Welcome message from author
This document is posted to help you gain knowledge. Please leave a comment to let me know what you think about it! Share it to your friends and learn new things together.
Transcript

INTRODUCTION
The final report is the most important part of the
research
Wilson‘s six-point suggestion for the presentation
of research focuses on the audience‘s needs:
1. Respect the importance
2. What do they need from report?
3. How does your report meet this need?
4. Underpin the key information with evidence
5. Remind them of the key points of the report
6. Make recommendations as to action
THE INITIAL UNDERSTANDING OF THE
REPORT WRITING
Report provides a ‗permanent‘ record of the
quality of the research
Researcher should take into account the
audience-thinking sequence that people go
through when communicating with them
Report should contain several elements and can
be constructed in a logical manner
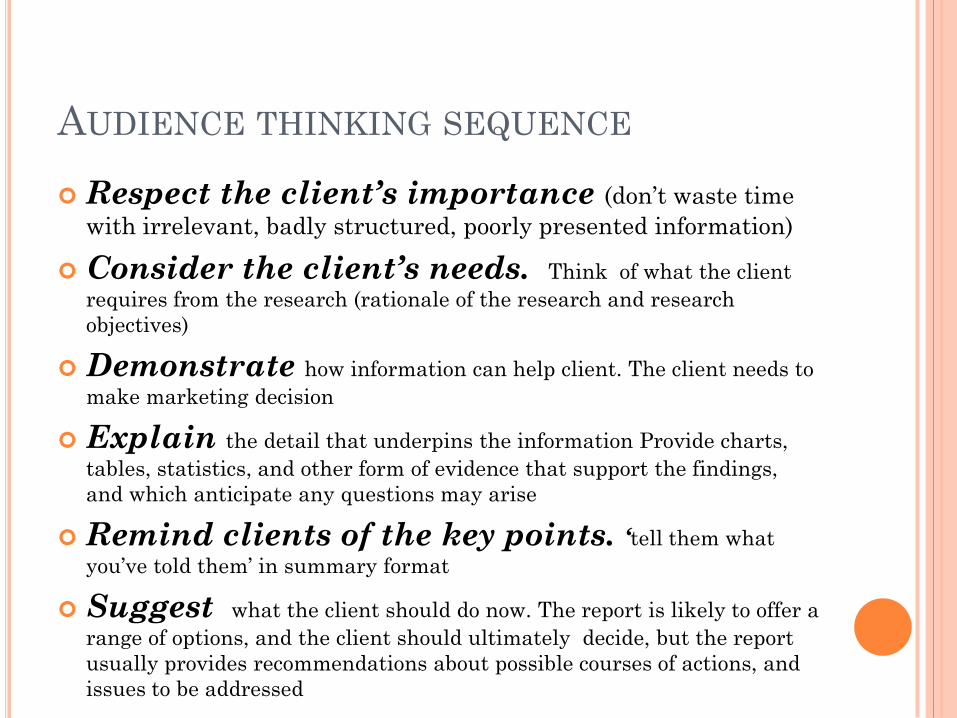
AUDIENCE THINKING SEQUENCE
Respect the client’s importance (don‘t waste time
with irrelevant, badly structured, poorly presented information)
Consider the client’s needs. Think of what the client
requires from the research (rationale of the research and research
objectives)
Demonstrate how information can help client. The client needs to
make marketing decision
Explain the detail that underpins the information Provide charts,
tables, statistics, and other form of evidence that support the findings,
and which anticipate any questions may arise
Remind clients of the key points. ‘tell them what
you‘ve told them‘ in summary format
Suggest what the client should do now. The report is likely to offer a
range of options, and the client should ultimately decide, but the report
usually provides recommendations about possible courses of actions, and
issues to be addressed
THE MARKETING RESEARCH WRITTEN
REPORT FORMAT
Title page
Contents page
The Executive summary
Introduction
Situation analysis and problem definition
Research methodology and limitations
Findings and analysis
Conclusions and recommendations
Appendices
DESCRIPTION OF WRITTEN REPORT
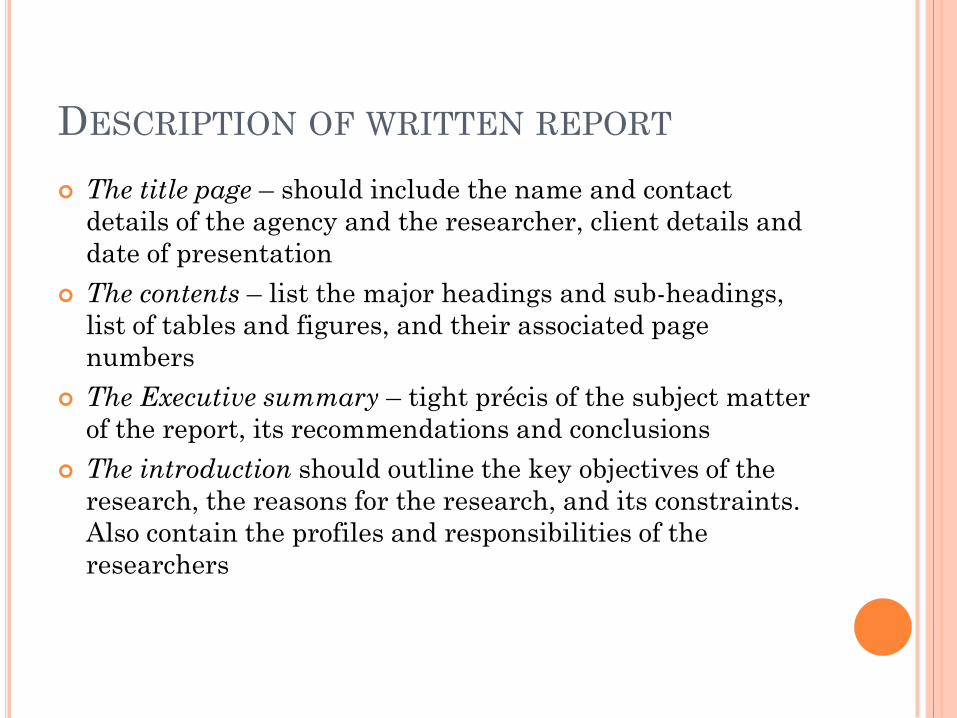
The title page – should include the name and contact
details of the agency and the researcher, client details and
date of presentation
The contents – list the major headings and sub-headings,
list of tables and figures, and their associated page
numbers
The Executive summary – tight précis of the subject matter
of the report, its recommendations and conclusions
The introduction should outline the key objectives of the
research, the reasons for the research, and its constraints.
Also contain the profiles and responsibilities of the
researchers
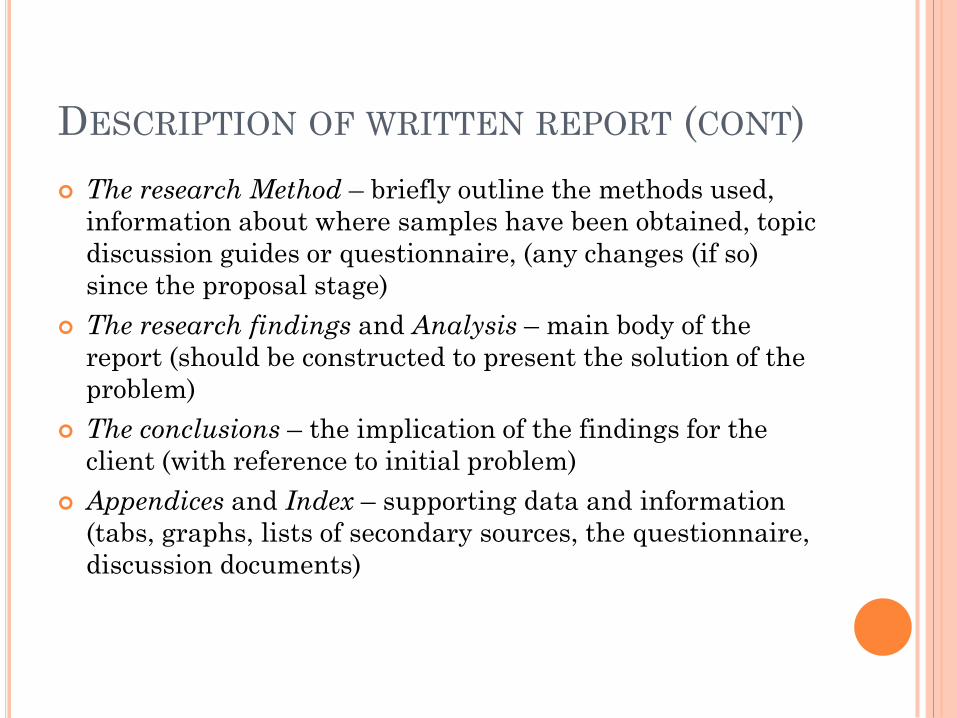
DESCRIPTION OF WRITTEN REPORT (CONT)
The research Method – briefly outline the methods used,
information about where samples have been obtained, topic
discussion guides or questionnaire, (any changes (if so)
since the proposal stage)
The research findings and Analysis – main body of the
report (should be constructed to present the solution of the
problem)
The conclusions – the implication of the findings for the
client (with reference to initial problem)
Appendices and Index – supporting data and information
(tabs, graphs, lists of secondary sources, the questionnaire,
discussion documents)
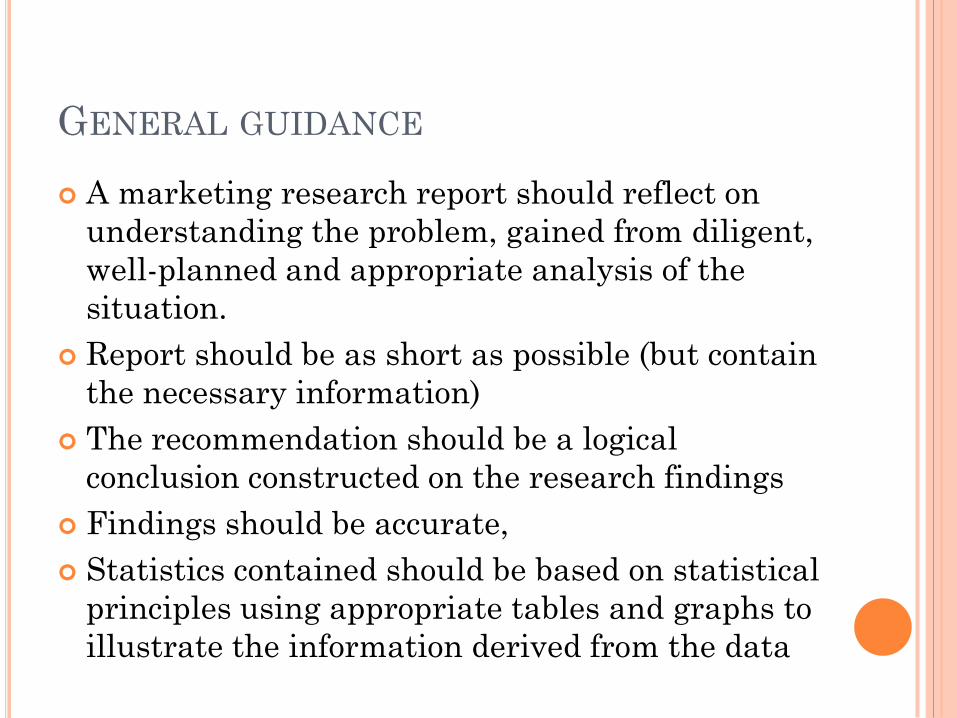
GENERAL GUIDANCE
A marketing research report should reflect on
understanding the problem, gained from diligent,
well-planned and appropriate analysis of the
situation.
Report should be as short as possible (but contain
the necessary information)
The recommendation should be a logical
conclusion constructed on the research findings
Findings should be accurate,
Statistics contained should be based on statistical
principles using appropriate tables and graphs to
illustrate the information derived from the data
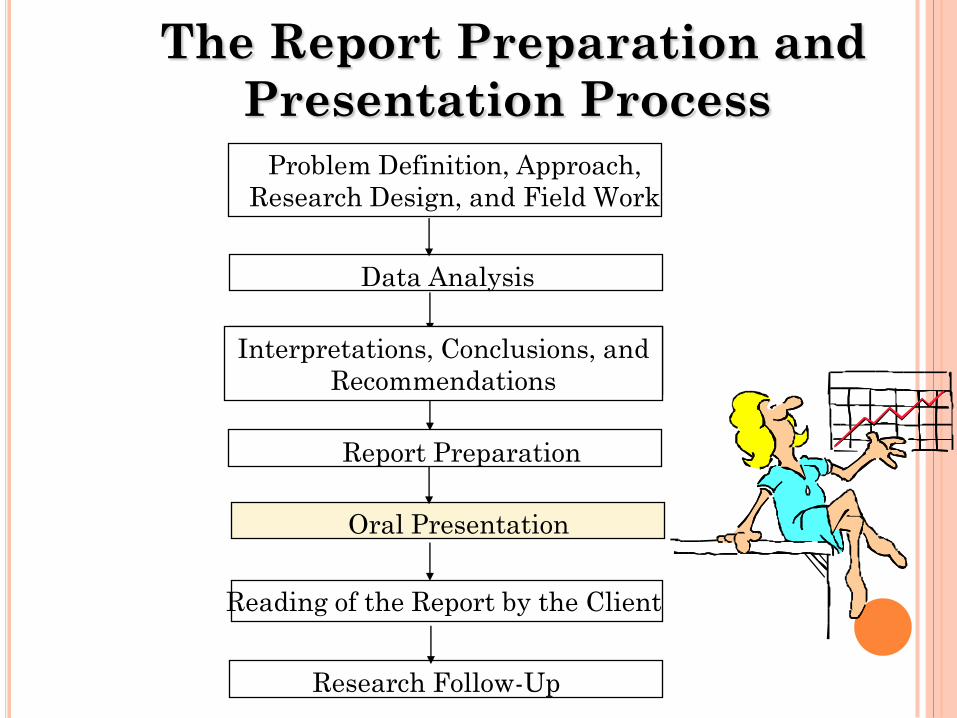
Oral Presentation
The Report Preparation and
Presentation Process
Data Analysis
Report Preparation
Interpretations, Conclusions, and
Recommendations
Reading of the Report by the Client
Research Follow-Up
Problem Definition, Approach,
Research Design, and Field Work
THE EXECUTIVE SUMMARY
Short summary of the whole report and its
recommendations
Should be written after the report is made, but
should start the report.
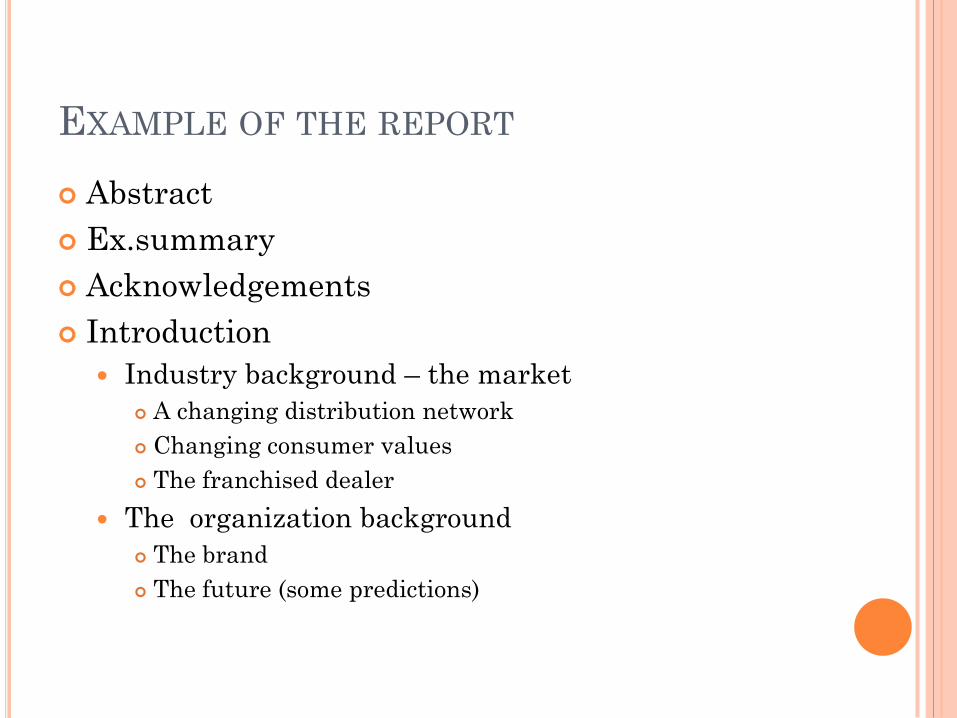
EXAMPLE OF THE REPORT
Abstract
Ex.summary
Acknowledgements
Introduction
Industry background – the market
A changing distribution network
Changing consumer values
The franchised dealer
The organization background
The brand
The future (some predictions)
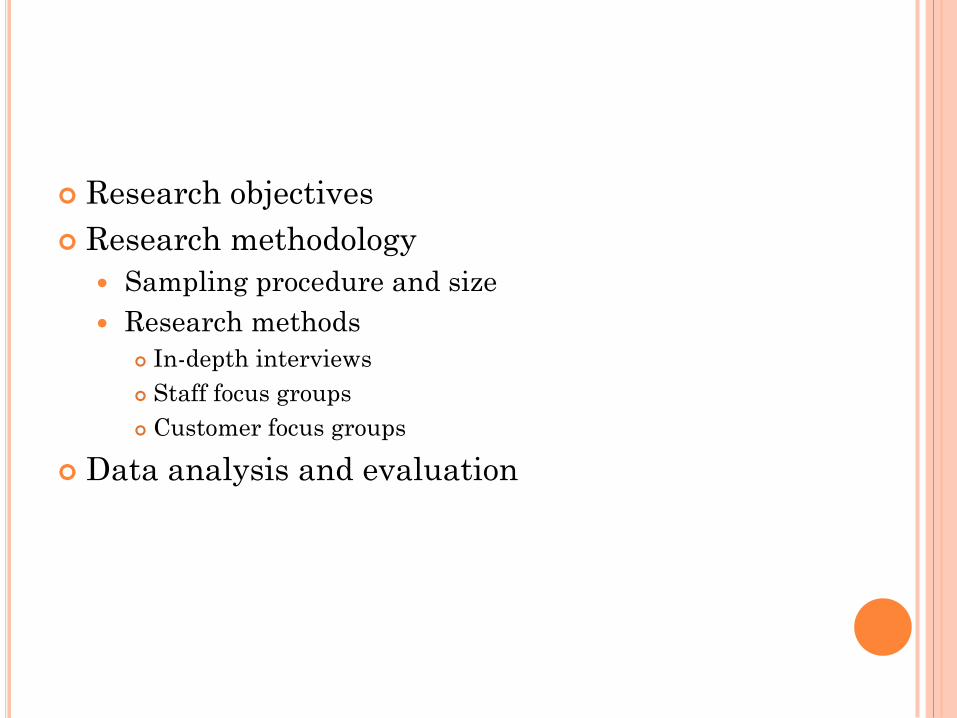
Research objectives
Research methodology
Sampling procedure and size
Research methods
In-depth interviews
Staff focus groups
Customer focus groups
Data analysis and evaluation
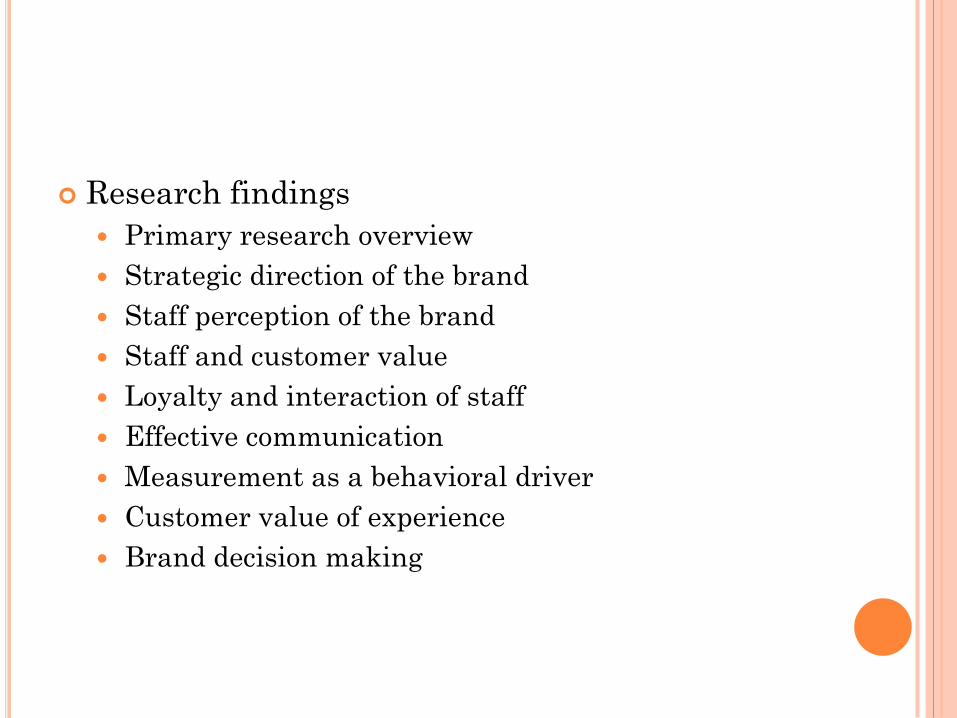
Research findings
Primary research overview
Strategic direction of the brand
Staff perception of the brand
Staff and customer value
Loyalty and interaction of staff
Effective communication
Measurement as a behavioral driver
Customer value of experience
Brand decision making
Appendices
App A: in-depth interview guide
App b: staff focus group discussion guide
App C: customer focus group discussion guide
App d: CD Rom recording in-depth interview
App F: video footage of focus group
Terms of reference
THE ORAL PRESENTATION
Introduction
Introduce the research team
Agenda
Research background and objectives
Methodology
Key findings
Conclusion and recommendation
Questions???
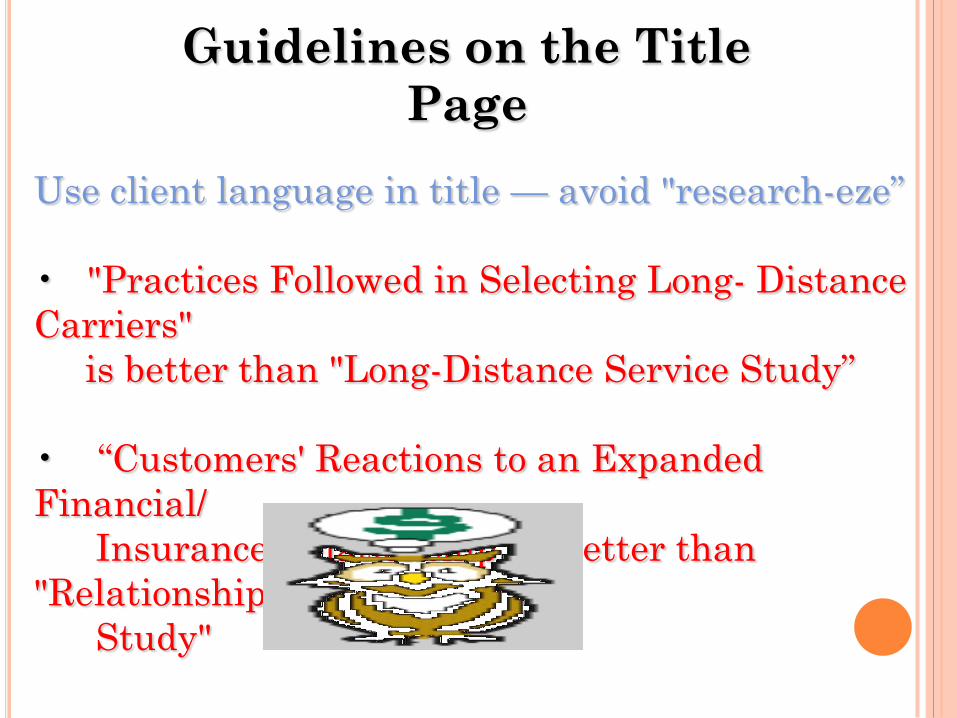
Use client language in title — avoid "research-eze‖
• "Practices Followed in Selecting Long- Distance
Carriers"
is better than "Long-Distance Service Study‖
• ―Customers' Reactions to an Expanded
Financial/
Insurance Relationship‖ is better than
"Relationship
Study"
Guidelines on the Title
Page
CONCLUSIONS
Conclusions concerning, for example:
* customer behavior
* customer attitudes or perceptions
* the nature of the markets studied
Generally, in studies with samples designed to represent the
market. Avoid interesting results that are not relevant to the
conclusions
• May be in the form of statement or paragraphs
• Use subheadings to identify conclusions covering different
subjects or market segments
Guidelines on Conclusions and
Recommendations
RECOMMENDATIONS
• Recommendations regarding actions that should be taken or
considered in light of the research results:
* Add/drop a product
* What to say in advertising__advertising positioning
* Market segments to select as primary targets
* How to price product
* Further research that should be considered
• Should be related to the stated purpose of the research
• Sometimes omitted, for example:
* Client staff members want to author the recommendations
* Study designed merely to familiarize client with a market
• Most clients are interested in our suggestions, in spite of the fact
that we may not be familiar with internal financial issues and other
internal corporate factors
USE OF GRAPHICS: TABLES
Tables should be presented with title and a
number
The table should show the figures of samples and
subsamples which were used in the research
75% is an impressive statistical figure, but if the
full picture is that the sample was only 10 people,
it is less so.
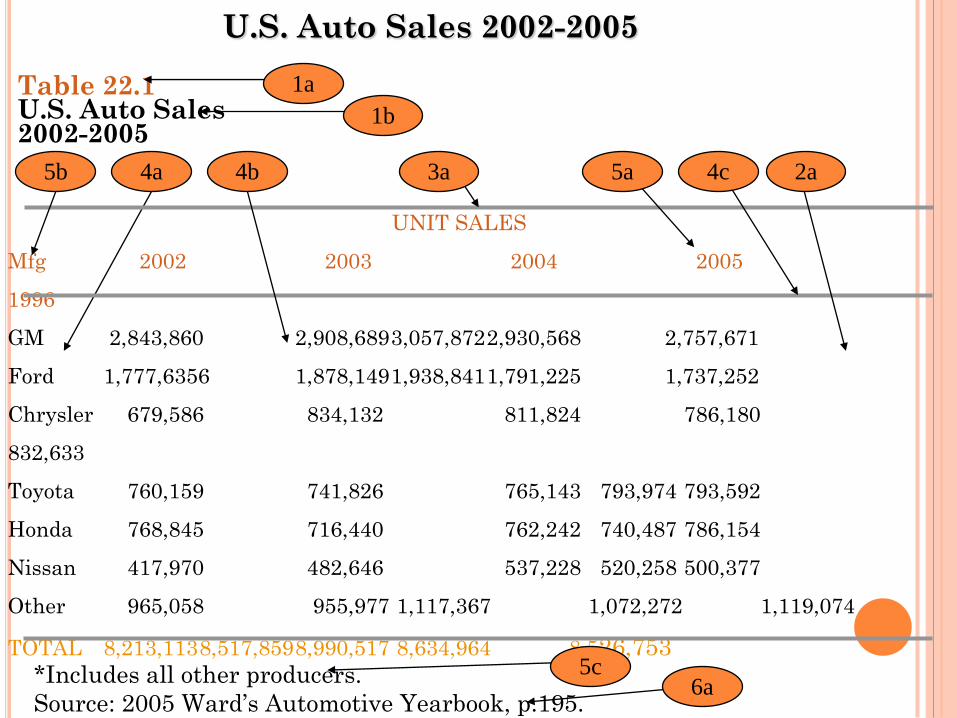
U.S. Auto Sales 2002-2005
UNIT SALES
Mfg 2002 2003 2004 2005
1996
GM 2,843,860 2,908,6893,057,8722,930,568 2,757,671
Ford 1,777,6356 1,878,1491,938,8411,791,225 1,737,252
Chrysler 679,586 834,132 811,824 786,180
832,633
Toyota 760,159 741,826 765,143 793,974 793,592
Honda 768,845 716,440 762,242 740,487 786,154
Nissan 417,970 482,646 537,228 520,258 500,377
Other 965,058 955,977 1,117,367 1,072,272 1,119,074
TOTAL 8,213,1138,517,8598,990,517 8,634,964 8,526,753
Table 22.1U.S. Auto Sales2002-2005
*Includes all other producers.
Source: 2005 Ward‘s Automotive Yearbook, p.195.
1a
4b5b 4a 5a 2a3a 4c
5c6a
1b
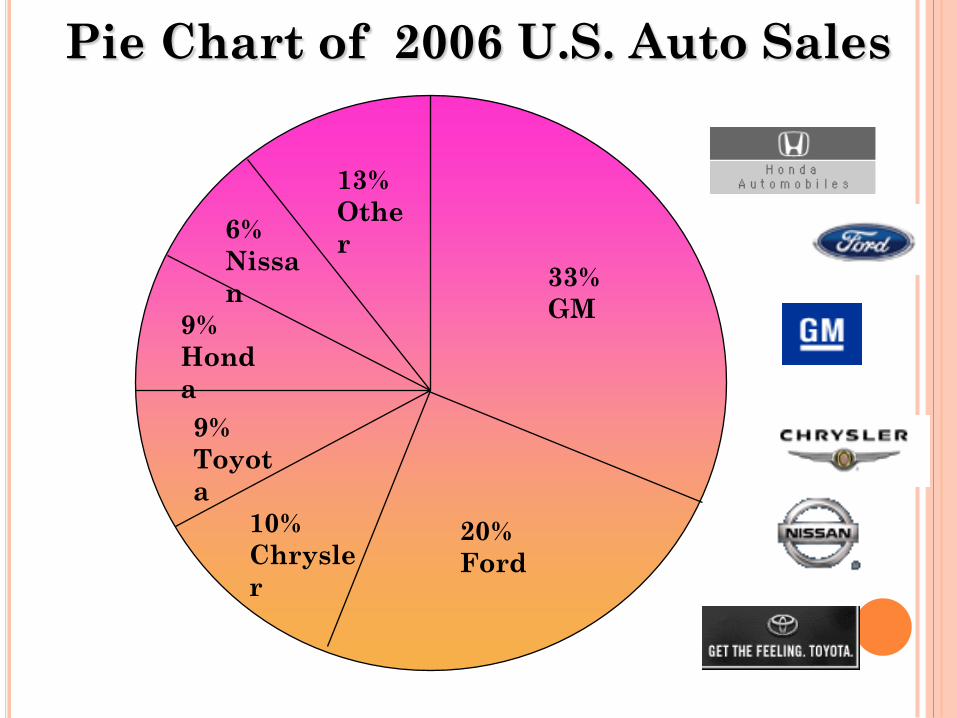
33%
GM
Pie Chart of 2006 U.S. Auto Sales
20%
Ford
13%
Othe
r6%
Nissa
n
9%
Hond
a
9%
Toyot
a
10%
Chrysle
r
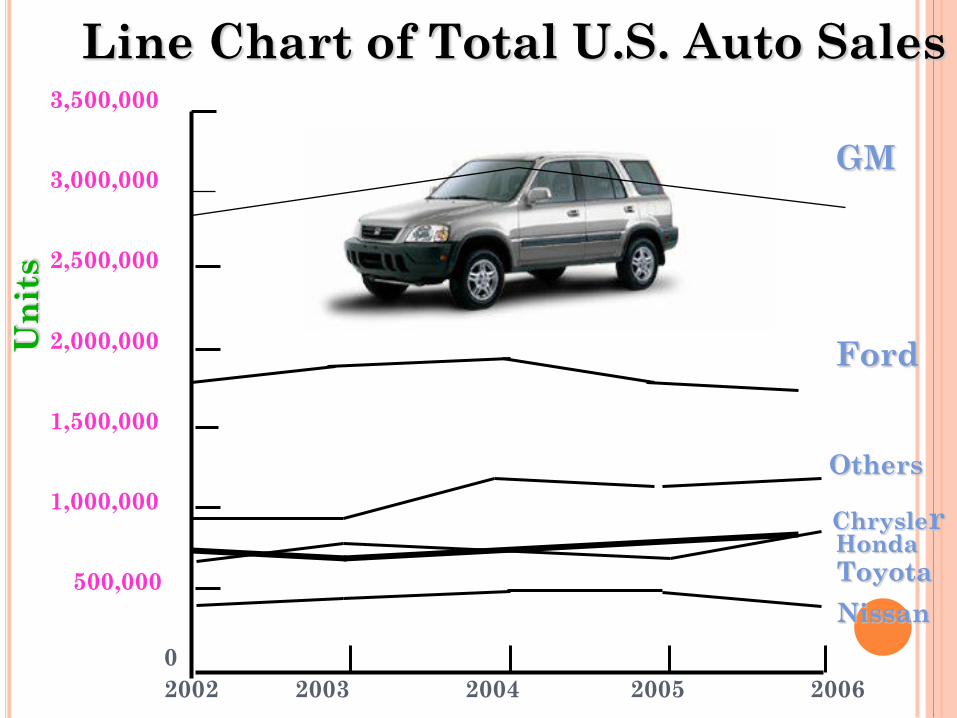
Line Chart of Total U.S. Auto Sales
500,000
2003 2006200520042002
0
Un
its
1,000,000
3,500,000
1,500,000
2,000,000
2,500,000
3,000,000GM
Ford
Nissan
HondaChrysler
Toyota
Others
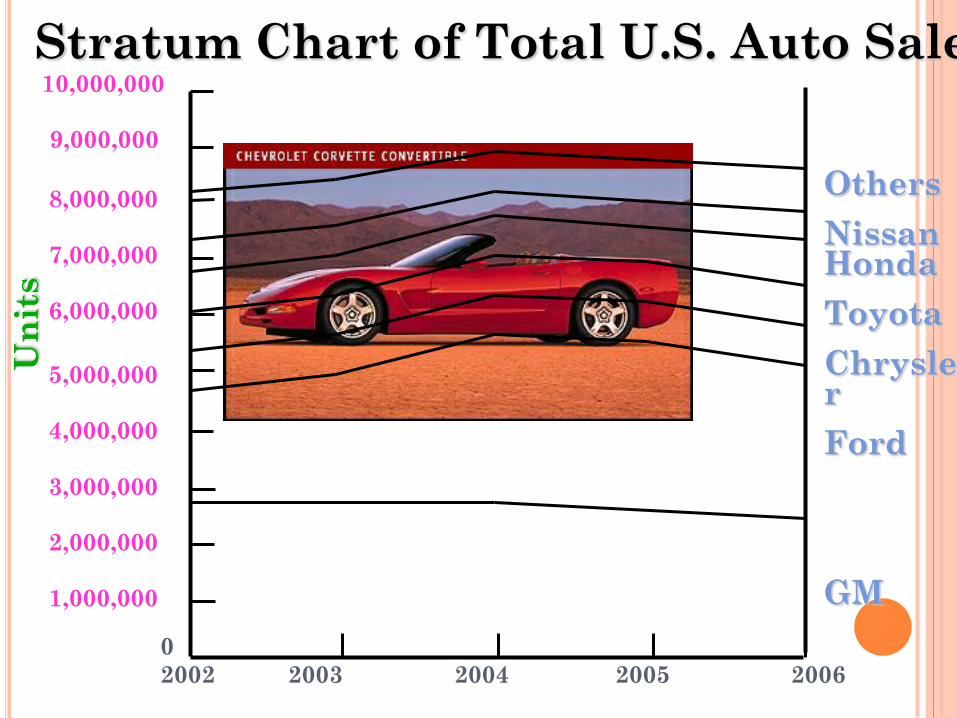
1,000,000
2003
Others
Nissan Honda
Toyota
Chrysler
Ford
GM
2006200520042002
0
Un
its
2,000,000
7,000,000
8,000,000
9,000,000
10,000,000
3,000,000
4,000,000
5,000,000
6,000,000
Stratum Chart of Total U.S. Auto Sales
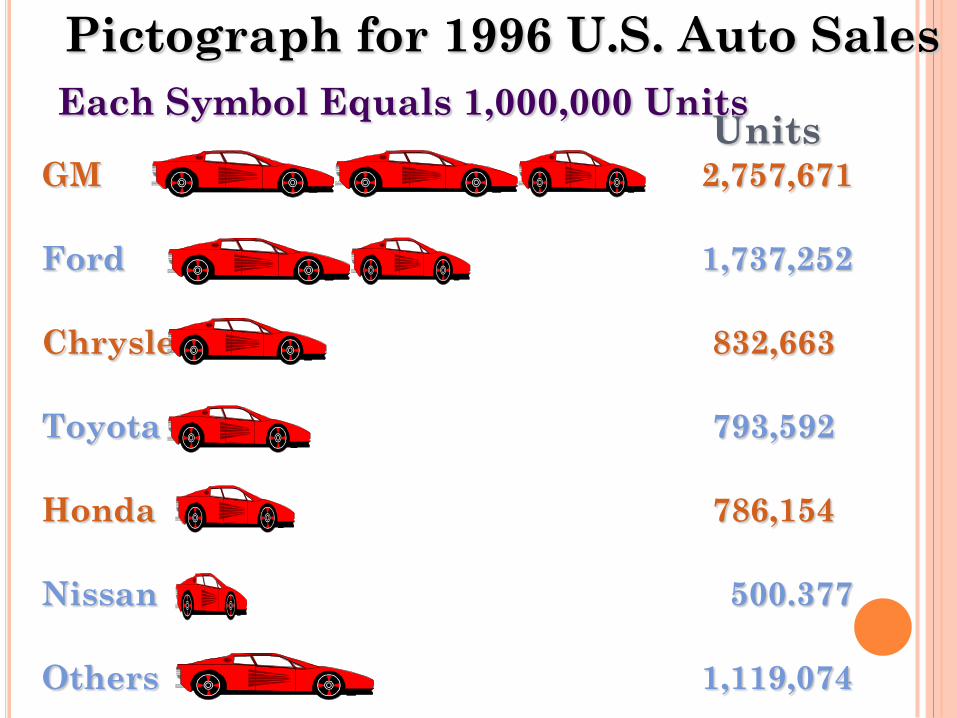
Pictograph for 1996 U.S. Auto Sales
UnitsGM 2,757,671
Ford 1,737,252
Chrysler 832,663
Toyota 793,592
Honda 786,154
Nissan 500.377
Others 1,119,074
Each Symbol Equals 1,000,000 Units
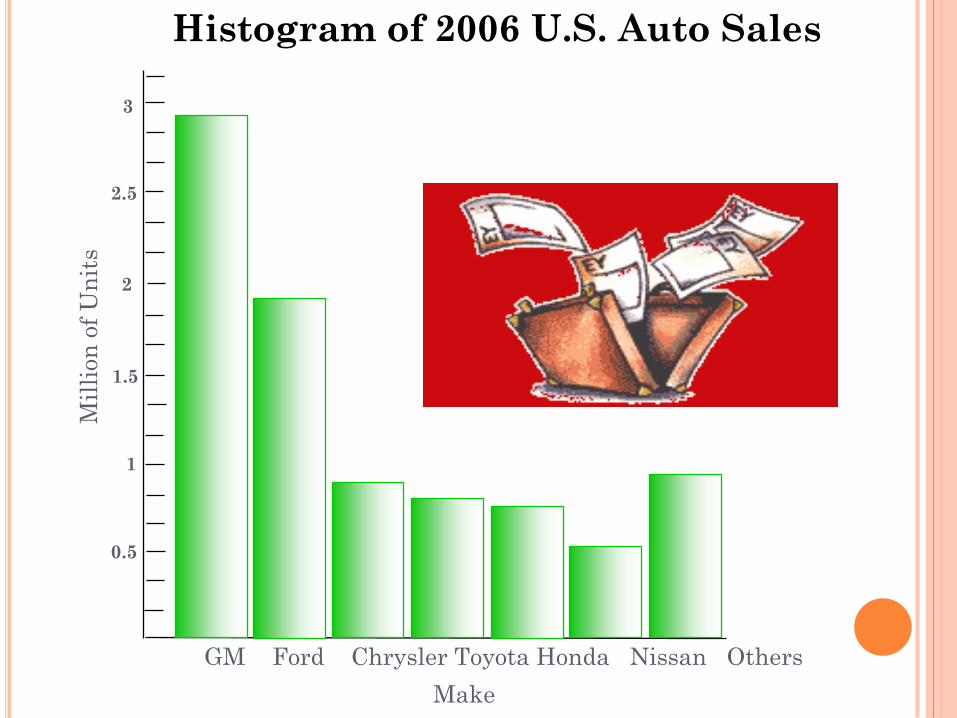
Histogram of 2006 U.S. Auto Sales
2
3
2.5
1.5
1
0.5
Make
Mil
lion
of
Un
its
GM Ford Chrysler Toyota Honda Nissan Others
Related Documents