© 2002 Blackwell Science Ltd. http://www.blackwell-science.com/ddi 219 ORIGINAL ARTICLE Diversity and Distributions (2002) 8 , 219–233 Blackwell Science, Ltd Present and potential distribution of invasive garlic mustard ( Alliaria petiolata ) in North America ERIK WELK 1 *, KONSTANZE SCHUBERT 1 and MATTHIAS H. HOFFMANN 2 Martin-Luther-Universität Halle-Wittenberg, Institut für Geobotanik and Botanischer Garten, Neuwerk 21, D-06108 Halle/Saale, Germany, and 2 Institut für Pflanzengenetik und Kulturpflanzenforschung, Abteilung: Taxonomie, D-06466 Gatersleben, Germany Abstract. This paper demonstrates the use of a bioclimatic model mapped over geographical regions as a tool for spatially refined risk assess- ment for the establishment of non-indigenous plants with invasive behaviour. Drawing on the relationship between plant distribution and cli- mate, the approach uses gridded spatial inter- polated monthly means of temperature and precipitation linked with accurate maps of general native distribution ranges to predict the long-term potential of a plant species to invade a certain region. The ascertained potential for establishment is illustrated by the example of garlic mustard ( Alliaria petiolata [M. Bieb.] Cavara & Grande) in North America. The first step is to calculate and visualize the number of populated grid cells along climatic gradients in frequency diagrams for the general native distri- bution range. Interpretations of the response curves recorded are used for assessing apparent climatic range boundaries. Modelling was gradu- ally optimized based on the results of experience- based interpretations and by examining omission and over-representation errors. The obtained climatic model of the range of A. petiolata shows considerable congruencies with its mapped, native Eurasian range. Degrees of climatic similar- ity between North America and the native range of A. petiolata were calculated with the help of GIS methodology and were used to assess the region- ally different likelihood of establishment in North America of the invasive species under consideration. Key words. Alliaria , potential distribution, pre- diction, invasive non-indigenous plants, climatic range model. INTRODUCTION Occurrences of non-indigenous plant species have become components of the vegetation of most regions of the world as a result of increasing species exchange between continents and vegeta- tion transformation by man. At a global scale, the problem of invasive alien plants has increased greatly over the past decades (Perrings et al ., 2000). Procedures for assessing the potential invasive- ness of non-indigenous plants are urgently needed for objective and scientifically based quar- antine regulations for preventing introduction or further spread, or for making informed decisions about deliberate introductions. Recent systems for predicting invasiveness of plants have been developed for parts of the non- indigenous floras of North America (Reichard & Hamilton, 1997), Australia (Pheloung et al ., 1999), and South Africa (Tucker & Richardson, 1995). They are based on the analysis of a number of biological and ecological characters of the species in question (life history, habitat char- acteristics, invasiveness elsewhere and biogeo- graphy). However, according to (Cronk & Fuller, 1995) environmental factors, such as climate, and particularly seasonality of climate, are of special importance because the relationship between * Corresponding author: E-mail: [email protected]

Welcome message from author
This document is posted to help you gain knowledge. Please leave a comment to let me know what you think about it! Share it to your friends and learn new things together.
Transcript
© 2002 Blackwell Science Ltd. http://www.blackwell-science.com/ddi
219
ORIGINAL ARTICLE
Diversity and Distributions
(2002)
8
, 219–233
Blackwell Science, Ltd
Present and potential distribution of invasive garlic mustard (
Alliaria petiolata
) in North America
ERIK WELK
1
*, KONSTANZE SCHUBERT
1
and MATTHIAS H. HOFFMANN
2
Martin-Luther-Universität Halle-Wittenberg, Institut für Geobotanik and Botanischer Garten, Neuwerk 21, D-06108 Halle/Saale, Germany, and
2
Institut für Pflanzengenetik und Kulturpflanzenforschung,
Abteilung: Taxonomie, D-06466 Gatersleben, Germany
Abstract.
This paper demonstrates the use of abioclimatic model mapped over geographicalregions as a tool for spatially refined risk assess-ment for the establishment of non-indigenousplants with invasive behaviour. Drawing on therelationship between plant distribution and cli-mate, the approach uses gridded spatial inter-polated monthly means of temperature andprecipitation linked with accurate maps ofgeneral native distribution ranges to predict thelong-term potential of a plant species to invadea certain region. The ascertained potential forestablishment is illustrated by the example ofgarlic mustard (
Alliaria petiolata
[M. Bieb.]Cavara & Grande) in North America. The firststep is to calculate and visualize the number ofpopulated grid cells along climatic gradients infrequency diagrams for the general native distri-
bution range. Interpretations of the responsecurves recorded are used for assessing apparentclimatic range boundaries. Modelling was gradu-ally optimized based on the results of experience-based interpretations and by examining omissionand over-representation errors. The obtainedclimatic model of the range of
A. petiolata
showsconsiderable congruencies with its mapped,native Eurasian range. Degrees of climatic similar-ity between North America and the native rangeof
A. petiolata
were calculated with the help of GISmethodology and were used to assess the region-ally different likelihood of establishment in NorthAmerica of the invasive species under consideration.
Key words.
Alliaria
, potential distribution, pre-diction, invasive non-indigenous plants, climaticrange model.
INTRODUCTION
Occurrences of non-indigenous plant species havebecome components of the vegetation of mostregions of the world as a result of increasingspecies exchange between continents and vegeta-tion transformation by man. At a global scale,the problem of invasive alien plants has increasedgreatly over the past decades (Perrings
et al
., 2000).Procedures for assessing the potential invasive-
ness of non-indigenous plants are urgentlyneeded for objective and scientifically based quar-antine regulations for preventing introduction or
further spread, or for making informed decisionsabout deliberate introductions.
Recent systems for predicting invasiveness ofplants have been developed for parts of the non-indigenous floras of North America (Reichard& Hamilton, 1997), Australia (Pheloung
et al
.,1999), and South Africa (Tucker & Richardson,1995). They are based on the analysis of anumber of biological and ecological characters ofthe species in question (life history, habitat char-acteristics, invasiveness elsewhere and biogeo-graphy). However, according to (Cronk & Fuller,1995) environmental factors, such as climate, andparticularly seasonality of climate, are of specialimportance because the relationship between
* Corresponding author: E-mail: [email protected]
DDI_144.fm Page 219 Monday, June 24, 2002 7:03 PM
220
E. Welk
et al.
© 2002 Blackwell Science Ltd,
Diversity and Distributions
,
8
, 219–233
climate and the distribution of plants is welldocumented (Grace, 1987; Woodward, 1987).
Climate may be considered as setting thebroad limits for plant distribution, while otherfactors such as geology, soils and competitionwill determine the presence or absence of a spe-cies in a particular area and on a finer regionalor local scale. Accepting that climate usuallylimits the range of a species, analysis of the climaticpreferences of a species can be used to predictareas where a species might be expected to occur.
Previously, some climatic models have beendeveloped to define the potential distribution ofdifferent plant forms (Box, 1981), of forest treesfor optimized cultivation (Booth, 1991; Booth &Jones, 1998), of possible locations of species (Box
et al
., 1993; Skov & Borchsenius, 1997; Skov,2000) and of weeds in newly colonized areas(Howden, 1985; Panetta & Dodd, 1987; Panetta& Mitchell, 1991). The cited prediction systemsuse comparisons of weather station data withsimple distribution data of where the species isrecorded to construct climate profiles for thespecies. Inadequate sampling, especially whereclimatic gradients are steep or complex, is apossible problem inherent to these correlativemodels. A set of localities, or even considerableparts of the known range, often do not containdata representative of the full climatic toleranceof the species.
Recently, some of these model systems becameavailable as user-friendly computer programs(Climate™: developed from concepts containedin the Bioclim™ Prediction System, Climex™, or
™ © 1999 International Centre forTropical Agriculture [CIAT]). For Bioclim™see Busby (1991), for Climex™ see Sutherst &Maywald (1985).
The main advantage of the bioclimatic model-ling systems mentioned above is that they areeasy to handle and thus they allow decision makersor land managers to obtain acceptable modelsfor considerable numbers of plant species in areasonable time frame. However, once a plant isrecognized as behaving aggressively or invasively,decision makers, conservationists or land managersmay be interested in assessments which aregeographically more accurate for both theirselected species and the region for which they areresponsible, even if the method is more labourconsuming.
For this special purpose, we would like tointroduce a method for determining the spatiallydifferent likelihood of long-term establishment ofintroduced species. In order to achieve moredetailed results, more time and data are necessar-ily required. A case study for
Alliaria petiolata
(M. Bieb.) Cavara & Grande in North America isused to present this bioclimatic modellingmethod, which is based not only on climatictolerances at a set of localities but also on fre-quency distributions along climatic gradients inthe general native distribution area.
SPECIES AND METHODS
Long-term probability zones of potential distri-bution in North America were assessed for
Alli-aria petiolata
(M. Bieb.) Cavara & Grande (garlicmustard).
Alliaria petiolata
is a tall, short-lived herb inthe Brassicaceae, native to western Eurasia. Usedas a culinary herb and because of its perceivedmedicinal value, garlic mustard was probablyintroduced to North America by early Europeansettlers and has become one of the most rapidlyexpanding invasive plants of woodland habitatsin eastern North America. It invaded and nowdominates the forest ground layer in manyregions from New England through the Midwest,and from southern Ontario to Tennessee. Itsspread through forests of the eastern and Mid-western United States and Canada has causedgreat concern (Blossey
et al
., 2001), and thusgarlic mustard is an example of a species that mayjustify the use of greater time and data intensivemethods to determine its potential distribution,like the approach we present here.
In Europe,
A. petiolata
is most common inhabitats of relatively high air humidity. Slightlyshaded places beside rivers and at roadsides andtracks are reported as optimal habitats fromregions with a humid maritime climate (BritishIsles, Grime
et al
., 1988). In more arid regions(Sicily and Greece) the species occurs mainly inshaded habitats and mountainous areas where itexhibits a marked bias towards north facingslopes (de Halácsy, 1901).
In North America,
A. petiolata
most fre-quently occurs in moist, shaded soils of riverfloodplains, forests, roadsides, edges of woods,forest openings and trails.
DDI_144.fm Page 220 Monday, June 24, 2002 7:03 PM
Distribution of garlic mustard in N. America
221
© 2002 Blackwell Science Ltd,
Diversity and Distributions
,
8
, 219–233
Distributional data and climate data
The general distribution data is based on mapspublished by Meusel
et al
. (1965), Jäger (1970),and de Bolós & Vigo (1990) and was completelyrevised using a great amount of recently pub-lished data, especially for the compilation of thenewly colonized regions and localities in NorthAmerica. The main advantage of the mappingmethod used is that it allows the possibility todraw on very heterogeneous data sources, rang-ing from simple presence–absence indications forlarge regions to detailed dot maps showing singlelocations. The approach is useful for findingdistributional gaps, outposts, exclaves and sectorswhere occurrence is continuous (for methodology,see also Hoffmann & Welk, 1999; Hoffmann,2001).
Global climate data (monthly means of precip-itation and temperature) were obtained from thePotsdam Institute of Climate Impact Research(CLIMATE database version 2.1; W. Cramer,Potsdam, personal communication).
The distribution map was digitized, and sub-sequently transformed into a grid of the sameresolution as the climate data. Calculations wereperformed using the program Arc/Info® (ESRI,1992).
Climate analysis
The investigations of Bartlein
et al
. (1986) andHuntley
et al
. (1995) showed that the distribu-tional range of a species may be considered on aglobal scale as a function of the endogenousecological constitution of the species and theclimate. Clearly, plant distribution is influencedby and interacts with the environment in a verycomplex way. However, on large spatial scales itis sufficient and suitable to use statistical models,which summarize the effect of the interactionbetween climate and plant distribution using asmaller number of parameters. The study byHuntley
et al
. (1995) substantiates evidence thatdistributional ranges may be modelled using onlyclimatic factors.
The method of the climatic response surfaces(Bartlein
et al
., 1986) has been modified toobtain the position of the species in the world’sclimate system (see Hoffmann, 2001, 2002).Intervals of the climate data used are defined as
follows: 0.1 K for temperature and 1 mm forprecipitation. Frequency of occurrences wasrecorded by counting the number of occupiedgrid cells of the species within the defined inter-val of temperature and precipitation, respectively.The data is presented in frequency diagrams.
Frequency diagrams
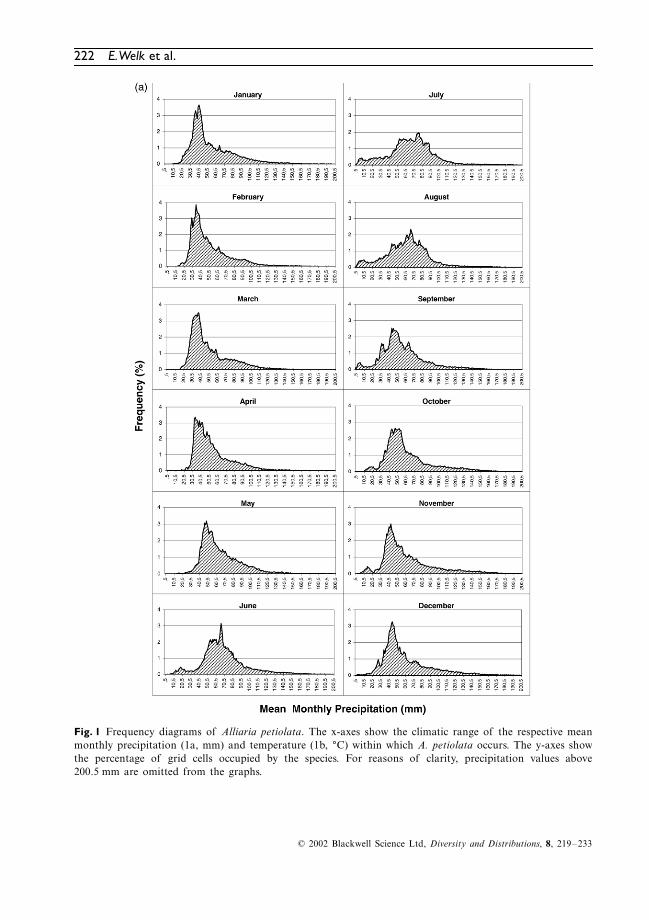
These diagrams show the number of grid cells(percentage) occupied by a species, along thechosen climatic gradient (Fig. 1). Despite thegreat diversity of individual shapes, some commoncharacteristics can be observed in the curves (seealso Hoffmann, 2000, 2001).
Shape and slope of a curve are the mostimportant characteristics of the diagrams. Thepoint where the slope changes from steep to flatmay indicate the position of a range limitingfactor (critical level) or a geographical barrier(mountains, oceans and deserts), whereas a gentleslope may point to the fact that this climatic factoris of less importance for the limitation of the range.Isolated records in the tails of the graph maybelong to various categories, e.g. relicts, outposts,occurrences in unusual habitats, temporary occur-rences due to synanthropic dispersal, or errorsdue to inaccurate climate data.
Climatic modelling
To obtain a climate-based model of the spatialdistribution of
A. petiolata
, each of the 24 cli-mate variables (monthly means of precipitationand temperature) are analysed. The first step is tocount and visualize the number of populated gridcells along climatic gradients (from minimum tomaximum values) in frequency diagrams for thegeneral native distribution range. Shape and ascentof the resulting 24 frequency diagrams are exam-ined to find out the strongest correlations betweenrange limits and the regarded climatic variables.This could have been done using mathematicalmethods, but because the distributional data usedto map the range borders analysed varies stronglyin accuracy and relevance, a manual methodbased on personal experience was chosen.
To improve the fit of spatial models theremoval of observations that are beyond the lastpositive observation by greater than 1% of thesample is recommended (Austin
et al
., 1995). For
DDI_144.fm Page 221 Monday, June 24, 2002 7:03 PM
222
E. Welk
et al.
© 2002 Blackwell Science Ltd,
Diversity and Distributions
,
8
, 219–233
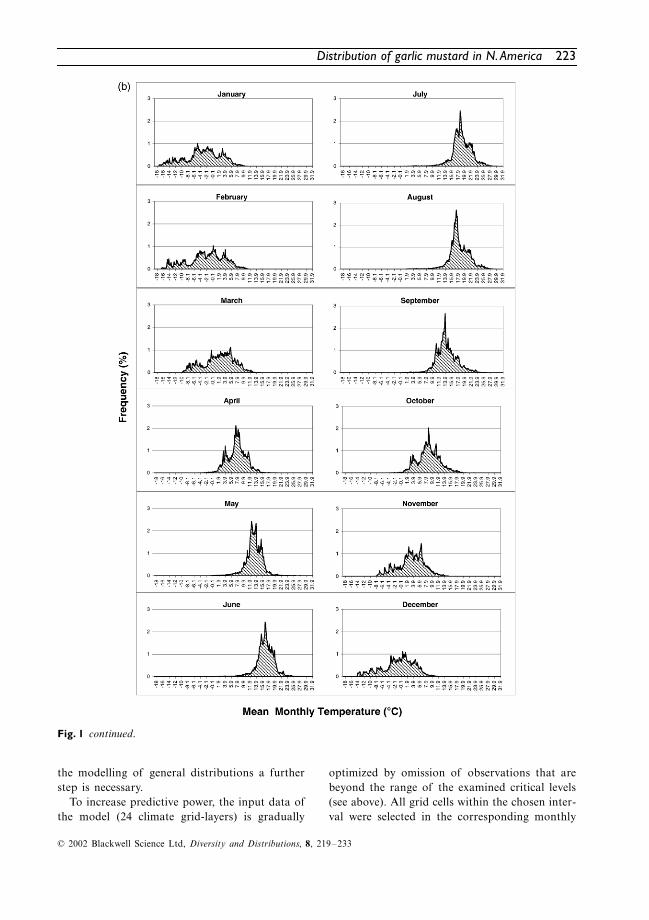
Fig. 1 Frequency diagrams of Alliaria petiolata. The x-axes show the climatic range of the respective meanmonthly precipitation (1a, mm) and temperature (1b, °C) within which A. petiolata occurs. The y-axes showthe percentage of grid cells occupied by the species. For reasons of clarity, precipitation values above200.5 mm are omitted from the graphs.
DDI_144.fm Page 222 Monday, June 24, 2002 7:03 PM
Distribution of garlic mustard in N. America
223
© 2002 Blackwell Science Ltd,
Diversity and Distributions
,
8
, 219–233
the modelling of general distributions a furtherstep is necessary.
To increase predictive power, the input data ofthe model (24 climate grid-layers) is gradually
optimized by omission of observations that arebeyond the range of the examined critical levels(see above). All grid cells within the chosen inter-val were selected in the corresponding monthly
Fig. 1 continued.
DDI_144.fm Page 223 Monday, June 24, 2002 7:03 PM
224
E. Welk
et al.
© 2002 Blackwell Science Ltd,
Diversity and Distributions
,
8
, 219–233
climate grid and assigned a value of ‘1’. Cellsfrom outside the chosen interval were labelledwith a value of ‘0’. Finally, the resulting 24‘clipped’ binary grids were added. This overlay ofbinary maps results in a cumulative map showingthe spatial pattern of the number of climaticallysupportive months — the climatic model.
The resulting model fit was analysed by exam-ining the number of observations (populated gridcells) correctly predicted by the model variant(C), as well as the proportion of omission andcommission errors, which respectively predict thespecies to be absent when it is present, and viceversa (A, B). This examination was done usingrigid calculations of similarity (Jaccard-Index;J = C
×
100/A
×
B percentage) between the nativerange and the spatial pattern that was createdusing climate variables for Eurasia.
The application of this index allows exclusionof the vast number of grid cells, which remainvacant in both the model and the actual area ofthe plant in northern Eurasia (D), and thuscomputes only the exact congruence between thetwo patterns, regardless of the size of the surround-ing modelling arena. In this way threshold valuesfor the regarded climate intervals that minimizedthe omission and commission errors were chosenmanually.
RESULTS
Distribution Map
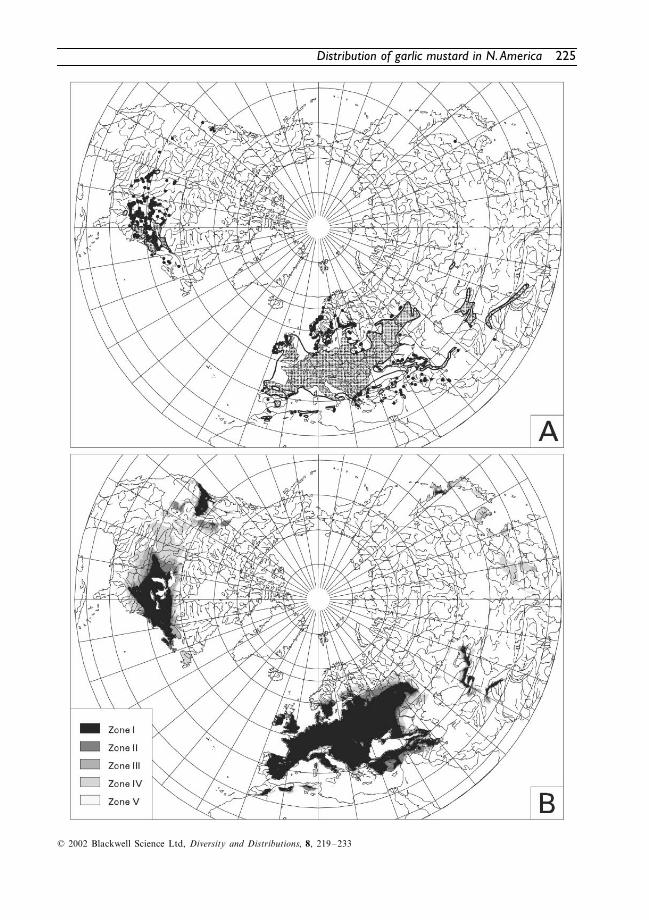
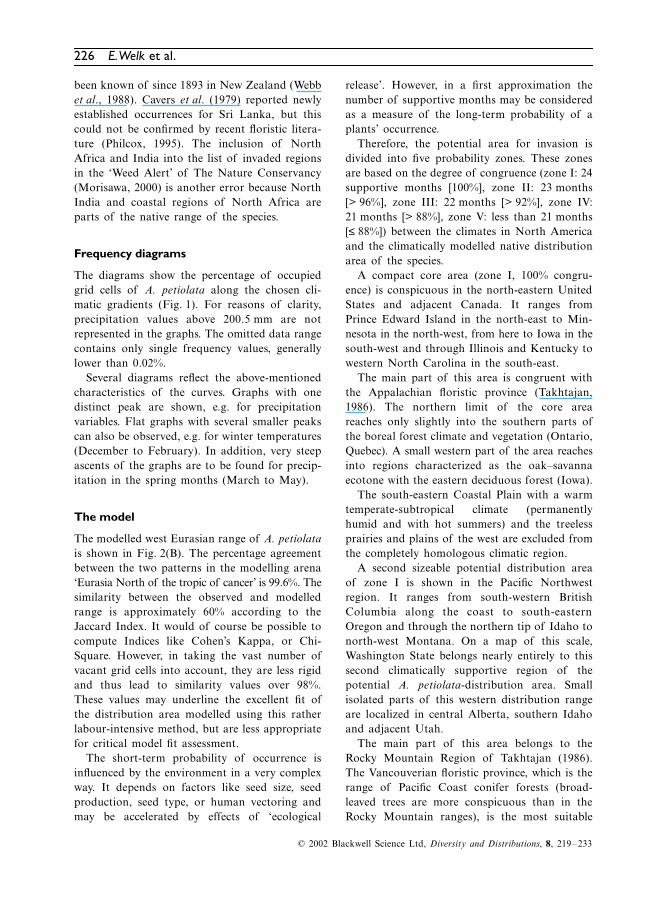
The native range of
A. petiolata
is shown inFig. 2(A). The TNC-Element StewardshipAbstract by Nuzzo (2000), which is otherwisewell investigated, describes the native rangeincorrectly as extending eastwards from Englandto Czechoslovakia (cited also in the TNC-weedalert by Morisawa, 2000). The species behaves asan apophyte in most parts of its native distribu-tion area (apophytes are elements of the naturalvegetation that benefit from human influenceslike disturbance or eutrophication).
Alliaria peti-
olata
benefits especially from the effects ofincreasing alkalinity and nutrient content of soilsand is considered an expanding and abundantspecies almost everywhere within its native distri-bution area.
According to Jäger (1970) the range of garlicmustard belongs to the
Eupatorium
-type ofMediterranean–Middle European plant distributionareas. The species of this type (e.g.
Eupatoriumcannabinum
,
Iris pseudacorus
,
Ranunculus ficaria
,
Crataegus monogyna
,
Rumex obtusifolius
and
Prunus spinosa
) are elements of the temperatebroadleaved forest zone and prefer relativelymoist habitats (floodplain forests, riverbanks,margins of lakes and ponds). There are naturalizedoccurrences of most of the above-mentionedspecies in North America and they are consideredlocally as invasive or potentially invasive plants.
The altitudinal distribution increases fromnorth (400 m in south Norway, 350 m in theBritish Isles) to south (900–1600 m in Iraq,1100–2500 m in Tadzhikistan, and 2200–3100 min Nepal).
The neophytic North American range is alsoshown in Fig. 2(A). The new distribution areahas grown exponentially since introduction, andby 2000 the species had spread to 34 US statesand 4 Canadian provinces. For this reason alldata concerning distribution has to be consideredas preliminary until the species has occupied itsfull potential range.
Alliaria petiolata
is most widespread in theMidwestern and north-eastern United States, insouth-western Ontario, and in the St. LawrenceValley. Infrequent collections are reported frommountain states (Colorado, Utah), and sub-boreal regions (Gaspé/Quebec).
In the Pacific Northwest,
A. petiolata
is estab-lished only in Portland (Oregon), in severallocations around Seattle (Washington) and inVictoria and Vancouver (British Columbia, firstreport from 1948).
North America is the main area for new occur-rences for
A. petiolata
. Only one locality has
Fig. 2 Native, neophytic, and climatically modelled range of Alliaria petiolata. (A) Distribution range of A.petiolata in Eurasia (native, archeophytic) and North America (introduced, neophytic). Open circles indicategeographically imprecise records of occurrence. (B) Climatically modelled range and long-term probabilityzones for invasion in North America. The legend indicates the percentage of similarity between the climateof the modelled native range and the climate in North America based on the number of supportive(climatically suitable) months (zone I: 100%, zone II: > 96%, zone III: > 92%, zone IV: > 88%, zone V: ≤ 88%).
DDI_144.fm Page 224 Monday, June 24, 2002 7:03 PM
Distribution of garlic mustard in N. America
225
© 2002 Blackwell Science Ltd,
Diversity and Distributions
,
8
, 219–233
DDI_144.fm Page 225 Monday, June 24, 2002 7:03 PM
226
E. Welk
et al.
© 2002 Blackwell Science Ltd,
Diversity and Distributions
,
8
, 219–233
been known of since 1893 in New Zealand (Webb
et al
., 1988). Cavers
et al
. (1979) reported newlyestablished occurrences for Sri Lanka, but thiscould not be confirmed by recent floristic litera-ture (Philcox, 1995). The inclusion of NorthAfrica and India into the list of invaded regionsin the ‘Weed Alert’ of The Nature Conservancy(Morisawa, 2000) is another error because NorthIndia and coastal regions of North Africa areparts of the native range of the species.
Frequency diagrams
The diagrams show the percentage of occupiedgrid cells of
A. petiolata
along the chosen cli-matic gradients (Fig. 1). For reasons of clarity,precipitation values above 200.5 mm are notrepresented in the graphs. The omitted data rangecontains only single frequency values, generallylower than 0.02%.
Several diagrams reflect the above-mentionedcharacteristics of the curves. Graphs with onedistinct peak are shown, e.g. for precipitationvariables. Flat graphs with several smaller peakscan also be observed, e.g. for winter temperatures(December to February). In addition, very steepascents of the graphs are to be found for precip-itation in the spring months (March to May).
The model
The modelled west Eurasian range of
A. petiolata
is shown in Fig. 2(B). The percentage agreementbetween the two patterns in the modelling arena‘Eurasia North of the tropic of cancer’ is 99.6%. Thesimilarity between the observed and modelledrange is approximately 60% according to theJaccard Index. It would of course be possible tocompute Indices like Cohen’s Kappa, or Chi-Square. However, in taking the vast number ofvacant grid cells into account, they are less rigidand thus lead to similarity values over 98%.These values may underline the excellent fit ofthe distribution area modelled using this ratherlabour-intensive method, but are less appropriatefor critical model fit assessment.
The short-term probability of occurrence isinfluenced by the environment in a very complexway. It depends on factors like seed size, seedproduction, seed type, or human vectoring andmay be accelerated by effects of ‘ecological
release’. However, in a first approximation thenumber of supportive months may be consideredas a measure of the long-term probability of aplants’ occurrence.
Therefore, the potential area for invasion isdivided into five probability zones. These zonesare based on the degree of congruence (zone I: 24supportive months [100%], zone II: 23 months[> 96%], zone III: 22 months [> 92%], zone IV:21 months [> 88%], zone V: less than 21 months[
≤
88%]) between the climates in North Americaand the climatically modelled native distributionarea of the species.
A compact core area (zone I, 100% congru-ence) is conspicuous in the north-eastern UnitedStates and adjacent Canada. It ranges fromPrince Edward Island in the north-east to Min-nesota in the north-west, from here to Iowa in thesouth-west and through Illinois and Kentucky towestern North Carolina in the south-east.
The main part of this area is congruent withthe Appalachian floristic province (Takhtajan,1986). The northern limit of the core areareaches only slightly into the southern parts ofthe boreal forest climate and vegetation (Ontario,Quebec). A small western part of the area reachesinto regions characterized as the oak–savannaecotone with the eastern deciduous forest (Iowa).
The south-eastern Coastal Plain with a warmtemperate-subtropical climate (permanentlyhumid and with hot summers) and the treelessprairies and plains of the west are excluded fromthe completely homologous climatic region.
A second sizeable potential distribution areaof zone I is shown in the Pacific Northwestregion. It ranges from south-western BritishColumbia along the coast to south-easternOregon and through the northern tip of Idaho tonorth-west Montana. On a map of this scale,Washington State belongs nearly entirely to thissecond climatically supportive region of thepotential
A. petiolata
-distribution area. Smallisolated parts of this western distribution rangeare localized in central Alberta, southern Idahoand adjacent Utah.
The main part of this area belongs to theRocky Mountain Region of Takhtajan (1986).The Vancouverian floristic province, which is therange of Pacific Coast conifer forests (broad-leaved trees are more conspicuous than in theRocky Mountain ranges), is the most suitable
DDI_144.fm Page 226 Monday, June 24, 2002 7:03 PM
Distribution of garlic mustard in N. America
227
© 2002 Blackwell Science Ltd,
Diversity and Distributions
,
8
, 219–233
area for
A. petiolata
. It is characterized by anoceanic cool temperate forest climate (Bruillet &Whetstone, 1993). The Intermountain grasslandwith its dry steppe climate and cold winters alongwith the Mediterranean woodlands and scrub-lands of California are excluded from zone I.
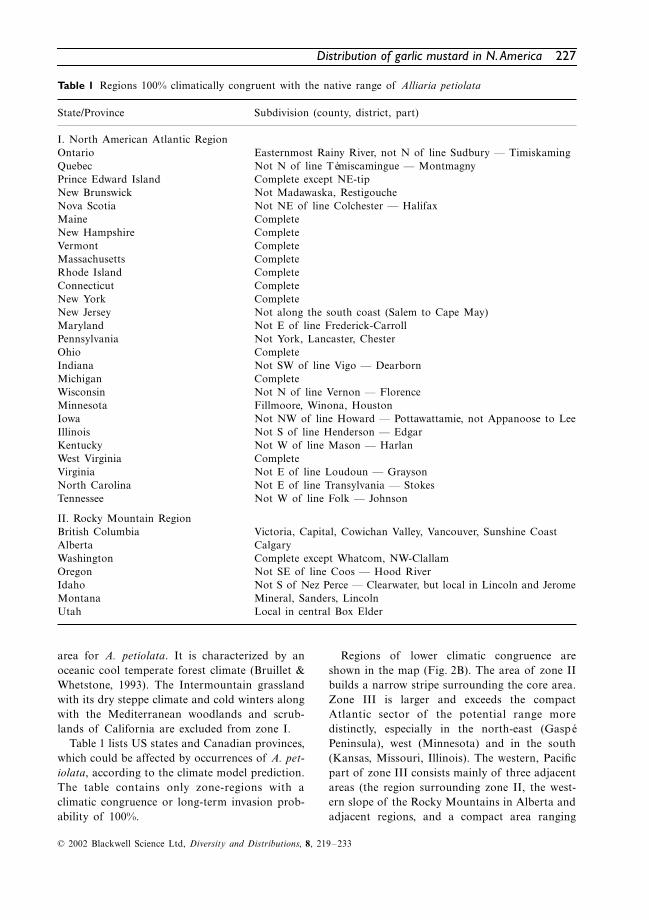
Table 1 lists US states and Canadian provinces,which could be affected by occurrences of
A. pet-iolata
, according to the climate model prediction.The table contains only zone-regions with aclimatic congruence or long-term invasion prob-ability of 100%.
Regions of lower climatic congruence areshown in the map (Fig. 2B). The area of zone IIbuilds a narrow stripe surrounding the core area.Zone III is larger and exceeds the compactAtlantic sector of the potential range moredistinctly, especially in the north-east (GaspéPeninsula), west (Minnesota) and in the south(Kansas, Missouri, Illinois). The western, Pacificpart of zone III consists mainly of three adjacentareas (the region surrounding zone II, the west-ern slope of the Rocky Mountains in Alberta andadjacent regions, and a compact area ranging
Table 1 Regions 100% climatically congruent with the native range of Alliaria petiolata
State/Province Subdivision (county, district, part)
I. North American Atlantic RegionOntario Easternmost Rainy River, not N of line Sudbury — TimiskamingQuebec Not N of line Témiscamingue — MontmagnyPrince Edward Island Complete except NE-tipNew Brunswick Not Madawaska, RestigoucheNova Scotia Not NE of line Colchester — HalifaxMaine CompleteNew Hampshire CompleteVermont CompleteMassachusetts CompleteRhode Island CompleteConnecticut CompleteNew York CompleteNew Jersey Not along the south coast (Salem to Cape May)Maryland Not E of line Frederick-CarrollPennsylvania Not York, Lancaster, ChesterOhio CompleteIndiana Not SW of line Vigo — DearbornMichigan CompleteWisconsin Not N of line Vernon — FlorenceMinnesota Fillmoore, Winona, HoustonIowa Not NW of line Howard — Pottawattamie, not Appanoose to LeeIllinois Not S of line Henderson — EdgarKentucky Not W of line Mason — HarlanWest Virginia CompleteVirginia Not E of line Loudoun — GraysonNorth Carolina Not E of line Transylvania — StokesTennessee Not W of line Folk — Johnson
II. Rocky Mountain RegionBritish Columbia Victoria, Capital, Cowichan Valley, Vancouver, Sunshine CoastAlberta CalgaryWashington Complete except Whatcom, NW-ClallamOregon Not SE of line Coos — Hood RiverIdaho Not S of Nez Perce — Clearwater, but local in Lincoln and JeromeMontana Mineral, Sanders, LincolnUtah Local in central Box Elder
DDI_144.fm Page 227 Monday, June 24, 2002 7:03 PM
228
E. Welk
et al.
© 2002 Blackwell Science Ltd,
Diversity and Distributions
,
8
, 219–233
from northern Utah to southern Idaho). Isolatedlocalities are shown in central British Columbia(Nechako and Fraser River Valleys) and northernCalifornia (Klamath and North Coast Ranges).
Zone IV is much larger than the climatic corearea. It comprises Newfoundland and an isolatedarea south of Lake Winnipeg. Large parts of thePrairie Province, including most of South Dakotaand Nebraska connect the compact AtlanticRegion with the more scattered occurrence ofclimatically similar areas of the Rocky MountainRegion. Here, zone IV ranges from northernCalifornia and Colorado in the south to BritishColumbia and Alberta in the north. Zone Vcontains the remaining regions of North America,which are supposedly unfavourable for successfulestablishment of
A. petiolata
.
Comparison of current and potential range in North America
Evaluation of the quality of the model mustprimarily be based on occurrences reported frombeyond the predicted zones (omission errors).Due to the continuing expansion of the relatively‘young’ distribution area, it cannot be assumed
that invasion is complete. However, large gapsfound within areas which are almost completelyinvaded must be included in a critical analysis ofthe quality of the model.
At a first glance, the comparison of the currentand potential range shows one main result. Thespread of
A. petiolata
in eastern North Americahas reached almost every climatically suitableregion, at least with isolated occurrences.Repeated introduction (Meekins
et al
., 2001) andhuman-facilitated dispersal enable the species to‘fill’ its potential distribution area very quickly.But within this potential range, garlic mustardhas not yet invaded every possible habitat, andthus, the process of invasion is far from over.
A large proportion of the current occurrences(
c.
70%) are situated in zone I; 6%, 7%, 14% and3% of the currently known localities are situatedwithin zones II, III, IV and V, respectively.
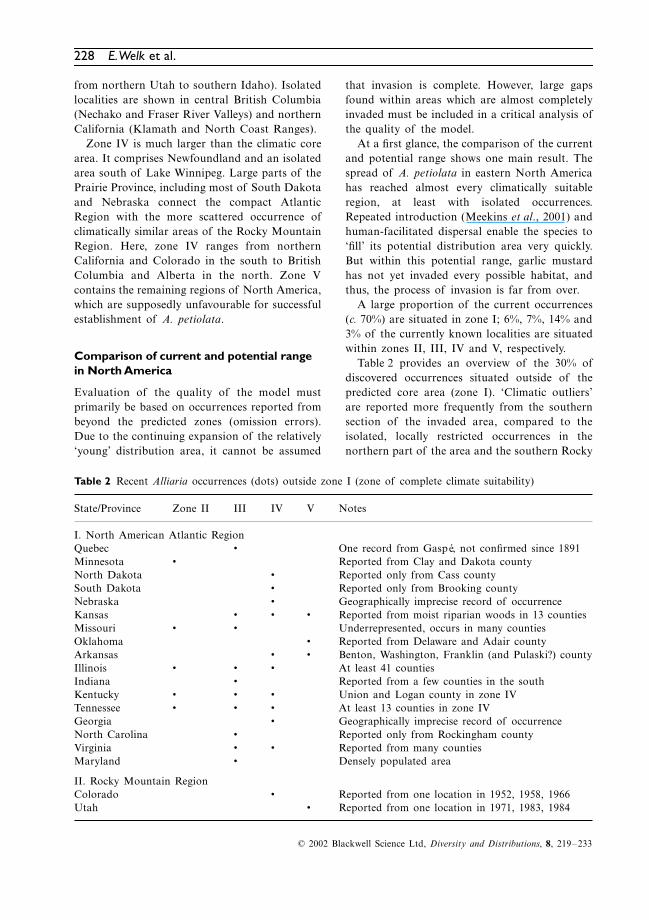
Table 2 provides an overview of the 30% ofdiscovered occurrences situated outside of thepredicted core area (zone I). ‘Climatic outliers’are reported more frequently from the southernsection of the invaded area, compared to theisolated, locally restricted occurrences in thenorthern part of the area and the southern Rocky
Table 2 Recent Alliaria occurrences (dots) outside zone I (zone of complete climate suitability)
State/Province Zone II III IV V Notes
I. North American Atlantic RegionQuebec • One record from Gaspé, not confirmed since 1891Minnesota • Reported from Clay and Dakota countyNorth Dakota • Reported only from Cass countySouth Dakota • Reported only from Brooking countyNebraska • Geographically imprecise record of occurrenceKansas • • • Reported from moist riparian woods in 13 countiesMissouri • • Underrepresented, occurs in many countiesOklahoma • Reported from Delaware and Adair countyArkansas • • Benton, Washington, Franklin (and Pulaski?) countyIllinois • • • At least 41 countiesIndiana • Reported from a few counties in the southKentucky • • • Union and Logan county in zone IVTennessee • • • At least 13 counties in zone IVGeorgia • Geographically imprecise record of occurrenceNorth Carolina • Reported only from Rockingham countyVirginia • • Reported from many countiesMaryland • Densely populated area
II. Rocky Mountain RegionColorado • Reported from one location in 1952, 1958, 1966Utah • Reported from one location in 1971, 1983, 1984
DDI_144.fm Page 228 Monday, June 24, 2002 7:03 PM
Distribution of garlic mustard in N. America
229
© 2002 Blackwell Science Ltd,
Diversity and Distributions
,
8
, 219–233
Mountains. In addition to isolated outposts inOklahoma, Arkansas, Georgia and North Caro-lina, much more numerous occurrences are to befound particularly in Kansas and Tennessee, andprobably in Illinois and Missouri.
All reported occurrences in the Pacific North-west are situated within ‘zone I’ as predicted by theclimatic model. However, this part of the rangecomprises only a few localities, and thus theoccupation of the western subsection has to beconsidered as being in an initial phase of invasion.
DISCUSSION
The data
For identifying and predicting species’ habitatpreferences and requirements in relation to cli-matic variables, the quality of spatial data aboutclimate and distribution is crucial. On a globalscale, floristic knowledge differs greatly fromregion to region (see Jäger’s map in Frodin 2001).In some regions data is sparse in terms of time(short normal periods) and space (density ofweather stations). The validity of the interpolatedclimate data is somewhat limited, especially inthese regions.
Another problem in modelling plants distribu-tion areas is the use of different types and num-bers of climatic parameters. It might be arguedthat it is the extreme values in the year that aremost critical to plants. Indeed, many modellers inthis field use metrics, such as minimum monthlytemperatures or, on an annual scale, minimumtemperatures of the coldest month. Extremevalues are, however, not always particularly robustmeasures. The use of mean values in place ofextreme values can be justified particularly withoscillations of the plants distribution areas, espe-cially as climate is likewise subjected to oscilla-tions. Mean values of many years of productionand reproduction are crucial for the fitness of thepopulations. The fact that modelling with bothextreme values and mean values produces goodresults is due to the close relationship (parallel-ism) between monthly extremes and mean values.Finally, on large spatial scales, range boundariesresult from the complete life cycle of the plants,which depend on the climate over the whole yearand thus includes the possibility of regenerationas well as any temporary damage.
Another problem is the possible life cyclechanges of the species due to genetic differentia-tion in isolated populations or adaptation to newcombinations of environmental factors.
Thompson
et al
. (1999) calculated a series of‘bioclimatic’ variables that were proposed asmore direct controls over plant distributions thantemperature and precipitation. However, on largespatial scales (e.g. global and Holarctic), theseindices might not reflect the important differ-ences between the climatic rhythms of the easternand western sides of the main landmasses (Jäger,1995); a situation that favours the use of the basicclimatic parameters. Artificially limiting thenumbers of climatic parameters may result in poorlyfitting models, such as in Beerling
et al
. (1995).The FloraMap™ system (CIAT, 1999), which
is designed for mapping large-scale climate prob-abilities mainly for the tropic regions of theworld, uses monthly average diurnal temperatureranges in addition to rainfall and temperaturedata (altogether 36 climate variables). For aspatially more explicit large scale modelling ofplant ranges, high quality distribution maps anda wide array of basic climatic parameters arenecessary.
Frequency diagrams
Comparing the data of Baskin & Baskin (1992),Byers & Quinn (1998); Cavers
et al
. (1979),Grime et al. (1988), Meekins (2000), Nuzzo(1993); Rejmánek (2000) and Trimbur (1973)with the diagrams (Fig. 1), it appears that lifecycle data are reflected to a large extent.
At the time of germination (late February untilbeginning of April in northern localities) theremust be an average minimum monthly precipita-tion of 25 mm at temperatures between 0 °C and12 °C. In the plant’s native distribution range,optimal mean values are 5–10 °C and 30–60 mm.In May (main time of flowering), precipitationmust reach an average minimum of 30 mm, com-bined with average monthly temperatures rangingfrom 8 °C to 18 °C.
For a successful establishment of the youngplants, the elongation of the flowering stems, thedevelopment of flowers and seed formation, afrost-free time of at least 4 months is probablynecessary. The development of the plants isclearly temperature related; long-term studies
DDI_144.fm Page 229 Monday, June 24, 2002 7:03 PM
230 E. Welk et al.
© 2002 Blackwell Science Ltd, Diversity and Distributions, 8, 219–233
have documented that A. petiolata flowers openearlier with increasing temperature (Fitter et al.,1995).
In July and August, the young rosettes of A.petiolata expose minimal leaf size. Adult plantsare in the life cycle phase of seed ripening at thistime and therefore may need a certain minimumtemperature, whereas rainfall is of lesser impor-tance. In the plant’s native distribution range,mean values of the July temperature (between16 °C and 23 °C) appear to be most favourablefor the species.
Autumn precipitation does not seem to be ofgreat importance for the distribution of A. peti-olata. The relevant diagrams (Fig. 1A) show amodest increase at lower amounts of precipita-tion. However, only a few occurrences areobserved at precipitation values of less than20 mm for September and of less than 30 mm forOctober The diagrams of temperature (Fig. 1B)indicate that optimal temperatures have to bewell above the freezing in these months. It ispossible that these temperatures are necessary forthe further growth of the plants and the forma-tion of new rosette leaves.
During the winter, A. petiolata may requiretemperatures low enough to break seed dor-mancy through cold stratification. If daytimetemperatures are above freezing the rosettes cancontinue growth and biomass production. Belowa sufficiently thick snow cover, the rosettes cansurvive even periods of severe frost.
The diagrams for winter temperature (Fig. 1B)show a relatively wide range of values (26–28 Kfor December, January and February), but meantemperatures below 5 °C seem to be necessary.This value is not necessarily the prerequisite forbreaking seed dormancy; however, these minimalvalues are the expression of temperature condi-tions that enable this physiological process. On theother hand, these low temperatures may prevent thedevelopment of competing evergreen vegetation.
In summary, it can be said that the native dis-tribution range of A. petiolata is roughly approx-imated by climatic factors, such as moisture(≥ 500 mm annual rainfall), sufficient warmthduring the main time of development (the 9 °CMay isotherm), sufficient cold winters (the 6 °CJanuary isotherm), and a sufficient time span forplant development (symbolized by the isoline of> 120 frost-free days).
The climatic model
The climatic model of the distribution range ofA. petiolata describes both the natural and theadventitious, neophytic range of the species witha large degree agreement. This may confirm theassumption that, on a global scale, climate is themain range-limiting factor for this species.However, the agreement of the model and theobserved native range is not complete, especiallyin mountainous regions. These mismatches arecaused by differences between the altitudinaldistribution of the plant and the interpolatedelevation of the underlying climate grids.
Large distribution ranges, partly limited byseacoasts, are generally reducing the possibilitiesof climatic modelling. For example, it is impos-sible to characterize the potential western rangeboundary in Europe with climatic variables alone.
Additionally, for relatively large parts of itsrange (e.g. Turkey) only very sparse floristic dataare available. Thus, the agreement with the modelproduced from climatic data could possibly behigher here. In the north-eastern part of the area(Byelorussia and adjacent north-west Russia)edaphic factors probably mask the effect of cli-mate. Here, unsuitable soil conditions (wet andacidic, see above) seem to produce a large gap inan otherwise climatically suitable region. The verydetailed distributional data for north-westernEurope (Denmark and Scotland) emphasis theimportance of soil factors, which modify or over-ride the influences of climate in these areas.
In North America, the reasons for the differ-ences between the current distribution range andthat of the climatic model are clear. The large,uninvaded areas north of the Great Lakes andthe valley of the St. Lorenz Stream may beattributed to the prevalence in these areas ofshallow soils derived primarily from ancientacidic bedrock, which are associated predom-inantly with coniferous forest vegetation.Although some vigorous Alliaria populations arereported from habitats upon the Canadian Shield(IPCP, 1999), it should be assumed that A. peti-olata reaches its climatically defined northernboundary only locally within areas of humansettlement (parks, hedges, edges of road andgardens). Its limited occurrence in New Brunswickis also within an area of calcareous bedrock. Moreextensive distributions of A. petiolata can only
DDI_144.fm Page 230 Monday, June 24, 2002 7:03 PM
Distribution of garlic mustard in N. America 231
© 2002 Blackwell Science Ltd, Diversity and Distributions, 8, 219–233
be expected in the Mixedwood Plain Ecozone(Barbour & Christensen, 1993), a biogeograph-ical region dominated by limestone bedrock,where soils and water bodies tend to be alkaline.
Certainly, probability zones II–IV will remaindevoid of A. petiolata in Canada. This predictionis strongly supported by the long-term, relativelylimited distribution of invading A. petiolata inCanadian compared with the situation in theadjacent United States.
The second remarkably sparsely populatedarea is the Pacific Northwest section of thepredicted range. At this point in time, A. petiolatamay be at an early stage of invasion (the ‘lag-phase’, see Jäger, 1995), as the first report datesback to 1948. The area of distribution predictedby the climatological model depends on the inter-polated climate surfaces and does not satisfact-orily reflect the great regional variation causedby the very diverse topography. Beside possibleoccurrences in ruderal habitats, cultivated landand other man-made vegetation types, suitablegrowth conditions seem in fact to be restricted tosmall parts of the predicted area.
In the forests of the Pacific, or Humid Transi-tion area, dense coniferous overstoreys aboverich ericaceous shrub, herb and moss canopiesoffer very limited opportunities for A. petiolatato invade natural habitats of the region. Favour-able growth conditions may occur along rivervalleys of lowlands and in humid grasslands.
The Cascade Mountains form a sharp and effi-cient climatic barrier across the predicted range.For the arid eastern part, with predominantlysagebrush, bunchgrass and yellow pine vegeta-tion, suitable growth conditions are hardlyencountered. Here, A. petiolata may invade habitatswith extrazonal vegetation, like river valleys, moistplaces, shady, north facing slopes and severalmountainous habitat types. However, more prob-able are occurrences in urbane areas and disturbed,nutrient-rich places around human settlements.
The next conspicuous difference between themodelled and the observed distribution are therelatively numerous Alliaria occurrences in prob-ability zones III–V reported from Kansas. Thelocalities are concentrated in the north-easternpart of the state. The linearly arranged dots (seeFig. 2A) indicate the association with riversideforest strips of the wooded floodplains alongMissouri and Kansas Rivers, and their tributaries.
These are extrazonal vegetation types whose distribu-tion is predominantly influenced by topography,geology and soil characteristics, rather than byclimatic variables. The same interpretation mayapply to the occurrences reported from Tennessee.According to Baskin & Baskin (1992), possiblelife cycle changes (see above) were not detected inthis region.
Further discussion about differences betweenthe modelled and the actual distribution seemunnecessary, in so much as areas predicted by themodel to be suitable for Alliaria but which areuninhabited might either not have been reachedby diaspores, or were predicted falsely as suitabledue to the locally restricted predictive power ofclimatic variables. Another, and more speculative,explanation for the absence of the plant from cli-matically suitable areas as predicted by the modelmight be due to the origin of the introduceddiaspores. It is possible that A. petiolata is locallyadapted to particular climate conditions in itsnatural range. From the entire source populationof A. petiolata constituting its natural distribu-tion range, a random sample has been trans-ported by humans to North America (seeMeekins et al., 2001). This sample may not beable to spread with equal speed to all regionsthat are predicted as climatically suitable.
In summary, it can be stated that not all of thepredicted areas will necessarily be invaded byAlliaria. The probability zones show only thespatial framework within which — if furtherrequirements and preconditions are met (such asthe presence of human vectors) — Alliaria has ahigh (climatically defined) likelihood of inhabit-ing in the long term. The presence of non-acidicsoils, deciduous wood vegetation and mesic hab-itat conditions seems to be a particularly impor-tant combination of additional prerequisites. Ifthey are fulfilled, habitats with extrazonal vege-tation and man-made habitats can becomeinvaded locally, even if they are in zones III andIV. However, wide-ranging invasions of natural,zonal vegetation types are not predicted to occurhere.
Usually, predictions are easy to make butdifficult to test. Pysek (2001) states that most ofthe predictions in invasion ecology were made toorecently to know whether they are accurate ornot. The research on well known, non-indigenousEuropean species in North America, and vice
DDI_144.fm Page 231 Monday, June 24, 2002 7:03 PM
232 E. Welk et al.
© 2002 Blackwell Science Ltd, Diversity and Distributions, 8, 219–233
versa, provides us with opportunities for long-term field tests because many of the species hadhave enough time to reach even the remote partsof their potential distribution ranges on their‘new’ continents. With a review of the results ofinvestigations on a large number of species withdifferent life history strategies, life forms andnative range types, our understanding of thedifferent capacities of climatic range models forpredicting invasiveness could be improved.
ACKNOWLEDGMENTS
This research was supported by the DeutscheForschungsgemeinschaft. The manuscript wasimproved by the helpful suggestions of KarstenWesche, Linda Scott and two anonymous referees.The authors would like to express thanks to W.Cramer (Potsdam Institute of Climate ImpactResearch) for providing the climate data.
REFERENCES
Austin, M.P., Meyers, J.A., Belbin, L. & Doherty,M.D. (1995) Modelling of landscape patterns andprocesses using biological data: sub-project 5,simulated data case study. Division of Wildlifeand Ecology, Commonwealth Scientific andIndustrial Research Organisation, Canberra.
Barbour, M.G. & Christensen, N.L. (1993) Vegeta-tion. Flora of North America north of Mexico,Vol. 1 (ed. by Flora of North America EditorialCommittee), pp. 97–131. Oxford University Press,New York.
Bartlein, P.J., Prentice, I.C. & Webb, T. (1986)Climate response surfaces from pollen data forsome eastern North American taxa. Journal ofBiogeography 13, 35–57.
Baskin, J.M. & Baskin, C.C. (1992) Seed germina-tion biology of the weedy biennial Alliaria petio-lata. Natural Areas Journal 12, 191–197.
Beerling, D.J., Huntley, B. & Bailey, J.P. (1995)Climate and the distribution of Fallopia japonica:use of an introduced species to test the predictivecapacity of response surfaces. Journal of Vegeta-tion Science 6, 269–282.
Blossey, B., Nuzzo, V., Hinz, H. & Gerber, E. (2001)Developing biological control of Alliaria petiolata(M. Bieb.) Cavara and Grande (garlic mustard).Natural Areas Journal 21/4, 357–367.
de Bolós, O. & Vigo, J. (1990) Flora dels PaisosCatalans. II (Crucíferes — Amarantácies). Bar-cino, Barcelona.
Booth, T.H. (1991) A climatic/edaphic database andplant growth index prediction system for Africa.Ecological Modelling 56, 127–134.
Booth, T.H. & Jones, P.G. (1998) Identifying climat-ically suitable areas for growing particular trees inLatin America. Forest Ecology and Management108, 167–173.
Box, E.O. (1981) Macroclimate and plant forms: anintroduction to predictive modelling in phytogeo-graphy. Dr. W. Junk Publishers, The Hague.
Box, E.O., Crumpacker, D.W. & Hardin, E.D.(1993) A climatic model for location of plantsspecies in Florida, U.S.A. Journal of Biogeography20, 629–644.
Bruillet, L. & Whetstone, R.D. (1993) Climate andPhysiography. Flora of North America North ofMexico, Vol. 1 (ed. by Flora of North AmericaEditorial Committee), pp. 13–46. Oxford Univer-sity Press, New York.
Busby, J.R. (1991) BIOCLIM — A bioclimatic ana-lysis and prediction system. Nature conservation:cost effective biological surveys and data analysis.(ed. by C.R. Margules and M.P. Austin), pp. 64–68. CSIRO, Canberra.
Byers, D.L. & Quinn, J.A. (1998) Demographicvariation in Alliaria petiolata (Brassicaceae) infour contrasting habitats. Journal of the TorreyBotanical Society 125, 138–149.
Cavers, P.B., Heagy, M.I. & Kokron, R.F. (1979)The biology of Canadian weeds. 35. Alliaria peti-olata (M. Bieb.) Cavara and Grande. CanadianJournal of Plant Science 59, 217–229.
CIAT (1999) Floramap™ [Copyright 1999]. Interna-tional Centre for Tropical Agriculture (CIAT), Cali,Columbia. http://www.floramap-ciat.org/floramap.
Cronk, Q.C.B. & Fuller, J.L. (1996) Plant invaders.Chapman & Hall, New York.
ESRI (1992) Arc/Info™. ESRI, Redlands.Fitter, A.H., Fitter, R.S.R., Harris, I.T.B. &
Williamson, M.H. (1995) Relationships betweenfirst flowering date and temperature in the flora ofa locality in central England. Functional Ecology9, 55–60.
Frodin, D.G. (2001) Guide to standard floras of theworld. 2nd edn. University Press, Cambridge.
Gaston, K.J. (1994) Measuring geographic rangesizes. Ecography 17, 198–205.
Grace, J. (1987) Climatic tolerance and the distributionof plants. New Phytologist 106 (Suppl.), 113–170.
Grime, J.P., Hodgson, J.G. & Hunt, R. (1988) Com-parative plant ecology: A functional approach tocommon British species. Unwin-Hyman, London.
de Halácsy, E. (1901) Conspectus florae Graecae,Vol. I. Engelmann, Leipzig.
Hoffmann, M.H. (2000) Biogeography and climaticdifferentiation of two annual species of TeesdaliaR. B. (Brassicaceae). Journal of Biogeography 27,989–999.
Hoffmann, M.H. (2001) The distribution of Seneciovulgaris: capacity of climatic range models forpredicting adventitious ranges. Flora 196/5, 395–403.
DDI_144.fm Page 232 Monday, June 24, 2002 7:03 PM
Distribution of garlic mustard in N. America 233
© 2002 Blackwell Science Ltd, Diversity and Distributions, 8, 219–233
Hoffmann, M.H. (2002) Biogeography of Arabidop-sis thaliana (L.) Heynh. (Brassicaceae). Journal ofBiogeography 29/1, 125–134.
Hoffmann, M.H. & Welk, E. (1999) A method forthe estimation of the global population sizes ofplant species — the area–abundance index. GlobalEcology and Biogeography Letters 8, 39–46.
Howden, S.M. (1986) The potential distribution ofbitou bush in Australia. Proceedings of a NationalConference on Chrysanthemoides monilifera (ed.by R. Holtkamp), pp. 69–77. New South WalesNational Parks and Wildlife Service and Depart-ment of Agriculture, Sydney.
Huntley, B., Berry, P.M., Cramer, W. & McDonald, A.P.(1995) Modelling present and potential futureranges of some European higher plants using climateresponse surfaces. Journal of Biogeography 22, 967–1001.
IPCP (1999) Alliaria petiolata. http://www.cws-scf.ec.gc.ca/habitat/inv/p8_e.html.
Jäger, E.J. (1970) Charakteristische Typen mediterran-mitteleuropäischer Pflanzenareale. Feddes Reper-torium 81, 67–92.
Jäger, E.J. (1995) Die Gesamtareale von Reynoutriajaponica H. und R. sachalinensis (F.S) N, ihre klimatische Interpretationund Daten zur Ausbreitungsgeschichte. Schriften-reihe für Vegetationskunde 27, 395–403.
Leemans, R. & Cramer, W. (1991) The IIASA data-base for mean monthly values of temperature,precipitation and cloudiness of a global terrestrialgrid. RR-91-18. International Institute for AppliedSystems Analysis (IIASA), Laxenburg, Austria.
Meekins, J.F. (2000) Population biology and commu-nity ecology of the invasive woodland herb Alliariapetiolata (Brassicaceae). PhD Thesis, OhioUniversity, Athens.
Meekins, J.F., Ballard, H.E. fil. & McCarthy, B.C.(2001) Genetic variation and molecular biogeo-graphy of a North American invasive plant species(Alliaria petiolata, Brassicaceae). InternationalJournal of Plant Science 162/1, 161–169.
Meusel, H., Jäger, E. & Weinert, E. (1965) Ver-gleichende Chorologie der ZentraleuropäischenFlora. Bd.1, (Text + Karten). Fischer, Jena.
Morisawa, T.L. (2000) Weed alert! Alliariapetiolata [Bieb.] Cavara and Grande. TheNature Conservancy, Arlington, VA. http://www.tncweeds.ucdavis.edu/alert/alrtalli.html
Nuzzo, V. (1993) Natural mortality of garlic mus-tard (Alliaria petiolata [Bieb.] Cavara and Grande)rosettes. Natural Areas Journal 13, 132–133.
Nuzzo, V. (2000) Element stewardship abstract forAlliaria petiolata (Alliaria officinalis) GarlicMustard. The Nature Conservancy, Arlington, VA.http://www.tncweeds.ucdavis.edu/esadocs/documnts/allipet.html
Panetta, F.D. & Dodd, J. (1987) Bioclimatic predic-tion of the potential distribution of skeleton weed
Chondrilla juncea L. in Western Australia. Journalof the Australian Institute of Agricultural Science53, 11–16.
Panetta, F.D. & Mitchell, N.D. (1991) Homoclimeanalysis and the prediction of weediness. WeedResearch 31, 273–284.
Perrings, C., Williamson, M. & Dalmazzone, S., eds(2000) The economics of biological invasions.Elgar, Cheltenham.
Pheloung, P.C., Williams, P.A. & Halloy, S.R. (1999)A weed risk assessment model for use as a biose-curity tool evaluating plant introductions. Journalof Environmental Management 57, 239–251.
Philcox, D. (1995) Brassicaceae. A revised handbookto the flora of Ceylon (ed. by M.D. Dassanayake,F.R. Fosberg and W.D. Clayton), pp. 1–13. Amer-ind, New Delhi.
Pysek, P. (2001) Past and future of predictions inplant invasions: a field test by time. Diversity andDistributions 7, 145–151.
Reichard, S.H. & Hamilton, C.W. (1997) Predictinginvasions of woody plants introduced into NorthAmerica. Conservation Biology 11, 193–203.
Rejmánek, M. (2000) On the use and misuse oftransition matrices in plant population biology.Biological Invasions 2/4, 315–317.
Skov, F. (2000) Potential plant distribution mappingbased on climatic similarity. Taxon 49, 503–515.
Skov, F. & Borchsenius, F. (1997) Predicting plantspecies distribution patterns using simple climaticparameters: a case study of Ecuadorian palms.Ecography 20, 347–355.
Sutherst, R.W. & Maywald, J.F. (1985) A computer-ised system for matching climates in ecology.Agriculture, ecosystems and environment 13, 281–299.
Takhtajan, A. (1986) Floristic regions of the world.University of California Press, Berkeley.
Thompson, R.S., Bartlein, P.J. & Anderson, K.H.(1999) Atlas of relations between climatic para-meters and distributions of important trees and shrubsin North America. US Geological Survey Profes-sional Paper 1650 A&B, Online Version 1.0, http://greenwood.cr.usgs.gov/pub/ppapers/p1650-a/atlas-intro.html. US Geological Survey, Reston, VA.
Trimbur, T.J. (1973) An ecological life history ofAlliaria officinalis, a deciduous forest ‘weed’. MScThesis. Ohio State University, Columbus.
Tucker, K.C. & Richardson, D.M. (1995) An expertsystem for screening potentially invasive alienplants in South African fynbos. Journal of Envir-onmental Management 44, 309–338.
Webb, C.J., Sykes, W.R. & Garnock-Jones, P.J.(1988) Flora of New Zealand. IV. Naturalisedpteridophytes, gymnospermes, dicotyledons. BotanyDivision, D.S.I.R., Christchurch, New Zealand.
Woodward, F.I. (1987) Climate and plant distribu-tion. University Press, Cambridge.
DDI_144.fm Page 233 Monday, June 24, 2002 7:03 PM
Related Documents