ORIGINAL ARTICLE Presence of Giardia cysts and Cryptosporidium oocysts in drinking water supplies in northern Spain D. Carmena 1 , X. Aguinagalde 1 , C. Zigorraga 2 , J.C. Ferna ´ ndez-Crespo 1 and J.A. Ocio 1 1 Department of Health, Laboratory of Public Health of A ´ lava, Basque Government, Vitoria-Gasteiz, Spain 2 Department of Health, Laboratory of Public Health of Guipu ´ zcoa, Basque Government, San Sebastia ´ n, Spain Introduction Protozoan enteroparasites of the genera Cryptosporidium (phylum Apicomplexa) and Giardia (subphylum Sarco- mastigophora) have emerged over the past decades as major waterborne pathogens. Both parasites are among the major causative agents of gastroenteritis in humans and can potentially shorten the life spans of immunocom- promised individuals. These micro-organisms are trans- mitted via the faecal–oral route, with the consumption of contaminated drinking water and use of recreational waterways significant avenues for acquisition of infection in developed countries (Slifko et al. 2000). Cryptospori- dium and Giardia are ubiquitous in the aquatic environ- ment and their transmission stages (oocysts and cysts, respectively) may remain viable for several months under Keywords Cryptosporidium, Giardia, drinking water, public health, recreational water, water quality. Correspondence D. Carmena, MRC Clinical Sciences Centre, Faculty of Medicine, Imperial College, Hammersmith Hospital Campus, Du Cane Road, London W12 0NN, UK. E-mail: [email protected] 2006/0916: received 28 June 2006, revised 23 August 2006 and accepted 6 September 2006 doi:10.1111/j.1365-2672.2006.03193.x Abstract Aims: To evaluate the prevalence of Cryptosporidium and Giardia in surface water supplies from the province of A ´ lava, northern Spain, and to investigate possible associations among the presence of these pathogenic protozoa with microbiological, physicochemical and atmospheric parameters. Methods and results: A total of 284 samples of drinking and recreational water supplies were analysed. Cryptosporidium oocysts were found in 63Æ5% of river samples, 33Æ3% of reservoirs samples, 15Æ4% and 22Æ6% of raw water samples from conventional and small water treatment facilities (respectively), 30Æ8% of treated water from small treatment facilities, and 26Æ8% of tap water from municipalities with chlorination treatment only. Giardia cysts were found in 92Æ3% of river samples, 55Æ5% of reservoirs samples, 26Æ9% and 45Æ2% of raw water samples from conventional and small water treatment facilities (respect- ively), 19Æ2% of treated water from small treatment facilities, and 26Æ8% of tap water from municipalities with chlorination treatment only. The presence of Cryptosporidium and Giardia had significant Pearson’s correlation coefficients (P <0Æ01) with the turbidity levels of the samples, and a number of significant associations were also found with the count levels for total coliforms and Escherichia coli. The samples were positive for Cryptosporidium significantly (P <0Æ05) more frequently during the autumn season than during the spring and winter seasons. No significant differences were found in the seasonal pat- tern of Giardia. A moderate association (r ¼ 0Æ52) was found between rainfall and the presence of Cryptosporidium oocysts. Conclusions: Cryptosporidium and Giardia are consistently found at elevated concentrations in surface waters for human consumption from the province of A ´ lava, northern Spain. Significance and Impact of the Study: Water treatments based on rapid filtra- tion process and/or chlorination only are often unsatisfactory to provide safe drinking water, a situation that represents an important public health problem for the affected population because of the risk of waterborne outbreaks. Journal of Applied Microbiology ISSN 1364-5072 ª 2006 The Authors Journal compilation ª 2006 The Society for Applied Microbiology, Journal of Applied Microbiology 102 (2007) 619–629 619

Welcome message from author
This document is posted to help you gain knowledge. Please leave a comment to let me know what you think about it! Share it to your friends and learn new things together.
Transcript
ORIGINAL ARTICLE
Presence of Giardia cysts and Cryptosporidium oocystsin drinking water supplies in northern SpainD. Carmena1, X. Aguinagalde1, C. Zigorraga2, J.C. Fernandez-Crespo1 and J.A. Ocio1
1 Department of Health, Laboratory of Public Health of Alava, Basque Government, Vitoria-Gasteiz, Spain
2 Department of Health, Laboratory of Public Health of Guipuzcoa, Basque Government, San Sebastian, Spain
Introduction
Protozoan enteroparasites of the genera Cryptosporidium
(phylum Apicomplexa) and Giardia (subphylum Sarco-
mastigophora) have emerged over the past decades as
major waterborne pathogens. Both parasites are among
the major causative agents of gastroenteritis in humans
and can potentially shorten the life spans of immunocom-
promised individuals. These micro-organisms are trans-
mitted via the faecal–oral route, with the consumption of
contaminated drinking water and use of recreational
waterways significant avenues for acquisition of infection
in developed countries (Slifko et al. 2000). Cryptospori-
dium and Giardia are ubiquitous in the aquatic environ-
ment and their transmission stages (oocysts and cysts,
respectively) may remain viable for several months under
Keywords
Cryptosporidium, Giardia, drinking water,
public health, recreational water, water
quality.
Correspondence
D. Carmena, MRC Clinical Sciences Centre,
Faculty of Medicine, Imperial College,
Hammersmith Hospital Campus, Du Cane
Road, London W12 0NN, UK.
E-mail: [email protected]
2006/0916: received 28 June 2006, revised
23 August 2006 and accepted 6 September
2006
doi:10.1111/j.1365-2672.2006.03193.x
Abstract
Aims: To evaluate the prevalence of Cryptosporidium and Giardia in surface
water supplies from the province of Alava, northern Spain, and to investigate
possible associations among the presence of these pathogenic protozoa with
microbiological, physicochemical and atmospheric parameters.
Methods and results: A total of 284 samples of drinking and recreational water
supplies were analysed. Cryptosporidium oocysts were found in 63Æ5% of river
samples, 33Æ3% of reservoirs samples, 15Æ4% and 22Æ6% of raw water samples
from conventional and small water treatment facilities (respectively), 30Æ8% of
treated water from small treatment facilities, and 26Æ8% of tap water from
municipalities with chlorination treatment only. Giardia cysts were found in
92Æ3% of river samples, 55Æ5% of reservoirs samples, 26Æ9% and 45Æ2% of raw
water samples from conventional and small water treatment facilities (respect-
ively), 19Æ2% of treated water from small treatment facilities, and 26Æ8% of tap
water from municipalities with chlorination treatment only. The presence of
Cryptosporidium and Giardia had significant Pearson’s correlation coefficients
(P < 0Æ01) with the turbidity levels of the samples, and a number of significant
associations were also found with the count levels for total coliforms and
Escherichia coli. The samples were positive for Cryptosporidium significantly
(P < 0Æ05) more frequently during the autumn season than during the spring
and winter seasons. No significant differences were found in the seasonal pat-
tern of Giardia. A moderate association (r ¼ 0Æ52) was found between rainfall
and the presence of Cryptosporidium oocysts.
Conclusions: Cryptosporidium and Giardia are consistently found at elevated
concentrations in surface waters for human consumption from the province of
Alava, northern Spain.
Significance and Impact of the Study: Water treatments based on rapid filtra-
tion process and/or chlorination only are often unsatisfactory to provide safe
drinking water, a situation that represents an important public health problem
for the affected population because of the risk of waterborne outbreaks.
Journal of Applied Microbiology ISSN 1364-5072
ª 2006 The Authors
Journal compilation ª 2006 The Society for Applied Microbiology, Journal of Applied Microbiology 102 (2007) 619–629 619
a range of environmental conditions (Smith et al. 1995).
In addition, Cryptosporidium oocysts and Giardia cysts
are resistant to conventional disinfectants at the concen-
trations and exposure times commonly used, and their
infectious doses in humans have been estimated to be as
low as 30 oocysts for Cryptosporidium (DuPont et al.
1995) and 10 cysts for Giardia (Adam 2001). Taking
together, these data indicate that Cryptosporidium and
Giardia represent a significant threat to public health.
More than 160 waterborne outbreaks of cryptosporidi-
osis and giardiasis have been reported worldwide, with
most cases reported in the US and UK (Slifko et al. 2000;
Craun et al. 2002). This situation has become a major
concern for water utilities and sanitary authorities that
are responsible for providing safe drinking water supplies
for human consumption. In the US, the US Environmen-
tal Protection Agency (USEPA) initiated an effort in 1996
to collect data related to the biology and the epidemiol-
ogy of these protozoa, and to evaluate their risk to
human health. As a result, the USEPA has implemented
national drinking water regulations and developed inno-
vative technologies to improve the detection, monitoring
and surveillance of these micro-organisms in drinking
water (U.S. Environmental Protection Agency 2002). Sim-
ilar initiatives have been implemented in other countries
including England, Wales (Drinking Water Inspectorate
2003), Canada (Health Canada 2004) and New Zealand
(Ministry of Health of New Zealand 2005). The new
European Drinking Water Directive (Directive 98/83/CE)
establishes the goal that all the state members should pro-
vide drinking water supplies with the absence of patho-
genic organisms. However, for practical purposes, the
highly variable sensitivities of the methods available for
the detection of Cryptosporidium and Giardia and prob-
lems associated with the determination of the (oo)cysts
viability/infectivity make the establishment of maximum
acceptable concentrations very difficult (Messner and
Wolpert 2003). Concentrations of ‡3–30 (oo)cysts per
100 l in treated water have been proposed as an ‘action
level’, where the possibility of an outbreak may exist
(Haas and Rose 1995; Wallis et al. 1996).
The province of Alava (northern Spain) extends over
3037 km2, has winter/summer temperatures ranging from
)6�C to 16�C and 7�C to 38�C, respectively, and its
annual precipitation is in the range of 650–900 l m)2. It
has an estimated population of 294 360 people, of which
223 257 are living in the capital, Vitoria-Gasteiz. The
province bears a significant cattle farming activity whose
runoff may be a potential source of contamination in sur-
face waters. The Zadorra Reservoir (225 Hm3) is the main
water supply for human consumption, providing drinking
water to approx. 2 million people in Vitoria-Gasteiz and
the Gran Bilbao area of the adjacent province of Vizcaya.
Other smaller water bodies, as the Marono (2Æ2 Hm3) and
Arceniega (1Æ4 Hm3) reservoirs, supply drinking water to
a number of minor towns. These drinking water sources
are generally open to varied recreational uses, including
swimming recreation, especially during the summer
months. The treatment of the water is carried out in con-
ventional large and medium-size water plants and includes
coagulation, flocculation, clarification through sedimenta-
tion, filtration and disinfection processes. However, there
are also approx. 300 small communities that use surface
water supplies with minimal treatment, usually only chlor-
ination. Because Cryptosporidium oocysts and Giardia
cysts are resistant to this disinfectant, these communities
(estimated total population of approx. 50 000 people) are
potentially at risk of waterborne outbreaks of crypto-
sporidiosis and/or giardiasis. These facts, together with the
lack of previous data in the province of Alava, have
induced the Department of Health of the Basque Govern-
ment to carry out the present study with the aims of
(i) evaluating the prevalence of Cryptosporidium and Giar-
dia in surface water supplies; (ii) estimating the efficiency
of treatment plants in removing these parasites; and
(iii) determining the relationship with microbiological,
physicochemical and atmospheric parameters.
Materials and methods
Sample collection and filtration
A total of 284 samples of water supplies for human
consumption and/or recreation were analysed. Samples
were collected over a 30-month period between April
2000 and September 2002, and comprised natural surface
waters from rivers (n ¼ 52) and reservoirs (n ¼ 36), raw
(n ¼ 26) and treated (n ¼ 31) water from conventional
water treatment facilities (CWTF, facilities that include
coagulation, flocculation, sedimentation, filtration and
disinfection processes), raw (n ¼ 31) and treated (n ¼26) water from small water treatment facilities (SWTF,
facilities that include rapid filtration and/or disinfection
processes only), and tap water (n ¼ 82) from municipal-
ities with chlorination treatment only. Sampling was
mainly directed to those points where Cryptosporidium
and Giardia were suspected. Sampling points were tested
at an interval of approx. 2 months, although when
increased numbers of pathogens in waters were observed
surveillance was intensified to weekly intervals. Samples
were collected in the field by using a portable sampling
apparatus equipped with a peristaltic pump. A minimum
of 100 l of water was filtered through a polypropylene
MicroWynd D-PPPY filter (Cuno Europe, France) of
1-lm nominal pore size at a flow rate of 3–5 l min)1.
However, less volume of water was processed in some
Giardia and Cryptos. in surface waters D. Carmena et al.
620 Journal compilation ª 2006 The Society for Applied Microbiology, Journal of Applied Microbiology 102 (2007) 619–629
ª 2006 The Authors
samples with high turbidity because of filter clogging.
Filters were returned to the laboratory in clean poly-
thene containers, typically within 2–5 h after filtration.
Upon receipt, the samples were stored refrigerated at
4�C until processed. Water sub samples were also inde-
pendently collected following the standard procedures
for subsequent physicochemical and microbiological
analysis.
Sample elution and concentration
Samples were processed within 24 h after filtration.
Briefly, filters were kept in the housing with the water that
remained after sampling and subjected to a crosscurrent
air flow for 15 min to unpack the fibres and facilitate the
removal of cysts/oocysts. Filters were then cut longitudi-
nally and the fibres divided into an outer, middle and
inner layer. Portions were washed separately three times
for 5 min in 1 l of PBS buffer pH 7Æ2 containing 0Æ1%
SDS, 0Æ1% Tween 80, and 0Æ01% Antifoam A (Sigma-Ald-
rich, Dorset, UK). In order to increase the cyst/oocyst
recoveries, fibre portions were sonicated in a water bath
for 5 min at 40 Hz between the second and the third
wash. The material that was washed from the fibres was
centrifuged at 1050 g for 10 min using 50-ml centrifuge
tubes in a swinging-bucket rotor, and the supernatant
carefully discarded by aspiration. The packed pellet vol-
ume was recorded, and the pellet resuspended in a suitable
volume of deionized water and sonicated in a water bath
for 10 min at 40 Hz to prevent cysts/oocysts aggregation.
Sample purification
Cysts/oocysts in the samples were isolated from other par-
ticulate material by immunomagnetic separation using the
commercial kit Dynabeads GC-Combo (Dynal Biotech,
Bromborough, UK), as described in the method 1623
(U.S. Environmental Protection Agency 1999). Briefly, the
procedure involves adding magnetic beads labelled with
Cryptosporidium- and Giardia-specific monoclonal anti-
bodies to 10 ml of resuspended pellet and allowing
the antibody-antigen reactions to bind the (oo)cysts to
the beads. The sample is then magnetized, separating the
(oo)cyst-magnetic bead complex from the sample debris,
which is then discarded. The beads are then detached and
the (oo)cysts are added to a well slide for sample screen-
ing, allowed to air-dry completely, and fixed with acetone.
Sample staining and examination
The identification and enumeration of cysts/oocysts was
carried out by immunofluorescence assay using the
commercial kit Crypto/Giardia IF Test (Cellabs, Brookvale,
Australia), according to the manufacturer’s instructions.
Well slides were washed three times with abundant PBS
buffer pH 7Æ2, and after adding mounting medium, the
coverslip was sealed with nail polish. The slides were sys-
tematically examined by using epifluorescence microscope
(Zeiss Standard Lab 16; Carl Zeiss, Gottingen, Germany)
at 400· magnification, searching for brilliant apple-green
fluorescing round to oval objects. Magnification was
increased to 1000· for confirmation of presumptive sam-
ples and differential interference contrast microscopy was
used for identification of internal morphological features
such as number of sporozoites or nuclei, and presence of
axonema or median bodies. Estimations of the total
amount of cysts/oocysts were calculated considering the
volume of water filtered and the fraction of the pellet ana-
lysed. Positive and negative staining controls were rou-
tinely included.
Physicochemical analysis
Turbidity and free chlorine were measured in the laborat-
ory immediately after the arrival of the samples. Turbidity
was measured for each thoroughly stirred sample with a
Hach 2100N turbimeter (Hach, Loveland, CO, USA) and
the results were expressed in nephelometric turbidity
units (NTU). Free chlorine was measured in treated water
samples only by using the DPD chlorine test kit (La-
Motte, Chestertown, MD, USA) and expressed in milli-
gram per litre.
Analyses of Escherichia coli and total coliforms
Escherichia coli counts were determined by filtering
100-ml sample through a 0Æ45-lm pore size cellulose
filter (Millipore, Bedford, MA, USA). The filters were
incubated at 36�C for 24 h on the Chromocult� coliform
agar (Merck Biosciences, Nottingham, UK) and the dark
blue- to violet-coloured colonies were considered to be
E. coli. Total coliforms counts were determined by filter-
ing 100-ml samples through 0Æ45-lm pore size cellulose
filter (Millipore). The filters were incubated at 36�C for
24 h on the m-Endo total coliform agar (Millipore) and
the deep red with distinct green metallic sheen colonies
were counted as total coliforms.
Stock suspension preparation and enumeration
Human stools from patients infected with Giardia lamblia
were obtained from the Donostia Hospital, San Sebastian
(Spain). Stools from calves with cryptosporidiosis were
kindly provided by Dr Enrique Perez, Faculty of Veterin-
ary, University of Extremadura (Spain). Faecal samples
were filtered through a 0Æ5-mm sieve and concentrated by
D. Carmena et al. Giardia and Cryptos. in surface waters
ª 2006 The Authors
Journal compilation ª 2006 The Society for Applied Microbiology, Journal of Applied Microbiology 102 (2007) 619–629 621
centrifugation at 1050 g for 10 min. Cysts/oocysts were
isolated by using percoll-sucrose gradient (specific gravity:
1Æ09–1Æ10) and centrifugation at 1050 g for 10 min.
Purified cysts/oocysts were stored at 4�C in PBS buffer
pH 7Æ2 complemented with 10 000 U ml)1 penicillin and
10 mg ml)1 streptomycin (Sigma-Aldrich) to prevent bac-
terial growth. Spiking suspensions containing 10 000–
15 000 cysts/oocysts were prepared in reagent water with
0Æ01% Tween 20. Stock and spiking suspensions were
enumerated by using both haemocytometer chamber and
well slide for immunofluorescence detection (U.S. Envi-
ronmental Protection Agency 1995). A total of 10 differ-
ent haemacytometer chambers were counted and averaged
for each cyst/oocyst suspension to achieve optimal count-
ing accuracy. Well slide counting was performed by ana-
lysing a 20-ll aliquot of each cyst/oocyst suspension, in
triplicate. Stock suspensions of cysts/oocysts were used for
no more than 12 weeks following the purification.
Initial precision and recovery of the method
In order to determine the initial recovery achieved using
the method, 12 independent spiking experiments were
carried out by filtering 50 l of distilled water as described
above. Spiking suspensions with 2500 cysts of Giardia
and 5000 oocysts of Cryptosporidium were sequentially
delivered into the inlet tube of the sampling housing by
injection using a syringe with a 21-gauge needle. This
procedure avoids the loss off cysts/oocysts that may
remain attached to the internal wall of the carboy. The
percent recovery (R) of the method was calculated by
using the following equation:
R ¼ N=T � 100
where N is the number of cysts/oocysts detected and T
the number of cysts/oocysts spiked. The average percent
recovery and the SD of the recoveries for Cryptosporidium
and Giardia were also calculated.
Quality control of the method
In order to determine the inter-assay variation of the
method for the recovery of Cryptosporidium oocysts and
Giardia cysts, a spiking experiment was carried out every
15 field samples processed, as previously described. The
acceptance criterion for Cryptosporidium and Giardia
recoveries during routine use of the method was defined
as their initial mean recovery ±1Æ5 SD.
Meteorological data
Rainfall data recorded at representative weather stations
were utilized to study the extent to which heavy rains
influence the concentration of Cryptosporidium oocysts
and Giardia cysts in water for human consumption. The
obtained precipitation data were used to calculate weekly
sums and monthly arithmetic means.
Statistical analysis
Pearson’s correlation coefficient and nonparametric
Spearman’s rho were calculated to evaluate how physico-
chemical, microbiological and atmospheric parameters
are related with cysts/oocysts rates. Spearman’s rho test
was chosen because it is less sensitive to extreme values
than the standard Pearson’s correlation coefficient.
Chi-squared test was used to estimate possible significant
differences between the seasonal prevalence of Crypto-
sporidium and Giardia and rainfall. Values of P < 0Æ05
were considered statistically significant. All the analyses
were performed with the Statistical Package for Social
Sciences 12Æ0 for Windows (SPSS Inc., Chicago, IL, USA)
software.
Results
Precision of the method
The initial average percent recovery of the method
(n ¼ 12) was 16Æ7% (SD: 7Æ7) for Cryptosporidium
oocysts and 41Æ5% (SD: 10Æ6) for Giardia cysts. The
acceptable recovery intervals (accuracy) ranged from
5Æ2% to 28Æ2% for Cryptosporidium oocysts and from
25Æ5% to 57Æ5% for Giardia cysts. Inter-assay variation
during routine use of the method was investigated by
assaying a total of 18 independent spiking experiments
carried through out the course of the study (Fig. 1).
Only 3/18 (16Æ7%) of the Crypstosporidium and Giardia
seeded samples failed to fall inside the acceptable range
for (oo)cysts recovery.
Prevalence of Cryptosporidium and Giardia in water
samples
Over the course of the 30-month study period, a total of
284 water samples were analysed for the detection of
Cryptosporidium oocysts and Giardia cysts. Both protozoa
were frequently found in all water sources, except those
from CWTF (Table 1). Natural surface water from rivers
and reservoirs showed the highest rates of protozoa
occurrence, with concentrations that reached 1767
Cryptosporidium oocysts and >25 000 Giardia cysts per
100 l. CWTF achieved at least 3-log (99Æ9%) (oo)cyst
removal, and no protozoa were detected in the finished
water. However, SWTF only achieved 0Æ53 log10 Crypto-
sporidium oocysts and 1Æ62 log10 Giardia cysts removals,
Giardia and Cryptos. in surface waters D. Carmena et al.
622 Journal compilation ª 2006 The Society for Applied Microbiology, Journal of Applied Microbiology 102 (2007) 619–629
ª 2006 The Authors

respectively. In addition, differences in the parasitological
quality of the raw water were also noted, having the
samples from SWTF higher (oo)cysts concentrations than
the equivalent samples from the CWTF. Worryingly, an
important proportion of the SWTF finished water and
tap water samples analysed was found positive for the
presence of both Cryptosporidium and Giardia (ranging
from 26% to 31% and from 19% to 27%, respectively).
The detected concentrations were always <8 (oo)cysts per
100 l.
Physicochemical parameters
Physicochemical and microbiological data of the water
samples studied are shown in Table 2. Turbidity values
varied between 0Æ3 and 181 NTU, with river and reservoir
water samples recording the highest levels (mean: 15Æ3and 10Æ7 NTU, respectively). CWTF achieved an average
fivefold reduction of turbidity levels (mean: 0Æ4; SD: 0Æ2).
In contrast, a much lower performance of 2Æ7-fold reduc-
tion rate was accomplished by SWTF (mean: 3Æ1; SD:
9Æ4). In order to evaluate the efficiency of the disinfection
process, free chlorine levels were measured in finished
and tap water. The tested samples showed values ranging
from 0Æ1 to 1Æ08 mg ml)1 (mean: 0Æ31–0Æ40; SD: 0Æ22–
0Æ42).
Microbiological parameters
Occurrence of E. coli and total coliforms was determined
as these micro-organisms are traditional faecal indicators.
The presence of E. coli was detected in all the categories
of samples, except those from CWTF-treated water
(Table 2). As expected, the highest counts were obtained
in natural surface and raw water samples (means ranging
from 4Æ6 to >100 CFU 100 ml)1). Although absence
of E. coli was recorded in CWTF-finished water, low lev-
els of this indicator were frequently observed in SWTF-
treated water samples (mean: 17Æ0 CFU 100 ml)1; SD:
30Æ9). The presence of E. coli was also sporadically detec-
ted in tap water samples (mean: 0Æ04 CFU 100 ml)1; SD:
0Æ24). Total coliforms counts reveal the same pattern
obtained for E. coli., although with slightly higher rates.
Table 1 Descriptive statistics of the concentration of Cryptosporidium oocysts and Giardia cysts in the different water samples analysed
Rivers Reservoirs
Conventional
water
treatment
facilities
(CWTF) raw�
CWTF
treated�
Small water
treatment
facilities
(SWTF) raw� SWTF treated� Tap water§
Cryptosporidium Giardia Crypto. Giardia Crypto. Giardia Crypto. Giardia Crypto. Giardia Crypto. Giardia Crypto. Giardia
No. samples 52 52 36 36 26 26 31 31 31 31 26 26 82 82
% positive samples 63Æ5 92Æ3 33Æ3 55Æ5 15Æ4 26Æ9 0Æ0 0Æ0 22Æ6 45Æ2 30Æ8 19Æ2 26Æ8 26Æ8
Range (n 100 l)1) 0–1767 0->25 000 0–380 0–1320 0–276 0–50 0Æ0 0Æ0 0–1325 0–2997 0–184 0–25 0–61 0–62
Mean (n 100 l)1) 113Æ2 6522Æ8 17Æ6 63Æ3 17Æ2 4Æ6 0Æ0 0Æ0 26Æ4 53Æ9 7Æ8 1Æ3 2Æ3 2Æ0
SD 279Æ5 9452Æ7 31Æ7 110Æ8 26Æ7 5Æ0 0Æ0 0Æ0 58Æ2 94Æ8 13Æ6 2Æ2 3Æ6 2Æ7
�Conventional water treatment facilities that include coagulation, flocculation, sedimentation, filtration and disinfection processes.
�Small water treatment facilities that include rapid filtration and/or disinfection processes only.
§Tap water with chlorination treatment only.
Cryptosporidium
0
5
10
15
20
25
30
35
40
1
No. assay
Ooc
yst r
ecov
ery
(%)
Cys
t rec
over
y (%
)
Giardia
0
10
20
30
40
50
60
70
80
No. assay
1817 16 15 14 13 12 11 10 9 8 7 6 5 4 3 2
1 18171615141312111098765432
Figure 1 Inter-assay variation (n ¼ 18) for the detection of Cryptos-
poridium oocysts (mean: 11Æ1; SD: 6Æ8) and Giardia cysts (mean: 32Æ3;
SD ¼ 11Æ0) during routine use of the method.
D. Carmena et al. Giardia and Cryptos. in surface waters
ª 2006 The Authors
Journal compilation ª 2006 The Society for Applied Microbiology, Journal of Applied Microbiology 102 (2007) 619–629 623
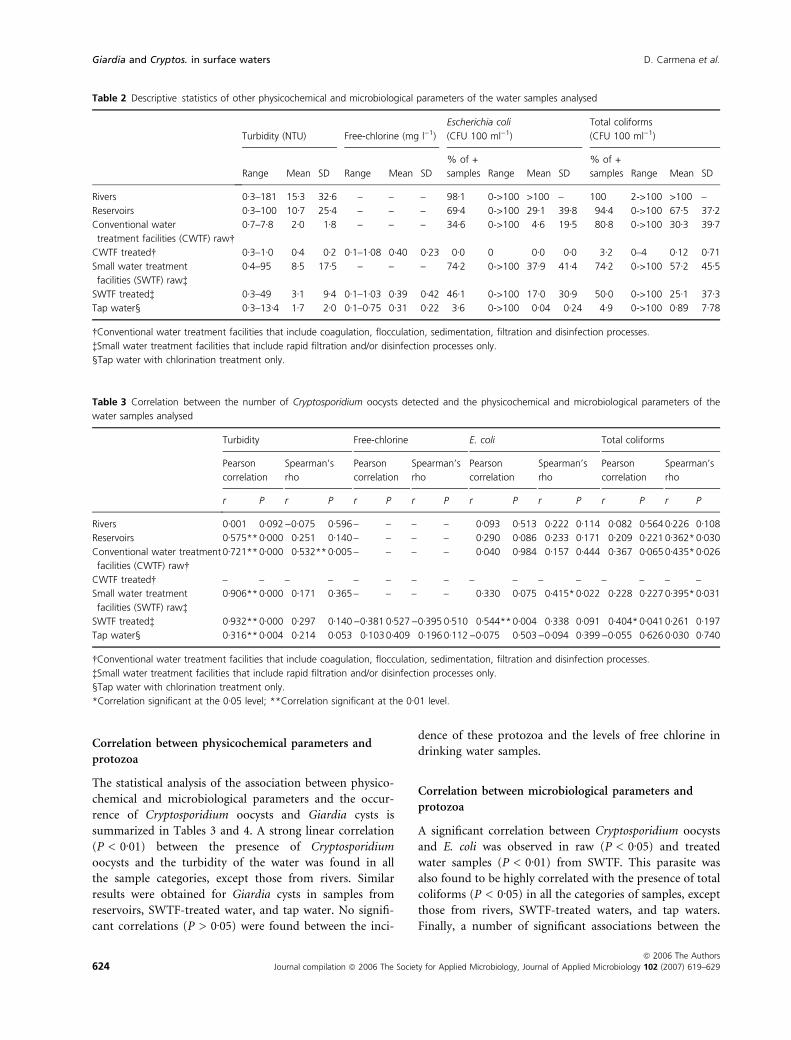
Correlation between physicochemical parameters and
protozoa
The statistical analysis of the association between physico-
chemical and microbiological parameters and the occur-
rence of Cryptosporidium oocysts and Giardia cysts is
summarized in Tables 3 and 4. A strong linear correlation
(P < 0Æ01) between the presence of Cryptosporidium
oocysts and the turbidity of the water was found in all
the sample categories, except those from rivers. Similar
results were obtained for Giardia cysts in samples from
reservoirs, SWTF-treated water, and tap water. No signifi-
cant correlations (P > 0Æ05) were found between the inci-
dence of these protozoa and the levels of free chlorine in
drinking water samples.
Correlation between microbiological parameters and
protozoa
A significant correlation between Cryptosporidium oocysts
and E. coli was observed in raw (P < 0Æ05) and treated
water samples (P < 0Æ01) from SWTF. This parasite was
also found to be highly correlated with the presence of total
coliforms (P < 0Æ05) in all the categories of samples, except
those from rivers, SWTF-treated waters, and tap waters.
Finally, a number of significant associations between the
Table 3 Correlation between the number of Cryptosporidium oocysts detected and the physicochemical and microbiological parameters of the
water samples analysed
Turbidity Free-chlorine E. coli Total coliforms
Pearson
correlation
Spearman’s
rho
Pearson
correlation
Spearman’s
rho
Pearson
correlation
Spearman’s
rho
Pearson
correlation
Spearman’s
rho
r P r P r P r P r P r P r P r P
Rivers 0Æ001 0Æ092)0Æ075 0Æ596 – – – – 0Æ093 0Æ513 0Æ222 0Æ114 0Æ082 0Æ564 0Æ226 0Æ108
Reservoirs 0Æ575** 0Æ000 0Æ251 0Æ140 – – – – 0Æ290 0Æ086 0Æ233 0Æ171 0Æ209 0Æ221 0Æ362* 0Æ030
Conventional water treatment
facilities (CWTF) raw�
0Æ721** 0Æ000 0Æ532** 0Æ005 – – – – 0Æ040 0Æ984 0Æ157 0Æ444 0Æ367 0Æ065 0Æ435* 0Æ026
CWTF treated� – – – – – – – – – – – – – – – –
Small water treatment
facilities (SWTF) raw�
0Æ906** 0Æ000 0Æ171 0Æ365 – – – – 0Æ330 0Æ075 0Æ415* 0Æ022 0Æ228 0Æ227 0Æ395* 0Æ031
SWTF treated� 0Æ932** 0Æ000 0Æ297 0Æ140)0Æ381 0Æ527 )0Æ395 0Æ510 0Æ544** 0Æ004 0Æ338 0Æ091 0Æ404* 0Æ041 0Æ261 0Æ197
Tap water§ 0Æ316** 0Æ004 0Æ214 0Æ053 0Æ103 0Æ409 0Æ196 0Æ112)0Æ075 0Æ503)0Æ094 0Æ399)0Æ055 0Æ626 0Æ030 0Æ740
�Conventional water treatment facilities that include coagulation, flocculation, sedimentation, filtration and disinfection processes.
�Small water treatment facilities that include rapid filtration and/or disinfection processes only.
§Tap water with chlorination treatment only.
*Correlation significant at the 0Æ05 level; **Correlation significant at the 0Æ01 level.
Table 2 Descriptive statistics of other physicochemical and microbiological parameters of the water samples analysed
Turbidity (NTU) Free-chlorine (mg l)1)
Escherichia coli
(CFU 100 ml)1)
Total coliforms
(CFU 100 ml)1)
Range Mean SD Range Mean SD
% of +
samples Range Mean SD
% of +
samples Range Mean SD
Rivers 0Æ3–181 15Æ3 32Æ6 – – – 98Æ1 0->100 >100 – 100 2->100 >100 –
Reservoirs 0Æ3–100 10Æ7 25Æ4 – – – 69Æ4 0->100 29Æ1 39Æ8 94Æ4 0->100 67Æ5 37Æ2
Conventional water
treatment facilities (CWTF) raw�
0Æ7–7Æ8 2Æ0 1Æ8 – – – 34Æ6 0->100 4Æ6 19Æ5 80Æ8 0->100 30Æ3 39Æ7
CWTF treated� 0Æ3–1Æ0 0Æ4 0Æ2 0Æ1–1Æ08 0Æ40 0Æ23 0Æ0 0 0Æ0 0Æ0 3Æ2 0–4 0Æ12 0Æ71
Small water treatment
facilities (SWTF) raw�
0Æ4–95 8Æ5 17Æ5 – – – 74Æ2 0->100 37Æ9 41Æ4 74Æ2 0->100 57Æ2 45Æ5
SWTF treated� 0Æ3–49 3Æ1 9Æ4 0Æ1–1Æ03 0Æ39 0Æ42 46Æ1 0->100 17Æ0 30Æ9 50Æ0 0->100 25Æ1 37Æ3
Tap water§ 0Æ3–13Æ4 1Æ7 2Æ0 0Æ1–0Æ75 0Æ31 0Æ22 3Æ6 0->100 0Æ04 0Æ24 4Æ9 0->100 0Æ89 7Æ78
�Conventional water treatment facilities that include coagulation, flocculation, sedimentation, filtration and disinfection processes.
�Small water treatment facilities that include rapid filtration and/or disinfection processes only.
§Tap water with chlorination treatment only.
Giardia and Cryptos. in surface waters D. Carmena et al.
624 Journal compilation ª 2006 The Society for Applied Microbiology, Journal of Applied Microbiology 102 (2007) 619–629
ª 2006 The Authors
occurrence of Giardia cysts and the E. coli/total coliform
counts were detected in samples from rivers, reservoirs,
CWTF raw water and SWTF-treated water.
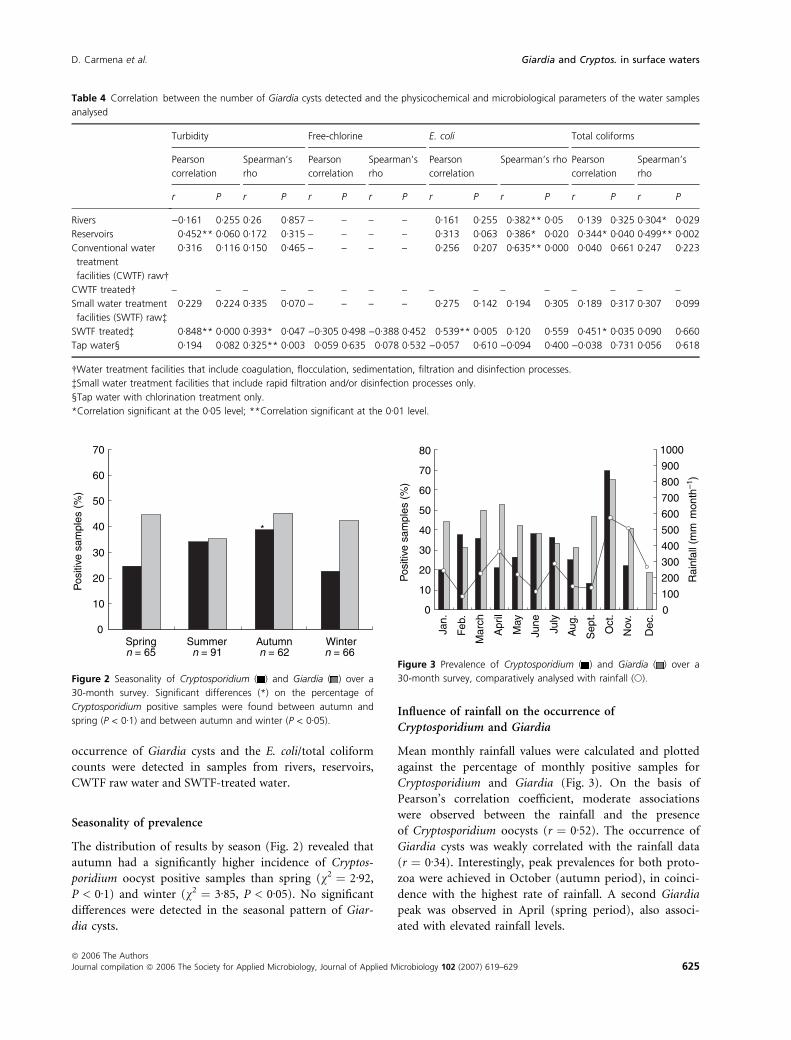
Seasonality of prevalence
The distribution of results by season (Fig. 2) revealed that
autumn had a significantly higher incidence of Cryptos-
poridium oocyst positive samples than spring (v2 ¼ 2Æ92,
P < 0Æ1) and winter (v2 ¼ 3Æ85, P < 0Æ05). No significant
differences were detected in the seasonal pattern of Giar-
dia cysts.
Influence of rainfall on the occurrence of
Cryptosporidium and Giardia
Mean monthly rainfall values were calculated and plotted
against the percentage of monthly positive samples for
Cryptosporidium and Giardia (Fig. 3). On the basis of
Pearson’s correlation coefficient, moderate associations
were observed between the rainfall and the presence
of Cryptosporidium oocysts (r ¼ 0Æ52). The occurrence of
Giardia cysts was weakly correlated with the rainfall data
(r ¼ 0Æ34). Interestingly, peak prevalences for both proto-
zoa were achieved in October (autumn period), in coinci-
dence with the highest rate of rainfall. A second Giardia
peak was observed in April (spring period), also associ-
ated with elevated rainfall levels.
0
10
20
30
40
50
60
70
Spring
Pos
itive
sam
ples
(%
)
*
n = 65 n = 91 n = 62 n = 66 WinterAutumnSummer
Figure 2 Seasonality of Cryptosporidium ( ) and Giardia ( ) over a
30-month survey. Significant differences (*) on the percentage of
Cryptosporidium positive samples were found between autumn and
spring (P < 0Æ1) and between autumn and winter (P < 0Æ05).
0
10
20
30
40
50
60
70
80Ja
n.
Feb
.
Mar
ch
Apr
il
May
June
July
Aug
.
Sep
t.
Oct
.
Nov
.
Dec
.
Pos
itive
sam
ples
(%
)
0
100
200
300
400
500
600
700
800
900
1000
Rai
nfal
l (m
m m
onth
–1)
Figure 3 Prevalence of Cryptosporidium ( ) and Giardia ( ) over a
30-month survey, comparatively analysed with rainfall (s).
Table 4 Correlation between the number of Giardia cysts detected and the physicochemical and microbiological parameters of the water samples
analysed
Turbidity Free-chlorine E. coli Total coliforms
Pearson
correlation
Spearman’s
rho
Pearson
correlation
Spearman’s
rho
Pearson
correlation
Spearman’s rho Pearson
correlation
Spearman’s
rho
r P r P r P r P r P r P r P r P
Rivers )0Æ161 0Æ255 0Æ26 0Æ857 – – – – 0Æ161 0Æ255 0Æ382** 0Æ05 0Æ139 0Æ325 0Æ304* 0Æ029
Reservoirs 0Æ452** 0Æ060 0Æ172 0Æ315 – – – – 0Æ313 0Æ063 0Æ386* 0Æ020 0Æ344* 0Æ040 0Æ499** 0Æ002
Conventional water
treatment
facilities (CWTF) raw�
0Æ316 0Æ116 0Æ150 0Æ465 – – – – 0Æ256 0Æ207 0Æ635** 0Æ000 0Æ040 0Æ661 0Æ247 0Æ223
CWTF treated� – – – – – – – – – – – – – – – –
Small water treatment
facilities (SWTF) raw�
0Æ229 0Æ224 0Æ335 0Æ070 – – – – 0Æ275 0Æ142 0Æ194 0Æ305 0Æ189 0Æ317 0Æ307 0Æ099
SWTF treated� 0Æ848** 0Æ000 0Æ393* 0Æ047 )0Æ305 0Æ498 )0Æ388 0Æ452 0Æ539** 0Æ005 0Æ120 0Æ559 0Æ451* 0Æ035 0Æ090 0Æ660
Tap water§ 0Æ194 0Æ082 0Æ325** 0Æ003 0Æ059 0Æ635 0Æ078 0Æ532 )0Æ057 0Æ610 )0Æ094 0Æ400 )0Æ038 0Æ731 0Æ056 0Æ618
�Water treatment facilities that include coagulation, flocculation, sedimentation, filtration and disinfection processes.
�Small water treatment facilities that include rapid filtration and/or disinfection processes only.
§Tap water with chlorination treatment only.
*Correlation significant at the 0Æ05 level; **Correlation significant at the 0Æ01 level.
D. Carmena et al. Giardia and Cryptos. in surface waters
ª 2006 The Authors
Journal compilation ª 2006 The Society for Applied Microbiology, Journal of Applied Microbiology 102 (2007) 619–629 625
Discussion
During the past 15 years, an increasing number of water-
borne outbreaks caused by Cryptosporidium and Giardia
have been documented worldwide (Lisle and Rose 1995;
Slifko et al. 2000; Craun et al. 2002; Fricker et al. 2002),
showing a trend in which protozoa and viruses are
replacing bacterial pathogens as agents of primary con-
cern in waterborne disease (Briancesco and Bonadonna
2005). Because of this situation, detection of Cryptospori-
dium oocysts and/or Giardia cysts in surface water,
especially in reservoirs for drinking water supply, is of
great public health importance. In order to provide safe
drinking water, drinking water systems must optimize five
key elements: source water protection, adequate treat-
ment, secure distribution, appropriate monitoring and
appropriate response to adverse monitoring results (Huck
and Coffey 2004).
In Spain, the prevalence of Cryptosporidium and
Giardia has been well documented in humans (Rodrı-
guez-Hernandez et al. 1996), livestock (Quilez et al.
1996; Castro-Hermida et al. 2002) and molluscs (Freire-
Santos et al. 2000; Gomez-Couso et al. 2004, 2005).
However, very few epidemiological surveys have been
conducted on the occurrence of these protozoa in sur-
face water for human consumption (Rodrıguez-Hernan-
dez et al. 1994; Montemayor et al. 2005) and no
significant waterborne outbreaks of cryptosporidiosis/
giardiasis have been reported. In addition, although the
European Community environmental legislation states
that water intended for human consumption should
not contain pathogenic organisms (Directive 98/83/CE),
in Spain there are no specific regulations relating to
Cryptosporidium and Giardia tolerable limits in drinking
water.
In the present study, the initial recovery results
(Cryptosporidium, 16Æ7%; Giardia, 41Æ5%) obtained during
the optimization of the analytical system were satisfactory,
meeting the acceptance criteria proposed by the method
1623 (U.S. Environmental Protection Agency 1999). Reli-
able values were also achieved in the inter-assay precision
tests, assuring the reproducibility of the method. These
facts demonstrate that the system performance is suitable
for analytical purposes.
Data obtained in this long-term survey show that
Cryptosporidium and Giardia (oo)cysts were consistently
detected in surface, raw and finished water samples from
the province of Alava (northern Spain), showing their
ubiquitous distribution. In most cases Giardia prevalence
was higher than that of Cryptosporidium, corroborating
the tendency observed in other countries (Horman et al.
2004; Rimhanen-Finne et al. 2004; Briancesco and Bona-
donna 2005).
Water treatment facilities play a key role in the process
to provide safe drinking water for human consumption.
Despite their small size, Cryptosporidium oocysts and Giar-
dia cysts can be effectively removed from water supplies
by conventional particle separation processes. However,
small number of these protozoa can be found in finished
water even in the absence of treatment problems (States
et al. 1997). In our study, CWTF achieved three orders of
magnitude removal for (oo)cysts, and no protozoa were
found in the treated water. These data are consistent with
those obtained in other investigations at pilot- and full-
scale conventional water treatment plants (reviewed by
Betancourt and Rose 2004). In addition, significant corre-
lations between water turbidity level and presence of Cryp-
tosporidium oocysts have been documented in previous
reports (Falabi et al. 2002; Hsu and Yeh 2003; Hsu 2003).
The observation that consistent removal rates of (oo)cysts
are achieved when the treatment facilities produce water
of consistently low turbidity (£0Æ3 NTU) has suggested
that turbidity is a useful in-plant measure of the degree of
(oo)cyst removal (Nieminsky et al. 1995; Hsu and Yeh
2003). In the present study, CWTF achieved fivefold tur-
bidity removals, with an average plant effluent turbidity of
0Æ4 NTU. We also found a strong association between
turbidity and presence of Cryptosporidium oocysts and
Giardia cysts in most of the categories of water analysed.
These findings strongly support the use of turbidity
removal as a reliable indicator of the effectiveness of
removal of (oo)cysts in water treatment plants. Finally, no
E. coli counts were detected in finished water from CWTF
and total coliforms were only detected in one sample at
very low concentration (mean: 0Æ12 CFU 100 ml)1). Over-
all, these results reveal that the CWTF system components
involved in the removal of water particles and disinfection
were intact and operating correctly, assuring the produc-
tion of safe drinking water.
With regard to SWTF, removals of 0Æ53 log10 for
Cryptosporidium oocysts and of 1Æ62 log10 for Giardia
cysts were obtained. However, both protozoa were found
in 30Æ8% and 19Æ2% of the finished water samples, respect-
ively (means: 7Æ8 oocysts/100 l, and 1Æ3 cysts/100 l). SWTF
also achieved 2Æ7-fold turbidity removal, producing an
average effluent turbidity of 3Æ1 NTU. As expected, these
data show that SWTF performance is inferior in compar-
ison with CWTF, demonstrating that water treatments
based on rapid filtration process and/or disinfection only
are clearly insufficient for removing protozoa and redu-
cing turbidity levels to acceptable limits. In addition, E.
coli and total coliforms counts were also found in finished
water from SWTF, indicating inadequacy of the disinfec-
tion procedures in some of the SWTF.
Escherichia coli and total coliforms are used as indicator
organisms worldwide for faecal contamination and
Giardia and Cryptos. in surface waters D. Carmena et al.
626 Journal compilation ª 2006 The Society for Applied Microbiology, Journal of Applied Microbiology 102 (2007) 619–629
ª 2006 The Authors
microbial water hygiene (Edberg et al. 2000). In this
investigation, counts of these micro-organisms ranging
between 4Æ6 and >100 CFU 100 ml)1 were found in an
elevated proportion of the surface water samples analysed.
It is important to take into consideration that the
Zadorra Reservoir system bears a considerable cattle
farming activity, with up to 7000 cows, 8500 pigs, 25000
sheep and 700 horses. This picture suggests that livestock
faecal products are probably the main source of environ-
mental and water contamination. Some reports have
investigated the possible association between the preval-
ence of Cryptosporidium and Giardia and the presence of
other micro-organisms, with unclear results (Payment
and Franco 1993; Horman et al. 2004; Rimhanen-Finne
et al. 2004; Briancesco and Bonadonna 2005). We found
a number of significant correlations between the presence
of Cryptosporidium and Giardia and samples being posit-
ive for E. coli and/or total coliforms. These findings
indicate that micro-organism counts may be used as
predictors for the presence of these protozoan parasites.
The analyses of the tap water samples from municipal-
ities with chlorination treatment only show relevant
data. The presence of E. coli and total coliforms
was sporadically recorded at very low levels (average
E. coli, 0Æ04 CFU 100 ml)1; average total coliforms,
0Æ89 CFU 100 ml)1), demonstrating an acceptable per-
formance of the disinfection treatment. However, Cryptos-
poridium and Giardia were detected in the 26Æ8% of the
samples, at average concentrations of 2–2Æ3 (oo)cysts/
100 l. These data indicate that some of the tap water sam-
ples analysed contained (oo)cysts at concentrations in the
range considered as ‘action level’ by Haas and Rose
(1995) and Wallis et al. (1996). Although the viability
and the genotype of the (oo)cysts have not been assessed
in this study, this situation represents a potential risk for
waterborne infection for an estimated 50 000 population
in the province of Alava.
This 30-month survey has also shown that Cryptos-
poridium and Giardia (oo)cysts are present in surface
water throughout the year, with the highest frequency of
occurrence during the autumn. A second peak for
Cryptosporidium was recorded during the summer,
whereas Giardia prevalence was more homogeneously dis-
tributed during the rest of the year. The seasonality of
these parasite protozoa has been investigated in few stud-
ies, with diverse results. High frequencies of samples pos-
itive for Cryptosporidium and Giardia in environmental
water have been linked to activities associated with agri-
cultural practices and cattle farming such as calving,
lambing and muck spreading (Kemp et al. 1995; Ong
et al. 1996; Casemore et al. 1997). Additionally, runoff
from precipitation has been proposed as a mechanism for
entry of these organisms into surface waters (Bodley-Tick-
ell et al. 2002) and previous studies have reported moder-
ate correlations between rainfall and the presence of
Cryptosporidium and Giardia (Atherholt et al. 1998; Thur-
man et al. 1998; Bodley-Tickell et al. 2002). However,
unclear seasonality or association with rainfall has been
found in some other investigations (Carrington and Mil-
ler 1993; Robertson and Gjerde 2001). In the present
study, we found a reasonable correlation (r ¼ 0Æ52)
between the rainfall and the presence of Cryptosporidium,
with oocysts peak concentration in October coinciding
with the annual highest rate of rainfall. A weak associ-
ation was found for Giardia (r ¼ 0Æ34), but again cysts
peak concentrations were reached in October with a sec-
ond lesser peak in April. These data suggest that monitor-
ing of Cryptosporidium and Giardia must be intensified
during autumn rainfall months, the period of highest pre-
valence of these protozoa in surface water.
To address this situation, the Department of Health of
the Basque Government, in co-ordination with the local
authorities, has initiated a number of actions directed to
assure the quality of the most vulnerable drinking water
supplies in the province of Alava. These include protec-
tion of watersheds susceptible to be contaminated by
human or domestic animal faecal waste, construction of
new compact water treatment water facilities and
improvement of the disinfection procedures by imple-
mentation of UV light irradiation-based systems where
the construction of compact water treatment facilities was
not feasible. In addition, the sensitivity of the detection
assay has been enhanced by adoption of the Envirochek
capsule filters (Pall Gelman Sciences, Ann Arbor, MI,
USA) for routine use, as recommended in the Method
1623 (U.S. Environmental Protection Agency 1999). In
our hands, these capsules achieved a preliminary initial
average percent recovery (n ¼ 4) of 33Æ4% (SD: 2Æ2) for
Cryptosporidium oocysts, and 48Æ2% (SD: 3Æ9) for Giardia
cysts (Carmena et al., unpubl. data).
Acknowledgements
The authors are grateful to Phil Hobson (MRC Clinical
Sciences Centre, Imperial College London) for his advice
with the English language editing. This work was finan-
cially supported by a grant from the Health Department
of the Basque Government, Spain. David Carmena was a
recipient of a fellowship from the Health Department of
the Basque Government, Spain.
References
Adam, R.D. (2001) Biology of Giardia lamblia. Clin Microbiol
Rev 14, 447–475.
D. Carmena et al. Giardia and Cryptos. in surface waters
ª 2006 The Authors
Journal compilation ª 2006 The Society for Applied Microbiology, Journal of Applied Microbiology 102 (2007) 619–629 627
Atherholt, T.B., LeChevallier, M.W., Norton, W.D. and Rosen,
J.S. (1998) Effect of rainfall on Giardia and Cryptospori-
dium. J Am Water Works Assoc 90, 66–80.
Betancourt, W.Q. and Rose, J.B. (2004) Drinking water treat-
ment processes for removal of Cryptosporidium and Giar-
dia. Vet Parasitol 126, 219–234.
Bodley-Tickell, A.T., Kitchen, S.E. and Sturdee, A.P. (2002)
Occurrence of Cryptosporidium in agricultural surface
waters during an annual farming cycle in lowland UK.
Wat Res 36, 1880–1886.
Briancesco, R. and Bonadonna, L. (2005) An Italian study
of Cryptosporidium and Giardia in wastewater, fresh water
and treated water. Environ Monit Asses 104, 445–457.
Carrington, E.G. and Miller, D.G. (1993) The occurrence and
origins of Cryptosporidium oocysts in source waters. Wat
Supply 11, 91–102.
Casemore, D.P., Wright, S.E. and Coop, R.L. (1997) Crypto-
sporidiosis – human and animal epidemiology. In Crypto-
sporidium and Cryptosporidiosis ed. Fayer, R. pp. 65–92.
Boca Raton: CRC.
Castro-Hermida, J.A., Gonzalez-Losada, Y.A. and Ares-Mazas,
E. (2002) Prevalence of and risk factors involved in the
spread of neonatal bovine cryptosporidiosis in Galicia
(NW Spain). Vet Parasitol 106, 1–10.
Craun, G.F., Nwachuku, N., Calderon, R.L. and Craun, M.F.
(2002) Outbreaks in drinking-water systems. J Environ
Health 65, 16–23.
Directive 98/83/CE (1998) Qualite des eaux destinees a la
consommation humaine. Journal Officiel de l’Union
Europeenne L330, 0032–0054.
Drinking Water Inspectorate. (2003) Drinking water for
England and Wales – Annual Report 2003. [Online].
http://www.dwi.gov.uk/pubs/annrep03/mainindex.shtm.
Accessed 27 June 2006.
DuPont, H.L., Chappell, C.L., Sterling, C.R., Okhuysen, P.C.,
Rose, J.B. and Jakubowski, W. (1995) The infectivity of
Cryptosporidium parvum in healthy volunteers. New Eng J
Med 332, 855–859.
Edberg, S.C., Rice, E.W., Karlin, R.J. and Allen, M.J. (2000)
Escherichia coli: the best biological drinking water indicator
for public health protection. Symp Ser Soc Appl Microbiol
29, 106S–116S.
Falabi, J.A., Gerba, C.P. and Karpiscak, M.M. (2002) Giardia
and Cryptosporidium removal from waste-water by a duck-
weed (Lemna gibba L.) covered pond. Lett Appl Microbiol
34, 384–387.
Freire-Santos, F., Oteiza-Lopez, A.M., Vergara-Castiblanco,
C.A., Ares-Mazas, E., Alvarez-Suarez, E. and Garcıa-Martın,
O. (2000) Detection of Cryptosporidium oocysts in bivalve
molluscs destined for human consumption.
J Parasitol 86, 853–854.
Fricker, C.R., Medema, G.D. and Smith, H.V. (2002) Proto-
zoan parasites (Cryptosporidium, Giardia, Cyclospora). In
Guidelines for Drinking-Water Quality. pp. 70–118. Geneva:
World Health Organization.
Gomez-Couso, H., Freire-Santos, F., Amar, C.F., Grant, K.A.,
Williamson, K., Ares-Mazas, M.E. and McLauchlin, J.
(2004) Detection of Cryptosporidium and Giardia in
molluscan shellfish by multiplexed nested-PCR. Int J Food
Microbiol 91, 279–288.
Gomez-Couso, H., Mendez-Hermida, F., Castro-Hermida, J.A.
and Ares-Mazas, E. (2005) Giardia in shellfish-farming
areas: detection in mussels, river water and waste waters.
Vet Parasitol 133, 13–18.
Haas, C.N. and Rose, J.B. (1995) Developing an action level
for Cryptosporidium. J Am Water Works Assoc 87, 81–84.
Health Canada. (2004) Guidelines for Canadian Drinking Water
Quality: Supporting Documentation – Protozoa: Giardia and
Cryptosporidium. Water Quality and Health Bureau,
Healthy Environments and Consumer Safety Branch.
Ottawa, Ontario: Health Canada.
Horman, A., Rimhanen-Finne, R., Maunula, L., von Bonsdorff,
C.H., Torvela, N., Heikinheimo, A. and Hanninen, M.L.
(2004) Campylobacter spp., Giardia spp., Cryptosporidium
spp., noroviruses, and indicator organisms in surface water
in southwestern Finland, 2000–2001. Appl Environ Micro-
biol 70, 87–95.
Hsu, B.-M. (2003) Evaluation of analyzing methods for Giar-
dia and Cryptosporidium in a Taiwan water treatment
plant. J Parasitol 89, 369–371.
Hsu, B.-M. and Yeh, H.-H. (2003) Removal of Giardia and
Cryptosporidium in drinking water treatment: a pilot-scale
study. Water Res 37, 1111–1117.
Huck, P.M. and Coffey, B.M. (2004) The importance of
robustness in drinking-water systems. J Toxicol Environ
Health A 67, 1581–1590.
Kemp, J.S., Wright, S.E. and Bukhari, Z. (1995) On farm
detection of Cryptosporidium parvum in cattle, calves and
environmental samples. In Protozoan Parasites and Water
ed. Betts, W.B., Casemore, D., Fricker, C., Smith, H. and
Watkins, J. pp. 154–157. Cambridge: Royal Society of
Chemistry Special Publication.
Lisle, J.T. and Rose, J.B. (1995) Cryptosporidium contamination
of water in the USA and UK: a mini review. J Water Sup-
ply Res Tech 44, 103–117.
Messner, M.J. and Wolpert, R.L. (2003) Cryptosporidium and
Giardia occurrence in ICR drinking water sources: statisti-
cal analysis of ICR data. In Information Collection Rule
Data Analysis ed. McGuire, M.C. pp. 463–481. Denver,
CO: AWWA Research Foundation and the American
Water Works Association.
Ministry of Health of New Zealand (2005) Annual Review of
Drinking Water Quality in New Zealand 2003. [Online].
http://www.moh.govt.nz/water. Accessed 27 June 2006.
Montemayor, M., Valero, F., Cofre, J. and Lucena, F. (2005)
Occurrence of Cryptosporidium spp. oocysts in raw and
treated sewage and river water in north-eastern Spain.
J Appl Microbiol 99, 1455–1462.
Nieminski, E.C., Schaefer, F.W. and Ongerth, J.E. (1995) Com-
parison of two methods for detection of Giardia cysts and
Giardia and Cryptos. in surface waters D. Carmena et al.
628 Journal compilation ª 2006 The Society for Applied Microbiology, Journal of Applied Microbiology 102 (2007) 619–629
ª 2006 The Authors
Cryptosporidium oocysts in water. Appl Environ Microbiol
61, 1714–1719.
Ong, C., Moorehead, W., Ross, A. and Isaac-Renton, J. (1996)
Studies of Giardia spp. and Cryptosporidium spp. in two
adjacent watersheds. Appl Environ Microbiol 62, 2798–2805.
Payment, P. and Franco, E. (1993) Clostridium perfringens and
somatic coliphages as indicators of the efficiency of drink-
ing water treatment for viruses and protozoan cysts. Appl
Environ Microbiol 59, 2418–2424.
Quilez, J., Sanchez-Acedo, C., del Cacho, E., Clavel, A. and
Causape, A.C. (1996) Prevalence of Cryptosporidium and
Giardia infections in cattle in Aragon (northeastern Spain).
Vet Parasitol 66, 139–146.
Rimhanen-Finne, R., Vuorinen, A., Marmo, S., Malmberg, S.
and Hanninen, M.-L. (2004) Comparative analysis of Cryp-
tosporidium, Giardia and indicator bacteria during sewage
sludge hygienization. Lett Appl Microbiol 38, 301–305.
Robertson, L.J. and Gjerde, B. (2001) Occurrence of Cryptos-
poridium oocysts and Giardia cysts in raw waters in Nor-
way. Scand J Public Health 29, 200–207.
Rodrıguez-Hernandez, J, Canut-Blasco, A., Ledesma-Garcıa, M.
and Martın-Sanchez, A.M. (1994) Cryptosporidium oocysts
in water for human consumption. Comparison of staining
methods. Eur J Epidemiol 10, 215–218.
Rodrıguez-Hernandez, J., Canut-Blasco, A. and Martın-Sanchez,
A.M. (1996) Seasonal prevalences of Cryptosporidium and
Giardia infections in children attending day care centres
in Salamanca (Spain) studied for a period of 15 months.
Eur J Epidemiol 12, 291–295.
Slifko, T.R., Smith, H.V. and Rose, J.B. (2000) Emerging para-
site zoonoses associated with water and food. Int J Parasi-
tol 30, 1379–1393.
Smith, H.V., Robertson, L.J. and Ongerth, J.E. (1995) Crypto-
sporidiosis and giardiasis: the impact of waterborne trans-
mission. J Wat Supply Res T 44, 258–274.
States, S.M., Stadterman, K., Ammon, L., Vogel, P., Baldizar,
J., Wright, D., Conley, L. and Sykora, J. (1997) Protozoa
in river water: sources, occurrence, and treatment.
J AWWA 89, 74–83.
Thurman, R., Faulkner, B., Veal, D., Cramer, G. and Meikle-
john, M. (1998) Water quality in rural Australia. J Appl
Microbiol 84, 619–626.
U.S. Environmental Protection Agency. (1995) ICR Protozoan
Method for Detecting Giardia Cysts and Cryptosporidium
Oocysts in Water by a Fluorescent Antibody Procedure.
Office of Ground Water and Drinking Water.
EPA-814-B-95–003 Cincinnati, OH: U.S. Environmental
Protection Agency.
U.S. Environmental Protection Agency. (1999) Method 1623:
Cryptosporidium and Giardia in Water by Filtration/IMS/
FA. Office of Water. EPA-821-R-99–006 Cincinnati, OH:
U.S. Environmental Protection Agency.
U.S. Environmental Protection Agency. (2002) National
primary drinking water regulations: long term 1
enhanced surface water treatment rule; Final Rule. Fed Reg
67, 1812.
Wallis, P.M., Erlandsen, S.L., Isaac-Renton, J.L., Olson, M.E.,
Robertson, W.L. and van Keulen, H. (1996) Prevalence of
Giardia cysts and Cryptosporidium oocysts and characteri-
zation of Giardia spp. isolated from drinking water in
Canada. Appl Environ Microbiol 62, 2789–2797.
D. Carmena et al. Giardia and Cryptos. in surface waters
ª 2006 The Authors
Journal compilation ª 2006 The Society for Applied Microbiology, Journal of Applied Microbiology 102 (2007) 619–629 629
Related Documents


![Prevalence of Cryptosporidium and Giardia lamblia in Water ...cyst of Cryptosporidium and Giardia lamblia as described earlier [16,17]. Oocysts in the specimens are usually difficult](https://static.cupdf.com/doc/110x72/6035961b3d575467871f6698/prevalence-of-cryptosporidium-and-giardia-lamblia-in-water-cyst-of-cryptosporidium.jpg)


