www.Dcouncil.orq FEBRUARY 2003 PRESEASON REPORT I STOCK ABUNDANCE ANALYSIS FOR 2003 OCEAN SALMON FISHERIES PREPARED BY THE SALMON TECHNICAL TEAM Pacific Fishery Management Council 7700 NE Ambassador Place, Suite 200 Portland, Oregon 97220-l 384 (503) 820-2280

Welcome message from author
This document is posted to help you gain knowledge. Please leave a comment to let me know what you think about it! Share it to your friends and learn new things together.
Transcript

www.Dcouncil.orq
FEBRUARY 2003
PRESEASON REPORT ISTOCK ABUNDANCE ANALYSIS FOR 2003
OCEAN SALMON FISHERIES
PREPARED BY THE
SALMON TECHNICAL TEAM
Pacific Fishery Management Council7700 NE Ambassador Place, Suite 200
Portland, Oregon 97220-l 384(503) 820-2280

NA03NMF4410067.Atmospheric Administration Award Number
HeydenMs. Donde Hayes
This document is published by the Pacific Fishery Management Councilpursuant to National Oceanic and
AdenMs. Renee
I Stock Abundance Analysis for2003 Ocean Salmon Fisheries. (Document prepared for the Council and its advisoryentities.) Pacific Fishery Management Council, 7700 NE Ambassador Place, Suite 200,Portland, Oregon 97220-l 384.
COUNCIL STAFF
Mr. Chuck TracyMs. Kerry
Mercer Island, Washington
Mr. Curt MelcherOregon Department of Fish and Game, Clackamas, Oregon
Mr. Henry YuenU.S. Fish and Wildlife Service
The Salmon Technical Team and the Council staff express their thanks for the expert assistanceprovided by Ms. Wendy Beeghley, WDFW; Mr. Craig Foster, ODFW; Ms. Melodie Palmer-Zwahlen,CDFG; and numerous other agency and tribal personnel in completing this report.
This document may be cited in the following manner:
Pacific Fishery Management Council. Preseason Report
A CKNOWLEDGMENTS
SALMON TECHNICAL TEAM
Mr. Dell Simmons, ChairNational Marine Fisheries Service, Lacy, Washington
Mr. Allen Grover, Vice ChairCalifornia Department of Fish and Game, Healdsburg, California
Dr. Robert KopeNational Marine Fisheries Service, Seattle Washington
Mr. Doug MilwardWashington Department of Fish and Wildlife, Olympia, Washington
Mr. Michael MohrNational Marine Fisheries Service, Santa Cruz, California
Dr. Gary MorishimaIndian Tribes,

II-22........II-22
Evaluation of 2002 Regulations on 2003 Stock Abundance North of Cape Falcon.................................................
II-22Summer/Fall Chinook
II-22Spring Chinook ......................................................
........................................................II-1 92003StockStatus .......................................................
..ll-19Puget Sound Chinook
.................................. II-1 92003StockStatus .....................................................
.................................................. II-1 9Predictor Description and Past Performance
II-1 9Washington Coastal Chinook
.........................ll-16
Evaluation of 2002 Regulations on 2003 Stock Abundance
.................................. II-1 62003StockStatus .....................................................
II-1 6Predictor Description and Past Performance
....................................................................................... II-1 6
Columbia River Fall Chinook
.......................... II-1 4CHINOOK STOCKS NORTH OF CAPE FALCON
OtherStocks ...................................................... ..ll-14Evaluation of 2002 Regulations on 2003 Stock Abundance
.............................................. II-1 4II-1 4
Rogue River Fall Chinook............................
.................................. II-1 4Umpqua River and Rogue River Spring Chinook
II-1 4Predictor Description and 2003 Stock Status
...................................................ll-13
South/Local Migrating Chinook
NorthOregonCoast...................................................ll-l 3Mid-OregonCoast ..................................................
.................................. II-1 3......................................................II-1 3
Predictor Description and 2003 Stock Status
II-1 3North Migrating Chinook
............................................................................ II-1 3
OREGON COASTAL CHINOOK STOCKS
II-5OTHER CALIFORNIA COASTAL CHINOOK STOCKS
...........................ll- 5
Evaluation of 2002 Regulations on 2003 Stock Abundance..........................................................
II-52003StockStatus..
........................................................II-5
Predictor Performance.........................................................
II-5Predictor Description
.................................................II-5
KLAMATH RIVER FALL CHINOOK...........................
........................................................II-12003StockStatus.. .......................................................... II-1Evaluation of 2002 Regulations on 2003 Stock Abundance
II-1Predictor Performance
.............................................................................................. II-1
Predictor Description
II-1SACRAMENTO RIVER FALL CHINOOK SALMON
........................................
.....................................................l-l
CHAPTER II CHINOOK SALMON ASSESSMENT.
........................ l-lABUNDANCE PROJECTIONS
I ABUNDANCE PROJECTIONS AND NEW INFORMATION
v
INTRODUCTION .................................................................... 1
CHAPTER
.............................................
LISTOFTABLES.. .................................................................. iii
LIST OF ACRONYMS AND ABBREVIATIONS
LISTOFFIGURES ................................................................... iii
TABLE OF CONTENTS

C-i...........................B-i
APPENDIX C SALMON HARVEST ALLOCATION SCHEDULES
...................................
...................................... Ill-l 7
CHAPTER IV FRASER RIVER AND PUGET SOUND PINK SALMON ASSESSMENTS .......... IV-l
APPENDIX A SUMMARY OF COUNCIL STOCK MANAGEMENT GOALS .................... A-i
APPENDIX B OREGON PRODUCTION INDEX DATA.
................................................ Ill-l 2North of the Oregon Production Index Area
........................................ Ill-12EVALUATION OF 2002 REGULATIONS ON 2003 STOCK ABUNDANCE ................ Ill-l 2
Oregon Production Index Area
HoodCanal ............................................................ Ill-12SELECTIVE FISHERY CONSIDERATIONS
SouthSound ........................................................... Ill-12
................................................... Ill-l 1Nooksack-Samish ...................................................... Ill-11Skagit ................................................................ Ill-11Stillaguamish .......................................................... Ill-12Snohomish ............................................................ Ill-12
PugetSound .............................................................. Ill-11Strait of Juan de Fuca
............................. Ill-l 1........................................................Ill-l 0
North Washington Coast Independent Tributaries
HohRiver ............................................................. Ill-10Quillayute River
QueetsRiver ........................................................... Ill-10QuinaultRiver .......................................................... Ill-10
...........................................................Ill-9WillapaBay ............................................................ Ill-9Grays Harbor
.................................................... Ill-9...........................................................Ill-9
Washington Coastal Coho
...................................... Ill-92003 Stock Status
....................... Ill-9Predictor Description and Past Performance
....................... Ill-9WASHINGTON COASTAL AND PUGET SOUND COHO STOCKS
....................................................Ill-92003StockStatus ....................................................... Ill-9
Oregon Production Index Area Summary of 2003 Stock Status
.....................................................Ill-5Predictor Performance
......................... Ill-5Predictor Description
.......................................................Ill-5Salmon Trout Enhancement Hatchery Coho Smolt Program
....................................................Ill-52003StockStatus ....................................................... Ill-5
Private Hatchery Coho
.......................................... Ill-5Predictor Performance
.......................................... Ill-4Oregon Coastal Natural Lakes
.....................................................Ill-4Oregon Coastal Natural Rivers
................................................. Ill-4Predictor Description
....................................................Ill-42003StockStatus ....................................................... Ill-4
Oregon Coastal Natural Coho
.....................................................Ill-lPredictor Performance
........................................................Ill-lPredictor Description
...................... Ill-lPublic Hatchery Coho
......................................... Ill-lCOLUMBIA RIVER AND OREGON/CALIFORNIA COASTAL COHO
CHAPTER III COHO SALMON ASSESSMENTS

. Ill-7.
. Ill-6.
. Ill-2.
III.. .
.. . . . . . . . . . . . . . . . . . . . . . . . . coho stocks
.
Preseason and postseason estimates of ocean escapements for selectedWashington coastal adult natural
. . . . . . . . . . . . . . . . . . . . . . . . . coho harvest impacts, spawning, abundance, and
exploitation rate estimates by SRS accounting
.
Oregon production index
. . . . . . . . . . . . . ‘. . . . . . . . . . . . . . . . . . . . . . , . coho stock SRS abundance
estimates for OPI area stocks
. II-20
Preliminary 1996-2003 preseason and postseason
. . . . . . . . . . . . . . . . . . . . . . . . . . . . . . . . . . . . . . . . . . . . . .
II-17
Comparison of preseason and postseason forecasts of Puget Sound run sizefor summer/fall chinook
. . . . . . . . . .
. II-1 5
Predicted and postseason returns of Columbia River adult fall chinook
. . . . . . . . . . . . . inriver run and ocean population indices
. II-1 0
Rogue River fall chinook
. . .
II-9
Harvest levels and rates of age-three and age-four Klamath River fall chinook
. . . . . . . . . . . . . . . . . . . . . . . . . . . . . . . . . . . . . . . . . . . . . . . . . . . . . .
II-7
Summary of management objectives and predictor performance for KlamathRiver fall chinook
. . . . . . . . . . . . . . . . . . . . . . . . . . . . . . .
II-4
Klamath River fall chinook ocean abundance, harvest rate, and river run sizeestimatesbyage . . . . . . . . . . . . . . . . . . . . . . . . . . . . . . . . . . . . . . . . . . . . . . . . . . . ...11-6
Comparisons of preseason forecast and postseason estimates for oceanabundance of adult Klamath River fall chinook
. . . . . . . .
II-2
Comparisons of preseason forecast and postseason estimates for the CVI
. . . . . . . . . . . . . . . . . . . . . . . . . . . . . . . . . . . . . . . . . . . . . . . . . .
Amendment14........................................................ l-6
Indices of annual abundance and ocean fishery impacts on CaliforniaCentral Valley chinook
. l-4
Achievement of conservation objectives for natural stocks listed in Table 3-l of
. . . . . coho salmon stock ocean abundance forecasts.
. l-2
Preliminary preseason adult
. . . . . . . . . . . . . . . . . .
II-12
LIST OF TABLES
Preliminary preseason adult chinook salmon stock forecasts
. . . . . . . . . . . . . . . .
II-3
Regression estimators for Klamath River fall chinook ocean abundance(September 1) based on that year’s river return of same cohort
. . . . . . . . . . . . . . . .
II-3
Spawning escapements of adult Sacramento River fall chinook, 1970-2002,and the goal range for the stock of 122,000 to 180,000 adult fish
. . . . . . . . . . . . . . . . . . . . . . . . . . . . . . . . .
111-3.
Regression estimator for CVI based on previous year’s river return ofage-two Central Valley chinook 1990-2002
111-2.
Table
11-9.
Table Ill-l.
Table
11-8.
Table
11-7.
Table
11-6.
Table
11-5.
Table
11-4.
Table
11-3.
Table
11-2.
Table
11-3.
Table I-1.
Table l-2.
Table l-3.
Table 11-l.
Table
11-2.
Figure
LIST OF FIGURES
Figure 11-l.
Figure

. IV-l
iv
. . . . . .
. Ill-l 6
Table IV-l. Estimated annual run sizes for Fraser River and Puget Sound pink salmon
. . . . . . . . . . . . . . . . . . . . . . . .
coho under Amendment 13matrix and the OCN work group matrix based on parent escapement levelsby stock component and marine survival category.
111-8. Maximum Allowable fishery impact rate for OCN
. Ill-l 5
Table
. . . . . . . . . . .
coho harvestmortality and exploitation rates by fishery under Council-adopted 2002regulations and preliminary 2003 preseason abundance estimates
Rogue/Klamath 111-7. Comparison of Oregon coastal natural and
. Ill-l 4
Table
. . . . . . . . . . . . . . . . . . . . . . . . . . . . . . . . . . . . . . . . . . . . . coho stocks based on preliminary 2003 preseason abundance forecasts and2002 Council regulations
111-6. Estimated ocean escapements for critical natural and Columbia River hatchery
. Ill-13
Table
. . . . . . . . . coho available to 2003 Council fisheries 111-5. Mass marking of 2000 brood
. Ill-8
Table
. . . . . . . . . . . . . . . . . . . . . . . . . . . . . . . . . . . coho stocks 111-4. Preseason and postseason estimates of ocean escapements for selected
Puget Sound adult natural
LIST OF TABLES(continued)
Table

McNary Dam and the Deschutes River, Oregon)U.S. Fish and Wildlife Servicevisual stock identificationWest Coast Vancouver IslandWashington Department of Fish and Wildlife
V
(tule fall chinook returning to Spring Creek Hatchery)Stratified random samplingScientific and Statistical CommitteeSalmon Trout Enhancement Program (Oregon)Salmon Technical Teamtotal allowable catchupper river brights (naturally spawning bright fall chinook returning to areas upstream from
coho)Pacific Salmon CommissionSelect Area brights (hatchery fall chinook originally from Rogue River stock that is currentlypropagated in lower Columbia River hatcheries for release in Youngs Bay)Spring Creek Hatchery
coho)Oregon Production Index Technical TeamOregon coastal private hatchery (adult
(coho salmon stock index south of Leadbetter Point)Oregon production index area hatchery (adult
mainstem Columbia downstream from Bonneville Dam)lower Columbia River hatchery (tule fall chinook returning to hatcheries below BonnevilleDam)lower Columbia River wild (native bright fall chinook spawning naturally in tributaries belowBonneville Dam)mid-Columbia River brights (bright hatchery fall chinook released in the mid-ColumbiaRiver)mid-Oregon Coastmaximum sustainable yieldnot availableNational Marine Fisheries ServiceNorth Oregon CoastOregon coastal natural (coho)Oregon coastal natural (coho) lake componentOregon coastal natural (coho) river componentOregon Department of Fish and WildlifeOregon production index
(coho ocean recruits)Endangered Species Actfishery management planFishery Regulation Assessment Modelgenetic stock identificationHarvest Rate ModelKlamath management zone (ocean zone between Humbug Mountain and Horse Mountainwhere management emphasis is on Klamath River fall chinook)Klamath Ocean Harvest ModelKlamath River Technical Advisory Teamlower Columbia River brights (bright fall chinook of upriver origin spawning naturally in the
WCVIWDFW
California Department of Fish and GamePacific Fishery Management CouncilColumbia River Technical Advisory CommitteeCentral Valley indexcoded-wire tagDecember age-two
VSI
PSCSAB
SCHSRSsscSTEPSTTTACURB
USFWS
PRIHOPITTOPIHOPI
CVICWTDA2ESAFMPFRAMGSIHRMKMZ
KOHMKRTATLRB
LRH
LRW
MCB
MOCMSYNANMFSNOCOCNOCNLOCNRODFW
LIST OF ACRONYMS AND ABBREVIATIONS
CDFGCouncilCRTAC

coho stocks,differences in assessment methodologies (postseason estimates are based on run reconstructionassumptions which differ substantially from those represented in the Fishery Regulatory Assessment Model[FRAM]).
coho; Appendix C contains the Council’s current harvest allocation schedules.
The STT notes that differences between preseason and postseason estimates are caused by a number offactors, including, (1) inaccuracies in abundance forecasts for these and other stocks which are exploited inmixed stock fisheries, (2) deviations of actual catches and fishery patterns from preseason expectations,(3) anomalies in stock distribution and migration patterns, and (4) for the Puget Sound
coho salmon, respectively. Chapter IV summarizes abundanceinformation for pink salmon. Three appendices provide supplementary information as follows: Appendix Aprovides a summary of Council stock management goals; Appendix B contains pertinent data for Oregonproduction index (OPI) area
coho stocks that have been important in determining Council fisheries in recent years and on stocks listedunder the Endangered Species Act (ESA) with established jeopardy standards.
Chapter I provides a summary of stock abundance projections. Chapters II and III provide detailedstock-by-stock analyses of abundance and a description of prediction methodology and accuracy of pastabundance predictions for chinook and
INTRODUCTION
This is the second report in an annual series of four reports prepared by the Salmon Technical Team (STT)of the Pacific Fishery Management Council (Council) to document and help guide salmon fishery managementoff the coasts of Washington, Oregon, and California. This report will be formally reviewed at the Council’sMarch meeting. The third and fourth reports in this series will be developed at the close of the March and AprilCouncil meetings, respectively. They will analyze the impacts of the Council’s proposed and final oceansalmon fishery management recommendationsfor2003. An environmental assessment will also be preparedto assist the Council and U.S. Secretary of Commerce in the decision process.
This report provides year 2003 salmon stock abundance projections and an analysis of the impacts of 2002regulations, or regulatory procedures, on the projected 2003 abundance. The report focuses on chinook and

coho.
l-l
coho salmon stocks in Tables l-l andl-2, respectively. Information on pink salmon abundance, which is only significant in odd-numbered years,is contained in Chapter IV. Overall Council salmon management goals, as developed for Amendment 14, arepresented in Table l-3 and Appendix A, Table A-l.
In addition to the key stocks with abundance projections listed in Tables I-1 and l-2, Council managementdecisions for the 2003 ocean salmon fishing seasons may be constrained by other stocks listed under theESA which may not have abundance projections made, or do not have abundance projections available intime for inclusion in this report. These include Sacramento River winter, Central Valley spring, Californiacoastal, lower Columbia River, and Snake River fall chinook; and central California and southernOregon/northern California
1.ABUNDANCE PROJECTIONS
ABUNDANCE PROJECTIONS
Abundance expectations in 2003 are summarized for key chinook and
CHAPTER

Glenwood spring release.Nooksack/Samish fall
chinook multiplied by 1998
Available ____________________ ____
45.8 52.8 34.9 19.0 27.0 28.0 34.0 27.0
1.6 1.6 1.6 5.0 2.3 0.5 1.2 1.7
24.6 36.2 67.8 37.2
46.0 32.8 27.4 38.7
4.3 3.9 3.8 3.3
2.1 1.5 1.4 1.9
0.3 0.5 0.7 0.6
1.5 0.9 2.4 1.9
16.5 17.3 16.7 16.8
147.5 150.8 166.4 88.9
65.8 14.2 21.9 27.6
2.6 8.1 7.5 8.8
34.8 19.2 54.2 37.7
38.3 47.8 72.1 40.8
Linear regression analysis of river age-2 jacks on CVI of thefollowing year. CDFG.
Linear regression analysis of age-specific ocean abundanceestimates on river runs of same cohort. KRTAT.
Age-specific linear regressions of cohort returns in previousrun years. WDFW staff.
Age-specific linear regressions of cohort returns in previousrun years. ODFW staff.
Recent year average. ODFW staff.
Age-specific linear regressions of cohort returns in previousrun years. WDFW staff.
Age-specific linear regressions of cohort returns in previousrun years. WDFW staff.
Age-specific linear regressions of cohort returns in previousrun years. WDFW staff.
Age-specific average cohort ratios/cohort regressions.Columbia River TAC.
Age-specific average cohort ratios/cohort regressions.Columbia River TAC.
Age-specific average cohort ratios/cohort regressions.Columbia River TAC.
Age-specific average cohort ratios/cohort regressions.Columbia River TAC.
Age-specific average cohort ratios/cohort regressions.Columbia River TAC.
Age-specific average cohort ratios/cohort regressions.Columbia River TAC.
Mean return per release by age class. WDFW staff.WDFW and tribes.
WDFW and tribes.
Brood release times average return-at-age/release.
1991-2000 average return rate of
Not _________ __________________
-14.2 18.8 17.8 18.9 15.5 64.5 49.0 34.6
- -
NooksackISamish Hatchery
East Sound Bay Hatchery
2.4 3.7 4.3 4.2 4.2
a/
ZLewis Spring
Upriver Summer
3.1 2.0 2.8 2.6
87.6 77.7 24.5
URB Fall 280.4 281.0 127.2
33.3
171.1
SCH Fall 96.9 144.4 56.6 21.9
LRW Fall 24.6 18.7 16.7 3.5
LRH Fall 115.9 137.6 32.2 23.7
MCB Fall 104.8 96.2 43.5 50.6
Washington Coast (Ocean Escapement)
Willapa Bay NaturalHatchery
Other Coastal Stocks
Puget Sound
1,051.O 849.0 533.0
310.2 362.5 435.4 389.8 165.5 225.2 286.3 749.4
-------------- Preseason Estimates Not Made ---------- None.
145.4 333.7 364.6 134.0
Willamette Spring 109.8 73.8 61 .O 59.9
Sandy Spring 4.8 4.3 4.0 3.8
Cowlitz Spring 4.9 3.1 1.0 2.0
Kalama Spring 3.6 1.6 1.0 1.4
1,108.l 825.4 649.4 790.4 847.7
TABLE I-1. Preliminary preseason adult chinook salmon stock forecasts in thousands of fish. (Page 1 of 2)
Production Area, Preseason Estimates of AdultsType of Prediction and/orStock or Stock Groupinq 2003 2002 2001 2000 1999 1998 1997 1996
Methodology for 2003Prediction and Source
California Central Valley (Index)Sacramento and San Joaquin Basins,Fall, Late Fall, Spring, and Winter Run
Klamath River (Ocean Abundance)Fall Run
Oregon CoastNorth and South/Local Migrating
Columbia River (Ocean Escapement)Upriver Spring
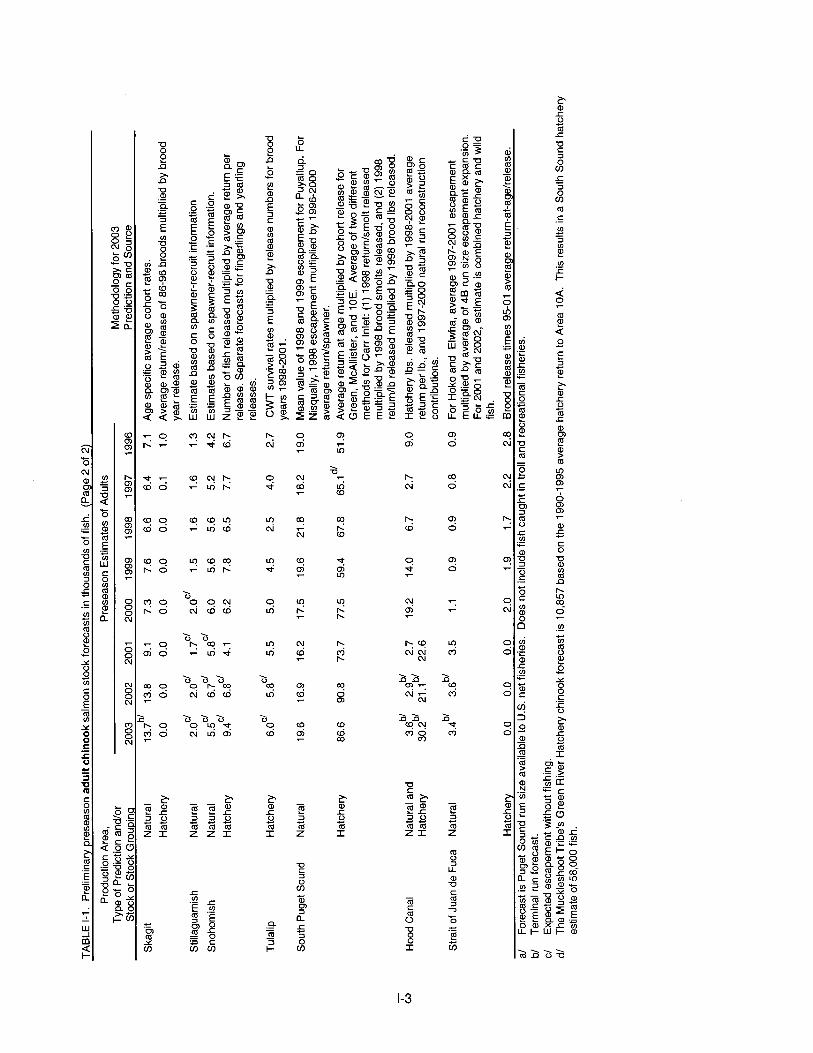
dl The Muckleshoot Tribe’s Green River Hatchery chinook forecast is 10,857 based on the 1990-l 995 average hatchery return to Area 1 OA. This results in a South Sound hatcheryestimate of 58.000 fish.
c/ Expected escapement without fishing.forecast.b/ Terminal run
return/smelt releasedmultiplied by 1998 brood smolts released, and (2) 1998return/lb released multiplied by 1998 brood Ibs released.
Hatchery Ibs. released multiplied by 1998-2001 averagereturn per lb., and 1997-2000 natural run reconstructioncontributions.
3.5
0.0
59.4
14.0
0.9
1.9
0.9
1.7
0.8
19.0
51.9
9.0
0.9 For Hoko and Elwha, average 1997-2001 escapementmultiplied by average of 4B run size escapement expansion.For 2001 and 2002, estimate is combined hatchery and wildfish.
Hatchery 0.0 0.0 2.2 2.8 Brood release times 95-01 average return-at-age/release.a/ Forecast is Puaet Sound run size available to U.S. net fisheries. Does not include fish caught in troll and recreational fisheries.
10E. Average of two differentmethods for Carr Inlet: (1) 1998
65.1d’
2.722.6
6.7 2.7
Mean value of 1998 and 1999 escapement for Puyallup. ForNisqually, 1998 escapement multiplied by 1996-2000average return/spawner.Average return at age multiplied by cohort release forGreen, McAllister, and
3.6b’
7.6 6.6 6.4 7.1
0.0 0.0 0.1 1.0
Age specific average cohort rates.Average return/release of 86-96 broods multiplied by broodyear release.
1.5 1.6 1.6 1.3
5.6 5.6 5.2 4.2
7.8 6.5 7.7 6.7
Estimate based on spawner-recruit information
Estimates based on spawner-recruit information.Number of fish released multiplied by average return perrelease. Separate forecasts for fingerlings and yearlingreleases.
5.0
17.5
77.5
19.2
1.1
2.0
4.5 2.5 4.0 2.7 CWT survival rates multiplied by release numbers for broodyears 1998-2001.
19.6 21.8 18.2
67.8
,$Z
3.4bl
,$
5.8” 5.5
South Puget Sound Natural 19.6 16.9 16.2
Hatchery 86.6 90.8 73.7
Hood Canal Natural andHatchery
Strait of Juan de Fuca Natural
6.0”
6.ac’ 4.1 6.2
Tulalip Hatchery
9.4c/
5.8” 6.0
Hatchery
6.7”5.5c’
2.0c’
Natural
.7c’2.0c’ 1 Cl
0.0 0.0 0.0
Natural 2.0
13.8 9.1 7.3
Hatchery 0.03.7”’
I.,Skagit
Stillaguamish
Snohomish
Natural 1
Groupinq
Preseason Estimates of AdultsMethodology for 2003
2003 2002 2001 2000 1999 1998 1997 1996 Prediction and Source
TABLE l-l. Preliminary preseason adult chinook salmon stock forecasts in thousands of fish. (Page 2 of 2)
Production Area,Type of Prediction and/orStock or Stock

recruits/smelt survival rate.
1996-l 999 brood year average survival rate to ocean recruit applied tosmolt release.
Average Queets smolts per square mile multiplied by 299 square milesof Hoh River watershed and 7% projected marine survival rateestimated from Bingham Creek data.
Estimated smolt production multiplied by average predicted survival ratefrom sea surface temperature based on Bingham Creek data.Mean ocean recruits per release for BY 80-93, multiplied by releases.
6.03%,based on 2002 Bingham Creek jack return rates and 1997-2001 average
Smelt releases multiplied by average ocean recruits per release.
1993-l 997 brood year average ocean recruits per spawner.1994-1998 average marine survival rate to ocean recruit applied torelease.
Smolt estimate multiplied by marine survival rate projection of
smelt toadult survival rate.
1998-2000 average terminal run.1992-1997 average brood year survival applied to 1998 brood yearreleases.
2000 brood escapement multiplied by average return per spawner.
Smelt production from 2000 brood year with 1999 brood year
3-year average abundance for lake production.
1,036.5 326.3 325.5 63.8
143.5 491.8 278.0 140.9 24.9
36.6 127.3 48.5 59.4 21.6
20.0 52.0 18.6 33.4 8.1
71.8 50.1 55.9 60.7 47.2
22.3
86.4 For river production, relates ocean recruits (SRS accounting) toupwelling, sea surface temperature; data base 1970-2000. Most recent
1,707.6 671.4 559.2 118.4
161.6SRS accounting
database. Public hatchery prediction is partitioned into Columbia Riverearly and late, and coastal stocks based on the percent of jacksobserved and recent year average stock specific maturation rates.
15.9
117.9
361.7
1,758.7 727.9 620.6 165.8 463.8 Sum of stock component estimates.
863.1
440.0
377.9
29.3
376.1
206.9
86.5
60.4
Multiple linear regression of OPI public hatchery jacks to adults adjustedfor Columbia River delayed smolt release; 1970-2000
(FloNodA)
8.5
0.8 3.0 0.7 1.0 1995-l 997 brood year average survival rate multiplied by smolt release.
3.5 3.2 3.4 2.8
Natural 24.9 22.3 23.0 8.7 8.0 8.9
Hatchery 15.2 15.0 15.3 13.9
14.5
9.4 4.4 9.1
984.6 434.1
P Washington Coast
Willapa Natural 31.8 21.6 21.6 9.9 8.3 3.3
Hatchery 57.5 40.4 36.1 19.6 40.5 20.8
Grays Harbor
Quinault
Queets Natural 24.0 12.5 12.0 2.7 4.3 4.2 4.3
Hoh Natural 12.5 8.5
QuillayuteFall Run
72.5
Natural 58.0 55.4 51.3 47.8 57.7 30.1 26.1
Hatchery 64.0 56.8 67.1 75.8 30.4 25.6 104.3
Natural 47.7 29.4 8.7 4.4 7.3 6.5 2.0
Hatchery 20.6 12.3 10.8 7.4 8.2 3.9 5.1
Hatchery 24.9 16.0 10.0 11.8 13.8 4.6 16.9
Supplemental 1.3 2.0
T
Blanc0
STEP 3.6 0.6 1 .o 0.6 0.7 0.2 1.3
Blanc0
Coastal S. of Cape
2)
Production Sourceand Stock or Stock Group 2003
Preseason Estimates of Adults Methodology for 20032002 2001 2000 1999 1998 1997 Prediction
OPI Area (Total Abundance)(California and Oregon Coasts andColumbia River)
OPI Public Hatchery
Columbia River Early
Columbia River Late
Coastal N. of Cape
of 1 (Page coho salmon stock ocean abundance forecasts in thousands of fish. TABLE l-2. Preliminary preseason adult

coho from Secondary (Hatchery) management zones.coho from Secondary (Hatchery) management zones.
Cl Hood Canal Hatchery number includes 1,157 Natural b’ Strait of Juan de Fuca Hatchery number includes 2,312 Natural
1,200.la’ Run sizes scaled to FRAM base period (1979-l 981) catch and escapement.
..___._._.__......................................................................................................................_.................................................Puget Sound Total Natural 536.4 359.8 366.5 202.0 366.0 480.9 541.4
Hatchery 494.5 447.6 335.9 311.8 700.3 711.3
.3c’ 96.8 95.2 66.3. .
4.0b’ 14.4 13.6
22.0 12.4 14.9
105.4 44.4 65.5
98.5 87.2 30.2
14.1 10.1 10.3
19.7 24.4 17.7
14.7 16.8
37.7 28.3
13.8 30.8
95.0 119.1
75.7 55.0
10.9 12.9
35.7 47.8
29.7
28.0
223.3
70.9
22.1
36.0
Snohomish
South Sound
Hood Canal
Hatchery
Natural
Hatchery
Natural
Hatchery
Natural
Hatchery
Natural
Hatchery
Natural
Hatchery
Natural
18.6
16.4
66.2
116.6
10.4
37.8
1.3
203.0
35.4
103.6
315.6
33.4
123.1
60.3
40.4
222.5
34.9
129.6
60.9
29.5
172.6
62.0
33.5
53.0
62.1
11.7
121.8
61 .O
38.5
141.6 165.3 186.6
87.8 47.1 184.6
19.4 57.2 135.0
372.1 408.7 674.1
65.1 108.0 78.4
Hatchery 47.0 31
ul Juan de Fuca
Nooksack-Samish
Natural 25.6 21.2 21.4 13.5
A variety of methods were used for 2003, primarily based on smoltproduction and survival. See text in Chapter Ill and Joint WDFW andtribal annual reports on Puget Sound Coho Salmon ForecastMethodology for details.
6.5
Skagit
Stillaguamish
1
T Strait of
..__.__.._._......~...................................................._.................................................Puget Sound
a’._..__.._....._................................... . . . . . . . . Hatchey 199.6 155.5 152.7 146.4 114.6 64.8 212.5
_ . . . . . . . . . . . . . . . . . . . . . . . . . . . . . . . . . . . . . . . . . . . . . . . . .WA Coast Total Natural 215.5 157.3 133.8 83.7 99.9 59.8 49.5.._..._..._........................................................................................................................
coho salmon stock ocean abundance forecasts in thousands of fish. (Page 2 of 2)
Production Sourceand Stock or Stock Group
Quillayute NaturalSummer Run
Hatchery
2003
1.8
5.4
Preseason Estimates of Adults Methodology for 20032002 2001 2000 1999 1998 1997 Prediction
1.2 0.6 1.6 1.2 1.3 1.6 Estimated smolt production multiplied by average predicted survival ratefrom sea surface temperature based on Bingham Creek jack models.
4.9 5.3 5.4 3.5 1.8 3.6 Average ocean recruits per release BY 1980-93, multiplied by thenumber of smolts released.
North Coast Independent Average of 500 smolts per square mile multiplied by 424 square milesTributaries Natural 14.8 6.4 8.1 5.1 3.4 3.0 3.8 of watershed and 7% projected marine survival rate estimated from
Bingham Creek data.
Hatchery 10.7 8.1 8.1 11.7 5.8 3.0 NA average brood year 1988-l 997 marine survival fate of 0.047 from theMakah National Fish Hatchery, multiplied by the 2000 brood yearrelease of 304,300..
TABLE l-2. Preliminary preseason adult

-----------------------------_---------- NAg’- 1.2 adult spawners (MSY) 1.2 0.9 1.6 0.7 1.0 1.2 1.0.
Quillayute Spring/Summer . . . . . . . . . . . . . . . . . . . . . . . . . .._.......... . . . . . . . . . . _ . . . . . . . . . . . . . _ .._............. . . . . . . . . . . . _ . . . . . . . . . . . . . _ . . . . . . . . . . . . . _ . . . . . . . . . . . . . _ .._..._.._................................................................................................ - no less than 3.0 adult spawners (MSY)
.Quillayute Fall
. . . . . . . . . . . . . . . . . . . . . . . . . _.......~~. . . . . ;,.; . . . . _ . . . . ;:; . . . . _ . . . . . . . . . . . .&.._ .._.. .-.&-‘_ ._... 5.,.i.‘_ . . . . . ;,;.._ . . . . . _ .__.__.................................................................................................... NAg’
;
Hoh Spring/Summer - no less than 0.9 adult spawners 1.4 1.8 1.3 1.0 0.5 1.2 2.4
.’ i NAg’ No NA”- no less than 1.2 adult spawners (MSY) 3.0 1.8 4.3 1.9 1.7 2.6 4.5
iHoh Fall
_.._....__............ j .__......___.____.__.................................. _ .._....._. . . . _ . . . . . . . . . . . . . _ . . . . . . . . . . . . . _ ._....._._..._............. _ . . . . . . . . . . . . . _ .._........ . . _ ___......_................................................................................................ ;J iLimitede’ Limitede’NAg’SpringlSummer - no less than 0.7 adult spawners 0.78 0.54 0.49 0.37 0.25 0.57 0.75
;
Queets
J ; NAg’ No NAg’- no less than 2.5 adult spawners (MSY) 3.4 2.5 4.0 1.9 3.6 2.9 2.3Queets Fall
~~~~~~~~ ~~~..~~~~~~.~~~~~~~~~~~~~~~~~~~~~~~~ ___.............. ;.’ ; NA No NAg’
j
Grays Harbor Spring - 1.4 adult spawners 4.5 4.5 2.3 2.9 2.9 2.9 2.6
J iLimitede’ Limitede’NAg’- 14.6 adult spawners (MSP) 20.2 18.2 12.5 7.8 4.9 9.5 11.3
iGrays Harbor Fall
1...................... ._......._............................................ .._....__. _ .._...._..... _ . . . . . . . . . . . . . _ . . . . . . . . . . . . . _ . . . . . . . . . . . . . _ . . . .._. _ ._.__...._...__..._....................................................................................... _ . . . . . . . . . . . . . _ . . . . . . . . .
~2%.Long history of dam passage and habitat losses.ZCouncil area base period impacts
;J iLimitede’ Limitede’>80.0
i
Columbia River Summer Chinook80.0 to 90.0 adults over Bonneville Dam.
18.0 27.9 21.4 28.2 30.8 78.2 127.4
>43.5 No No
~4%.
73.9 67.1 63.8 78.4 66.4 110.5 141.6McNary Dam
Council area base period impacts
~~~Upper Columbia River Bright Fall43.5 adults over
~~~~ ~~~~~~~~~~~~~~ _____..................................................... spawners/mile.fi
- no less than 35.0 adult natural spawners 81.3 46.1 42.5 18.5 82.7 77.8 65.6 135.0 No
Southern, Central and Northern Oregon Coast Spring and Fall 133.1 93.3 87.7 104.4 76.4 165.2 222.8 260.0 NoNo less than 60 adult
>180.0 No No
Klamath River Fall
- 180.0 adult spawners244.4 323.9 237.5 273.3 413.6 537.1 778.6
el
CHINOOK
Sacramento River Fall122.0
dlException2003b’
Overfishing Criteria
Alert”’ Concern
(Paae 1 of 3)
Stock and Conservation Objective(thousands of spawners; spawners per mile; impact or
replacement rate)
Observed or Projected Conservation Achievement(postseason estimates of thousands of spawners or spawners per mile;
pre- or postseason impact or replacement rate)
1996 1997 1998 1999 2000 2001 2002a’
Soecies Act are not included. Bolded numbers indicate a failure to meet the conservation objective. Stocks
listed under the Endanaered TABLE l-3. Achievement of conservation objectives for natural stocks listed in Table 3-1 of Amendment 14.

- Use the expertise of STT and HC to confirm negligible impacts of proposed Council fisheries, identify factors which have led to the decline or low abundance (e.g.,fishery impacts outside Council jurisdiction, or degradation or loss of essential fish habitat) and monitor abundance trends and total harvest impact levels. Council action will focus onadvocating measures to improve stock productivity, such as reduced interceptions in non-Council managed fisheries, and improvements in spawning and rearing habitat, fish passage,flows, and other factors affecting overall stock survival.
Alert and Overfishing Concern Actions for Natural Stocks that are Exceptions (thosewith exploitation rates limited to less than 5% in base period Council-areaocean fisheries)
- strict application of the conservation alert and overfishing criteria and subsequent Council actions do not apply for (1) hatchery stocks, (2) natural stocks with a cumulativeadult equivalent exploitation rate limited to less than 5% in ocean fisheries under Council jurisdiction during the FRAM base periods, and (3) stocks listed under the ESA.Conservation
e/ Exception
- Within one year, the STT to recommend and the Council to adopt management measures to end the overfishing concern andrecover the stock in as short a time as possible, preferably within ten years or less. The HC to provide recommendations for habitat restoration and enhancement measures withina suitable time frame.
not Exceptions
- triggered if, in three consecutive years, the postseason estimates indicate a natural stock, listed in Table 3-l of the salmon FMP, has fallen short of itsconservation objective (MSY, MSP, or spawner floor as noted for some harvest rate objectives).Actions required for Stocks that are
dl Overfishing concern
Washington, Hoh v. Baldriqe, and subsequent U.S. District Court ordered processes and plans, which may vary from the MSY or MSPconservation objectives. For all natural stocks which meet the conservation alert criteria, the Council will notify pertinent fishery and habitat managers, advising that the stock may betemporarily depressed or approaching an overfishing concern (depending on its recent conservation status), and request that state and tribal fishery managers identify the probablecauses, if known. If the stock in question has not met its conservation objective in the previous two years, the Council will request the pertinent state and tribal managers to do a formalassessment of the primary factors leading to the shortfalls and report their conclusions and recommendations to the Council no later than the March meeting prior to the next salmonseason.
- The Council will close salmon fisheries within its jurisdiction which impact the stocks, except in the case ofWashington coastal and Puget Sound salmon stocks and fisheries managed under U.S. District Court orders. In these cases, the Council mayallowfisheries which meet annual spawnertargets developed through relevant U.S. v.
not Exceptions (beginning in 2001)
- triggered during the annual preseason process if a natural stock or stock complex, listed in Table 3-l of the salmon FMP, is projected to fall short of itsconservation objective (MSY, MSY proxy, MSP, or floor in the case of some harvest rate objectives [e.g., 35,000 natural Klamath River fall chinook spawners]).Actions for Stocks that are
b/ Preliminary approximations based on preseason abundance projections and last year’s regulations or season structures.cl Conservation Alert
a/ Preliminary estimates.i>70.0 No No - 70.0 adult spawners (MSP) 53.1 58.2 150.1 61.3 94.2 261.8 161.65 Snohomish
i ......................!27.3 Z-17.0 No No ....T ” . . . . . . . . . . ...” . . . . . . . . . . ...” . . . . . . . . . . ...” . . . . . . . . . . ...” . . . . . . . . . . ...” . . . . . . . . . . ...” . . . . . . . . . . ...” . . . . . . . . . . . . . . . . . . . . . . . . . . . . . . . . . . . . . . . . ����¨ûB�������������.__.._.___.._.______...................................................................................... - 17.0 adult spawners (MSP) 10.4 10.9 27.3 7.0 28.3 73.6.____............._.............”.............”.............”.............“.......................................~......................!
Stillaguamish .. . . . . . . . ...” . . . . . . . . . . ...” . . . . . . . . . . ” ..__.......................................................................................... . . . . . . . . . . . . i>30.0 No No - 30.0 adult spawners (MSP) 8.3 32.6 73.6 28.6 63.7 92.0 NA
..“.............“.............“......................................................~......................!Skagit
. . . . . . . i” . . . . . . . . . . ...” . . . . . . . . . . ...” . . . . . . . . . . ...” . . . . . . . . . . ...” . . . . No _.__.___..........._...................................................................................... - 21.5 adult spawners (MSP) 37.1 95.8 101.1 18.8 27.3 94.7 NA 221.5 No
iHood Canal
>0.95 No No - 0.95 adult spawners 1.89 1.30 1.94 1.36 2.11 2.6 NA
iEastern Strait of Juan de Fuca
- 11.9 adult spawners 3.7 4.1 15.1 8.0 16.9 34.3 NA Z-11.9 No No j
Western Strait of Juan de Fuca . . . . . . . . . . . . . . . . . . . . . . $ . . . . . . . . . . . . . . . . . . . . . . . . . . . . . . . . . . . . . . . . . . . . . . . . . . . . . . ...” . . . . . . . . . . _ . . . . . . . . . . . . . _ . . . . . . . . . . . . . _ . . . . . . . . .. . . . ...” . . . . . . . . . . ...” . . . . . . . . . . ...” . . . . . . . . . . ” ..__.._............................................................................................ . . . . . . . ;~-6.3 No No - 6.3 to 15.8 adult spawners (MSY range) 11 .o 4.8 13.9 9.4 13.3 18.9 14.7Quillayute Fall
..-............._.............-.............-.............~.......................................*......................i” . . . . . . . . . . ...” . . . . . . . . . . ...” . . . . . . . . . . ...” . . . . . . . . . . . _.................__...................................................................................... ;>2.0 No No - 2.0 to 5.0 adult spawners (MSY range) 4.9 1.4 4.4 4.6 6.8 10.8 NA
..“............._.............“.............”......................................................~.......................Hoh
” . . . . . . . . . . ...” . . . . . . . . . . ...” . . . . . . . . . . ...” . . . . . . .. . . . .____.....................................................................................................
;Includes supplemental adults.
>5.8 No No - 5.8 to 14.5 adult spawners (MSY range) 12.6 1.9 5.5 5.3 8.6 22.4 23.1Queets ..“_““..“..“‘_.............“.............”......................................................~......................~” . . . . . . . . . . ...” . . . . . . . . . . ...” . . . . . . . . . . ...” . . . . . . . . ._........__.......__...................................................................................... >35.4 No No :- 35.4 adult spawners (MSP) 63.6 22.5 35.6 33.3 35.9 30.7 NA
Exceptione’
COHO
Grays Harbor
Concernd’ Aler?’ 2003b’ 2o02a’
Bolded numbers indicate a failure to meet the conservation objective. Stockslisted under the Endangered Species Act are not included.(Page 2 of 3)
Observed or Projected Conservation Achievement(postseason estimates of thousands of spawners or spawners per mile;
Stock and Conservation Objective pre- or postseason impact or replacement rate) Overfishing Criteria(thousands of spawners; spawners per mile; impact or
replacement rate) 1996 1997 1998 1999 2000 2001
TABLE l-3. Achievement of conservation objectives for natural stocks listed in Table 3-l of Amendment 14.

gl Preseason forecasts are not made for Washington coastal chinook stocks.
-.9.2 miles for northern stocks).
- south’local andr!lile weighted by the total number of miles surveyed for each of the two components (2.2 miles for sp(awr!?ers per sou&ocal and north migrating sumgof fl Based on the S ecies Act are not included. Pa e 3 of 3Endan ered
Bolded numbers indicate a failure to meet the conservation objective. Stockslisted under the TABLE l-3. Achievement of conservation objectives for natural stocks listed in Table 3-l of Amendment 14.


c/ Preliminary estimate. Likely to be adjusted when genetic stockidentification (GSI) bias correction methodologies are finalized.
IV-1
b/ Total run size.
c/3.50 21.192.30 17.30
a/ Total Puget Sound run size includes stocks other than Puget Soundpink stocks.
1999c,0.95 3.59
2003
1997c, 0.44 8.20
2001
1993c,1.06 17.012.11 12.881995c/
.Ol 15.351985 1.76 19.101987 1.57 7.171989 1.93 16.631991 1.09 22.33
Riverb’
1977 0.88 8.211979 1.32 14.401981 0.50 18.691983 1
Sounda/ Fraser
CHAPTER IVFRASER RIVER AND PUGET SOUND
PINK SALMON ASSESSMENTS
Two major stocks of pink salmon contribute to Council ocean fisheries during odd-numbered years, FraserRiver and Puget Sound. The more abundant of the two runs originates from the Fraser River in BritishColumbia, Canada. Table IV-l provides a summary of recent run sizes.
The 2003 pink salmon abundance projections for the Fraser and Puget Sound stocks are 17.3 million and2.3 million, respectively. The 2001 run size of Fraser pinks is estimated at 21.20 million, compared to theforecast of 5.47 million. The 2001 estimated run size for Puget Sound pinks is 3.5 million compared to theforecast run size of 2.92 million.
Fraser River and Puget Sound pink runs occur in significant numbers only in odd-numbered years.
TABLE IV-l. Estimated annual run sizes (odd numbered years 1977-2003) for Fraser River and Puget Sound pink salmon in millions ofsalmon.
Year Puget


bycatch reduction opportunities.
A-16
smelt). If parent spawnersdecline to lower levels than observed through 1998, rates of less than 10% would be considered, recognizing that there is a limitto further
(<0.0006 jack per hatchery #l rebuilding criteria, or (2) marine
survival conditions are projected to be at an extreme low as in 1994-1996 b/ This exploitation rate criteria applies when (1) parent spawners are less than 38% of the Level
bLa major basin within the stock component is less than 10% of full seeding, (1) the parent spawner status will be downgraded onelevel to establish the allowable fishery impact rate for that component, and (2) no coho-directed harvest impacts will be allowedwithin that particular basin.
I/ When a stock component achieves a medium or high parent spawner status under a medium or high marine survival index,
Winchuck River) 5,400
.____________--____---~~~~-~~~~~--~~~~-~___-_____-_____--___---__--~~~_-~~~~-~~~
Southern: Rogue(Elk River to
.___-____--___--____---~~~--~~~~--~~~~-~~~~~--~__-____---~__--~~_~-~~~~~~~~~~~~~~~~~~~--~---
South-Central: Umpqua coos Coquille Coastal Lakes(Siltcoos River to Sixes River) 29,400 7,200 5,400 8,000
Alsea Siuslaw Ocean Tribs.(Salmon River to Siuslaw River) 4,300 7,100 15,100 22,800 5,700
Siletz Yaquina.__--_____-____-__,__--__,_-___,__--_____~___~____-_~_______-__~~~~~-~~~~~~~~~~~~~--~---------
North-Central:
#l (19% of full seeding): 4,100
North-Central South-Central
55,000 50,00041,300 37,500
27,500 25,00010,500 9,500
Southern Total
5,400 132,100
4,100 99,300
2,700 66,1001,000 25,100
Stock Component Full Seeding of Major Basins at Low Marine Survival(Boundaries) (Number of Adult Spawners)
Northern: Nehalem Tillamook Nestucca Ocean Tribs.(Necanicum River to Neskowin Creek) 17 500 2 000 1 800 400
#l (50% of full seeding): 10,90038% of Level
#2 (75% of full seeding): 16,400Level
#l rebuilding criteria
OCN Coho Spawners by Stock Component
Rebuilding Criteria Northern
Full Seeding at Low Marine Survival: 21,700Level
2J
Parent spawners less than Level
~25%<20%a/
515%#I or greaterrebuilding criteria
535%al
Medium: Parent spawners achieved Level
<15%al
#l
Allowable Total Fishery Impact Rate
130%#2 rebuilding criteria;grandparent spawners achieved Level
(>0.0034)
High:PARENT SPAWNER STATUS
Parent spawners achieved Level
(<0.0009) (0.0009 to 0.0034)
smelt)
Low Medium High
1)
MARINE SURVIVAL INDEX(based on return of jacks per hatchery
coho stock components under Amendment 13. (Page 1 of TABLE A-2. Allowable fishery impact rate criteria for OCN

does not represent “Critical” status forthat basin. Instead. “Critical” status for the Rogue Basin (Southern Subaggergate) is estimated as 12% of full seeding of highquality
A-17
b! “Critical” parental spawner status is defined as 4 fish per mile for the Northern, North-Central, and South-Centralsubaggergates. Because the ratio of high quality spawning habitat to total spawning habitat in the Rogue River Basin differssignificantly from the rest of the basins on the coast, the spawner density of 4 fish per mile
OCN aggergate assumes the status of the weakest sub-aggregate.
.
Very Low
Sub-aggregate
a/ Parental spawner abundance status for the
. . . . . , . . .. . . . . . . :~:~:&!Y~‘:‘:115% 115%80/,?;;5 I_ __,;: 50% of full seeding
-:,5& > 19% .
Parent Spawners . . . . . . . .. . . * . . . , R’.‘.‘.’.. . , .: H M .. . c-.‘:>
.A..;&~,Low
;&<~*,;;,;,;; .. . . . . . . , ,‘,,, 1,“,,A; .” .. . . . . . , _,,,,:,, .,,, ,I :* : . *=38%” : . : . : 5 20%5 15%_,,,, J I. :8ye ( I’:_,,
,*,~+*;j
75% of full seedingI_50%& >
.Parent Spawners
. . * . . . , _’ ** . . . ; ,, , . . < * . . . .‘s’ . ,,,-;: I N . . . .d y;,”,“::: ,,,,, >A,: .
Medium . . . .. . . . . . . . /+..: ~~~,;;,,,~:,;c .. . . . . . . :. : ’ +i5IYi : ’ : * : 5 30%5 15%_\I&% _ i,>< ‘j :
‘,seeding
“” ’ .. . . . . . .
”ii,:, ,_” ~?” > 75% of full*
Parent Spawners . . . . . . . . ,,z 9’:::.. . , .. . , ._” J 0Es ;,~.;_,
)
High
(>0.0040 (>0.0014 to 0.0040))) (0.0008 to 0.0014 (<O.o008 ’
smelt)
Extremely Low Low Medium High
Parent Spawner Status
CCNwork group 2000 review of Amendment 13. (Page 1 of 1).
Marine Survival Index(based on return of jacks per hatchery
from the coho stock components based on the harvest matrix resulting TABLE A-3. Fishery impact rate criteria for OCN

. B-4
B-i
. B-3
. B-2
.
. B-l
. . . . . . . . . . . . . . . . . . . . . . . . . . . . . . . . . coho recruits with
Stratified Random Sampling accounting.
.
Data set used in predicting 2003 Oregon coastal natural river
. . . . . . . . . . . . . . . . . . . . . . . . . . . . . . , . . coho management component coho salmon natural spawner abundance in Oregon coastal basins for
each OCN
.
Estimated
. . . . . . . . . . . . . . , . . . . . . . . . . . . . . . . . . . . coho with
Stratified Random Sampling accounting
coho smolts released annually into the OPI area by geographic areaand rearing agency . . . . . . . . . . . . . . . . . . . . . . . . . . . . . . . . . . . . . . . . . . . . . . . . . . . .
Data set used in predicting 2003 Oregon production index hatchery adult
APPENDIX BOREGON PRODUCTION INDEX DATA
LIST OF TABLES
Table B-l.
Table B-2.
Table B-3.
Table B-4.
Millions of

. 1.01.42.52.72.32.12.12.43.23.43.44.13.83.94.13.44.74.34.35.47.5
10.57.54.35.98.07.95.46.47.28.55.36.24.35.03.73.32.91.71 .o0.90.9
0.00.10.40.50.51.10.71.31.81.41.41.01.61.20.61.60.60.90.50.80.80.90.60.90.70.21.81.31.21.31.21.50.70.80.60.70.30.70.60.70.60.6
7.416.617.425.620.823.827.427.824.332.428.833.335.333.632.634.034.236.637.435.136.443.935.932.235.937.042.635.537.138.140.042.139.739.532.329.531.624.629.129.732.126.8
1 .o 0.6 25.2
d/ Preliminary.cl Excludes 3.5 million assumed lost at Toutle Hatchery on May 18, 1980 during the eruption of Mt. Saint Helens.b/ Beginning in 1989, does not include minor releases from STEP projects.
coho smolt is here defined as 30 fish per pound or larger and released in February or later.
;$;dl7.5 3.3 8.6 11.9 4.3 23.7 1.0
a/ A
5.9cf8.74.02.42.53.93.83.32.82.53.33.74.34.32.53.43.43.25.84.06.24.2
5.24.63.15.25.97.2
12.410.910.6
8.09.1
11.714.214.915.014.213.815.315.416.117.014.315.314.314.812.012.912.97.8
11.411.510.8
9.7
2.56.35.58.06.57.8
12.18.56.6
15.714.416.618.817.016.718.316.517.018.217.317.622.818.917.416.717.719.118.718.919.517.619.018.619.114.516.316.311.017.215.517.013.9
1.74.22.37.94.66.46.58.67.25.64.44.54.25.24.34.14.26.05.32.85.03.73.33.43.62.04.73.34.53.54.75.92.74.13.01.73.43.93.64.85.93.7
6.415.114.522.418.020.624.624.119.327.624.028.229.928.527.929.028.931.432.628.928.132.527.827.029.328.832.928.829.529.630.335.332.834.426.625.228.021 .o26.827.930.625.3
1.01.42.52.72.32.12.12.43.23.43.44.13.83.94.13.44.03.24.04.53.43.94.33.04.53.84.84.95.35.25.75.36.24.35.23.73.32.91.71.00.90.9
0.71.10.30.94.16.63.21.31.44.23.10.51.12.02.8
OPI
1960196119621963196419651966196719681969197019711972197319741975197619771978
CD 1979.!A 1980
19811982198319841985198619871988198919901991199219931994199519961997199819992000
2.24.66.76.56.96.46.07.05.56.35.27.26.96.36.96.68.28.49.18.85.55.95.66.28.99.19.16.86.26.68.0
10.411.511.1
9.17.18.46.16.17.67.87.6
10.59.8
13.513.611.19.55.95.66.4
10.28.2
ODFWb’ Yearlings Total CaliforniaTotal
(Paqe 1 of 1)
Columbia River Oreaon Coast
Washinqton Private
Year Oregon Early Late Combined Federal Total
aqency.a/ smelts released annually into the OPI area bv qeoqraphic area and rearinq coho TABLE B-l. Millions of

r, 18.8 6.3
27.6 0.024.0 0.028.3 0.029.9 1.828.5 2.927.8 1.829.0 2.028.9 0.231.4 0.032.6 5.028.9 6.728.1 5.632.4 6.827.7 5.027.0 5.129.2 9.128.8 12.232.9 9.028.8 7.729.5 7.229.6 8.530.3 7.135.3 6.032.8 5.534.4 6.026.6 3.125.2 4.228.0 3.421.0 2.526.8 3.027.9 4.130.6 2.023.5 1.4
B-2
1,439.6 71.1 15.7660.1
1,874.8 60.8 7.9543.6 19.9 5.7261.7 19.6 7.5202.3 3.9 1.3147.6 9.1 2.7177.8 14.1 3.2197.6 15.8 4.6205.2 6.8 3.0335.1 22.9 5.9679.4 31.2 3.5
1,720.2 55.0 5.8718.4 37.1 9.6
1,669.3 72.3 12.9
2,435.8 64.6 12.9887.2 24.2 8.7
1,266.8 55.0 6.3599.2 61.0 7.2691.3 28.1 3.6717.5 18.2 7.8
1,064.5 40.6 8.11,224.O 51.6 6.01,476.7 64.1 8.41,824.l 99.2 4.0
3,885.3 146.2 25.3987.5 46.2 7.5
1,652.8 75.1 1.1.l 132.1 12.1
1,817.O 85.7 5.73,071
1,924.8 100.8 2.9
2,765.l 148.6 13.63,365.0 172.8 6.6
Niiio impacts.Cl Preseason predicted adults.
El b/ Data not used in the analysis due to SmD = Columbia River delayed smolt releases.SmCR = Columbia River smolt release.
JackOC = Oregon coastal and California hatchery jack returns corrected for smalladults.
JackCR = Columbia River jack returns corrected for small adults.
OPIH = Harvest impacts plus escapement for public hatchery stocksoriginating in the Columbia River, Oregon coastal rivers, and theKlamath River, California.
%I198319841985198619871988198919901991199219931994199519961997199819992000200120022003 863.1”’ 42.6 8.1 23.7 0.3
a/ Adult
(t-l)
197019711972197319741975197619771978197919801981198
(t-l)(t-l)(t-l)(t)(t)OPIH Jack CR Jack OC Sm CR Sm D
smelts in millions of fish. (Page 1 of 1)
Year Adult
Samplings$ccounting. Adults and jacks shown inthousands of fish and
coho with Stratified Random TABLE B-2. Data set used in predicting 2003 Oregon production index hatchery (OPIH)adult

bl Mark recapture estimate based on seining at Huntley Park in the lower Rogue River.
3,051 1,027 2,208 361 5,439 3,761 4,622 8,282 2,316 1,438 10,966 12,213 7,800 4,883bl
COASTWIDE 23954 37356 42798 54773 48757 56280 77568 30953 33,341 48,844 83,388 180,439 272,116 76,197a/ The sum of the individual basins may not equal the aggregate totals due to the method used in removing hatchery strays.
G Direct OceanTributaries
TOTAL
SOUTH CENTRAL
Umpqua
coos
Coquille
Coastal Lakes
TOTAL
386 1,552 3,975 1,268 2,265 2,007 1,463 1,057 1,173 1,190 3,713 15,519 22,310 20,654 6,011
249 265 3,000 261 860 652 289 661 388 271 2,175 2,253 1,883 16,488 2,265
167 189 728 684 401 313 1,811 519 271 169 2,201 1,070 3,940 12,334 1,895
97 191 1,579 209 983 485 319 1,043 314 946 775 410 5,318 2,726 1,177
899 2,197 9,282 2,422 4,509 3,457 3,882 3,280 2,146 2,576 8,842 18,596 33,667 52,202 11,312
118 441 984 2,447 400 1,200 607 763 336 394 706 2,765 1,437 2,369 1,142
109 381 380 633 549 2,448 5,668 5,127 384 365 2,588 788 3,039 25,039 3,645
221 1,189 1,561 7,029 1,071 1,279 681 1,637 680 213 2,050 2,571 3,339 5,767 2,236
514 2,685 3,740 3,440 4,428 3,205 6,089 7,625 668 1,089 2,724 6,910 11,024 57,125 8,519
201 895 67 1,821 1,331 1,683 560 2,975 774 1,222 3,691 1,002 6,373 13,809 2,785
1,163 5,591 6,732 15,370 7,779 9,815 13,605 18,127 2,842 3,283 11,442 15,820 25,528 104,111 18,465
1,083 3,737 3,600 2,152 9,311 4,485 11,349 9,749 2,233 8,426 6,466 12,990 34,041 42,413 11,612
208 2,273 3,813 16,545 15,284 14,685 10,351 12,128 1,127 3,167 4,945 4,600 43,301 35,005 12,863
331 2,712 5,651 2,115 7,384 5,035 2,116 16,169 5,720 2,466 3,001 7,669 13,310 8,488 6,295
4,393 7,251 1,986 10,145 5,841 11,216 13,493 8,603 11,107 12,710 12,747 19,669 22,097 10,866
1,622 13,115 20,315 22,798 42,124 30,046 35,032 51,539 17,683 25,166 27,122 38,006 109,031 108,003 41,537
SOUTH
Rogue
m Siuslaw
Alsea
2o02a/ Mean
NORTHERN
Nehalem
Tillamook
Nestucca
Direct OceanTributaries
TOTAL
NORTH CENTRAL
Siletz
Yaquina
2oooa/ 200199ga/
coho management component. Estimates adjusted forvisual observation bias by multiplying observed count by 1.33. (Page 1 of 1)
Adjusted SRS Natural Coho Spawner Estimates
a/ 1990-2002Component and Basin Miles 1990 1991 1992 1993 1994 1995 1996 1997 1998 1
coho salmon natural spawner abundance (SRS accounting) in Oregon coastal basins for each OCN TABLE B-3. Estimated

b/ Preseason adult prediction.
B-4
42” Nlatitude.
97.8b’ 4.60393 1.107 54.08a/ JanAnom = The annual deviation from mean (1969-1996) January sea surface temperature
(degrees Centigrade) at Charleston, Oregon.UpAnom = Annual deviation from mean (1946-l 996) April-June Bakun upwelling index at
,3.97218 -0.007 -21.921991 52.3 3.95700 -0.893 -37.921992 78.6 4.36437 0.107 43.081993 76.8 4.34120 -0.593 7.081994 40.2 3.69387 1.107 -50.921995 47.1 3.85227 0.707 -3.921996 64.9 4.17285 1.807 -1.921997 16.1 2.77882 0.907 9.081998 21.5 3.06805 2.407 -24.921999 37.4 3.62167 -0.393 18.082000 68.1 4.22098 0.107 84.082001 161.8 5.08636 0.707 9.082002 276.2 5.62113 0.207 65.082003
(t-l)iL/
1970 147.1 4.99111 0.307 -16.921971 374.1 5.92452 -1.293 30.081972 153.5 5.03370 -1.393 10.081973 209.2 5.34329 -0.493 23.081974 170.6 5.13932 -0.693 47.081975 187.3 5.23271 -0.493 48.081976 387.6 5.95997 -0.893 65.081977 122.3 4.80648 -0.193 32.081978 104.2 4.64631 1.207 17.081979 186.8 5.23004 -1.193 -2.921980 95.0 4.55388 0.507 17.081981 159.6 5.07267 1.607 -1.921982 177.8 5.18066 -0.093 -8.921983 90.9 4.50976 1.007 14.081984 87.7 4.47392 0.607 -24.921985 116.7 4.75961 0.007 -24.921986 87.5 4.47164 0.107 -24.921987 64.0 4.15888 0.507 -39.921988 116.9 4.76132 -0.093 -21.921989 93.1 4.53367 -0.493 -43.921990 53.1
a/UpAnom
coho recruits withStratified Random Sampling (SRS) accounting. Recruits shown in thousands of fish. (Page 1 of 1)
Recruits to Ocean
Year SRS Ln SRS (Recruits) JanAnom
(OCNR) TABLE B-4. Data set used in predicting 2003 Oregon coastal natural river


Related Documents