1 CONFERENCE OF EUROPEAN STATISTICIANS Workshop on Statistical Data Dissemination and Communication 28-30 June 2017, Geneva, Switzerland WP.1-2 27 June 2017 Preparing a statistics communication strategy Per Nymand-Andersen (European Central Bank) [email protected] Abstract Independent statistics is fundamental for presenting and comparing the structures and dynamics of our societies. Safeguarding the facts and figures and facilitating the use of good quality statistics for evidence based policy making contributes to sound and sustainable policies for the collective benefits of citizens. This paper raises the need for the statistics community to use statistics as a strategic asset and to proactively service the professional user communities with relevant statistics and methodology and to bring statistics closer to citizens. Communicating statistics is a fundamental and legitimate responsibility as part of the transparency and accountability objectives of institutions engaged in official statistics and to crowd out low quality statistics and cyclical sentiment based policy strategies. Keywords: Statistics, strategy, communication, service 1. Strengthening the communication function of the national and international statistical systems In today’s open market economics and modern society, there are ample private and public data sources freely available of diverse quality for national and international policy use. This challenges traditional thinking that users and consumers of available data first provide an assessment of the respective sources and second can differentiate between good quality “official statistics” and less good quality “statistics” and its associated impact on comparability and third the decreasing time available for professional intermediaries and users (such policy analysts, advisers, journalists and opinion formers) to critically investigate methodological differences for correctly adjusting policy analysis and recommendations. This paper raises the need for the statistics community to modernize the statistics function by adding the “communication function” as an integrated part of the statistical production process and to pro-actively reach out to professional users and citizens with easy to re-use and presentable statistics as part of crowding out poor, in-transparent and ever increasing sentiment based statistics.

Welcome message from author
This document is posted to help you gain knowledge. Please leave a comment to let me know what you think about it! Share it to your friends and learn new things together.
Transcript

1
CONFERENCE OF EUROPEAN STATISTICIANS
Workshop on Statistical Data Dissemination and Communication
28-30 June 2017, Geneva, Switzerland
WP.1-2
27 June 2017
Preparing a statistics communication strategy
Per Nymand-Andersen (European Central Bank)
Abstract
Independent statistics is fundamental for presenting and comparing the structures and dynamics of our
societies. Safeguarding the facts and figures and facilitating the use of good quality statistics for evidence based
policy making contributes to sound and sustainable policies for the collective benefits of citizens. This paper
raises the need for the statistics community to use statistics as a strategic asset and to proactively service the
professional user communities with relevant statistics and methodology and to bring statistics closer to citizens.
Communicating statistics is a fundamental and legitimate responsibility as part of the transparency and
accountability objectives of institutions engaged in official statistics and to crowd out low quality statistics and
cyclical sentiment based policy strategies.
Keywords: Statistics, strategy, communication, service
1. Strengthening the communication function of the national and international statistical systems
In today’s open market economics and modern society, there are ample private and public data sources freely
available of diverse quality for national and international policy use. This challenges traditional thinking that
users and consumers of available data first provide an assessment of the respective sources and second can
differentiate between good quality “official statistics” and less good quality “statistics” and its associated
impact on comparability and third the decreasing time available for professional intermediaries and users (such
policy analysts, advisers, journalists and opinion formers) to critically investigate methodological differences
for correctly adjusting policy analysis and recommendations.
This paper raises the need for the statistics community to modernize the statistics function by adding the
“communication function” as an integrated part of the statistical production process and to pro-actively reach
out to professional users and citizens with easy to re-use and presentable statistics as part of crowding out poor,
in-transparent and ever increasing sentiment based statistics.

2
This modernization process is recognised by Eurostat and the European Statistical System (ESS) as part of the
“Modernisation strategy 2020”, where the communication function plays a new role. This communication
function needs to be conceptualised and operationalised by agents engaged and responsible for providing
official statistics and by recognising the importance of independent national and international official statistics
in society.
The lack of a proactive communication strategy may well have contributed to the steady and continuous
reputational loss and trust in statistics, in its profession and in those statistical agents engaged in developing
methodology and producing reliable and comparable national and international statistics, as a public good for
sound and sustainable decision making.
According to the Eurobarometer survey1 an absolute majority of European citizens do not trust statistics and
only 59% of respondents believe that statistical information plays a role in decision making. These results
are critical and follow a continuous declining trend also observed in equivalent surveys from 2007 and 2009,
which, if not reverted, will have significant social consequences, as the gap between citizens and citizens’ trust
in public establishments, administration and international institutions wideness. It may well be this has already
materialized, since sentiment based statistics seem to be increasingly and deliberately used within the political
scene using own digital channels as part reaching directly out to large groups of followers.
This trend is furthermore confirmed or amplified by citizen’s knowledge deficiency of basic economic,
financial and statistics literacy. Only 6% of European citizens know the GDP growth rate of their own country
and while only 25% of respondents could give a correct answer to the unemployment rate, none of the
respondents were able to give a correct answer to the annual inflation rate of their country2. It is therefore
expected that the general public’s knowledge of less press focused and prominent statistics and statistical terms
might even be lower.
The field of Statistics and the institutions responsible for producing statistics need to acknowledge the
seriousness and contagion effects this may have on the trust and reputation of statistics, the institutions
responsible for the provision of statistics and more importantly, the impact it may have on our societies and the
way policy makers and professional users use official and other available statistics and data3.
There is a clear call for statistics to become an active and valuable asset collectively, by national and
international statistics agents. As statistics is a core ingredient of transparency and accountability of institutions,
it needs to be proactively rendered to citizens as part of crowing out the increasing noise or less quality
statistics.
For instance, communicating understandable and easy to use statistics not only supports (i) statistics, financial
and economic literacy, but also (ii) facilitates the acceptance process of sound and sustainable policy decisions;
1 Eurobarometer 83, Europeans and economic statistics report, Spring 2015.
2 Eurobarometer (Spring 2015)
3 “How politicians poisoned statistics”, Tim Harford, Financial Times April 14, 2016

3
(iii) contributes to enhancing the trust in (iv) official statistics and (v) in the institutions responsible for
producing statistics and furthermore (vi) contributes to a knowledge-based society critically (vii) verifying and
maintaining the accountability of policy decisions.
Communicating statistics is therefore a strategic asset as an integrated part of the functional independence of
producing statistics. Within the same vein, communicating statistics is a fundamental and mandatory obligation
contributing to national and international agents’ transparency and accountability objectives.
It is widely agreed that fostering transparency as regards to policy decisions by providing the underlying
statistics contribute to an efficient and effective pass-through for these decisions and facilitate the external
acceptance process. The broader the general understanding of statistics, the more likely it is that there will be
support for sound and sustainable oriented policies. Ceteris paribus, the increased use of good quality statistics
will lead to a better understanding of policy decisions and by proactively communicating statistics will enable
external users to use statistics, provide their own analysis, assessments and contribute to the public debate
thereby enriching and increasing the likelihood of sound and sustainable policy decisions, for the collective
benefit of society.
Against this background, there is a collective need for statistics agents to develop and integrate the statistics
communication function as part of the modernization process of national and international statistics. But how
should such a strategy look like and what are the necessary components?
2. Preparing a statistics communication strategy
Statisticians need to use their unique conceptual business knowledge and information gathering skills to build
an user-centric communication strategy, seeking to understand users’ needs, the barriers they face and their
working processes. This requires that statisticians embrace current market developments and opportunities in
order to establish a new two-way statistics communication strategy and thereby involve users in the statistics
community.

4
Figure 1: The Communication function as an integrated part of statistics4
The conceptual and cultural mind-set change can by summarised – in technical terms - as moving from a
traditional “pull” concept5, where statistics is released in databases for public use to a new “push” concept.
This new push concept relates to a new function, whereby the statisticians (a) segregate and provide tailored
statistics to (b) different users’ groups by (c) facilitating the understanding and (d) simplifying the integration
of statistics within workflows and (digital) media and (e) offer statistics descriptions using common language
and methodological advice.
This statistics communication function relates predominantly to five main components;
(1) Extracting statistics intelligence in context from the pool of disseminated/available statistics (the
what);
(2) Applying tailored market segmentations (to who);
(3) Using various communication concepts and forms (the how);
4
It should be noted that some international statistics agents do not have the mandate to draft legal acts (step 5) as
part of guaranteeing the use of common definitions, standards and quality of statistics and are dependent on less rigorous
measures such as Memorandum of understandings or even “good-will”, of suppliers of data used to produce statistics. 5 The traditional “pull concept” provides significant entry barriers for the use of statistics; such as, that users are
required to have advanced knowledge of (i) the originator of the source (who provides what statistics); (ii) the ability to
know and being able to distinguish between economics concepts, understand metadata and institutional structures as part
of searching for statistics in databases and (iii) technical knowledge to use and extract statistics and (iv) statistical
knowledge to differentiate between statistics methodological concepts.

5
(4) Applying multiple communication channels (the which) and
(5) Descriptions and applying statistics knowledge (why).
Figure 2: The concept of providing a communication function to statistics;
A description of the five main components and the associated tasks is provided below.
2.1 The component of - Extracting and describing insights from the pool of available statistics
National and international statistics offices have traditionally disseminated statistics into public available
databases which are increasing in size and complexity over time. The availability of datasets, series and
metadata are running up in the millions and it is expected to continue to increase in the foreseen future mainly
due to new policy needs for granularity and availability of new micro-level statistics serving various policy
demands at regional, national, geographical and global level. While all the statistics should continue to be
available and remain a public good, there is a clear need to summarise and extract core and essential messaging
from the statistics with the aim of explaining the main and broad statistics developments and the applied
methodologies to the professional user segments, policy makers and the general public at large.
This will assist and contribute to a better understanding and use of statistics. The professional expert users
(also called “power users”) will continue to know and use the variety and granularity of public released
statistics in databases, though they likewise have a special need for statistics (for instance; being granted access
to confidential data for research purposes).

6
Let put ourselves in the shoes of a user. A user arrives at a public available “Statistics Data Warehouse”6 and is
looking for the “inflation rate”; A core and frequently used data set. This data set is sourced and produced by
Eurostat and the respective National Statistics Institutes within Europe and the statistics is shared and stored
within databases by the other European Statistics system (ECB and the National Central Banks). A so called
“power user” may know which inflation rate to select for purpose, thought the layman may have difficulties to
choose and select among the 895 available series related to inflation rates, when performing a simple data
query. In fact, the database does not render you the 895 results but asks you to be more specific; “Did you
mean (ICP or inflation) rate?” Already at this stage the layman may feel uncomfortable to redefine the query, as
it may not be clear to which of the two rendered terms to use and may already be afraid of choosing the wrong
term (the use of abbreviations may not be too supportive either). While the engaged user will continue and
obtain a significant list of inflation rates, shall layman then choose the (i) overall and broad inflation rates; (ii)
inflation rates excluding energy; (iii) inflation rate excluding unprocessed food or (iv) inflation rate excluding
both energy and unprocessed food? The selection process becomes more complex, when users have to choose
between growth rates calculated based on quarter-on-quarter growth rates or calculating using previous year’s
quarterly value and/or between using seasonal or non-seasonal adjusted series. This correct offer is - as within
many other professional fields and choices in life - “it depends on the purpose of the request”. Though what is
important issue is to acknowledge is that the “Statisticians are best placed”, as producers of statistics and with
their statistics knowledge of the business and applied methodology to guide layman to the most relevant set of
statistics. The sheer volume of available statistics has outgrown the cliché used by traditional statisticians that
“all the statistics is there and available”. The statisticians have the obligation to communicate, by extracting the
relevant information in context and providing descriptive statistics using common language, explainers and
narratives tailored to core user segments, which are grouped according to similar homogeneous needs.
2.2 The component - Market segmentation – Knowing your user and serving their needs
The diversity of use and culture are important elements in market segmentation. Take for instance the euro area
- one common economic area sharing one currency, the euro – though the diversity among countries are
reflected by their richness of different cultures, languages, society and market structures, and, for these reasons,
a “one size fits all” concept of communicating (euro area) statistics is likely only to have marginal impact. For
instance, within the euro area there are (at least) 333 million citizens, speaking 23 languages. There are over 60
regional and minority languages, spoken regularly by 40 million citizens7,8
. This is not a unique European
phenomenon and many other countries and regions throughout the continents may have similar and important
diversity factors. The need for segmentation arises from the recognition of the diversity of user’s and language
6 The example used for illustrative purposes happens to be the ECB Statistics Data Warehouse, but could, in
principle, be any statistics data warehouse. The ECB Statistics Data Warehouse is a well scaled and well-functioning data
warehouse. 7 The most widely spoken language is Catalan, with 7 million speakers in Spain, France and the town of Alghero in
Sardinia; and the Celtic language is spoken in France, Ireland and the United Kingdom. 8 European Commission Multilingualism, available at http://ec.europa.eu/education/languages/languages-of-
europe/doc141_en.htm
7
needs. The objective in segmenting statistical users is the ability to serve a certain group of users with a set of
tailor-made statistics and functionalities, which in turn would enable the latter to better fit their purpose. These
tailored statistical presentations would allow users with similar needs to easily integrate those statistics and
functionalities within the own business processes and thereby support the use and spreading of statistics
narratives throughout our society. There is a clear need for the statistical community to define its segmentation
strategies, and its criteria for grouping users into homogeneous groups of similar needs and serve these needs.
This requires – apart from conceptual statistical knowledge – the ability of the statistician to understand users’
professional needs, their barriers to accessing and using statistics and their associated working patterns, as part
of generating suggestions for facilitating the understanding and re-use of statistics.
The central banking community conducted five tailor-made user surveys9 in order to better understand the
external users’ need for statistics, their barriers and their working patterns. As a result it became clear that the
external users of euro area and national statistics present the following characteristics:
They
1) are mainly professional users or intermediaries (data vendors);
2) have significantly different needs in terms of the level of detail, and timeliness of the statistics
and technical knowledge;
3) have a great heterogeneity in terms of statistical literacy;
4) present very diverse working patterns;
5) have identified significant barriers in using statistics.
Against this background, the following initial nine broad professional user segments for statistics can be
established, in this specific central banking case.
9 These were (i) interviews with journalists; (ii) a survey of website users; (iii) a survey of international
statisticians; (iv) a survey of large data users/vendors; and (v) a survey of the banking community.
8
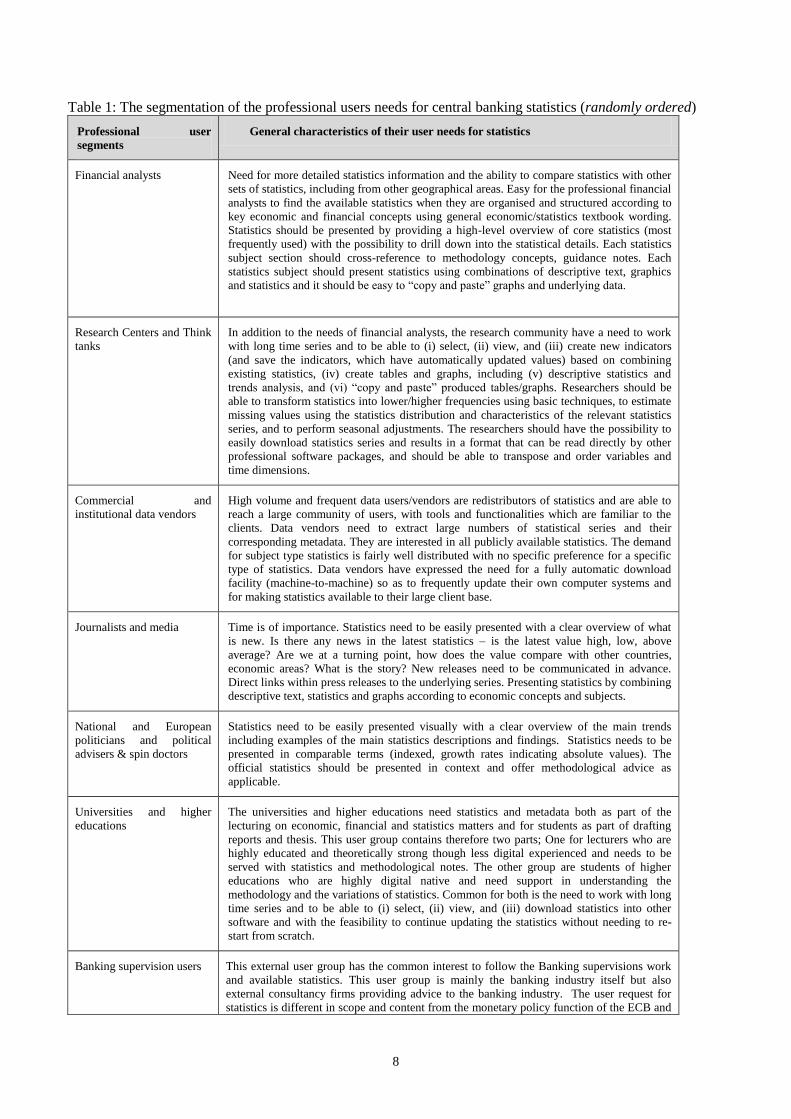
Table 1: The segmentation of the professional users needs for central banking statistics (randomly ordered)
Professional user
segments
General characteristics of their user needs for statistics
Financial analysts Need for more detailed statistics information and the ability to compare statistics with other
sets of statistics, including from other geographical areas. Easy for the professional financial
analysts to find the available statistics when they are organised and structured according to
key economic and financial concepts using general economic/statistics textbook wording.
Statistics should be presented by providing a high-level overview of core statistics (most
frequently used) with the possibility to drill down into the statistical details. Each statistics
subject section should cross-reference to methodology concepts, guidance notes. Each
statistics subject should present statistics using combinations of descriptive text, graphics
and statistics and it should be easy to “copy and paste” graphs and underlying data.
Research Centers and Think
tanks
In addition to the needs of financial analysts, the research community have a need to work
with long time series and to be able to (i) select, (ii) view, and (iii) create new indicators
(and save the indicators, which have automatically updated values) based on combining
existing statistics, (iv) create tables and graphs, including (v) descriptive statistics and
trends analysis, and (vi) “copy and paste” produced tables/graphs. Researchers should be
able to transform statistics into lower/higher frequencies using basic techniques, to estimate
missing values using the statistics distribution and characteristics of the relevant statistics
series, and to perform seasonal adjustments. The researchers should have the possibility to
easily download statistics series and results in a format that can be read directly by other
professional software packages, and should be able to transpose and order variables and
time dimensions.
Commercial and
institutional data vendors
High volume and frequent data users/vendors are redistributors of statistics and are able to
reach a large community of users, with tools and functionalities which are familiar to the
clients. Data vendors need to extract large numbers of statistical series and their
corresponding metadata. They are interested in all publicly available statistics. The demand
for subject type statistics is fairly well distributed with no specific preference for a specific
type of statistics. Data vendors have expressed the need for a fully automatic download
facility (machine-to-machine) so as to frequently update their own computer systems and
for making statistics available to their large client base.
Journalists and media Time is of importance. Statistics need to be easily presented with a clear overview of what
is new. Is there any news in the latest statistics – is the latest value high, low, above
average? Are we at a turning point, how does the value compare with other countries,
economic areas? What is the story? New releases need to be communicated in advance.
Direct links within press releases to the underlying series. Presenting statistics by combining
descriptive text, statistics and graphs according to economic concepts and subjects.
National and European
politicians and political
advisers & spin doctors
Statistics need to be easily presented visually with a clear overview of the main trends
including examples of the main statistics descriptions and findings. Statistics needs to be
presented in comparable terms (indexed, growth rates indicating absolute values). The
official statistics should be presented in context and offer methodological advice as
applicable.
Universities and higher
educations
The universities and higher educations need statistics and metadata both as part of the
lecturing on economic, financial and statistics matters and for students as part of drafting
reports and thesis. This user group contains therefore two parts; One for lecturers who are
highly educated and theoretically strong though less digital experienced and needs to be
served with statistics and methodological notes. The other group are students of higher
educations who are highly digital native and need support in understanding the
methodology and the variations of statistics. Common for both is the need to work with long
time series and to be able to (i) select, (ii) view, and (iii) download statistics into other
software and with the feasibility to continue updating the statistics without needing to re-
start from scratch.
Banking supervision users This external user group has the common interest to follow the Banking supervisions work
and available statistics. This user group is mainly the banking industry itself but also
external consultancy firms providing advice to the banking industry. The user request for
statistics is different in scope and content from the monetary policy function of the ECB and

9
relates to supervisory related statistics. This market segment can be broken down into sub-
segments once further experience has been gained on their profile, working processes and
specific needs.
Reporting Institutions This is the population of entities which are contributing input to the provision of statistics.
Serving these users helps to ensure the quality of statistics reporting, the willingness of
reporters to contribute and their ability to compare themselves with similar types of reporters
(market shares and changes).
NSIs, IMF, G20, BIS,
OECD and similar
International Organisations
This is likewise an important user community as part of sharing methodology, standards and
reporting templates as to ensure consistency of statistics at international level. The need
relates to sharing large scale machine-to-machine statistics and metadata and to time the
availability of according to detailed release calendars.
2.3 The component – “forms of communication” and use of infographics and visualisations
Statistics has to be understood - before it can be used. A conscious communication strategy is required to fully
utilise the explanatory power of statistics and to gain the ability to select and convey statistical information with
sufficient accuracy, as part of representing official statistics and contributing to crowding out of imperfect
information. Statistics agents have a competitive advantage based on their long-held reputation of providing
independent, factual and credible statistics and they have the knowledge to understand the methodology,
reporting guidelines, economic concepts and estimation methods. This knowledge is a necessary prerequisite
for communicating statistics and indeed need to be neutrally communicated by national and international
statisticians as well as the uncertainty surrounding the statistics values.
Against this background, the way in which statistics are presented is vital in facilitating the users’
understanding of the statistics, and in enhancing their usability: they must be presented according to the needs
of the various user segments. There are ample tools available on the market to assist statisticians in this regard,
such as web-based movies, interactive tables, new graphical tools (info-graphics statistics) and tools enabling
the users to “slice and dice” statistics, touch-screen gadgets, and mobile technology.
However, the fundamental change required is the ability to convey narrative and statistics using common
language that is tailored to the target audience. Each statistics subject field includes methodology concepts and
guidance notes which need to be converted into text, thereby building bridges between statistics language and
common language. It is important to realise that presenting statistics in common language and using references
to the statistical definitions, does not compromise the accuracy of statistics. Statisticians will not be able to
compel professional users and policy-makers to adapt and use statistics terminology and statistics
classifications. Statisticians need to engage externally and contribute with their wealth of knowledge to ensure
that the statistics are used in the right context and are understood, as part of reflecting the structures and
changes in our economy. The use of statistics classification language is a barrier to facilitate users’
understanding and thereby frequent use.
Visualisations and infographics are useful tools to assist the statistician in communicating statistics. Research
shows that approximately 65% of the population are visual learners and the brain has the capacity to process
visual information 60.000 faster than text10. Furthermore 90% of information which reaches the brain is visual.
Therefore presenting statistics visually should therefore be prioritised and recognised within the field of
statistics. Applying visualisation in presenting statistics in context and with descriptive text becomes an
important tool as part of reaching out to external users with narratives. This is a conceptual statistical and
10
www.visualteachingalliance.com
10
complex task – and a misperception to believe it belongs to a technical and IT task. You have to understand the
business for ensuring its objective presentation and to avoid misrepresentation. Within the similar vein, writing
short scripts and producing statistics video and interactive publications are also useful statistical tools.
2.4 The component – “Communication channel”
The individual user groups and key messaging can be reached via different and supplementary communication
channels. Communication channels can be defined as “a medium through which a message is directed to and
exchanged with its intended audience”.
Here again, there is a need for a conceptual change in mind set to acknowledge that the same or similar
statistics can and should be communicated using multiple communication channels. Statistics has to be
communicated using multiple and supplementary or even partially overlapping communication channels. In this
context, it may be seen as a pathway to reach the audience, where statistical information – covering both
statistics and methodology – is conveyed in an understandable and useful manner and where statistical
knowledge can be exchanged. This refers to a two-way communication procedure: on the one hand, using a
medium to convey the information to the intended audiences and, on the other hand, engaging the audience in
the process by allowing interaction, forwarding, linking and the provision of feedback. Feedback is a key
component in allowing for an evaluation of the effectiveness of statistics messages. Ultimately, it provides an
opportunity to give explanations, to assist the users and to take new and corrective communication actions,
where applicable.
The past concept that statisticians can or should control statistics, once released, is part of history. Showing,
sharing and re-using statistics will have an amplifying effect with no orthogonal constraints.
Communication channels have to be fitting, known and used by the respective audience. This implies selecting
a combination of communication channels for each of the market segments, whereby a user can extract
maximum utility from the applied channels. Possible selection criteria are, inter alia:
1. Accessibility (do the target audiences have access to and use the selected medium? Can they reach?
How many would we expect reach using this channel?)
2. Comprehensibility (Is it easy for the target audience to understand?)
3. Reliance (Does the target audiences trust/believe in these channels, and is the target audience familiar
with the channel?)
4. Depth of knowledge (What knowledge is the target audience expected to learn, and what should they
already know? Are there other access barriers?)

11
There is a general paradigm shift in the use of communications channels, moving from traditional
communication channels to using more electronic and digital media channels11
.
Knowledge and understanding of user needs and their working methods are needed to facilitate the integration
of statistics into users regular business processes. For instance, many journalists have data teams that scour the
public space for evidence and statistics that can support the story of the day, and they present this information
in tables and graphs in their respective magazines, newspapers and electronic media. How can statisticians
assist these data teams in using and replicating graphs and tables in telling today’s narrative?
The following table presents a non-exclusive overview of communication channels, differentiating between the
traditional channels and the supplementary electronic channels.
Table 2: Illustration of traditional channels and supplementary digital communication channels
Traditional channels Digital (Electronic) communication channels
Articles, booklets, etc. on
statistics
Electronic publishing (e-reading on electronic
devices)
Paper-based publications –
publication offices
Dedicated internet websites (e.g. statistics portals –
one-stop electronic shop)
Conferences, seminars,
workshops, etc. on statistics
Video, movies, documentaries on statistics (YouTube
channels)
Economic/financial magazines Internet search optimisation, tagging statistics
Press releases Tablets, smartphones and handheld devices
Speeches and briefings Visualisation icons
Press conferences Dynamic visualisation and info-graphics
Newspapers (both mainstream
and specialised)
Widgets to embed/refer to statistics in external
websites and electronic/social media
Posters at specific events Electronic games and cartoons
Radio Electronic replication of statistics graphs and charts,
news
Institutional websites Electronic automatic translation services
Statistics hotline Interactive and searchable databases
Television news Building application programming interface (API) -
Electronic Data Interchange
Regular radio programmes Webinars
Other traditional channels RSS and news feeds, direct e-mailing
Social media, of which (as examples):
Twitter, Wikis, video-sharing websites
Social media related to statistics
Blogs
Other electronic media channels
11
TV and newspapers are mainly used by the older section of the population, and both channels have decreasing
market shares. In this regard, TV channels are focusing on diversifying and segmenting their programmes, catering for
audiences interested in specific areas (sports, news, shopping, cartoons, music, etc.).

12
Further research is needed to better understand the effects of using different communication channels and
presentational forms for statistics and the impact of each method on different cultures and on the behavioral
patterns of users, with the objective of achieving repetitive recognition and frequent use of statistics.
2.5 The component – “Statistics descriptions”
At its best, the statistics users compare and provides cross country analysis between geographical and/or
economics areas. Despite that the same statistics concept is used within international statistics, the methodology
applied at national level may in many cases not fully comply with the international standards and reporting
templates or the standards and reporting templates provide significant discretion for national agents to collect
statistics according to different national practices, which again impacts the comparability of international
statistics.
The impact of these national practices may significantly disturb the comparability of international statistics and
therefore provide an inaccurate picture when comparing country performances, which in turn may contribute to
incorrect policy advice and decisions, with its associated detrimental impact on the soundness of these policy.
Current best practice of statisticians to overcome the comparability deficits is to highlight the methodological
deviations within the meta-data (in the best cases) and to reflect the applied methodology in multiple footnotes
and endnotes.
The difficulties for layman and professional users are that it requires significant statistics knowledge to
understand the different applied methodology and even more difficult to quantify the impact of these different
methodologies. The statisticians are however well placed to apply their statistics knowledge and estimates of
the impact of these methodological differences using various statistics techniques. Therefore a clear need arises
for the statistician to contribute to the process of increasing comparability of national and international statistics
for sound analysis and policy usage. The current risk to mitigate is that today the respective (professional) users
are forced to quantify these differences individually by applying likely different methods and estimates leading
to different results thereby adding confusion or maybe even contradicting messages for policy analysis,
assessments and - making. This in turn will reflect negatively on statistics, erode the trust in statistics and the
institutions responsible for providing official statistics.
3 Modernising the skills of statisticians
As a new field of expertise, the modernisation of statistics would require training and schooling needs and new
resources for initiating and developing the statistics communication function.
The statistics communication function requires capacity building and new skill sets of statisticians. There are at
least four main skills requirements as part fulfilling this statistics communication function;
a. The statistics information intelligence; the ability of the statisticians to abstract from the statistics
production process and to focus on extracting relevant facts and figures in context. This would require good

13
knowledge the statistics business, the methodology, standards and to ability for reflect on finding the core
message and narratives in context and the ability to sensitize and summaries statistics for various users.
b. The design and form of presenting statistics; this relates to the ability of converting statistics into
common language; providing clarity, simplicity and to present the forms and functions of providing
engaging, readable and new design of statistics;
c. The statistics communication; which relates to the ability of the statistician to engage with external
professional users and communicate facts and figures using the social and digital media and to measure the
impact of events and campaigns;
d. The infographics and visualisation skills; the ability of the statistician to map and apply the available
tools and techniques in presenting statistics clearly and factually to external users.
Figure 3: The capacity and skills sets requirements for communicating statistics
The statisticians have the fundamental statistics skills and knowledge and need additional skills to fulfil the
objective of facilitating users in using quality statistics, whereby crowding out the mass of low and un-validated
available statistics.
4 Preliminary conclusions
The communication function of statistics is an important part of the statistics production process and needs to
be integrated as part of modernising statistics. The objective is to facilitate the respective external professional
users in understanding, using and sharing national and international statistics while being transparently
informed of methodology and its possible impact on analytical and policy recommendations.
There is a growing need not only to safeguard actual statistics - the facts and figures which describes the
structures and dynamics of our society – but also the continuous observed reputational loss and trust in

14
statistics, in the statistics profession and in those statistical agents engaged in developing methodology and
producing reliable and comparable national and international statistics, for sound and sustainable policy
making.
The function of communicating statistics could be one option to revert the current deteriorating trend by using
statistics as a pro-active and strategic asset collectively; by national and international statistics agents.
Statistics needs to be proactively serviced to the professional user communities with relevant statistics and
methodology and to bring statistics closer to citizens. Communicating statistics is a fundamental and legitimate
responsibility as part of the transparency and accountability objective of institutions engaged in official
statistics and as part of crowding out low quality statistics and sentiment based information.
Related Documents