REPORT TRIAL OF THE ENGAGEMENT MATRIX - COMPONENT 2 THE RELIABILITY AND VALIDITY OF THE ENGAGEMENT MATRIX Prepared for the South Australian Department of Education and Children’s Services (DECS) By the Australian Council for Educational Research Petra Lietz, Mollie Tobin 5 May 2011

Welcome message from author
This document is posted to help you gain knowledge. Please leave a comment to let me know what you think about it! Share it to your friends and learn new things together.
Transcript

REPORT
TRIAL OF THE ENGAGEMENT MATRIX - COMPONENT 2
THE RELIABILITY AND VALIDITY OF THE ENGAGEMENT MATRIX
Prepared for the
South Australian
Department of Education and Children’s Services (DECS)
By the
Australian Council for Educational Research
Petra Lietz, Mollie Tobin
5 May 2011

Trial of Engagement Matrix (EM) – Component 2 – Reliability and validity of the EM 1
Contact details Dr Petra Lietz Principal Research Fellow Australian Council for Educational Research Address: Adelaide Office, Level 3, 97 Pirie Street, Adelaide, S.A. 5000 T. (08) 7129 4493 F. (08) 8232 4446 E. [email protected]

Trial of Engagement Matrix (EM) – Component 2 – Reliability and validity of the EM 2
EXECUTIVE SUMMARY ................................................................................. 3
BACKGROUND AND INTRODUCTION.......................................................... 5
THE ONLINE SURVEY.................................................................................... 6
EM Statements .................................................................................................................................. 6
Survey Design .................................................................................................................................... 7
Participants and Administration ........................................................................................................ 7
Preparation for Data Analyses ........................................................................................................... 9
RESULTS ...................................................................................................... 10
Preliminary analysis: Factor analyses ............................................................................................... 11 Factor analysis postulating three dimensions................................................................................ 12 One factor analysis for each dimension ........................................................................................ 13
Main analyses: Rasch modelling....................................................................................................... 15 Item-Rest Correlation and Item-Total Correlation ......................................................................... 18 Point-biserial ................................................................................................................................ 18 Plausible Value Average ............................................................................................................... 19
Further Analyses: Construct Validity ................................................................................................ 22
CONCLUSION ............................................................................................... 24
REFERENCES .............................................................................................. 26
APPENDIX 1 DISAGGREGATED AND REVISED STATEMENTS BY DIMENSION ... 27
APPENDIX 2 TEXT OF ONLINE SURVEY ................................................................. 36
APPENDIX 3 RESULTS OF FACTOR ANALYSES .................................................... 42
APPENDIX 4 MULTIDIMENSIONAL PARTIAL CREDIT MODEL .............................. 54
APPENDIX 5 ONLINE SURVEY COMMENTS ........................................................... 64

Trial of Engagement Matrix (EM) – Component 2 – Reliability and validity of the EM 3
Trial of the Engagement Matrix - Component 2 The Reliability and Validity of the Engagement Matrix
EXECUTIVE SUMMARY
The trial of the engagement matrix (EM) consisted of two components. While the first component evaluated the effectiveness of the EM labels, the second component seeks to examine empirically the reliability, validity and dimensionality of the EM by way of various analyses, particularly Rasch modelling. This report covers the second component. Results of the EM trial‟s first component found that the labels that were used by DECS in November 2010 worked well at the lower and middle points of the scale. At the higher end of the scale a change of terms was proposed. This resulted in the suggested labels: „Significantly disengaged‟, „Partly disengaged‟, „Moderately engaged‟, „Very engaged‟ and „Extremely engaged‟. The overarching issue to be addressed in this second component concerned the reliability, validity and dimensionality of the EM. To this end, the statements used in the EM to describe the different levels of engagement and disengagement were further refined and administered by way of an online survey to more than 300 ICAN/FLO staff and teachers. Responses were analysed to ascertain whether the statements a) could be grouped together along the three assumed underlying dimensions („Relationships‟, „Involvement in learning‟ and „Well-being‟ and if also these dimensions were related to a common underlying trait, namely „Engagement‟, b) measured these dimensions reliably, c) could differentiate between students with different levels of engagement and d) worked to describe five levels of engagement. In addition, an analysis of construct validity was conducted whereby expectations of case managers regarding the likely amount of time young people would be involved in ICAN/FLO activities were related to subsequent EM ratings of these young people. The findings from this second component can be summarised as follows:
Results of the factor analysis indicate that there is one strong factor underlying all statements in the EM.
When the statements for each of the three dimensions – „Relationships‟, „Well-being‟, and „Involvement in learning‟ – are analysed separately results show that a) the large majority of statements relate well to the dimension and b) statements describing lower levels of engagement relate negatively and statements describing higher engagement levels relate positively to the dimension.
Results of the Rasch modelling show that the three-dimensional partial credit model fits the data better than the one-dimensional partial credit model. This supports the assumption that „Engagement‟ can be measured along three dimensions, namely „Relationships‟, „Involvement in learning‟ and „Well-being‟.

Trial of Engagement Matrix (EM) – Component 2 – Reliability and validity of the EM 4
These three dimensions are so highly correlated that an overall „Engagement‟ scale can be said to be underlying the data. This result supports also the validity of the Engagement matrix as it indicates that the theoretically assumed constructs underlying engagement are indeed related empirically.
The reliability with which the three dimensions and the overall Engagement scale are measured is very high.
In general, the EM statements describe the spectrum of engagement quite well. Some findings suggest that the statements describing the two lowest levels of engagement may not always be in the correct order. However, this finding might also be due to a reluctance of ICAN/FLO staff to choose statements that describe young people in the lowest category of engagement. Some statements describing the second highest level of engagement are not significantly related to the underlying scale which suggests that some of these statements might be reconsidered.
As regards construct validity, a significant, albeit small, positive relationship was found between the expectations of case managers regarding the likely amount of time young people would be involved in ICAN/FLO activities and subsequent EM ratings of these young people.

Trial of Engagement Matrix (EM) – Component 2 – Reliability and validity of the EM 5
BACKGROUND AND INTRODUCTION The Engagement Matrix (EM) was designed by the Department of Education and Children‟s Services in South Australia to measure engagement levels of young people enrolled in the Innovative Community Action Networks (ICAN)/ Flexible Learning Options (FLO) program once a term. ICAN schools work with young people (year 6–age 19), families, community groups, businesses and different levels of government to encourage young people to finish their secondary education. Flexible Learning Options (FLO) was first introduced in 2006 as an enrolment option in ICAN schools which is funded by DECS. FLO is an approach that is more flexible than the traditional full-time enrolment in school to support young people most at risk to successfully complete their secondary education (DECS, 2010). In its current form, the EM is a high-level inference instrument that requires raters to provide one overall rating of a student‟s engagement in (a) „Relationships‟ (b) „Involvement in learning‟ and (c) „Well-being‟, along five levels of engagement. Each of the five levels contains explanatory sentences describing possible behaviours and affective characteristics of the young person that are assumed to be associated with that level of engagement. The potential expanded application of the EM as a rating, or monitoring tool to a wider range of young people and raters in ICAN/FLO necessitates an examination of the EM‟s theoretical assumptions. To this end, ACER designed an online survey to examine the assumed dimensions, levels of engagement and explanatory sentences. Please note that throughout the report what DECS defines as „domain‟ will be referred to as „dimension‟. In summary, the objectives of Component 2 of the Engagement Matrix Trial are to examine the following characteristics of the EM and its descriptive statements:
1. Dimensionality: Can the statements be grouped together along the three assumed underlying dimensions („Relationships‟, „Involvement in learning‟ and „Well-being‟? Also, are these dimensions related to a common underlying trait, namely „Engagement‟?
2. Reliability: Can these dimensions and the underlying trait be measured reliably?
3. Differentiation: Does the EM and its constituent aspects differentiate between students with different levels of engagement?
4. Coverage: Do the EM statements describe five levels of engagement? 5. Validity: What is the construct validity of the EM?
Trial of Engagement Matrix (EM) – Component 2 – Reliability and validity of the EM 6
THE ONLINE SURVEY EM Statements Rasch modelling (Rasch, 1966) is an appropriate method to address the dimensionality, reliability, differentiation and coverage of the EM by way of examining the explanatory sentences. The Rasch model considers the response process as one of ordered classification. This is in line with the EM providing a classification system which implies that each successive category assumes that the previous category has been fulfilled, and that these categories or labels remain constant across the EM statements. The EM presents a bipolar scale from „disengagement‟ to „engagement‟ (see report for component one). The statements assume that the specific behaviour or characteristic described has been fulfilled moving from „Partly disengaged‟ to „Significantly disengaged‟. Likewise, the statements assume that a specific behaviour or characteristic has been fulfilled moving from „Moderately engaged‟ to „Extremely engaged‟. Therefore, ACER designed an online survey to examine how current and potential raters use the EM to rate actual young people. To undertake Rasch modelling using online survey data, the explanatory sentences in the EM were transformed into a list of separate statements that survey participants could use to rate a young person. In its current state, EM explanatory sentences are grouped together for each level of engagement by dimension and raters give young people one, holistic rating for each dimension. The explanatory sentences for each level of engagement were organised across levels of engagement according to conceptually similar topics, or „aspects‟. An aspect refers to any conceptualised behaviour or characteristic assumed to be related to a dimension. For example, the aspect „Goal-setting‟ is assumed to relate to the dimension „Well-being‟. ACER reduced explanatory sentences to one statement per level of engagement for an aspect. For example, the aspect „Emotional condition‟ in „Well-being‟ contains five statements, one per each level of engagement. The original EM explanatory sentences either presented descriptions of different behaviours or connoted different degrees of the same behaviour or characteristic. For example, some aspects presented statements with different described behaviours per level of engagement, assuming that the previous level has been fulfilled and a new behaviour added: „Completes work in most fields, but may need extra time‟ to „Actively engages with learning, often going beyond the set task to explore further‟. Other aspects presented statements with varying degrees of one described behaviour or characteristic: „Has loose connections with one or two community groups‟ to „Has some links with several community groups‟. If a statement was missing for a level of engagement, a statement was produced using similar language and structure as those statements belonging to the same aspect. In this way and with several iterations a list of revised statements to be used in the online survey was produced with a total of 90 statements with five statements covering one aspect resulting in a total of 18 aspects being

Trial of Engagement Matrix (EM) – Component 2 – Reliability and validity of the EM 7
covered. Twenty statements covered four aspects for the „Relationships‟ dimension, 35 statements covered seven aspects for „Involvement in learning‟, and 35 statements dealt with seven aspects for „Well-being‟. The original and revised statements are provided in Appendix 1. Survey Design
In order to obtain information regarding the reliability and validity of the EM, the objectives of the online survey were to obtain information from a purposeful sample regarding the assumed dimensions, levels of engagement and statements in the EM. The full text of the online survey is provided in Appendix 2. To examine the EM using Rasch modelling, the online survey asked respondents to rate a young person well-known to them, using the 90 statements. This young person was to be known from term four 2010 or currently-known from term one 2011 so that ratings were from recent knowledge of the young person. Young people were to be between year six and age 19. The online survey asked participants to report the gender and school year level of the young person to prompt the respondent to think of an actual young person and aid recall. In order to ensure that data were collected regarding the statements across all levels of engagement, DECS and ACER selected a purposeful sample of potential participants who would have contact with young people across the spectrum of engagement. All Case Managers and ICAN School Staff employed in the ICAN/FLO programs were invited to participate in the online survey to cover the lower–middle levels of engagement. To cover the middle–
upper levels of engagement, DECS and ACER invited teachers who teach students from years six to 12, to participate in the online survey. These teachers were instructed to select students who are not disengaged from school. The online survey presented respondents with the 90 statements, split over five screens. The respondents were asked to rate, using a 5 point Likert scale, the degree to which they agreed that the statement applied to the young person that they had selected. The response scale ranged from „Strongly disagree‟, „Disagree‟, „Neither agree nor disagree‟, „Agree‟ to „Strongly agree‟. Statements were presented according to dimension and aspect by level of engagement, always proceeding from „Significantly disengaged‟ to „Extremely engaged‟. Statements for the „Relationships‟ dimension were presented first and followed by statements for „Involvement in learning‟ and „Well-being‟. At the end of the survey, respondents were given the opportunity to provide feedback regarding the EM or the survey by way of an open-ended question. Participants and Administration To cover the lower–middle spectrum of engagement, DECS invited 101 Case
Mangers in the ICAN/FLO programs to participate as well as 83 ICAN School Staff to participate in the online survey. Case managers and ICAN Staff were

Trial of Engagement Matrix (EM) – Component 2 – Reliability and validity of the EM 8
invited to rate two different young people, to augment the amount of data collected for statements at lower–middle levels of engagement. DECS invited
383 teachers from 12 different primary and secondary schools to participate in the online survey. ACER also augmented the teacher sample using its own networks. In total there were 683 potential survey responses. ACER monitored data collection. ACER electronically sent the identified participants the online survey address and included unique identification numbers to monitor survey completion. Invited respondents were able to access the online survey from 25 February 2011 to 9 March 2011. ACER sent electronic reminders to all participants who had not completed the survey to encourage participation. DECS also followed up non-responses using their own professional networks to encourage participation. Participants were able to login and complete the survey at their convenience. The date of access was extended to 21 March 2011 to collect a sufficient number of responses for analyses. Data were cleaned and checked for consistency. Respondents who did not identify their employed position were supplemented in the dataset using the unique identification numbers. Across the 90 statements, the number of responses per statement ranged from 305 to 312 responses. Each statement received ratings using the whole scale of agreement, from „Strongly disagree‟ to „Strongly agree‟. However, for several analyses responses to the 90 statements were combined into responses to 18 aspects by selecting that statement which had received the highest engagement rating by a respondent for each aspect (see further explanations in section on „Preparation for data analysis‟ below). Twenty-four respondents were deleted from the sample as they did not contain any useable data. Of the 683 potential survey responses, there were 311 submitted surveys (and an additional eight surveys that were started but never submitted but which contained useable data) which is a response rate of 46.7 per cent. Considering all 319 responses, there were 168 responses combined from Case Managers and ICAN staff, which is 52.7 per cent of the total responses. There were 151 responses received from teachers, which is 47.3 per cent of the sample. Of the respondents that reported the gender of the young person that they rated (N=313), 44.4 per cent of the young people rated was reported to be female (N=139) and 55.6 percent of the young people rated was reported to be male. Case Managers, ICAN Staff and Teachers did not largely differ in the ratio of females and males selected to rate. Of the respondents that reported the year level of the young person whom they rated (N= 313), 4.5 per cent of the young people rated was reported to be in year six, 5.8 percent in year seven, 8.9 per cent in year eight, 12.8 per cent in year nine, 18.8 per cent in year 10, 27.2 per cent in year 11 and 22.0 per cent in year 12. The data regarding the EM statements is primarily drawn from evaluations of young people in upper secondary school. The ICAN/FLO
Trial of Engagement Matrix (EM) – Component 2 – Reliability and validity of the EM 9
programs primarily target young people in secondary school. This distribution of year levels for young people rated may also be an artefact of the sample, as the Case Managers, ICAN Staff and Teachers involved primarily work in secondary schools.
Responses to the open-ended question requesting feed-back at the end of the survey are summarised in Appendix 5. Preparation for Data Analyses
Initially, analyses were intended to be undertaken with the 90 statements to which responses were sought in the online survey. These 90 statements consisted of five statements for each of the 18 aspects. Four of these 18 aspects concerned the „Relationships‟ dimension while seven aspects related to the „Well-being‟ and „Involvement in learning‟ dimensions respectively.
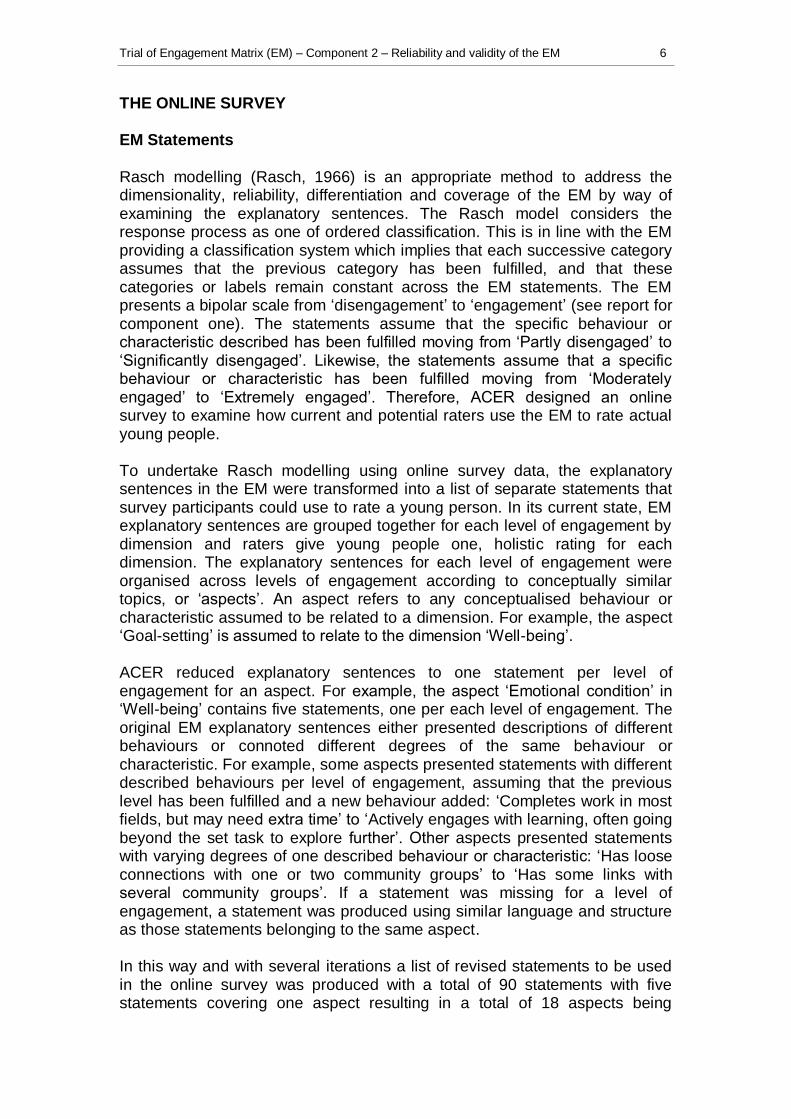
However, the lower than anticipated response rate resulted in a sample size which was lower than required for some of the analyses. In order to still undertake the full range of analyses, the 90 statements were brought back to 18 items which corresponded to the 18 aspects. This meant that for each aspect the statement that had received the highest rating by a respondent was selected as representing this respondent‟s rating of a young person on this aspect. Where a respondent had given the highest rating for several statements, the statement which reflected the higher level of engagement was selected. Below is an example of this recoding:
Respondent A
Original responses to statements relating to aspect „Peer connections‟ of dimension „Relationships‟:
Statement Strongly disagree Disagree
Neither agree nor disagree Agree
Strongly agree
Is withdrawn from others.
Connects with a small group of peers with similar views.
Has connections to a small group of peers with a range of life views
Usually open and engages with many other people.
Is nearly always open to others and relates very well with a wide range of people.

Trial of Engagement Matrix (EM) – Component 2 – Reliability and validity of the EM 10
The response that was selected for the recode was „Usually open and engages with many other people‟.
Respondent B
Original responses to statements relating to aspect „Peer connections‟ of dimension „Relationships‟:
Statement Strongly disagree Disagree
Neither agree nor disagree Agree
Strongly agree
Is withdrawn from others.
Connects with a small group of peers with similar views.
Has connections to a small group of peers with a range of life views
Usually open and engages with many other people.
Is nearly always open to others and relates very well with a wide range of people.
Selected response for recode: „Is nearly always open to others and relates very well with a wide range of people‟.
As a result, two data sets were available for analyses: One with the original responses to 90 items and the recoded one with 18 items. Please note that in the subsequent analyses for factor analyses, „statements‟ and „items‟ will be used interchangeably. For the Rasch modelling, „aspects‟ and „items‟ will be used interchangeably.
RESULTS The analyses were conducted in two steps. The first step was to undertake factors analyses to obtain some preliminary evidence regarding the dimensionality and relationship between EM statements and the three dimensions. The second step involved Rasch modelling in order to confirm the dimensionality, levels and identify potential items for improvement.
Results of the factor analyses are reported first followed by results of the Rasch modelling.

Trial of Engagement Matrix (EM) – Component 2 – Reliability and validity of the EM 11
Preliminary analysis: Factor analyses
Factor analyses were undertaken to obtain some preliminary evidence regarding the dimensionality of the EM and the extent to which the statements used in the EM reflect the underlying dimensions. More specifically, the questions to be addressed by the factor analyses were as follows:
1. How many factors (i.e. dimensions) underlie the EM? Do all statements relating to a dimension reflect this dimension well?
2. Do the statements that describe lower levels of engagement relate negatively to the dimension and statements describing higher levels of engagement positively to the dimension?
It should be noted that in terms of the objectives of the study, these analyses explored objective 1, the dimensionality of the EM, and objective 4, coverage. In order to address these questions, the following factor analyses were undertaken:
1. A factor analysis postulating three factors (i.e. the three dimensions) whereby it was hypothesised that the 90 statements relating to each dimension would be most strongly related to (i.e. “load on”) that dimension. In addition, a factor analysis postulating three factors whereby it was hypothesised that the 18 aspects relating to each dimension would be most strongly related to that dimension.
2. Three factor analyses, one for each dimension, were undertaken whereby it was hypothesised that the five statements used to describe the different aspects within each dimension would be related to the dimension as follows:
a. The two statements describing the two lower levels of engagement (i.e. „significantly disengaged‟ and „partly disengaged‟) would be related negatively to the dimension.
b. The two statements describing the two upper levels of engagement (i.e. „very engaged‟ and „extremely engaged‟) would be related positively to the dimension.
c. The middle statement (i.e. the one describing „moderately engaged‟) would also be related positively to the dimension but less so than the statements describing the two upper levels of engagement.
It should be noted that the term „factor analysis‟ is used throughout this report although a “principal component extraction” method was used. It is for this reason that the output presented Appendix 3 refers to „components‟ while the text in the report refers to „factors‟. While it is acknowledged that there are differences between a principal component and factor analysis, this report follows the convention which subsumes the technique of principal component analysis under the term „factor analysis‟ (e.g. Coakes and Steed, 1996; Pallant, 2005; Sarantakos, 1998).
Results of the factor analyses are discussed in the following section.

Trial of Engagement Matrix (EM) – Component 2 – Reliability and validity of the EM 12
Factor analysis postulating three dimensions
In line with the design of the EM, three factors were assumed to underlie the statements in the EM describing different behaviours of young people, namely „Relationships‟, „Involvement in learning‟ and „Well-being‟. Therefore, in an initial analysis, all 90 statements were included in a factor analysis which assumed three factors and allowed these factors to be correlated („oblimin‟ rotation). Results are shown in Appendix 3 Part 1.
The first point to note is that the first factor extracts nearly half of the variance (49.58%). In other words, this one factor accounts for nearly half the differences in engagement of the young people who were rated by ICAN/FLO staff and teachers. The second and third factor, in comparison, account for much less variance with about six (5.7%) and three per cent (2.9%) respectively. It should also be noted that the fourth factor only accounts for a little less of the variance (2.4%) than the third factor. This means that it would be quite arbitrary to cut off at three factors.
The scree plot tells a similar story in that it reveals a very strong first factor and then, maybe, a second factor. The usual cut-off point for the number of factors to be extracted is usually the point where the scree line becomes fairly horizontal. While there is some evidence for a second factor, there is no theoretical support for a two-factor solution (i.e. two dimensions) based on the design of the EM.
The examination of the structure matrix also provides little, if any support, for a three factor solution. If there were three underlying factors, one would expect that individual items would show relatively stronger loadings for one factor than on the other two factors. Also, given the design of the EM, one would expect the first 20 items, which relate to the dimension of „Relationships‟ to load on one factor (not necessarily the first factor but one of the three factors), the next 35 items to load on another factor and the next 35 items to load on the third factor. However, no such structure emerges.
As the ratio of number of cases per item was lower than desirable (i.e. 5:1) this analysis was repeated using the 18 items in which responses for the five statements per aspects were combined. Results are shown in Appendix 3 Part 2).
These results provide further evidence for a strong first factor. Indeed, in this analysis more than 60 per cent of the variance is accounted for by this first factor (61.7%). The second and third factor each account for a similar amount as in the previous analysis (i.e. 5% and 4% respectively). However, in this analysis the corresponding eigenvalues for these factors of 0.9 and 0.7 indicate that these factors explain less variance than an individual item would explain. Thus, these two factors do not comply with the aim of a factor analysis which is a data reduction technique intended to combine what individual items share into a factor.
The structure matrix for this analysis shows no characteristic of the expected pattern. The expected pattern would involve the first four items designed to describe behaviours regarding „Relationships‟ relating to one factor, the next
Trial of Engagement Matrix (EM) – Component 2 – Reliability and validity of the EM 13
seven items designed to describe behaviours regarding „Well-being‟ relating to another factor and the final seven items designed to describe behaviours regarding „Involvement in learning‟. However, the results show reasonably high loadings for nearly all items on two factors and the items that load on the third factors being related to two different dimensions, namely „Relationships‟ and „Involvement in learning‟.
In summary, these results indicate that there is one strong factor underlying all statements in the EM.
One factor analysis for each dimension
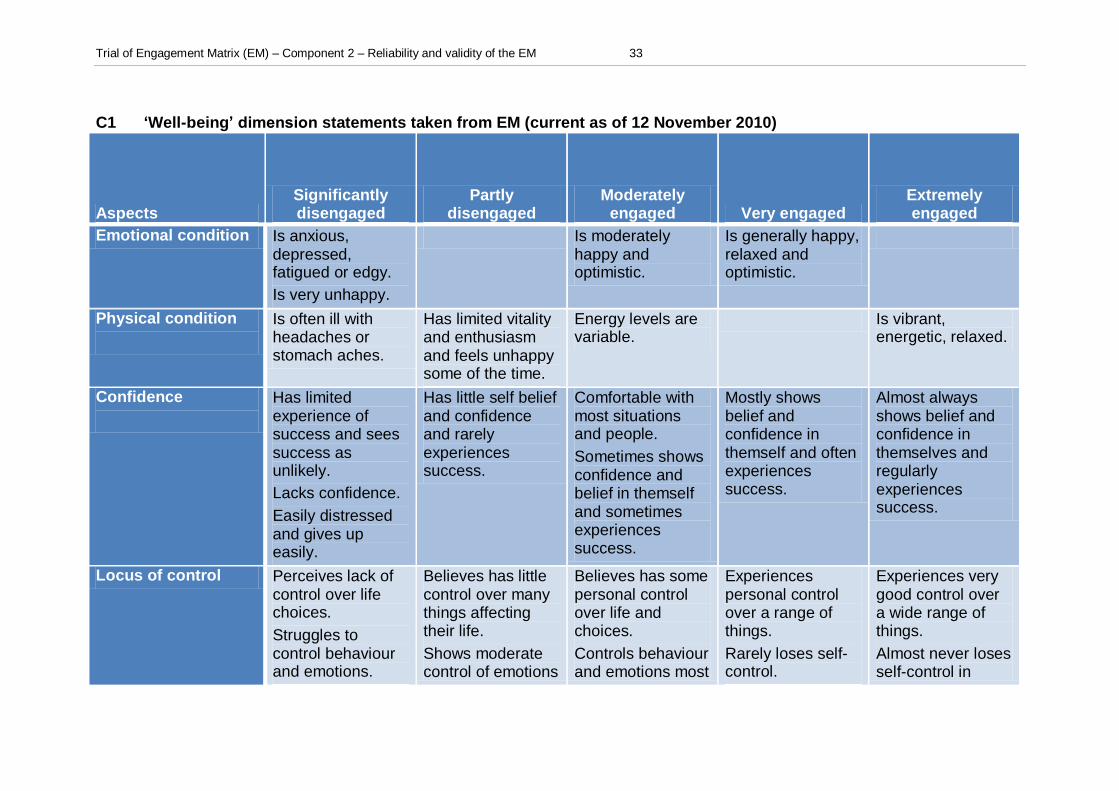
The EM was designed in such a way that each dimension was broken down into different aspects for which a range of behaviours reflecting different levels of engagement on these aspects could be specified by way of statements. For the „Relationships‟ dimension, four aspects were defined, namely „Integration into community‟, „Peer connections‟, „Cooperation‟ and „Empathy‟. For the „Involvement in learning‟ dimension, seven aspects were defined, namely „Attention/Memory‟, „Involvement in learning‟, „Literacy/Numeracy levels‟, „Resilience‟, „Class participation‟, „Satisfaction in work‟ and „Dealing with feedback‟. For the „Well-being‟ dimension, seven aspects were defined, namely „Emotional condition‟, „Physical condition‟, „Confidence‟, „Locus of control‟, „Goal setting, „Dealing with change‟ and „Organisation. For each aspect, in turn, five statements were specified that described the five levels of engagement from least engaged (i.e. „Significantly disengaged‟ to most engaged (i.e. „Extremely engaged‟). These statements are given in Appendix 1 Tables A2 for „Relationships‟, B2 for ‟Involvement in learning‟ and C2 for „Well-being‟.
Three factor analyses, one for each dimension, were undertaken to examine the following hypotheses. First, it was hypothesised that all statements within one dimension (i.e. 20 for „Relationships‟, 35 for „Involvement in learning‟ and 35 for „Well-being‟) would relate reasonably strongly to the dimension. Given the sample size of 319, a significant factor loading would be required to exceed 0.32 (Hair et al., 1995). In addition, it was hypothesised that the five statements used to describe the different aspects within each dimension would be related to the dimension as follows:
1. The two statements describing the two lower levels of engagement (i.e. „significantly disengaged‟ and „partly disengaged‟) would be related negatively to the dimension.
2. The two statements describing the two upper levels of engagement (i.e. „very engaged‟ and „extremely engaged‟) would be related positively to the dimension.
3. The middle statement (i.e. the one describing „moderately engaged‟) would also be related positively to the dimension but less so than the statements describing the two upper levels of engagement.
Results of the each of the three factor analyses are given in Appendix 3 Part 3 for „Relationships‟, Appendix 3 Part 4 for „Involvement in learning„ and Appendix 3 Part 5 for „Well-being‟.

Trial of Engagement Matrix (EM) – Component 2 – Reliability and validity of the EM 14
Results of the one factor analysis for the „Relationships‟ dimension show that 18 of the 20 statements load satisfactorily or highly on the factor. The two exceptions where loadings are below 0.32 are the statement ‟Has loose connections with one or two community groups.‟ under the aspect „Integration into community‟ and „Connects with a small group of peers with similar views.‟ As regards the direction of the relationship between the statements and the dimension the results are as hypothesised. Within each aspect, the first two statements which describe the lowest two levels of engagement are related negatively to the factor as can be seen by the negative signs of the factor loading. In contrast, the last two statements within each aspect are related positively to the underlying factor as is shown by the positive sign of the factor loading.
For the middle category, three statements are positively linked to the dimension while one is negatively linked. The one that is negatively linked is „Generally cooperates with others, but is occasionally disruptive‟. It is probably the word „disruptive‟ that makes this middle statement more negative in terms of engagement.
Results of the one factor analysis for the „Involvement in learning‟ dimension show that 31 of the 35 statements load satisfactorily or highly on the factor. The statements for which the loadings are below 0.32 are „Completes work in most fields, but may need extra time.‟, „Can manage challenges with support.‟, „Responds to some questions in her or his field of interest‟ and „Shows some capacity for accepting feedback.‟ It should be noted that all four statements are „middle‟ statements. Therefore, one explanation could be that these statements are very „neutral‟ therefore not relating systematically to the underlying dimension.
The remaining three middle statements, however, are strongly and positively related to the dimension. This provides some evidence to support their labelling as „moderately engaged‟ that is already along the more positive side of the disengagement-engagement continuum.
Results of the one factor analysis for the „Well-being‟ dimension show that 30 of the 35 statements load satisfactorily or highly on the factor. Again all five statements for which the loadings are below 0.32 are middle category statements. This seems to support further the possibility that these statements are actually „neutral‟ as responses to these statements are not systematically linked to the underlying dimension.
In summary, the majority of statements relate to the dimension for which they were designed very well. Only eleven of the 90 statements show loadings that are lower than is desirable. Nine of them are statements describing the middle category. This seems to suggest that these statements are not systematically related to the underlying dimension. However, this is not in contradiction to the logic underlying the structure of the statements as the middle category can be chosen by raters who have rated a young person more positively or more negatively on other statements.

Trial of Engagement Matrix (EM) – Component 2 – Reliability and validity of the EM 15
Main analyses: Rasch modelling The preliminary factor analyses were followed by the Rasch modelling in order to answer the following questions: At the level of the EM matrix as a whole:
1. Are three dimensions underlying the EM matrix? How well is each item (i.e. aspect) related to the trait of interest, namely „Engagement‟?
2. How reliable is the EM matrix overall? If three dimensions can be identified, how reliably can they be measured?
At the level of the item (i.e. aspect) 3. How well does each item (i.e. aspect) discriminate between young
people who have higher and lower levels of engagement? 4. Do the statements within each item (i.e. aspect) describe a range of
behaviours from lower levels of engagement to higher levels of engagement?
It should be noted that due to the computational demands of the Rasch modelling, all analyses for which results are reported in this section were undertaken with the 18 items (i.e. 18 aspects; see Section „Preparation for data analyses‟ above for further details). The Rasch analyses were undertaken using Conquest (Wu, Adams, Wilson & Haldane, 2007). As the first step, analyses were undertaken aimed at identifying the model which reflected the data best. The data involved responses to polytomously scored items in that agreement with statements describing higher levels of engagement were scored higher than agreement with statements describing lower levels of engagement. During the recoding of the data (see Section „Preparation for data analyses‟ above), responses were combined so that for each aspect that of the five statements was selected that had the highest level of agreement by the respondent. In this way, in line with the assumptions of the EM, statements describing higher levels of engagement should receive a higher score than statements describing lower levels of engagement. Therefore, within each aspect, if the statement which described the lowest level of engagement was picked by a rater, this was scored as a „1‟, the statement describing the second lowest level of engagement was scored as a „2‟ and so on until the statement describing the highest level of engagement which was scored as a „5‟. This scoring method reflected the five categories on the EM for which the statements had been originally designed. To accommodate polytomously scored items, the rating scale model (Andrich, 1978; Wright and Masters, 1982) and the partial credit model (Masters, 1982; Wright and Masters, 1982) were developed as extensions to Rasch‟s simple logistic model (1966). While the partial credit model is often applied to cognitive skills data, the rating scale model is frequently applied to Likert-type data. However, nothing in the algorithms underlying the two models precludes them from being applied to the other type of data. Therefore, comparative analyses tend to be run to identify the model that fit the data best (see, for example, Wu, Adams, Wilson & Haldane, 2007).

Trial of Engagement Matrix (EM) – Component 2 – Reliability and validity of the EM 16
In addition to address the type of model that reflected the data best, the dimensionality was examined. This was done in order to identify whether a model assuming three dimensions – „Relationships‟, „Involvement in learning‟ and „Well-being‟ - or one dimension – „Overall Engagement - would best reflect the data. This resulted in four models being defined and run. Table 1 Comparison of alternative models – Model type and dimensionality
Difference
Model Deviance Estimated Parameters
Deviance Estimated Parameters
Critical Chi-square value (.01)
1 Three dimensional rating scale model
12982.95 27 (to M3) 30.61 (to M3) 5 15.09
2 Three dimensional partial credit model
12485.40 78 (to M4) 50.80 (to M4) 5 15.09
3 One dimensional rating scale model
13013.56 22
4 One dimensional partial credit model
12536.20 73 (to M1) 446.75 (to M1) 46 21.20
A formal statistical test of the relative fit of alternative models can be undertaken by comparing the deviance whereby a lower deviance indicates a better fit of the model to the data. It can be seen in Table 1 that Model 2 has the lowest deviance (12485.40). However, in order for this model to be judged as having the best fit, it has to be taken into account that it is less parsimonious and that it has to estimate five more parameters than the next best fitting model, Model 4. Therefore, a chi-square test has to be conducted which examines whether the decrease in deviance (i.e. 50.80) is significant given the change in degrees of freedom (i.e. 5). As the critical Chi-square value is lower (i.e. 15.09) than the comparison value of the decrease in deviance, this change in deviance can be considered significant (Kenkel, 1996). Thus, model 2 can be concluded to provide the best fit to the data. This means that the partial credit model provides a better fit to the data than the rating scale which is frequently used for Likert-type scales. In addition, the partial credit model which assumes three dimensions provides a better fit to the data than the partial credit model which assumes one dimension only. Once the best fitting model was identified, this model‟s results were used to address the question raised above. The output for this model is presented in Appendix 4. The first piece of interesting information in the output relates to the reliability with which each of the dimensions as well as the overall scale – „Engagement‟ – could be measured and the correlations between dimensions. These are presented in Table 2.

Trial of Engagement Matrix (EM) – Component 2 – Reliability and validity of the EM 17
Table 2 Reliabilities and Correlations
RELIABILITY COEFFICIENTS
------------------------
Coefficient Alpha: 0.94
Dimension_1: Relationships: EAP/PV RELIABILITY: 0.90
------------------------
Dimension_2: Learning: EAP/PV RELIABILITY: 0.92
------------------------
Dimension_3: Well-being:EAP/PV RELIABILITY: 0.91
Correlation Estimates:
Rel’nships Learning Well-being
Dimension_1: Rel’nships 1.00
Dimension_2: Learning 0.97 1.00
Dimension_3: Well-being 0.97 0.98 1.00
As can be seen in Table 2, the reliability of the overall underlying trait, engagement , is very high with a Cronbach‟s alpha of 0.94. The reliabilities of each of the three dimensions are also high with 0.90 for the „Relationships‟ dimension, 0.92 for the „Involvement in learning‟ dimension and 0.91 for the „Well-being‟ dimension. The correlations between the three dimensions are also very high which indicates that young people who are rated as having high levels of engagement in the „Relationships‟ dimension also have a high level of engagement in „Involvement in learning‟ and „Well-being‟. This is also evidence that a strong underlying common trait – „Engagement‟ – is being measured. In Rasch modelling, the Infit mean square can be regarded as representation of how well an item discriminates between people (Masters, 1988). The ideal value for the Infit mean square is one although a range from 0.80 to 1.20 is considered acceptable, particularly where the sample size is relatively small as is the case in this study. Positive values indicate items discriminate less than required whereas negative values indicate items that discriminate more than required. As can be seen by the infit mean square statistics (column heading „MNSQ‟ in the part of the output in Appendix 4 entitled „Table of response model parameter estimates‟) fitting into the desired range most items discriminate well between young people with higher and lower levels of engagement. Only the first item (i.e. aspect) „Integration into Community‟ which is part of the „Relationships‟ dimension (infit mean square=1.39) and the seventh item „Literacy/Numeracy levels‟ (infit mean square=1.28) discriminate less than is desirable. A reason for this could be that it might be hard for raters to know how well the young people are connected into the community. In addition, for case managers, a precise location of the young person in terms of his or her literacy and numeracy levels might be difficult given that they see the young people mainly outside the formal learning contexts.

Trial of Engagement Matrix (EM) – Component 2 – Reliability and validity of the EM 18
The next table of interest in the output in Appendix 4 contains the „generalised item analysis‟. For each item (i.e. aspect), it provides the number of cases, the correlation between this item and the scale if it consisted of only the other 17 items („Item-Rest Cor.‟), the correlation between this item and the scale („Item-Total Cor.‟) and the weighted infit mean square. Below this, information is provided concerning each of the five statements that describe an aspect. Labels 1, 2, 3, 4, and 5 correspond to the five statements ranging from „1‟ as the statement that describes the lowest level of engagement to „5‟ describing the highest level of engagement. Corresponding to these labels, scores were assigned so that increasing scores meant higher levels of engagement. The „Count‟ column is the frequency with which a statement was chosen, followed by the „% of total‟ column. The next column entitled „Pt bis‟ provides information regarding the point-biserial correlation which is an indicator of the direction and strength of the link between this statement and the underlying trait (i.e. „Engagement‟). The following column entitled „t(p)‟ provides a significance test of the point-biserial correlation. The last two columns show the average score and corresponding standard deviation for the overall engagement scale (i.e. a plausible value estimate) of young people to whom this statement is thought to apply. The interpretation of these pieces of information follows the discussions by Wu and Adams (2007). Item-Rest Correlation and Item-Total Correlation
A correlation of 0.4 or higher is desired to indicate a relationship between the score on the item and the overall score on the scale (i.e. „engagement‟). The higher the correlation, the stronger is the link between the item and the underlying trait. The Item Rest-Correlation tends to be lower than the item-total correlation as the latter includes the item itself whereas the former excludes it from the calculations.
Results of the analysis reveal item-rest and item-total correlations which range from 0.64 for items 1 and 13 to 0.87 for item 18. Thus, all items under review have a medium to strong link with the underlying trait.
Point-biserial
The point-biserial correlation should be increasing with increasing score. In addition, for the highest score category, the point-biserial correlation should be positive. An indication of a statement not being linked to the underlying trait is a t-statistics with a corresponding p-value larger than 0.05. The desideratum that the point-biserial correlation should be positive for the highest score is met by all 18 items. However, the desideratum that the correlations should increase with increasing score is not met. The sign is invariably negative for both statements 1 and 2 (i.e. describing the lowest and second lowest level of engagement) which is what would be expected given the design of the EM which means that these two statements for each aspect describe disengagement and hence the negative side of engagement. The size of the coefficient, however, is reversed for most items in that it is larger

Trial of Engagement Matrix (EM) – Component 2 – Reliability and validity of the EM 19
for the second than the first statement (except items 1 and, marginally, 15) which could be an indication of an incorrect ordering of these statements. However, the low numbers in the „count‟ column for the statement describing the lowest engagement level seems to suggest a reluctance of raters to choose these statements. Statements for which the point-biserial correlation with the overall score is not significant are:
Has some links with several community groups. (Item/aspect 1; label/statement 3)
Cooperates with others and behaves in a calm and settled manner. (Item/aspect 3; label/statement 4)
Able to listen to and empathise with other viewpoints. (Item/aspect 4; label/statement 4)
Is attentive most of the time. (Item/aspect 5; label/statement 4)
Demonstrates pride in own work. (Item/aspect 10; label/statement 4)
Rarely loses self-control. (Item/aspect 15; label/statement 4)
Can set short and longer term goals. (Item/aspect 16; label/statement 4) An inspection of these statements suggests that they are very similar to the adjacent statements and consideration might be given to their rewording.
Plausible Value Average
The plausible value average is expected to increase with increasing score. This means that for a higher score category, the average engagement level should be higher than that for a lower category as should be the case if the categories (or statements in this analysis) were ordered correctly. The average increases with increasing scores for most items, except for the two lowest categories for item 13. This, in combination with the reversal of the point-biserial correlations for these categories suggests that consideration may be given to swapping them or to their rewording. The statements in question are: For item 13: Statement 1: Is often unwell. Statement 2: Has limited vitality and enthusiasm. In summary, the questions raised at the beginning of the Rasch modelling can be answered as follows: At the level of the EM matrix as a whole:
1. Are three dimensions underlying the EM matrix? If yes, how are the three dimensions related? How well is each item (i.e. aspect) related to the trait of interest, namely „Engagement‟?

Trial of Engagement Matrix (EM) – Component 2 – Reliability and validity of the EM 20
Yes as the three-dimensional model fits the data better than the one-dimensional model. The three dimensions, however, are highly correlated. All items are moderately or strongly related to the trait of interest.
2. How reliable is the EM matrix overall? If three dimensions can be identified, how reliably can they be measured? The reliability of the EM matrix overall is 0.94. The reliabilities of each of the three dimensions are 0.90 for the ‘Relationship’ dimension, 0.92 for the ‘Involvement in learning’ dimension and 0.91 for the ‘Well-being’ dimension.
At the level of the aspect, statements within aspects:
3. How well does each item (i.e. aspect) discriminate between young people who have higher and lower levels of engagement? Most items discriminate well between young people with higher and lower levels of engagement. Only the first item (i.e. aspect), namely ‘Integration into Community’, which is part of the ‘Relationships’ dimension, and the seventh item, namely ‘Literacy/Numeracy levels’, which is part of the ‘Involvement in learning’ dimension’, discriminate less than is desirable.
4. Do the statements within each aspect describe a range of behaviours from lower levels of engagement to higher levels of engagement? Yes, most statements describe a range of behaviours from lower levels of engagement to higher levels of engagement. However, seven statements were found not to be significantly related to the underlying trait and consideration might be given to their wording. Similarly, for one aspect results suggest an incorrect ordering of the two statements describing lower levels of engagement.
Based on the above results, six of the seven statements found to be not significantly related to the underlying trait are reported below, as well as suggested revisions to these statements. One of the seven statements not significantly related to the underlying trait of engagement belongs to the aspect „Integration into Community‟. As the aspect „Integration into Community‟ was found to discriminate less than is desirable between young people with higher and lower levels of engagement, revisions were not proposed for this statement.
For each non-significant statement, the statements describing all five levels that make up an aspect are shown. The number of the current statement that did not work well is shown in the underlined header. That statement is shown in bolded, strike-through font. The proposed re-worded statement is shown

Trial of Engagement Matrix (EM) – Component 2 – Reliability and validity of the EM 21
below it in bolded, italicised font. In two cases, a change in one statement leads to a slight change in adjacent statements. Relationships; Cooperation; Statement 4:
1. Is disruptive and uncooperative or very passive. 2. At times disruptive and uncooperative or passive. 3. Cooperates with others, but is occasionally disruptive. 4. Cooperates with others and behaves in a calm and settled
manner. Generally cooperates with others
5. Very cooperative with others and supportive of them.
Relationships; Empathy; Statement 4: 1. Generally unable to empathise with others. 2. Shows limited ability to empathise with others. 3. Shows some empathy for others. 4. Able to listen to and empathise with other viewpoints.
Able to empathise with other viewpoints. 5. Very empathetic and respectful of others‟ views.
Involvement in learning; Attention/Memory; Statement 4: 1. Has short attention span and difficulty remembering instructions and concepts. 2. Sometimes forgets instructions and concepts. 3. Usually remembers instructions and concepts. 4. Is attentive most of the time.
Is almost always attentive. 5. Is always attentive and able to complete tasks without additional prompting.
Involvement in learning; Satisfaction in work; Statement 4:
1. May destroy own work. 2. Appears to gain little satisfaction from own work. 3. Gains satisfaction from own work.
Gains some satisfaction from own work. 4. Demonstrates pride in own work.
Gains considerable satisfaction from own work. 4. Celebrates own work and achievements.
Well-being; Locus of control; Statement 4 1. Struggles to control behaviour and emotions; easily loses temper. 2. Shows moderate control of emotions and behaviour in some situations;
sometimes acts impulsively. 3. Controls behaviour and emotions most of the time.
Generally controls behaviour and emotions most of the time. 4. Rarely loses self-control.
Almost always displays self-control 5. Almost never loses self-control in difficult situations; thinks before acting.

Trial of Engagement Matrix (EM) – Component 2 – Reliability and validity of the EM 22
Never loses self-control in difficult situations; thinks before acting.
Well-being; Goal Setting; Statement 4:
1. Struggles with setting goals. 2. Goals are small and short-term. 3. Can set short and limited longer term goals. 4. Can set short and longer term goals.
Sets short and long-term goals. 5. Sets appropriate and achievable long and short-term goals.
Further Analyses: Construct Validity To further assess the validity of the Engagement Matrix, ACER used secondary data provided by DECS to assess the convergent construct validity of the EM. A test of construct validity seeks to answer if the EM actually measures or is related to the underlying construct that it assumes to measure: engagement in „Relationships‟, „Involvement in learning‟ and „Well-being‟. Convergent construct validity seeks to do this by using other indicators that are also assumed to measure the same underlying construct, and there is an expectation that these measures should be related if indeed they are measuring the construct (Sarantakos, 1998). ACER conducted an assessment of convergent construct validity of the EM using secondary data provided by DECS. DECS provided data regarding the actual EM ratings of young people enrolled in the ICAN/FLO programs in term three 2010 carried out by ICAN/FLO case managers. These ratings were undertaken using the EM prior to the revised November 2010 version, which used the labels „Resistant‟. „Disinterested‟, „Compliant‟, „Enthusiastic‟ and „Proactive‟. While most ratings were undertaken during term three 2010, some were reported for others terms. DECS also provided secondary data for another indicator of engagement: the number of planned learning activities for young people enrolled in the ICAN/FLO programs for term two, planned and negotiated by ICAN/FLO case managers and young people enrolled in the programs. These planned learning activities included both traditional learning activities at a school, and learning activities out of the classroom such as an apprenticeship or work study programme. ACER combined both types of activities for a total amount of planned learning activities. The proposed learning activities were reported for term two 2010, but also a part of the sample reported the planned learning activities for term three. The number of planned learning activities is also theorised as an indicator of engagement in learning, and generally engagement across all three dimensions. According to this theoretical perspective, it is hypothesised that there should be a positive correlation between the indicators such that as the proposed number of learning activities increase, the EM ratings for these young people would also increase for the subsequent term. Even though both indicators were undertaken by case managers, you would expect that the

Trial of Engagement Matrix (EM) – Component 2 – Reliability and validity of the EM 23
number of planned learning activities would reflect the young person‟s engagement in learning and other dimensions, along with the case managers rating of the young person‟s engagement using the EM. Reported planned learning activities from term two from all regions participating in the ICAN/FLO programs were merged, cleaned and checked for consistency. Activities that were reported in hours were converted to number of days, by increments of 0.5 days, to be consistent with how learning activities were reported by case managers. In total, there were a maximum number of five days of possible learning activities. Reported EM ratings from term three 2010 for all young people in the ICAN/FLO programs were cleaned and checked for consistency. In the case of duplicate ratings for the same young person over time, ACER selected the rating that was conducted in term three, or as close to term three as possible. EM labels were given numerical values, such that „Resistant‟=1; „Disengaged‟=2; „Compliant‟=3; „Enthusiastic‟=4 and „Proactive‟=5. Each young person, having received a rating using the EM labels then received a corresponding numerical rating 1-5 for „Relationships‟, „Involvement in learning‟ and „Well-being‟. These scores were also averaged to provide an overall rating in engagement by averaging the numeric scores across the reported dimensions. Individual young person data for planned number of learning activities and EM ratings were matched by way of DECS unique student education identification numbers. A one-tailed non-parametric correlation was first conducted between the number of planned learning activities and the EM ratings for each of the three dimensions. In addition, a correlation was calculated for an average „Overall engagement‟ rating across the three domains. Results are presented in Table 3.
Table 3 Correlations between planned activities, and ratings for the three dimensions and engagement overall
EM rating for Planned number of learning activities
„Relationships‟ 0.15**
(N=1031)
„Involvement in learning‟ 0.15**
(N=1281)
EM rating for „Well-being 0.15**
(N=1093) „Overall engagement‟ (i.e. average of 3 ratings
0.16** (N=1014)
Notes: *p < .05 **p < .01 *** p< .001 There is a significant positive small (Cohen, 1992) correlation between the planned number of learning activities and the EM rating for all dimensions. The squared correlation coefficient is the amount of shared variance between

Trial of Engagement Matrix (EM) – Component 2 – Reliability and validity of the EM 24
two indicators, which is 2.56 per cent for all four indicators. Thus, even though the correlation coefficients are significant, the strength of the correlation and the amount of shared variance shows that these two indicators are only weakly related. These results do not strongly support the construct validity of the EM. There are several possibilities which may account for these small correlations. Firstly, the alternative indicator of engagement, planned number of learning activities may not have been performed as expected by case managers. It was expected that students with few number of planned learning activities would also receive lower EM ratings. If case managers planned an increased number of learning activities for the young person in order to motivate them, or had more positive expectations for their planned learning activities than their EM rating would reflect, this could result in the low correlation between these two indicators. As data for actual days of attended learning activities was unavailable, planned activities was the next best indicator. There may have been inconsistencies with how the number of planned days was reported, with case managers loosely interpreting the amount of learning time which constitutes a half a day, or one day. This could partially explain the small correlation between the two indicators. Lastly, the two indicators were reported one term apart. While it is not expected that young people would greatly change their levels of engagement in one term, if young people greatly differed in their level of engagement from term two to term three this could help to explain the small correlation between the two indicators. A further examination of construct validity could be aided by other indicators of engagement for the young people enrolled in the ICAN/FLO programs. CONCLUSION
The findings presented in this report indicate that the engagement matrix has a high level of reliability, both at the level of the three dimensions, namely „Relationships‟, „Involvement in learning‟ and „Well-being‟ as well as when dimensions are combined into a scale measuring overall engagement. Indeed results indicate a strong underlying trait as the three dimensions are extremely highly correlated. However, results also suggest that the model assuming three dimensions reflects the data better than a model assuming one dimension. Most individual statements within the 18 aspects covered under the three dimensions describe the range from disengagement to engagement quite well. Still, some results point to individual statements that could benefit from re-ordering or rewording. It should be noted, though, that overall, the analyses and the interpretation of results were conducted in a lenient way. This means that cut-off criteria and interpretation guidelines were applied in way that was conducive to the design and assumptions underlying the EM.

Trial of Engagement Matrix (EM) – Component 2 – Reliability and validity of the EM 25
Finally, given the results regarding the EM‟s construct validity, some further work to ascertain the validity of the EM by way of relating EM ratings to external indicators of involvement or engagement appears to be desirable.

Trial of Engagement Matrix (EM) – Component 2 – Reliability and validity of the EM 26
REFERENCES
Andrich, D.A. (1978). A rating formulation for ordered response categories. Psychometrika, 43, 357-374.
Coakes, S. J., & Steed, L.G. (1996). SPSS for Windows. Milton, Qld: John Wiley & Sons.
Cohen, J. (1992). Quantitative Methods in Psychology: A Power Primer. Psychological Bulletin , 112 (1), 155-159.
Department of Education and Children's Services (DECS) South Australia. (n.d.). Innovative Action Community Networks (ICAN) and Flexible Learning Options (FLO). Retrieved December 22, 2010, from http://www.ican.sa.edu.au/pages/aboutus
Hair, J. F., Anderson, R. E., Tatham, R. L., & Black, W. C. (1995). Multivariate data analysis (4th ed.). Englewood Cliffs, NJ: Prentice-Hall Inc.
Kenkel, J. L. (1996). Intorductory statistics for management and economics (4th ed.). Belmont, CA: International Thompson Publishing Inc.
Masters, G. N. (1982). A Rasch model for partial credit scoring. Psychometrika, 47, 149-74.
Masters, G.N. (1988). Measurement models for ordered response categories. In R. Langheine & J. Rost (Eds.) Latent trait and latent class models. New York: Plenum.
Pallant, J. (2005). SPSS Survival manual (2nd edition). Crows Nest NSW: Allen & Unwin.
Rasch, G. (1966). An individualistic approach to item analysis. In P.F. Lazarsfeld and N.W. Henry (eds.) Readings in mathematical social science (pp. 89-108). Chicago: Science Research Associates.
Sarantakos, S. (1998). Social Research (2nd ed.). South Yarra: Macmillan Education Australia Pty Ltd.
Wright, B.D. & Masters, G. N. (1982). Rating scale analysis: Rasch measurement. Chicago: Mesa Press.
Wu, M. & Adams, R. (2007). Applying the Rasch model to psycho-social measurement: A practical approach. Educational Measurement Solutions, Melbourne.
Wu, M. L., Adams, R. J., Wilson, M. R. & Haldane, S. (2007). ACER ConQuest: Generalised item response modelling software. Melbourne, Vic.

Trial of Engagement Matrix (EM) – Component 2 – Reliability and validity of the EM 27
APPENDIX 1 DISAGGREGATED AND REVISED STATEMENTS BY DIMENSION
A1 ‘Relationships’ dimension statements as taken from EM (current as of 12 November 2010)
Aspect Significantly disengaged Partly disengaged
Moderately engaged Very engaged Extremely engaged
Integration into community
Seems isolated or alienated from community/cultural groups
Has few connections with community/cultural groups
Has some links with community/cultural groups
Connected with community/cultural groups
Has strong connections with community/cultural groups.
Openness Highly anxious, withdrawn and has low levels of interaction with others
At times is anxious withdrawn or closed in relation to others.
Occasionally anxious, withdrawn or closed in relation to others.
Usually open and engages with others. Calm, settled and cooperative with others.
Open to others and relates very well with a wide range of people.
Cooperation Disruptive, aggressive, undermining, uncooperative and violent or very passive.
At times can be disruptive, aggressive and uncooperative or can be passive, in relation to others.
Generally cooperates with others, but can be disruptive on occasion.
Very cooperative with others and supportive of them.
Peer connections Limited or no peer connections
Connects with a small group of peers with similar life views.
Has connections to a small group of peers; is able to listen to the views of others and show some empathy for them.
Has wider connections with others; Able to listen to and empathise with other viewpoints.
Connected to a wide group of people. Considers others before acting.
Empathy Has difficulty Shows limited Very empathetic and

Trial of Engagement Matrix (EM) – Component 2 – Reliability and validity of the EM 28
empathising with others.
ability to empathise with others.
respectful of others‟ views.

Trial of Engagement Matrix (EM) – Component 2 – Reliability and validity of the EM 29
A2 ‘Relationships’ dimension statements revised by DECS and ACER
Aspect Significantly disengaged Partly disengaged Moderately engaged Very engaged Extremely engaged
Integration into community
Seems isolated or alienated from community groups.
Has loose connections with one or two community groups.
Has some links with several community groups.
Has regular interactions with several community groups.
Has strong connections with several community groups.
Peer connections Is withdrawn from others.
Connects with a small group of peers with similar life views.
Has connections to a small group of peers with a range of life views.
Usually open and engages with many other people.
Is nearly always open to others and relates very well with a wide range of people.
Cooperation Is disruptive and uncooperative or very passive.
At times disruptive and uncooperative or passive.
Generally cooperates with others, but is occasionally disruptive.
Cooperates with others and behaves in a calm and settled manner.
Very cooperative with others and supportive of them.
Empathy Generally unable to empathise with others.
Shows limited ability to empathise with others.
Shows some empathy for others.
Able to listen to and empathise with other viewpoints.
Very empathetic and respectful of others‟ views.

Trial of Engagement Matrix (EM) – Component 2 – Reliability and validity of the EM 30
B1 ‘Involvement in learning’ dimension statements taken from EM (current as of 12 November 2010)
Aspect Significantly disengaged Partly disengaged
Moderately engaged Very engaged Extremely engaged
Attention/Memory Has short attention span and difficulty remembering instructions and concepts
Sometimes forgets instructions and concepts
Occasionally forgets instructions and concepts
Memory works at full capacity
Involvement in Learning
Doesn‟t attend school or walks out of classes; avoids opportunities for learning
Complies minimally with learning and instruction
Attentive most of the time.Completes work in most fields, but may need extra time.
Actively engages with learning and quickly completes tasks.
Often extends tasks and explores new ways of learning. Prepared to invest considerable effort.
Literacy/Numeracy levels
Has low levels of literacy/numeracy
Struggles with literacy/numeracy for basic daily tasks
Can use literacy/numeracy to achieve most age-appropriate tasks
Maintains high standard of literacy/numeracy
Uses literacy/numeracy to broaden other learning
Resilience Easily distressed; easily overwhelmed; gives up easily; lacks interest in all but limited fields; finds change and challenges threatening and frequently won‟t respond to instruction
At times is easily distressed and/or overwhelmed by challenges or new situations.
Occasionally easily distressed and/or overwhelmed. Can manage challenges of new situations with support.
Shows enthusiasm for areas of passion and will complete most work within set time.
Engrossed, enthusiastic; Enjoys challenges in many fields; particularly in identified areas of passion.

Trial of Engagement Matrix (EM) – Component 2 – Reliability and validity of the EM 31
Class participation Avoids answering questions and may provide irrelevant talk
Responds to some instructions and will comply with some tasks if in field of interest.
Responds to questions.
Answers and may pose some questions
Contributes to discussions
May lead peer group in discussions and debate
Pride in work May destroy work Gains little satisfaction from own work
Shows some pride in work
Demonstrates pride in own work
Celebrates own and others‟ achievements; prepared to invest effort and take responsibility
Demonstrates obvious satisfaction and pride in work.
Acceptance of praise and constructive criticism
Does not accept positive feedback
Has limited capacity to accept positive feedback
Shows some capacity for accepting positive feedback
Receives positive feedback and constructive criticism well
Able to act on advice received.

Trial of Engagement Matrix (EM) – Component 2 – Reliability and validity of the EM 32
B2 ‘Involvement in learning’ dimension statements revised by DECS and ACER
Aspect Significantly disengaged Partly disengaged
Moderately engaged Very engaged Extremely engaged
Attention/Memory Has short attention span and difficulty remembering instructions and concepts.
Sometimes forgets instructions and concepts.
Usually remembers instructions and concepts.
Attentive most of the time.
Always attentive and able to complete tasks without additional prompting.
Involvement in Learning
Doesn‟t attend school or walks out of classes.
Complies minimally with learning and instruction.
Completes work in most fields, but may need extra time.
Actively engages with learning and completes all tasks.
Actively engages with learning, often going beyond the set task to explore further.
Literacy/Numeracy levels
Has low levels of literacy/numeracy.
Struggles with literacy/numeracy for basic daily tasks.
Can use literacy/numeracy to achieve most age-appropriate tasks.
Maintains high standard of literacy/numeracy.
Uses literacy/numeracy to broaden other learning.
Resilience Gives up easily.
At times is easily overwhelmed by challenges.
Can manage challenges with support.
Manages many challenges by her-/himself.
Enjoys challenges in many fields.
Class participation Avoids answering questions and may provide irrelevant talk.
Responds to some questions in their field of interest.
Answers and may pose some relevant questions.
Contributes actively to class discussions.
May lead peer group in class discussions and debate.
Satisfaction in work May destroy own work.
Appears to gain little satisfaction from own work.
Gains satisfaction from own work.
Demonstrates pride in own work.
Celebrates own work and achievements.
Dealing with Feedback Does not accept feedback.
Has limited capacity to accept feedback.
Shows some capacity for accepting feedback.
Generally accepts feedback.
Accepts and values feedback.
Trial of Engagement Matrix (EM) – Component 2 – Reliability and validity of the EM 33
C1 ‘Well-being’ dimension statements taken from EM (current as of 12 November 2010)
Aspects Significantly disengaged
Partly disengaged
Moderately engaged Very engaged
Extremely engaged
Emotional condition Is anxious, depressed, fatigued or edgy.
Is very unhappy.
Is moderately happy and optimistic.
Is generally happy, relaxed and optimistic.
Physical condition
Is often ill with headaches or stomach aches.
Has limited vitality and enthusiasm and feels unhappy some of the time.
Energy levels are variable.
Is vibrant, energetic, relaxed.
Confidence
Has limited experience of success and sees success as unlikely.
Lacks confidence.
Easily distressed and gives up easily.
Has little self belief and confidence and rarely experiences success.
Comfortable with most situations and people.
Sometimes shows confidence and belief in themself and sometimes experiences success.
Mostly shows belief and confidence in themself and often experiences success.
Almost always shows belief and confidence in themselves and regularly experiences success.
Locus of control Perceives lack of control over life choices.
Struggles to control behaviour and emotions.
Believes has little control over many things affecting their life.
Shows moderate control of emotions
Believes has some personal control over life and choices.
Controls behaviour and emotions most
Experiences personal control over a range of things.
Rarely loses self-control.
Experiences very good control over a wide range of things.
Almost never loses self-control in

Trial of Engagement Matrix (EM) – Component 2 – Reliability and validity of the EM 34
Often has low tolerance to stress and easily loses temper.
May act impulsively, over-react to a situation or be passive and „shut down‟.
and behaviour in some situations.
Sometimes acts impulsively or passively.
of the time.
Occasionally acts impulsively.
Controls behaviour and emotions most of the time.
Recognises necessity for behaviour codes and rules.
difficult situations.
Thinks before acting; recognises they have choices and takes responsibility for behaviour; admits mistakes; accepts consequences.
Goal-setting Struggles with setting goals for the future.
Goals are small and short-term.
Can set limited longer term goals, but lacks some self-direction and initiative.
Sets goals and achieves a significant proportion of them.
Sets appropriate, achievable long and short-term goals.
Dealing with change Shows little ability to adapt to changed situations.
Shows little ability to respond to changed situations.
Responds positively to changes they desire, but needs support when facing challenges.
Responds positively to change.
Responds very positively to change.
Organisation Needs considerable support to get organised.
Requires some support to get organised.
Moderately well organised.
Mostly well organised.
Very well organised.

Trial of Engagement Matrix (EM) – Component 2 – Reliability and validity of the EM 35
C2 ‘Well-being’ dimension statements revised by DECS and ACER
Aspects Significantly disengaged
Partly disengaged
Moderately engaged Very engaged Extremely engaged
Emotional condition
Appears to be anxious, very unhappy or edgy.
Appears to be unhappy some of the time.
Appears to be moderately happy and optimistic.
Appears to be happy, relaxed and optimistic.
Appears to be happy most of the time and may be able to cheer up others.
Physical condition
Is often unwell. Has limited vitality and enthusiasm.
His/her energy levels are variable.
Generally has high energy levels.
Is very vibrant and highly energetic.
Confidence
Lacks confidence. Has little self belief and confidence.
Sometimes shows confidence and belief in her-/himself.
Mostly shows belief and confidence in him-/herself.
Almost always shows belief and confidence in her-/himself.
Locus of control
Struggles to control behaviour and emotions; easily loses temper.
Shows moderate control of emotions and behaviour in some situations; sometimes acts impulsively.
Controls behaviour and emotions most of the time.
Rarely loses self-control.
Almost never loses self-control in difficult situations; thinks before acting.
Goal-setting Struggles with setting goals.
Goals are small and short-term.
Can set short and limited longer term goals.
Can set short and longer term goals.
Sets appropriate and achievable long and short-term goals.
Dealing with change
Generally unable to adapt to changed situations.
Has limited ability to handle changes.
Can respond to changes that are personally desired.
Positively deals with changes.
Engages with changes in an active and positive manner.
Organisation Needs considerable support to get organised.
Requires some support to get organised.
Moderately well organised.
Mostly well organised.
Very well organised.

Trial of Engagement Matrix (EM) – Component 2 – Reliability and validity of the EM 36
APPENDIX 2 TEXT OF ONLINE SURVEY
South Australian Department of Education and Children's Services (DECS) Engagement Matrix Survey Part II
Welcome to Part II of the South Australian Department of Education and Children‟s Services (DECS) Engagement Matrix Survey. The Australian Council for Educational Research (ACER) has been commissioned by DECS to test the reliability and validity of the Engagement Matrix. The EM has been designed by the South Australian Department of Education and Children‟s Services (DECS) to assess a young person‟s engagement in three different dimensions: „Well-being‟, „Relationships‟ and „Involvement in learning‟. Part I, conducted in Term 4 of 2010, collected information regarding the labels of the Engagement Matrix. Part II will now collect information regarding the statements used in the Engagement Matrix. This survey is to help identify the most appropriate statements for the Engagement Matrix. Participation in the survey is anonymous. Your responses will only be tracked to monitor survey completion. No individual responses will be identified and data collected will be used in group comparisons only. The survey should take about 20 minutes to complete. If you would like to save your responses and return to complete the survey later, please remember to note down the login details the system will provide. You will have an opportunity to print your answers when you submit the survey. We greatly appreciate your participation.
Please select your employed position below. Choose one of the following answers:
Teacher
Case Manager in ICAN/FLO programs
During the online survey, you will be presented with five screens of statements from the Engagement Matrix. For this task we would like you to think of a young person whom you know well and evaluate how well the statements apply to this specific young person. These statements will concern a young person's engagement in various aspects. For some of the statements, it may be difficult for you to evaluate a specific element of a young person's engagement. While we do not expect you to be an "expert", please make a judgement for every statement. It is important that you select a young person whom you know well enough to

Trial of Engagement Matrix (EM) – Component 2 – Reliability and validity of the EM 37
answer in-depth statements about their various aspects of engagement. If you are a Case Manager, this young person should be enrolled in the ICAN/FLO programs in Term 1 2011 or Term 4 2010 from year 6 to age 19. If you are a teacher, this young person should be one of your current students from year 6 to year 12 in Term 1 2011 or should have been one of your students from year 6 to year 12 in Term 4 2010. While the young person whom you are evaluating will remain anonymous, we would like to collect some general demographic information regarding this young person before you evaluate them. Is the young person female or male?
Female
Male
In what year level is the young person currently enrolled? (If the young person is not attending school, select the most appropriate year level as if they were attending school.) Choose one of the following answers:
Year 6
Year 7
Year 8
Year 9
Year 10
Year 11
Year 12
Engagement Matrix Statements Part 1
Below is a list of statements. There are five statements concerning an aspect of engagement followed by other statements concerning other aspects. For example, there may be five statements regarding 'organisation' which are then followed by five statements regarding 'goal-setting' etc. Please select the radio button from the scale that indicates how strongly you agree or disagree with each statement regarding the young person that you have selected.
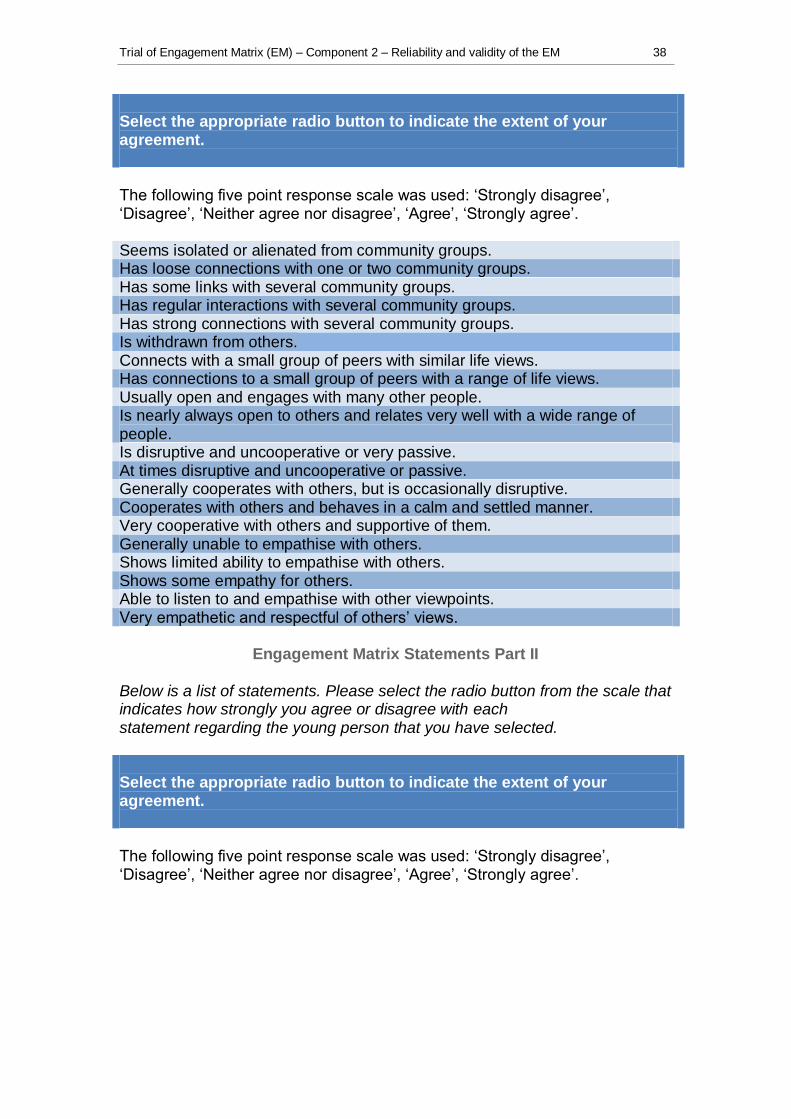
Trial of Engagement Matrix (EM) – Component 2 – Reliability and validity of the EM 38
Select the appropriate radio button to indicate the extent of your agreement.
The following five point response scale was used: „Strongly disagree‟, „Disagree‟, „Neither agree nor disagree‟, „Agree‟, „Strongly agree‟. Seems isolated or alienated from community groups. Has loose connections with one or two community groups. Has some links with several community groups. Has regular interactions with several community groups. Has strong connections with several community groups. Is withdrawn from others. Connects with a small group of peers with similar life views. Has connections to a small group of peers with a range of life views. Usually open and engages with many other people. Is nearly always open to others and relates very well with a wide range of people. Is disruptive and uncooperative or very passive. At times disruptive and uncooperative or passive. Generally cooperates with others, but is occasionally disruptive. Cooperates with others and behaves in a calm and settled manner. Very cooperative with others and supportive of them. Generally unable to empathise with others. Shows limited ability to empathise with others. Shows some empathy for others. Able to listen to and empathise with other viewpoints. Very empathetic and respectful of others‟ views.
Engagement Matrix Statements Part II Below is a list of statements. Please select the radio button from the scale that indicates how strongly you agree or disagree with each statement regarding the young person that you have selected. Select the appropriate radio button to indicate the extent of your agreement.
The following five point response scale was used: „Strongly disagree‟, „Disagree‟, „Neither agree nor disagree‟, „Agree‟, „Strongly agree‟.

Trial of Engagement Matrix (EM) – Component 2 – Reliability and validity of the EM 39
Has short attention span and difficulty remembering instructions and concepts. Sometimes forgets instructions and concepts. Usually remembers instructions and concepts. Is attentive most of the time. Is always attentive and able to complete tasks without additional prompting. Doesn‟t attend school or walks out of classes. Complies minimally with learning and instruction. Completes work in most fields, but may need extra time. Actively engages with learning and completes all tasks. Actively engages with learning, often going beyond the set task. Has low levels of literacy/numeracy. Struggles with literacy/numeracy for basic daily tasks. Can use literacy/numeracy to achieve most age-appropriate tasks. Maintains a high standard of literacy/numeracy. Uses literacy/numeracy to broaden other learning. Gives up easily. At times is easily overwhelmed by challenges. Can manage challenges with support. Manages many challenges by her-/himself. Enjoys challenges in many fields.
Engagement Matrix Statements Part III Below is a list of statements. Please select the radio button from the scale that indicates how strongly you agree or disagree with each statement regarding the young person that you have selected. Select the appropriate radio button to indicate the extent of your agreement.
The following five point response scale was used: „Strongly disagree‟, „Disagree‟, „Neither agree nor disagree‟, „Agree‟, „Strongly agree‟. Avoids answering questions and may provide irrelevant talk. Responds to some questions in her/his field of interest. Answers and may pose some relevant questions. Contributes actively to class discussions. May lead peer group in class discussions and debate. May destroy own work. Appears to gain little satisfaction from own work. Gains satisfaction from own work. Demonstrates pride in own work. Celebrates own work and achievements. Does not accept feedback. Has limited capacity to accept feedback. Shows some capacity for accepting feedback. Generally accepts feedback. Accepts and values feedback.

Trial of Engagement Matrix (EM) – Component 2 – Reliability and validity of the EM 40
Engagement Matrix Statements Part IV Below is a list of statements. Please select the radio button from the scale that indicates how strongly you agree or disagree with each statement regarding the young person that you have selected. Select the appropriate radio button to indicate the extent of your agreement.
The following five point response scale was used: „Strongly disagree‟, „Disagree‟, „Neither agree nor disagree‟, „Agree‟, „Strongly agree‟. Appears to be anxious, very unhappy or edgy. Appears to be unhappy some of the time. Appears to be moderately happy and optimistic. Appears to be happy, relaxed and optimistic. Appears to be happy most of the time and may be able to cheer up others. Is often unwell. Has limited vitality and enthusiasm. His/her energy levels are variable. Generally has high energy levels. Is very vibrant and highly energetic. Lacks confidence. Has little self-belief and confidence. Sometimes shows confidence and belief in her-/himself. Mostly shows belief and confidence in him-/herself. Almost always shows belief and confidence in her-/himself. Struggles to control behaviour and emotions; easily loses temper. Shows moderate control of emotions and behaviour in some situations; sometimes acts impulsively. Controls behaviour and emotions most of the time. Rarely loses self-control. Almost never loses self-control in difficult situations; thinks before acting.
Engagement Matrix Statements Part V Below is a list of statements. Please select the radio button from the scale that indicates how strongly you agree or disagree with each statement regarding the young person that you have selected. Select the appropriate radio button to indicate the extent of your agreement.

Trial of Engagement Matrix (EM) – Component 2 – Reliability and validity of the EM 41
The following five point response scale was used: „Strongly disagree‟, „Disagree‟, „Neither agree nor disagree‟, „Agree‟, „Strongly agree‟. Struggles with setting goals. Goals are small and short-term. Can set short and limited longer term goals. Can set short and longer term goals. Sets appropriate and achievable long and short-term goals. Generally unable to adapt to changed situations. Has limited ability to handle changes. Can respond to changes that are personally desired. Positively deals with changes. Engages with changes in an active and positive manner. Needs considerable support to get organised. Requires some support to get organised. Is moderately well organised. Is mostly well organised. Is very well organised. Struggles with setting goals. Goals are small and short-term. Can set short and limited longer term goals. Can set short and longer term goals. Sets appropriate and achievable long and short-term goals. Feedback If you have any comments regarding this survey or the Engagement Matrix, please tell us in the space below. Also, if you would like any information about the results of this survey please let us know in the space below.

Trial of Engagement Matrix (EM) – Component 2 – Reliability and validity of the EM 42
APPENDIX 3 RESULTS OF FACTOR ANALYSES
1. Factor analysis postulating three factors (i.e. dimensions) Total Variance Explained
Component Initial Eigenvalues Rotation Sums of Squared Loadingsa
Total % of Variance Cumulative % Total
1 44.618 49.576 49.576 42.138
2 5.134 5.704 55.280 5.574
3 2.609 2.899 58.179 32.448
4 2.187 2.430 60.609
5 1.820 2.022 62.632
. . . . . . . . . . . . . . .
Extraction Method: Principal Component Analysis. a. When components are correlated, sums of square loadings cannot be added to obtain a total variance.

Trial of Engagement Matrix (EM) – Component 2 – Reliability and validity of the EM 43
Structure Matrix
Component
1 2 3
INTGR COM_Seems isolated or alienated from community groups -.638 -.772
INTGR COM_Has loose connections with one or two community groups. -.267 -.320
INTGR COM_Has some links with several community groups. .296 .467
INTGR COM_Has regular interactions with several community groups. .537 .730
INTGR COM_Has strong connections with several community groups. .546 .736
PER CON_Is withdrawn from others. -.495 -.701
PER CON_Connects with a small group of peers with similar views. -.265
PER CON_Has connections to a small group of peers with a range of life views. .257 .211 .243
PER CON_Usually open and engages with many other people. .627 .827
PER CON_Is nearly always open to others and relates very well with a wide range of
people.
.678 .773
COOP_Is disruptive and uncooperative or very passive. -.770 -.622
COOP_At times disruptive and uncooperative or passive. -.836 -.570
COOP_Generally cooperates with others, but is occasionally disruptive. -.561 .286 -.309
COOP_Cooperates with others and behaves in a calm and settled manner. .789 .220 .502
COOP_Very cooperative of others and supportive of them. .856 .675
EMPTHY_Generally unable to empathise with others. -.582 -.545
EMPTHY_Shows limited ability to empathise with others. -.758 -.637
EMPTHY_Shows some empathy for others. .265 .584 .256
EMPTHY_Able to listen to and empathise with other viewpoints. .728 .295 .657
EMPTHY_Very empathetic and respectful of others' views. .804 .670
ATTN_Has short attention span and difficulty remembering instructions and concepts. -.834 -.565
ATTN_Sometimes forgets instructions and concepts. -.807 -.583
ATTN_Usually remembers instructions and concepts. .606 .227 .376
ATTN_Is attentive most of the time. .740 .374 .479
ATTN_Is always attentive and able to complete tasks without additional prompting. .903 .676
INVOLV_Doesn‟t attend school or walks out of classes. -.742 -.611
INVOLV_Complies minimally with learning and instruction. -.733 -.550
INVOLV_Completes work in most fields, but may need extra time. -.209 .526
INVOLV_Actively engages with learning and completes all tasks. .870 .672
INVOLV_Actively engages with learning, often going beyond the set task. .877 .735
LIT_NUM_Has low levels of literacy/numeracy. -.758 -.530
LIT_NUM_Struggles with literacy/numeracy for basic daily tasks. -.720 -.481
LIT_NUM_Can use literacy/numeracy to achieve most age-appropriate tasks. .501 .295 .243
LIT_NUM_Maintains a high standard of literacy/numeracy. .813 .612
LIT_NUM_Uses literacy/numeracy to broaden other learning. .811 .642
RESLNCE_Gives up easily. -.890 -.670
RESLNCE_At times is easily overwhelmed by challenges. -.825 -.681
RESLNCE_Can manage challenges with support. .638
RESLNCE_Manages many challenges by her- or himself .835 .673
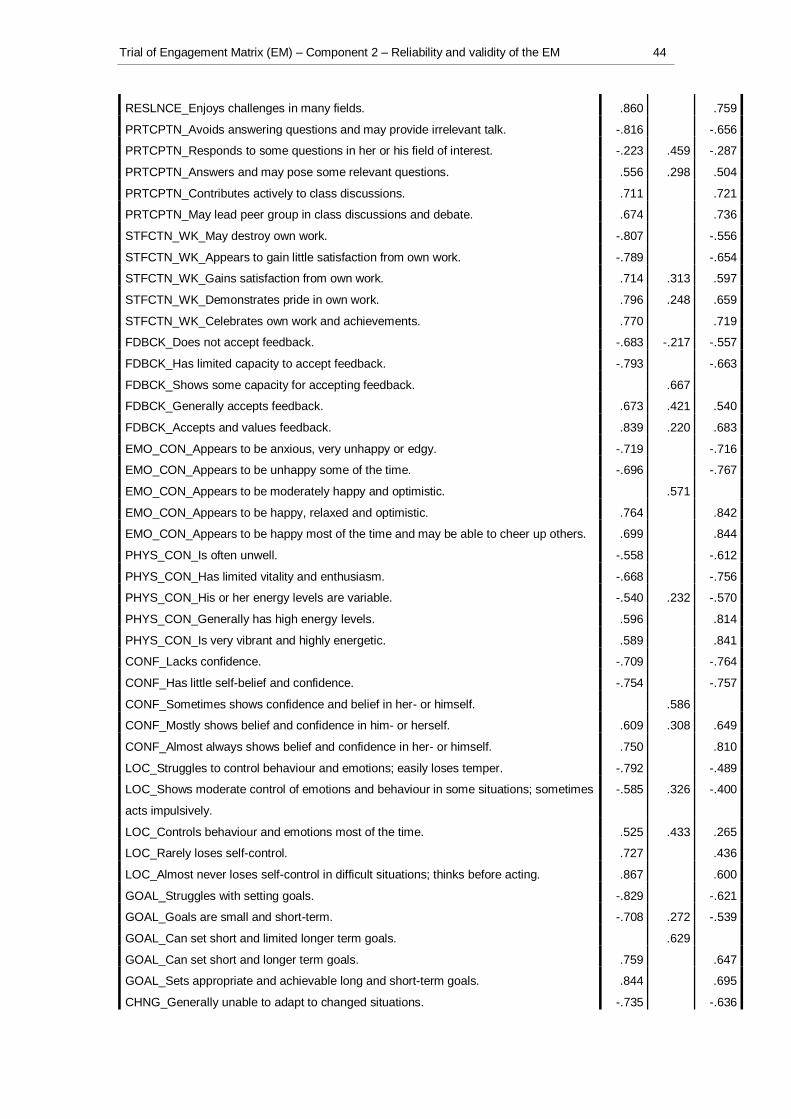
Trial of Engagement Matrix (EM) – Component 2 – Reliability and validity of the EM 44
RESLNCE_Enjoys challenges in many fields. .860 .759
PRTCPTN_Avoids answering questions and may provide irrelevant talk. -.816 -.656
PRTCPTN_Responds to some questions in her or his field of interest. -.223 .459 -.287
PRTCPTN_Answers and may pose some relevant questions. .556 .298 .504
PRTCPTN_Contributes actively to class discussions. .711 .721
PRTCPTN_May lead peer group in class discussions and debate. .674 .736
STFCTN_WK_May destroy own work. -.807 -.556
STFCTN_WK_Appears to gain little satisfaction from own work. -.789 -.654
STFCTN_WK_Gains satisfaction from own work. .714 .313 .597
STFCTN_WK_Demonstrates pride in own work. .796 .248 .659
STFCTN_WK_Celebrates own work and achievements. .770 .719
FDBCK_Does not accept feedback. -.683 -.217 -.557
FDBCK_Has limited capacity to accept feedback. -.793 -.663
FDBCK_Shows some capacity for accepting feedback. .667
FDBCK_Generally accepts feedback. .673 .421 .540
FDBCK_Accepts and values feedback. .839 .220 .683
EMO_CON_Appears to be anxious, very unhappy or edgy. -.719 -.716
EMO_CON_Appears to be unhappy some of the time. -.696 -.767
EMO_CON_Appears to be moderately happy and optimistic. .571
EMO_CON_Appears to be happy, relaxed and optimistic. .764 .842
EMO_CON_Appears to be happy most of the time and may be able to cheer up others. .699 .844
PHYS_CON_Is often unwell. -.558 -.612
PHYS_CON_Has limited vitality and enthusiasm. -.668 -.756
PHYS_CON_His or her energy levels are variable. -.540 .232 -.570
PHYS_CON_Generally has high energy levels. .596 .814
PHYS_CON_Is very vibrant and highly energetic. .589 .841
CONF_Lacks confidence. -.709 -.764
CONF_Has little self-belief and confidence. -.754 -.757
CONF_Sometimes shows confidence and belief in her- or himself. .586
CONF_Mostly shows belief and confidence in him- or herself. .609 .308 .649
CONF_Almost always shows belief and confidence in her- or himself. .750 .810
LOC_Struggles to control behaviour and emotions; easily loses temper. -.792 -.489
LOC_Shows moderate control of emotions and behaviour in some situations; sometimes
acts impulsively.
-.585 .326 -.400
LOC_Controls behaviour and emotions most of the time. .525 .433 .265
LOC_Rarely loses self-control. .727 .436
LOC_Almost never loses self-control in difficult situations; thinks before acting. .867 .600
GOAL_Struggles with setting goals. -.829 -.621
GOAL_Goals are small and short-term. -.708 .272 -.539
GOAL_Can set short and limited longer term goals. .629
GOAL_Can set short and longer term goals. .759 .647
GOAL_Sets appropriate and achievable long and short-term goals. .844 .695
CHNG_Generally unable to adapt to changed situations. -.735 -.636
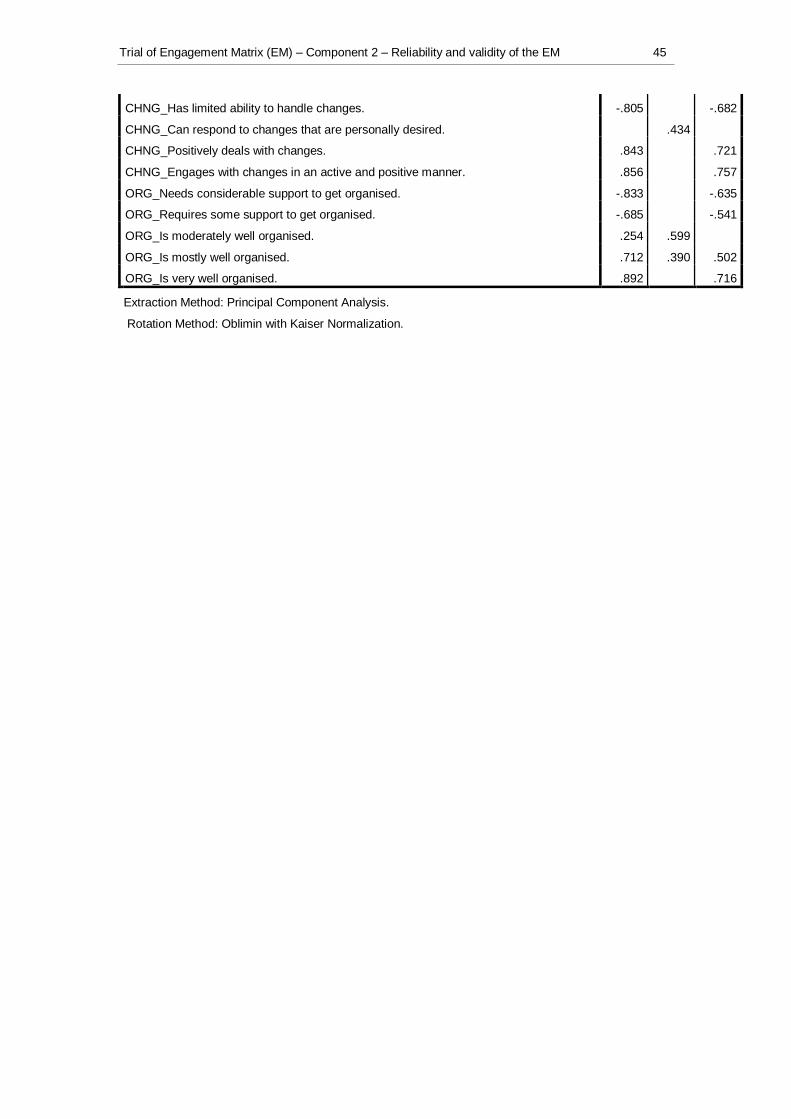
Trial of Engagement Matrix (EM) – Component 2 – Reliability and validity of the EM 45
CHNG_Has limited ability to handle changes. -.805 -.682
CHNG_Can respond to changes that are personally desired. .434
CHNG_Positively deals with changes. .843 .721
CHNG_Engages with changes in an active and positive manner. .856 .757
ORG_Needs considerable support to get organised. -.833 -.635
ORG_Requires some support to get organised. -.685 -.541
ORG_Is moderately well organised. .254 .599
ORG_Is mostly well organised. .712 .390 .502
ORG_Is very well organised. .892 .716
Extraction Method: Principal Component Analysis.
Rotation Method: Oblimin with Kaiser Normalization.

Trial of Engagement Matrix (EM) – Component 2 – Reliability and validity of the EM 46
2. Factor analysis for aspects Total Variance Explained
Component Initial Eigenvalues Rotation Sums of Squared Loadingsa
Total % of Variance Cumulative % Total
1 11.109 61.716 61.716 10.628
2 .931 5.171 66.887 7.931
3 .684 3.802 70.689 .735
4 .615 3.419 74.109
5 .551 3.059 77.168
. . . . . . . . . . . . . . .
Extraction Method: Principal Component Analysis. a. When components are correlated, sums of square loadings cannot be added to obtain a total variance.

Trial of Engagement Matrix (EM) – Component 2 – Reliability and validity of the EM 47
Structure Matrix
Component
1 2 3
RL_IntCom .611 .666 -.530
RL_PerCon .623 .728 -.321
RL_Coop .833 .558
RL_Emp .816 .568
LR_Attn .867 .530
LR_Inv .841 .722
LR_Lit .730 .588
LR_Rsln .867 .634
LR_Part .707 .700
LR_Sat .730 .695 .400
LR_Fdbk .777 .591 .347
WB_Emo .697 .845
WB_Phy .533 .857
WB_Conf .717 .750
WB_Loc .824 .485
WB_Goal .826 .609
WB_Chng .843 .651
WB_Org .878 .640
Extraction Method: Principal Component Analysis.
Rotation Method: Oblimin with Kaiser.
Normalization.
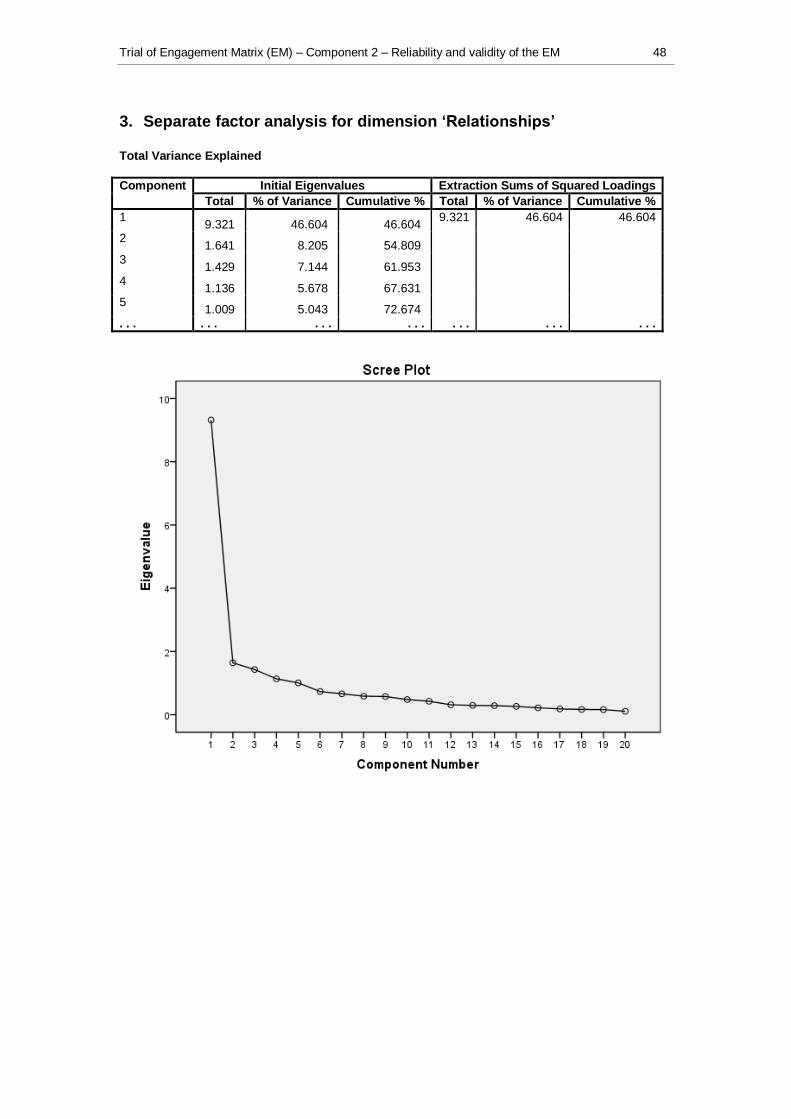
Trial of Engagement Matrix (EM) – Component 2 – Reliability and validity of the EM 48
3. Separate factor analysis for dimension ‘Relationships’
Total Variance Explained
Component Initial Eigenvalues Extraction Sums of Squared Loadings
Total % of Variance Cumulative % Total % of Variance Cumulative %
1 9.321 46.604 46.604
9.321 46.604 46.604
2 1.641 8.205 54.809
3 1.429 7.144 61.953
4 1.136 5.678 67.631
5 1.009 5.043 72.674
. . . . . . . . . . . . . . . . . . . . .
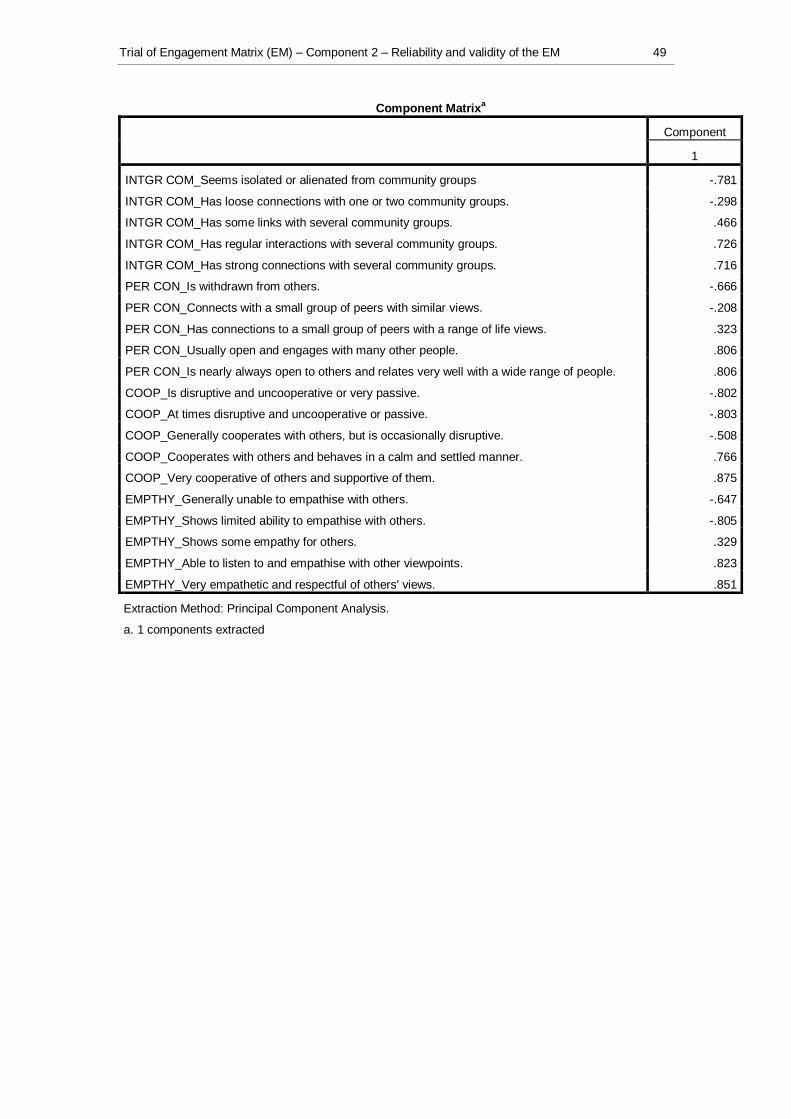
Trial of Engagement Matrix (EM) – Component 2 – Reliability and validity of the EM 49
Component Matrixa
Component
1
INTGR COM_Seems isolated or alienated from community groups -.781
INTGR COM_Has loose connections with one or two community groups. -.298
INTGR COM_Has some links with several community groups. .466
INTGR COM_Has regular interactions with several community groups. .726
INTGR COM_Has strong connections with several community groups. .716
PER CON_Is withdrawn from others. -.666
PER CON_Connects with a small group of peers with similar views. -.208
PER CON_Has connections to a small group of peers with a range of life views. .323
PER CON_Usually open and engages with many other people. .806
PER CON_Is nearly always open to others and relates very well with a wide range of people. .806
COOP_Is disruptive and uncooperative or very passive. -.802
COOP_At times disruptive and uncooperative or passive. -.803
COOP_Generally cooperates with others, but is occasionally disruptive. -.508
COOP_Cooperates with others and behaves in a calm and settled manner. .766
COOP_Very cooperative of others and supportive of them. .875
EMPTHY_Generally unable to empathise with others. -.647
EMPTHY_Shows limited ability to empathise with others. -.805
EMPTHY_Shows some empathy for others. .329
EMPTHY_Able to listen to and empathise with other viewpoints. .823
EMPTHY_Very empathetic and respectful of others' views. .851
Extraction Method: Principal Component Analysis.
a. 1 components extracted

Trial of Engagement Matrix (EM) – Component 2 – Reliability and validity of the EM 50
4. Separate factor analysis for dimension ‘Involvement in learning’
Total Variance Explained
Component Initial Eigenvalues Extraction Sums of Squared Loadings
Total % of Variance Cumulative % Total % of Variance Cumulative %
1 19.478 55.651 55.651
19.478 55.651 55.651
2 2.378 6.794 62.445
3 1.727 4.933 67.378
4 1.096 3.132 70.510
5 .934 2.669 73.179
. . . . . . . . . . . . . . . . . . . . .
Extraction Method: Principal Component Analysis.
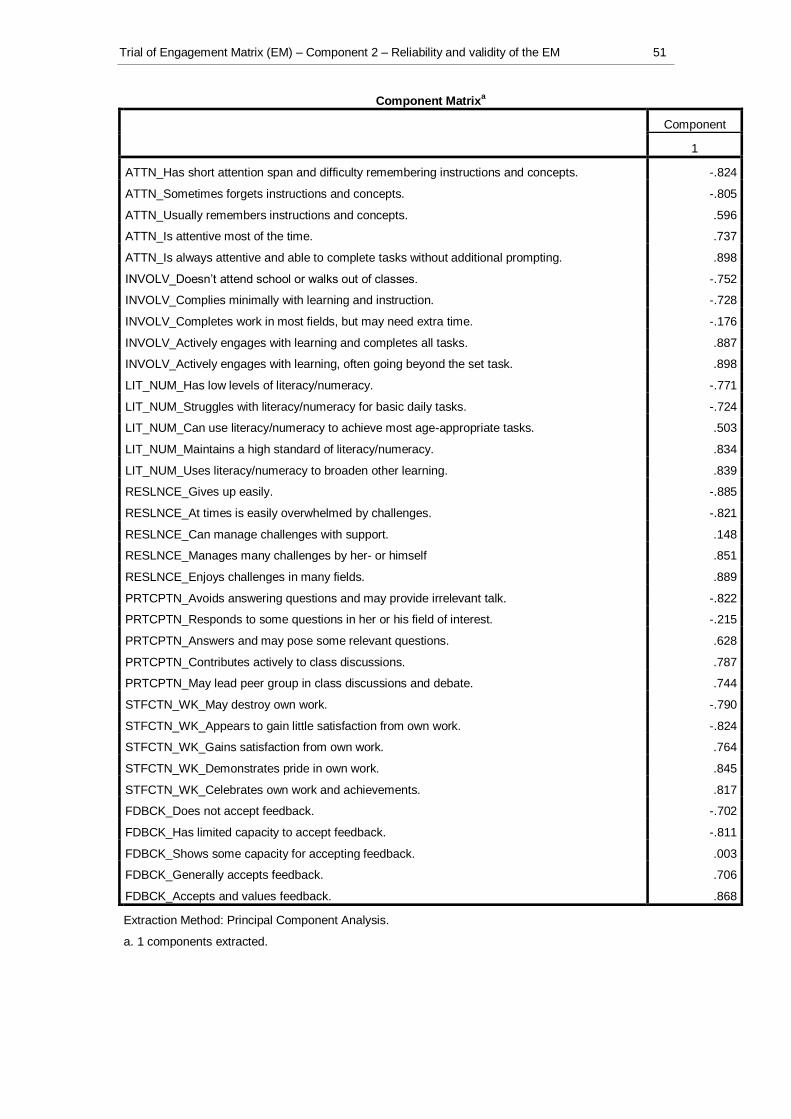
Trial of Engagement Matrix (EM) – Component 2 – Reliability and validity of the EM 51
Component Matrixa
Component
1
ATTN_Has short attention span and difficulty remembering instructions and concepts. -.824
ATTN_Sometimes forgets instructions and concepts. -.805
ATTN_Usually remembers instructions and concepts. .596
ATTN_Is attentive most of the time. .737
ATTN_Is always attentive and able to complete tasks without additional prompting. .898
INVOLV_Doesn‟t attend school or walks out of classes. -.752
INVOLV_Complies minimally with learning and instruction. -.728
INVOLV_Completes work in most fields, but may need extra time. -.176
INVOLV_Actively engages with learning and completes all tasks. .887
INVOLV_Actively engages with learning, often going beyond the set task. .898
LIT_NUM_Has low levels of literacy/numeracy. -.771
LIT_NUM_Struggles with literacy/numeracy for basic daily tasks. -.724
LIT_NUM_Can use literacy/numeracy to achieve most age-appropriate tasks. .503
LIT_NUM_Maintains a high standard of literacy/numeracy. .834
LIT_NUM_Uses literacy/numeracy to broaden other learning. .839
RESLNCE_Gives up easily. -.885
RESLNCE_At times is easily overwhelmed by challenges. -.821
RESLNCE_Can manage challenges with support. .148
RESLNCE_Manages many challenges by her- or himself .851
RESLNCE_Enjoys challenges in many fields. .889
PRTCPTN_Avoids answering questions and may provide irrelevant talk. -.822
PRTCPTN_Responds to some questions in her or his field of interest. -.215
PRTCPTN_Answers and may pose some relevant questions. .628
PRTCPTN_Contributes actively to class discussions. .787
PRTCPTN_May lead peer group in class discussions and debate. .744
STFCTN_WK_May destroy own work. -.790
STFCTN_WK_Appears to gain little satisfaction from own work. -.824
STFCTN_WK_Gains satisfaction from own work. .764
STFCTN_WK_Demonstrates pride in own work. .845
STFCTN_WK_Celebrates own work and achievements. .817
FDBCK_Does not accept feedback. -.702
FDBCK_Has limited capacity to accept feedback. -.811
FDBCK_Shows some capacity for accepting feedback. .003
FDBCK_Generally accepts feedback. .706
FDBCK_Accepts and values feedback. .868
Extraction Method: Principal Component Analysis.
a. 1 components extracted.

Trial of Engagement Matrix (EM) – Component 2 – Reliability and validity of the EM 52
5. Separate factor analysis for dimension ‘Well-being’
Total Variance Explained
Component Initial Eigenvalues Extraction Sums of Squared Loadings
Total % of Variance Cumulative % Total % of Variance Cumulative %
1 18.046 51.560 51.560
18.046 51.560 51.560
2 2.846 8.131 59.691
3 1.604 4.583 64.274
4 1.057 3.019 67.293
5 .938 2.681 69.974
. . . . . . . . . . . . . . . . . . . . .
Extraction Method: Principal Component Analysis.

Trial of Engagement Matrix (EM) – Component 2 – Reliability and validity of the EM 53
Component Matrixa
Component
1
EMO_CON_Appears to be anxious, very unhappy or edgy. -.791
EMO_CON_Appears to be unhappy some of the time. -.804
EMO_CON_Appears to be moderately happy and optimistic. .188
EMO_CON_Appears to be happy, relaxed and optimistic. .866
EMO_CON_Appears to be happy most of the time and may be able to cheer up others. .810
PHYS_CON_Is often unwell. -.661
PHYS_CON_Has limited vitality and enthusiasm. -.781
PHYS_CON_His or her energy levels are variable. -.628
PHYS_CON_Generally has high energy levels. .758
PHYS_CON_Is very vibrant and highly energetic. .748
CONF_Lacks confidence. -.799
CONF_Has little self-belief and confidence. -.835
CONF_Sometimes shows confidence and belief in her- or himself. -.100
CONF_Mostly shows belief and confidence in him- or herself. .693
CONF_Almost always shows belief and confidence in her- or himself. .845
LOC_Struggles to control behaviour and emotions; easily loses temper. -.745
LOC_Shows moderate control of emotions and behaviour in some situations; sometimes acts
impulsively.
-.565
LOC_Controls behaviour and emotions most of the time. .486
LOC_Rarely loses self-control. .695
LOC_Almost never loses self-control in difficult situations; thinks before acting. .837
GOAL_Struggles with setting goals. -.809
GOAL_Goals are small and short-term. -.698
GOAL_Can set short and limited longer term goals. .202
GOAL_Can set short and longer term goals. .783
GOAL_Sets appropriate and achievable long and short-term goals. .849
CHNG_Generally unable to adapt to changed situations. -.766
CHNG_Has limited ability to handle changes. -.840
CHNG_Can respond to changes that are personally desired. .189
CHNG_Positively deals with changes. .870
CHNG_Engages with changes in an active and positive manner. .890
ORG_Needs considerable support to get organised. -.832
ORG_Requires some support to get organised. -.696
ORG_Is moderately well organised. .264
ORG_Is mostly well organised. .698
ORG_Is very well organised. .893
Extraction Method: Principal Component Analysis.; a. 1 components extracted.

Trial of Engagement Matrix (EM) – Component 2 – Reliability and validity of the EM 54
APPENDIX 4 MULTIDIMENSIONAL PARTIAL CREDIT MODEL
Iteration: 27 .........................................................
Deviance = 12485.39770
Covariance Estimates:
Dimension_1 1.25193 1.72182 1.58161
Dimension_2 1.72182 2.48754 2.28122
Dimension_3 1.58161 2.28122 2.14254
Correlation Estimates:
Dimension_1 1.00000 0.97569 0.96570
Dimension_2 0.97569 1.00000 0.98814
Dimension_3 0.96570 0.98814 1.00000
Means:
Dimension_1 0.67095
Dimension_2 0.95322
Dimension_3 0.90115
Maximum changes:
Item location parameter estimates ==> 0.00981 (Parameter 58)
Mean estimates ==> 0.00023 (Dimension 1)
Covariance matrix ==> -0.00603 (Element 3 3)
Change in the deviance ==> 2.88258
.........................................................................
The maximum change in the estimates is less than the convergence criterion
Iterations will terminate
=>show !tables=1:2:3:4:5:6, estimates=latent;
================================================================================
Multidimensional partial credit model 18 items Wed Apr 13 19:41 2011
SUMMARY OF THE ESTIMATION
===========================================================Build: Mar 29 2011===
Estimation method was: MonteCarlo with 400 nodes
Assumed population distribution was: Gaussian
Constraint was: DEFAULT
The Data File: EM18.dat
The format: responses 1-18
No case weights

Trial of Engagement Matrix (EM) – Component 2 – Reliability and validity of the EM 55
The regression model:
Grouping Variables:
The item model: item+item*step
Slopes are fixed
Sample size: 319
Final Deviance: 12485.39770
Total number of estimated parameters: 78
The number of iterations: 27
Termination criteria: Max iterations=1000, Parameter Change= 0.01000
Deviance Change= 0.00010
Iterations terminated because the convergence criteria were reached
Random number generation seed: 1.00000
Number of nodes used when drawing PVs: 2000
Number of nodes used when computing fit: 200
Number of plausible values to draw: 5
Maximum number of iterations without a deviance improvement: 100
Maximum number of Newton steps in M-step: 10
Value for obtaining finite MLEs for zero/perfects: 0.30000
================================================================================
Multidimensional partial credit model 18 items Wed Apr 13 19:41 2011
TABLES OF RESPONSE MODEL PARAMETER ESTIMATES
===========================================================Build: Mar 29 2011===
TERM 1: item
--------------------------------------------------------------------------------------------------------------
VARIABLES UNWEIGHTED FIT WEIGHTED FIT
--------------- ----------------------- -----------------------
item ESTIMATE ERROR^ MNSQ CI T MNSQ CI T
--------------------------------------------------------------------------------------------------------------
1 1 0.582 1.51 ( 0.84, 1.16) 5.6 1.39 ( 0.83, 1.17) 4.2
2 2 0.049 0.002 1.19 ( 0.84, 1.16) 2.3 1.15 ( 0.83, 1.17) 1.7
3 3 -0.232 0.001 0.71 ( 0.84, 1.16) -4.0 0.76 ( 0.84, 1.16) -3.3
4 4 -0.398* 0.001 0.77 ( 0.84, 1.16) -3.1 0.79 ( 0.84, 1.16) -2.9
5 5 0.035 0.005 0.91 ( 0.84, 1.16) -1.2 0.95 ( 0.83, 1.17) -0.6
6 6 0.417 0.001 0.79 ( 0.84, 1.16) -2.8 0.82 ( 0.83, 1.17) -2.3
7 7 0.291 0.002 1.28 ( 0.84, 1.16) 3.2 1.28 ( 0.83, 1.17) 3.0
8 8 0.042 0.004 0.90 ( 0.84, 1.16) -1.2 0.80 ( 0.83, 1.17) -2.4
9 9 0.331 0.002 1.17 ( 0.84, 1.16) 2.0 1.17 ( 0.84, 1.16) 2.0
10 10 -0.333 0.002 0.97 ( 0.84, 1.16) -0.4 1.04 ( 0.83, 1.17) 0.4
11 11 -0.783* 0.006 0.80 ( 0.84, 1.16) -2.7 0.89 ( 0.83, 1.17) -1.2

Trial of Engagement Matrix (EM) – Component 2 – Reliability and validity of the EM 56
12 12 -0.142 0.004 1.09 ( 0.84, 1.16) 1.1 1.05 ( 0.83, 1.17) 0.6
13 13 -0.345 0.003 1.29 ( 0.84, 1.16) 3.3 1.24 ( 0.82, 1.18) 2.5
14 14 0.004 0.001 0.95 ( 0.84, 1.16) -0.5 1.02 ( 0.83, 1.17) 0.3
15 15 0.242 0.001 1.18 ( 0.84, 1.16) 2.2 1.15 ( 0.83, 1.17) 1.7
16 16 0.058 0.002 0.96 ( 0.84, 1.16) -0.4 0.98 ( 0.82, 1.18) -0.2
17 17 -0.293 0.004 0.84 ( 0.84, 1.16) -2.1 0.80 ( 0.82, 1.18) -2.3
18 18 0.475* 0.004 0.79 ( 0.84, 1.16) -2.8 0.79 ( 0.82, 1.18) -2.5
--------------------------------------------------------------------------------
An asterisk next to a parameter estimate indicates that it is constrained
Separation Reliability = 1.000
Chi-square test of parameter equality = 359380.79, df = 15, Sig Level = 0.000
^ Empirical standard errors have been used
================================================================================
Multidimensional partial credit model 18 items Wed Apr 13 19:41 2011
TABLES OF POPULATION MODEL PARAMETER ESTIMATES
===========================================================Build: Mar 29 2011===
REGRESSION COEFFICIENTS
Dimension
---------------------------------------------------
Regression Variable Dimension_1 Dimension_2 Dimension_3
CONSTANT 0.671 ( 0.002) 0.953 ( 0.000) 0.901 ( 0.004)
---------------------------------------------------------------------------------
An asterisk next to a parameter estimate indicates that it is constrained
=================================================================================
CONDITIONAL COVARIANCE/CORRELATION MATRIX
Dimension
------------------------------------------------------
Dimension 1 2 3
Dimension_1 1.722 1.582
Dimension_2 0.976 2.281
Dimension_3 0.966 0.988
-------------------------------------------------------------------------------
Variance 1.252 ( 0.001) 2.488 ( 0.005) 2.143 ( 0.009)
-------------------------------------------------------------------------------
An asterisk next to a parameter estimate indicates that it is constrained
Values below the diagonal are correlations and values above are covariances

Trial of Engagement Matrix (EM) – Component 2 – Reliability and validity of the EM 57
RELIABILITY COEFFICIENTS
------------------------
Dimension: (Dimension_1)
-----------------------
MLE Person separation RELIABILITY: Unavailable
WLE Person separation RELIABILITY: Unavailable
EAP/PV RELIABILITY: 0.897
------------------------
Dimension: (Dimension_2)
-----------------------
MLE Person separation RELIABILITY: Unavailable
WLE Person separation RELIABILITY: Unavailable
EAP/PV RELIABILITY: 0.916
------------------------
Dimension: (Dimension_3)
-----------------------
MLE Person separation RELIABILITY: Unavailable
WLE Person separation RELIABILITY: Unavailable
EAP/PV RELIABILITY: 0.913
===========================================================================
Multidimensional partial credit model 18 items Wed Apr 13 18:48 2011
GENERALISED ITEM ANALYSIS
Group: All Students
===========================================================================
Item 1
item:1 (1)
Cases for this item 312 Item-Rest Cor. 0.64 Item-Total Cor. 0.69
Item Threshold(s): NOT AVAILABLE Weighted MNSQ 1.39
---------------------------------------------------------------------------
Label Score Count % of tot Pt Bis t (p) PV1Avg:1 PV1 SD:1
-----------------------------------------------------------------------------
1 1.00 92 29.49 -0.48 -9.75(.000) -0.23 0.65
2 2.00 38 12.18 -0.18 -3.22(.001) 0.10 0.60
3 3.00 41 13.14 -0.04 -0.63(.532) 0.49 0.78
4 4.00 53 16.99 0.17 3.05(.003) 1.00 0.89
5 5.00 88 28.21 0.51 10.33(.000) 1.74 1.05
===========================================================================
Item 2
item:2 (2)

Trial of Engagement Matrix (EM) – Component 2 – Reliability and validity of the EM 58
Cases for this item 312 Item-Rest Cor. 0.66 Item-Total Cor. 0.70
Item Threshold(s): NOT AVAILABLE Weighted MNSQ 1.15
---------------------------------------------------------------------------
Label Score Count % of tot Pt Bis t (p) PV1Avg:1 PV1 SD:1
---------------------------------------------------------------------------
1 1.00 22 7.05 -0.24 -4.38(.000) -0.37 0.87
2 2.00 92 29.49 -0.41 -8.01(.000) -0.09 0.69
3 3.00 59 18.91 -0.18 -3.26(.001) 0.19 0.61
4 4.00 39 12.50 0.14 2.54(.011) 1.17 0.99
5 5.00 100 32.05 0.59 12.81(.000) 1.69 0.95
===========================================================================
Item 3
item:3 (3)
Cases for this item 312 Item-Rest Cor. 0.78 Item-Total Cor. 0.80
Item Threshold(s): NOT AVAILABLE Weighted MNSQ 0.76
---------------------------------------------------------------------------
Label Score Count % of tot Pt Bis t (p) PV1Avg:1 PV1 SD:1
-----------------------------------------------------------------------------
1 1.00 16 5.13 -0.25 -4.55(.000) -0.59 0.47
2 2.00 56 17.95 -0.48 -9.53(.000) -0.41 0.52
3 3.00 73 23.40 -0.29 -5.33(.000) 0.09 0.49
4 4.00 52 16.67 0.04 0.76(.445) 0.74 0.94
5 5.00 115 36.86 0.71 17.95(.000) 1.71 0.90
===========================================================================
Item 4
item:4 (4)
Cases for this item 312 Item-Rest Cor. 0.77 Item-Total Cor. 0.80
Item Threshold(s): NOT AVAILABLE Weighted MNSQ 0.79
---------------------------------------------------------------------------
Label Score Count % of tot Pt Bis t (p) PV1Avg:1 PV1 SD:1
---------------------------------------------------------------------------
1 1.00 10 3.21 -0.23 -4.14(.000) -0.70 0.42
2 2.00 57 18.27 -0.48 -9.55(.000) -0.40 0.53
3 3.00 71 22.76 -0.29 -5.26(.000) 0.05 0.56
4 4.00 56 17.95 0.01 0.18(.853) 0.62 0.76
5 5.00 118 37.82 0.70 17.37(.000) 1.70 0.95
===========================================================================
Item 5
item:5 (5)
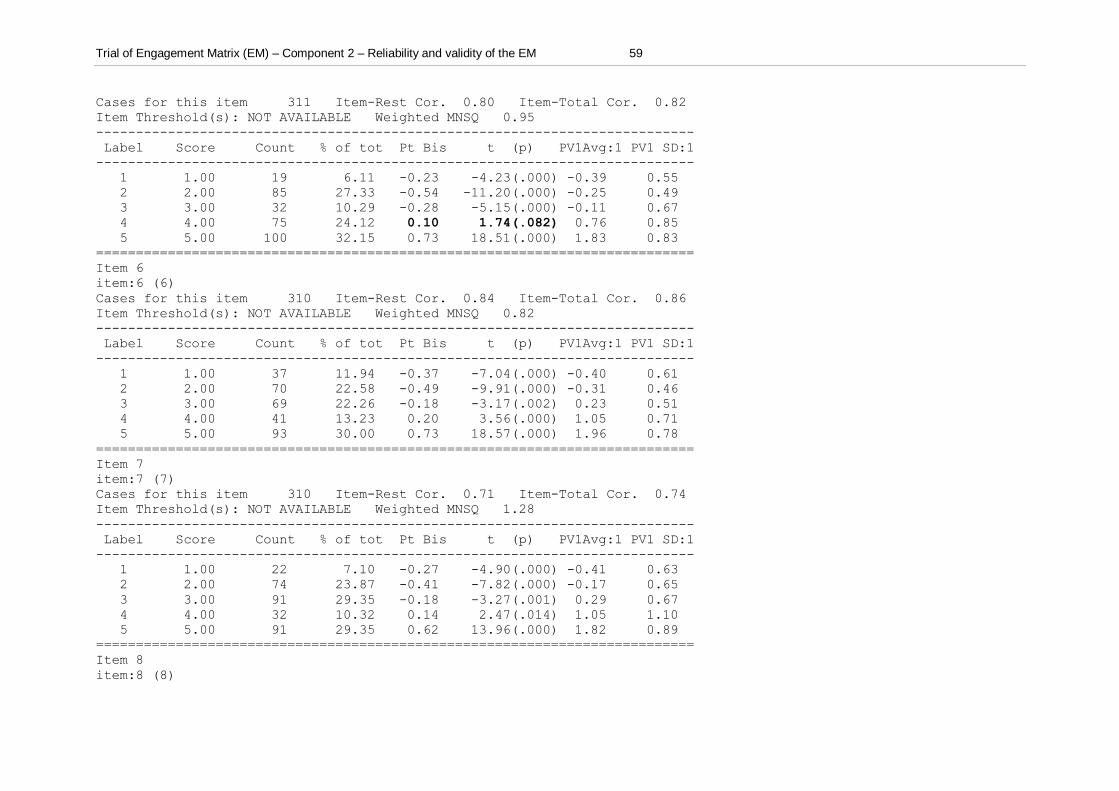
Trial of Engagement Matrix (EM) – Component 2 – Reliability and validity of the EM 59
Cases for this item 311 Item-Rest Cor. 0.80 Item-Total Cor. 0.82
Item Threshold(s): NOT AVAILABLE Weighted MNSQ 0.95
---------------------------------------------------------------------------
Label Score Count % of tot Pt Bis t (p) PV1Avg:1 PV1 SD:1
---------------------------------------------------------------------------
1 1.00 19 6.11 -0.23 -4.23(.000) -0.39 0.55
2 2.00 85 27.33 -0.54 -11.20(.000) -0.25 0.49
3 3.00 32 10.29 -0.28 -5.15(.000) -0.11 0.67
4 4.00 75 24.12 0.10 1.74(.082) 0.76 0.85
5 5.00 100 32.15 0.73 18.51(.000) 1.83 0.83
===========================================================================
Item 6
item:6 (6)
Cases for this item 310 Item-Rest Cor. 0.84 Item-Total Cor. 0.86
Item Threshold(s): NOT AVAILABLE Weighted MNSQ 0.82
---------------------------------------------------------------------------
Label Score Count % of tot Pt Bis t (p) PV1Avg:1 PV1 SD:1
---------------------------------------------------------------------------
1 1.00 37 11.94 -0.37 -7.04(.000) -0.40 0.61
2 2.00 70 22.58 -0.49 -9.91(.000) -0.31 0.46
3 3.00 69 22.26 -0.18 -3.17(.002) 0.23 0.51
4 4.00 41 13.23 0.20 3.56(.000) 1.05 0.71
5 5.00 93 30.00 0.73 18.57(.000) 1.96 0.78
===========================================================================
Item 7
item:7 (7)
Cases for this item 310 Item-Rest Cor. 0.71 Item-Total Cor. 0.74
Item Threshold(s): NOT AVAILABLE Weighted MNSQ 1.28
---------------------------------------------------------------------------
Label Score Count % of tot Pt Bis t (p) PV1Avg:1 PV1 SD:1
---------------------------------------------------------------------------
1 1.00 22 7.10 -0.27 -4.90(.000) -0.41 0.63
2 2.00 74 23.87 -0.41 -7.82(.000) -0.17 0.65
3 3.00 91 29.35 -0.18 -3.27(.001) 0.29 0.67
4 4.00 32 10.32 0.14 2.47(.014) 1.05 1.10
5 5.00 91 29.35 0.62 13.96(.000) 1.82 0.89
===========================================================================
Item 8
item:8 (8)

Trial of Engagement Matrix (EM) – Component 2 – Reliability and validity of the EM 60
Cases for this item 310 Item-Rest Cor. 0.83 Item-Total Cor. 0.85
Item Threshold(s): NOT AVAILABLE Weighted MNSQ 0.80
---------------------------------------------------------------------------
Label Score Count % of tot Pt Bis t (p) PV1Avg:1 PV1 SD:1
---------------------------------------------------------------------------
1 1.00 13 4.19 -0.22 -3.96(.000) -0.47 0.62
2 2.00 78 25.16 -0.55 -11.42(.000) -0.35 0.55
3 3.00 84 27.10 -0.24 -4.40(.000) 0.19 0.52
4 4.00 37 11.94 0.12 2.07(.039) 0.93 0.77
5 5.00 98 31.61 0.75 20.17(.000) 1.92 0.78
===========================================================================
Item 9
item:9 (9)
Cases for this item 310 Item-Rest Cor. 0.72 Item-Total Cor. 0.76
Item Threshold(s): NOT AVAILABLE Weighted MNSQ 1.17
---------------------------------------------------------------------------
Label Score Count % of tot Pt Bis t (p) PV1Avg:1 PV1 SD:1
---------------------------------------------------------------------------
1 1.00 28 9.03 -0.34 -6.33(.000) -0.62 0.54
2 2.00 63 20.32 -0.40 -7.58(.000) -0.23 0.51
3 3.00 79 25.48 -0.17 -3.05(.002) 0.31 0.71
4 4.00 56 18.06 0.18 3.28(.001) 1.04 0.87
5 5.00 84 27.10 0.59 12.72(.000) 1.83 0.94
===========================================================================
Item 10
item:10 (10)
Cases for this item 310 Item-Rest Cor. 0.74 Item-Total Cor. 0.77
Item Threshold(s): NOT AVAILABLE Weighted MNSQ 1.04
---------------------------------------------------------------------------
Label Score Count % of tot Pt Bis t (p) PV1Avg:1 PV1 SD:1
---------------------------------------------------------------------------
1 1.00 14 4.52 -0.26 -4.81(.000) -0.79 0.65
2 2.00 68 21.94 -0.52 -10.63(.000) -0.34 0.44
3 3.00 40 12.90 -0.21 -3.74(.000) 0.06 0.47
4 4.00 53 17.10 0.06 1.00(.320) 0.63 0.75
5 5.00 135 43.55 0.64 14.66(.000) 1.51 1.02
===========================================================================
Item 11
item:11 (11)

Trial of Engagement Matrix (EM) – Component 2 – Reliability and validity of the EM 61
Cases for this item 310 Item-Rest Cor. 0.74 Item-Total Cor. 0.77
Item Threshold(s): NOT AVAILABLE Weighted MNSQ 0.89
---------------------------------------------------------------------------
Label Score Count % of tot Pt Bis t (p) PV1Avg:1 PV1 SD:1
---------------------------------------------------------------------------
1 1.00 6 1.94 -0.15 -2.65(.008) -0.60 0.88
2 2.00 41 13.23 -0.41 -7.99(.000) -0.43 0.49
3 3.00 59 19.03 -0.39 -7.39(.000) -0.15 0.57
4 4.00 46 14.84 -0.20 -3.51(.001) 0.13 0.48
5 5.00 158 50.97 0.77 20.94(.000) 1.45 0.99
===========================================================================
Item 12
item:12 (12)
Cases for this item 310 Item-Rest Cor. 0.76 Item-Total Cor. 0.79
Item Threshold(s): NOT AVAILABLE Weighted MNSQ 1.05
---------------------------------------------------------------------------
Label Score Count % of tot Pt Bis t (p) PV1Avg:1 PV1 SD:1
---------------------------------------------------------------------------
1 1.00 15 4.84 -0.28 -5.21(.000) -0.81 0.57
2 2.00 88 28.39 -0.56 -11.76(.000) -0.24 0.50
3 3.00 51 16.45 -0.16 -2.76(.006) 0.21 0.57
4 4.00 36 11.61 0.22 3.89(.000) 1.16 0.89
5 5.00 120 38.71 0.62 13.75(.000) 1.55 0.99
===========================================================================
Item 13
item:13 (13)
Cases for this item 309 Item-Rest Cor. 0.64 Item-Total Cor. 0.67
Item Threshold(s): NOT AVAILABLE Weighted MNSQ 1.24
---------------------------------------------------------------------------
Label Score Count % of tot Pt Bis t (p) PV1Avg:1 PV1 SD:1
---------------------------------------------------------------------------
1 1.00 9 2.91 -0.17 -2.96(.003) -0.34 0.47
2 2.00 17 5.50 -0.26 -4.80(.000) -0.53 0.75
3 3.00 135 43.69 -0.44 -8.62(.000) 0.07 0.68
4 4.00 48 15.53 0.14 2.46(.015) 0.89 0.95
5 5.00 100 32.36 0.55 11.51(.000) 1.62 1.06
===========================================================================
Item 14
item:14 (14)

Trial of Engagement Matrix (EM) – Component 2 – Reliability and validity of the EM 62
Cases for this item 310 Item-Rest Cor. 0.75 Item-Total Cor. 0.78
Item Threshold(s): NOT AVAILABLE Weighted MNSQ 1.02
---------------------------------------------------------------------------
Label Score Count % of tot Pt Bis t (p) PV1Avg:1 PV1 SD:1
---------------------------------------------------------------------------
1 1.00 17 5.48 -0.20 -3.54(.000) -0.35 0.81
2 2.00 62 20.00 -0.46 -9.15(.000) -0.29 0.52
3 3.00 88 28.39 -0.30 -5.49(.000) 0.13 0.65
4 4.00 45 14.52 0.16 2.81(.005) 0.93 0.79
5 5.00 98 31.61 0.66 15.60(.000) 1.79 0.94
===========================================================================
Item 15
item:15 (15)
Cases for this item 310 Item-Rest Cor. 0.75 Item-Total Cor. 0.78
Item Threshold(s): NOT AVAILABLE Weighted MNSQ 1.15
---------------------------------------------------------------------------
Label Score Count % of tot Pt Bis t (p) PV1Avg:1 PV1 SD:1
--------------------------------------------------------------------------
1 1.00 41 13.23 -0.39 -7.53(.000) -0.39 0.62
2 2.00 69 22.26 -0.37 -7.08(.000) -0.08 0.60
3 3.00 47 15.16 -0.11 -1.94(.054) 0.34 0.76
4 4.00 43 13.87 -0.06 -1.04(.301) 0.42 0.79
5 5.00 110 35.48 0.73 18.71(.000) 1.76 0.91
===========================================================================
Item 16
item:16 (16)
Cases for this item 310 Item-Rest Cor. 0.79 Item-Total Cor. 0.82
Item Threshold(s): NOT AVAILABLE Weighted MNSQ 0.98
---------------------------------------------------------------------------
Label Score Count % of tot Pt Bis t (p) PV1Avg:1 PV1 SD:1
---------------------------------------------------------------------------
1 1.00 31 10.00 -0.35 -6.52(.000) -0.46 0.67
2 2.00 80 25.81 -0.49 -9.81(.000) -0.20 0.45
3 3.00 45 14.52 -0.14 -2.54(.012) 0.22 0.72
4 4.00 26 8.39 -0.03 -0.48(.632) 0.44 0.79
5 5.00 128 41.29 0.76 20.76(.000) 1.67 0.88
===========================================================================
Item 17
item:17 (17)

Trial of Engagement Matrix (EM) – Component 2 – Reliability and validity of the EM 63
Cases for this item 309 Item-Rest Cor. 0.82 Item-Total Cor. 0.84
Item Threshold(s): NOT AVAILABLE Weighted MNSQ 0.80
---------------------------------------------------------------------------
Label Score Count % of tot Pt Bis t (p) PV1Avg:1 PV1 SD:1
---------------------------------------------------------------------------
1 1.00 10 3.24 -0.22 -3.99(.000) -0.50 0.67
2 2.00 47 15.21 -0.38 -7.10(.000) -0.26 0.59
3 3.00 116 37.54 -0.48 -9.57(.000) -0.04 0.56
4 4.00 19 6.15 0.11 1.93(.054) 0.99 0.98
5 5.00 117 37.86 0.78 22.09(.000) 1.77 0.82
===========================================================================
Item 18
item:18 (18)
Cases for this item 310 Item-Rest Cor. 0.85 Item-Total Cor. 0.87
Item Threshold(s): NOT AVAILABLE Weighted MNSQ 0.79
---------------------------------------------------------------------------
Label Score Count % of tot Pt Bis t (p) PV1Avg:1 PV1 SD:1
---------------------------------------------------------------------------
1 1.00 46 14.84 -0.40 -7.62(.000) -0.33 0.43
2 2.00 88 28.39 -0.47 -9.41(.000) -0.17 0.58
3 3.00 49 15.81 -0.13 -2.26(.025) 0.34 0.62
4 4.00 27 8.71 0.12 2.14(.033) 0.82 0.68
5 5.00 100 32.26 0.79 22.25(.000) 1.96 0.75
===========================================================================
The following traditional statistics are only meaningful for complete
designs and when the amount of missing data is minimal.
In this analysis 1.11% of the data are missing.
The following results are scaled to assume that a single response was provided for each item.
N 314
Mean 62.51
Standard Deviation 18.92
Variance 358.06
Skewness 0.08
Kurtosis -1.44
Standard error of mean 1.07
Standard error of measurement 4.59
Coefficient Alpha 0.94
===========================================================================

Trial of Engagement Matrix (EM) – Component 2 – Reliability and validity of the EM 64
APPENDIX 5 ONLINE SURVEY COMMENTS At the end of the online survey, respondents were given the opportunity to provide feedback regarding the online survey or the engagement matrix. Sixty-six comments were received from the 319 responses which is 20.69 per cent of the total number of responses. These comments can provide some further insight into the online survey and the EM. Examining these comments, they generally can be cross-classified into seven categories: 1. Interest in survey results: Seventeen respondents expressed having enjoyed the online survey and are interested in
receiving further information regarding the results 2. Difficulty with rating all statements: Fifteen respondents expressed having experienced difficulty in rating their level of
agreement for all statements for one aspect, for example, „I spent most of my time in just forming patterns of answers similar to "no,no, no, yes, yes, yes" „. Some of these respondents suggested that it may have been easier to select one statement from the five rather than rating all five. Furthermore, several of these15 respondents suggested that it may have been easier to complete if they were presented only one statement and then rate the young person on a continuum, for example „…there should be ONE statement and then should ask to vary the degrees you agree with it or not…‟.
3. Difficulty differentiating statements: Ten respondents expressed having experienced difficulty in differentiating distinct
levels of engagement between statements. Some respondents specifically expressed that these were for statements at the positive end of engagement for example, „The last three questions in each section are too similar‟ and „Some questions difficult to answer. Eg: where 3 questions in a row related to the same area (eg: 1. Engages moderately in 2. Engages mostly in 3. Engages very well in ‟. Some of these respondents also specifically expressed that they experienced di fficulty with statements for intermediate levels of disengagement and engagement, for example „What I found tricky were statements such as “is generally well-organised”. My particular student is extremely well organised, but it was difficult to respond to the “generally...” item‟.
4. Young person’s engagement limited by statements: Ten respondents expressed an inability to clearly portray their
perception of the young person‟ engagement because they were limited by the EM statements. For example, one respondent expressed dissatisfaction that the EM assumes behaviour is consistent, “I found the survey very difficult to complete as the client I chose has mental health issues - as do many of the clients. Her behaviour is not consistent.”
5. Difficulty with the online survey format: Six comments expressed difficulty with the online survey format, such as the size
of the text, or too much required scrolling on the screen, for example „You need to format the text a bit smaller as it makes it difficult to tick the boxes easily . . .‟
6. Statements not useful: Five respondents expressed dissatisfaction with the EM statements in that they were not useful in evaluating engagement, or did not add anything to their understanding of the young person. For example one respondent
Trial of Engagement Matrix (EM) – Component 2 – Reliability and validity of the EM 65
wrote, “I would imagine that engaged people would score in all/most of the areas. Can‟t see that you're going to get much useful material. If someone isn't engage[d] they usually exhibit poor self esteem, confidence, have limited ability to cope or adapt to change “.
7. EM as a useful tool: Four respondents gave feedback about their positive past experiences with the EM, or positive
experiences with the online survey statements. For example, “I enjoyed doing this. Really made me think about a few things” and “It may help the Case management team on how to set goals for our client. [Especially when you are] working with young people from Refugee backgrounds”.
Examining the comments, the online respondents‟ experiences with the online survey and the EM statements may provide some future ideas for the EM design, the statements and the intended use of the EM for the raters.
Related Documents