Prepared by: MOHAMAD SHARIF B ISHAK B050810346 MOHD KHAIRUL SHAHRIL B MUSTAQ AHMAD B050810085 KHAIRUN NAZIHAH BT KHALID B050810081 FARIZA FUZIANA BT YACOB B050810220 1

Prepared by: MOHAMAD SHARIF B ISHAK B050810346 MOHD KHAIRUL SHAHRIL B MUSTAQ AHMADB050810085 KHAIRUN NAZIHAH BT KHALIDB050810081 FARIZA FUZIANA BT YACOBB050810220.
Dec 23, 2015
Welcome message from author
This document is posted to help you gain knowledge. Please leave a comment to let me know what you think about it! Share it to your friends and learn new things together.
Transcript

1
Prepared by:MOHAMAD SHARIF B ISHAK B050810346MOHD KHAIRUL SHAHRIL B MUSTAQ AHMAD B050810085KHAIRUN NAZIHAH BT KHALID B050810081FARIZA FUZIANA BT YACOB B050810220

2
Outline
1) What is Six Sigma2) History of Six Sigma3) Definition of Six Sigma4) Key focus of Six Sigma5) Statistical meaning of Six Sigma6) DMAIC: Define phase Measure phase Analyze phase Improve phase Control phase7) Benefit of applying Six Sigma8) Challenges in implementing Six Sigma9) Case study
3
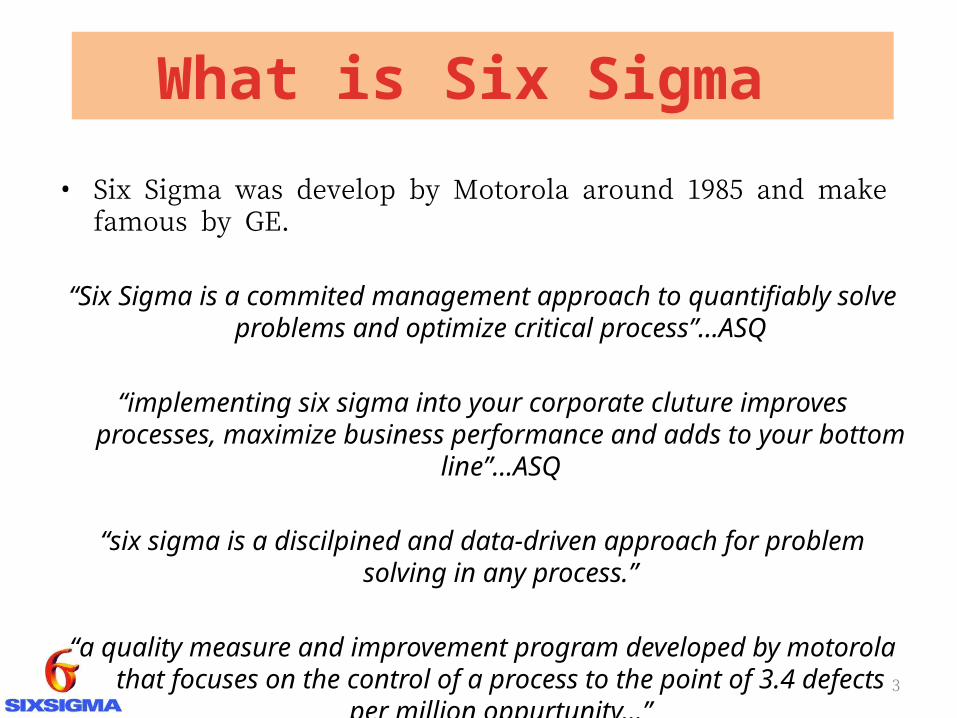
What is Six Sigma
• Six Sigma was develop by Motorola around 1985 and make famous by GE.
“Six Sigma is a commited management approach to quantifiably solve problems and optimize critical process”...ASQ
“implementing six sigma into your corporate cluture improves processes, maximize business performance and adds to your bottom line”...ASQ
“six sigma is a discilpined and data-driven approach for problem solving in any process.”
“a quality measure and improvement program developed by motorola that focuses on the control of a process to the point of 3.4 defects per million
oppurtunity...”
4
What is Six Sigma
“sigma”Is a measurement scale upon which
improvements can be gauged.
“six sigma”Is an overall methodology that drives business
improvement.

5
History of Six Sigma
1950s 1960s 1970 1980s 1990s 2000 2005
Total Quality Control
Motorola’s Six Sigma Methodology
Six Sigma/ Quality Awards
Statistical Quality Control
ISO 9000/ Total Quality Management
Lean ManufacturingLean Six Sigma
Design for Six Sigma (DFSS)/ Six Sigma for Production Development (SSPD)

6
Definition of Six Sigma• There are three different levels that Six Sigma can be defined and understood.
Metric •It can be defined as metric 3.4 Defects per Million Opportunities (DPMO). That allows taking Complexity of product or process into account.
Methodology •It could be described as structured problem-solving roadmap and tools. For Example: Define, Measure, Analyse, Improve, and Control (DMAIC) and Design for Six Sigma (DFSS) methodologies.
Philosophy •It can be used as philosophy in reducing variation in business and take customer-focused and data driven decisions.
7
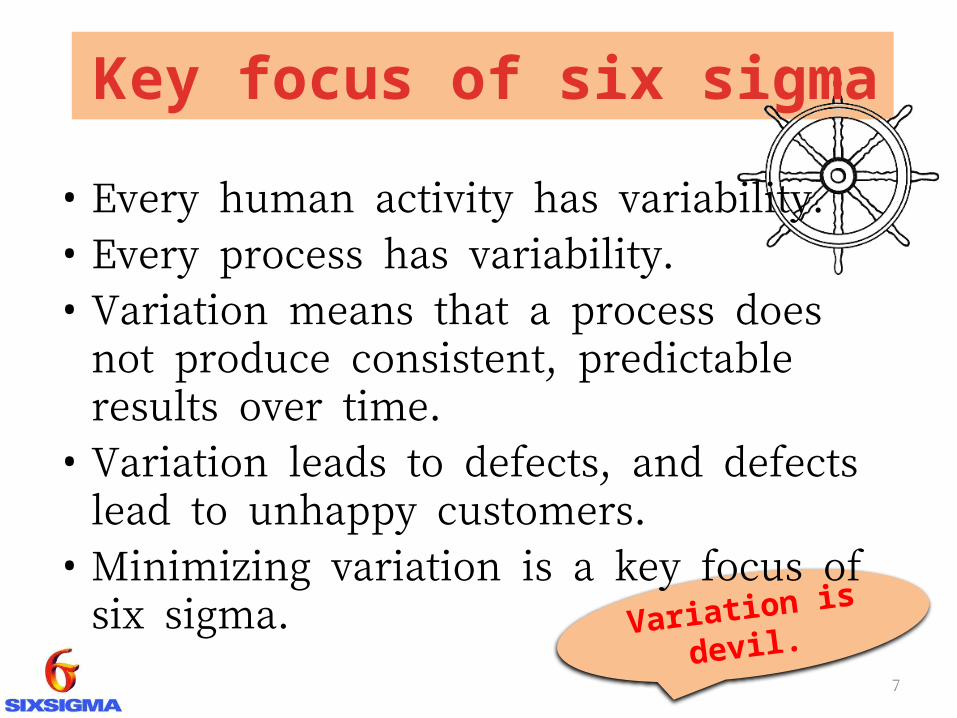
Key focus of six sigma
Variation is devil.
• Every human activity has variability.• Every process has variability.• Variation means that a process does not
produce consistent, predictable results over time.
• Variation leads to defects, and defects lead to unhappy customers.
• Minimizing variation is a key focus of six sigma.

8
Statistical Meaning of Six Sigma
Defect per million
opportunity
% Accuracy Competitive Level
6 3.4 99.99966 World Class
5 233 99.9767 World Class
4 6,210 99.956 Industry Average
3 66,807 99.73 Industry Average
2 3,08,537 95.46 Non-Competitive
1 6,90,000 68.26 Non-Competitive
Table 1: Six Sigma Process Capability, percentage of accuracy and competitive level (Schroeder,2008)
9
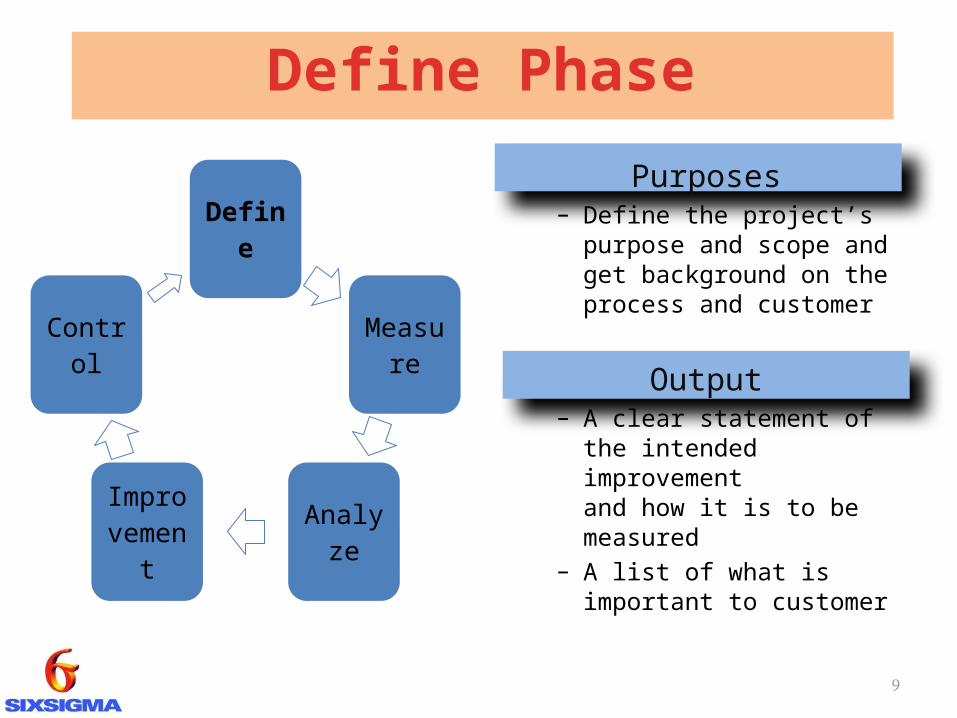
Define Phase
Define
Measure
Analyze
Improvement
Control
Purposes– Define the project’s purpose
and scope and get background on the process and customer
Output– A clear statement of the
intended improvement and how it is to be measured
– A list of what is important to customer
10
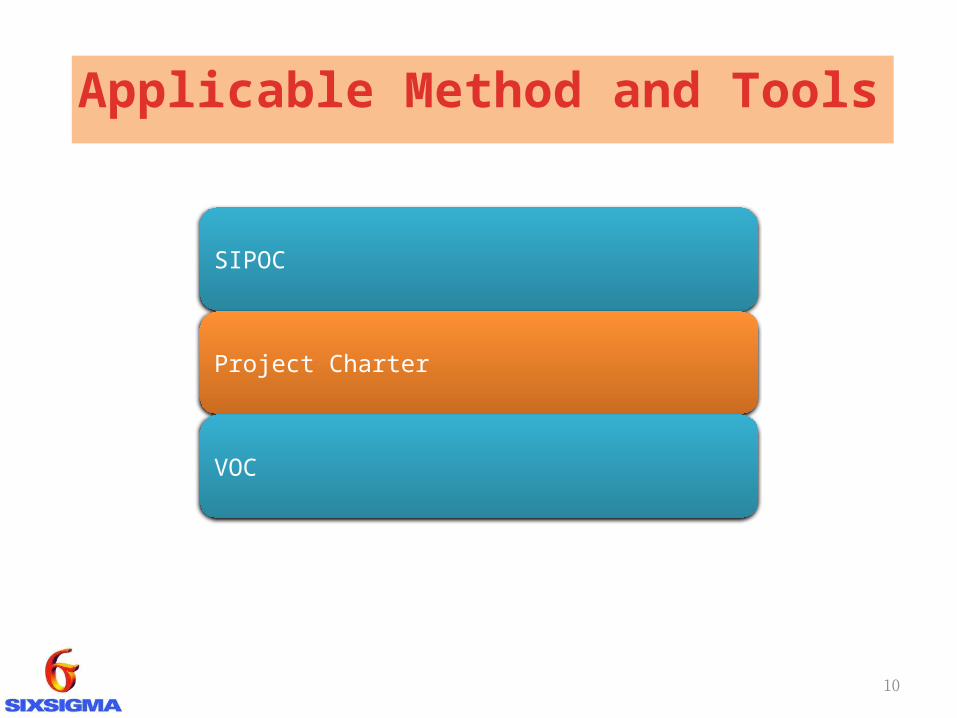
Applicable Method and Tools
SIPOC
Project Charter
VOC

11
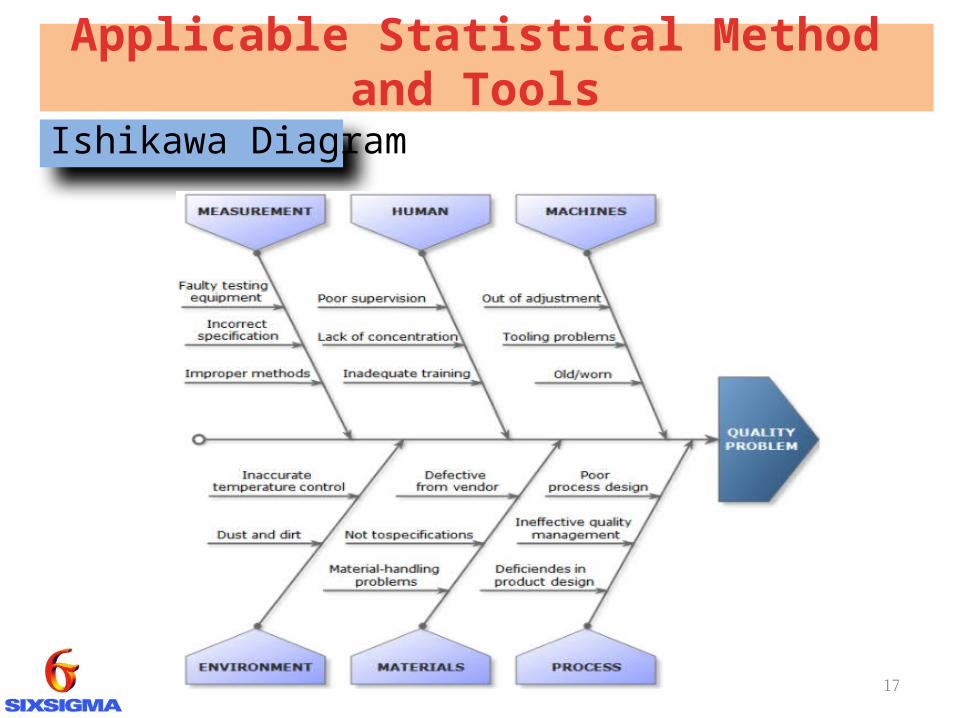
SIPOC• A SIPOC diagram is a tool that is used to gather a view of
process information.• SIPOC stands for Suppliers, Inputs, Process, Outputs and
Customers.
Benefits:• Remove ambiguity.• Immediate
understanding of project boundaries.
• Simple to understand by team.
12
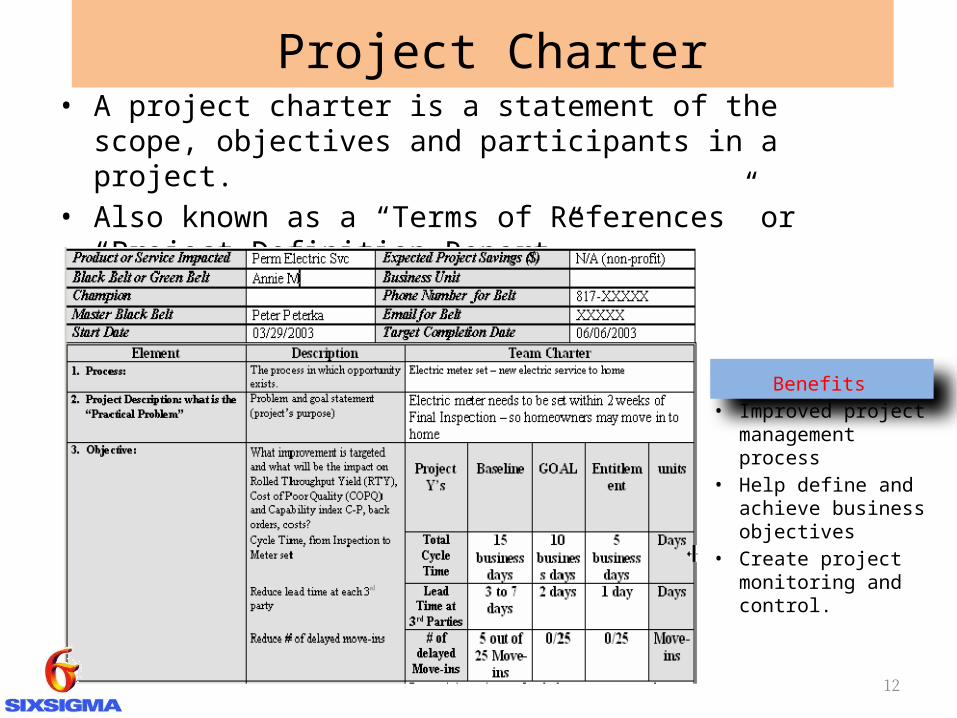
• A project charter is a statement of the scope, objectives and participants in a project.
• Also known as a “Terms of References” or “Project Definition Report”
Project Charter
Benefits• Improved project
management process
• Help define and achieve business objectives
• Create project monitoring and control.
13
VOC• VOC stands for Voice of the Customers.• Customers - Any person or organization that receives a
product or service (output) from the work activities (Process)
• Types of “customers”: 1. External (individuals or organization)2. Internal (colleagues – marketing, management, stockholders)3. Regulatory ( government agency – OSHA, EPA)
• Benefits – improve customer loyalty, ensure continuous business growth, improve product innovation.
14
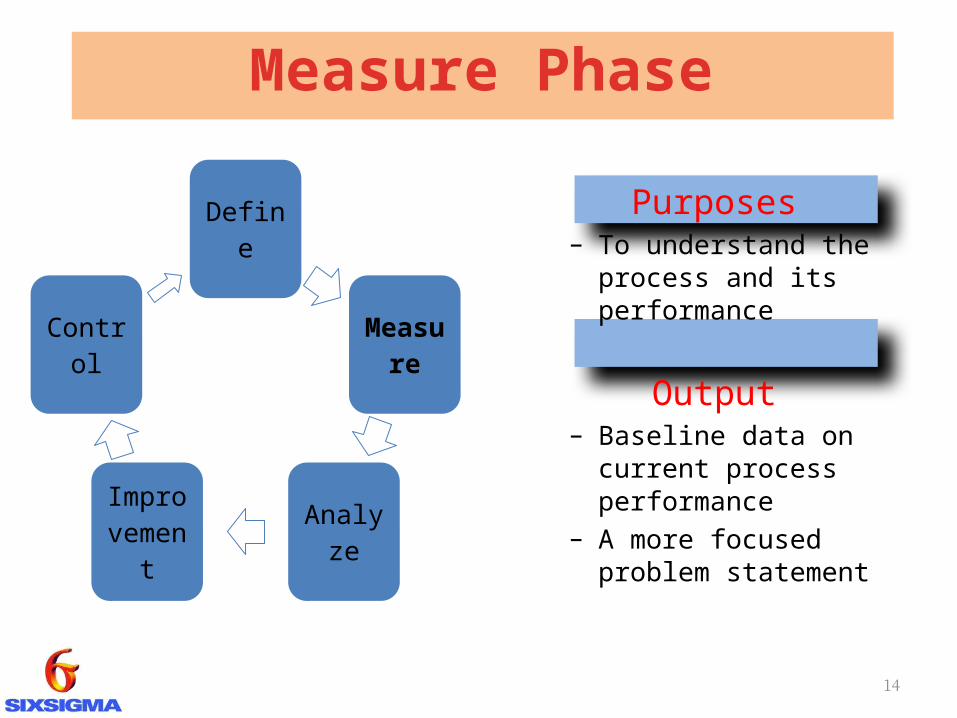
Measure Phase
Define
Measure
Analyze
Improvement
Control
Purposes– To understand the process
and its performance
Output– Baseline data on current
process performance– A more focused problem
statement
15
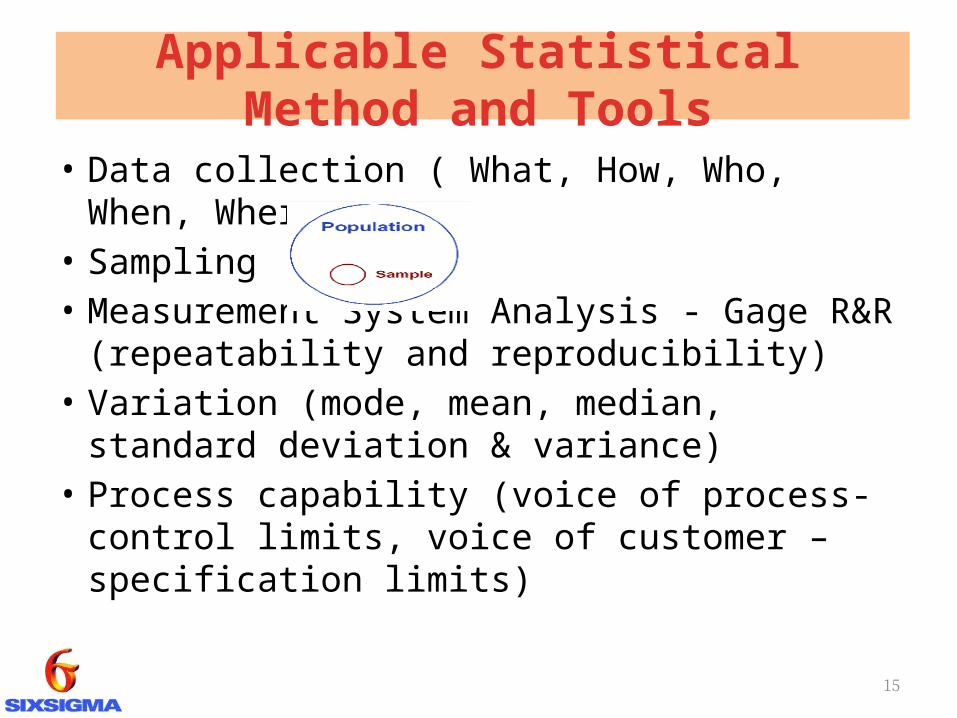
Applicable Statistical Method and Tools
• Data collection ( What, How, Who, When, Where)
• Sampling • Measurement System Analysis - Gage R&R
(repeatability and reproducibility)• Variation (mode, mean, median, standard
deviation & variance)• Process capability (voice of process-control
limits, voice of customer – specification limits)

16
Applicable Statistical Method and Tools
FM
EA
17
Applicable Statistical Method and Tools
Ishikawa Diagram

18
Statistical Process Control (SPC)

19
Pareto Analysis

20
Analyze PhasePurpose1. The third stage analyze serves as an
outcome of the measure stage. 2. This stage will begin streamlining its
focus on a distinct group of project issues and opportunities.
3. In other words, this stage allows the team to further target improvement opportunities by taking a closer look at the data.
Outcome/OutputThe team should have a strong understanding of the factors impacting their project including:4. Key process input variables ( the vital
few Xs that impact the Y)5. Sources of variation where the greatest
degree of variation exists.
Define
Measure
Analyze
Improvement
Control

21
The team are able to do this by performing the following specific sequence of tasks:
Perform capability analysis:
this is a process for establishing the current performance level of the process being. This baseline capability will be used to verify process improvements through the improve and control phases.
Select analysis tools:
this step will help the team to look at the complete set of graphical analysis tools to determine how each tool may be used to reveal details about process and variation.
Apply graphical analysis tools:
this refers to the technique of applying a set of basic graphical analysis tools to data to produce a visual indication of performance.
Identify sources of variation:
this refers to the process of identifying the sources of variation in the process under study, using statistical techniques, so that significant variation is identified and eliminated.
22
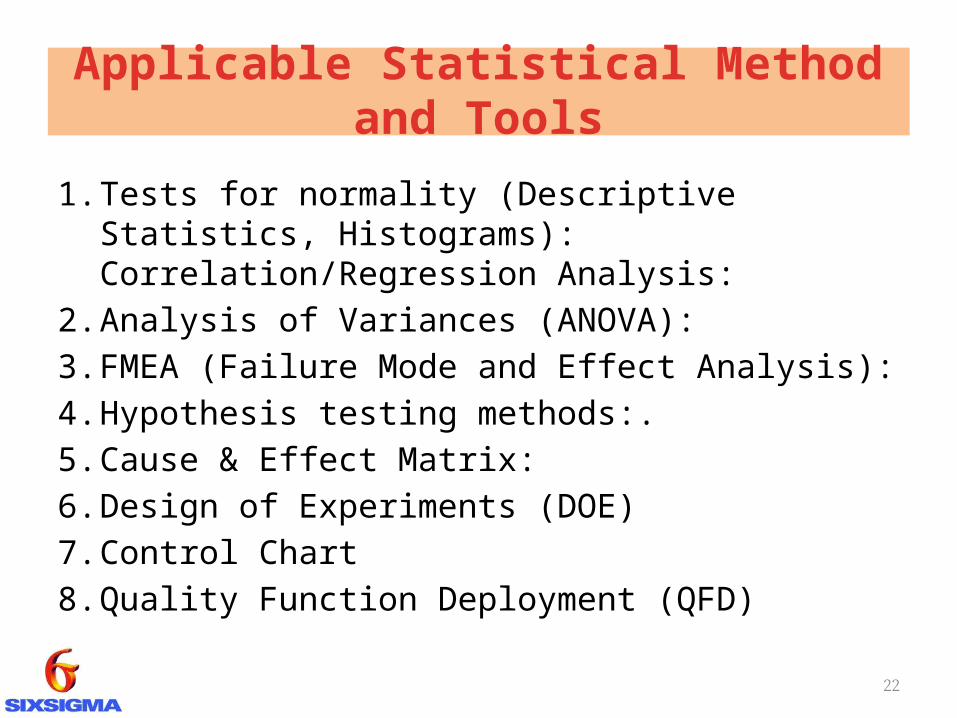
Applicable Statistical Method and Tools
1. Tests for normality (Descriptive Statistics, Histograms): Correlation/Regression Analysis:
2. Analysis of Variances (ANOVA):3. FMEA (Failure Mode and Effect Analysis):4. Hypothesis testing methods:.5. Cause & Effect Matrix:6. Design of Experiments (DOE)7. Control Chart8. Quality Function Deployment (QFD)

23
Improvement Phase• Purpose
The fourth stage improves aims to generate idea, design, and pilot and implement improvement and validate the improvement.
• Outcome/OutputThe most important items in this stage are 1. the process of brainstorming, 2. the development of the process map, 3. review of the current FMEA,
preliminary cost/benefit analysis, 4. a pilot of the recommended action
and the preliminary implementation process.
Define
Measure
Analyze
Improvement
Control
24
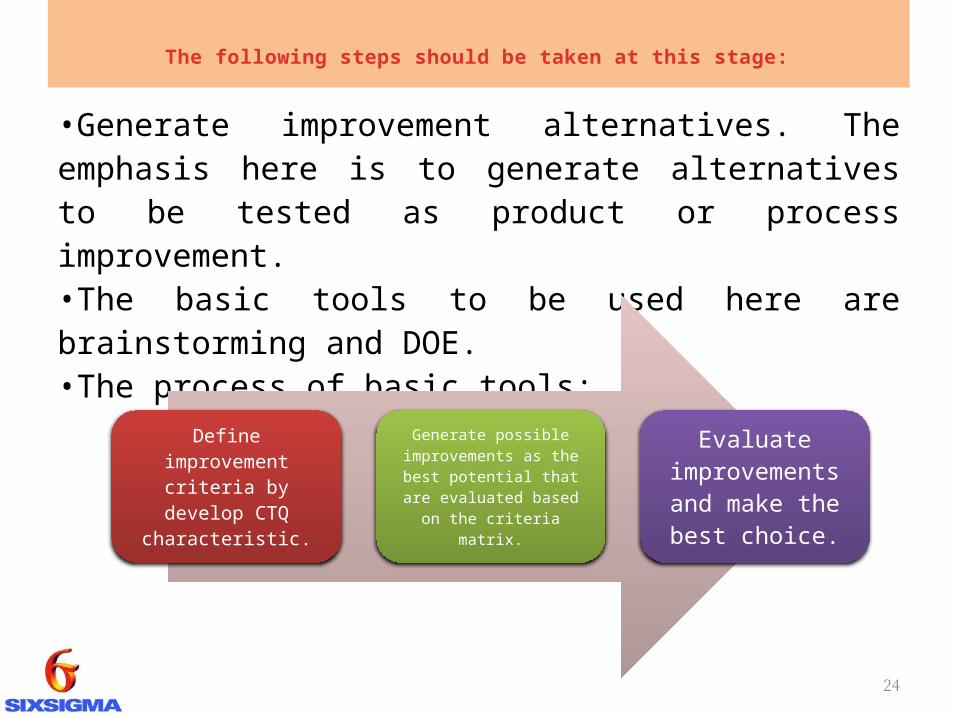
The following steps should be taken at this stage:
•Generate improvement alternatives. The emphasis here is to generate alternatives to be tested as product or process improvement. •The basic tools to be used here are brainstorming and DOE. •The process of basic tools:
Define improvement
criteria by develop CTQ characteristic.
Generate possible improvements as the
best potential that are evaluated based on the criteria matrix.
Evaluate improvements and
make the best choice.

25
Applicable Statistical Method and Tools
Process Mapping
Process Capability Analysis (Cpk)
DOE (Design of Experiment)
26
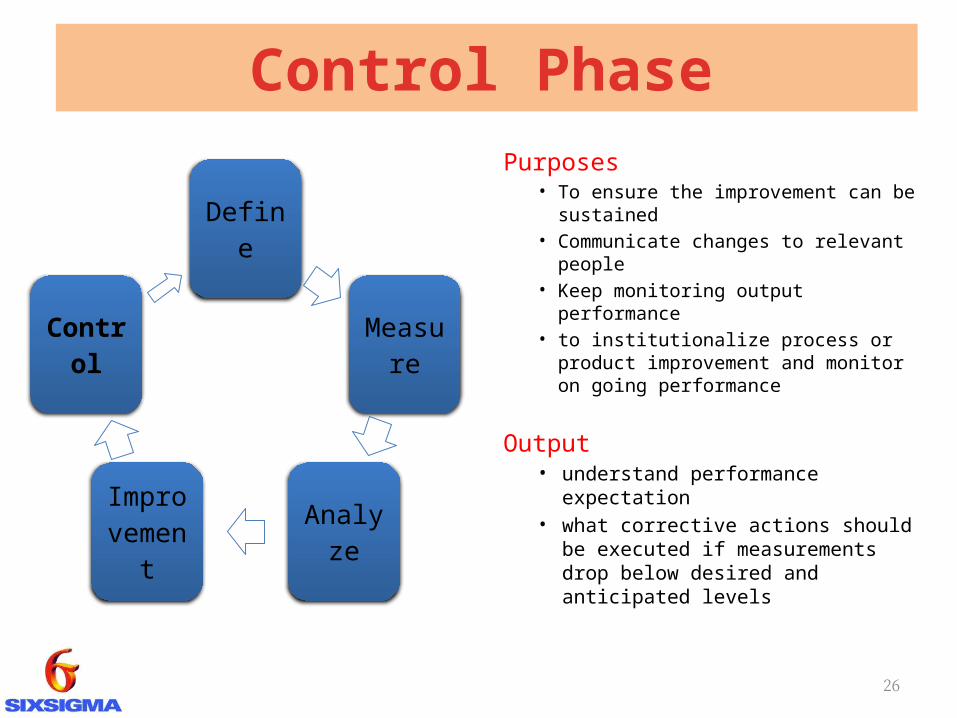
Control Phase
Define
Measure
Analyze
Improvement
Control
Purposes• To ensure the improvement can
be sustained• Communicate changes to
relevant people• Keep monitoring output
performance• to institutionalize process or
product improvement and monitor on going performance
Output• understand performance
expectation• what corrective actions should
be executed if measurements drop below desired and anticipated levels

27
Applicable Statistical Method and Tools
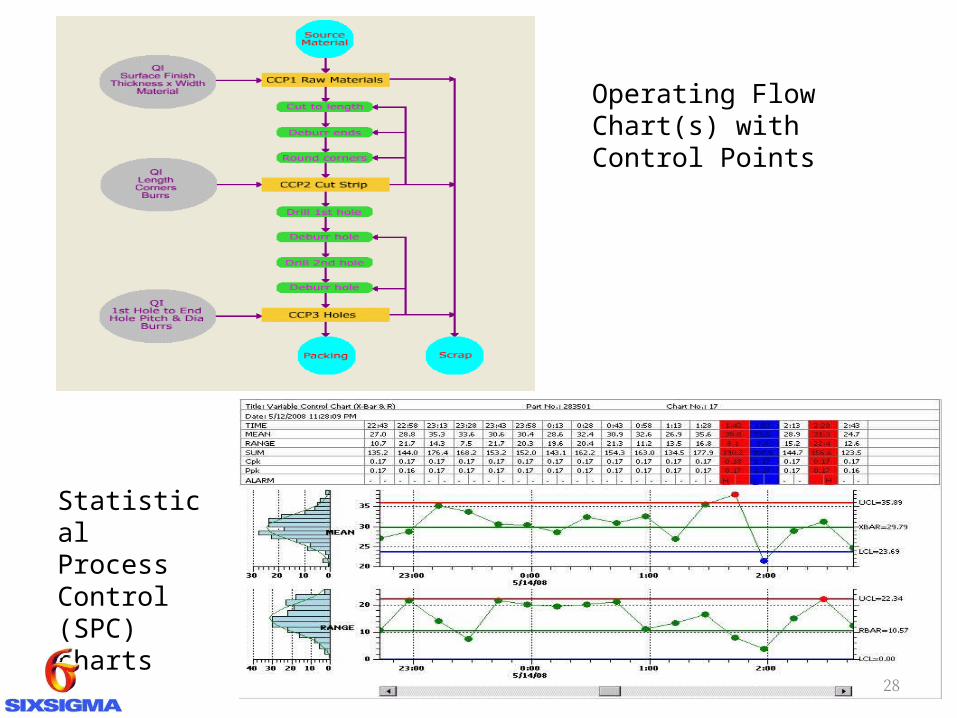
Operating Flow Chart(s) with
Control Points
Statistical Process Control
(SPC) charts
Control Plans Check Sheets
28
Operating Flow Chart(s) with Control Points
Statistical Process Control (SPC) charts

29
Check Sheet
Control Plan
30
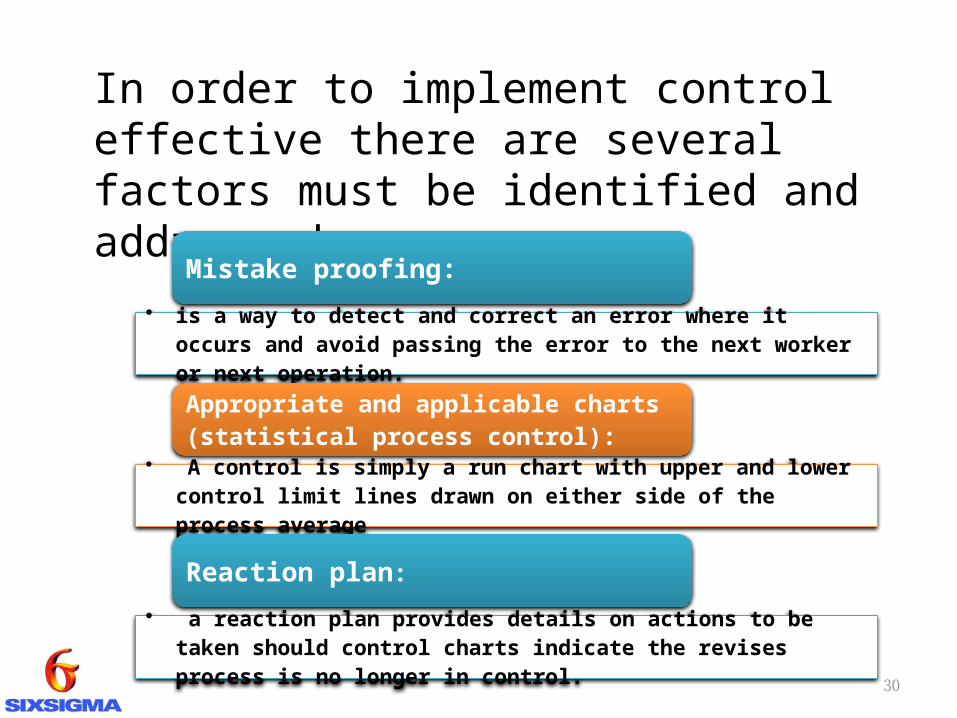
In order to implement control effective there are several factors must be identified and addressed.
Mistake proofing:
• is a way to detect and correct an error where it occurs and avoid passing the error to the next worker or next operation.
Appropriate and applicable charts (statistical process control):
• A control is simply a run chart with upper and lower control limit lines drawn on either side of the process average
Reaction plan:
• a reaction plan provides details on actions to be taken should control charts indicate the revises process is no longer in control.

31
Documentation
What is docume
nt?
• Project documentation – workbook
• New SOPs, work instruction etc.• Reaction plan in order to control
performance• Establish new visual control chart
Why docum
ent?
• Best practice sharing – replicate similar solution to other process
• To communicate and train people on new process
• Act as a guide for the person who carry out the task
• Everyone should have same understanding

32
Visual control
It is a visual display that is easy to understand and practical to update
for everyone
Transparent to everyone so that quick
action can be taken if any
Should be in color to
make it easy to read
33
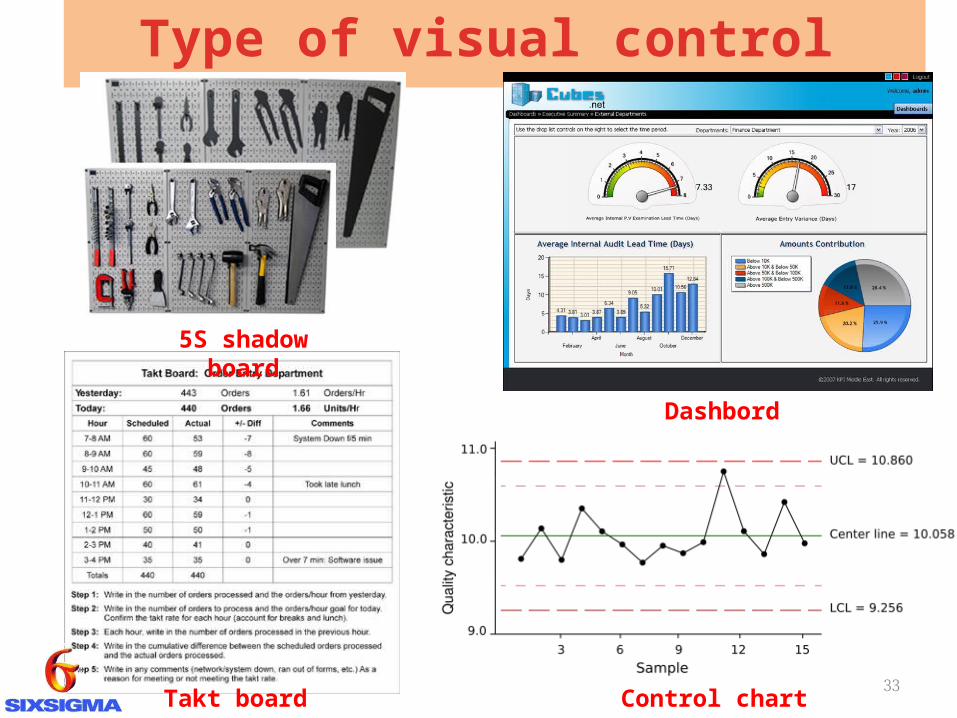
Type of visual control
Control chart
Dashbord
5S shadow board
Takt board

34
Visual control tipsIt
should relate to key output measurementFrequency of update should
be practical and bring value
Reaction plan must
be clear if process not in
control
Easy to update
and assign responsibi
lity

35
BENEFIT OF APPLYING SIX SIGMA
Search for continued improvement in
processes
Better understanding of
customer requirement
Maximisation of profits through improvement in
quality
Increased productivity
Reduction in cycle times
Increase production capability and
reliability
Reduction of defects, costs
and loses.

36
CHALLENGES IN IMPLEMENTING SIX SIGMA
Too much focus on the black belts and green belt training without identifying projects for improvement after the training.
Lack of understanding of the strategic intent of Six Sigma.
Too many books and talks about Six Sigma cause confusion,.
Lack of innovation in problem solving other words no real breakthroughs.
Lack of support for small business in implementation of Six Sigma.

37
Case Study: Summary application in MotorolaCase Study: Summary application in Motorola
Introduction •Motorola has implemented Six Sigma to reduce cost and improving organizational bottom line.•Motorola won the Malcolm Baldrige National Award in 1988.
Problem Encountered •The problem face by Motorola in 1987 the company was operating in four sigma level. This equal to defect rate of about 6,200 DPMO compare to its Japanese counter parts that were running at 3.4 DPMO. •The defect leads to increase cost to sales and reduce the profit as well as contributed to lose market share. •At that time Motorola’s customers included many police, fire, and emergency response organizations that relied on radios and communication equipment manufactured by Motorola. •Losing these customers will become financial disaster for Motorola.

38
Continued
Action Taken •Bob Galvin CEO of Motorola has directed initiative for the company.
•These directions are: Improve product quality by ten times in two years, Improve product quality by 100 times in four years and reach Six Sigma quality level in five years.
•The goal of Six Sigma is to reduce defect increase the productivity. Hence, improve customer satisfaction.
Result •According to McClusky (2000) Motorola focus on reducing defects to the target of 3.4DPMO level was quantified in dollar $2 billion over a four year period.
•An example of Motorola applied Six Sigma on the redesign and manufacturing of its pages in 1990. Pagers were new technology in 1990 and Motorola’s pages were highly priced about $1500 and it took about 18 month to product.
•McClusky (2000) has stated that the lead time went from 18months to 72minutes while the cost when from $1500 to $200.

39
Conclusion• Six Sigma is a methodology that can improve the
business performance and reduce the process variation.
• Three different levels that Six Sigma can be defined and understood are: Metric, Methodology and Philosophy
• Methodology DMAIC is used.
Related Documents