LOCAL LAW 84 ENERGY BENCHMARKING DATA REPORT TO THE NEW YORK CITY MAYOR’S OFFICE OF LONG-TERM PLANNING AND SUSTAINABILITY Prepared by: Dr. Constantine E. Kontokosta, PE, AICP New York University Director, NYU Center for the Sustainable Built Environment Deputy Director, NYU Center for Urban Science and Progress FINAL – March 14, 2012 UPDATED – April 11, 2012

Welcome message from author
This document is posted to help you gain knowledge. Please leave a comment to let me know what you think about it! Share it to your friends and learn new things together.
Transcript

LOCAL LAW 84 ENERGY BENCHMARKING DATA
REPORT TO THE NEW YORK CITY MAYOR’S OFFICE OF LONG-TERM PLANNING
AND SUSTAINABILITY
Prepared by:
Dr. Constantine E. Kontokosta, PE, AICP
New York University
Director, NYU Center for the Sustainable Built Environment
Deputy Director, NYU Center for Urban Science and Progress
FINAL – March 14, 2012
UPDATED – April 11, 2012

Report to the Mayor’s Office of 1 Constantine E. Kontokosta, PhD, PE Long-Term Planning and Sustainability New York University
1.0 EXECUTIVE SUMMARY
At the request of New York City Mayor’s Office of Long-Term Planning and Sustainability, this
report provides an analysis of building energy consumption data as required by Local Law 84
(LL84). Following a description of the database, this report focuses on three primary areas. First,
a predictive model of building energy consumption is developed, which builds on an analysis of
the influence of several factors in determining energy use intensity (EUI) for office and multi-
family properties. Second, a preliminary discussion of the underlying analytic foundations of a
multi-family energy rating system is presented. Finally, this report analyzes the spatial
distribution and patterns of energy consumption and efficiency across New York City.
The initial database included energy consumption information for 10,201 buildings. After data
cleaning and validity testing, the final dataset includes 8,648 buildings. These buildings account
for over 1.4 billion square feet of space, with multi-family buildings representing approximately
63 percent of the total space. For the 948 office buildings included in the sample, the median
source EUI is 213.3 and the mean is 233.8 with a standard deviation of 111.0. The median EUI
for office buildings is within 1.6 percent of the weather-adjusted primary energy use intensity for
office buildings in the Northeast region, according to the 2003 Commercial Building Energy
Consumption Survey. The median source EUI for the 6,671 multi-family buildings in the
database is 132.2 and the mean is 136.5 with a standard deviation of 55.7. The median EUI for
New York City multi-family properties is within 1.7 percent of the weather-adjusted primary
energy use intensity for buildings with five or more units in the Northeast region as reported in
the 2005 Residential Energy Consumption Survey.
The factors influencing building energy efficiency are analyzed using multivariate regression
models with robust standard errors. The models include independent (explanatory) variables
from both LL84 and PLUTO databases, together with new interaction variables. For office
buildings, the results indicate that the significant drivers of building energy efficiency, as
measured by changes in source EUI, are building age, fuel type, location and size of lot, building

Report to the Mayor’s Office of 2 Constantine E. Kontokosta, PhD, PE Long-Term Planning and Sustainability New York University
size, the amount of non-office space, operating hours, and worker density. For multi-family
buildings, the primary determinants of building energy efficiency include building age, fuel type,
location and size of lot, building size, laundry facilities per unit, and whether the building
contains all subsidized units.
The spatial analysis of the data reveals some interesting findings with respect to patterns of
energy efficiency across the five boroughs of New York City. In particular, of the zipcodes with
the worst-performing buildings, on average, all are in Manhattan. For multi-family buildings, the
worst-performing buildings are located in the poorest and wealthiest zipcodes based on median
household income. As a preliminary test of neighborhood impacts of building energy efficiency,
a positive correlation is found between asthma rates and high median energy use intensities,
although this does not control for other neighborhood factors and should be interpreted only as
an area for further exploration.
The LL84 data provides an important first look at a robust, heterogeneous sample of building
energy consumption. As additional data are added to the database from the annual reporting
requirements, time trends in energy efficiency and pre/post studies will become possible. Also,
by merging the LL84 database with other relevant building and neighborhood data sources, the
potential uses of the data, and hypotheses that can be tested and explored, will increase
dramatically.

Report to the Mayor’s Office of 3 Constantine E. Kontokosta, PhD, PE Long-Term Planning and Sustainability New York University
2.0 INTRODUCTION
The tenuous position of federal climate change policy in the U.S. has necessitated a more
market-driven, city-focused approach to energy efficiency in the building sector. Strategies and
policy initiatives involve a combination of local regulations to improve efficiency standards
coupled with incentives and market-based mechanisms to catalyze innovation in the marketplace
and create value around building energy performance. Cities have taken the lead in this respect,
with more than 50 U.S. cities adopting some form of green building policy since 2001, as shown
in Figure 2.0.1 (Kontokosta 2011a). These policies predominantly mandate or encourage newly
constructed public sector and, in some cases, privately-owned buildings to achieve an eco-label
certification – such as the U.S. Green Building Council’s LEED certification or the
Environmental Protection Agency’s Energy Star label.
However, increasing attention is being placed on existing commercial buildings as an
opportunity to reduce greenhouse gas (GHG) emissions, increase efficiencies, and create new
investment and employment opportunities. Approximately 75 percent of commercial buildings in
the U.S. were built more than 20 years ago, and 30 percent were built more than 50 years ago
(U.S. Department of Energy 2008). In New York City, one of the oldest urban centers in the
U.S., fully 85 percent of buildings that will be standing by 2030 have already been constructed
(City of New York 2011). The existing building stock represents a significant opportunity to
reduce total emissions through energy efficient retrofit strategies. However, substantial
challenges remain to scaling up energy efficiency and GHG emission reduction measures in
existing buildings, including regulatory, economic, technological, and behavioral constraints.

Report to the Mayor’s Office of 4 Constantine E. Kontokosta, PhD, PE Long-Term Planning and Sustainability New York University
Figure 2.0.1: Number of U.S. Cities with Green Building Policy and Sustainability Plan (Kontokosta
2011a)
Energy disclosure laws represent one of the most promising public policy tools to accelerate
market transformation around building energy efficiency. These laws require building owners to
report energy consumption on an annual basis. The first and most ambitious of these policies is
New York City’s Local Law 84 (hereafter LL84 and the subject of this report), adopted as part of
Mayor Bloomberg’s Greener, Greater Buildings Plan in 2009. Local Law 84 stipulates that all
commercial (including multi-family) buildings of 50,000 square feet (approximately 4,645
square meters) or more must report energy and water consumption on an annual basis. The first
deadline for reporting occurred in August of 2011.
This database represents one of the largest and most heterogeneous collections of non-voluntary
building energy performance data in the nation. This information will allow New York City, and
other cities with such policies including Seattle, San Francisco, and Washington DC, to
understand the factors that influence building energy consumption, to create a benchmark for
investment-quality comparisons across building types, and to provide the market with sufficient
information to account for energy efficiency in investment decisions.
The potential for energy disclosure policies to shift market awareness of building energy
efficiency is substantial. Research has shown that similar disclosure requirements in other
Source: Kontokosta2011
0
5
10
15
20
25
30
35
40
45
50
55
2000 2001 2002 2003 2004 2005 2006 2007 2008 2009 2010
Cum
ulat
ive
Num
ber o
f Citi
es
Green Building Policy Sustainability Plan

Report to the Mayor’s Office of 5 Constantine E. Kontokosta, PhD, PE Long-Term Planning and Sustainability New York University
industries, such fuel efficiency in the auto sector and nutrition labels for food served by “chain”
restaurants, has led to changes in behaviors by both produces/suppliers and consumers/end-users
(Day 1976; Vadiveloo, Dixon, and Elbel 2011). In the building sector, greater information on
energy performance will allow tenants to incorporate energy efficiency metrics into leasing
decisions. This, in turn, should create demand for more efficient buildings, thereby encouraging
building owners to improve the relative energy efficiency of their building to make it more
competitive.
There are, however, numerous impediments to energy efficiency improvements in existing
buildings resulting from information asymmetries. One well-known challenge is the “split
incentive” problem, defined as the mismatch between costs and benefits for owners and tenants
in multi-tenant commercial buildings (Gillingham, Harding, and Rapson 2012; Schleich 2009).
An emerging contractual tool known as the “energy-aligned lease” works to overcome this
mismatch by clearing defining how costs for energy efficiency improvements are passed-through
from owner to tenant (see Figure 2.0.2). Another challenge is the availability and cost of capital
for energy efficiency improvements (Galuppo and Tu 2010; Kontokosta 2011b). Currently,
uncertainty and risk around the potential energy savings from improvements has limited the
sources of funds for building owners seeking to retrofit their buildings.
Figure 2.0.2: Energy-Aligned Lease Description (Source: NYC OLTPS)

Report to the Mayor’s Office of 6 Constantine E. Kontokosta, PhD, PE Long-Term Planning and Sustainability New York University
There are a number of innovative financing mechanisms that have been developed, including
performance contracts, on-bill financing, property-assessed clean energy (PACE) bonds, together
with equity investors willing to fund what are perceived as high-yield, high-risk investments in
energy efficiency improvements. Energy performance data collected through energy disclosure
laws has the potential to increase the volume and quality of information on building energy
efficiency and help to reduce uncertainty around patterns of building energy consumption and
the savings expected from a building energy retrofit and specific energy conservation measures
(ECMs). These data, together with pre/post studies of energy consumption in retrofitted
buildings, will help to minimize risk and thus reduce the cost of capital for building owners
seeking to optimize the efficiency of their property. By lowering the cost of capital for building
retrofits, the yield on such investments will increase and shift the calculus of the business case
for sustainable buildings.
More information and data on building energy consumption also has significant implications for
infrastructure investment, particularly as it relates to the electricity grid and other sources of
energy. By identifying clusters of poorly-performing or high consumption buildings, cities and
utility companies can more efficiently determine where to focus their capital budgets and how
best to target energy efficiency incentives. This type of information could also be used to locate
potential areas for distributed generation facilities and other forms of shared renewable energy
capabilities. Finally, understanding the spatial patterns of energy consumption can help
neighborhoods to better plan future development and address issues of carbon emissions and
potential negative externalities of inefficient buildings, including air quality and other public
health concerns.
The growing availability, coverage, and granularity of building data have the power to transform
real estate markets and investment decision-making around sustainability and energy efficiency.
By properly collecting, analyzing, and disseminating this type of information, all of the key
decision-makers in sustainable building markets – owners, tenants, lenders and investors, city
agencies, utility companies – will have a robust source of data that will allow asset and portfolio-
level decisions to include environmental impact as an important criterion in defining a suitable

Report to the Mayor’s Office of 7 Constantine E. Kontokosta, PhD, PE Long-Term Planning and Sustainability New York University
investment. By shifting market values to account for energy and emissions, the potential exists to
catalyze a significant scaling up of energy efficiency initiatives in the global buildings sector.

Report to the Mayor’s Office of 8 Constantine E. Kontokosta, PhD, PE Long-Term Planning and Sustainability New York University
3.0 DATA DESCRIPTION AND BACKGROUND
This report analyzes energy consumption and building data for commercial buildings over
50,000 square feet in New York City. These data were collected as per New York City LL84,
which requires annual energy consumption reporting for large commercial buildings. This
analysis includes all covered buildings for which information was submitted by August 31st,
2011. The LL84 database was then merged with building and lot information from the Primary
Land Use Tax Lot Output (hereafter PLUTO) data file from the New York City Department of
City Planning. The initial merged database contained 59 variables from PLUTO and 166
variables from the LL84 database enter through the EPA’s Portfolio Manager tool.
3.1 Data Cleaning
Initially, the database contained 10,201 observations. However, substantial cleaning was
performed to remove errors and omissions in data entry through the EPA Portfolio Manager
interface. An observation was dropped from the analysis if it exhibited one of the following
characteristics:
• Building located outside of the political boundaries of the five boroughs of New York
City
• Facility Type was not indicated
• No Energy Use Intensity (EUI) value was provided
• Duplicate entries
In addition, the top and bottom one percent of buildings by EUI were omitted as outliers. The
resultant cleaned database contains 8,648 observations. Additional measures were taken to
ensure the accuracy and validity of the remaining observations, including mean testing with a
quality-controlled sample of the dataset.
The dropped observations are indicative of a range of data entry errors and uncertainty in how to
report certain unusual circumstances relating to building and meter configuration. For instance,
two buildings on two separate parcels, but with a shared meter, might have been entered with all

Report to the Mayor’s Office of 9 Constantine E. Kontokosta, PhD, PE Long-Term Planning and Sustainability New York University
of the energy consumption attributed to just one building (and thus resulting in zero energy
consumption for the other) or by arbitrarily allocating energy use between the two buildings.
3.2 Descriptive Statistics
The figures below provide a descriptive analysis of the type and quantity of space covered by the
data and patterns of energy and water consumption and energy efficiency, as measured by source
energy use intensity unless otherwise indicated. Source energy is the energy used during
generation and transmission in addition to energy consumed at the site (EPA 2011).
In total, over 1.4 billion square feet of commercial space reported energy consumption by August
2011. A large majority, both by square footage and number of buildings, are multi-family
properties. Office buildings represent the second largest amount of space reported.
Figure 3.2.1: Total Square Footage in LL84 Database, by Building Type
Other 177,508,208
Office 340,688,576
Multi-Family 897,219,264

Report to the Mayor’s Office of 10 Constantine E. Kontokosta, PhD, PE Long-Term Planning and Sustainability New York University
Distribution of Building Energy Use Intensities
Figure 3.2.2: Histogram of Source EUI with Kernel Density Plot, Office Buildings Only
Figure 3.2.3: Histogram of Source EUI with Kernel Density Plot, Multi-Family Buildings Only
02
46
Per
cent
0 100 200 300 400 500Current Weather Normalized Source Energy Intensity (kBtu/Sq. Ft.)
02
46
810
Per
cent
0 100 200 300 400 500Current Weather Normalized Source Energy Intensity (kBtu/Sq. Ft.)
Median EUI = 213.3
Median EUI = 132.2
CBECS 2003: Northeast Region EUI for Office Buildings = 210
RECS 2005: Northeast Region EUI for Residential Buildings with 5 or more units = 130

Report to the Mayor’s Office of 11 Constantine E. Kontokosta, PhD, PE Long-Term Planning and Sustainability New York University
Figure 3.2.4: Histogram of Source EUI with Kernel Density Plot, Hotel/Lodging Buildings Only
Figure 3.2.5: Histogram of Source EUI per Occupant, Office Buildings Only
05
1015
Per
cent
0 200 400 600Current Weather Normalized Source Energy Intensity (kBtu/Sq. Ft.)
05
1015
Per
cent
0 1 2 3 4 5SourceEUIperOccupant

Report to the Mayor’s Office of 12 Constantine E. Kontokosta, PhD, PE Long-Term Planning and Sustainability New York University
Figure 3.2.6: Histogram of Source Energy per Occupant, Office Buildings Only
Figure 3.2.7: Histogram of Source Energy per Unit, Multi-Family Buildings
02
46
8P
erce
nt
0 50000 100000 150000 200000SourceEnergyperOccupant
05
1015
Per
cent
0 100000 200000 300000 400000 500000SourceEnergyperUnit

Report to the Mayor’s Office of 13 Constantine E. Kontokosta, PhD, PE Long-Term Planning and Sustainability New York University
Building Energy Efficiency and Fuel Type
Figure 3.2.8: Average Percent of Total Site Energy Consumption by Fuel Type, 20-Quantile (Five-Percent Increments) based on Source EUI, Office Buildings
Figure 3.2.9: Average Percent of Total Site Energy Consumption by Fuel Type, 20-Quantile (Five-Percent Increments) based on Source EUI, Multi-Family Buildings
0.2
.4.6
.8%
of T
otal
Bui
ldin
g S
ite E
nerg
y C
onsu
mpt
ion
<5%5-1
0%
10-15
%
15-20
%
20-25
%
25-30
%
30-35
%
35-40
%
40-45
%
45-50
%
50-55
%
55-60
%
60-65
%
65-70
%
70-75
%
75-80
%
80-85
%
85-90
%
90-95
%>95
%
Mean of % Electric Mean of % Natural GasMean of % Steam Mean of % No.2 Fuel OilMean of % No.4 Fuel Oil Mean of % No.5/6 Fuel OilMean of % Diesel

Report to the Mayor’s Office of 14 Constantine E. Kontokosta, PhD, PE Long-Term Planning and Sustainability New York University
Figure 3.2.10: Source EUI by % Electric Energy Source, Office Buildings
Figure 3.2.11: Source EUI by % Electric Energy Source, Multi-Family Buildings
010
020
030
040
050
0S
ourc
e E
UI
0 .2 .4 .6 .8 1% Electric
Current Weather Normalized Source Energy Intensity (kBtu/Sq. Ft.)95% Confidence IntervalFitted values
010
020
030
040
050
0S
ourc
e E
UI
0 .2 .4 .6 .8 1% Electric
Current Weather Normalized Source Energy Intensity (kBtu/Sq. Ft.)95% Confidence IntervalFitted values

Report to the Mayor’s Office of 15 Constantine E. Kontokosta, PhD, PE Long-Term Planning and Sustainability New York University
Figure 3.2.12: Bar Plot, Site EUI v. Source EUI
Figure 3.2.13: Combined Scatterplot of Water Consumption per Sq.Ft., Multi-Family and Office Buildings
050
100
150
200
250
Hotel/Lodging Multi-Family Office
Median Site EUI Median Source EUI
010
020
030
0In
door
Wat
er U
se p
er S
q. F
t. (k
Gal
)
0 200000 400000 600000 800000 1000000Total Floor Space (Sq. Ft.)
Multi-Family Office

Report to the Mayor’s Office of 16 Constantine E. Kontokosta, PhD, PE Long-Term Planning and Sustainability New York University
Figure 3.2.14: Histogram of Difference Between Self-Reported Total Square Footage and Department of Finance Total Square Footage (Multiple Buildings and Outliers excluded)
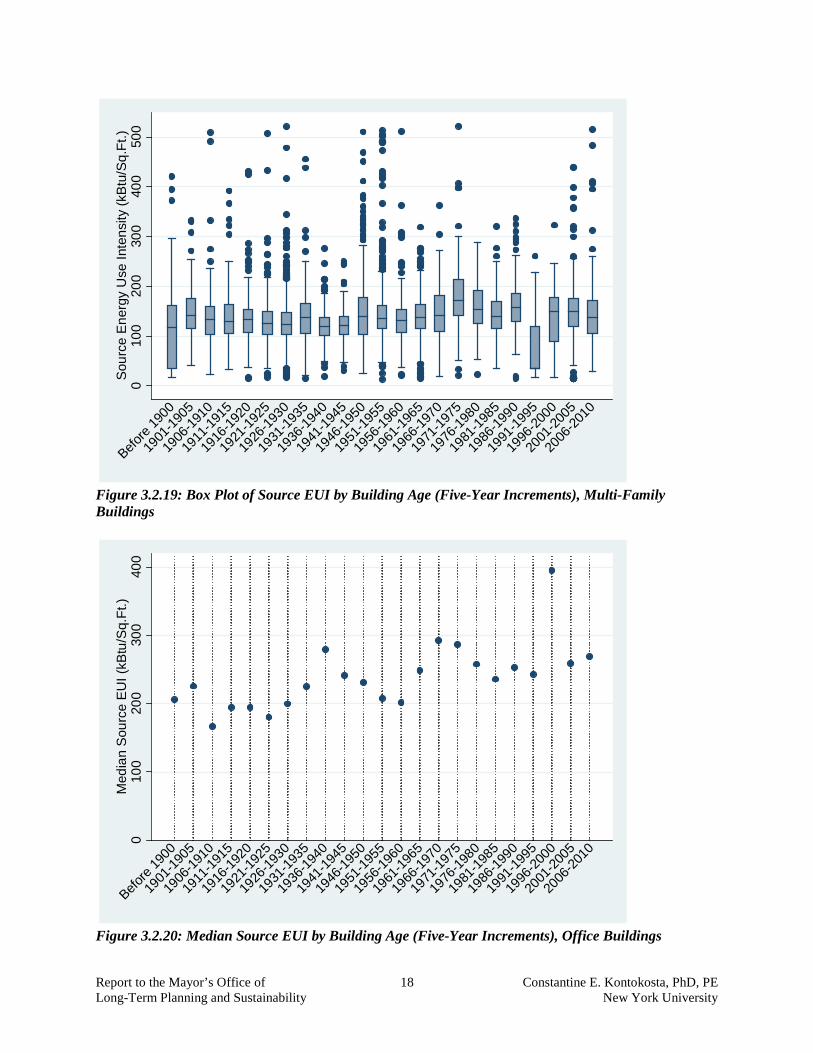
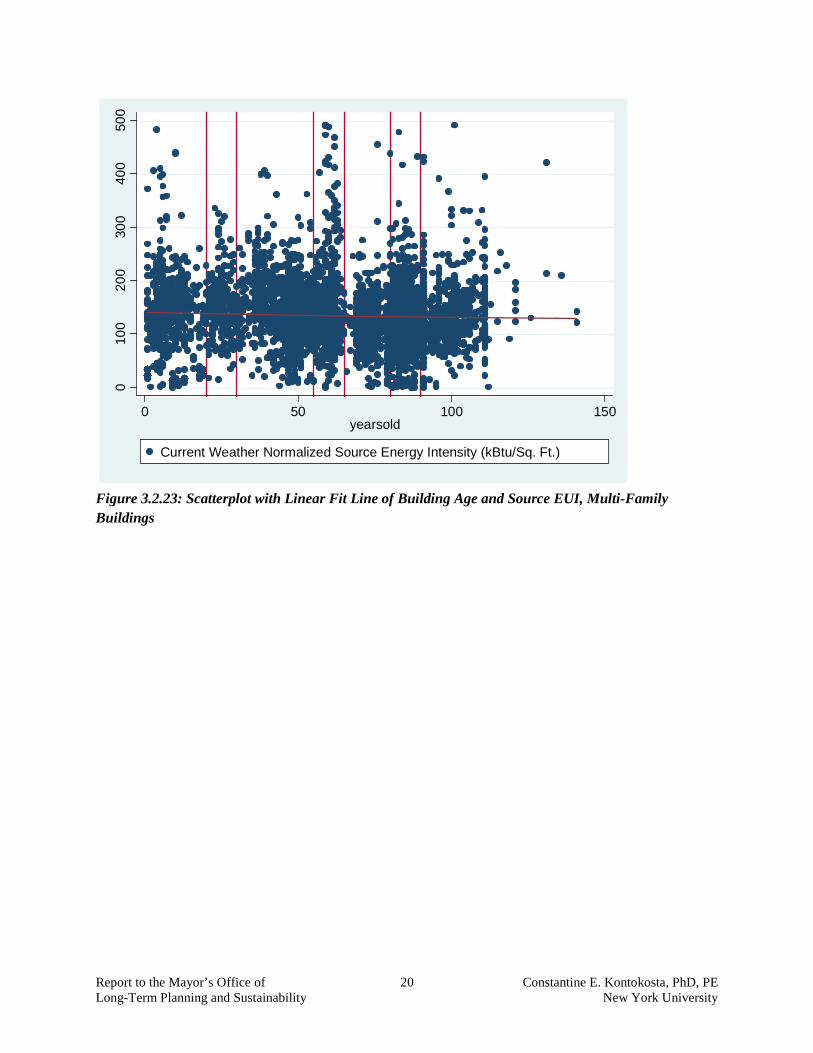
Building Age and Energy Use Intensity
The figures below present building EUI as a function of building age. For both office and multi-family
buildings, older buildings, particularly those more than 80 years old, are found to be more efficient, on
average. The data shown in the charts do not control for other building factors; this is discussed in Section
4.0. Figures 3.2.22 and 3.2.23 reveal clusters of building activity since 1900.
010
2030
4050
Per
cent
-200000 -100000 0 100000 200000FLOORAREAdiff
36.7% of Buildings Reported Dept. of Finance Square Footage

Report to the Mayor’s Office of 17 Constantine E. Kontokosta, PhD, PE Long-Term Planning and Sustainability New York University
Figure 3.2.17: Source EUI by Building Age and Type
Figure 3.2.18: Median Source EUI by Building Age (Five-Year Increments), Multi-Family Buildings
239
270.5
219.8
245.05254.4
131.6
157.8135.1126.9126.55
262.1249.45
239.9226.4
188.3
010
020
030
0W
eath
erN
orm
aliz
edS
ourc
eEU
I
Hotel/LodgingMulti-FamilyOffice
Sin
ce 1
991
1971
to 1
990
1951
to 1
970
1931
to 1
950
1930
or b
efor
e
Sin
ce 1
991
1971
to 1
990
1951
to 1
970
1931
to 1
950
1930
or b
efor
e
Sin
ce 1
991
1971
to 1
990
1951
to 1
970
1931
to 1
950
1930
or b
efor
e
050
100
150
200
Med
ian
Sou
rce
EU
I (kB
tu/S
q.Ft
.)
Before
1900
1901
-1905
1906
-1910
1911
-1915
1916
-1920
1921
-1925
1926
-1930
1931
-1935
1936
-1940
1941
-1945
1946
-1950
1951
-1955
1956
-1960
1961
-1965
1966
-1970
1971
-1975
1976
-1980
1981
-1985
1986
-1990
1991
-1995
1996
-2000
2001
-2005
2006
-2010
Report to the Mayor’s Office of 18 Constantine E. Kontokosta, PhD, PE Long-Term Planning and Sustainability New York University
Figure 3.2.19: Box Plot of Source EUI by Building Age (Five-Year Increments), Multi-Family Buildings
Figure 3.2.20: Median Source EUI by Building Age (Five-Year Increments), Office Buildings
010
020
030
040
050
0S
ourc
e E
nerg
y U
se In
tens
ity (k
Btu
/Sq.
Ft.)
Before
1900
1901
-1905
1906
-1910
1911
-1915
1916
-1920
1921
-1925
1926
-1930
1931
-1935
1936
-1940
1941
-1945
1946
-1950
1951
-1955
1956
-1960
1961
-1965
1966
-1970
1971
-1975
1976
-1980
1981
-1985
1986
-1990
1991
-1995
1996
-2000
2001
-2005
2006
-2010
010
020
030
040
0M
edia
n S
ourc
e E
UI (
kBtu
/Sq.
Ft.)
Before
1900
1901
-1905
1906
-1910
1911
-1915
1916
-1920
1921
-1925
1926
-1930
1931
-1935
1936
-1940
1941
-1945
1946
-1950
1951
-1955
1956
-1960
1961
-1965
1966
-1970
1971
-1975
1976
-1980
1981
-1985
1986
-1990
1991
-1995
1996
-2000
2001
-2005
2006
-2010

Report to the Mayor’s Office of 19 Constantine E. Kontokosta, PhD, PE Long-Term Planning and Sustainability New York University
Figure 3.2.21: Box Plot of Source EUI by Building Age (Five-Year Increments), Office Buildings
Figure 3.2.22: Scatterplot with Linear Fit Line of Building Age and Source EUI, Office Buildings
020
040
060
080
0S
ourc
e E
nerg
y U
se In
tens
ity (k
Btu
/Sq.
Ft.)
Before
1900
1901
-1905
1906
-1910
1911
-1915
1916
-1920
1921
-1925
1926
-1930
1931
-1935
1936
-1940
1941
-1945
1946
-1950
1951
-1955
1956
-1960
1961
-1965
1966
-1970
1971
-1975
1976
-1980
1981
-1985
1986
-1990
1991
-1995
1996
-2000
2001
-2005
2006
-2010
010
020
030
040
050
0
0 50 100 150Building Age (years)
Current Weather Normalized Source Energy Intensity (kBtu/Sq. Ft.)
Report to the Mayor’s Office of 20 Constantine E. Kontokosta, PhD, PE Long-Term Planning and Sustainability New York University
Figure 3.2.23: Scatterplot with Linear Fit Line of Building Age and Source EUI, Multi-Family Buildings
010
020
030
040
050
0
0 50 100 150yearsold
Current Weather Normalized Source Energy Intensity (kBtu/Sq. Ft.)

Report to the Mayor’s Office of 21 Constantine E. Kontokosta, PhD, PE Long-Term Planning and Sustainability New York University
4.0 PREDICTIVE MODEL AND DETERMINANTS OF BUILDING ENERGY
CONSUMPTION
This section analyzes the determinants of building energy consumption, based on the LL84 and PLUTO
data, and develops a predictive model to create an energy performance benchmark or to estimate energy
consumption for buildings where no actual data exists (Griffith et al. 2008). The predictive model can be
used for several purposes, including:
1. Estimating energy consumption in noncompliant LL84 covered buildings
2. Estimating energy consumption in buildings less than 50,000 square feet, and those otherwise not
subject to the requirements of LL84
3. Estimating energy consumption in buildings where actual energy consumption data is not
available
4. Developing an energy benchmarking tool to identify more and less efficient buildings
4.1 Determinants of Building Energy Consumption Building energy consumption is given by the following function:
εβββββα ++++++= iiiii ENERGYTYPEOCCBULKSPATIALy 54321
where SPATIAL consists of geographic and locational variables, BULK includes variables that measure
building size and placement on a given lot, OCC represents variables for occupant density and energy-
consuming amenities, TYPE includes space type variables, ENERGY consists of variables for energy
source, and ԑ is the error term.
Using robust multiple regression techniques, this section presents the factors that influence building
energy efficiency (Griffith et al. 2008; Tso and Yau 2007; Turiel 1987). Based on the model coefficients
and tests of significance, the model output is used to predict building energy consumption for use in
creating an energy efficiency benchmark for commercial buildings in New York City (Chung, Hui, and
Lam 2006; Hernandez, Burke, and Lewis 2008). It should be noted that there are potential limitations to
multiple regression modeling for predicting building energy efficiency (Tso and Yau 2007). Potential bias
in the coefficient estimates may result from collinearity between the explanatory variables.

Report to the Mayor’s Office of 22 Constantine E. Kontokosta, PhD, PE Long-Term Planning and Sustainability New York University
Due to significant differences in energy consumption across building types, and the type-specific
variables available in the LL84 database, individual models are created for each primary building type.
For all building types, the following independent (explanatory) variables are included in the base model:
Building Square Footage – Total building area as reported in PM
Building Age – Age of building based on year built from PLUTO database (new variable)
Number of Floors – Total number of floors in building from PLUTO database
FAR – As-built floor area ratio from PLUTO database
Lot Coverage – building footprint divided by lot area from PLUTO database. Building footprint
approximated by multiplying building width by building depth (new variable)
Lot Location – a binary variable for whether the building is an inside lot or corner lot (based on
variable from the PLUTO database)
Detached Building - a binary variable for whether the building is detached or attached to adjacent
buildings (based on variable from the PLUTO database)
Primary Energy Source – a binary variable equal to 1 for the dominant fuel type in the building,
and equal to 0 otherwise (new variable)
% non-Primary Space Type – percentage of non-primary space type (e.g. percentage of retail in
a building with a majority office space) (new variable)
For Office buildings, the following variables are added to the base model:
Office Worker Density – Number of employees per 1,000 square feet (default value = 2.3)
Office Weekly Operating Hours – number of hours per week that a building is occupied by at
least 75% of the tenant employees (default value = 65 hours per week)
Floor Plate Size – estimate of average floor plate size (new variable)
For Multi-Family buildings, the following variables are added to the base model:
Affordable or Market Rate – a binary variable equal to 1 if all units in building are affordable,
and equal to 0 if market-rate (new variable); note that “affordable” is used here according to the
EPA Portfolio Manager definition, which includes subsidized housing intended for low-income
households.
Number of Laundry Facilities per Unit – total number of laundry facilities for each residential
unit
Number of Dishwashers per Unit – total number of dishwashers for each residential unit
Percent Cooled – percent of gross floor space that is air conditioned

Report to the Mayor’s Office of 23 Constantine E. Kontokosta, PhD, PE Long-Term Planning and Sustainability New York University
Average Unit Size = estimate of the average gross floor area per unit (new variable)
Individual models for office and multi-family buildings are estimated using ordinary least-squares (OLS)
regression methods. Each building type model is run using both Weather Normalized Source EUI and its
natural log as the dependent variable. The results are presented below.

Report to the Mayor’s Office of 24 Constantine E. Kontokosta, PhD, PE Long-Term Planning and Sustainability New York University
Figure 4.1.1: Regression Results, Source EUI and natural log of Source EUI as dependent variable, Office Buildings (excluding lots with multiple buildings)
Dependent Variable Source EUI log Source EUIN = 824 N = 824F-stat = 8.68 F-stat = 9.12R2 = .198 R2 = .199
Coef. Coef.Building RenovationAltered and Building 21 to 40 years old -23.667 -0.0955Altered and Building 41 to 60 years old -54.652 *** -0.2090 ***Altered and Building 61 to 80 years old 34.626 0.1521Altered and Building 81 or more years old 9.749 0.0523Building Age21 to 40 years old -6.269 -0.028341 to 60 years old -14.936 -0.035061 to 80 years old -34.004 -0.132081 or more years old -61.021 *** -0.2542 ***Energy Source (> 50% site energy)Electric 18.699 * 0.1410 ***Steam 27.554 * 0.1663 **Bulk and AreaLot Coverage 0.674 0.0040 *Lot Area (000s of sq.ft.) -0.093 -0.0002Detached Building -9.406 -0.0827Inside Lot -15.288 * -0.0681 *Number of Floors -1.077 * -0.0008Floor Area (000s of sq.ft.) 0.064 *** 0.0002 **% non-Office Space 82.017 ** 0.3527 **Floor Plate - 10k to 20k sq.ft -0.216 0.0013Floor Plate - more than 20k sq.ft. -8.514 -0.0269In Historic District? -22.136 ** -0.0949OccupancyWeekly Operating Hours 0.447 ** 0.0014Worker Density (workers per 1,000 sq.ft.) 10.482 *** 0.0569 ***ValueAssessed Value per Sq.Ft. 0.194 * 0.0005
Constant 180.592 *** 5.0284 ***

Report to the Mayor’s Office of 25 Constantine E. Kontokosta, PhD, PE Long-Term Planning and Sustainability New York University
Figure 4.1.2: Regression Results, Source EUI and natural log of Source EUI as dependent variable, Multi-Family Buildings (excluding lots with multiple buildings)
Dependent Variable Source EUI log Source EUIN = 3642 N = 3642F-stat = 21.04 F-stat = 23.12R2 = .1546 R2 = .1594
Coef. Coef.Building RenovationAltered and Building 21 to 40 years old 2.306 -0.002Altered and Building 41 to 60 years old -2.888 -0.031Altered and Building 61 to 80 years old -1.912 -0.021Altered and Building 81 or more years old -0.151 0.001Building Age21 to 40 years old 11.530 ** 0.075 **41 to 60 years old -5.127 -0.02661 to 80 years old -22.025 *** -0.163 ***81 or more years old -12.857 ** -0.105 ***Energy Source (> 50% site energy)Electric -10.123 *** -0.192 ***Steam 1.238 0.005Natural Gas 5.987 *** 0.029 **Bulk and AreaLot Coverage -0.012 *** -0.0001 ***Lot Area (000s of sq.ft.) 0.159 * 0.001 *Detached Building -0.913 -0.001Inside Lot -3.082 ** -0.023 **Number of Floors (7 or more) -7.431 *** -0.046 ***Floor Area (000s of sq.ft.) -0.027 ** -0.0002 **% non-Residential Space 45.343 *** 0.299 ***Gross Sq.Ft. per Unit -0.004 * 0.000 *In Historic District -5.019 * -0.029AmenitiesDishwashers per Unit (1 or more) 1.838 0.017Laundry Facilities per Unit (1 or more) 7.668 ** 0.053 **% Space Cooled 8.679 * 0.061 ***ValueAffordable Housing Only 7.819 ** 0.035Assessed Value per Sq.Ft. 0.347 *** 0.002 ***
Constant 133.318 *** 4.874 ***

Report to the Mayor’s Office of 26 Constantine E. Kontokosta, PhD, PE Long-Term Planning and Sustainability New York University
4.2 Discussion of Results
On average, the models explain approximately 20 percent of the variation in energy efficiency
across buildings. These models may, in fact, be more robust than those currently used in Energy
Star benchmarking analysis, as the LL84 and PLUTO merged dataset provide a greater range of
independent variables that have been shown to have a statistically significant effect on energy
efficiency, including lot coverage, adjacent buildings, and other parcel-level characteristics (EPA
2011). For each building type, two models are estimated: one using source EUI as the dependent
variable and the other using a semi-logarithmic transformation with the natural log of source EUI
as the dependent variable. In this model, the coefficients can be approximated as the percent
change in source EUI for a one unit change in the independent variable. However, it should be
noted that the actual interpretation of the relationship between the independent and dependent
variables is given by exp(c)-1 where c is the coefficient value (Halvorsen and Palmquist 1980).
The results and coefficient estimates for each model are discussed below.
4.2.1 Office Buildings For office buildings (Figure 4.1.1), the age of the building is negatively correlated with EUI.
Therefore, older buildings are found to be more efficient than those built more recently. Most
notably, buildings over 80 years old have an almost 28 percent lower EUI than the average EUI
for the entire sample. Buildings that are 41 to 60 years old and that have been altered (based on
data contained in the PLUTO database) are also shown to be more energy efficient, controlling
for the other variables included in the model.
Energy source is also a significant factor influencing source EUI, at least at the 90 percent
confidence level. Buildings that primarily use either electric or district steam are shown to be less
efficient than those using natural gas or fuel oil.
Looking at building size, space type, and location, several variables stand out. First, there is a
positive correlation between EUI and building size, as measured by square footage. Larger office
buildings, therefore, are shown to have higher EUIs (although it should be noted that buildings
over 2,000,000 square feet are excluded from the model). Similarly, a larger amount of non-
office space (based on a percentage of total space) is associated with a higher EUI. Specifically,

Report to the Mayor’s Office of 27 Constantine E. Kontokosta, PhD, PE Long-Term Planning and Sustainability New York University
for every additional 10 percent of non-office space, the building EUI increased by 8.2. Buildings
on an inside lot (a lot with adjacent lots on either side) or in a historic district are found to have
lower EUIs. This finding suggests the need for more detailed descriptions of the various uses in
multi-use buildings.
Occupancy variables are a key driver of building energy efficiency. Worker densities vary
considerably across usage and tenant types in office buildings, from relatively low-density law
firm use, for example, to very high-density trading floors. Understanding and controlling for
occupant density and the operational hours of a building are critical to the reliable and effective
identification and comparison of peer groups of buildings. The regression results show that the
coefficients for both weekly operating hours and worker density are positive and significant. As
expected, this finding indicates that as operating hours or occupant density increases, so does the
EUI of the building, after controlling for the factors included the model. The results in Figure
4.1.1 above reveal that for every additional hour the building is in operation, EUI increases by
0.45. Turning to the worker density variable, building EUI increases by a substantial 10.48 for
every additional occupant added per 1,000 square feet. Therefore, it is shown that buildings with
more people working longer hours have higher EUIs. This reinforces previous empirical
evidence on building energy consumption from CBECS and highlights the importance of
understanding building usage and occupant characteristics before attempting peer-to-peer
building efficiency comparison.
4.2.2. Multi-Family Buildings Many of the fundamental building characteristic variables – age, size, parcel location, fuel type –
that are found to be significant for office buildings are also shown to be critical in understanding
energy efficiency in multi-family buildings (Figure 4.1.2). Older buildings again shown to be
correlated with lower EUIs, specifically for buildings more than 60 years old. Buildings that are
more than 80 years old are much more efficient, controlling for the other factors in the model,
than buildings built within the last twenty years. This finding is consistent with the results for
office buildings, and reinforces the link between older buildings and energy efficiency.
Interestingly, multi-family buildings built between 1970 and 1990 are found to be less efficient

Report to the Mayor’s Office of 28 Constantine E. Kontokosta, PhD, PE Long-Term Planning and Sustainability New York University
than similar buildings built since 1990. There are a number of possible explanations for this
outcome, including the effects of building codes, construction materials, and building envelope.
Contrary to the findings for office buildings, larger multi-family buildings are found to be more
efficient. Looking at the variables for number of floors (equal to 1 if the building has more than
seven stories and 0 otherwise) and total building square footage, both are negative and
significant, suggesting that as building size increases, building EUI decreases. The results
demonstrate that buildings on inside lots, and thus with a high probability of adjacent structures,
have lower EUIs. Similarly, buildings built more fully on a lot with, therefore, higher lot
coverage ratios are more efficient than, for instance, a tower covering only a portion of the lot
area. The coefficient estimates for both of these variables indicate the importance of adjacent
buildings and the possible influence of shared party walls and less exposed building envelope
area. Similar to office buildings, multi-family buildings located in historic districts have, on
average, lower EUIs, after controlling for building age and other factors. This could reflect the
building densities in these areas as well as the type of construction.
As with office buildings, energy source is a significant factor in determining source EUI. Multi-
family buildings where electric is the dominant energy source (accounting for more than 50
percent of the total site energy consumption) have lower EUIs than buildings using fuel oil.
Conversely, buildings where natural gas is the dominant energy source have slightly higher EUIs
than comparable buildings using other energy sources.
For multi-family buildings with non-residential space, each additional ten percent of non-
residential space equates to a 4.5 point increase in building EUI. This suggests non-residential
space may occupied be higher intensity uses, such as retail and community facilities. It also
raises issues of the availability of energy data for non-residential space in multi-family buildings.
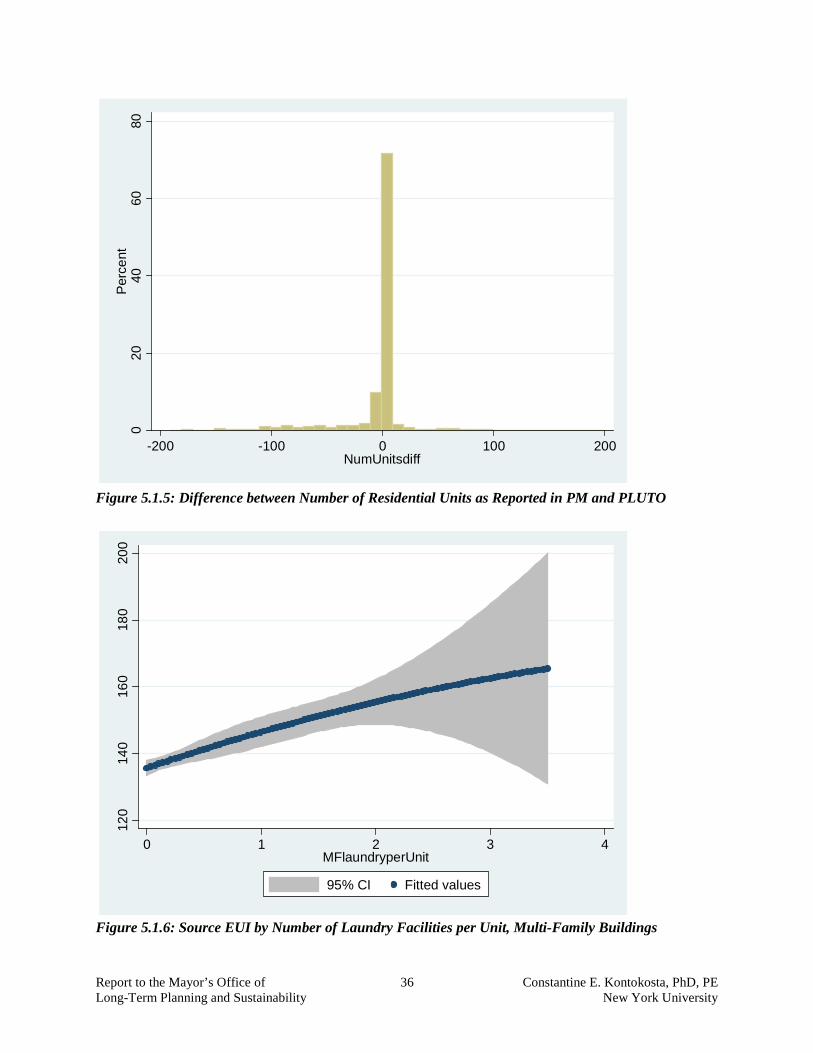
The type of amenities in a multi-family building, including number of dishwashers, laundry
facilities, and the amount of cooled space in the building, have a positive correlation with overall
building EUI. Most notably, for buildings with one or more laundry facilities per unit, the
Report to the Mayor’s Office of 29 Constantine E. Kontokosta, PhD, PE Long-Term Planning and Sustainability New York University
building EUI is higher by 7.67. For the amount of cooled space, for every additional ten percent
of cooled building area, the building EUI increases by 0.87.
Finally, buildings defined as “affordable” through the Portfolio Manager tool have, on average, a
7.82 higher EUI than mixed-income or market-rate buildings. Affordable buildings are defined
as those buildings where all of the units are subsidized for occupancy by low-income
households. Mixed-income buildings, such as 80/20 buildings, do not have a statistically
significant difference in building EUI, controlling for other factors, as compared to market-rate
buildings.
4.3 Predictive Model and Analysis Using the coefficient estimates from the regression results, the predictive capacity of the models
can be tested using actual data from observations in the LL84 database. Figures 4.3.1 and 4.3.2
below present the actual and predicted EUI for an office building in Manhattan and a multi-
family building in Brooklyn.
As is shown below, the accuracy of the models is quite good and within a 15-20 percent range,
although it must be noted that there is a wide variance in the predicted values. This reflects the
explanatory power of the regression models presented above. The predictive models provide a
solid foundation for developing a benchmark for office and multi-family buildings in New York
City. It would be strengthened considerably by adding additional information on building
systems and design characteristics. In the future, building energy audit data could be used to
supplement the LL84 and PLUTO databases and create a more robust predictive model for
building energy efficiency.
Figures 4.3.3 and 4.3.4 show the quantile-quantile (Q-Q) plots for office and multi-family
buildings, respectively. These Q-Q plots display the relationship of actual EUI values to those
predicted by the models for the entire LL84 sample. To clarify the interpretation of the graphs, if
the predictive models were perfectly accurate in predicting building EUI, then all dots would fall
on the upward-sloping diagonal line. Currently, the models are accurate in predicting EUI for
buildings with actual EUIs around the respective medians for each building type, as would be

Report to the Mayor’s Office of 30 Constantine E. Kontokosta, PhD, PE Long-Term Planning and Sustainability New York University
expected given the relatively low explanatory power of the OLS models presented above. The
models as specified tend to over-estimate EUI for more efficient (lower EUI) buildings and
under-estimate EUI for less efficient (higher EUI) buildings.
Figure 4.3.1: Actual v. Predicted EUI – Office Building Example
1423569Bldg 1
Building Renovation Coef. Actual Values Coef. ValuesAltered and Building 21 to 40 years old -23.667 0Altered and Building 41 to 60 years old -54.652 *** 1 -54.7Altered and Building 61 to 80 years old 34.626 0Altered and Building 81 or more years old 9.749 0Building Age21 to 40 years old -6.269 041 to 60 years old -14.936 061 to 80 years old -34.004 081 or more years old -61.021 *** 0 0.0Energy Source (> 50% site energy)Electric 18.699 * 0 0.0Steam 27.554 * 1 27.6Bulk and AreaLot Coverage 0.674 1Lot Area (000s of sq.ft.) -0.093 17.05Detached Building -9.406 0Inside Lot -15.288 * 0 0.0Number of Floors -1.077 * 21 -22.6Floor Area (000s of sq.ft.) 0.064 *** 330 21.2% non-Office Space 82.017 ** 0.02 1.6Floor Plate - 10k to 20k sq.ft -0.216 1Floor Plate - more than 20k sq.ft. -8.514 0In Historic District? -22.136 ** 0 0.0OccupancyWeekly Operating Hours 0.447 ** 65 29.1Worker Density (workers per 1,000 sq.ft.) 10.482 *** 2.39 25.1ValueAssessed Value per Sq.Ft. 0.194 * 52.7 10.2
Constant 180.592 *** 1 180.6
252 218.0Actual EUI Predicted EUI
34.0 differential

Report to the Mayor’s Office of 31 Constantine E. Kontokosta, PhD, PE Long-Term Planning and Sustainability New York University
Figure 4.3.2: Actual v. Predicted EUI – Multi-Family Building Example
2721900Bldg 1
Coef. Actual Values Coef. ValuesBuilding RenovationAltered and Building 21 to 40 years old 2.306 0Altered and Building 41 to 60 years old -2.888 0Altered and Building 61 to 80 years old -1.912 0Altered and Building 81 or more years old -0.151 0Building Age21 to 40 years old 11.530 ** 1 11.541 to 60 years old -5.127 061 to 80 years old -22.025 *** 0 0.081 or more years old -12.857 ** 0 0.0Energy Source (> 50% site energy)Electric -10.123 *** 0 0.0Steam 1.238 0Natural Gas 5.987 *** 1 6.0Bulk and AreaLot Coverage -0.012 *** 0.387 0.0Lot Area (000s of sq.ft.) 0.159 * 38.8 6.2Detached Building -0.913 0Inside Lot -3.082 ** 1 -3.1Number of Floors (7 or more) -7.431 *** 1 -7.4Floor Area (000s of sq.ft.) -0.027 ** 139.2 -3.7% non-Residential Space 45.343 *** 0 0.0Gross Sq.Ft. per Unit -0.004 * 838 -3.1In Historic District -5.019 * 0 0.0AmenitiesDishwashers per Unit (1 or more) 1.838 0Laundry Facilities per Unit (1 or more) 7.668 ** 0.03 0.2% Space Cooled 8.679 * 0.1 0.9ValueAffordable Housing Only 7.819 ** 1 7.8Assessed Value per Sq.Ft. 0.347 *** 53 18.4
Constant 133.318 *** 133.3
140.9 167.0Actual EUI Predicted EUI
-26.1 differential

Report to the Mayor’s Office of 32 Constantine E. Kontokosta, PhD, PE Long-Term Planning and Sustainability New York University
Figure 4.3.3: Quantile-Quantile Plot, Actual v. Predicted EUI, Office Buildings
Figure 4.3.4: Quantile-Quantile Plot, Actual v. Predicted EUI, Multi-Family Buildings
010
020
030
040
050
0P
redi
cted
EU
I
0 100 200 300 400 500Actual Source EUI
Quantile-Quantile Plot0
100
200
300
400
Pre
dict
ed E
UI
0 100 200 300 400Actual Source EUI
Quantile-Quantile Plot

Report to the Mayor’s Office of 33 Constantine E. Kontokosta, PhD, PE Long-Term Planning and Sustainability New York University
5.0 MULTI-FAMILY BUILDING ENERGY RATING SYSTEM – A DISCUSSION
There are currently several initiatives underway to develop an energy rating/grading system for
multi-family buildings (see, for example, Energy Star for Multifamily Housing; U.S. Department
of Housing and Urban Development benchmark tool; Department of Energy Commercial
Building Asset Rating Program). The LL84 database provides a rich source of information to
build a rating system that controls for a number of observed building characteristics; however,
additional data are needed on occupant/unit characteristics and consumption data collection
methods. Possible foundations of a residential rating system include:
• Grading system based on ‘A’, ‘B’, and ‘C’ letter grades corresponding to building
performance among some proportion cluster of energy performance. For example, the A-
B-C letter grade scale could correspond to the 30% most efficient buildings, the 40%
middle band of EUI, and the 30% least efficient buildings, respectively. Such a grading
system would control for building and site characteristics as presented in the regression
models in Section Four. In addition, data on building systems and operations would be
useful in improving the reliability of the EUI predictive model and the accuracy of
defining building comparison groups.
• Rating system tied to a benchmark for similar buildings, based off the predictive model
presented in Section Four. This would function in a similar manner to the Energy Star
measurement, but has the potential to improve the accuracy of the benchmark by
controlling for additional building and site characteristics available through City of New
York datasets.
Descriptive statistics for multi-family buildings in the sample are presented below.

Report to the Mayor’s Office of 34 Constantine E. Kontokosta, PhD, PE Long-Term Planning and Sustainability New York University
5.1 Multi-Family Building Data Analysis
Figure 5.1.1: Number of Units by Type of Housing, Multi-Family Buildings (Note: Units in Mixed-Income Buildings are not allocated between Affordable and Market-Rate)
Figure 5.1.2: Comparison of Affordable, Mixed-Income and Market-Rate Multi-Family Buildings, Pre-War by Building Height
Affordable 87,007
Mixed-Income 72,435
Market-Rate 443,876
050
100
150
Med
ian
Sou
rce
EU
I
Pre-War >7 Stories Pre-War <7 Stories
Afforda
ble
Mixed-I
ncom
e
Market-
Rate
Afforda
ble
Mixed-I
ncom
e
Market-
Rate

Report to the Mayor’s Office of 35 Constantine E. Kontokosta, PhD, PE Long-Term Planning and Sustainability New York University
Figure 5.1.3: Comparison of Affordable, Mixed-Income, and Market-Rate Multi-Family Buildings, Post-War by Building Size
Figure 5.1.4: Histogram of Source EUI, Multi-Family Buildings (less than 2,000,000 sq.ft.)
050
100
150
Med
ian
Sou
rce
EU
I
Post-War >100k Sq.Ft. Post-War <100k Sq.Ft.
Afforda
ble
Mixed-I
ncom
e
Market-
Rate
Afforda
ble
Mixed-I
ncom
e
Market-
Rate
050
010
0015
0020
00Fr
eque
ncy
0 100 200 300 400 500Current Weather Normalized Source Energy Intensity (kBtu/Sq. Ft.)
Report to the Mayor’s Office of 36 Constantine E. Kontokosta, PhD, PE Long-Term Planning and Sustainability New York University
Figure 5.1.5: Difference between Number of Residential Units as Reported in PM and PLUTO
Figure 5.1.6: Source EUI by Number of Laundry Facilities per Unit, Multi-Family Buildings
020
4060
80P
erce
nt
-200 -100 0 100 200NumUnitsdiff
120
140
160
180
200
0 1 2 3 4MFlaundryperUnit
95% CI Fitted values
Report to the Mayor’s Office of 37 Constantine E. Kontokosta, PhD, PE Long-Term Planning and Sustainability New York University
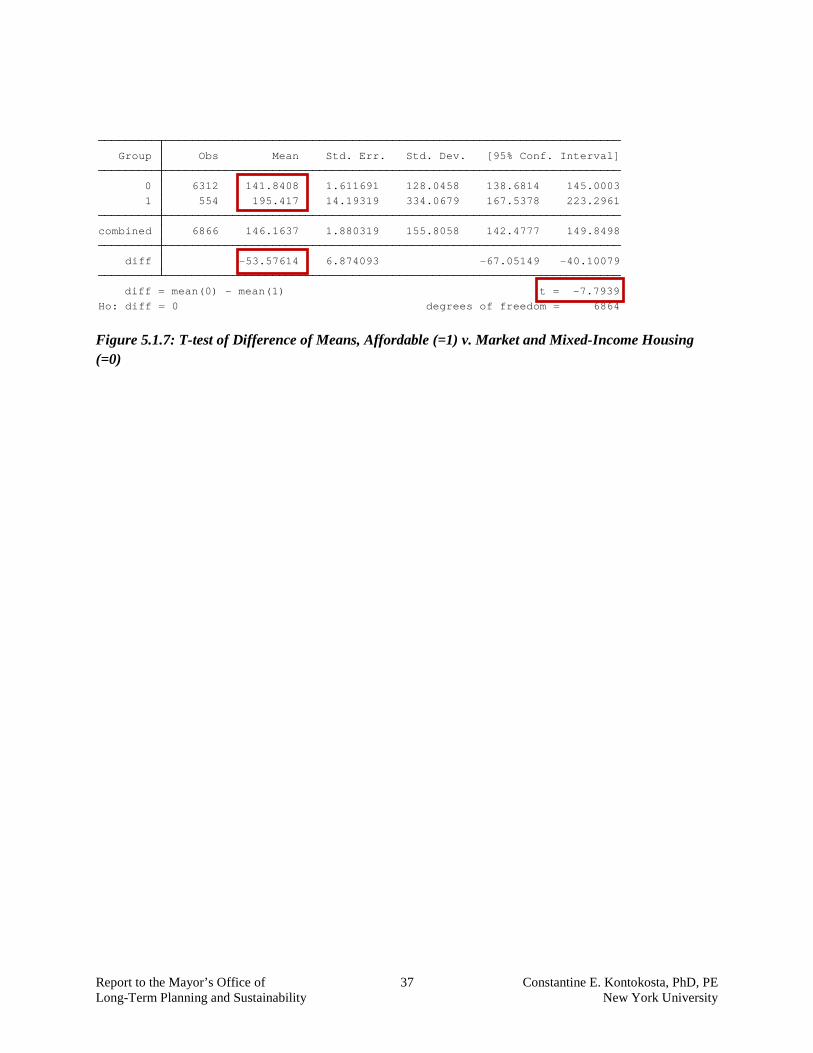
Figure 5.1.7: T-test of Difference of Means, Affordable (=1) v. Market and Mixed-Income Housing (=0)
Ho: diff = 0 degrees of freedom = 6864 diff = mean(0) - mean(1) t = -7.7939 diff -53.57614 6.874093 -67.05149 -40.10079 combined 6866 146.1637 1.880319 155.8058 142.4777 149.8498 1 554 195.417 14.19319 334.0679 167.5378 223.2961 0 6312 141.8408 1.611691 128.0458 138.6814 145.0003 Group Obs Mean Std. Err. Std. Dev. [95% Conf. Interval]

Report to the Mayor’s Office of 38 Constantine E. Kontokosta, PhD, PE Long-Term Planning and Sustainability New York University
6.0 BUILDING ENERGY CONSUMPTION REDUCTION POTENTIAL
Energy performance disclosure can be an important mechanism to shift market demand and
behavior with respect to building energy efficiency. In New York City, buildings account for 76
percent of total energy use. The LL84 data reveal that a targeted strategy, focusing on the 20
percent least efficient buildings, can have a dramatic impact on total energy consumption in New
York. In summary, a 30 percent reduction in energy consumption in the City’s least efficient
buildings could result in an annual energy savings of over 11,000 GBtu.
The figures below present the median source EUI, total site and source energy consumption, and
GHG emissions per square foot for multi-family and office buildings, by five percent increments
based on source EUI. Reduction potentials in the worst-performing 20 percent of buildings are
also shown. Clearly, the best performing buildings (those in the <5% increment) and the worst
performing buildings (those in the >95% increment) capture noticeable deviations from the
distribution of the remaining 90 percent of buildings.
6.1 Multi-Family Buildings
Figure 6.1.1: Source EUI by Five-Percent Increment, Multi-Family Buildings
Median Source EUI = 132.2
010
020
030
0S
ourc
e E
UI
<5%5-1
0%
10-15
%
15-20
%
20-25
%
25-30
%
30-35
%
35-40
%
40-45
%
45-50
%
50-55
%
55-60
%
60-65
%
65-70
%
70-75
%
75-80
%
80-85
%
85-90
%
90-95
%>95
%
Report to the Mayor’s Office of 39 Constantine E. Kontokosta, PhD, PE Long-Term Planning and Sustainability New York University
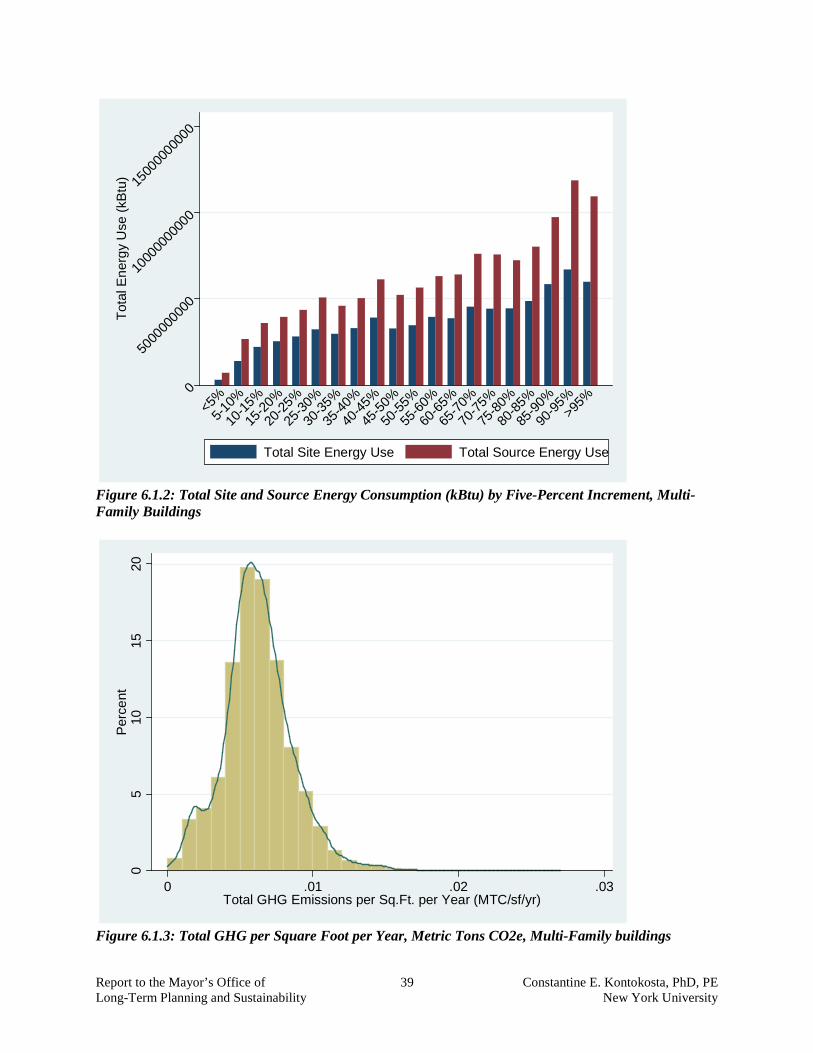
Figure 6.1.2: Total Site and Source Energy Consumption (kBtu) by Five-Percent Increment, Multi-Family Buildings
Figure 6.1.3: Total GHG per Square Foot per Year, Metric Tons CO2e, Multi-Family buildings
0
5000
0000
00
1000
0000
000
1500
0000
000
Tota
l Ene
rgy
Use
(kB
tu)
<5%5-1
0%
10-15
%
15-20
%
20-25
%
25-30
%
30-35
%
35-40
%
40-45
%
45-50
%
50-55
%
55-60
%
60-65
%
65-70
%
70-75
%
75-80
%
80-85
%
85-90
%
90-95
%>95
%
Total Site Energy Use Total Source Energy Use
05
1015
20P
erce
nt
0 .01 .02 .03Total GHG Emissions per Sq.Ft. per Year (MTC/sf/yr)

Report to the Mayor’s Office of 40 Constantine E. Kontokosta, PhD, PE Long-Term Planning and Sustainability New York University
Figure 6.1.2 above shows the total energy consumption in multi-family buildings by five-percent
increment. The figure reveals that the 20 percent worst-performing buildings consume more than
six times the total energy as the 20 percent best-performing buildings. The 20 percent worst-
performing buildings collectively account for more than 6,470.427.724 kBtu annually in total
site energy consumption.
What is apparent from the figure above is the potential to achieve significant energy use
reductions by targeting the worst-performing 20 percent of multi-family buildings. The following
calculation provides an estimate the potential impact of a 30 percent reduction in energy
consumption in the worst-performing buildings, and graphically depicted in Figure 6.1.4:
• Total Energy Consumption – 20% Best-Performing Buildings = 6,470,427,724 kBtu
• Total Energy Consumption – 20% Worst-Performing Buildings = 25,672,900,000 kBtu
• 30% Efficiency Improvement in Worst-Performing Buildings = 7,701,870,000 kBtu use reduction

Report to the Mayor’s Office of 41 Constantine E. Kontokosta, PhD, PE Long-Term Planning and Sustainability New York University
Figure 6.1.4: Illustration of Potential Savings in Multi-Family Buildings
0
2,000
,000,0
004,0
00,00
0,000
6,000
,000,0
008,0
00,00
0,000
Tota
l Site
Ene
rgy
Use
(kB
tu)
<5%5-1
0%
10-15
%
15-20
%
20-25
%
25-30
%
30-35
%
35-40
%
40-45
%
45-50
%
50-55
%
55-60
%
60-65
%
65-70
%
70-75
%
75-80
%
80-85
%
85-90
%
90-95
%>95
%
Total Consumption = 6,470 GBtu
Total Consumption = 25,672 GBtu
30% Reduction = 7,702 GBtu
saved

Report to the Mayor’s Office of 42 Constantine E. Kontokosta, PhD, PE Long-Term Planning and Sustainability New York University
6.2 Office Buildings
Figure 6.2.1: Source EUI by Five-Percent Increment, Office Buildings
Figure 6.2.2: Total Site and Source Energy Consumption (kBtu) by Five-Percent Increment, Office Buildings
Median Source EUI = 213.3
020
040
060
0S
ourc
e E
UI
<5%5-1
0%
10-15
%
15-20
%
20-25
%
25-30
%
30-35
%
35-40
%
40-45
%
45-50
%
50-55
%
55-60
%
60-65
%
65-70
%
70-75
%
75-80
%
80-85
%
85-90
%
90-95
%>95
%
020
0000
0000
4000
0000
0060
0000
0000
8000
0000
00
Tota
l Ene
rgy
Use
(kB
tu)
<5%5-1
0%
10-15
%
15-20
%
20-25
%
25-30
%
30-35
%
35-40
%
40-45
%
45-50
%
50-55
%
55-60
%
60-65
%
65-70
%
70-75
%
75-80
%
80-85
%
85-90
%
90-95
%>95
%
Total Site Energy Use Total Source Energy Use

Report to the Mayor’s Office of 43 Constantine E. Kontokosta, PhD, PE Long-Term Planning and Sustainability New York University
Figure 6.2.3: Total GHG per Square Foot per Year, Metric Tons CO2e, Office buildings
As with multi-family buildings, there is significant energy use reduction potential embedded in
the 20 percent worst-performing buildings. The following calculation provides an estimate the
potential impact of a 30 percent reduction in energy consumption in the worst-performing office
buildings and is shown graphically in Figure 6.2.4:
• Total Energy Consumption – 20% Best-Performing Buildings = 1,597,000,000 kBtu
• Total Energy Consumption – 20% Worst-Performing Buildings = 11,640,000,000 kBtu
• 30% Efficiency Improvement in Worst-Performing Buildings = 3,492,000,000 kBtu use reduction
05
1015
20P
erce
nt
0 .01 .02 .03 .04Total GHG Emissions per Sq.Ft. per Year (MtC/sf/yr)

Report to the Mayor’s Office of 44 Constantine E. Kontokosta, PhD, PE Long-Term Planning and Sustainability New York University
Figure 6.2.4: Illustration of Potential Savings in Office Buildings
01,
000
2,00
03,
000
Tota
l Site
Ene
rgy
Con
sum
ptio
n (G
Btu
)
<5%5-1
0%
10-15
%
15-20
%
20-25
%
25-30
%
30-35
%
35-40
%
40-45
%
45-50
%
50-55
%
55-60
%
60-65
%
65-70
%
70-75
%
75-80
%
80-85
%
85-90
%
90-95
%>95
%
Total Consumption = 1,597 GBtu
Total Consumption = 11,640 GBtu
30% Reduction = 3,492 GBtu
saved

Report to the Mayor’s Office of 45 Constantine E. Kontokosta, PhD, PE Long-Term Planning and Sustainability New York University
7.0 SPATIAL ANALYSIS OF BUILDING ENERGY CONSUMPTION
Understanding the spatial patterns of energy consumption and efficiency in New York City
provides an important level of analysis for directing infrastructure investment, targeting outreach
for incentives and place-based policies, and informing community organizations and residents
regarding neighborhood-level energy issues. Figure 7.0.1 presents basic descriptive statistics by
borough for office and multi-family buildings. Figure 7.0.2 shows the median source EUI by
borough for the three primary space types contained in the LL84 database. It should be noted that
the median EUI values do not control for differences in building inventory or characteristics, so
the figure is intended to provide only a relative indication of typical energy efficiencies across
the five boroughs.
Figure 7.0.1: Descriptive Statistics by Borough
Office # of BuildingsAvg. Number
of FloorsAverage Size
(Sq.Ft.)Average Age
(years old)Bronx 11 7 136,798 62Brooklyn 38 10 213,031 73Manhattan 864 20 372,269 76Queens 45 6 195,622 58Staten Island 10 3 59,298 33
Multi-Family # of BuildingsAvg. Number
of FloorsAverage Size
(Sq.Ft.)Average Age
(years old)Bronx 1,139 7 102,643 64Brooklyn 1,309 7 108,377 57Manhattan 2,902 15 159,919 65Queens 1,386 6 113,597 60Staten Island 73 5 120,490 50

Report to the Mayor’s Office of 46 Constantine E. Kontokosta, PhD, PE Long-Term Planning and Sustainability New York University
Figure 7.0.2: Median Source EUI by Borough and Building Type
Figure 7.0.3 shows the ten zipcodes in the five boroughs with the highest total energy
consumption, together with the total number of buildings in the zipcode and the aggregate square
footage. All ten zipcodes are located in Manhattan, primarily a function of the distribution of
large commercial buildings covered by Local Law 84 requirements.
Figure 7.0.4 maps the mean total energy consumption per building by zipcode. Given the
variations in building types and sizes across the five boroughs, each borough is mapped using its
own scale.
Figure 7.0.3: Top 10 zipcodes with largest total energy consumption
050
100
150
200
250
p 50
of C
urre
ntW
eath
erN
orm
aliz
edS
ourc
Other Office Multi-Family
BR
ON
X
KIN
GS
NE
W Y
OR
K
QU
EE
NS
RIC
HM
ON
D
BR
ON
X
KIN
GS
NE
W Y
OR
K
QU
EE
NS
RIC
HM
ON
D
BR
ON
X
KIN
GS
NE
W Y
OR
K
QU
EE
NS
RIC
HM
ON
D
Zip Code Total Site Energy Consumption # of Bldgs. Total Square Footage1 10019 6,130,000,000 173 58,100,0002 10022 5,770,000,000 232 59,200,0003 10017 4,980,000,000 145 47,900,0004 10036 4,520,000,000 102 41,600,0005 10016 4,440,000,000 218 45,900,0006 10001 3,650,000,000 167 39,600,0007 10023 3,540,000,000 180 39,100,0008 10065 3,120,000,000 145 25,800,0009 10021 2,530,000,000 193 30,500,000
10 10025 2,380,000,000 207 29,700,000

Report to the Mayor’s Office of 47 Constantine E. Kontokosta, PhD, PE Long-Term Planning and Sustainability New York University
Figure 7.0.4: Map of Mean Total Source Energy Use per Building by Zipcode, Office and Multi-Family Buildings
7.1 Office Buildings
The following two sections (7.1 and 7.2) present geographic information system (GIS) maps of
the median EUI for office and multi-family buildings, respectively, by zipcode. Although maps
depicting a much more granular level of detail are possible, down to the individual parcel,
confidentiality concerns prohibit the presentation of such analysis at this time. Following the
maps, tables are included that identify the ten zipcodes with the least efficient buildings (based
on median EUI) for the respective building type.

Report to the Mayor’s Office of 48 Constantine E. Kontokosta, PhD, PE Long-Term Planning and Sustainability New York University
Figure 7.1.1: Map of Source EUI by Zipcode, Office Buildings Only (Green = Lower EUI; Red = Higher EUI) (All Zipcodes)

Report to the Mayor’s Office of 49 Constantine E. Kontokosta, PhD, PE Long-Term Planning and Sustainability New York University
Zip CodeMedian
Source EUI Bldgs. Avg. Age1 10467 708.7 3 69.02 10024 391.0 4 78.83 10301 356.5 4 49.54 10027 355.3 30 90.75 11439 354.7 8 61.06 10020 323.7 5 51.67 10065 277.3 5 56.28 10023 268.5 9 58.09 10005 258.5 17 55.7
10 10022 249.9 75 53.3
Figure 7.1.2: Ten Zipcodes with Highest Median EUI, Office Buildings (min. four observations)

Report to the Mayor’s Office of 50 Constantine E. Kontokosta, PhD, PE Long-Term Planning and Sustainability New York University
7.2 Multi-Family Buildings
Figure 7.2.1: Map of Source EUI by Zipcode, Multi-Family Buildings Only (Green = Lower EUI; Red = Higher EUI)

Report to the Mayor’s Office of 51 Constantine E. Kontokosta, PhD, PE Long-Term Planning and Sustainability New York University
Zip CodeMedian
Source EUI Bldgs. Total UnitsAvg. Age
(years)1 11224 196.8 16 7241 168.32 11367 193.0 68 3983 58.63 11365 183.6 48 288 61.74 10473 178.7 24 4256 42.35 11362 174.1 43 2425 56.76 10454 173.0 22 1343 74.97 10469 168.0 116 1523 75.98 10304 162.7 14 460 41.89 10005 162.0 15 4229 71.3
10 10038 161.3 25 2234 151.1
Figure 7.2.2: Ten Zipcodes with Highest Median EUI, Multi-Family Buildings (min. ten observations)
Figure 7.2.3 shows a scatterplot of median EUI by zipcode and childhood asthma emergency
room visit rates (based on data from the New York State Department of Health for ages 0 to 17).
The positive slope of the linear best-fit line indicates a correlation between poorly performing
neighborhoods and potential air quality issues. Please note that this graph does not control for
other variables that may affect asthma rates and does not suggest causation. However, the visual
relationship between EUI and asthma rates suggests that neighborhoods where public health
concerns are greatest are also home to energy inefficient buildings, a finding that should be
explored more rigorously.
Figure 7.2.3: Median Source EUI and Asthma ER Visit Rate, Multi-Family Buildings, by Zipcode
y = 1.1731x + 37.809
0
100
200
300
400
500
600
700
800
50 70 90 110 130 150 170 190
Asth
ma
ER V
isit
Rate
Median Source EUI

Report to the Mayor’s Office of 52 Constantine E. Kontokosta, PhD, PE Long-Term Planning and Sustainability New York University
Figure 7.2.4: Map of Source EUI by Zipcode, Multi-Family Buildings Only (Green = Lower EUI; Red = Higher EUI) and Asthma Emergency Room Visit Rate by Zipcode (minimum 10 buildings)

Report to the Mayor’s Office of 53 Constantine E. Kontokosta, PhD, PE Long-Term Planning and Sustainability New York University
8.0 CONCLUSIONS AND NEXT STEPS
Local Law 84 has provided the first look at a large sample of non-voluntary (and thus non-self-
selected) building performance data. The uses of this information are numerous, and the analysis
of the initial data collection effort presented here offer some examples of the potential for
building energy disclosure to catalyze shifts in market demand, tenant and building owner
behavior, and building and infrastructure investment criteria.
The next reporting date is scheduled for May 2012. As additional data become available, a panel
or cross-section time-series dataset can be created, allowing for future analysis of program and
policy evaluation and changes in consumption and efficiency over time. The next steps in
analysis of the data should include:
• Extension of the predictive models to include cluster and factor analyses
• The analysis of year-over-year changes in energy consumption and efficiency
• The analysis of discrepancies in other indicators when comparing first-year data and
subsequent submissions
• Merging of the LL84 data with additional datasets, particular those with systems-level
information
• The use of the models presented here to estimate energy consumption and efficiency
patterns in buildings under 50,000 square feet
• The use of the models presented here to estimate energy consumption and efficiency
patterns in other cities

Report to the Mayor’s Office of 54 Constantine E. Kontokosta, PhD, PE Long-Term Planning and Sustainability New York University
REFERENCES
Chung, William, Y.V. Hui, and Y. Miu Lam. 2006. “Benchmarking the Energy Efficiency of Commercial Buildings,” Applied Energy, 83: 1-14. City of New York. 2011. PlaNYC Update: A Greener, Greater New York. New York: City of New York. Day, George S. 1976. “Assessing the Effects of Information Disclosure Requirements,” The Journal of Marketing, 40: 42-52. Environmental Protection Agency. 2011. “ENERGY STAR Performance Ratings – Technical Methodology.” Washington DC: EPA. Galuppo, Louis A. and Charles Tu. 2010. “Capital Markets and Sustainable Real Estate: What Are the Perceived Risks and Barriers?” Journal of Sustainable Real Estate, 2: 143-159. Gillingham, K., M. Harding, and D. Rapson. 2012. “Split Incentives in Household Energy Consumption,” Energy Journal, 33: 37-62. Halvorsen, R. and R. Palmquist. 1980. “The Interpretation of Dummy Variables in Semi-logarithmic Equations,” American Economic Review, 70: 474–475. Hernandez, Patxi, Kevin Burke, and J. Owen Lewis. 2008. “Development of Energy Performance Benchmarks and Building Energy Ratings for Non-Domestic Buildings: An Example of Irish Primary Schools,” Energy and Buildings, 40: 249-254. Kontokosta, Constantine E. 2011a. “Greening the Regulatory Landscape: The Spatial and Temporal Diffusion of Green Building Policies in U.S. Cities,” Journal of Sustainable Real Estate, 3: 68-90. Kontokosta, Constantine E. 2011b. “The Emerging Market for Building Energy Retrofits: Navigating the Investment Frontier,” Real Estate Finance Intelligence, August. Schleich, Joachim. 2009. “Barriers to Energy Efficiency: A Comparison across the German Commercial and Services Sector,” Ecological Economics, 68: 2150-2159. Tso, G. and K. Yau. 2007. “Predicting Electricity Energy Consumption: A Comparison of Regression Analysis, Decision Tree and Neural Networks,” Energy, 32: 1761–1768.
Turiel, I. 1987. “Estimation of Energy Intensity by End-Use for Commercial Buildings,” Energy, 12: 435–446. U.S. Department of Energy. 2008. Energy Efficiency Trends in Residential and Commercial Buildings. Washington DC: Department of Energy.

Report to the Mayor’s Office of 55 Constantine E. Kontokosta, PhD, PE Long-Term Planning and Sustainability New York University
Vadiveloo, Maya K., L. Beth Dixon, and Brian Elbel. 2011. “Consumer Purchasing Patterns in Response to Calorie Labeling Legislation in New York City,” International Journal of Behavioral Nutrition and Physical Activity, 8:51.
ACKNOWLEDGEMENTS
The author would like to thank NYU Center for the Sustainable Environment Research Assistants Alexandra Hack, Jared Rodriguez, and Yemi Adediji for their work in data merging and mapping.

Report to the Mayor’s Office of 56 Constantine E. Kontokosta, PhD, PE Long-Term Planning and Sustainability New York University
APPENDIX A – ADDITIONAL CHARTS AND GRAPHS
Figure A.1: Mean of % Building Site Energy Consumption By Fuel Type by Building Age, Office and Multi-Family Buildings
Figure A.2: Mean of % Building Site Energy Consumption By Fuel Type by Building Age, Office Buildings Only
0.2
.4.6
% o
f Tot
al B
uild
ing
Site
Ene
rgy
Con
sum
ptio
n
Before
1900
1900
-1910
1910
-1920
1920
-1930
1930
-1940
1940
-1950
1950
-1960
1960
-1970
1970
-1980
1980
-1990
1990
-2000
2000
-2010
Mean of % Electric Mean of % Natural GasMean of % Steam Mean of % No.2 Fuel OilMean of % No.4 Fuel Oil Mean of % No.5/6 Fuel OilMean of % Diesel
0.2
.4.6
.8%
of T
otal
Bui
ldin
g S
ite E
nerg
y C
onsu
mpt
ion
Before
1900
1900
-1910
1910
-1920
1920
-1930
1930
-1940
1940
-1950
1950
-1960
1960
-1970
1970
-1980
1980
-1990
1990
-2000
2000
-2010
Mean of % Electric Mean of % Natural GasMean of % Steam Mean of % No.2 Fuel OilMean of % No.4 Fuel Oil Mean of % No.5/6 Fuel OilMean of % Diesel

Report to the Mayor’s Office of 57 Constantine E. Kontokosta, PhD, PE Long-Term Planning and Sustainability New York University
Figure A.3: Mean of % Building Site Energy Consumption By Fuel Type by Building Age, Multi-Family Buildings Only
Figure A.4: Kernel Density Plots of GHG Emissions Per Sq.Ft. Per Year, Office and Multi-Family Buildings (Overlay of Figures 6.1.3 and 6.2.3)
0.2
.4.6
% o
f Tot
al B
uild
ing
Site
Ene
rgy
Con
sum
ptio
n
Before
1900
1900
-1910
1910
-1920
1920
-1930
1930
-1940
1940
-1950
1950
-1960
1960
-1970
1970
-1980
1980
-1990
1990
-2000
2000
-2010
Mean of % Electric Mean of % Natural GasMean of % Steam Mean of % No.2 Fuel OilMean of % No.4 Fuel Oil Mean of % No.5/6 Fuel OilMean of % Diesel
050
100
150
200
Ker
nel D
ensi
ty
0 .01 .02 .03GHG Emissions Per Sq.Ft. Per Year
Office Buildings Multi-Family Buildings
Related Documents