JAG l Volume 1 - Issue 3/4 - 1999 ~repararion of volume table of SAL (Shorea robusta) - an approach using satellite data V.K. Srivastaval, A.M. RaP, R.K. Dixit2, M.P.Oza~ & A. Narayana’ 1 Forestry, Landuse and Photogrammetric Group, Remote Sensing Appiicat~ons Area, Space Applications Centre (ISRO), Ahmedabad, 380 053 India (e-mail:vi~ayksS2~hotmail.com) 2 Uttar Pradesh Forest Department, Lucknow, India 3 Master Control Facility, Hasan, India KEYWORDS: sal, plantation, volume table, remote sens- ing data, IRS-LISS II, correlation coefficient, regression equation ABSTRACT Sal (Shorea robusta) is an important forest tree species in north and north-eastern India. Large-scale plantations of this species have been raised there under taungya and coppice system of manage- ment. The conventional volume table prepared for high sal forest is referred to infer the volume of production of this species. Earlier workers have used aerial remote sensing data to develop volume tables of this species. In the present study a volume table for sal is developed based on remotely sensed satellite data using a regres- sion technique. A two-step method was developed to estimate mean tree volume from satellite data. In step 1, mean crown diam- eter - an intermediate variable - was estimated from satellite data. In step 2, the estimated mean crown diameter was used to estimate the mean tree volume. Addition of age of the crop as an indepen- dent variable improved the predictive ability of the regression equa- tion. INTRODUCTION Sal (Shorea robusta Gaertn. F.) is an important tree species of northern and north-eastern Indian forests above 23” N latitude. It is being raised artificially under both taungya and coppice systems of management. As such, large-scale plantations of this species, constituting about one-third of the total man-made forest in the country, have been successfully raised in India. Under the taungya system of management, the forest plantations are raised in combination with field (agricul- tural) crops in the initial stages of growth. In the case of sat, this practice continues for initial five years. Under the coppice system of management, the older forests were cut near to the ground so that the coppice shoots arise from the base of the resulting stumps. In order to assess the productjon of the forest, volume tables showing the average content of trees for one or more assumed dimensions are referred to with respect to the diameter at breast height (DBH) and commercial height of the tree crop [Chaturvedi & Khanna, 19821. The volume table available for Sal was prepared in 1935 by Griffith & Santram [I9351 for high sal forests. The same table is used today to assess the production of planta- tions of this species raised under either taungya or cop- pice systems, or a combination of both. Chaturvedi & Sharma [I9801 opined that as the growth of a tree species in natural high forest and growth under manage- ment systems is likely to differ, the same tables cannot be applied to the two systems. The conventional preparation of volume table (a table showing for a given species the average contents of trees, and log or sawn timber for one or more assumed dimensions) or yield table (a tabular statement which summarises on a unit area basis all the essential data relating to the development of a fully-stocked and regu- larly thinned even-aged crop at periodic intervals that cover the greater part of its useful life) calls for measure- ment of felled trees in the forests. Hence, such methods need to be explored, preferably while avoiding the felling of trees for this purpose. In this context, remote sensing data, both aerial and satellite, need to be explored as they provide data on biophysical parameters associated with growing stock [Colwell et al, 19831 that can be used to prepare volume table. Therefore in this study we attempt to prepare volume tables for plantation crops of sal (Shorea robusta) from satellite data. Aerial data have been used by some workers to prepare aerial volume and yield tables [Tiwari & Parthsarthy, 1979; Chaturvedi, 1975; Joshi, 1973; Gupta, 19731.. In all such studies, parameters were identified that could be measured directly on aerial photographs. In general, only tree height and crown diameter were found to be mea- surable from the aerial data. Chaturvedi [I9751 studied the relationship between ground-measured crown diam- eter (CD) and diameter at breast height (DBH) for sal and indicated their application for determining basal area from aerial photographs. 214

Welcome message from author
This document is posted to help you gain knowledge. Please leave a comment to let me know what you think about it! Share it to your friends and learn new things together.
Transcript
JAG l Volume 1 - Issue 3/4 - 1999
~repararion of volume table of SAL (Shorea robusta) - an approach using satellite data
V.K. Srivastaval, A.M. RaP, R.K. Dixit2, M.P.Oza~ & A. Narayana’
1 Forestry, Landuse and Photogrammetric Group, Remote Sensing Appiicat~ons Area, Space Applications Centre (ISRO), Ahmedabad, 380 053 India (e-mail:vi~ayksS2~hotmail.com)
2 Uttar Pradesh Forest Department, Lucknow, India 3 Master Control Facility, Hasan, India
KEYWORDS: sal, plantation, volume table, remote sens-
ing data, IRS-LISS II, correlation coefficient, regression
equation
ABSTRACT
Sal (Shorea robusta) is an important forest tree species in north and
north-eastern India. Large-scale plantations of this species have
been raised there under taungya and coppice system of manage-
ment. The conventional volume table prepared for high sal forest is
referred to infer the volume of production of this species. Earlier
workers have used aerial remote sensing data to develop volume
tables of this species. In the present study a volume table for sal is
developed based on remotely sensed satellite data using a regres-
sion technique. A two-step method was developed to estimate
mean tree volume from satellite data. In step 1, mean crown diam-
eter - an intermediate variable - was estimated from satellite data.
In step 2, the estimated mean crown diameter was used to estimate
the mean tree volume. Addition of age of the crop as an indepen-
dent variable improved the predictive ability of the regression equa-
tion.
INTRODUCTION
Sal (Shorea robusta Gaertn. F.) is an important tree
species of northern and north-eastern Indian forests
above 23” N latitude. It is being raised artificially under
both taungya and coppice systems of management. As
such, large-scale plantations of this species, constituting
about one-third of the total man-made forest in the
country, have been successfully raised in India.
Under the taungya system of management, the forest
plantations are raised in combination with field (agricul- tural) crops in the initial stages of growth. In the case of
sat, this practice continues for initial five years. Under the
coppice system of management, the older forests were
cut near to the ground so that the coppice shoots arise
from the base of the resulting stumps.
In order to assess the productjon of the forest, volume
tables showing the average content of trees for one or
more assumed dimensions are referred to with respect to
the diameter at breast height (DBH) and commercial
height of the tree crop [Chaturvedi & Khanna, 19821. The
volume table available for Sal was prepared in 1935 by
Griffith & Santram [I9351 for high sal forests. The same
table is used today to assess the production of planta-
tions of this species raised under either taungya or cop-
pice systems, or a combination of both. Chaturvedi &
Sharma [I9801 opined that as the growth of a tree
species in natural high forest and growth under manage-
ment systems is likely to differ, the same tables cannot
be applied to the two systems.
The conventional preparation of volume table (a table
showing for a given species the average contents of
trees, and log or sawn timber for one or more assumed
dimensions) or yield table (a tabular statement which
summarises on a unit area basis all the essential data
relating to the development of a fully-stocked and regu-
larly thinned even-aged crop at periodic intervals that
cover the greater part of its useful life) calls for measure-
ment of felled trees in the forests. Hence, such methods
need to be explored, preferably while avoiding the felling
of trees for this purpose. In this context, remote sensing
data, both aerial and satellite, need to be explored as
they provide data on biophysical parameters associated
with growing stock [Colwell et al, 19831 that can be used
to prepare volume table. Therefore in this study we
attempt to prepare volume tables for plantation crops of
sal (Shorea robusta) from satellite data.
Aerial data have been used by some workers to prepare
aerial volume and yield tables [Tiwari & Parthsarthy,
1979; Chaturvedi, 1975; Joshi, 1973; Gupta, 19731.. In all
such studies, parameters were identified that could be
measured directly on aerial photographs. In general, only
tree height and crown diameter were found to be mea-
surable from the aerial data. Chaturvedi [I9751 studied
the relationship between ground-measured crown diam-
eter (CD) and diameter at breast height (DBH) for sal and
indicated their application for determining basal area
from aerial photographs.
214
Preparing volume tables of sal from satellite data
No attempt has been made so far to prepare volume
table from satellite data, which is readily available and
has many advantages over aerial data. Franklin [1986],
Peterson et a/ [I 9861, Butera [1986], Danson [1987],
Shimabukuro et al [I9891 and Kazmierczak [I9911 have
studied the relationship between dendrometric variables
and spectral responses derived from satellite data. Ardo
[1992], Danson & Curran [1993], Brockhaus & Khorram
[1992], Ripple et al [19911, Tomppo & Katila [1991],
DeWulf et a/ [ 19901, Cook et a/ [ 19891 and Trotter et a/
[I9971 have successfully demonstrated the utility of
satellite data in the inventory of forest resources. Indeed,
Srivastava et a/ [ 19921 have estimated mean tree volume
in teak plantations from satellite data.
STUDY AREA
The study was conducted in the sal (Shorea robusta)
plantations of Gorakhpur (South) forest division, Uttar
Pradesh, India. This forest division comprised five ranges:
Tilkonia, Banki, CompierGunj, Anand Nagar and Pakari at
the time of sampling, ie, February-March 1994. Sal plan-
tations in this division have been raised under both man-
agement practices ie, taungya and coppice, so that in
this division plantations raised under both taungya and
coppice system grow side by side. No visual difference in
growth performance between the two management
practices is noticeable.
The division is located between latitudes 26’ 35’ N and
27” 13’ N and between the longitudes 83” 13’ E and 83”
35’ E. Well-drained alluvial soil, rich in clay and silt, is of
common occurrence in the area, which features very
gentle slopes to almost flat terrain. The climate is tropi-
cal, having annual rainfall of about 1300 mm and maxi-
mum temperatures of 43°C in summer; minimum tem-
peratures may drop as low as to 5’C during winter.
METHODS
A total of 40 samples, each 30 m x 30 m, were distrib-
uted randomly in the five ranges of the division, inde-
pendently of the management practice under which the
trees on the sample were raised.
All the trees present in each sample were measured for
basal circumference (BC), diameter at breast height
(DBH) and total tree height (H). Crown diameter (CD)
was measured as the maximum crown spread in two
directions perpendicular to each other. The mean of the
two measurements was taken to represent the_ actual
crown diameter (CD) of the tree. DBH and H were used
to calculate tree volume. This tree volume was multiplied
by a form factor as given by Singh [I 9801 for taungya Sal,
which varied from 0.451 at 10 years to 0.40 at 60 years,
thereafter remaining constant. The tree volume as calcu-
JAG l Volume 1 - Issue 3/4 - 1999
lated under our study differed from the conventional tree
volume as estimated in forestry sector, in which either
timber height or tree height up to 5 cm DBH is consid-
ered. The mean of the tree volume was calculated for
each sample used in our study.
The remote sensing data from Linear Imaging Self
Scanning (LISS)-II Al sensor of the Indian Remote Sensing
Satellite (IRS)-IB was used in the present study. The
details of the Indian Remote Sensing Satellite and cam-
eras onboard are described by Joseph [1996]. Cloud free
satellite data over the study area (Path 23; Row 49) near-
est to the sampling date was analyzed. Satellite data of
25 April 1992 was found to be suitable for our study.
Because sal is a slow growing species, having a rotation
of 75 years, the tree parameters acquired during
February/March 1994 were considered to be acceptably
close to this date of satellite data acquisition. Hence, in
our study this data only was used. All the plantations
sampled were related to this data with the help of Survey
of India (501) topographical maps at 1: 50,000 scale,
working-plan maps and associated features recorded
during our ground visit.
For the calculation of various spectral variables, a matrix
of 3 x 3 pixels was selected from the centre of each sam-
ple identified on the satellite data. The DN values of the
nine pixels were converted to radiance values. The means
of the nine pixels in the four spectral bands, ie, bl(band
1 = 0.45-0.52 pm), b2( band 2 = 0.52-0.59 pm), b3(band
3 = 0.62-0.68 pm) and b4 (band 4 = 0.77-0.86 pm) were
considered in the present study to derive the indices list-
ed below, as these indices are the quantitative measure-
ments that indicate the vigor of vegetation [Campbell,
19871. Further, in a certain way, these indices represent
a normalization of the spectral behavior and, therefore,
allow reduction of the illumination effects and make
comparisons with different studies possible [Baulies &
Pons, 19951. Bannari et a/ [I9951 have listed more than
forty indices derived from the spectral responses by vari-
ous workers, some of which have shown very good cor-
relation with different “factors” of interest, among
which the productivity of cultivated fields or forest areas
and their biomass content [Perry & Lautenschlager, 1984;
Baret, 19861.
Indices = (b3-bl)/(b3+bl); (b3-bZ)/(b3+b2);
(b4-bl)/(b4+bl); (b4-bZ)/(b4+b2);
(b4-b3)/(b4+b3).
PREPARATION OF VOLUME TABLE
The aerial volume tables have in general been confined
to investigation of the most suitable variable(s) that cor-
relate highly with the dependent variable, usually volume
[Tiwari & Parthsarthy, 19791. Thus tree volume is not
215
Preparing volume tables of sal from satellite data JAG l Volume 1 - Issue 314 - 1999
directly measured from the aerial data. Instead, such tree
variables are measured from aerial data that has a high
degree of correlation with tree volume; regression equa-
tions are developed allometrically (using ground mea-
surement of such variable(s)) to estimate tree volume.
Such approaches have been called “Indirect Approaches”
[Colwell et a/, 19831..
The above approach may also be used to derive the suit-
able variable from satellite sensor data as all the features
of the biosphere cannot be measured directly by satellite
data. However, by using an underlying functional rela-
tionship between the variable under investigation and a
secondary variable that can be measured by a satellite
sensor, a model can be prepared that predicts the
desired information on the basis of satellite sensor data
[Cook et al, 19891. This approach along with the gener-
alized approach described by Unnikrishnan & Singh
[I9841 for the construction of volume tables of forest
trees have been adhered to in the present study. Various
steps involved in tkis approach are:
1. Selection of the date for acquisition of satellite data
2. Selection of the intermediate (secondary) variable
3. Selection of the dependent variable
4. Selection of the spectral variable(s) that correlate
stages, were analyzed to select the best date on which
the sal plantations could be properly identified (separat-
ed) from surrounding land cover classes. For this, diver-
gence analysis (Bhattacharya Distance and Transformed
Divergence) was carried out, which is a measure of sep-
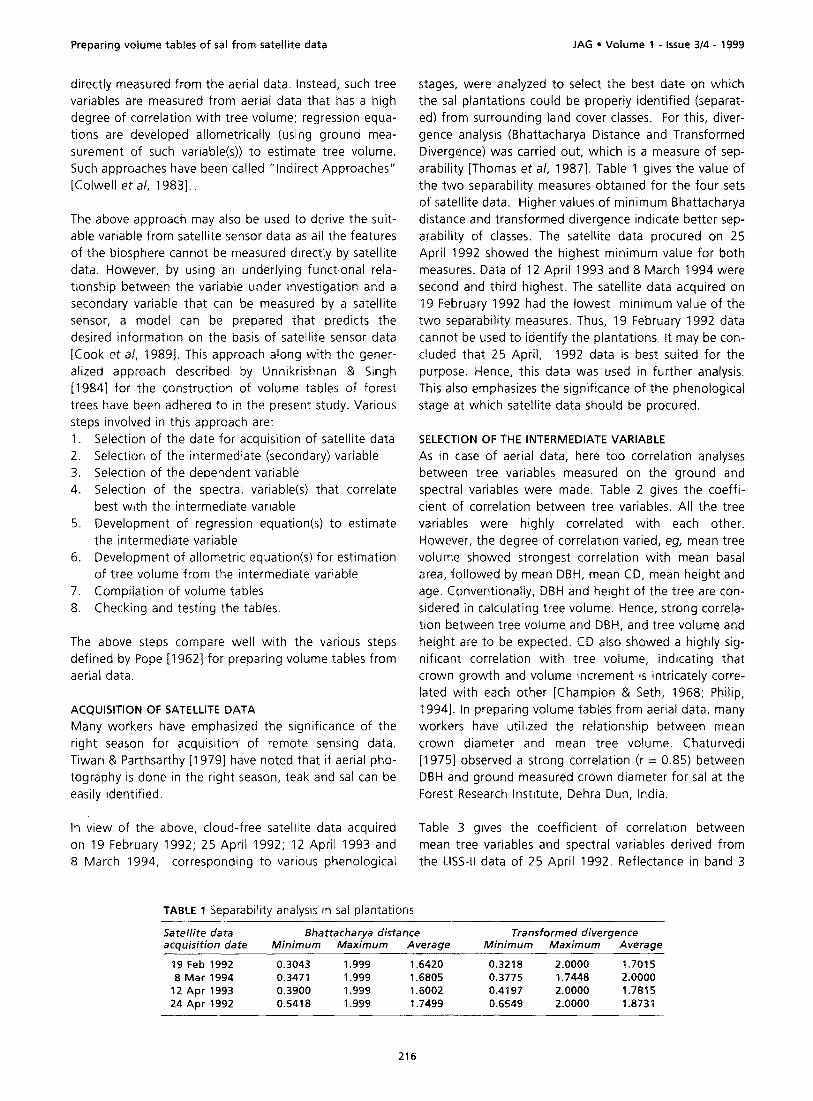
arability [Thomas et a/, 19871. Table 1 gives the value of
the two separability measures obtained for the four sets
of satellite data. Higher values of minimum Bhattacharya
distance and transformed divergence indicate better sep-
arability of classes. The satellite data procured on 25
April 1992 showed the highest minimum value for both
measures. Data of 12 April 1993 and 8 March 1994 were
second and third highest. The satellite data acquired on
19 February 1992 had the lowest minimum value of the
two separabil;ty measures. Thus, 19 February 1992 data
cannot be used to identify the plantations. It may be con-
cluded that 25 April, 1992 data is best suited for the
purpose. Hence, this data was used in further analysis.
This also emphasizes the significance of the phenological
stage at which satellite data should be procured.
SELECTION OF THE INTERMEDIATE VARIABLE
best with the intermediate variable
5. Development of regression equation(s) to estimate
the intermediate variable
6. Development of allometric equation(s) for estimation
of tree volume from the intermediate variable
7. Compilation of volume tables
8. Checking and testing the tables.
The above steps compare well with the various steps
defined by Pope [I9621 for preparing volume tables from
aerial data.
ACQUISITION OF SATELLITE DATA
Many workers have emphasized the significance of the
right season for acquisition of remote sensing data.
Tiwari & Parthsarthy [ 19791 have noted that if aerial pho-
tography is done in the right season, teak and sal can be
easily identified.
As in case of aerial data, here too correlation analyses
between tree variables measured on the ground and
spectral variables were made. Table 2 gives the coeffi-
cient of correlation between tree variables. All the tree
variables were highly correlated with each other.
However, the degree of correlation varied, eg, mean tree
volume showed strongest correlation with mean basal
area, followed by mean DBH, mean CD, mean height and
age. Conventionally, DBH and height of the tree are con-
sidered in calculating tree volume. Hence, strong correla-
tion between tree volume and DBH, and tree volume and
height are to be expected. CD also showed a highly sig-
nificant correlation with tree volume, indicating that
crown growth and volume increment is intricately corre-
lated with each other [Champion & Seth, 1968; Philip,
19941. In preparing volume tabies from aerial data, many
workers have utilized the relationship between mean
crown diameter and mean tree volume. Chaturvedi
[I9751 observed a strong correlation (r = 0.85) between
DBH and ground measured crown diameter for sal at the
Forest Research Institute, Dehra Dun, India.
In view of the above, cloud-free satellite data acquired
on 19 February 1992; 25 April 1992; 12 April 1993 and
8 March 1994, corresponding to various phenological
Table 3 gives the coefficient of correlation between
mean tree variables and spectral variables derived from
the L&S-II data of 25 April 1992. Reflectance in band 3
TABLE I Separability analysis in sal plantations
Satellite data ac~uisitjon date
8~attacbarya distance minimum maximum Average
Transformed divergence minimum maximum Average
19 Feb 1992 0.3043 1.999 1.6420 0.3218 2.0000 1.7015 8 Mar 1994 0.3471 1.999 1.6805 0.3775 1.7448 2.0000
12 Apr 1993 0.3900 1.999 1.6002 0.4197 2.0000 1.7815 24 Apr 1992 0.5418 1.999 1.7499 0.6549 2.0000 1.8731
216
Preparing volume tables of sal from satellite data JAG l Volume 1 - Issue 3/4 - 1999
TABLE 2 Correlation analysis between measured tree variables
Tree variable
Age Tree height Mean DBH Mean vol. Mean CD Mean 8A TN/quad.
Age
1 .oo 0.861 0.851 0.741 0.731 0.781 0.721
Tree variables Tree Mean Mean Mean Mean TN/
height DBH volume CD BA quadrat
1.00 0.901 1.00 0.811 0.961 1 .oo 0.731 0.731 0.851 1.00 0.841 0.981 0.981 0.861 1 .oo 0.81 I 0.771 0.631 0.661 0.711 1 .oo
N=40; I = Significant at 1% significance level; TN/quadrat = Tree number per quadrat (sample)
(Red) was found to be significantly correlated with mean
tree variables. However, the degree of correlation varied.
Mean crown diameter (CD) gave the highest correlation
with this band (red), followed by mean tree height, tree
density, age, mean DBH and mean tree volume. All the
tree variables, namely age, mean tree height, mean DBH,
mean CD and mean tree volume, showed negative cor-
relation with reflectance in band 3. This may be due to
the fact that with increasing age of the tree, tree volume
and its attributes increases, leading to increased inter-
ception in the red region of EMR, thus reducing the
reflectance in this region.
As absorption in band 1 (Blue region) is related to both
chlorophyll and carotenoid concentration [Tucker, 19791,
phenology of the tree on this date may explain the sig-
nificance of the correlation.
As the leaves were in senescence stage, bands near 550
and 700 nm show maximum sensitivity to chlorophyll
concentration [Giltelson & Merzlyak, 19961. Franklin
[1986] and Badhwar et a/ [I9841 have observed that
reflectances in the visible bands are more sensitive to the
quality and biomass of leaves, and hence yield best cor-
relations with forest productivity. Sader et al [I 9891 have
observed that for even-age forest conditions, crown area
has been shown to be well correlated with main stem
diameter, wood volume and biomass. They also mention
that forest managers in the past have used crown diam-
eter, crown density and tree height as key measurements
in estimating timber volume in
plantations and even-age forests
from aerial photographs.
From the above, it can safely
be said that crown diameter
can be considered as an inter-
mediate variable which corre-
lates with tree volume and also
with spectral variables. Crown
diameter can, therefore, be
estimated from satellite data.
This estimated CD can then be
used to predict tree volume.
ESTIMATING THE INTERMEDIATE VARI-
ABLE - MEAN CROWN DIAMETER
Regression is most commonly used to
inventory forest resources, owing to
difficulties in using a physical model
[Baulies & Pons, 19951. All spectral
variables used in correlation analysis
were considered for regression
against mean crown diameter. The
variables entering the multiple
regression equations were selected
by the “Leaps and Bound” technique [Furnival & Wilson,
19741. This is a technique for finding the best subsets of
variables for prediction in terms of Rz, without examining
all possible subsets in a multiple regression analysis
[IMSL, 19821. The criterion of Rz is generally used as it is
one of the most acceptable measures to describe good-
ness of fit [Curran & Hay, 19861. The best models were
selected based on highest Rz and significance of the
models.
The best regression equation containing the three inde-
pendent spectral variables to estimate mean crown diam-
eter (CD) is:
CD = -17.789 + 0.754(bl) - 0.585(b3) + 10.713
(b3 - b2) /(b3 + b2) [II (Rz= 0.42: SEOE = 0.826: F-Cal = 8.659)
The above equation can be used to estimate CD from
spectral variables even though the Rz is low but signifi-
cant at a 1 percent level of significance. The standard
error of estimate (SEOE) was found to be 21 percent of
the mean. The predictive performance of the above
equation was improved by addition of age of the crop, a
nonspectral variable and readily available for an even-
aged forest, to the pool of independent variables. The
equation then developed was,
CD = -10.427 + 3.751(bl) - 0.247(b3) + 0.044
(Age) (Rz= 0.71; SEOE = 0.58; F-Cal = 29.43)
I21
TABLE 3 Correlation analysis between spectral variables and tree variables
Spectral Tree variables variable Age DBH H CD DSH TN
b-l -0.31 -0.29 -0.35H -0.34H -0.31 0.34H b-2 -0.21 -0.35H -0.35H -0.34H -0.36H 0.421 b-3 -0.41 H -0.39H -0.43H -0.48H -0.39H 0.421 b-4 0.14 0.06 -0.04 0.18 0.06 -0.09 (b3-bl)/ (b3+bl) -0.451 -0.431 -0.451 -0.541 -0.421 0.471 (b3-b2)/ (b3+b2) -0.41 H -0.32 -0.37H -0.461 -0.31 0.34H (b4-bl)/ (b4+bl) 0.21 0.14 0.07 0.27 0.15 -0.18 (b4-b2)/ (b4+b2) 0.22 0.19 0.09 0.31 0.20 0.25 (b4-b3)/ (b4+b3) 0.32H 0.27 0.22 0.41 H 0.27 -0.31
I = Significant at 1% level of significance. H= Significant at 5% level of significance.
217
Preparing volume tables of sal from satellite data JAG l Volume 1 - Issue 3/4 - 1999
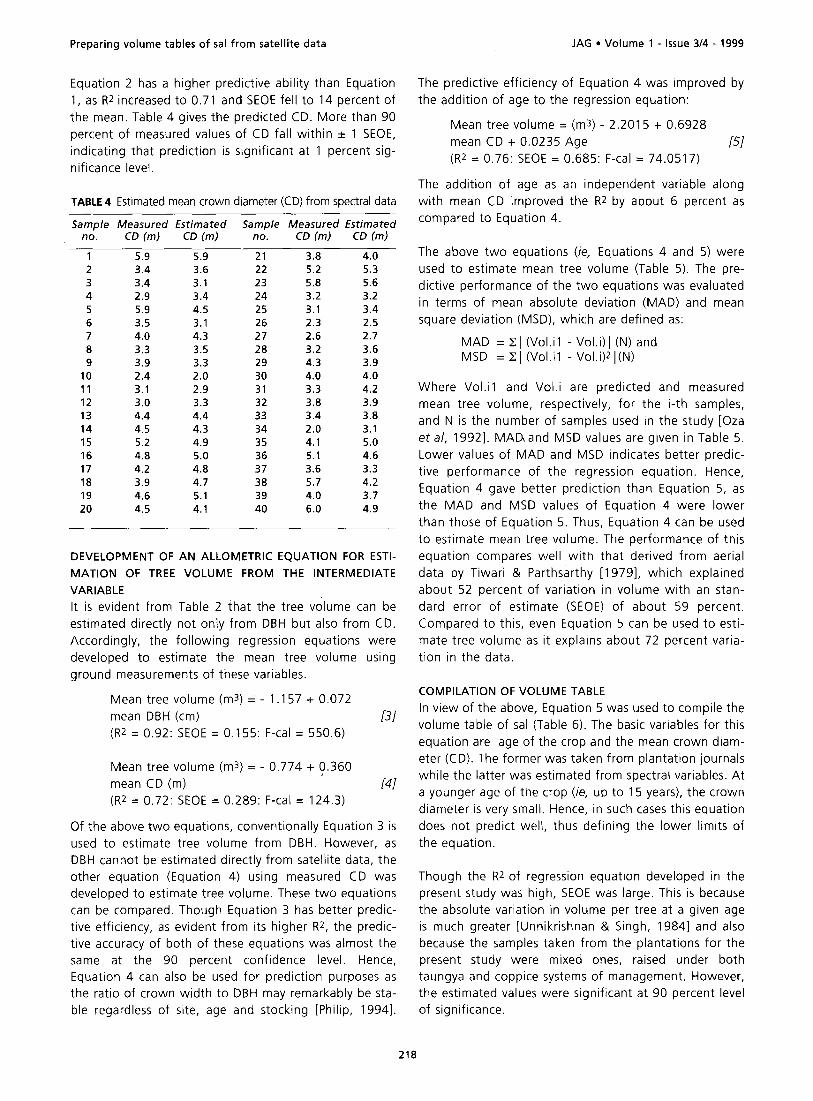
Equation 2 has a higher predictive ability than Equation
1, as R2 increased to 0.71 and SEOE fell to 14 percent of
the mean. Table 4 gives the predicted CD. More than 90
percent of measured values of CD fall within f 1 SEOE,
indicating that prediction is significant at 1 percent sig-
nificance level.
The predictive efficiency of Equation 4 was improved by
the addition of age to the regression equation:
Mean tree volume = (m3) - 2.2015 + 0.6928
mean CD + 0.0235 Age LSl
(R2 = 0.76: SEOE = 0.685: F-Cal = 74.0517)
TABLE 4 Estimated mean crown diameter (CD) from spectral data
Sample Measured Estimated Sample Measured Estimated IlO. CD (mJ CD fmJ no. CD (mJ CD (mJ
1 5.9 5.9 21 3.8 4.0
2 3.4 3.6 22 5.2 5.3
3 3.4 3.1 23 5.8 5.6
4 2.9 3.4 24 3.2 3.2 5 5.9 4.5 25 3.1 3.4
6 3.5 3.1 26 2.3 2.5
7 4.0 4.3 27 2.6 2.7
8 3.3 3.5 28 3.2 3.6 9 3.9 3.3 29 4.3 3.9
10 2.4 2.0 30 4.0 4.0 11 3.1 2.9 31 3.3 4.2 12 3.0 3.3 32 3.8 3.9 13 4.4 4.4 33 3.4 3.8 14 4.5 4.3 34 2.0 3.1 15 5.2 4.9 35 4.1 5.0 16 4.8 5.0 36 5.1 4.6 17 4.2 4.8 37 3.6 3.3 18 3.9 4.7 38 5.7 4.2 19 4.6 5.1 39 4.0 3.7 20 4.5 4.1 40 6.0 4.9
The addition of age as an independent variable along
with mean CD improved the R2 by about 6 percent as
compared to Equation 4.
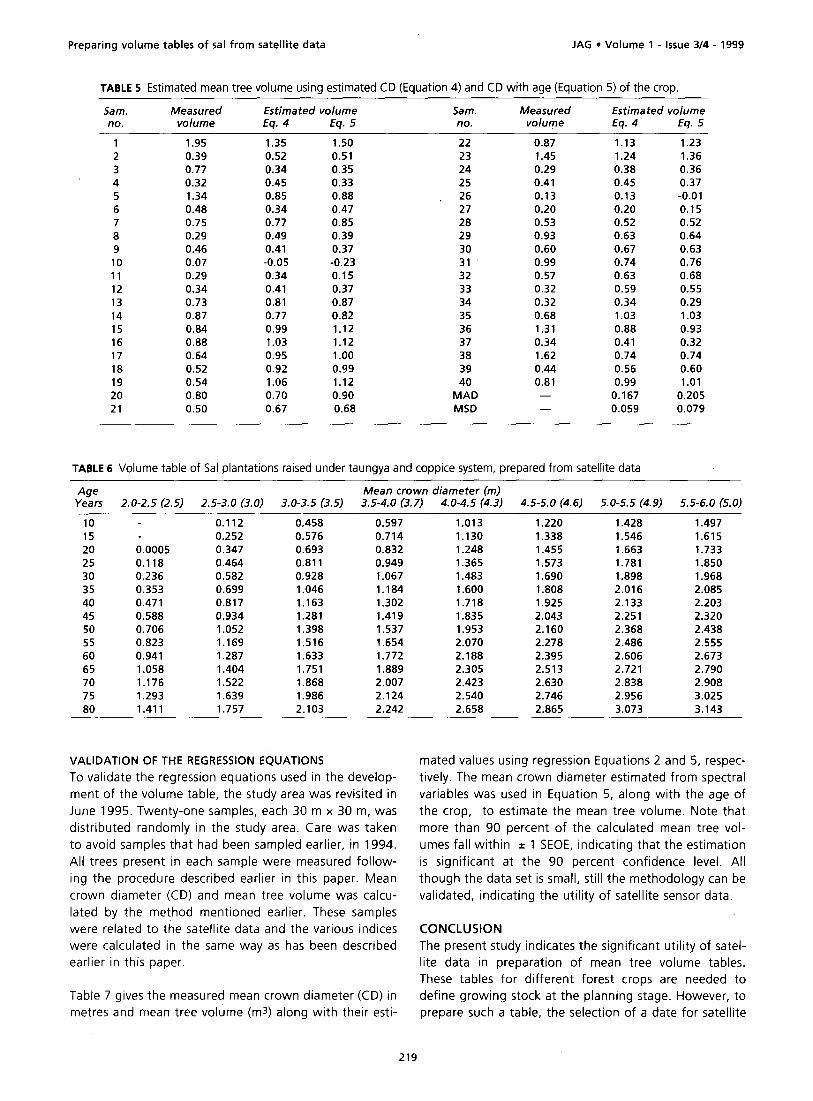
The above two equations (ie, Equations 4 and 5) were
used to estimate mean tree volume (Table 5). The pre-
dictive performance of the two equations was evaluated
in terms of mean absolute deviation (MAD) and mean
square deviation (MSD), which are defined as:
MAD = ZI (Vol.il - Vol.i)( (N) and MSD = ZI (Vol.il - Vol.i)zl(N)
DEVELOPMENT OF AN ALLOMETRIC EQUATION FOR ESTI-
MATION OF TREE VOLUME FROM THE INTERMEDIATE
VARIABLE
It is evident from Table 2 that the tree vdlume can be
estimated directly not only from DBH but also from CD.
Accordingly, the following regression equations were
developed to estimate the mean tree volume using
ground measurements of these variables.
Where Vol.il and Vo1.i are predicted and measured
mean tree volume, respectively, for the i-th samples,
and N is the number of samples used in the study [Oza
et a/, 19921. MALXand MSD values are given in Table 5.
Lower values of MAD and MSD indicates better predic-
tive performance of the regression equation. Hence,
Equation 4 gave better prediction than Equation 5, as
the MAD and MSD values of Equation 4 were lower
than those of Equation 5. Thus, Equation 4 can be used
to estimate mean tree volume. The performance of this
equation compares well with that derived from aerial
data by Tiwari & Parthsarthy [1979], which explained
about 52 percent of variation in volume with an stan-
dard error of estimate (SEOE) of about 59 percent.
Compared to this, even Equation 5 can be used to esti-
mate tree volume as it explains about 72 percent varia-
tion in the data.
Mean tree volume (m3) G - 1 .I 57 + 0.072
mean DBH (cm)
(R2 = 0.92: SEOE = 0.155: F-Cal = 550.6)
I31
COMPILATION OF VOLUME TABLE
Mean tree volume (m3) = - 0.774 + v.360
mean CD (m) 141
(R2 = 0.72: SEOE = 0.289: F-Cal = 124.3)
Of the above two equations, conventionally Equation 3 is
used to estimate tree volume from DBH. However, as
DBH cannot be estimated directly from satellite data, the
other equation (Equation 4) using measured CD was
developed to estimate tree volume. These two equations
can be compared. Though Equation 3 has better predic-
tive efficiency, as evident from its higher R2, the predic-
tive accuracy of both of these equations was almost the
same at the 90 percent confidence level. Hence,
Equation 4 can also be used for prediction purposes as
the ratio of crown width to DBH may remarkably be sta-
ble regardless of site, age and stocking [Philip, 19941.
In view of the above, Equation 5 was used to compile the
volume table of sal (Table 6). The basic variables for this
equation are age of the crop and the mean crown diam-
eter (CD). The former was taken from plantation journals
while the latter was estimated from spectral variables. At
a younger age of the crop (ie, up to 15 years), the crown
diameter is very small. Hence, in such cases this equation
does not predict well, thus defining the lower limits of
the equation.
Though the R2 of regression equation developed in the
present study was high, SEOE was large. This is because
the absolute variation in volume per tree at a given age
is much greater [Unnikrishnan & Singh, 19841 and also
because the samples taken from the plantations for the
present study were mixed ones, raised under both
taungya and coppice systems of management. However,
the estimated values were significant at 90 percent level
of significance.
218
Preparing volume tables of sal from satellite data JAG l Volume 1 - Issue 3/4 - 1999
TABLE 5 Estimated mean tree volume using estimated CD (Equation 4) and CD with age (Equation 5) of the crop.
Sam. no.
Measured volume
Estimated volume Eq. 4 Eq. 5
Sam. no.
Measured volume
Estimated volume Eq. 4 Eq. 5
1 1.95 1.35 1.50 22 2 0.39 0.52 0.51 23 3 0.77 0.34 0.35 24 4 0.32 0.45 0.33 25 5 1.34 0.85 0.88 26 6 0.48 0.34 0.47 27 7 0.75 0.77 0.85 28 a 0.29 0.49 0.39 29 9 0.46 0.41 0.37 30 10 0.07 -0.05 -0.23 31 11 0.29 0.34 0.15 32 12 0.34 0.41 0.37 33 13 0.73 0.81 0.87 34 14 0.87 0.77 0.82 35 15 0.84 0.99 1.12 36 16 0.88 1.03 1.12 37 17 0.64 0.95 1.00 38 18 0.52 0.92 0.99 39 19 0.54 1.06 1.12 40 20 0.80 0.70 0.90 MAD 21 0.50 0.67 0.68 MSD
0.87 1.45 0.29 0.41 0.13 0.20 0.53 0.93 0.60 0.99 0.57 0.32 0.32 0.68 1.31 0.34 1.62 0.44 0.81 - -
1.13 1.23 1.24 1.36 0.38 0.36 0.45 0.37 0.13 -0.01 0.20 0.15 0.52 0.52 0.63 0.64 0.67 0.63 0.74 0.76 0.63 0.68 0.59 0.55 0.34 0.29 1.03 1.03 0.88 0.93 0.41 0.32 0.74 0.74 0.56 0.60 0.99 1.01 0.167 0.205 0.059 0.079
TABLE 6 Volume table of Sal plantations raised under taungya and coppice system, prepared from satellite data
Age Mean crown diameter(m) Years 2.0-2.5 (2.5) 2.5-3.0 (3.0) 3.0-3.5 (3.5) 3.5-4.0 (3.7) 4.0-4.5 (4.3) 4.5-5.0 (4.6) 5.0-5.5 (4.9) 5.5-6.0 (5.0)
10 15 20 25 30 35 40 45 50 55 60 65 70 75
0.0005 0.118 0.236 0.353 0.471 0.588 0.706 0.823 0.941 1.058 1.176 1.293
0.112 0.458 0.597 1.013 1.220 1.428 1.497 0.252 0.576 0.714 1.130 1.338 1.546 1.615 0.347 0.693 0.832 1.248 1.455 1.663 1.733 0.464 0.811 0.949 1.365 1.573 1.781 1.850 0.582 0.928 1.067 1.483 1.690 1.898 1.968 0.699 1.046 1.184 1.600 1.808 2.016 2.085 0.817 1.163 1.302 1.718 1.925 2.133 2.203 0.934 1.281 1.419 1.835 2.043 2.251 2.320 1.052 1.398 1.537 1.953 2.160 2.368 2.438 1.169 1.516 1.654 2.070 2.278 2.486 2.555 1.287 1.633 1.772 2.188 2.395 2.606 2.673 1.404 1.751 1.889 2.305 2.513 2.721 2.790 1.522 1.868 2.007 2.423 2.630 2.838 2.908 1.639 1.986 2.124 2.540 2.746 2.956 3.025
80 1.411 1.757 2.103 2.242 2.658 2.865 3.073 3.143
VALIDATION OFTHE REGRESSION EQUATIONS
To validate the regression equations used in the develop-
ment of the volume table, the study area was revisited in
June 1995. Twenty-one samples, each 30 m x 30 m, was
distributed randomly in the study area. Care was taken
to avoid samples that had been sampled earlier, in 1994.
All trees present in each sample were measured follow-
ing the procedure described earlier in this paper. Mean
crown diameter (CD) and mean tree volume was calcu-
lated by the method mentioned earlier. These samples
were related to the satellite data and the various indices
were calculated in the same way as has been described
earlier in this paper.
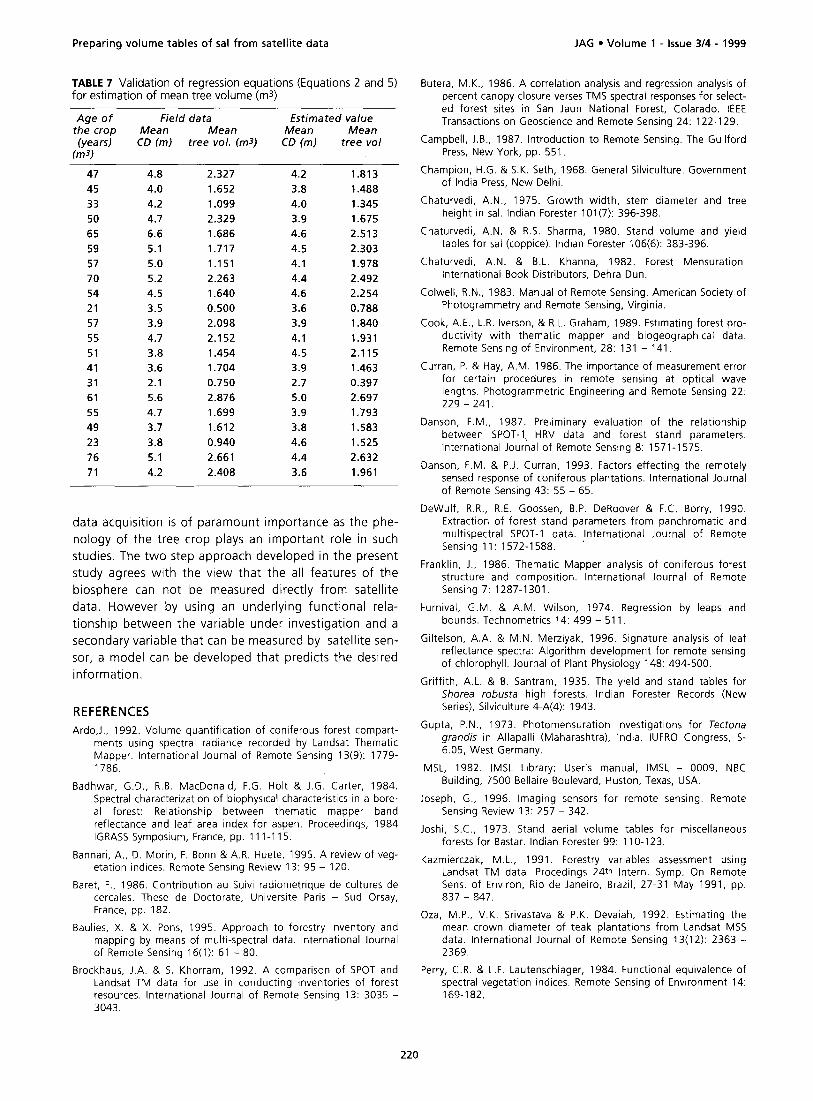
Table 7 gives the measured mean crown diameter (CD) in
metres and mean tree volume (ma) along with their esti-
mated values using regression Equations 2 and 5, respec-
tively. The mean crown diameter estimated from spectral
variables was used in Equation 5, along with the age of
the crop, to estimate the mean tree volume. Note that
more than 90 percent of the calculated mean tree vol-
umes fall within + 1 SEOE, indicating that the estimation
is significant at the 90 percent confidence level. All
though the data set is small, still the methodology can be
validated, indicating the utility of satellite sensor data.
CONCLUSION
The present study indicates the significant utility of satel-
lite data in preparation of mean tree volume tables.
These tables for different forest crops are needed to
define growing stock at the planning stage. However, to
prepare such a table, the selection of a date for satellite
219
Preparing volume tables of sal from satellite data JAG l Volume 1 - issue 3/4 - 1999
TABLE 7 Validation of regression equations (Equations 2 and 5) for estimation of mean tree volume (m3)
Age of the crop (yea rs1
(m3)
Field data Estimated value Mean Mean Mean Mean
CD (mj bee vol. (m-l) CD Cm) tree vol
Butera, M.K., 1986. A correlation analysis and regression analysis of percent canopy closure verses TMS spectral responses for select- ed forest sites in San Jaun National Forest, Colarado. IEEE Transactions on Geoscience and Remote Sensing 24: 122-129.
Campbell, J.B., 1987. Introduction to Remote Sensing. The Guilford Press, New York, pp. 551.
47 4.8 2.327 4.2 1.813
45 4.0 1.652 3.8 1.488
33 4.2 1.099 4.0 1.345
50 4.7 2.329 3.9 1.675
65 6.6 1.686 4.6 2.513
59 5.1 1.717 4.5 2.303
57 5.0 1.151 4.1 1.978
70 5.2 2.263 4.4 2.492
54 4.5 1.640 4.6 2.254
21 3.5 0.500 3.6 0.788
57 3.9 2.098 3.9 1.840
55 4.7 2.152 4.1 1.931
51 3.8 1.454 4.5 2.115
41 3.6 1.704 3.9 1.463
31 2.1 0.750 2.7 0.397
61 5.6 2.876 5.0 2.697
55 4.7 1.699 3.9 1.793
49 3.7 1.612 3.8 1.583
23 3.8 0.940 4.6 1.525
76 5.1 2.661 4.4 2.632
71 4.2 2.408 3.6 1.961
Champion, H.G. & S.K. Seth, 1968. General Silviculture. Government of India Press, New Delhi.
Chaturvedi, A.N., 1975. Growth width, stem diameter and tree height in Sal. Indian Forester lOl(7): 396-398.
Chaturvedi, A.N. & R.S. Sharma, 1980. Stand volume and yield tables for sal (coppice). Indian Forester 106(6): 383-396.
Chaturvedi, A.N. & B.L. Khanna, 1982. Forest Mensuration. International Book Distributors, Dehra Dun.
Colwell, R.N., 1983. Manual of Remote Sensing. American Society of Photogrammetry and Remote Sensing, Virginia.
Cook, A.E., L.R. Iverson, & R.L. Graham, 1989. Estimating forest pro- ductivity with thematic mapper and biogeographical data. Remote Sensing of Environment, 28: 131 - 141.
Curran, P. & Hay, A.M. 1986. The importance of measurement error for certain procedures in remote sensing at optical wave lengths. Photogrammetric Engineering and Remote Sensing 22: 229 - 241.
Danson, F.M., 1987. Preliminary evaluation of the relationship between SPOT-l\ HRV data and forest stand parameters. International Journal of Remote Sensing 8: 1571-1575.
Danson, F.M. & P.J. Curran, 1993. Factors effecting the remotely sensed response of coniferous plantations. International Journal of Remote Sensing 43: 55 - 65.
data acquisition is of paramount importance as the phe-
nology of the tree crop plays an important role in such
studies. The two step approach developed in the present
study agrees with the view that the all features of the
biosphere can not be measured directly from satellite
data. However by using an underlying functional rela-
tionship between the variable under investigation and a
secondary variable that can be measured by satellite sen-
sor, a model can be developed that predicts the desired
information.
DeWulf, R.R., R.E. Goossen, B.P. DeRoover & F.C. Borry, 1990. Extraction of forest stand parameters from panchromatic and multispectral SPOT-l data. International Journal of Remote Sensing 11: 1572-I 588. ”
Franklin, J., 1986. Thematic Mapper analysis of coniferous forest structure and composition. International Journal of Remote Sensing 7: 1287-I 301.
Furnival, G.M. & A.M. Wilson, 1974. Regression by leaps and bounds. Technometrics 14: 499 - 511.
REFERENCES
Giltelson, A.A. & M.N. Merzlyak, 1996. Signature analysis of leaf reflectance spectra: Algorithm development for remote sensing of chlorophyll. Journal of Plant Physiology 148: 494-500.
Griffith, A.L. & B. Santram, 1935. The yield and stand tables for Shorea robusta high forests. Indian Forester Records (New Series), Silviculture 4-A(4): 1943.
Ardo,J., 1992. Volume quantification of coniferous forest compart- ments using spectral radiance recorded by Landsat Thematic Mapper. International Journal of Remote Sensing 13(g): 1779- 1786.
Gupta, P.N., 1973. Photomensuration investigations for Tectona grandis in Allapalli (Maharashtra), India. IUFRO Congress, S- 6.05, West Germany.
Badhwar, G.D., R.B. MacDonald, F.G. Holt & J.G. Carter, 1984. Spectral characterization of biophysical characteristics in a bore- al forest: Relationship between thematic mapper band reflectance and leaf area index for aspen. Proceedings, 1984 IGRASS Symposium, France, pp. 11 l-l 15.
Bannari, A., D. Morin, F. Bonn & A.R. Huete, 1995. A review of veg- etation indices. Remote Sensing Review 13: 95 - 120.
Baret, F., 1986. Contribution au Suivi radiometrique de cultures de cercales. These de Doctorate, Universite Paris - Sud Orsay, France, pp. 182.
IMSL, 1982. IMSL Library: User‘s manual, IMSL - 0009, NBC Building, 7500 Bellaire Boulevard, Huston, Texas, USA.
Joseph, G., 1996. Imaging sensors for remote sensing. Remote Sensing Review 13: 257 - 342.
Joshi, S.C., 1973. Stand aerial volume tables for miscellaneous forests for Bastar. Indian Forester 99: 11 O-123.
Kazmierczak, M.L., 1991. Forestry variables assessment using Landsat TM data. Procedings 24th Intern. Symp. On Remote Sens. of Environ, Rio de Janeiro, Brazil, 27-31 May 1991, pp. 837 - 847.
Baulies, X. & X. Pons, 1995. Approach to forestry inventory and mapping by means of multi-spectral data. International Journal of Remote Sensing 16(l): 61 - 80.
Brockhaus, J.A. & S. Khorram, 1992. A comparison of SPOT and Landsat TM data for use in conducting inventories of forest resources. International Journal of Remote Sensing 13: 3035 - 3043.
Oza, M.P., V.K. Srivastava & P.K. Devaiah, 1992. Estimating the mean crown diameter of teak plantations from Landsat MSS data. International Journal of Remote Sensing 13(12): 2363 - 2369.
Perry, C.R. & L.F. Lautenschlager, 1984. Functional equivalence of spectral vegetation indices. Remote Sensing of Environment 14: 169-182.
220
Preparing volume tables of sal from satellite data JAG l Volume 1 - Issue 3/4 - 1999
Peterson, D.L., W.E. Westman, N.J. Stephenson, V.G. Ambrosia, J.A Brass 8 M.A. Spanner, 1986. Analysis of forest structure using thematic mapper simulated data. IEEE Transactions on Geoscience and Remote Sensing 24: 1541-I 552.
Philip, MS., 1994. Measuring Trees and Forests. CAB International, Oxford, U.K.
Pope, R.B. 1962. Constructing aerial photo volume tables. Pacific North-West forest and range experimental station USDA. Forest Service Research Paper, No. 49.
Ripple, W.J., S. Wang, D.L. lsaacson & D.P. Paine, 1991. A prelimi- nary comparison of Landsat Thematic Mapper and SPOT-l HRV multispectral data for estimating coniferous forest volume. International Journal of Remote Sensing 12: 1971-1977.
Sader, S.A., R.B. Waide, W.T. Lawrence& A.T. Joyce, 1989. Tropical forest biomass and successional age class relationship to a vege- tation index derived from Landsat TM data. Remote Sensing of Environment 28: 143 -156.
Shimabukuro, Y.E., F.P. Hernandez & D.C.L. Lee, 1989. Analise de dados do TM/Landsat para levantamento de reflorestamento. Proc. Simposio Latino-Americano De Sensoriamento Remoto, Argentina, 20-24 November 1989, T-l: 263-271.
Singh, S.P., 1980. Growth and yield of (Shorea robusta) sal in tangya plantations of Gorakhpur forest division. Indian Forester 1 10(7):474-481.
Srivastava, V.K., M.P. Oza & P.K. Devaiah, 1992. Estimation of Production Potential in teak Plantations using Remote Sensing data. Scientific Note, SACIRSAIRSAG-LRDISNI04/92, Space Applications Centre(lSRO), Ahmedabad, 62 pp.
Thomas, I.L., N.P. Ching, V.M. Benning 8 J.A. Auganno, 1987. A review of multi channel indices of class separability. Intern. J. Remote Sens. 8(3): 331 - 350.
Tiwari, P.K. 8 V. Parthsarthy, 1979. Tree and stand aerial volume tables for sal (Shorea robusta). Indian Forester 105(6): 458-470.
Tomppo, E. 8 M. Katila, 1991. Satellite image-based national forest inventory of Finland - Large scale area results. Proceedings of International Geoscience and Remote Sensing Symposium, Espoo, Finland, pp. 1141-I 144.
Trotter, C.M., J.R. Dymond & C.J. Goulding, 1997. Estimation of timber volume in a coniferous plantation forest using Landsat TM. International Journal of Remote Sensing lB(10): 2209- 2223.
Tucker, C.J., 1979. Red and photographic infra-red linear combina- tion for monitoring vegetation. Remote Sensing of Environment 8(2): 127-I 50.
Unnikrishnan, K.P. & R. Singh, 1984. Construction of volume tables - A generalised approach. Indian Forester 11 O(6): 561-573.
RESUME
Le sal (Shorea Robusta) est une espece d’arbre importante dans les forets au nord et au nord-est de I’lnde. Des plantations a grande echelle de cette espece ont ete entreprises avec le syste- me de gestion “taungya et coppice”. La table conventionnelle de volume preparee pour la for& de sals de grande taille permet de deduire le volume de production de cette espece. Les pre- miers employ& ont utilise des donnees aeriennes de teledetec- tion pour developper les tables de volume de cette espece. Dans I’etude presente. une table de volume de sals est developpee basee sur des donnees satellite de teledetection a I’aide d’une technique de regression. Une methode en deux phases a ete developpee afin d’estimer le volume moyen de I’arbre a partir de don&es satellite. Dans la phase 1, le diametre moyen de la cou- ronne - une variable intermediaire - a ete estime a partir de don- nees satellite. Dans la phase 2, le diametre moyen estime a et@ utilise pour deduire le volume moyen de I’arbre. L’addition de I’dge de la recolte en tant que variable independante a ameliore la capacite previsible de I’equation de regression.
RESUMEN
Shorea rob&a (Sal) es una importante especie de drbol forestal del norte y nordeste de la India. En este pais se han desarrollado plantaciones a gran escala de esta especie empleando sistemas de gestion del tipo de la taungya y 10s sotos. Se hate referencia al cuadro de volumen conventional destinado a grandes bos- ques de Shorea para deducir el volumen de production de esta especie. Los trabajadores anteriores utilizaban datos obtenidos por informaci6n aerea de sensores remotos para elaborar 10s cuadros de volumen de esta especie. En el presente estudio se desarrolla un cuadro de volumen para la Shorea basado en datos obtenidos por detection remota por satelite empleando una tecnica de regresion. Se desarrollo un metodo en dos etapas para calcular el volumen medio de 10s &boles a partir de 10s datos del satelite. En la primera etapa, se estimo el diametro medio de la copa (una variable intermedia) a partir de 10s datos del satelite. En la segunda etapa, el didmetro medio e la copa estimado se utilize para calcular el volumen medio de 10s drbo- les. Al ariadir la edad del cultivo coma una variable independien- te se mejoro la capacidad predictiva de la ecuacion de regresibn.
221
Related Documents


![Protective effect of ethanolic extract of Shorea robusta ... · [4], analgesic [5] anti obesity [6] and microbicidal [7] activity in rat model. Since, there is no report available](https://static.cupdf.com/doc/110x72/5ebabeb048586216902e19e7/protective-effect-of-ethanolic-extract-of-shorea-robusta-4-analgesic-5.jpg)


