Chiang Mai J. Sci. 2011; 38(3) : 473-484 http://it.science.cmu.ac.th/ejournal/ Contributed Paper Preparation of Depolymerized Chitosan and Its Effect on Dyeability of Mangosteen Dye Charuwan Suitcharit*[a], Farisan Awae [a], Wae-a-risa Sengmama [a], and Kawee Srikulkit [b] [a] Program of Chemistry, Faculty of Science and Technology, Songkhla Rajabhat University, Songkhla, 90000, Thailand. [b] Department of Materials Science, Faculty of Science, Chulalongkorn University, Bangkok, 10330, Thailand. *Author for correspondance; e-mail: [email protected] Received: 5 August 2010 Accepted: 2 February 2011 ABSTRACT The preparation of chitosan having various low molecular weights was carried out by treatment with sodium nitrite in acid media. The intrinsic viscosities of resultant chitosans designated to CTS-MW I, CTS-MW II, and CTS-MW III were measured for the determination of chitosan’s molecular weights using Mark-Houwink-Sakurada equation. As a result, the molecular weights of CTS-MW I, CTS-MW II, and CTS-MW III were 226 kDa, 10.8 kDa, and 7.2 kDa, respectively. In addition, thus obtained chitosans were characterised by infrared spectroscopy in order to determine the degree of deacetylation and nitrogen content. It was found that the molecular weight values as well as nitrogen content decreased with an increase in the amount of sodium nitrite. The opposite held true in case of percent degree of deacetylation. The application of chitosan onto cotton fabrics was also carried out. The effect of chitosan concentrations was studied. The results showed that percent nitrogen content tended to increase with an increase in the concentration of the depolymerized chitosans. Then, the co-application of chitosan and mangosteen dye extract on cotton fabric was carried out using three dyeing methods, namely, all-in-one method, pre-dyeing method, and post-dyeing method. It was found that the pre-dyeing method showed higher colour strength values in all cases. The effects of chitosan concentration and their molecular weights on colour fastness and fabric stiffness were also studied. The finding showed that chitosan with low molecular weights insignificantly imposed stiffness problem due to the lack of chitosan film formation on the fabric surface. Keywords: depolymerized chitosan, mangosteen dye extract, depolymerization, cotton fabric.

Welcome message from author
This document is posted to help you gain knowledge. Please leave a comment to let me know what you think about it! Share it to your friends and learn new things together.
Transcript
Chiang Mai J. Sci. 2011; 38(3) 473
Chiang Mai J. Sci. 2011; 38(3) : 473-484http://it.science.cmu.ac.th/ejournal/Contributed Paper
Preparation of Depolymerized Chitosan and Its Effect on Dyeability of Mangosteen Dye Charuwan Suitcharit*[a], Farisan Awae [a], Wae-a-risa Sengmama [a], and Kawee Srikulkit [b] [a] Program of Chemistry, Faculty of Science and Technology, Songkhla Rajabhat University,
Songkhla, 90000, Thailand.
[b] Department of Materials Science, Faculty of Science, Chulalongkorn University,
Bangkok, 10330, Thailand.
*Author for correspondance; e-mail: [email protected]
Received: 5 August 2010
Accepted: 2 February 2011
ABSTRACT
The preparation of chitosan having various low molecular weights was carried out
by treatment with sodium nitrite in acid media. The intrinsic viscosities of resultant chitosans
designated to CTS-MW I, CTS-MW II, and CTS-MW III were measured for the determination
of chitosan’s molecular weights using Mark-Houwink-Sakurada equation. As a result, the
molecular weights of CTS-MW I, CTS-MW II, and CTS-MW III were 226 kDa, 10.8 kDa,
and 7.2 kDa, respectively. In addition, thus obtained chitosans were characterised by infrared
spectroscopy in order to determine the degree of deacetylation and nitrogen content. It was
found that the molecular weight values as well as nitrogen content decreased with an increase in
the amount of sodium nitrite. The opposite held true in case of percent degree of deacetylation.
The application of chitosan onto cotton fabrics was also carried out. The effect of chitosan
concentrations was studied. The results showed that percent nitrogen content tended to increase
with an increase in the concentration of the depolymerized chitosans. Then, the co-application
of chitosan and mangosteen dye extract on cotton fabric was carried out using three dyeing
methods, namely, all-in-one method, pre-dyeing method, and post-dyeing method. It was found
that the pre-dyeing method showed higher colour strength values in all cases. The effects of
chitosan concentration and their molecular weights on colour fastness and fabric stiffness
were also studied. The fi nding showed that chitosan with low molecular weights insignifi cantly
imposed stiffness problem due to the lack of chitosan fi lm formation on the fabric surface.
Keywords: depolymerized chitosan, mangosteen dye extract, depolymerization, cotton fabric.
473-484CharuwanPreparationC104.indd 473 17/6/2554 15:35:51
474 Chiang Mai J. Sci. 2011; 38(3)
1. INTRODUCTION
Chitosan is a useful biopolymer obtained
by alkaline deacetylation of chitin. Generally,
chitin is converted into chitosan with various
degrees of deacetylation (DD) and molecular
weights (Mw) depending upon the purpose
of chitosan utilization [1-3]. Chitosan differs
from chitin in that it is soluble in mild acidic
medium. The cationic form of chitosan
in acidic solution plays a role in not only
governing its solubility but also acting as an
active site. The applications of chitosan for
improving dyeability of cotton fabric has been
widely studied [4-6]. In the textile area, the
higher the active site of chitosan favors the
higher the dye adsorption (including natural
dye) as well as fi lm formation on fi ber surface
[7]. Chitosan film on fabric surface is not
desirable since it causes the problem of fabric
stiffness (poor handling) [4, 8]. Fortunately,
these effects could be adjusted by the usage of
chitosan’s proper molecular weight. Normally,
chitosan with various molecular weights could
be achieved by depolymerization techniques.
In this study, the depolymerization of
native chitosan using sodium nitrite under
mild acidic condition was proposed in order to
prepare chitosans with various low molecular
weights [7]. Then the obtained depolymerized
chitosans and mangosteen dye extract as a
colorant were applied onto cotton fabrics. To
investigate the co-application of chitosan and
mangosteen dye extract on cotton fabric, three
dyeing methods, namely, all-in-one method,
pre-dyeing method, and post-dyeing method
were compared. The dyeing properties
including dyeability, colour fastnesses, i.e. light
fastness, wash fastness, and fabric stiffness
were evaluated.
2. MATERIALS AND METHODS
Woven co t ton f abr i c and f r e sh
mangosteen leaves; Garcina mangostana, were
obtained from Keerewong village located at
Nakornsrithamrat province, Thailand. Soap
nut scoured cotton fabrics sized 30 30 cm2
(120 g/m2) and mangosteen leave aqueous
extract were prepared in the laboratory and
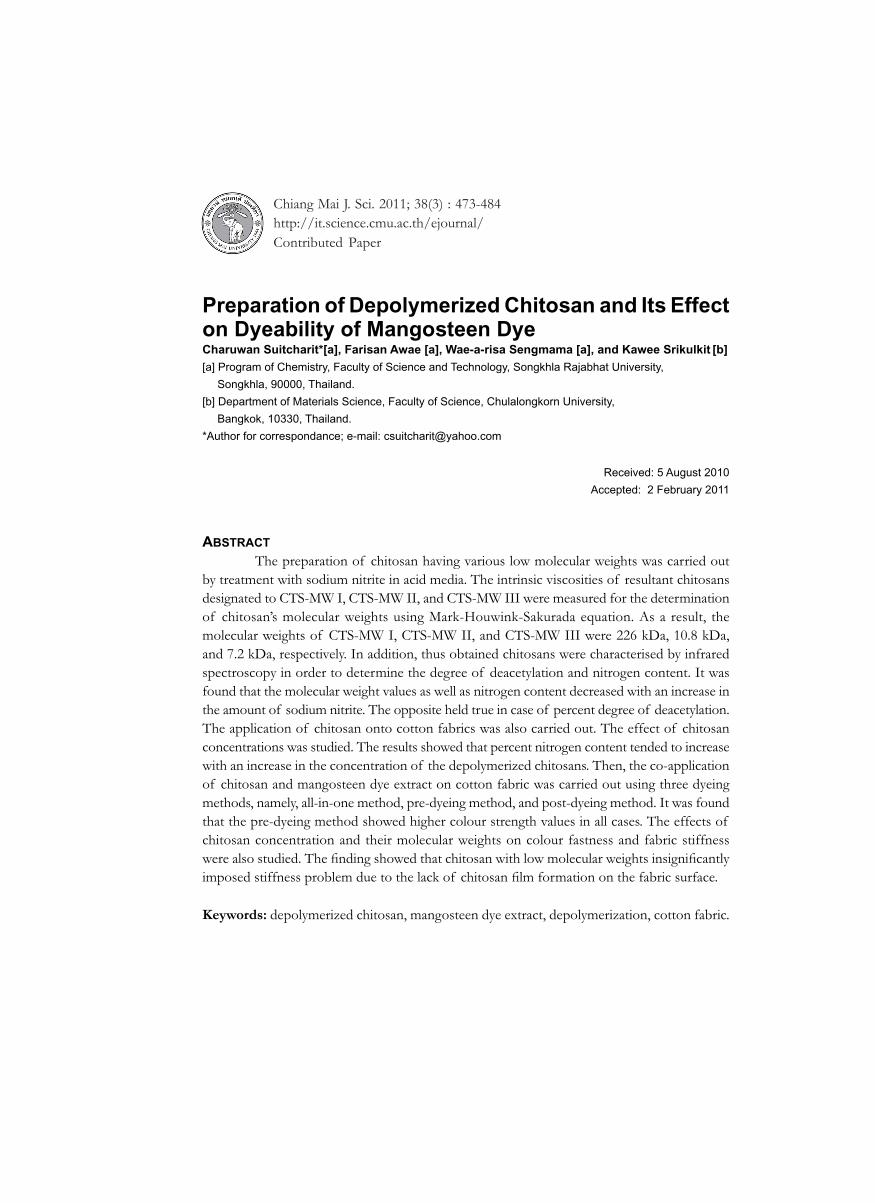
used throughout. The colorants found in
mangosteen extract include xanthone and
tannins [9]. The chemical structures are
presented in Figure 1.
Figure 1. Chemical substances found in Garcina mangostana.
Chiang Mai J. Sci. 2011; 38(3) 475
The scouring conditions used were 20
g/L soap nut extract (natural surfactant) with
pH value of 3.8 and scouring temperature of
90oC for 40 minutes. The scoured fabric with
soap nut extract showed adequate absorbency
for dyeing with a natural dye. Commercial
grade of chitosan powder (approx. 85%
DD with Mw of 2x10² kDa) purchased
from Ebase Co., LTD (Thailand) was used.
Analytical grade chemicals used in this study
were bought from Labscan (acetic acid;
CH3COOH, methanol; CH
3OH, and acetone;
(CH3)
2CO), Univar (sodium hydroxide;
NaOH, and sodium nitrite; NaNO2), and
Unilab (hydrochloric acid; HCl).
2.1 Preparation of Chitosans Having Low Molecular Weights
The depolymerization of chitosan using
sodium nitrite in acid media was carried out
to obtain the chitosan samples with various
molecular weights. Three sets of different
chitosan solutions were prepared by dissolving
6.0 g of chitosan in each 300-mL of 2%
(v/v) acetic acid solution and allowed to
stand overnight at room temperature (RT).
The prepared solution was designated to
“chitosan solution”. Various amounts of
NaNO2, i.e. 0 g, 0.179 g (3% w/w), and 0.543
g (9% w/w) were added into three chitosan
solutions designated as CTS-MW I, CTS-
MW II and CTS-MW III, respectively. The
solutions were slowly stirred at 500 rpm
(FramoR Geratetechnik M 22/1) for 3.5 hrs
at 30oC, and then neutralized with 0.1 M
NaOH. The solutions were concentrated by
rotary evaporator (Buchi Labortechnik AG
: R-124/V) at 50-60oC until about 60 mL
concentrated solutions were obtained. To
extract the chitosan samples, the concentrated
solutions were poured into 100 mL methanol.
The precipitates were collected by fi ltration,
washed several times with acetone, then dried
overnight at RT. The chitosan samples were
kept in refrigerator prior to the determination
of the degree of deacetylation and the average
molecular weight.
2 .2 Deter minat ion o f Deg ree o f Deacetylation
The depolymerized chitosan samples
were characterised by potentiometric titration
to determine the DD value [1]. Each chitosan
samples (0.5 g) were dissolved in 25 mL of
0.1 M HCl and made up to a volume of 100
mL with distilled water. The solution was
then titrated with a titrant of 0.05 M NaOH.
The pH meter (SevenEasy S-20; METTLER
TOLEDO) was used for pH measurement
under continuous stirring. The titrant was
added until the pH value reached 2.00, and
then 0.05 M NaOH was added stepwise, the
pH values of solution were recorded, and
a curve with two infl ection points of each
chitosan sample was plotted. The percent
degree of deacetylation was calculated using
following equation [2] :
DD = [203Q/(1+42Q)] 100% (1)
where Q = N V/m, V is the volume
of NaOH solution between two infl ection
points (in L), N is the concentration of
NaOH (0.05 M), and m is the dry weight of
chitosan samples (g) [1].
2.3 Infrared SpectroscopyInfrared (IR) spectra of chitosans were
recorded on a Shimadzu 8900 FTIR. A
sample was prepared in KBr pellet disc.
The measurement was conducted using
transmission mode at frequency ranges of
4,000-400 cm-1 with 64 consecutive scans at 4
cm-1 resolution.
473-484CharuwanPreparationC104.indd 475 17/6/2554 15:35:59
476 Chiang Mai J. Sci. 2011; 38(3)
2.4 XRD AnalysisXRD diffraction was performed using a
PW 3710 Philips diffractometer with CuK
radiation operated at 40 kV and 30 mA. The
diffraction patterns were obtained from 2 to
30 at scanning rate of 1 min-1.
2.5 Average Molecular Weight CalculationThe average molecular weight (M
v)
of chitosan was calculated with the Mark-
Houwink-Sakurada equation using intrinsic
viscosity ([ ]) and the chitosan-acetic acid
interaction parameters k and at 30oC [2].
The parameters of k and are empirical
coefficient dependent on the degree of
deacetylation of chitosan [7].
[ ] = k
vM (acetic acid) (2)
where k = 1.64 10-30 (DD%)14
and = -1.02 10-2 (DD%)+1.82
2.6 Nitrogen Content in the ChitosanThe nitrogen (N) content of chitosan
obtained from depolymerization process
was measured by Kjeldhal method [6]. The
nitrogen content was calculated using the
following equation:
N = (3)
where [HCl] is the concentration of
hydrochloric acid (0.1 M), Vsp and V
blk are the
volumes of hydrochloric acid (in mL) used for
the titration of chitosan samples and blank,
respectively, and W is the weight of chitosan
(1.0 g).
2.7 Application of Chitosans onto Scoured Cotton Fabrics
The pad-batch application of chitosan
was carried out. The soap nut scoured cotton
fabrics were padded in chitosan solutions at
various concentrations. Typical procedure
was conducted as follows: three chitosan
solutions having concentrations of 2, 6, and
9 g/L (CTS-MW I) along with four chitosan
solutions of 9, 19, 28, and 38 g/L (in case of
CTS-MW II and CTS-MW III) were prepared.
Then, cotton fabrics were impregnated into
the prepared solutions using a laboratory
padding machine (Labtec Co) set a pressure
nip to achieve 90% wet pick-up. The padded
fabric samples were kept in sealed plastic bags
at RT for 3 hrs, rinse with warm water, then
dried using a laboratory mini dryer (Rapid
Labortex Co. Ltd, Taipei, Taiwan) at 70oC for
10 min. Chitosan fabrics were achieved and
employed later for co-application of chitosan
and mangosteen extract dye on cotton fabric
(pre-dyeing method).
2.8 Co-Application of Chitosan and Mangosteen Extract Dye on Cotton Fabric
Three dyeing methods, i.e. all-in-one
method, pre-dyeing method, and post-dyeing
method, were employed with respect to the
chitosan application. To control the materials
used for individual methods, two different
molecular weights with desired concentrations
of chitosan, i.e., CTS-MW I (9 g/L), and CTS-
MW II (38 g/L) were carried out.
The all-in-one method was conducted
by immersing the scoured fabrics into 60 mL
of mixture solution containing chitosan and
mangosteen aqueous extract using the liquor
to material ratio (L:R) of 5:1 at 60oC for 3 hrs.
The pre-dyeing method was carried
out as follows: the scoured fabrics were
impregnated into 10 mL chitosan solution
using a padder. The padded fabrics were
kept in sealed plastic bags at RT for 3 hrs,
then dyed with 100 mL mangosteen aqueous
extract at 60oC for 1 hr using the method
similar to the all-in-one process.
Chiang Mai J. Sci. 2011; 38(3) 477
For the post-dyeing method, the
scoured fabrics were fi rstly dyed in 100 mL
mangosteen aqueous extract at 60°C for 1 hr.
The dyed fabrics were padded with 10 mL
chitosan solution and batched at RT for 3 hrs.
It was noted that all cases of dyed fabrics were
rinsed by tab water to remove surface dye.
2.9 Properties Evaluation Colour values of dyed fabrics were
evaluated using refl ectance spectrophotometer
(Machbeth colour-EYE 7000). The colour
value or colour strength was expressed as K/S
value. The colour fastness of dyed fabrics was
assessed accord ing to the s tandard
m e t h o d s i n c l u d i n g I S O 1 0 5 - B 0 2 :
1994(E) for l ight fastness, and ISO
105-C10: 2006(E) Test no. A (1) for
30 min. at 40°C for wash fastness.
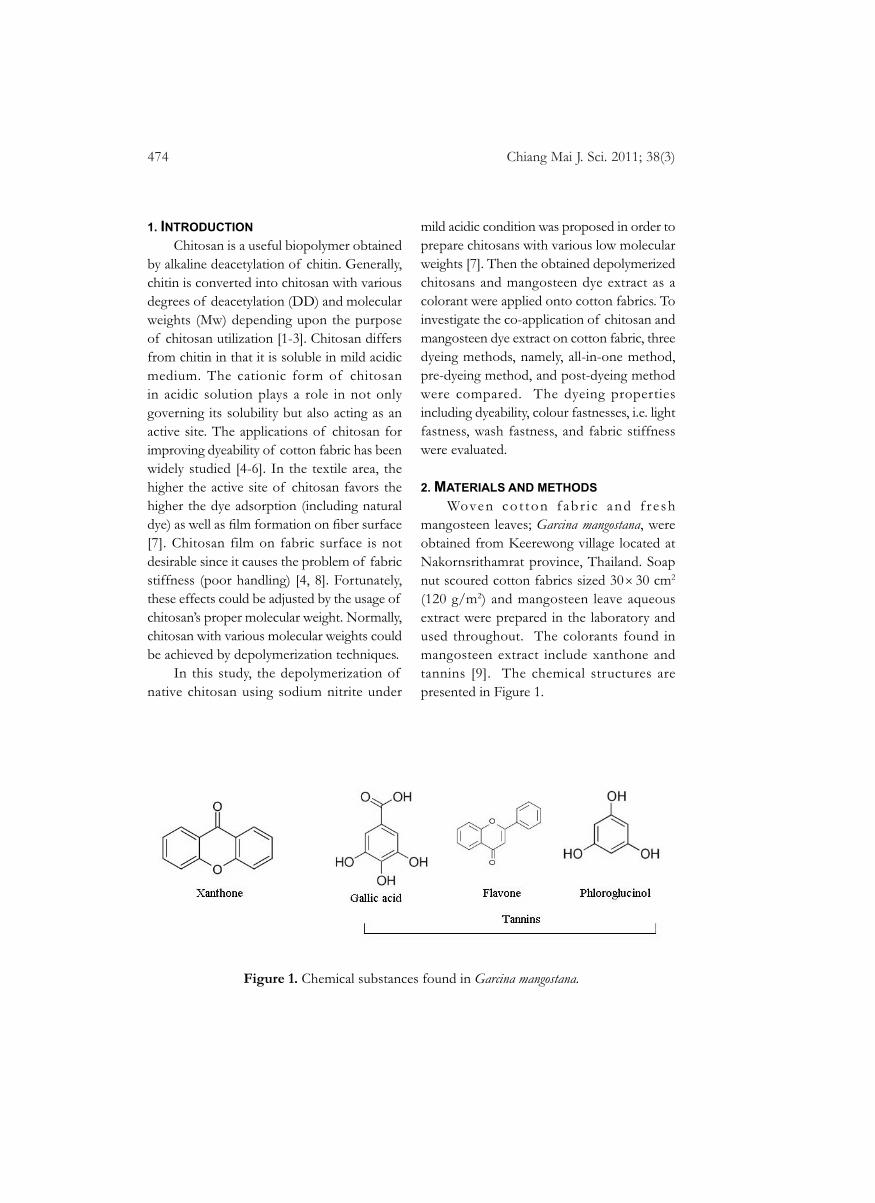
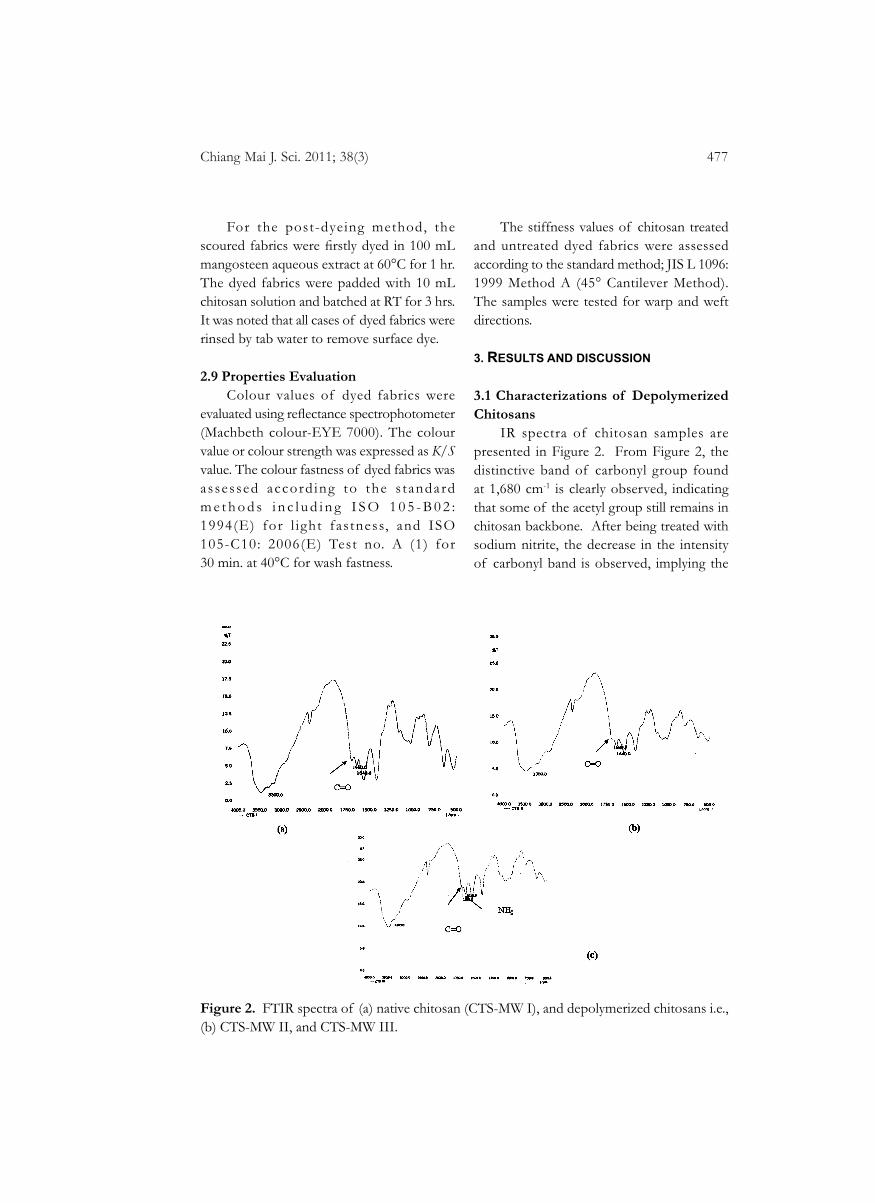
Figure 2. FTIR spectra of (a) native chitosan (CTS-MW I), and depolymerized chitosans i.e.,
(b) CTS-MW II, and CTS-MW III.
The stiffness values of chitosan treated
and untreated dyed fabrics were assessed
according to the standard method; JIS L 1096:
1999 Method A (45° Cantilever Method).
The samples were tested for warp and weft
directions.
3. RESULTS AND DISCUSSION
3.1 Characterizations of Depolymerized Chitosans
IR spectra of chitosan samples are
presented in Figure 2. From Figure 2, the
distinctive band of carbonyl group found
at 1,680 cm-1 is clearly observed, indicating
that some of the acetyl group still remains in
chitosan backbone. After being treated with
sodium nitrite, the decrease in the intensity
of carbonyl band is observed, implying the
473-484CharuwanPreparationC104.indd 477 17/6/2554 15:35:59
478 Chiang Mai J. Sci. 2011; 38(3)
further deacetylation of remaining N-acetyl
groups arising from sodium nitrite treatment.
In addition, quantitative measurement was
determined by potentiometric titration.
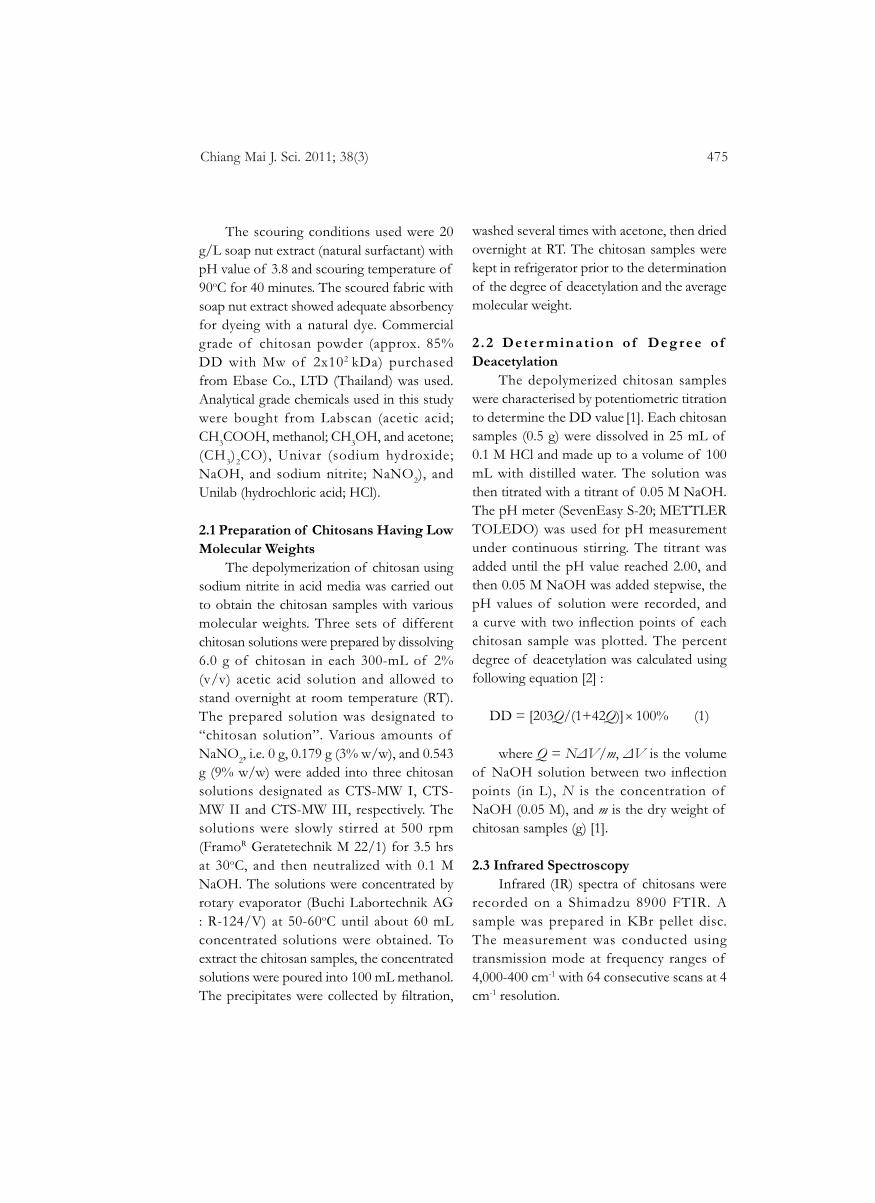
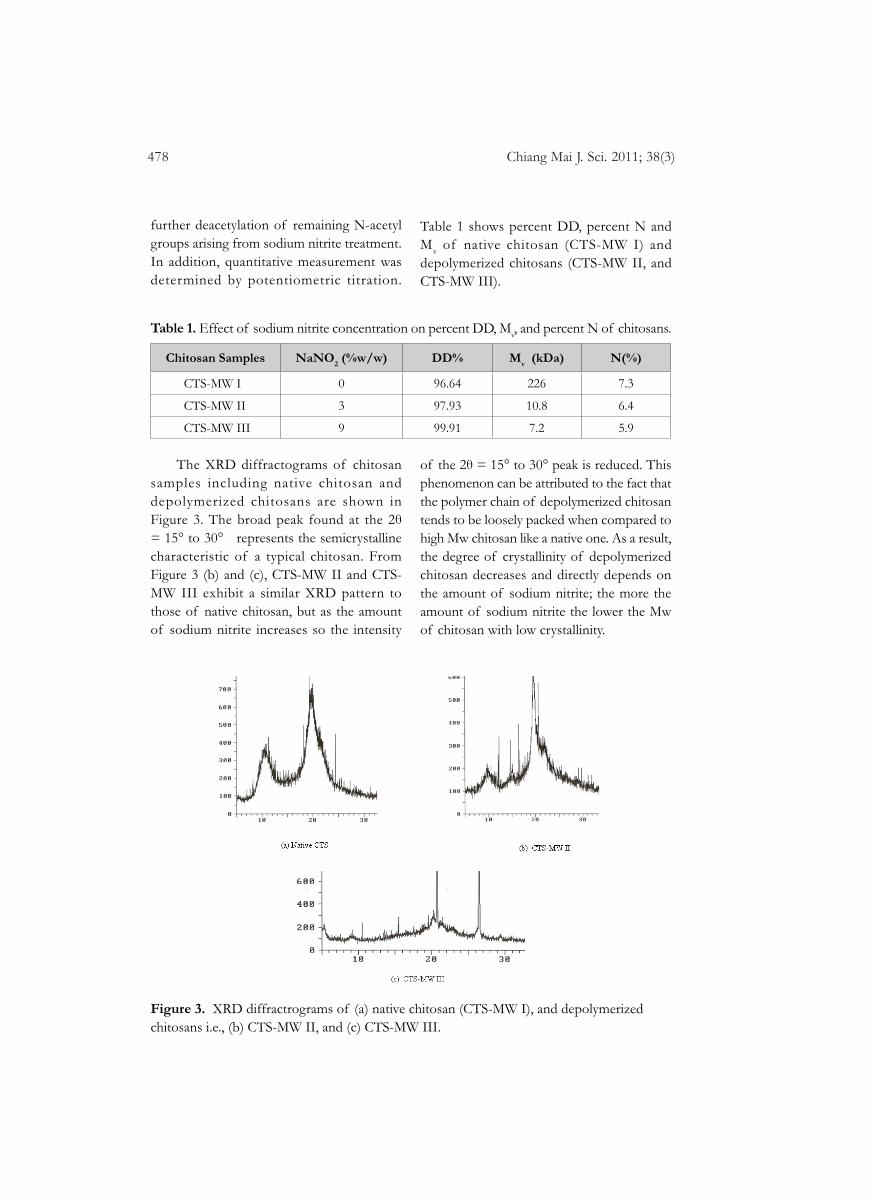
The XRD diffractograms of chitosan
samples including native chitosan and
depolymerized chitosans are shown in
Figure 3. The broad peak found at the 2
= 15° to 30° represents the semicrystalline
characteristic of a typical chitosan. From
Figure 3 (b) and (c), CTS-MW II and CTS-
MW III exhibit a similar XRD pattern to
those of native chitosan, but as the amount
of sodium nitrite increases so the intensity
Figure 3. XRD diffractrograms of (a) native chitosan (CTS-MW I), and depolymerized
chitosans i.e., (b) CTS-MW II, and (c) CTS-MW III.
of the 2 = 15° to 30° peak is reduced. This
phenomenon can be attributed to the fact that
the polymer chain of depolymerized chitosan
tends to be loosely packed when compared to
high Mw chitosan like a native one. As a result,
the degree of crystallinity of depolymerized
chitosan decreases and directly depends on
the amount of sodium nitrite; the more the
amount of sodium nitrite the lower the Mw
of chitosan with low crystallinity.
Table 1. Effect of sodium nitrite concentration on percent DD, Mv, and percent N of chitosans.
Chitosan Samples NaNO2 (%w/w) DD% M
v (kDa) N(%)
CTS-MW I 0 96.64 226 7.3
CTS-MW II 3 97.93 10.8 6.4
CTS-MW III 9 99.91 7.2 5.9
Table 1 shows percent DD, percent N and
Mv of native chitosan (CTS-MW I) and
depolymerized chitosans (CTS-MW II, and
CTS-MW III).
473-484CharuwanPreparationC104.indd 478 17/6/2554 15:36:00
Chiang Mai J. Sci. 2011; 38(3) 479
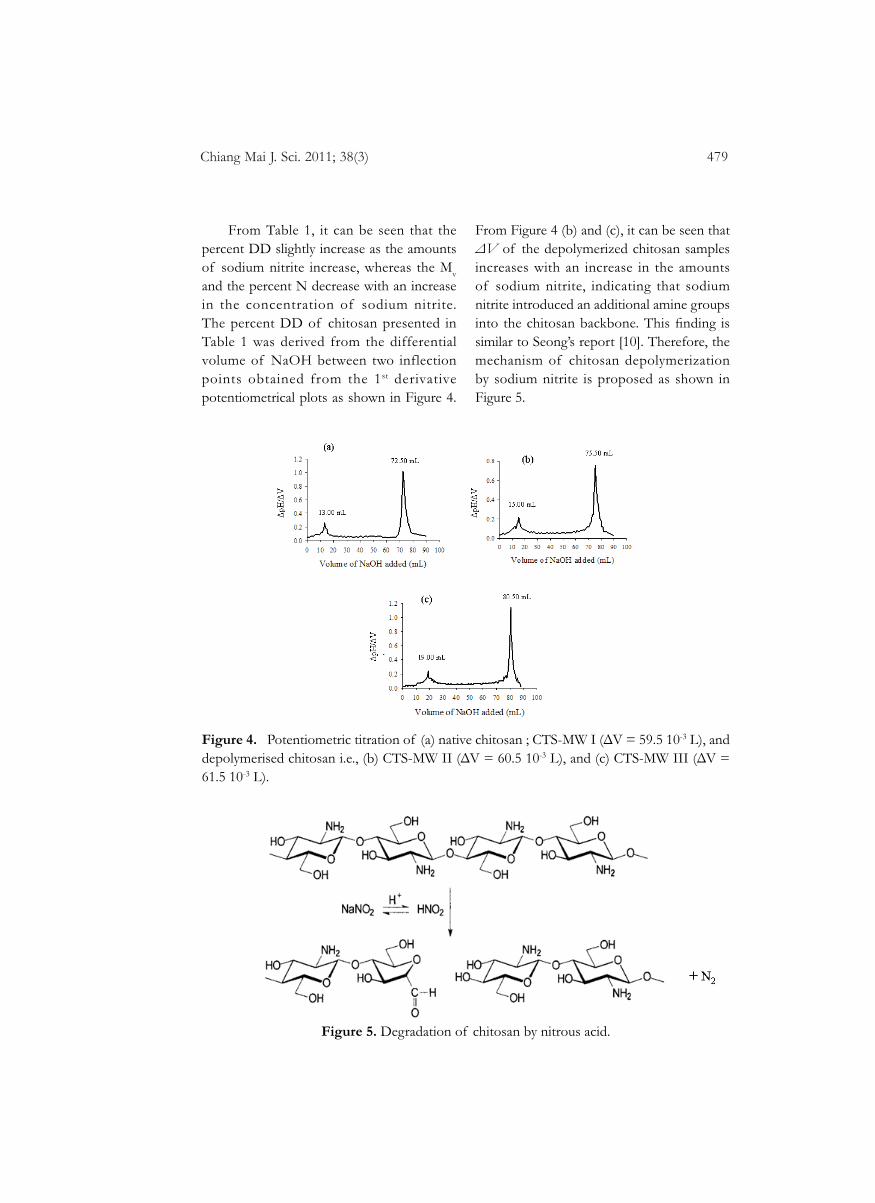
From Table 1, it can be seen that the
percent DD slightly increase as the amounts
of sodium nitrite increase, whereas the Mv
and the percent N decrease with an increase
in the concentration of sodium nitrite.
The percent DD of chitosan presented in
Table 1 was derived from the differential
volume of NaOH between two inflection
points obtained from the 1st derivative
potentiometrical plots as shown in Figure 4.
From Figure 4 (b) and (c), it can be seen that
V of the depolymerized chitosan samples
increases with an increase in the amounts
of sodium nitrite, indicating that sodium
nitrite introduced an additional amine groups
into the chitosan backbone. This fi nding is
similar to Seong’s report [10]. Therefore, the
mechanism of chitosan depolymerization
by sodium nitrite is proposed as shown in
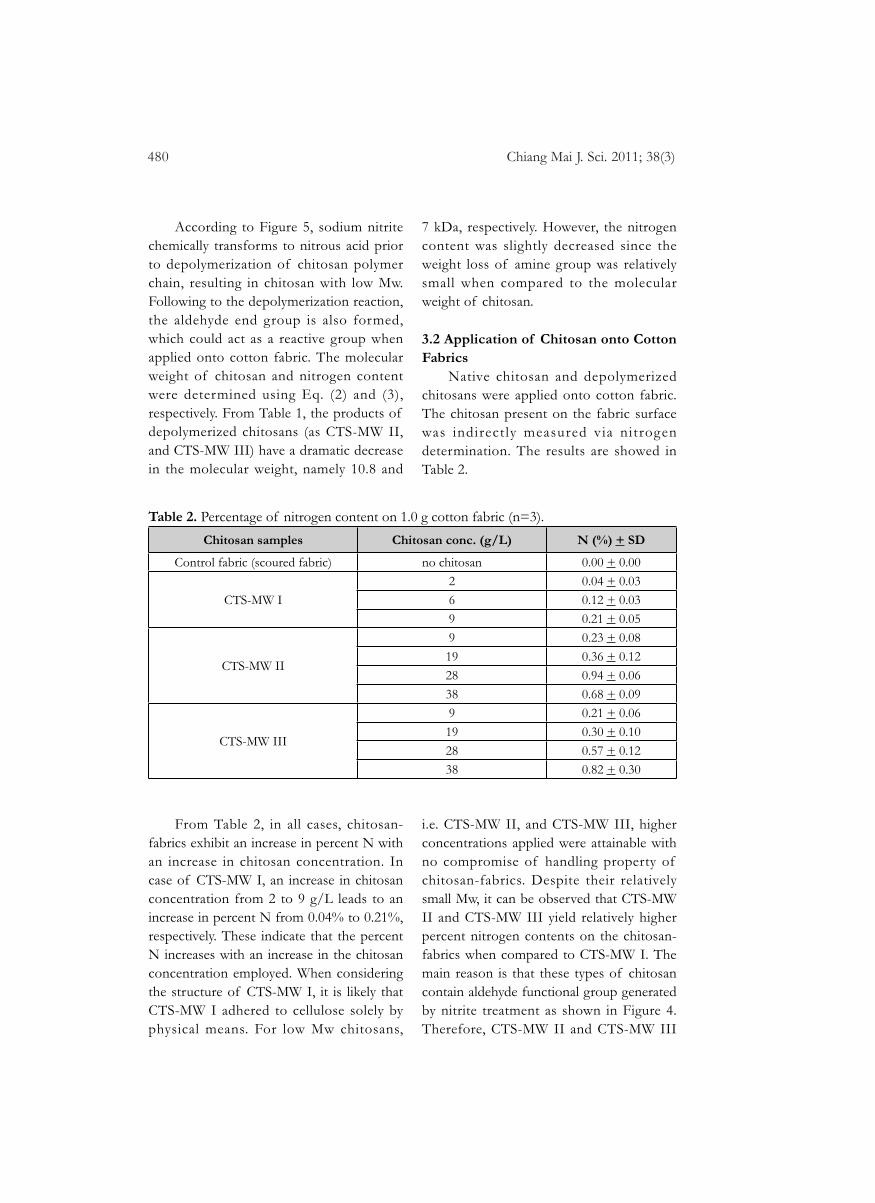
Figure 5.
Figure 4. Potentiometric titration of (a) native chitosan ; CTS-MW I ( V = 59.5 10-3 L), and
depolymerised chitosan i.e., (b) CTS-MW II ( V = 60.5 10-3 L), and (c) CTS-MW III ( V =
61.5 10-3 L).
Figure 5. Degradation of chitosan by nitrous acid.
480 Chiang Mai J. Sci. 2011; 38(3)
According to Figure 5, sodium nitrite
chemically transforms to nitrous acid prior
to depolymerization of chitosan polymer
chain, resulting in chitosan with low Mw.
Following to the depolymerization reaction,
the aldehyde end group is also formed,
which could act as a reactive group when
applied onto cotton fabric. The molecular
weight of chitosan and nitrogen content
were determined using Eq. (2) and (3),
respectively. From Table 1, the products of
depolymerized chitosans (as CTS-MW II,
and CTS-MW III) have a dramatic decrease
in the molecular weight, namely 10.8 and
7 kDa, respectively. However, the nitrogen
content was slightly decreased since the
weight loss of amine group was relatively
small when compared to the molecular
weight of chitosan.
3.2 Application of Chitosan onto Cotton Fabrics
Native chitosan and depolymerized
chitosans were applied onto cotton fabric.
The chitosan present on the fabric surface
was indirectly measured via nitrogen
determination. The results are showed in
Table 2.
Table 2. Percentage of nitrogen content on 1.0 g cotton fabric (n=3).
Chitosan samples Chitosan conc. (g/L) N (%) + SD
Control fabric (scoured fabric) no chitosan 0.00 + 0.00
CTS-MW I
2 0.04 + 0.03
6 0.12 + 0.03
9 0.21 + 0.05
CTS-MW II
9 0.23 + 0.08
19 0.36 + 0.12
28 0.94 + 0.06
38 0.68 + 0.09
CTS-MW III
9 0.21 + 0.06
19 0.30 + 0.10
28 0.57 + 0.12
38 0.82 + 0.30
From Table 2, in all cases, chitosan-
fabrics exhibit an increase in percent N with
an increase in chitosan concentration. In
case of CTS-MW I, an increase in chitosan
concentration from 2 to 9 g/L leads to an
increase in percent N from 0.04% to 0.21%,
respectively. These indicate that the percent
N increases with an increase in the chitosan
concentration employed. When considering
the structure of CTS-MW I, it is likely that
CTS-MW I adhered to cellulose solely by
physical means. For low Mw chitosans,
i.e. CTS-MW II, and CTS-MW III, higher
concentrations applied were attainable with
no compromise of handling property of
chitosan-fabrics. Despite their relatively
small Mw, it can be observed that CTS-MW
II and CTS-MW III yield relatively higher
percent nitrogen contents on the chitosan-
fabrics when compared to CTS-MW I. The
main reason is that these types of chitosan
contain aldehyde functional group generated
by nitrite treatment as shown in Figure 4.
Therefore, CTS-MW II and CTS-MW III
473-484CharuwanPreparationC104.indd 480 17/6/2554 15:36:01
Chiang Mai J. Sci. 2011; 38(3) 481
could undergo covalent bonding with cotton
cellulose, leading to their adhesion ability.
When focused on CTS-MW II, the resultant
percent N contents are found slightly higher
than those of CTS-MW III. One of the
possible reasons is that the affi nity of CTS-
MW III onto cellulose was lower due to its
relatively smaller polymer molecule.
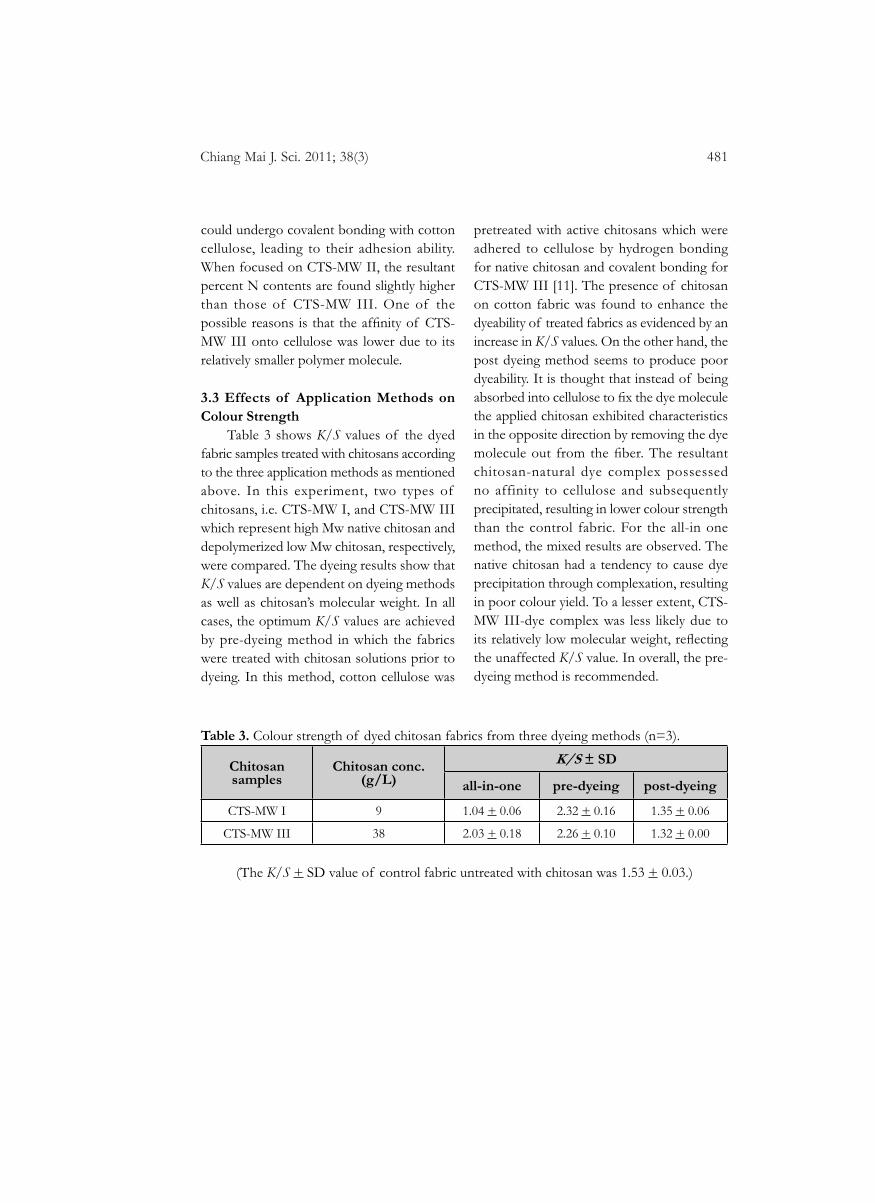
3.3 Effects of Application Methods on Colour Strength
Table 3 shows K/S values of the dyed
fabric samples treated with chitosans according
to the three application methods as mentioned
above. In this experiment, two types of
chitosans, i.e. CTS-MW I, and CTS-MW III
which represent high Mw native chitosan and
depolymerized low Mw chitosan, respectively,
were compared. The dyeing results show that
K/S values are dependent on dyeing methods
as well as chitosan’s molecular weight. In all
cases, the optimum K/S values are achieved
by pre-dyeing method in which the fabrics
were treated with chitosan solutions prior to
dyeing. In this method, cotton cellulose was
pretreated with active chitosans which were
adhered to cellulose by hydrogen bonding
for native chitosan and covalent bonding for
CTS-MW III [11]. The presence of chitosan
on cotton fabric was found to enhance the
dyeability of treated fabrics as evidenced by an
increase in K/S values. On the other hand, the
post dyeing method seems to produce poor
dyeability. It is thought that instead of being
absorbed into cellulose to fi x the dye molecule
the applied chitosan exhibited characteristics
in the opposite direction by removing the dye
molecule out from the fi ber. The resultant
chitosan-natural dye complex possessed
no affinity to cellulose and subsequently
precipitated, resulting in lower colour strength
than the control fabric. For the all-in one
method, the mixed results are observed. The
native chitosan had a tendency to cause dye
precipitation through complexation, resulting
in poor colour yield. To a lesser extent, CTS-
MW III-dye complex was less likely due to
its relatively low molecular weight, refl ecting
the unaffected K/S value. In overall, the pre-
dyeing method is recommended.
Table 3. Colour strength of dyed chitosan fabrics from three dyeing methods (n=3).
Chitosan samples
Chitosan conc.(g/L)
K/S ± SD
all-in-one pre-dyeing post-dyeing
CTS-MW I 9 1.04 + 0.06 2.32 + 0.16 1.35 + 0.06
CTS-MW III 38 2.03 + 0.18 2.26 + 0.10 1.32 + 0.00
(The K/S + SD value of control fabric untreated with chitosan was 1.53 + 0.03.)
473-484CharuwanPreparationC104.indd 481 17/6/2554 15:36:01
482 Chiang Mai J. Sci. 2011; 38(3)
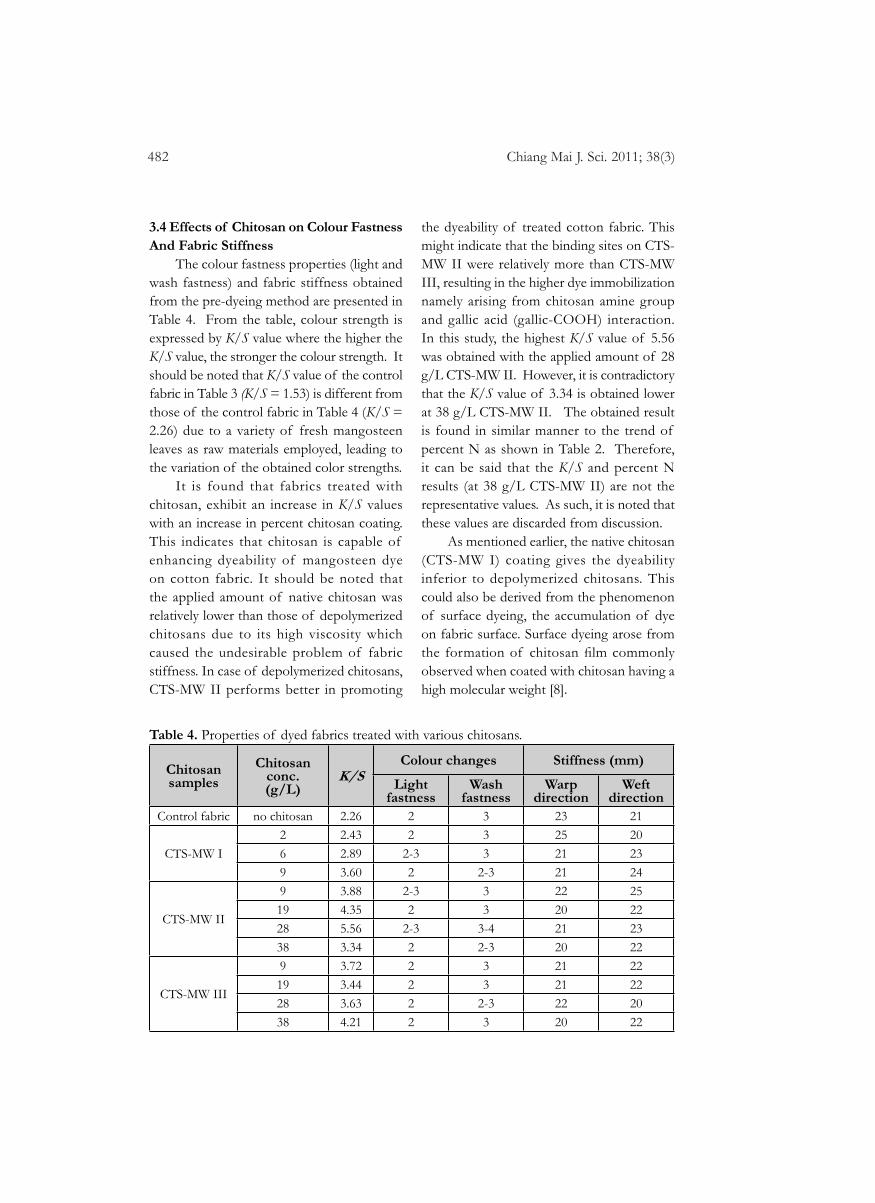
3.4 Effects of Chitosan on Colour Fastness And Fabric Stiffness
The colour fastness properties (light and
wash fastness) and fabric stiffness obtained
from the pre-dyeing method are presented in
Table 4. From the table, colour strength is
expressed by K/S value where the higher the
K/S value, the stronger the colour strength. It
should be noted that K/S value of the control
fabric in Table 3 (K/S = 1.53) is different from
those of the control fabric in Table 4 (K/S =
2.26) due to a variety of fresh mangosteen
leaves as raw materials employed, leading to
the variation of the obtained color strengths.
It is found that fabrics treated with
chitosan, exhibit an increase in K/S values
with an increase in percent chitosan coating.
This indicates that chitosan is capable of
enhancing dyeability of mangosteen dye
on cotton fabric. It should be noted that
the applied amount of native chitosan was
relatively lower than those of depolymerized
chitosans due to its high viscosity which
caused the undesirable problem of fabric
stiffness. In case of depolymerized chitosans,
CTS-MW II performs better in promoting
the dyeability of treated cotton fabric. This
might indicate that the binding sites on CTS-
MW II were relatively more than CTS-MW
III, resulting in the higher dye immobilization
namely arising from chitosan amine group
and gallic acid (gallic-COOH) interaction.
In this study, the highest K/S value of 5.56
was obtained with the applied amount of 28
g/L CTS-MW II. However, it is contradictory
that the K/S value of 3.34 is obtained lower
at 38 g/L CTS-MW II. The obtained result
is found in similar manner to the trend of
percent N as shown in Table 2. Therefore,
it can be said that the K/S and percent N
results (at 38 g/L CTS-MW II) are not the
representative values. As such, it is noted that
these values are discarded from discussion.
As mentioned earlier, the native chitosan
(CTS-MW I) coating gives the dyeability
inferior to depolymerized chitosans. This
could also be derived from the phenomenon
of surface dyeing, the accumulation of dye
on fabric surface. Surface dyeing arose from
the formation of chitosan fi lm commonly
observed when coated with chitosan having a
high molecular weight [8].
Table 4. Properties of dyed fabrics treated with various chitosans.
Chitosan samples
Chitosan conc.(g/L)
K/S Colour changes Stiffness (mm)
Light fastness
Wash fastness
Warp direction
Weft direction
Control fabric no chitosan 2.26 2 3 23 21
CTS-MW I
2 2.43 2 3 25 20
6 2.89 2-3 3 21 23
9 3.60 2 2-3 21 24
CTS-MW II
9 3.88 2-3 3 22 25
19 4.35 2 3 20 22
28 5.56 2-3 3-4 21 23
38 3.34 2 2-3 20 22
CTS-MW III
9 3.72 2 3 21 22
19 3.44 2 3 21 22
28 3.63 2 2-3 22 20
38 4.21 2 3 20 22
473-484CharuwanPreparationC104.indd 482 17/6/2554 15:36:01
Chiang Mai J. Sci. 2011; 38(3) 483
Fabric stiffness was assessed by bending
stiffness tester. A measured bending length
is indicative of fabric stiffness where the
higher the bending length, the higher would
be the fabric stiffness. The results presented
in Table 4 show that all cases of chitosan
fabrics exhibit similar stiffness values. For the
native chitosan which typically causes fabric
stiffness due to its ease of fi lm formation,
this problem was minimized by the usage
of low concentrations of chitosan solutions
(6 to 9 g/L). In the case of depolymerized
chitosans, high concentrations (19 to 38 g/L)
could be employed without the presence of
fabric stiffness thanks to the loss of film
characteristic
4. CONCLUSION
In this study, depolymerization of
chitosan using sodium nitrite to prepare
various low Mw chitosans was carried out.
FTIR analysis provided evidence to support
that depolymerized chitosan contained
an increase in free amine groups as a result
of deacetylation of remaining N-acetyl
groups. Moreover, the depolymerized
chitosan contained an increased percent DD
and a decreased percent N with respect to
increasing amounts of sodium nitrite.
Then, obtained chitosans combined with
mangosteen dye extract were applied
onto cotton fabric. An effect of chitosan
application methods on the properties
of dyed fabrics was evaluated. In all cases,
the pre-dyeing method in which the fabrics
were treated with chitosan solutions prior
to dyeing produced the optimum K/S value.
An increase in chitosan concentration
resulted in an increase in the dyeability
of mangosteen dye. This effect was
associated with the presence of bonded
chitosan through the chemical reaction
of the chitosan aldehyde group with
cellulose. As a result of low Mw employed,
depolymerized chitosans with higher
concentration (compared to native chitosan)
could be employed without the concession
of a stiffness problem. The reason for this is
due to their low Mw depolymerized chitosans
exhibited no fi lm formation.
ACKNOWLEDGEMENT
The authors wish to thank the Institute
of Research and Development for the Health
of Southern, Prince of Songkla University,
Thailand, for fi nancial support throughout
this work as part of phase I of re-entry
project.
REFERENCES
[1] Abdou E.S., Nagy K.S.A. and Elsabee
M.Z., Extraction and characterization of
chitin and chitosan from local sources,
Biores. Technol., 2008; 99: 1359-1367.
[2] Gupta K.C. and Jabrail F.H., Effects
of degree of deacetylation and cross-
linking on physical characteristics,
swelling and release behavior of chitosan
microspheres, Carbohydr. Polym., 2006; 66:
43-54.
[3] Zentz F., Bédouet L., Almeida M.J.,
Milet C., Lopez E. and Giraud M.,
Characterization and Quantifi cation
of chitosan Extracted from Nacre of
the Abalone Haliotis tuberculata and the
Oyster Pinctada maxima. Mar. Biotechnol.,
2001; 3: 36-44.
[4] Kittinaovarat S., Using Chitosan for
Improving the Dyeability of Cotton
Fabrics with Mangosteen Rind Dye, J.
Sci. Res. Chula. Univ., 2004; 29: 155-164.
[5] Vakhito N.A. and Safonov V.V., Effect
of chitosan on the effi ciency of dyeing
textiles with active dyes, Fibre Chem.,
2003; 35: 27-28.
484 Chiang Mai J. Sci. 2011; 38(3)
[6] Hakeim O., Abou-Okeil A., Abdou A.W.
and Waly A., The Infl uence of Chitosan
and Some of Its Depolymerized Grades
on Natural Colour Printing, J. App. Polym.
Sci., 2005; 97: 559-563.
[7] Lim S-H., Synthesis of a Fiber-Reactive
Chitosan derivative and its Application to
Cotton Fabric as an Antimicrobial Finish
and a Dyeing-Improving Agent, Ph.D.
Dissertation, North Carolina State
University, USA, 2002.
[8] Srisuk S. and Srikulkit K., Properties
Evaluation of Some Sodium Nitrite
Chitosan-Cotton Fabric, J. Met. Mater.
Miner., 2008; 18: 41-45.
[9] Simon, P-W., Plant Pigments for Color
and Nutrition, HortScience, 1997; 32: 12-
13.
[10] Seong H-S., Kim J-P. and Ko S-W.,
Preparing chito-oligosaccharides as
antimicrobial agents for cotton, Text.
Res. J., 1999; 69: 483-488.
[11] Houshyar S. and Amirshahi S.H.,
Treatment of Cotton with Chitosan and
Its Effect on Dyeability with Reactive
Dyes, Iran Polym. J., 2002; 11: 295-301.
Related Documents


