polymers Article Preparation and Properties of Poly(ethylene glycol-co-cyclohexane-1,4-dimethanol terephthalate)/Polyglycolic Acid (PETG/PGA) Blends Kai Wang 1 , Jianing Shen 1 , Zhao Ma 1 , Yipeng Zhang 1 , Nai Xu 1, * and Sujuan Pang 2 Citation: Wang, K.; Shen, J.; Ma, Z.; Zhang, Y.; Xu, N.; Pang, S. Preparation and Properties of Poly(ethylene glycol-co-cyclohexane-1,4-dimethanol terephthalate)/Polyglycolic Acid (PETG/PGA) Blends. Polymers 2021, 13, 452. https://doi.org/10.3390/ polym13030452 Academic Editor: Dimitrios Bikiaris Received: 10 January 2021 Accepted: 26 January 2021 Published: 31 January 2021 Publisher’s Note: MDPI stays neutral with regard to jurisdictional claims in published maps and institutional affil- iations. Copyright: © 2021 by the authors. Licensee MDPI, Basel, Switzerland. This article is an open access article distributed under the terms and conditions of the Creative Commons Attribution (CC BY) license (https:// creativecommons.org/licenses/by/ 4.0/). 1 Department of Polymer Materials and Engineering, School of Materials Science and Engineering, Hainan University, Haikou 570228, China; [email protected] (K.W.); [email protected] (J.S.); [email protected] (Z.M.); [email protected] (Y.Z.) 2 Department of Public Chemistry Teaching, School of Science, Hainan University, Haikou 570228, China; [email protected] * Correspondence: [email protected]; Tel.: +86-1313-602-3445 Abstract: Polyglycolic acid (PGA) is used as a reinforcing component to enhance the mechanical properties of poly(ethylene glycol-co-cyclohexane-1,4-dimethanol terephthalate) (PETG). The tensile performance, micromorphology, crystallinity, heat resistance, and melt mass flow rates (MFRs) of PETG/PGA blends with varying PGA contents were studied. Both the tensile yield strength and tensile modulus of the PETG/PGA blends increased gradually with an increase in the PGA content from 0 to 35 wt%. The tensile yield strength of the PETG/PGA (65/35) blend increased by 8.7% (44.38 to 48.24 MPa), and the tensile modulus increased by 40.2% (1076 to 1509 MPa). However, its tensile ductility decreased drastically, owing to the poor interfacial compatibility of PETG/PGA and the oversized PGA domains. A multiple epoxy chain extender (ADR) was introduced into the PETG/PGA (65/35) blend to improve its interfacial compatibility and rheological properties. The tensile performance, micromorphology, rheological properties, crystallinity, and heat resistance of PETG/PGA (65/35) blends with varying ADR contents were studied. The strong chain extension effect of ADR along with its reactive compatibilization improved the rheological properties and tensile ductility. By carefully controlling the ADR concentration, the performance of PETG/PGA blends can be regulated for different applications. Keywords: PETG; PGA; tensile performance; interfacial compatibility; rheological property 1. Introduction Poly(ethylene glycol-co-cyclohexane-1,4-dimethanol terephthalate) (PETG) is an amor- phous copolyester, synthesized by the polycondensation of 1,4-cyclohexanedimethanol (CHDM), ethylene glycol (EG), and terephthalic acid (TPA) in certain proportions [1]. PETG has excellent properties, such as high ductility, high chemical resistance, pro- cessability, and recyclability [2–4]. PETG, owing to its versatility, has been widely used for packaging. In recent years, PETG has also become a material of choice for 3D printing [5,6]. However, with its increased applications, the mechanical performance of PETG, such as tensile strength, modulus, and heat resistance, need to be boosted. Seong-Hun et al. used carbon black (CB) as a reinforcement to enhance the mechanical properties of PETG [7]. The results revealed that when the CB content was increased from 0 to 3 wt%, the tensile yield strength and tensile modulus of the composite increased by 11.2 and 5.9%, respectively. This could be attributed to the excellent mechanical properties and three-dimensional crystal structures of CB particles, which increased the strength of the PETG. Yuhsin Tsai et al. studied the influence of the organic clay content on the physical properties of PETG [8]. It was found that with an increase in the organic clay content from 0 Polymers 2021, 13, 452. https://doi.org/10.3390/polym13030452 https://www.mdpi.com/journal/polymers

Welcome message from author
This document is posted to help you gain knowledge. Please leave a comment to let me know what you think about it! Share it to your friends and learn new things together.
Transcript
polymers
Article
Preparation and Properties of Poly(ethyleneglycol-co-cyclohexane-1,4-dimethanolterephthalate)/Polyglycolic Acid (PETG/PGA) Blends
Kai Wang 1, Jianing Shen 1, Zhao Ma 1, Yipeng Zhang 1, Nai Xu 1,* and Sujuan Pang 2
�����������������
Citation: Wang, K.; Shen, J.; Ma, Z.;
Zhang, Y.; Xu, N.; Pang, S.
Preparation and Properties of
Poly(ethylene
glycol-co-cyclohexane-1,4-dimethanol
terephthalate)/Polyglycolic Acid
(PETG/PGA) Blends. Polymers 2021,
13, 452. https://doi.org/10.3390/
polym13030452
Academic Editor: Dimitrios Bikiaris
Received: 10 January 2021
Accepted: 26 January 2021
Published: 31 January 2021
Publisher’s Note: MDPI stays neutral
with regard to jurisdictional claims in
published maps and institutional affil-
iations.
Copyright: © 2021 by the authors.
Licensee MDPI, Basel, Switzerland.
This article is an open access article
distributed under the terms and
conditions of the Creative Commons
Attribution (CC BY) license (https://
creativecommons.org/licenses/by/
4.0/).
1 Department of Polymer Materials and Engineering, School of Materials Science and Engineering,Hainan University, Haikou 570228, China; [email protected] (K.W.); [email protected] (J.S.);[email protected] (Z.M.); [email protected] (Y.Z.)
2 Department of Public Chemistry Teaching, School of Science, Hainan University, Haikou 570228, China;[email protected]
* Correspondence: [email protected]; Tel.: +86-1313-602-3445
Abstract: Polyglycolic acid (PGA) is used as a reinforcing component to enhance the mechanicalproperties of poly(ethylene glycol-co-cyclohexane-1,4-dimethanol terephthalate) (PETG). The tensileperformance, micromorphology, crystallinity, heat resistance, and melt mass flow rates (MFRs) ofPETG/PGA blends with varying PGA contents were studied. Both the tensile yield strength andtensile modulus of the PETG/PGA blends increased gradually with an increase in the PGA contentfrom 0 to 35 wt%. The tensile yield strength of the PETG/PGA (65/35) blend increased by 8.7%(44.38 to 48.24 MPa), and the tensile modulus increased by 40.2% (1076 to 1509 MPa). However,its tensile ductility decreased drastically, owing to the poor interfacial compatibility of PETG/PGAand the oversized PGA domains. A multiple epoxy chain extender (ADR) was introduced into thePETG/PGA (65/35) blend to improve its interfacial compatibility and rheological properties. Thetensile performance, micromorphology, rheological properties, crystallinity, and heat resistance ofPETG/PGA (65/35) blends with varying ADR contents were studied. The strong chain extensioneffect of ADR along with its reactive compatibilization improved the rheological properties andtensile ductility. By carefully controlling the ADR concentration, the performance of PETG/PGAblends can be regulated for different applications.
Keywords: PETG; PGA; tensile performance; interfacial compatibility; rheological property
1. Introduction
Poly(ethylene glycol-co-cyclohexane-1,4-dimethanol terephthalate) (PETG) is an amor-phous copolyester, synthesized by the polycondensation of 1,4-cyclohexanedimethanol(CHDM), ethylene glycol (EG), and terephthalic acid (TPA) in certain proportions [1].
PETG has excellent properties, such as high ductility, high chemical resistance, pro-cessability, and recyclability [2–4]. PETG, owing to its versatility, has been widely used forpackaging. In recent years, PETG has also become a material of choice for 3D printing [5,6].However, with its increased applications, the mechanical performance of PETG, such astensile strength, modulus, and heat resistance, need to be boosted.
Seong-Hun et al. used carbon black (CB) as a reinforcement to enhance the mechanicalproperties of PETG [7]. The results revealed that when the CB content was increased from0 to 3 wt%, the tensile yield strength and tensile modulus of the composite increased by11.2 and 5.9%, respectively. This could be attributed to the excellent mechanical propertiesand three-dimensional crystal structures of CB particles, which increased the strength ofthe PETG.
Yuhsin Tsai et al. studied the influence of the organic clay content on the physicalproperties of PETG [8]. It was found that with an increase in the organic clay content from 0
Polymers 2021, 13, 452. https://doi.org/10.3390/polym13030452 https://www.mdpi.com/journal/polymers

Polymers 2021, 13, 452 2 of 20
to 3 wt%, the tensile yield strength increased from 47.9 to 53.3 MPa, and the tensile modulusincreased from 1849 to 2154 MPa. This was mainly due to the reinforcing effect of the claynanosheets, which were rigid and had a high aspect ratio. However, the tensile ductility(in terms of the elongation at break) of the PETG/organoclay nanocomposites significantlydeclined with an increase in organic clay content. For example, when 3 wt% organic claywas introduced into the PETG matrix, the elongation at break decreased from 112.9% (neatPETG sample) to 9.2%. As well-known, for most polymer blends and composites, howto tailor their properties to achieve a stiffness–ductility balance is still an interesting andchallenging issue.
Besides rigid inorganic particles, rigid organic polymers are also potential reinforce-ments for the PETG matrix. To date, few studies have reported on the introduction of rigidpolymers into the PETG matrix as the reinforcing material.
Polyglycolic acid (PGA) is a kind of aliphatic polyester, mainly synthesized by thering-opening polymerization of glycolide or by the direct polycondensation of glycolicacid [9,10]. PGA possesses excellent mechanical strength and rigidity [11–13] along withgood biocompatibility and biodegradability [14,15]. Owing to its high strength and rigidity(tensile strength = 115 MPa and tensile modulus = 7 GPa) [11,12], PGA can be consideredas a candidate for enhancing the mechanical performance of PETG.
To date, very little research has been reported on the reinforcing effect of PGA onPETG. In this paper, PGA was used as a reinforcing component to improve the mechanicalproperties of PETG. PETG/PGA binary blends with different PGA contents were preparedby melt-blending. The tensile performance, micromorphology, crystallinity, heat resistance,and melt mass flow rates (MFRs) of the PETG/PGA blends were studied in detail. Itwas found that the tensile yield strength and modulus of the binary blend increasedwith an increase in the PGA content. With 35 wt% PGA, the PETG/PGA (65/35) blendshowed the maximum tensile yield strength and modulus. However, the poor interfacialcompatibility between the PETG matrix and the PGA domains caused the tensile ductilityof the PETG/PGA (65/35) blend to drastically decrease. Moreover, the high melt fluidityof PGA increased the MFR of the PETG/PGA blend, which was not conducive to itsprocessing for some common processing technologies, such as extrusion, blown film,thermoforming, etc. The interfacial compatibility and the rheological properties of thePETG/PGA (65/35) blend could be improved by introducing a multiple epoxy chainextender into the PETG/PGA (65/35) blend. The effect of the chain extender on thePETG/PGA melt was evaluated by torque rheometry and MFR testing. In addition, theeffect of adding the chain extender on the tensile properties, micromorphology, crystallinity,and heat resistance of the PETG/PGA (65/35) blend was studied in detail. Finally, amodified PETG/PGA (65/35) blend with improved tensile performance and heat resistance,and good rheological properties was successfully prepared.
2. Materials and Methods2.1. Materials
PETG (K2012), with a density of 1.27 g/cm3 and MFR of 5.1 g/10 min (230 ◦C, 2.16 kg),was supplied by SK Chemicals Co. Ltd. (Seoul, Korea). PGA, with a density of 1.53 g/cm3
and MFR of 28.4 g/10 min (230 ◦C, 2.16 kg), was obtained from Inner Mongolia PujingPolymer Materials Technology Co. Ltd. (Bao Tou, China). The multiple epoxy chainextender (Joncryl ADR 4370s, abbreviated as ADR in this paper) was purchased from BASF(Ludwigshafen, Germany). Its molecular weight and epoxy equivalent weight were 6800and 285 g/mol, respectively. The chemical structures of PETG, PGA, and ADR are shownin Figure 1.

Polymers 2021, 13, 452 3 of 20
Polymers 2021, 13, x FOR PEER REVIEW 3 of 22
and 285 g/mol, respectively. The chemical structures of PETG, PGA, and ADR are shown in Figure 1.
Figure 1. Chemical structures of (a) poly(ethylene glycol-co-cyclohexane-1,4-dimethanol terephthalate) (PETG), (b) pol-yglycolic acid (PGA), and (c) Joncryl ADR 4370s (ADR).
2.2. Sample Preparation Prior to compounding, pellets of both PETG and PGA were dried under vacuum at
45 °C for 12 hours to remove moisture. An internal mixer (XS-60, Shanghai Kechuang Rubber and Plastic Machinery Equipment Co. Ltd., Shang Hai, China) equipped with a 60 mL mixing chamber was used for i) the melt-blending of PETG/PGA mixtures with different PGA contents, and ii) the reactive melt-blending of PETG/PGA/ADR (65/35/x) blends with different ADR contents. The compositions of the PETG/PGA (y/z) and PETG/PGA/ADR (65/35/x) samples are presented in Table 1, where y/z and 65/35 denote the weight ratio of the PETG/PGA, and x denotes the ADR content in parts per hundred of total resin (phr). The melt blending was conducted at 230°C for 8 min at a rotational speed of 50 rpm. Then, the obtained blends were compression-molded using a hot press at 230°C under 20 MPa for 8 min. After hot pressing, the closed mold with the in-mold melt was quickly transferred into a water-cooling system with a clamping pressure of 20 MPa and cooled down to room temperature at about 100°C/min. Thus, compres-sion-molded sheets of 0.5 mm thickness were obtained. These sheets were cut into dumbbell-shaped specimens for the subsequent tensile test.
Table 1. Compositions of PETG/PGA (y/z) and PETG/PGA/ADR (65/35/x) samples.
Sample number PETG (wt.) PGA (wt.) ADR (phr)
1# 100 0 0
2# 95 5 0
3# 85 15 0
4# 75 25 0
5# 65 35 0
6# 65 35 0.3
7# 65 35 0.6
8# 65 35 0.9
(a) (b)
(c)
Figure 1. Chemical structures of (a) poly(ethylene glycol-co-cyclohexane-1,4-dimethanol terephthalate) (PETG), (b) polygly-colic acid (PGA), and (c) Joncryl ADR 4370s (ADR).
2.2. Sample Preparation
Prior to compounding, pellets of both PETG and PGA were dried under vacuum at45 ◦C for 12 hours to remove moisture. An internal mixer (XS-60, Shanghai KechuangRubber and Plastic Machinery Equipment Co. Ltd., Shang Hai, China) equipped witha 60 mL mixing chamber was used for (i) the melt-blending of PETG/PGA mixtureswith different PGA contents, and (ii) the reactive melt-blending of PETG/PGA/ADR(65/35/x) blends with different ADR contents. The compositions of the PETG/PGA (y/z)and PETG/PGA/ADR (65/35/x) samples are presented in Table 1, where y/z and 65/35denote the weight ratio of the PETG/PGA, and x denotes the ADR content in parts perhundred of total resin (phr). The melt blending was conducted at 230 ◦C for 8 min at arotational speed of 50 rpm. Then, the obtained blends were compression-molded usinga hot press at 230 ◦C under 20 MPa for 8 min. After hot pressing, the closed mold withthe in-mold melt was quickly transferred into a water-cooling system with a clampingpressure of 20 MPa and cooled down to room temperature at about 100 ◦C/min. Thus,compression-molded sheets of 0.5 mm thickness were obtained. These sheets were cut intodumbbell-shaped specimens for the subsequent tensile test.
Table 1. Compositions of PETG/PGA (y/z) and PETG/PGA/ADR (65/35/x) samples.
Sample Number PETG (wt.) PGA (wt.) ADR (phr)
1# 100 0 02# 95 5 03# 85 15 04# 75 25 05# 65 35 06# 65 35 0.37# 65 35 0.68# 65 35 0.9
2.3. Tensile Testing
A universal tensile testing machine (WDW-1, Yinuo Century Testing Instrument Co.Ltd., Ji Nan, China) was used to determine the tensile performance of the samples. Priorto tensile testing, the samples were stored in an electronic drying oven for 48 h. Thetensile yield strengths, tensile moduli, and elongation at break values of the samples weremeasured at a tensile rate of 5 mm/min. Each result presented in Table 2 is an average offive valid test results per sample, along with the standard deviation.
Polymers 2021, 13, 452 4 of 20
Table 2. Tensile performance of neat PETG and PETG/PGA (y/z) samples.
Samples Tensile Yield Strength (MPa) Tensile Modulus (MPa) Elongation at Break (%)
Neat PETG 44.38 ± 0.62 1076 ± 35 223.0 ± 10.2PETG/PGA (95/05) 45.26 ± 0.62 1145 ± 17 227.2 ± 8.9PETG/PGA (85/15) 46.33 ± 0.20 1254 ± 07 260.4 ± 14.2PETG/PGA (75/25) 47.57 ± 0.77 1370 ± 50 29.0 ± 6.5PETG/PGA (65/35) 48.24 ± 0.72 1509 ± 31 11.1 ± 1.8
2.4. Scanning Electron Microscopy (SEM)
SEM (Verios G4 UC, Thermo Fisher Scientific Brno Co. Ltd., Waltham, USA) was usedto study the morphological evolutions of the specimens during the tensile deformationprocess. The tensile fractured specimens were collected after the tensile testing. Sometensile fractured specimens were immersed in liquid nitrogen for a sufficient time, andthen broken quickly to obtain cryofractured surfaces along the tensile direction. Thecryofractured surfaces of the specimens were sputter coated with gold powder in order toobtain better SEM images. Both the stretched and unstretched regions on the cryofracturedsurface of each specimen were photographed.
2.5. Differential Scanning Calorimetry (DSC)
DSC curves were obtained using a DSC instrument (Q100, TA Instruments, NewCastle, DE, USA). The DSC thermograms were used to determine the crystallinities of thesamples. The specific steps were as follows: each sample (around 5–8 mg) was heated from20 to 250 ◦C at 10 ◦C/min in an N2 atmosphere to obtain the heating DSC thermogram.The relevant parameters were determined from the DSC thermogram, and the crystallinity(Xc) of the PGA component was calculated according to Equation (1).
Xc =|∆Hm|
ωPGA ×∣∣∆H0
m∣∣ × 100% (1)
where ωPGA is the mass fraction of the PGA component in the sample, ∆Hm is the en-dothermic melting enthalpy of the PGA component, and ∆H0
m is the ideal melting enthalpyof 100% crystalline PGA (−198.14 J/g) [16,17]. In this study, the endothermic enthalpy wasnegative in the DSC measurements.
2.6. Wide-Angle X-ray Diffraction (WAXD)
The crystalline structures of the samples were determined by WAXD (Smart Lab,Rigaku Co., Akishima, Japan). The dimensions of the specimens were 40 × 40 × 2 mm(length × width × thickness). A CuKα radiation source (λ = 1.542Å) was used at a 40 kVvoltage and 40 mA current. WAXD data were recorded in the 2θ range of 5−40◦ with ascanning speed of 5◦/min.
2.7. Vicat Softening Temperature (VST)
A VST tester (CZ-6005, Changzhe Testing Machinery Co., Ltd., Yang Zhou, China)was used to determine the heat resistance of the samples. The VST test was conductedaccording to GB/T 1633–2000 at a heating rate of 120 ◦C/h and under a load of 10 N. Thedimensions of the specimens were 10 × 10 × 2 mm (length × width × thickness).
2.8. Torque
The curves for the torque vs. mixing time of the PETG/PGA/ADR (65/35/x) blendswere plotted from the results obtained by torque rheometry (XSS-300, Kechuang Rubber &Plastic Equipment Co. Ltd., Shang Hai, China). A steady temperature of 230.0 ± 1.0 ◦Cwas maintained, and the rotation speed was set at 50 rpm. The total mixing time was set as30 min.
Polymers 2021, 13, 452 5 of 20
2.9. Melt Mass Flow Rate (MFR)
The MFRs of the samples were determined using a melt flow rate apparatus (XNR-400B, Desheng Testing Equipment Co. Ltd., Cheng De, China) at 230 ◦C with a 2.16 kg load.
2.10. Transmission Electron Microscopy (TEM)
Transmission electron microscopy (JEM-2100, JEOL, Akishima, Japan) was employedto investigate the influence of adding ADR on the domain size of PGA at an acceleratingvoltage of 200 kV. TEM images of microtomed sections of 70–80 nm thickness were obtained.
3. Results and Discussion3.1. PETG/PGA Binary Blends3.1.1. Tensile Performance
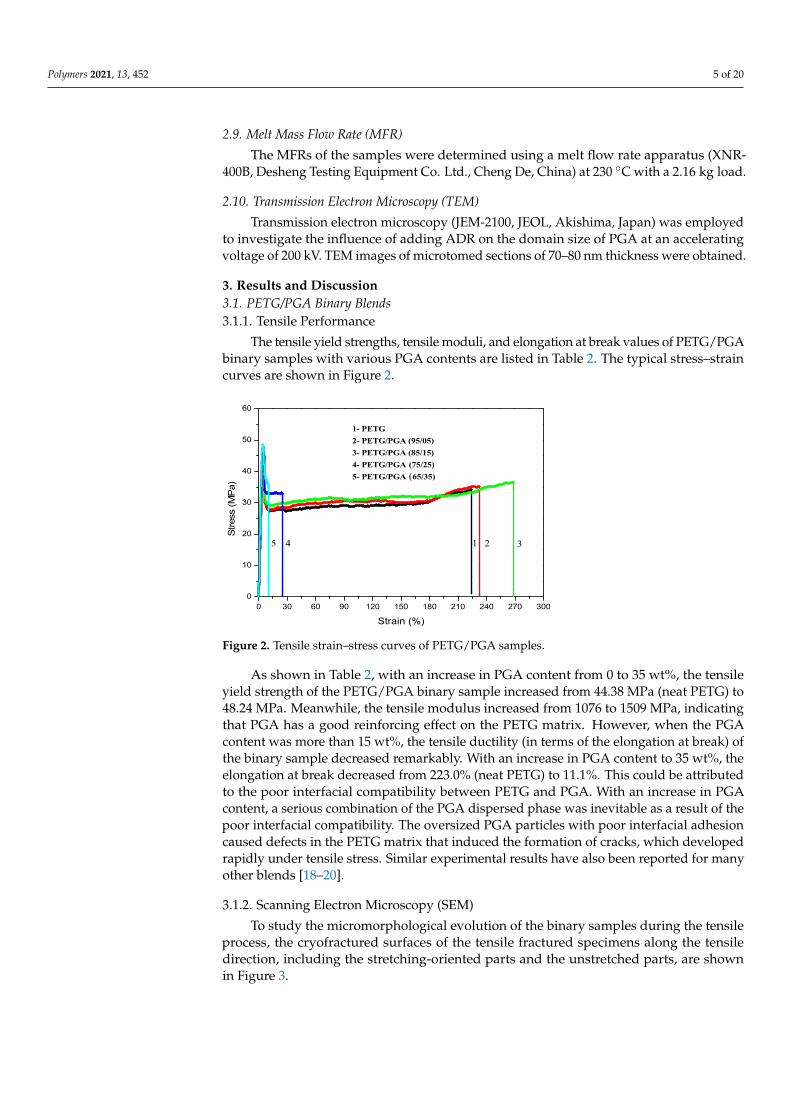
The tensile yield strengths, tensile moduli, and elongation at break values of PETG/PGAbinary samples with various PGA contents are listed in Table 2. The typical stress–straincurves are shown in Figure 2.
Polymers 2021, 13, x FOR PEER REVIEW 6 of 22
0 30 60 90 120 150 180 210 240 270 3000
10
20
30
40
50
60
5 4 321
Stre
ss (M
Pa)
Strain (%)
1- PETG2- PETG/PGA (95/05)3- PETG/PGA (85/15)4- PETG/PGA (75/25)5- PETG/PGA (65/35)
Figure 2. Tensile strain–stress curves of PETG/PGA samples.
3.1.2. Scanning Electron Microscopy (SEM) To study the micromorphological evolution of the binary samples during the tensile
process, the cryofractured surfaces of the tensile fractured specimens along the tensile direction, including the stretching-oriented parts and the unstretched parts, are shown in Figure 3.
Figure 2. Tensile strain–stress curves of PETG/PGA samples.
As shown in Table 2, with an increase in PGA content from 0 to 35 wt%, the tensileyield strength of the PETG/PGA binary sample increased from 44.38 MPa (neat PETG) to48.24 MPa. Meanwhile, the tensile modulus increased from 1076 to 1509 MPa, indicatingthat PGA has a good reinforcing effect on the PETG matrix. However, when the PGAcontent was more than 15 wt%, the tensile ductility (in terms of the elongation at break) ofthe binary sample decreased remarkably. With an increase in PGA content to 35 wt%, theelongation at break decreased from 223.0% (neat PETG) to 11.1%. This could be attributedto the poor interfacial compatibility between PETG and PGA. With an increase in PGAcontent, a serious combination of the PGA dispersed phase was inevitable as a result of thepoor interfacial compatibility. The oversized PGA particles with poor interfacial adhesioncaused defects in the PETG matrix that induced the formation of cracks, which developedrapidly under tensile stress. Similar experimental results have also been reported for manyother blends [18–20].
3.1.2. Scanning Electron Microscopy (SEM)
To study the micromorphological evolution of the binary samples during the tensileprocess, the cryofractured surfaces of the tensile fractured specimens along the tensiledirection, including the stretching-oriented parts and the unstretched parts, are shownin Figure 3.

Polymers 2021, 13, 452 6 of 20
Polymers 2021, 13, x FOR PEER REVIEW 6 of 22
0 30 60 90 120 150 180 210 240 270 3000
10
20
30
40
50
60
5 4 321
Stre
ss (M
Pa)
Strain (%)
1- PETG2- PETG/PGA (95/05)3- PETG/PGA (85/15)4- PETG/PGA (75/25)5- PETG/PGA (65/35)
Figure 2. Tensile strain–stress curves of PETG/PGA samples.
3.1.2. Scanning Electron Microscopy (SEM) To study the micromorphological evolution of the binary samples during the tensile
process, the cryofractured surfaces of the tensile fractured specimens along the tensile direction, including the stretching-oriented parts and the unstretched parts, are shown in Figure 3.
Polymers 2021, 13, x FOR PEER REVIEW 7 of 22
Figure 3. SEM images (×3000) of cryofractured surfaces of PETG/PGA tensile fractured specimens along tensile direction. (A) unstretched part (A1-95/5, A2-85/15, A3-75/25, A4-65/35), (B) stretching-oriented part (B1-95/5, B2-85/15, B3-75/25), and (C) sketching diagram of cryofractured surfaces along tensile direction.
The unstretched regions of the PETG/PGA (95/5) and (85/15) samples (see Figure 3A1, A2) showed that the PGA particles with finer particle sizes (<5 μm for most of the PGA particles) uniformly dispersed in the PETG matrix. However, as the PGA content increased to 25 and 35 wt%, a serious combination of PGA domains appeared, as shown in Figure 3-A3 and –A4. Most of the PGA particles in the PETG/PGA (75/25) and (65/35) samples showed oversized diameters (more than 5 μm). The formation of such oversized PGA particles could be attributed to the poor interfacial compatibility in the PETG/PGA blend and increased PGA content.
For the PETG/PGA (95/5) and (85/15) samples (see Figure 3-B1 and -B2), the regions oriented in the stretching direction showed the debonding of PGA particles from the PETG matrix along with highly oriented cavities. The tensile performance shown in Table 2 confirmed that the PGA component had an obvious reinforcing effect on the PETG matrix. In addition, when the PETG/PGA (95/5) and (85/15) specimens were subjected to tensile loads, finer PGA particles showed stronger stress concentration around these particles, which led to the formation of massive shear zones in the PETG matrix. How-ever, no plastic deformation occurred in the PGA domains, due to their superior rigidity. As a result, interfacial debonding in PETG/PGA was observed in the SEM images. The cavities formed due to interfacial debonding deformed along the tensile direction. This was followed by the plastic deformation and stretching of the PETG matrix along the tensile direction, as shown in Figure 3-B1 and -B2. Compared to that of the neat PETG sample, the presence of fine particles of PGA induced a higher number of shear zones in the matrix under a tensile load. Therefore, the improvement in the fracture toughness was due to energy absorption, caused by the matrix deformation. This was the result of the centralization of external stress around the PGA particles. Furthermore, these shear zones could effectively terminate crazes and prevent crack propagation. Consequently, the tensile yield strength, modulus, and elongation at break of the PETG/PGA (85/15) sample were improved. With an increase in the PGA content to 25 wt%, many oversized PGA particles dispersed in the PETG matrix, as shown as Figure 3-B3. As we know, dis-
Figure 3. SEM images (×3000) of cryofractured surfaces of PETG/PGA tensile fractured specimens along tensile direction.(A) unstretched part ((A1)-95/5, (A2)-85/15, (A3)-75/25, (A4)-65/35), (B) stretching-oriented part ((B1)-95/5, (B2)-85/15,(B3)-75/25), and (C) sketching diagram of cryofractured surfaces along tensile direction.
The unstretched regions of the PETG/PGA (95/5) and (85/15) samples (seeFigure 3(A1,A2)) showed that the PGA particles with finer particle sizes (<5 µm for most of

Polymers 2021, 13, 452 7 of 20
the PGA particles) uniformly dispersed in the PETG matrix. However, as the PGA contentincreased to 25 and 35 wt%, a serious combination of PGA domains appeared, as shown inFigure 3(A3,A4). Most of the PGA particles in the PETG/PGA (75/25) and (65/35) samplesshowed oversized diameters (more than 5 µm). The formation of such oversized PGAparticles could be attributed to the poor interfacial compatibility in the PETG/PGA blendand increased PGA content.
For the PETG/PGA (95/5) and (85/15) samples (see Figure 3(B1,B2)), the regionsoriented in the stretching direction showed the debonding of PGA particles from the PETGmatrix along with highly oriented cavities. The tensile performance shown in Table 2confirmed that the PGA component had an obvious reinforcing effect on the PETG matrix.In addition, when the PETG/PGA (95/5) and (85/15) specimens were subjected to tensileloads, finer PGA particles showed stronger stress concentration around these particles,which led to the formation of massive shear zones in the PETG matrix. However, no plasticdeformation occurred in the PGA domains, due to their superior rigidity. As a result,interfacial debonding in PETG/PGA was observed in the SEM images. The cavities formeddue to interfacial debonding deformed along the tensile direction. This was followedby the plastic deformation and stretching of the PETG matrix along the tensile direction,as shown in Figure 3(B1,B2). Compared to that of the neat PETG sample, the presenceof fine particles of PGA induced a higher number of shear zones in the matrix under atensile load. Therefore, the improvement in the fracture toughness was due to energyabsorption, caused by the matrix deformation. This was the result of the centralization ofexternal stress around the PGA particles. Furthermore, these shear zones could effectivelyterminate crazes and prevent crack propagation. Consequently, the tensile yield strength,modulus, and elongation at break of the PETG/PGA (85/15) sample were improved. Withan increase in the PGA content to 25 wt%, many oversized PGA particles dispersed in thePETG matrix, as shown as Figure 3(B3). As we know, dispersed particles with excessivedomain sizes have relatively less ability to induce the formation of shear zones in thematrix that weaken the craze termination ability of the matrix. Meanwhile, the oversizedPGA particles with poor interfacial compatibility became defect points and induced theformation of massive cracks under a tensile load. This led to the formation of an unstableand premature fracture. As a result, the PETG/PGA (75/25) sample showed a considerabledecrease in its tensile ductility. A further increase in PGA content to 35 wt% led to theformation of more oversized PGA particles in the PETG matrix. This led to a furtherdecrease in the tensile ductility of the binary sample that even caused a ductile–brittletransition in the tensile behavior. Owing to its poor tensile ductility, the PETG/PGA (65/35)sample (with a very low elongation at break of 11.1%) showed no obvious tensile yield andorientation behavior before its rupture during the tensile testing. Hence, an SEM imageof the stretching-oriented part for the PETG/PGA (65/35) sample cannot be provided inthis paper.
3.1.3. DSC and WAXD Measurements
It is well-known that the crystallization properties of thermoplastic polymers, suchas the crystallinity, crystalline structures, etc., can significantly influence the physicalperformance of the polymers and their blends [21–24].
DSC and WAXD analysis were used to evaluate the crystallization properties ofPETG/PGA blends with different PGA contents. The heating DSC thermograms of neatPETG, PGA, and PETG/PGA binary samples are shown in Figure 4. The correspondingthermodynamic parameters are summarized in Table 3.

Polymers 2021, 13, 452 8 of 20
Polymers 2021, 13, x FOR PEER REVIEW 8 of 22
persed particles with excessive domain sizes have relatively less ability to induce the formation of shear zones in the matrix that weaken the craze termination ability of the matrix. Meanwhile, the oversized PGA particles with poor interfacial compatibility be-came defect points and induced the formation of massive cracks under a tensile load. This led to the formation of an unstable and premature fracture. As a result, the PETG/PGA (75/25) sample showed a considerable decrease in its tensile ductility. A fur-ther increase in PGA content to 35 wt% led to the formation of more oversized PGA par-ticles in the PETG matrix. This led to a further decrease in the tensile ductility of the bi-nary sample that even caused a ductile–brittle transition in the tensile behavior. Owing to its poor tensile ductility, the PETG/PGA (65/35) sample (with a very low elongation at break of 11.1%) showed no obvious tensile yield and orientation behavior before its rupture during the tensile testing. Hence, an SEM image of the stretching-oriented part for the PETG/PGA (65/35) sample cannot be provided in this paper.
3.1.3. DSC and WAXD Measurements It is well-known that the crystallization properties of thermoplastic polymers, such
as the crystallinity, crystalline structures, etc., can significantly influence the physical performance of the polymers and their blends [21–24].
DSC and WAXD analysis were used to evaluate the crystallization properties of PETG/PGA blends with different PGA contents. The heating DSC thermograms of neat PETG, PGA, and PETG/PGA binary samples are shown in Figure 4. The corresponding thermodynamic parameters are summarized in Table 3.
Table 3. Differential scanning calorimetry (DSC) parameters of neat PGA, PETG, and PETG/PGA (y/z) samples.
Samples Tg (℃) (PETG) Tm (℃) (PGA) △Hm (J/g) (PGA) X c (%) (PGA)
Neat PGA N/A 224.9 -74.67 37.7
Neat PETG 74.9 N/A N/A N/A
PETG/PGA (95/05) 74.7 221.2 -2.91 29.4
PETG/PGA (85/15) 74.1 221.6 -9.48 31.9
PETG/PGA (75/25) 72.3 221.1 -17.49 35.3
PETG/PGA (65/35) 73.1 221.0 -24.96 36.0
30 60 90 120 150 180 210 240
PETG
PETG/PGA (85/15)
PETG/PGA (95/05)
PETG/PGA (75/25)
PETG/PGA (65/35)
PGA
Hea
t Flo
w (W
·g-1)
Temperature (°C)
10°C/min
EXO
Figure 4. Heating DSC thermographs of PETG/PGA (y/z) samples. Figure 4. Heating DSC thermographs of PETG/PGA (y/z) samples.
Table 3. Differential scanning calorimetry (DSC) parameters of neat PGA, PETG, and PETG/PGA (y/z) samples.
Samples Tg (◦C) (PETG) Tm (◦C) (PGA) ∆Hm (J/g) (PGA) Xc (%) (PGA)
Neat PGA N/A 224.9 −74.67 37.7Neat PETG 74.9 N/A N/A N/A
PETG/PGA (95/05) 74.7 221.2 −2.91 29.4PETG/PGA (85/15) 74.1 221.6 −9.48 31.9PETG/PGA (75/25) 72.3 221.1 −17.49 35.3PETG/PGA (65/35) 73.1 221.0 −24.96 36.0
The DSC thermogram of the neat PETG sample displayed a heat jump to approxi-mately 74.9 ◦C, which corresponded to its glass transition temperature (Tg). Moreover,the absence of an endothermic peak of melting proved that PETG was an amorphouspolyester without crystallization ability. A similar conclusion was also drawn from itsWAXD analysis (see Figure 5).
Polymers 2021, 13, x FOR PEER REVIEW 9 of 22
The DSC thermogram of the neat PETG sample displayed a heat jump to approxi-mately 74.9°C, which corresponded to its glass transition temperature (Tg). Moreover, the absence of an endothermic peak of melting proved that PETG was an amorphous poly-ester without crystallization ability. A similar conclusion was also drawn from its WAXD analysis (see Figure 5).
5 10 15 20 25 30 35 40
Inte
nsity
PETG/PGA (65/35)
PETG/PGA (75/25)
PETG/PGA (85/15)
PETG/PGA (95/05)
PETG
PGA
2θ (°)
Figure 5. Wide-angle X-ray diffraction (WAXD) patterns of PETG, PGA, and PETG/PGA (y/z) samples.
On the other hand, the DSC thermogram of the neat PGA sample showed its melting temperature (Tm) to be approximately 224.9°C, along with a sharp endothermic melting peak. The DSC thermograms of the binary PETG/PGA samples showed no obvious shifting of peaks for the Tg of the PETG matrix and Tm of the PGA component. Moreover, in contrast to the amorphous nature of the neat PETG sample, the neat PGA sample showed a semicrystalline structure with a relatively high crystallinity of 37.7%. For the PETG/PGA binary samples with lower PGA contents (≤15 wt%), the crystallinity of the PGA component was decreased compared to that of the neat PGA, as seen in Table 3. The reason for this is as follows: with a lower PGA content, some of the PETG and PGA macromolecular chains or segments could interpenetrate each other. As a result, the crystallization ability of the PGA component was restrained, which led to a decrease in the crystallinity of the PGA component. However, with an increase in the PGA content (≥25 wt%), a serious combination of the PGA domains caused by the microphase separa-tion in the binary blending system occurred, which weakened the interactions between the PETG and PGA chains and segments. Hence, the crystallinity of the PGA increased with an increase in the PGA content. Compared to the crystallinity (37.7%) of the neat PGA sample, the crystallinity of the PGA component in the PETG/PGA (65/35) sample was restored to 36.0%.
The WAXD patterns of the PETG/PGA binary samples with various PGA contents are shown in Figure 5. For comparison, the WAXD patterns of the neat PETG and neat PGA are also provided. Consistent with the DSC results, the WAXD pattern of the neat PETG showed a dispersive diffraction peak in the range of 2θ = 10° to 35°, indicating that the neat PETG was amorphous. Neat PGA showed two sharp diffraction peaks at 2θ = 21.8° and 28.4°, corresponding to the (110) and (020) planes of PGA crystals, respectively [25–27]. In the WAXD pattern of PETG/PGA (95/5), two sharp diffraction peaks at 22.2° and 28.9° were characteristic of PGA crystals. Moreover, the dispersive diffraction peak from 2θ = 10° to 35° indicated that the PETG matrix was completely amorphous. With an
Figure 5. Wide-angle X-ray diffraction (WAXD) patterns of PETG, PGA, and PETG/PGA(y/z) samples.
On the other hand, the DSC thermogram of the neat PGA sample showed its meltingtemperature (Tm) to be approximately 224.9 ◦C, along with a sharp endothermic meltingpeak. The DSC thermograms of the binary PETG/PGA samples showed no obvious shift-ing of peaks for the Tg of the PETG matrix and Tm of the PGA component. Moreover, incontrast to the amorphous nature of the neat PETG sample, the neat PGA sample showed
Polymers 2021, 13, 452 9 of 20
a semicrystalline structure with a relatively high crystallinity of 37.7%. For the PETG/PGAbinary samples with lower PGA contents (≤15 wt%), the crystallinity of the PGA compo-nent was decreased compared to that of the neat PGA, as seen in Table 3. The reason forthis is as follows: with a lower PGA content, some of the PETG and PGA macromolecularchains or segments could interpenetrate each other. As a result, the crystallization abilityof the PGA component was restrained, which led to a decrease in the crystallinity of thePGA component. However, with an increase in the PGA content (≥25 wt%), a serious com-bination of the PGA domains caused by the microphase separation in the binary blendingsystem occurred, which weakened the interactions between the PETG and PGA chainsand segments. Hence, the crystallinity of the PGA increased with an increase in the PGAcontent. Compared to the crystallinity (37.7%) of the neat PGA sample, the crystallinity ofthe PGA component in the PETG/PGA (65/35) sample was restored to 36.0%.
The WAXD patterns of the PETG/PGA binary samples with various PGA contents areshown in Figure 5. For comparison, the WAXD patterns of the neat PETG and neat PGAare also provided. Consistent with the DSC results, the WAXD pattern of the neat PETGshowed a dispersive diffraction peak in the range of 2θ = 10◦ to 35◦, indicating that theneat PETG was amorphous. Neat PGA showed two sharp diffraction peaks at 2θ = 21.8◦
and 28.4◦, corresponding to the (110) and (020) planes of PGA crystals, respectively [25–27].In the WAXD pattern of PETG/PGA (95/5), two sharp diffraction peaks at 22.2◦ and 28.9◦
were characteristic of PGA crystals. Moreover, the dispersive diffraction peak from 2θ = 10◦
to 35◦ indicated that the PETG matrix was completely amorphous. With an increase inPGA content, the two diffraction peaks characteristic of PGA crystals in the binary samplesincreased gradually, as expected.
3.1.4. Vicat Softening Temperature (VST)
The results of the DSC and WAXD analyses confirmed that the PETG matrix wasamorphous, regardless of the PGA content. By contrast, the PGA component was semicrys-talline, with higher crystallinity. Hence, theoretically, the presence of PGA domains couldimprove the heat resistance of PETG.
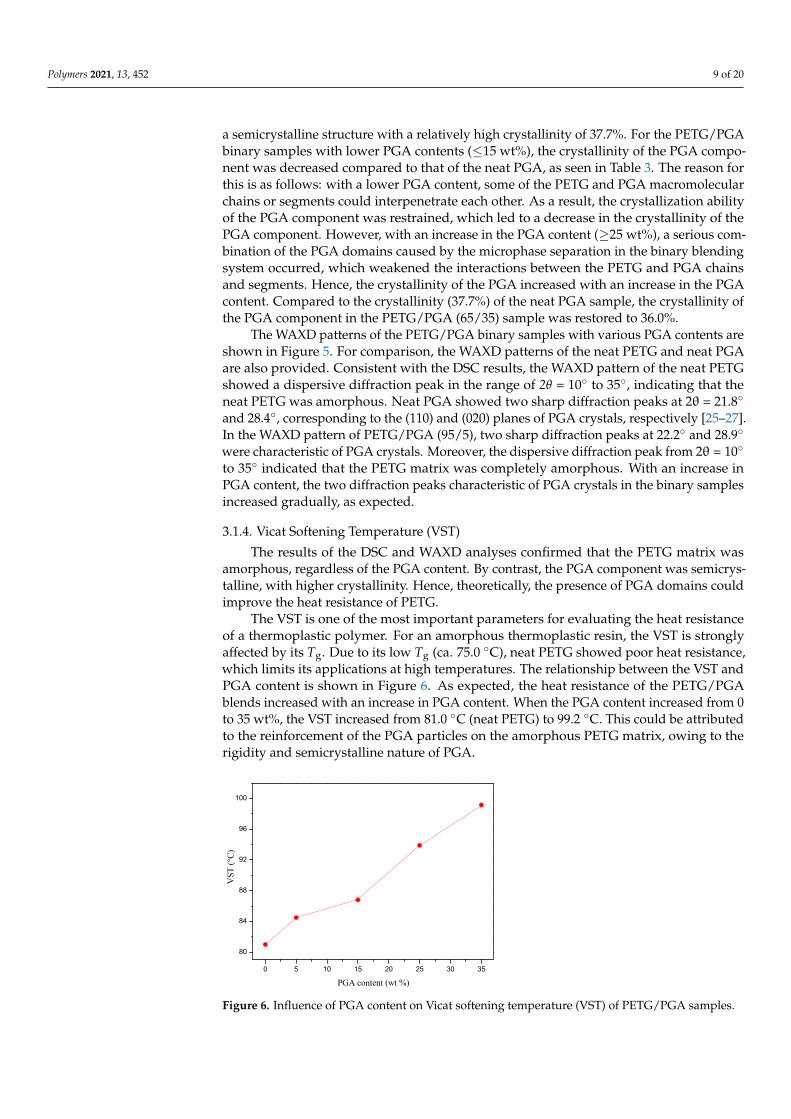
The VST is one of the most important parameters for evaluating the heat resistanceof a thermoplastic polymer. For an amorphous thermoplastic resin, the VST is stronglyaffected by its Tg. Due to its low Tg (ca. 75.0 ◦C), neat PETG showed poor heat resistance,which limits its applications at high temperatures. The relationship between the VST andPGA content is shown in Figure 6. As expected, the heat resistance of the PETG/PGAblends increased with an increase in PGA content. When the PGA content increased from 0to 35 wt%, the VST increased from 81.0 ◦C (neat PETG) to 99.2 ◦C. This could be attributedto the reinforcement of the PGA particles on the amorphous PETG matrix, owing to therigidity and semicrystalline nature of PGA.
Polymers 2021, 13, x FOR PEER REVIEW 10 of 22
increase in PGA content, the two diffraction peaks characteristic of PGA crystals in the binary samples increased gradually, as expected.
3.1.4. Vicat Softening Temperature (VST) The results of the DSC and WAXD analyses confirmed that the PETG matrix was
amorphous, regardless of the PGA content. By contrast, the PGA component was semi-crystalline, with higher crystallinity. Hence, theoretically, the presence of PGA domains could improve the heat resistance of PETG.
The VST is one of the most important parameters for evaluating the heat resistance of a thermoplastic polymer. For an amorphous thermoplastic resin, the VST is strongly affected by its Tg. Due to its low Tg (ca. 75.0°C), neat PETG showed poor heat resistance, which limits its applications at high temperatures. The relationship between the VST and PGA content is shown in Figure 6. As expected, the heat resistance of the PETG/PGA blends increased with an increase in PGA content. When the PGA content increased from 0 to 35 wt%, the VST increased from 81.0°C (neat PETG) to 99.2°C. This could be at-tributed to the reinforcement of the PGA particles on the amorphous PETG matrix, owing to the rigidity and semicrystalline nature of PGA.
0 5 10 15 20 25 30 35
80
84
88
92
96
100
VST
(°C)
PGA content (wt %)
Figure 6. Influence of PGA content on Vicat softening temperature (VST) of PETG/PGA samples.
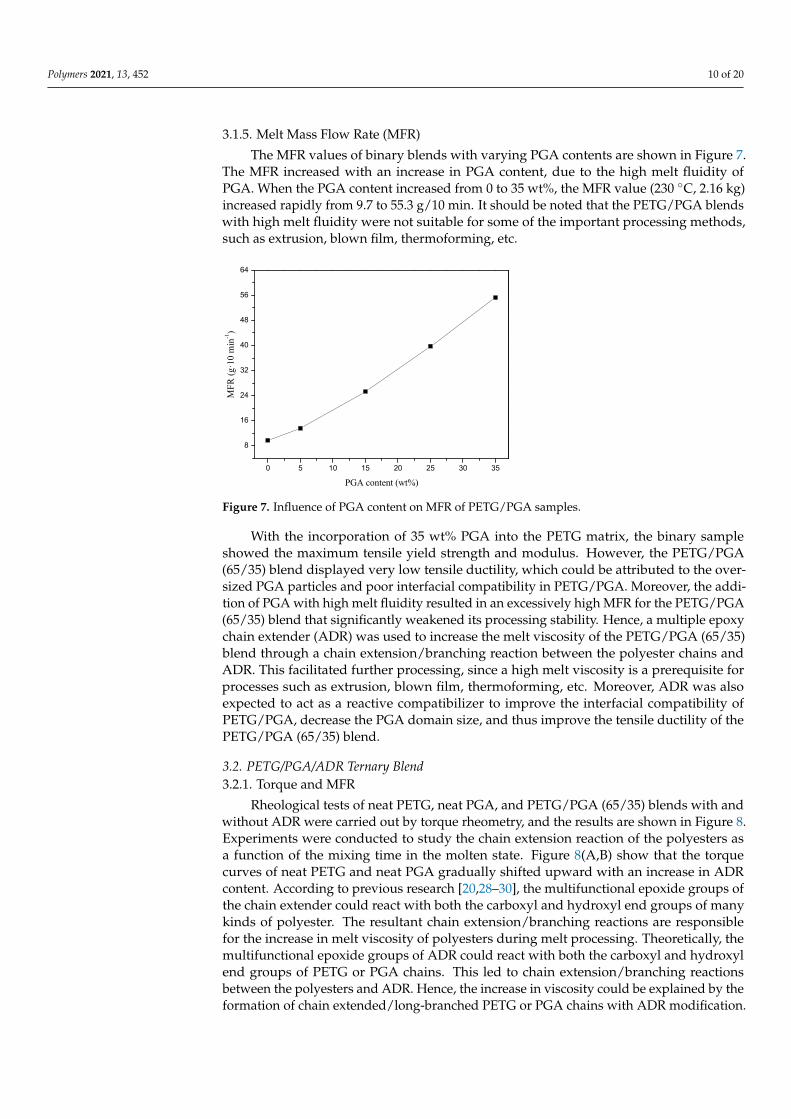
3.1.5. Melt Mass Flow Rate (MFR) The MFR values of binary blends with varying PGA contents are shown in Figure 7.
The MFR increased with an increase in PGA content, due to the high melt fluidity of PGA. When the PGA content increased from 0 to 35 wt%, the MFR value (230°C, 2.16 kg) increased rapidly from 9.7 to 55.3 g/10 min. It should be noted that the PETG/PGA blends with high melt fluidity were not suitable for some of the important processing methods, such as extrusion, blown film, thermoforming, etc.
Figure 6. Influence of PGA content on Vicat softening temperature (VST) of PETG/PGA samples.
Polymers 2021, 13, 452 10 of 20
3.1.5. Melt Mass Flow Rate (MFR)
The MFR values of binary blends with varying PGA contents are shown in Figure 7.The MFR increased with an increase in PGA content, due to the high melt fluidity ofPGA. When the PGA content increased from 0 to 35 wt%, the MFR value (230 ◦C, 2.16 kg)increased rapidly from 9.7 to 55.3 g/10 min. It should be noted that the PETG/PGA blendswith high melt fluidity were not suitable for some of the important processing methods,such as extrusion, blown film, thermoforming, etc.
Polymers 2021, 13, x FOR PEER REVIEW 11 of 22
0 5 10 15 20 25 30 35
8
16
24
32
40
48
56
64
PGA content (wt%)
MFR
(g·1
0 m
in-1
)
Figure 7. Influence of PGA content on MFR of PETG/PGA samples.
With the incorporation of 35 wt% PGA into the PETG matrix, the binary sample showed the maximum tensile yield strength and modulus. However, the PETG/PGA (65/35) blend displayed very low tensile ductility, which could be attributed to the over-sized PGA particles and poor interfacial compatibility in PETG/PGA. Moreover, the ad-dition of PGA with high melt fluidity resulted in an excessively high MFR for the PETG/PGA (65/35) blend that significantly weakened its processing stability. Hence, a multiple epoxy chain extender (ADR) was used to increase the melt viscosity of the PETG/PGA (65/35) blend through a chain extension/branching reaction between the polyester chains and ADR. This facilitated further processing, since a high melt viscosity is a prerequisite for processes such as extrusion, blown film, thermoforming, etc. More-over, ADR was also expected to act as a reactive compatibilizer to improve the interfacial compatibility of PETG/PGA, decrease the PGA domain size, and thus improve the tensile ductility of the PETG/PGA (65/35) blend.
3.2. PETG/PGA/ADR Ternary Blend 3.2.1. Torque and MFR
Rheological tests of neat PETG, neat PGA, and PETG/PGA (65/35) blends with and without ADR were carried out by torque rheometry, and the results are shown in Figure 8. Experiments were conducted to study the chain extension reaction of the polyesters as a function of the mixing time in the molten state. Figure 8 (A) and (B) show that the torque curves of neat PETG and neat PGA gradually shifted upward with an increase in ADR content. According to previous research [20,28–30], the multifunctional epoxide groups of the chain extender could react with both the carboxyl and hydroxyl end groups of many kinds of polyester. The resultant chain extension/branching reactions are re-sponsible for the increase in melt viscosity of polyesters during melt processing. Theo-retically, the multifunctional epoxide groups of ADR could react with both the carboxyl and hydroxyl end groups of PETG or PGA chains. This led to chain extension/branching reactions between the polyesters and ADR. Hence, the increase in viscosity could be ex-plained by the formation of chain extended/long-branched PETG or PGA chains with ADR modification.
The torque value of the PETG/PGA (65/35) blend increased upon the addition of ADR, as shown in Figure 8(C). However, the chain extension/branching reactions of the PETG/PGA/ADR (65/35/x) blends were more complicated. In addition to PETG–ADR–PETG and PGA–ADR–PGA with chain extension/long-branched structures, the PETG–
Figure 7. Influence of PGA content on MFR of PETG/PGA samples.
With the incorporation of 35 wt% PGA into the PETG matrix, the binary sampleshowed the maximum tensile yield strength and modulus. However, the PETG/PGA(65/35) blend displayed very low tensile ductility, which could be attributed to the over-sized PGA particles and poor interfacial compatibility in PETG/PGA. Moreover, the addi-tion of PGA with high melt fluidity resulted in an excessively high MFR for the PETG/PGA(65/35) blend that significantly weakened its processing stability. Hence, a multiple epoxychain extender (ADR) was used to increase the melt viscosity of the PETG/PGA (65/35)blend through a chain extension/branching reaction between the polyester chains andADR. This facilitated further processing, since a high melt viscosity is a prerequisite forprocesses such as extrusion, blown film, thermoforming, etc. Moreover, ADR was alsoexpected to act as a reactive compatibilizer to improve the interfacial compatibility ofPETG/PGA, decrease the PGA domain size, and thus improve the tensile ductility of thePETG/PGA (65/35) blend.
3.2. PETG/PGA/ADR Ternary Blend3.2.1. Torque and MFR
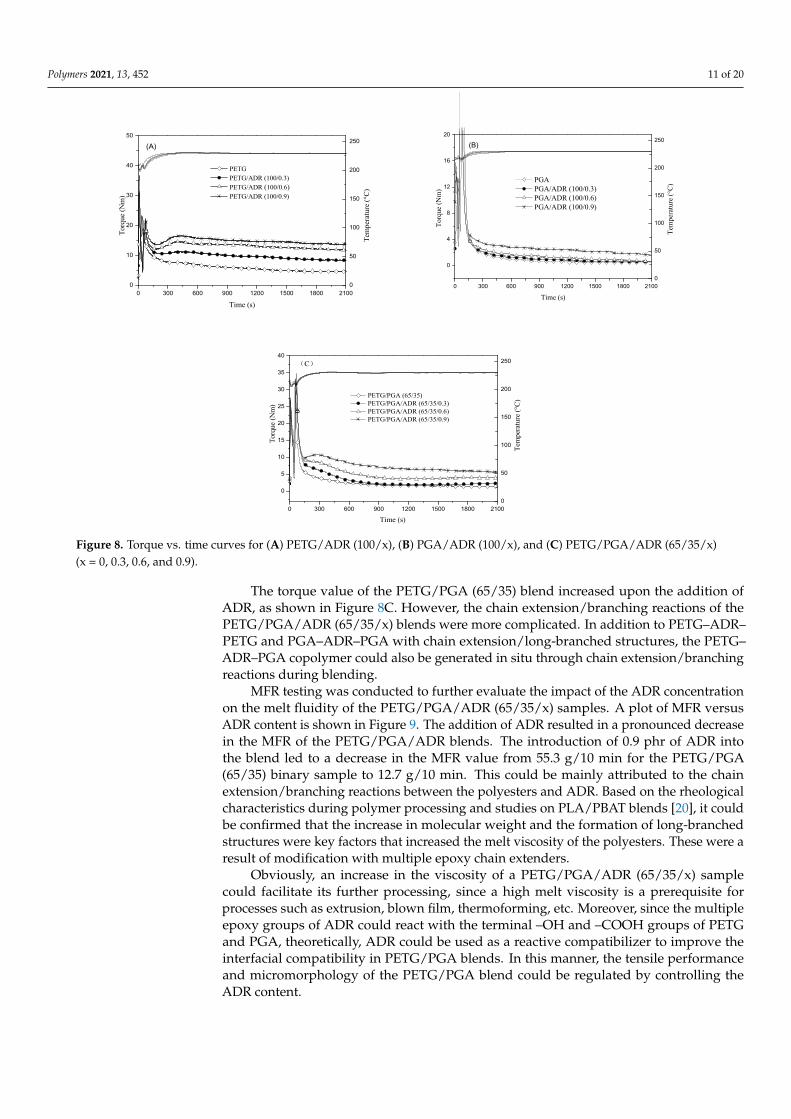
Rheological tests of neat PETG, neat PGA, and PETG/PGA (65/35) blends with andwithout ADR were carried out by torque rheometry, and the results are shown in Figure 8.Experiments were conducted to study the chain extension reaction of the polyesters asa function of the mixing time in the molten state. Figure 8(A,B) show that the torquecurves of neat PETG and neat PGA gradually shifted upward with an increase in ADRcontent. According to previous research [20,28–30], the multifunctional epoxide groups ofthe chain extender could react with both the carboxyl and hydroxyl end groups of manykinds of polyester. The resultant chain extension/branching reactions are responsiblefor the increase in melt viscosity of polyesters during melt processing. Theoretically, themultifunctional epoxide groups of ADR could react with both the carboxyl and hydroxylend groups of PETG or PGA chains. This led to chain extension/branching reactionsbetween the polyesters and ADR. Hence, the increase in viscosity could be explained by theformation of chain extended/long-branched PETG or PGA chains with ADR modification.
Polymers 2021, 13, 452 11 of 20
Polymers 2021, 13, x FOR PEER REVIEW 12 of 22
ADR–PGA copolymer could also be generated in situ through chain extension/branching reactions during blending.
0 300 600 900 1200 1500 1800 21000
10
20
30
40
50
Torq
ue (N
m)
Time (s)
PETG PETG/ADR (100/0.3) PETG/ADR (100/0.6) PETG/ADR (100/0.9)
0
50
100
150
200
250
Tem
pera
ture
(°C)
(A)
0 300 600 900 1200 1500 1800 2100
0
4
8
12
16
20
Torq
ue (N
m)
Tem
pera
ture
(°C)
Time (s)
PGA PGA/ADR (100/0.3) PGA/ADR (100/0.6) PGA/ADR (100/0.9)
0
50
100
150
200
250(B)
0 300 600 900 1200 1500 1800 2100
0
5
10
15
20
25
30
35
40
Time (s)
Torq
ue (N
m)
Tem
pera
ture
(°C)
PETG/PGA (65/35) PETG/PGA/ADR (65/35/0.3) PETG/PGA/ADR (65/35/0.6) PETG/PGA/ADR (65/35/0.9)
(C)
0
50
100
150
200
250
Figure 8. Torque vs. time curves for (A) PETG/ADR (100/x), (B) PGA/ADR (100/x), and (C) PETG/PGA/ADR (65/35/x) (x = 0, 0.3, 0.6, and 0.9).
MFR testing was conducted to further evaluate the impact of the ADR concentration on the melt fluidity of the PETG/PGA/ADR (65/35/x) samples. A plot of MFR versus ADR content is shown in Figure 9. The addition of ADR resulted in a pronounced decrease in the MFR of the PETG/PGA/ADR blends. The introduction of 0.9 phr of ADR into the blend led to a decrease in the MFR value from 55.3 g/10 min for the PETG/PGA (65/35) binary sample to 12.7 g/10 min. This could be mainly attributed to the chain exten-sion/branching reactions between the polyesters and ADR. Based on the rheological characteristics during polymer processing and studies on PLA/PBAT blends [20], it could be confirmed that the increase in molecular weight and the formation of long-branched structures were key factors that increased the melt viscosity of the polyesters. These were a result of modification with multiple epoxy chain extenders.
Figure 8. Torque vs. time curves for (A) PETG/ADR (100/x), (B) PGA/ADR (100/x), and (C) PETG/PGA/ADR (65/35/x)(x = 0, 0.3, 0.6, and 0.9).
The torque value of the PETG/PGA (65/35) blend increased upon the addition ofADR, as shown in Figure 8C. However, the chain extension/branching reactions of thePETG/PGA/ADR (65/35/x) blends were more complicated. In addition to PETG–ADR–PETG and PGA–ADR–PGA with chain extension/long-branched structures, the PETG–ADR–PGA copolymer could also be generated in situ through chain extension/branchingreactions during blending.
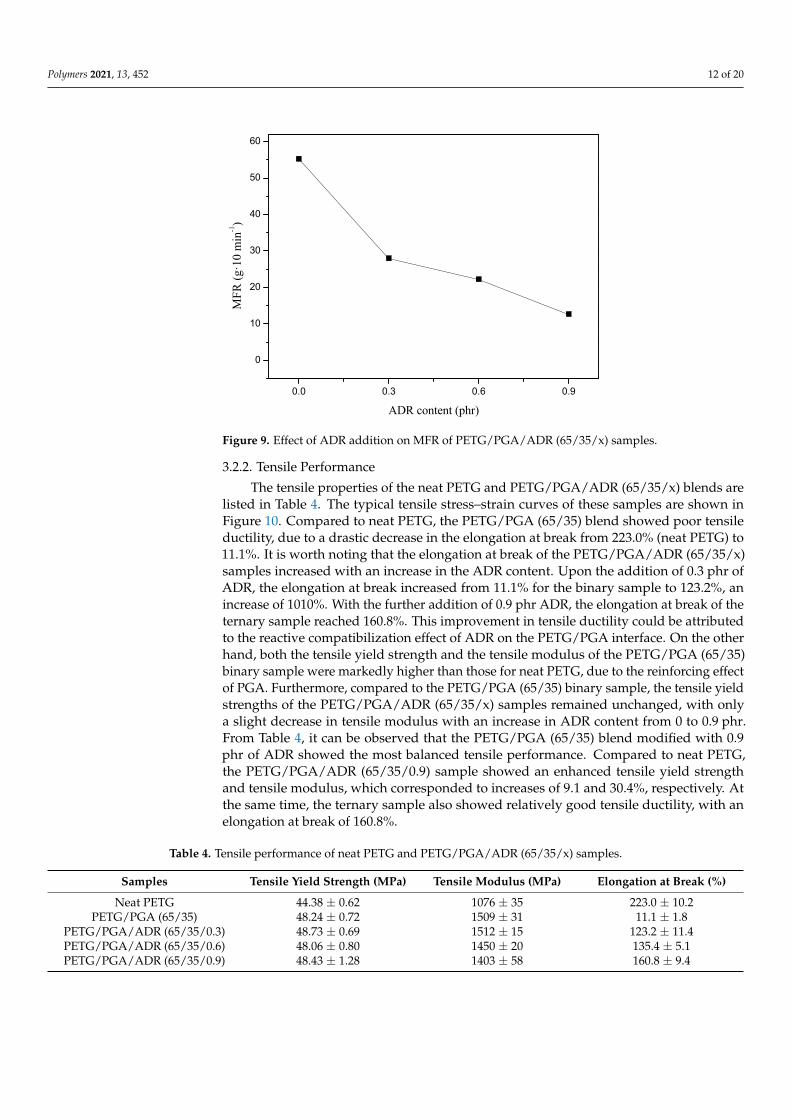
MFR testing was conducted to further evaluate the impact of the ADR concentrationon the melt fluidity of the PETG/PGA/ADR (65/35/x) samples. A plot of MFR versusADR content is shown in Figure 9. The addition of ADR resulted in a pronounced decreasein the MFR of the PETG/PGA/ADR blends. The introduction of 0.9 phr of ADR intothe blend led to a decrease in the MFR value from 55.3 g/10 min for the PETG/PGA(65/35) binary sample to 12.7 g/10 min. This could be mainly attributed to the chainextension/branching reactions between the polyesters and ADR. Based on the rheologicalcharacteristics during polymer processing and studies on PLA/PBAT blends [20], it couldbe confirmed that the increase in molecular weight and the formation of long-branchedstructures were key factors that increased the melt viscosity of the polyesters. These were aresult of modification with multiple epoxy chain extenders.
Obviously, an increase in the viscosity of a PETG/PGA/ADR (65/35/x) samplecould facilitate its further processing, since a high melt viscosity is a prerequisite forprocesses such as extrusion, blown film, thermoforming, etc. Moreover, since the multipleepoxy groups of ADR could react with the terminal –OH and –COOH groups of PETGand PGA, theoretically, ADR could be used as a reactive compatibilizer to improve theinterfacial compatibility in PETG/PGA blends. In this manner, the tensile performanceand micromorphology of the PETG/PGA blend could be regulated by controlling theADR content.
Polymers 2021, 13, 452 12 of 20
Polymers 2021, 13, x FOR PEER REVIEW 13 of 22
0.0 0.3 0.6 0.9
0
10
20
30
40
50
60
MFR
(g·1
0 m
in-1
)
ADR content (phr)
Figure 9. Effect of ADR addition on MFR of PETG/PGA/ADR (65/35/x) samples.
Obviously, an increase in the viscosity of a PETG/PGA/ADR (65/35/x) sample could facilitate its further processing, since a high melt viscosity is a prerequisite for processes such as extrusion, blown film, thermoforming, etc. Moreover, since the multiple epoxy groups of ADR could react with the terminal –OH and –COOH groups of PETG and PGA, theoretically, ADR could be used as a reactive compatibilizer to improve the in-terfacial compatibility in PETG/PGA blends. In this manner, the tensile performance and micromorphology of the PETG/PGA blend could be regulated by controlling the ADR content.
3.2.2. Tensile Performance The tensile properties of the neat PETG and PETG/PGA/ADR (65/35/x) blends are
listed in Table 4. The typical tensile stress–strain curves of these samples are shown in Figure 10. Compared to neat PETG, the PETG/PGA (65/35) blend showed poor tensile ductility, due to a drastic decrease in the elongation at break from 223.0% (neat PETG) to 11.1%. It is worth noting that the elongation at break of the PETG/PGA/ADR (65/35/x) samples increased with an increase in the ADR content. Upon the addition of 0.3 phr of ADR, the elongation at break increased from 11.1% for the binary sample to 123.2%, an increase of 1010%. With the further addition of 0.9 phr ADR, the elongation at break of the ternary sample reached 160.8%. This improvement in tensile ductility could be at-tributed to the reactive compatibilization effect of ADR on the PETG/PGA interface. On the other hand, both the tensile yield strength and the tensile modulus of the PETG/PGA (65/35) binary sample were markedly higher than those for neat PETG, due to the rein-forcing effect of PGA. Furthermore, compared to the PETG/PGA (65/35) binary sample, the tensile yield strengths of the PETG/PGA/ADR (65/35/x) samples remained un-changed, with only a slight decrease in tensile modulus with an increase in ADR content from 0 to 0.9 phr. From Table 4, it can be observed that the PETG/PGA (65/35) blend modified with 0.9 phr of ADR showed the most balanced tensile performance. Compared to neat PETG, the PETG/PGA/ADR (65/35/0.9) sample showed an enhanced tensile yield strength and tensile modulus, which corresponded to increases of 9.1 and 30.4%, respec-tively. At the same time, the ternary sample also showed relatively good tensile ductility, with an elongation at break of 160.8%.
Table 4. Tensile performance of neat PETG and PETG/PGA/ADR (65/35/x) samples.
Samples Tensile yield strength Tensile modulus Elongation at break
Figure 9. Effect of ADR addition on MFR of PETG/PGA/ADR (65/35/x) samples.
3.2.2. Tensile Performance
The tensile properties of the neat PETG and PETG/PGA/ADR (65/35/x) blends arelisted in Table 4. The typical tensile stress–strain curves of these samples are shown inFigure 10. Compared to neat PETG, the PETG/PGA (65/35) blend showed poor tensileductility, due to a drastic decrease in the elongation at break from 223.0% (neat PETG) to11.1%. It is worth noting that the elongation at break of the PETG/PGA/ADR (65/35/x)samples increased with an increase in the ADR content. Upon the addition of 0.3 phr ofADR, the elongation at break increased from 11.1% for the binary sample to 123.2%, anincrease of 1010%. With the further addition of 0.9 phr ADR, the elongation at break of theternary sample reached 160.8%. This improvement in tensile ductility could be attributedto the reactive compatibilization effect of ADR on the PETG/PGA interface. On the otherhand, both the tensile yield strength and the tensile modulus of the PETG/PGA (65/35)binary sample were markedly higher than those for neat PETG, due to the reinforcing effectof PGA. Furthermore, compared to the PETG/PGA (65/35) binary sample, the tensile yieldstrengths of the PETG/PGA/ADR (65/35/x) samples remained unchanged, with onlya slight decrease in tensile modulus with an increase in ADR content from 0 to 0.9 phr.From Table 4, it can be observed that the PETG/PGA (65/35) blend modified with 0.9phr of ADR showed the most balanced tensile performance. Compared to neat PETG,the PETG/PGA/ADR (65/35/0.9) sample showed an enhanced tensile yield strengthand tensile modulus, which corresponded to increases of 9.1 and 30.4%, respectively. Atthe same time, the ternary sample also showed relatively good tensile ductility, with anelongation at break of 160.8%.
Table 4. Tensile performance of neat PETG and PETG/PGA/ADR (65/35/x) samples.
Samples Tensile Yield Strength (MPa) Tensile Modulus (MPa) Elongation at Break (%)
Neat PETG 44.38 ± 0.62 1076 ± 35 223.0 ± 10.2PETG/PGA (65/35) 48.24 ± 0.72 1509 ± 31 11.1 ± 1.8
PETG/PGA/ADR (65/35/0.3) 48.73 ± 0.69 1512 ± 15 123.2 ± 11.4PETG/PGA/ADR (65/35/0.6) 48.06 ± 0.80 1450 ± 20 135.4 ± 5.1PETG/PGA/ADR (65/35/0.9) 48.43 ± 1.28 1403 ± 58 160.8 ± 9.4

Polymers 2021, 13, 452 13 of 20
Polymers 2021, 13, x FOR PEER REVIEW 14 of 22
(MPa) (MPa) (%)
Neat PETG 44.38 ± 0.62 1076 ± 35 223.0 ± 10.2
PETG/PGA (65/35) 48.24 ± 0.72 1509 ± 31 11.1 ± 1.8
PETG/PGA/ADR (65/35/0.3) 48.73 ± 0.69 1512 ± 15 123.2 ± 11.4
PETG/PGA/ADR (65/35/0.6) 48.06 ± 0.80 1450 ± 20 135.4 ± 5.1
PETG/PGA/ADR (65/35/0.9) 48.43 ± 1.28 1403 ± 58 160.8 ± 9.4
0 30 60 90 120 150 180 2100
10
20
30
40
50
60
70
80
2 3 4
Stre
ss (M
Pa)
Strain (%)
1- PETG 2- PETG/PGA (65/35)3- PETG/PGA/ADR (65/35/0.3)4- PETG/PGA/ADR (65/35/0.6)5- PETG/PGA/ADR (65/35/0.9)
15
Figure 10. Tensile stress–strain curves for neat PETG and PETG/PGA/ADR (65/35/x) samples.
In summary, with ADR chain extension and compatibilization, the rheological properties and tensile ductility of the PETG/PGA/ADR (65/35/x) blend were greatly im-proved.
3.2.3. TEM Observation Microstructural evolution is known to greatly influence the mechanical performance
of a blend. Hence, TEM analysis was used to investigate the impact of adding ADR on the micromorphology of PETG/PGA/ADR (65/35/x) samples with varying ADR contents. This would help to further elucidate the relationship between the tensile performance and micromorphology of the samples with different ADR contents.
The typical TEM images of the PETG/PGA/ADR (65/35/x) samples at 1000x magni-fication are presented in Figure 11. The range of the particle size distribution and ap-parent number-average particle sizes (d
_
app) of PGA for the ternary samples were obtained using average diameter analysis software (Nano Measurer 1.2), as shown in Figure 12.
TEM analysis showed the presence of many oversized PGA particles dispersed in the PETG/PGA (65/35) binary sample. This was due to the serious combining of the PGA domains as a result of the poor interfacial compatibility in the PETG/PGA blending sys-tem. However, upon the addition of 0.3 phr of ADR, the d
_
app of the PGA domains de-creased significantly. When the amount of ADR increased from 0.3 to 0.6 phr, the d
_
app further decreased from 1.24 to 0.29 μm. As the amount of added ADR increased to 0.9 phr, the value of d
_
app no longer decreased. That could be explained by the fact that the chain extension/branching reactions of PETG, PGA, and ADR could form some PETG–
Figure 10. Tensile stress–strain curves for neat PETG and PETG/PGA/ADR (65/35/x) samples.
In summary, with ADR chain extension and compatibilization, the rheological proper-ties and tensile ductility of the PETG/PGA/ADR (65/35/x) blend were greatly improved.
3.2.3. TEM Observation
Microstructural evolution is known to greatly influence the mechanical performanceof a blend. Hence, TEM analysis was used to investigate the impact of adding ADR on themicromorphology of PETG/PGA/ADR (65/35/x) samples with varying ADR contents.This would help to further elucidate the relationship between the tensile performance andmicromorphology of the samples with different ADR contents.
The typical TEM images of the PETG/PGA/ADR (65/35/x) samples at 1000x magni-fication are presented in Figure 11. The range of the particle size distribution and apparent
number-average particle sizes (−dapp) of PGA for the ternary samples were obtained using
average diameter analysis software (Nano Measurer 1.2), as shown in Figure 12.
Polymers 2021, 13, x FOR PEER REVIEW 15 of 22
ADR–PGA copolymers in situ. These copolymers could improve the PETG/PGA interfa-cial adhesion and thus significantly reduce the size of the PGA domains.
Figure 11. TEM images (×1000) of PETG/PGA/ADR (65/35/x; x = 0 (A), 0.3 (B), 0.6 (C), and 0.9 (D)) samples.
Figure 12. Statistical results for apparent particle sizes of PETG/PGA/ADR (65/35/x; x = 0.3 (A), 0.6 (B), and 0.9 (C)) sam-
ples.
3.2.4. SEM Observation In order to research the micromorphological evolution of the PETG/PGA (65/35)
samples with and without ADR during the tensile process, the cryofractured surfaces of the tensile fractured specimens along the tensile direction were photographed, including the stretching-oriented parts and the unstretched parts, as shown in Figure 13. The un-
Figure 11. TEM images (×1000) of PETG/PGA/ADR (65/35/x; x = 0 (A), 0.3 (B), 0.6 (C), and 0.9 (D)) samples.

Polymers 2021, 13, 452 14 of 20
Polymers 2021, 13, x FOR PEER REVIEW 15 of 22
ADR–PGA copolymers in situ. These copolymers could improve the PETG/PGA interfa-cial adhesion and thus significantly reduce the size of the PGA domains.
Figure 11. TEM images (×1000) of PETG/PGA/ADR (65/35/x; x = 0 (A), 0.3 (B), 0.6 (C), and 0.9 (D)) samples.
Figure 12. Statistical results for apparent particle sizes of PETG/PGA/ADR (65/35/x; x = 0.3 (A), 0.6 (B), and 0.9 (C)) sam-
ples.
3.2.4. SEM Observation In order to research the micromorphological evolution of the PETG/PGA (65/35)
samples with and without ADR during the tensile process, the cryofractured surfaces of the tensile fractured specimens along the tensile direction were photographed, including the stretching-oriented parts and the unstretched parts, as shown in Figure 13. The un-
Figure 12. Statistical results for apparent particle sizes of PETG/PGA/ADR (65/35/x; x = 0.3 (A), 0.6(B), and 0.9 (C)) samples.
TEM analysis showed the presence of many oversized PGA particles dispersed inthe PETG/PGA (65/35) binary sample. This was due to the serious combining of thePGA domains as a result of the poor interfacial compatibility in the PETG/PGA blending
system. However, upon the addition of 0.3 phr of ADR, the−dapp of the PGA domains
decreased significantly. When the amount of ADR increased from 0.3 to 0.6 phr, the−dapp
further decreased from 1.24 to 0.29 µm. As the amount of added ADR increased to 0.9 phr,
the value of−dapp no longer decreased. That could be explained by the fact that the chain
extension/branching reactions of PETG, PGA, and ADR could form some PETG–ADR–PGA copolymers in situ. These copolymers could improve the PETG/PGA interfacialadhesion and thus significantly reduce the size of the PGA domains.
3.2.4. SEM Observation
In order to research the micromorphological evolution of the PETG/PGA (65/35)samples with and without ADR during the tensile process, the cryofractured surfaces of thetensile fractured specimens along the tensile direction were photographed, including thestretching-oriented parts and the unstretched parts, as shown in Figure 13. The unstretchedpart of the PETG/PGA (65/35) sample (see Figure 13A) showed many oversized PGAparticles (with diameters more than 5 µm) dispersed in the matrix. This could be attributedto the poor compatibility at the PETG/PGA interface and excessive amount of PGA. Owingto their brittle fracturing behavior (in terms of their low elongations at break), there wasno obvious tensile yielding and necking observed in the PETG/PGA (65/35) specimensbefore they ruptured during the tensile testing process. Hence, SEM images of the partoriented in the tensile direction of the PETG/PGA (65/35) sample could not be included inFigure 13. In the case of the unstretched parts of the PETG/PGA/ADR (65/35/x) samples(see Figure 13(A2–A4), the PGA particles were seen embedded in the matrix with a blurredinterface. Moreover, the domain size of the PGA decreased significantly upon the additionof ADR. The distribution of the diameters of the PGA particles and the apparent number-
average particle sizes (−dapp) of PETG/PGA (65/35) with different ADR contents were
determined from the TEM images (see Figures 11 and 12). The reactive compatibilizationby ADR at the PETG/PGA interface was responsible for the decrease in the size of the PGAdomains with a blurred interface, as discussed in the section “TEM observation”.

Polymers 2021, 13, 452 15 of 20
Polymers 2021, 13, x FOR PEER REVIEW 16 of 22
stretched part of the PETG/PGA (65/35) sample (see Figure 13-A) showed many over-sized PGA particles (with diameters more than 5 μm) dispersed in the matrix. This could be attributed to the poor compatibility at the PETG/PGA interface and excessive amount of PGA. Owing to their brittle fracturing behavior (in terms of their low elongations at break), there was no obvious tensile yielding and necking observed in the PETG/PGA (65/35) specimens before they ruptured during the tensile testing process. Hence, SEM images of the part oriented in the tensile direction of the PETG/PGA (65/35) sample could not be included in Figure 13. In the case of the unstretched parts of the PETG/PGA/ADR (65/35/x) samples (see Figure 13-A2, A3, and A4), the PGA particles were seen embedded in the matrix with a blurred interface. Moreover, the domain size of the PGA decreased significantly upon the addition of ADR. The distribution of the diameters of the PGA particles and the apparent number-average particle sizes (d
_
app) of PETG/PGA (65/35) with different ADR contents were determined from the TEM images (see Figures 11 and 12). The reactive compatibilization by ADR at the PETG/PGA interface was responsible for the decrease in the size of the PGA domains with a blurred interface, as discussed in the section “TEM observation”.
Figure 13-B2, B3, and B4 show the SEM photographs of the stretching-oriented parts of the PETG/PGA/ADR (65/35/x) samples with different ADR contents. For the PETG/PGA/ADR (65/35/0.3) sample, as shown in Figure 13-B2, many PGA particles were seen debonded from the PETG matrix, accompanied by a highly oriented PETG matrix.
Polymers 2021, 13, x FOR PEER REVIEW 17 of 22
Figure 13. SEM images (×3000) of cryofractured surfaces of PETG/PGA/ADR tensile fractured specimens along tensile direction. (A) unstretched part (A1—65/35/0; A2—65/35/0.3; A3—65/35/0.6; A4—65/35/0.9); (B) stretching-oriented part (B2—65/35/0.3; B3—65/35/0.6; B4—65/35/0.9).
As compared to the oversized PGA particles of the PETG/PGA (65/35) binary sam-ple, the finer PGA particles of the PETG/PGA/ADR (65/35/0.3) sample showed significant ability to induce the shear yielding of the surrounding matrix. The formation of massive shear bands was conducive to the termination of craze and a stable orientation. As a re-sult, the tensile ductility of the ternary sample was significantly improved. With a further increase in the addition of ADR to 0.6 and 0.9 phr, the degree of the orientation of the PETG matrix increased, accompanied by the formation of a more intensively orientated structure. Moreover, for the parts oriented along the tensile direction, it is worth noting that the interfacial debonding of the PGA particles could be effectively restrained with an increase in ADR content. This demonstrates the efficient reactive compatibilization effect of ADR on the increase in the PETG/PGA interfacial adhesion. Overall, with an increase in ADR content, the domain size of the PGA decreased significantly. Additionally, the increased interfacial adhesion was more conducive to an increase in the tensile ductility of the PETG/PGA samples modified with ADR. However, compared with the oversized PGA particles of the PETG/PGA (65/35) binary sample, the finer PGA particles of the PETG/PGA/ADR (65/35/x) samples could result in more stress concentration around these particles under tensile loads, leading to a decrease in the inflexibility of the PETG matrix. As a result, the tensile moduli of the PETG/PGA/ADR (65/35/x) samples de-creased slightly from 1509 to 1403 MPa when the ADR content increased from 0 to 0.9 phr, as shown in Table 4.
In summary, the SEM results are consistent with the findings of the tensile testing results and TEM analysis. It was also confirmed that ADR had a pronounced reactive compatibilization effect, which tailored the interfacial adhesion and micromorphology of the PETG/PGA blends. As a result, a series of PETG/PGA/ADR blends with improved tensile performance were prepared.
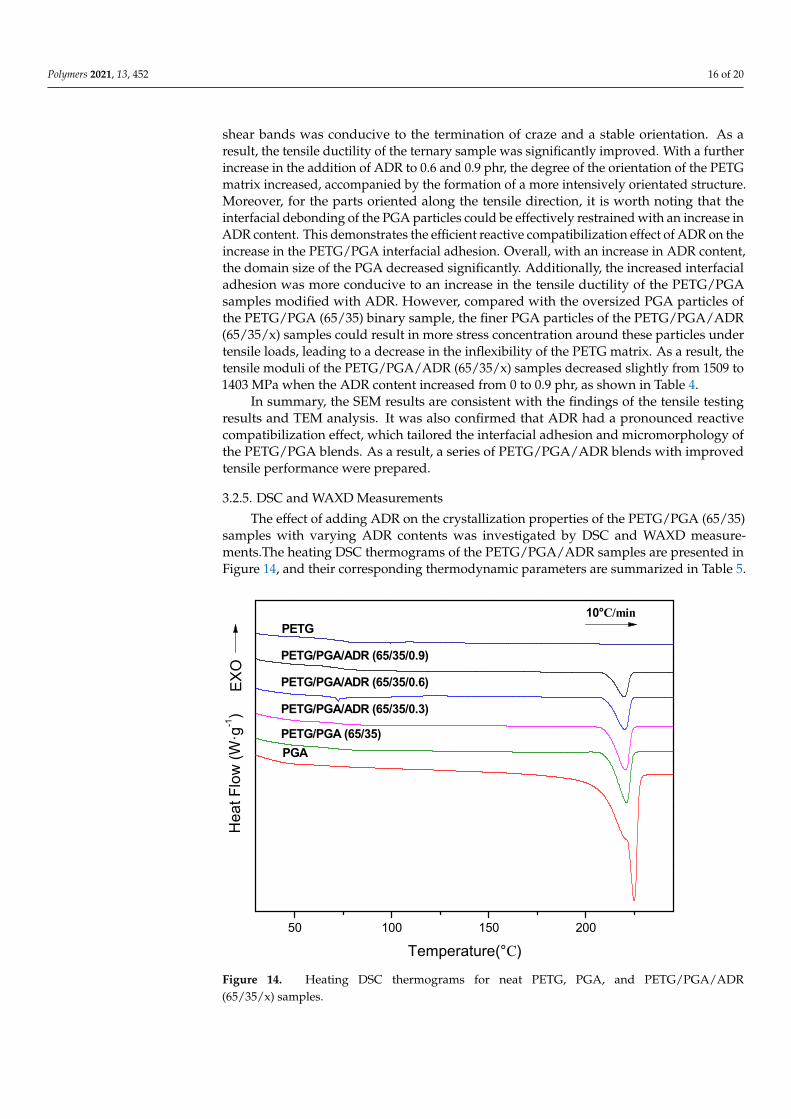
3.2.5. DSC and WAXD Measurements The effect of adding ADR on the crystallization properties of the PETG/PGA (65/35)
samples with varying ADR contents was investigated by DSC and WAXD measure-ments.The heating DSC thermograms of the PETG/PGA/ADR samples are presented in Figure 14, and their corresponding thermodynamic parameters are summarized in Table 5.
Table 5. DSC parameters of neat PGA, PETG, and PETG/PGA/ADR (65/35/x) samples.
Samples Tg (℃)
(PETG)
Tm (℃)
(PGA)
△Hm (J/g)
(PGA)
Xc (%)
(PGA)
Figure 13. SEM images (×3000) of cryofractured surfaces of PETG/PGA/ADR tensile fractured specimens along tensiledirection. (A) unstretched part ((A1)—65/35/0; (A2)—65/35/0.3; (A3)—65/35/0.6; (A4)—65/35/0.9); (B) stretching-oriented part ((B2)—65/35/0.3; (B3)—65/35/0.6; (B4)—65/35/0.9).
Figure 13(B2–B4) show the SEM photographs of the stretching-oriented parts of thePETG/PGA/ADR (65/35/x) samples with different ADR contents. For the PETG/PGA/ADR(65/35/0.3) sample, as shown in Figure 13(B2), many PGA particles were seen debondedfrom the PETG matrix, accompanied by a highly oriented PETG matrix.
As compared to the oversized PGA particles of the PETG/PGA (65/35) binary sample,the finer PGA particles of the PETG/PGA/ADR (65/35/0.3) sample showed significantability to induce the shear yielding of the surrounding matrix. The formation of massive
Polymers 2021, 13, 452 16 of 20
shear bands was conducive to the termination of craze and a stable orientation. As aresult, the tensile ductility of the ternary sample was significantly improved. With a furtherincrease in the addition of ADR to 0.6 and 0.9 phr, the degree of the orientation of the PETGmatrix increased, accompanied by the formation of a more intensively orientated structure.Moreover, for the parts oriented along the tensile direction, it is worth noting that theinterfacial debonding of the PGA particles could be effectively restrained with an increase inADR content. This demonstrates the efficient reactive compatibilization effect of ADR on theincrease in the PETG/PGA interfacial adhesion. Overall, with an increase in ADR content,the domain size of the PGA decreased significantly. Additionally, the increased interfacialadhesion was more conducive to an increase in the tensile ductility of the PETG/PGAsamples modified with ADR. However, compared with the oversized PGA particles ofthe PETG/PGA (65/35) binary sample, the finer PGA particles of the PETG/PGA/ADR(65/35/x) samples could result in more stress concentration around these particles undertensile loads, leading to a decrease in the inflexibility of the PETG matrix. As a result, thetensile moduli of the PETG/PGA/ADR (65/35/x) samples decreased slightly from 1509 to1403 MPa when the ADR content increased from 0 to 0.9 phr, as shown in Table 4.
In summary, the SEM results are consistent with the findings of the tensile testingresults and TEM analysis. It was also confirmed that ADR had a pronounced reactivecompatibilization effect, which tailored the interfacial adhesion and micromorphology ofthe PETG/PGA blends. As a result, a series of PETG/PGA/ADR blends with improvedtensile performance were prepared.
3.2.5. DSC and WAXD Measurements
The effect of adding ADR on the crystallization properties of the PETG/PGA (65/35)samples with varying ADR contents was investigated by DSC and WAXD measure-ments.The heating DSC thermograms of the PETG/PGA/ADR samples are presented inFigure 14, and their corresponding thermodynamic parameters are summarized in Table 5.
Polymers 2021, 13, x FOR PEER REVIEW 18 of 22
Neat PGA N/A 224.9 −74.67 37.7
Neat PETG 74.9 N/A N/A N/A
PETG/PGA (65/35) 73.1 221.0 −24.96 36.0
PETG/PGA/ADR (65/35/0.3) 73.3 220.4 −22.15 32.0
PETG/PGA/ADR (65/35/0.6) 71.9 220.1 −16.25 23.6
PETG/PGA/ADR (65/35/0.9) 72.6 219.9 −11.28 16.4
The DSC thermogram of PETG/PGA (65/35) showed a small step at 73.1°C and a strong endothermic peak at 221.0°C. They were attributed to the glass transition tem-perature of the amorphous PETG matrix and melting peak of the semicrystalline PGA component, respectively. It was confirmed by the data in Table 5 that there was no sig-nificant shift in the Tg of the PETG matrix and Tm of the PGA component. However, the crystallinity of the PGA component in the PETG/PGA/ADR (65/35/x) samples decreased from 36.0 to 16.2% with an increase in ADR content from 0 to 0.9 phr. The increase in the irregularity of the PGA macromolecular segments caused by the chain exten-sion/branching reactions between PGA, PETG, and ADR were responsible for the de-crease in the crystallinity of PGA component.
50 100 150 200
EXO
PETG/PGA/ADR (65/35/0.9)
PETG/PGA/ADR (65/35/0.6)
PETG/PGA/ADR (65/35/0.3)
PETG/PGA (65/35)
PETG
PGA
Hea
t Flo
w (W
·g-1)
Temperature(°C)
10°C/min
Figure 14. Heating DSC thermograms for neat PETG, PGA, and PETG/PGA/ADR (65/35/x) sam-ples.
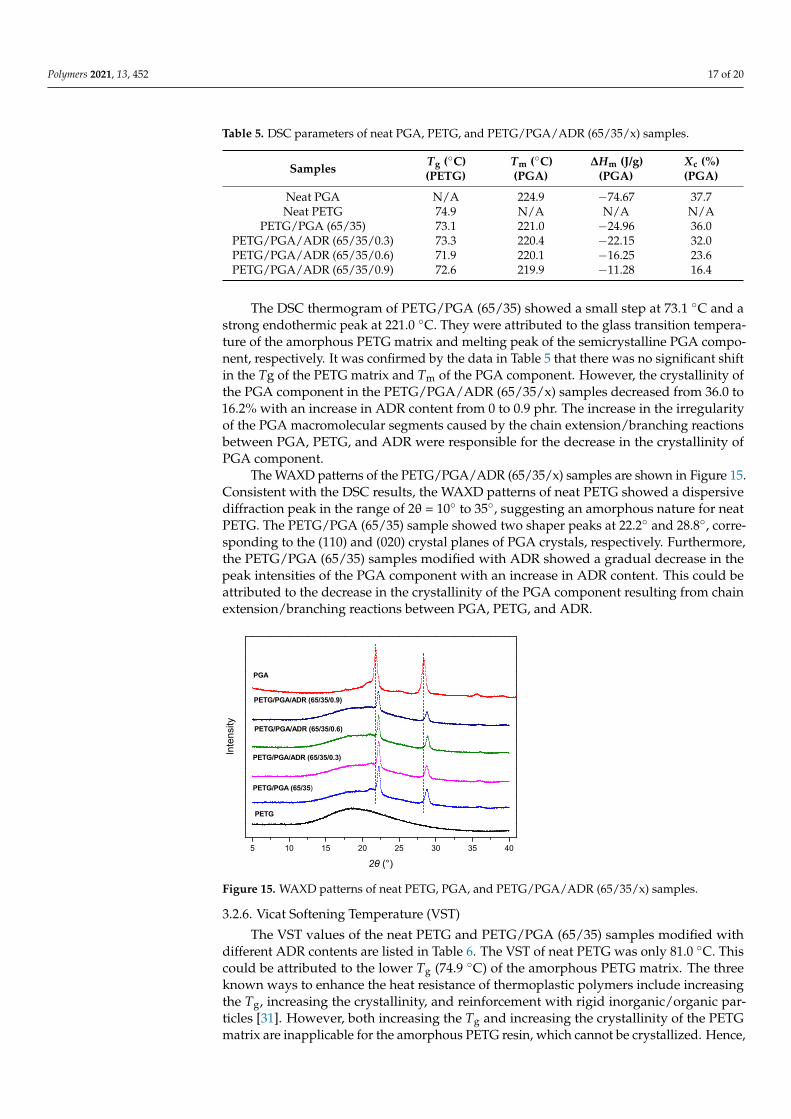
The WAXD patterns of the PETG/PGA/ADR (65/35/x) samples are shown in Figure 15. Consistent with the DSC results, the WAXD patterns of neat PETG showed a disper-sive diffraction peak in the range of 2θ = 10° to 35°, suggesting an amorphous nature for neat PETG. The PETG/PGA (65/35) sample showed two shaper peaks at 22.2° and 28.8°, corresponding to the (110) and (020) crystal planes of PGA crystals, respectively. Fur-thermore, the PETG/PGA (65/35) samples modified with ADR showed a gradual de-crease in the peak intensities of the PGA component with an increase in ADR content. This could be attributed to the decrease in the crystallinity of the PGA component re-sulting from chain extension/branching reactions between PGA, PETG, and ADR.
Figure 14. Heating DSC thermograms for neat PETG, PGA, and PETG/PGA/ADR(65/35/x) samples.
Polymers 2021, 13, 452 17 of 20
Table 5. DSC parameters of neat PGA, PETG, and PETG/PGA/ADR (65/35/x) samples.
Samples Tg (◦C)(PETG)
Tm (◦C)(PGA)
∆Hm (J/g)(PGA)
Xc (%)(PGA)
Neat PGA N/A 224.9 −74.67 37.7Neat PETG 74.9 N/A N/A N/A
PETG/PGA (65/35) 73.1 221.0 −24.96 36.0PETG/PGA/ADR (65/35/0.3) 73.3 220.4 −22.15 32.0PETG/PGA/ADR (65/35/0.6) 71.9 220.1 −16.25 23.6PETG/PGA/ADR (65/35/0.9) 72.6 219.9 −11.28 16.4
The DSC thermogram of PETG/PGA (65/35) showed a small step at 73.1 ◦C and astrong endothermic peak at 221.0 ◦C. They were attributed to the glass transition tempera-ture of the amorphous PETG matrix and melting peak of the semicrystalline PGA compo-nent, respectively. It was confirmed by the data in Table 5 that there was no significant shiftin the Tg of the PETG matrix and Tm of the PGA component. However, the crystallinity ofthe PGA component in the PETG/PGA/ADR (65/35/x) samples decreased from 36.0 to16.2% with an increase in ADR content from 0 to 0.9 phr. The increase in the irregularityof the PGA macromolecular segments caused by the chain extension/branching reactionsbetween PGA, PETG, and ADR were responsible for the decrease in the crystallinity ofPGA component.
The WAXD patterns of the PETG/PGA/ADR (65/35/x) samples are shown in Figure 15.Consistent with the DSC results, the WAXD patterns of neat PETG showed a dispersivediffraction peak in the range of 2θ = 10◦ to 35◦, suggesting an amorphous nature for neatPETG. The PETG/PGA (65/35) sample showed two shaper peaks at 22.2◦ and 28.8◦, corre-sponding to the (110) and (020) crystal planes of PGA crystals, respectively. Furthermore,the PETG/PGA (65/35) samples modified with ADR showed a gradual decrease in thepeak intensities of the PGA component with an increase in ADR content. This could beattributed to the decrease in the crystallinity of the PGA component resulting from chainextension/branching reactions between PGA, PETG, and ADR.
Polymers 2021, 13, x FOR PEER REVIEW 19 of 22
5 10 15 20 25 30 35 40
PETG/PGA/ADR (65/35/0.9)
PETG/PGA/ADR (65/35/0.6)
PETG/PGA/ADR (65/35/0.3)
Inte
nsity
2θ (°)
PETG
PETG/PGA (65/35)
PGA
Figure 15. WAXD patterns of neat PETG, PGA, and PETG/PGA/ADR (65/35/x) samples.
3.2.6. Vicat Softening Temperature (VST) The VST values of the neat PETG and PETG/PGA (65/35) samples modified with
different ADR contents are listed in Table 6. The VST of neat PETG was only 81.0°C. This could be attributed to the lower Tg (74.9°C) of the amorphous PETG matrix. The three known ways to enhance the heat resistance of thermoplastic polymers include increasing the Tg, increasing the crystallinity, and reinforcement with rigid inorganic/organic parti-cles [31]. However, both increasing the Tg and increasing the crystallinity of the PETG matrix are inapplicable for the amorphous PETG resin, which cannot be crystallized. Hence, in this work, increasing the heat resistance of the PETG matrix mainly depended on the reinforcement effect of rigid PGA particles. As expected, the addition of 35 wt% PGA caused the VST of the PETG/PGA (65/35) sample to increase to 99.2°C, which was 18.2°C higher than that of neat PETG. Based on the DSC results, the PGA particles dis-persed in the PETG/PGA (65/35) sample had a semicrystalline nature with a higher Tm (221.0°C) and crystallinity (36.0%). These rigid PGA particles having a higher Tm and crystallinity could prevent the deformation of the PETG matrix during heating. However, with an increase in the ADR concentration, the VST of the PETG/PGA/ADR (65/35/x) samples decreased gradually. For example, when the ADR content increased to 0.6 phr, the VST of the ternary sample decreased from 99.2 (PETG/PGA (65/35) binary sample) to 94.1°C. As the ADR content increased to 0.9 phr, the VST further dropped to 90.5°C. The weakening of reinforcing effect of PGA particles on the heat resistance of the PETG/PGA/ADR samples could be mainly attributed to the decreased crystallinity of the PGA particles. This was the result of chain extension/branching reactions between PGA, PETG, and ADR.
Table 6. VSTs of neat PETG and PETG/PGA/ADR (65/35/x) samples.
Samples VST (°C)
Neat PETG 81.0
PETG/PGA (65/35) 99.2
PETG/PGA/ADR (65/35/0.3) 95.0
PETG/PGA/ADR (65/35/0.6) 94.1
Figure 15. WAXD patterns of neat PETG, PGA, and PETG/PGA/ADR (65/35/x) samples.
3.2.6. Vicat Softening Temperature (VST)
The VST values of the neat PETG and PETG/PGA (65/35) samples modified withdifferent ADR contents are listed in Table 6. The VST of neat PETG was only 81.0 ◦C. Thiscould be attributed to the lower Tg (74.9 ◦C) of the amorphous PETG matrix. The threeknown ways to enhance the heat resistance of thermoplastic polymers include increasingthe Tg, increasing the crystallinity, and reinforcement with rigid inorganic/organic par-ticles [31]. However, both increasing the Tg and increasing the crystallinity of the PETGmatrix are inapplicable for the amorphous PETG resin, which cannot be crystallized. Hence,
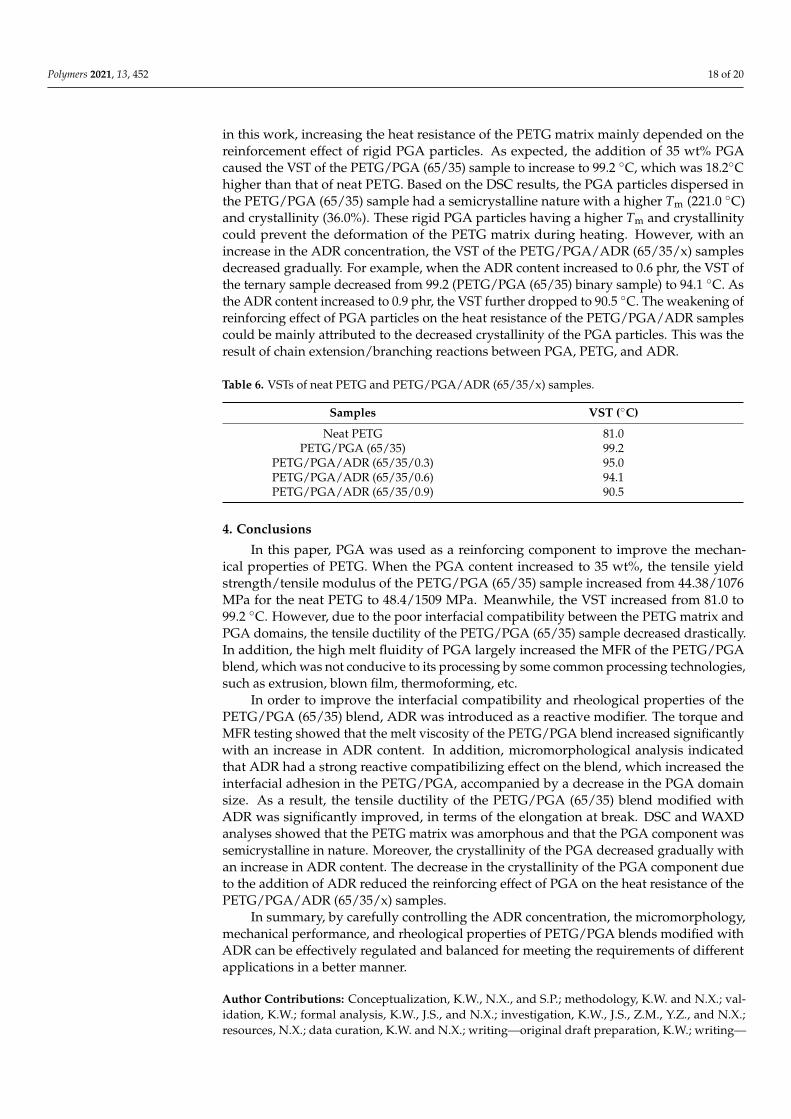
Polymers 2021, 13, 452 18 of 20
in this work, increasing the heat resistance of the PETG matrix mainly depended on thereinforcement effect of rigid PGA particles. As expected, the addition of 35 wt% PGAcaused the VST of the PETG/PGA (65/35) sample to increase to 99.2 ◦C, which was 18.2◦Chigher than that of neat PETG. Based on the DSC results, the PGA particles dispersed inthe PETG/PGA (65/35) sample had a semicrystalline nature with a higher Tm (221.0 ◦C)and crystallinity (36.0%). These rigid PGA particles having a higher Tm and crystallinitycould prevent the deformation of the PETG matrix during heating. However, with anincrease in the ADR concentration, the VST of the PETG/PGA/ADR (65/35/x) samplesdecreased gradually. For example, when the ADR content increased to 0.6 phr, the VST ofthe ternary sample decreased from 99.2 (PETG/PGA (65/35) binary sample) to 94.1 ◦C. Asthe ADR content increased to 0.9 phr, the VST further dropped to 90.5 ◦C. The weakening ofreinforcing effect of PGA particles on the heat resistance of the PETG/PGA/ADR samplescould be mainly attributed to the decreased crystallinity of the PGA particles. This was theresult of chain extension/branching reactions between PGA, PETG, and ADR.
Table 6. VSTs of neat PETG and PETG/PGA/ADR (65/35/x) samples.
Samples VST (◦C)
Neat PETG 81.0PETG/PGA (65/35) 99.2
PETG/PGA/ADR (65/35/0.3) 95.0PETG/PGA/ADR (65/35/0.6) 94.1PETG/PGA/ADR (65/35/0.9) 90.5
4. Conclusions
In this paper, PGA was used as a reinforcing component to improve the mechan-ical properties of PETG. When the PGA content increased to 35 wt%, the tensile yieldstrength/tensile modulus of the PETG/PGA (65/35) sample increased from 44.38/1076MPa for the neat PETG to 48.4/1509 MPa. Meanwhile, the VST increased from 81.0 to99.2 ◦C. However, due to the poor interfacial compatibility between the PETG matrix andPGA domains, the tensile ductility of the PETG/PGA (65/35) sample decreased drastically.In addition, the high melt fluidity of PGA largely increased the MFR of the PETG/PGAblend, which was not conducive to its processing by some common processing technologies,such as extrusion, blown film, thermoforming, etc.
In order to improve the interfacial compatibility and rheological properties of thePETG/PGA (65/35) blend, ADR was introduced as a reactive modifier. The torque andMFR testing showed that the melt viscosity of the PETG/PGA blend increased significantlywith an increase in ADR content. In addition, micromorphological analysis indicatedthat ADR had a strong reactive compatibilizing effect on the blend, which increased theinterfacial adhesion in the PETG/PGA, accompanied by a decrease in the PGA domainsize. As a result, the tensile ductility of the PETG/PGA (65/35) blend modified withADR was significantly improved, in terms of the elongation at break. DSC and WAXDanalyses showed that the PETG matrix was amorphous and that the PGA component wassemicrystalline in nature. Moreover, the crystallinity of the PGA decreased gradually withan increase in ADR content. The decrease in the crystallinity of the PGA component dueto the addition of ADR reduced the reinforcing effect of PGA on the heat resistance of thePETG/PGA/ADR (65/35/x) samples.
In summary, by carefully controlling the ADR concentration, the micromorphology,mechanical performance, and rheological properties of PETG/PGA blends modified withADR can be effectively regulated and balanced for meeting the requirements of differentapplications in a better manner.
Author Contributions: Conceptualization, K.W., N.X., and S.P.; methodology, K.W. and N.X.; val-idation, K.W.; formal analysis, K.W., J.S., and N.X.; investigation, K.W., J.S., Z.M., Y.Z., and N.X.;resources, N.X.; data curation, K.W. and N.X.; writing—original draft preparation, K.W.; writing—
Polymers 2021, 13, 452 19 of 20
review and editing, K.W., N.X., and S.P.; visualization, K.W.; supervision, N.X. and S.P.; projectadministration, N.X. All authors have read and agreed to the published version of the manuscript.
Funding: This research received no external funding.
Institutional Review Board Statement: Not applicable for studies not involving humans or animals.
Informed Consent Statement: Not applicable for studies not involving humans.
Data Availability Statement: The data presented in this study are available on request from thecorresponding author and the first author.
Acknowledgments: The authors gratefully acknowledge support from the Analytical & TestingCenter of Hainan University and Shiner National & Local Joint Engineering & Research Center ofShiner Industrial Co., Ltd., Haikou, China.
Conflicts of Interest: The authors declare no conflict of interest.
References1. Tsai, Y.; Fan, C.-H.; Hung, C.-Y.; Tsai, F.-J. Poly(ethylene Terephthalate) Copolymers That Contain 5-Tert-Butylisophthalic Acid and
1-3/1-4-Cyclohexanedimethanol: Synthesis, Characterization, and Properties. J. Appl. Polym. Sci. 2007, 104, 279–285. [CrossRef]2. Latko, P.; Dydek, K.; Boczkowska, A. Thermal, Rheological and Mechanical Properties of PETG/RPETG Blends. J. Polym. Environ.
2019, 27, 2600–2606. [CrossRef]3. Paszkiewicz, S.; Szymczyk, A.; Irska, I.; Pawlikowska, D.; Piesowicz, E. Synthesis and Characterization of New Reactive Polymer
Blends Based on Post-Consumer Glycol-Modified poly(ethylene Terephthalate) Foils and poly(tetramethylene Oxide). Polimery2018, 63, 45–48. [CrossRef]
4. Li, B.; Zhang, X.; Zhang, Q.; Chen, F.; Fu, Q. Synergistic Enhancement in Tensile Strength and Ductility of ABS by Using RecycledPETG Plastic. J. Appl. Polym. Sci. 2009, 113, 1207–1215. [CrossRef]
5. Kovácová, M.; Kozakovicová, J.; Procházka, M.; Janigová, I.; Vysopal, M.; Cernicková, I.; Krajcovic, J.; Špitalský, Z. Novel HybridPETG Composites for 3D Printing. Appl. Sci. 2020, 10, 3062. [CrossRef]
6. Bhandari, S.; Lopez-Anido, R.A.; Gardner, D.G. Enhancing the Interlayer Tensile Strength of 3D Printed Short Carbon FiberReinforced PETG and PLA Composites via Annealing. Addit. Manuf. 2019, 30, 100922. [CrossRef]
7. Yu, S.-H.; Lee, J.-h.; Sim, J.-H. Characterization of PETG Thermoplastic Composites Enhanced TiO2, Carbon Black, and POE.Textile Coloration Finish. 2019, 31, 354–362. [CrossRef]
8. Tsai, Y.; Fan, C.-H.; Hung, C.-Y.; Tsai, F.-J. Transparent copolyester/Organoclay Nanocomposites Prepared by in Situ IntercalationPolymerization: Synthesis, Characterization, and Properties. Polym. Compos. 2010, 32, 89–96. [CrossRef]
9. Schmidt, C.; Behl, M.; Lendlein, A.; Beuermann, S. Synthesis of High Molecular Weight Polyglycolide in Supercritical CarbonDioxide. RSC Adv. 2014, 4, 35099–35105. [CrossRef]
10. Göktürk, E.; Pemba, A.G.; Miller, S.A. Polyglycolic Acid from the Direct Polymerization of Renewable C1 Feedstocks. Polym.Chem. 2015, 6, 3918–3925. [CrossRef]
11. Samantaray, P.K.; Little, A.; Haddleton, D.M.; McNally, T.; Tan, B.; Sun, Z.; Huang, W.; Ji, Y.; Wan, C. Poly(glycolic Acid) (PGA): AVersatile Building Block Expanding High Performance and Sustainable Bioplastic Applications. Green Chem. 2020, 22, 4055–4081.[CrossRef]
12. Jem, K.J.; Tan, B. The Development and Challenges of Poly (lactic Acid) and Poly (glycolic Acid). Adv. Ind. Eng. Polym. Res. 2020,3, 60–70. [CrossRef]
13. Chang, L.-F.; Zhou, Y.-G.; Ning, Y.; Zou, J. Toughening Effect of Physically Blended Polyethylene Oxide on Polyglycolic Acid. J.Polym. Environ. 2020, 28, 2125–2136. [CrossRef]
14. Guo, W.; Zhang, Y.; Feng, P.; Gao, C.; Yang, Y.; Yang, W.; Peng, S.; Shuai, C. Montmorillonite With Unique Interlayer SpaceImparted Polymer Scaffolds With Sustained Release of Ag+. Ceram. Int. 2019, 45, 11517–11526. [CrossRef]
15. Zhang, J.; Xie, B.; Xi, Z.; Zhao, L.; Cen, L.; Yang, Y. A Comparable Study of Polyglycolic acid’s Degradation on macrophages’Activation. Mater. Sci. Eng. C 2020, 109, 110574. [CrossRef] [PubMed]
16. Lebedev, B.; Yevstropov, A.; Kiparisova, Y.; Belov, V. The Thermodynamics of Glycollide, Polyglycollide and of Polymerization ofGlycollide in the Temperature Range of 0–550◦K. Polym. Sci. USSR 1978, 20, 32–42. [CrossRef]
17. Pack, J.W.; Kim, S.H.; Cho, I.-W.; Park, S.Y.; Kim, Y.H. Microstructure Analysis and Thermal Property of Copolymers Made ofGlycolide and
Table 10: tipa Phonetic Symbols
È \textbabygamma P \textglotstop ï \textrtailn
b \textbarb ; \texthalflength ó \textrtailr
c \textbarc ż \texthardsign ù \textrtails
d \textbard # \texthooktop ú \textrtailt
é \textbardotlessj á \texthtb ü \textrtailz
g \textbarg ê \texthtbardotlessj $ \textrthook
Ü \textbarglotstop Á \texthtc À \textsca
1 \textbari â \texthtd à \textscb
ł \textbarl ä \texthtg ď \textsce
8 \textbaro H \texthth å \textscg
Ý \textbarrevglotstop Ê \texththeng Ë \textsch
0 \textbaru Î \texthtk @ \textschwa
ì \textbeltl Ò \texthtp I \textsci
B \textbeta Ó \texthtq ĺ \textscj
ò \textbullseye č \texthtrtaild Ï \textscl
\textceltpal É \texthtscg ð \textscn
\textchi Ö \texthtt Œ \textscoelig
Å \textcloseepsilon ß \texthvlig ś \textscomega
Ñ \textcloseomega Û \textinvglotstop ö \textscr
Æ \textcloserevepsilon K \textinvscr A \textscripta
Þ \textcommatailz Ì \textiota g \textscriptg
^ \textcorner ń \textlambda V \textscriptv
ă \textcrb : \textlengthmark Ú \textscu
ą \textcrd ş \textlhookt Y \textscy
g \textcrg ę \textlhtlongi \textsecstress
è \textcrh ű \textlhtlongy ž \textsoftsign
Û \textcrinvglotstop Ô \textlonglegr  \textstretchc
ň \textcrlambda ¡ \textlptr tC \texttctclig
2 \textcrtwo M \textltailm Ù \textteshlig
C \textctc ñ \textltailn T \texttheta
ć \textctd ë \textltilde þ \textthorn
ćý \textctdctzlig Ð \textlyoghlig £ \texttoneletterstem
š \textctesh Í \textObardotlessj ţ \texttslig
J \textctj ŋ \textOlyoghlig 5 \textturna
ő \textctn ř \textomega ŕ \textturncelig
ť \textctt _ \textopencorner 4 \textturnh
ťC \textcttctclig O \textopeno ľ \textturnk
ÿ \textctyogh % \textpalhook Õ \textturnlonglegr
ý \textctz F \textphi W \textturnm
dý \textdctzlig | \textpipe î \textturnmrleg
S \textdoublebaresh " \textprimstress ô \textturnr
} \textdoublebarpipe ij \textraiseglotstop õ \textturnrrtail
=/ \textdoublebarslash ğ \textraisevibyi 6 \textturnscripta
{ \textdoublepipe 7 \textramshorns Ø \textturnt
Ş \textdoublevertline \ \textrevapostrophe 2 \textturnv
Ť \textdownstep 9 \textreve û \textturnw
à \textdyoghlig 3 \textrevepsilon L \textturny
dz \textdzlig Q \textrevglotstop U \textupsilon
E \textepsilon ź \textrevyogh Ţ \textupstep
(continued on next page)
11
-Caprolactone by Stannous Octoate. J. Polym. Sci. Part A Polym. Chem. 2002, 40, 544–554. [CrossRef]18. Dutta, A.; Ghosh, A.K. Influence of Thermal and Morphological Characteristics on Mechanical Responses of polypropylene/γ-
Irradiated Elastomer Blends. J. Appl. Polym. Sci. 2018, 135, 46597. [CrossRef]19. Wang, S.; Pang, S.; Pan, L.; Xu, N.; Li, T. Isothermal Cold Crystallization, Heat Resistance, and Tensile Performance of Polylac-
tide/Thermoplastic Polyester Elastomer (PLA/TPEE) Blends: Effects of Annealing and Reactive Compatibilizer. Polymer 2016,8, 417. [CrossRef]
20. Al-Itry, R.; Lamnawar, K.; Maazouz, A. Improvement of Thermal Stability, Rheological and Mechanical Properties of PLA, PBATand Their Blends by Reactive Extrusion With Functionalized Epoxy. Polym. Degrad. Stab. 2012, 97, 1898–1914. [CrossRef]

Polymers 2021, 13, 452 20 of 20
21. Fried, J.R. Polymer Science and Technology; China Edition (original 2nd ed.); PEARSON EDUCATION ASIA LID.: Beijing, China,2010; pp. 153–205.
22. Liu, J.; Liu, J. Characterization of Maleic anhydride/Styrene Melt-Grafted Random Copolypropylene and Its Impact on Crystal-lization and Mechanical Properties of Isotactic Polypropylene. Polym. Bull. 2018, 76, 4369–4387. [CrossRef]
23. Nagarajan, V.; Mohanty, A.K.; Misra, M. Perspective on Polylactic Acid (PLA) Based Sustainable Materials for Durable Applica-tions: Focus on Toughness and Heat Resistance. ACS Sustain. Chem. Eng. 2016, 4, 2899–2916. [CrossRef]
24. Song, D.; Wang, K.; Shen, J.; Zhao, L.; Xu, N.; Pang, S.; Pan, L. Effects of Organic Montmorillonite (OMMT) and Pre-Orientationon Property of Poly(l-Lactic Acid) (PLLA)/Ethylene Propylene Diene Monomer (EPDM) Blends. Polymer 2020, 12, 106. [CrossRef][PubMed]
25. Zong, X.-H.; Wang, Z.-G.; Hsiao, B.S.; Chu, B.; Zhou, J.J.; Jamiolkowski, D.D.; Muse, E.; Dormier, E. Structure and MorphologyChanges in Absorbable Poly(glycolide) and Poly(glycolide-Co-Lactide) During in Vitro Degradation. Macromolecules 1999, 32,8107–8114. [CrossRef]
26. Ayyoob, M.; Lee, D.H.; Kim, J.H.; Nam, S.W.; Kim, Y.J. Synthesis of poly(glycolic Acids) via Solution Polycondensation andInvestigation of Their Thermal Degradation Behaviors. Fibers Polym. 2017, 18, 407–415. [CrossRef]
27. Yu, C.; Bao, J.; Xie, Q.; Shan, G.; Pan, P.; Bao, Y. Crystallization Behavior and Crystalline Structural Changes of poly(glycolic Acid)Investigated via Temperature-Variable WAXD and FTIR Analysis. CrystEngComm 2016, 18, 7894–7902. [CrossRef]
28. Wang, S.; Pang, S.; Xu, N.; Pan, L.; Lin, Q. In Situcompatibilization of polylactide/Thermoplastic Polyester Elastomer BlendsUsing a Multifunctional Epoxide Compound As a Processing Agent. J. Appl. Polym. Sci. 2016, 133, 43424. [CrossRef]
29. Härth, M.; Dörnhöfer, A. Film Blowing of Linear and Long-Chain Branched Poly(ethylene Terephthalate). Polymer 2020, 12, 1605.[CrossRef]
30. Quiles-Carrillo, L.; Montanes, N.; Lagaron, J.M.; Balart, R.; Torres-Giner, S. In Situ Compatibilization of Biopolymer TernaryBlends by Reactive Extrusion With Low-Functionality Epoxy-Based Styrene–Acrylic Oligomer. J. Polym. Environ. 2018, 27, 84–96.[CrossRef]
31. Li, Y.; Zhao, L.; Han, C.; Yu, Y. Biodegradable Blends of poly(butylene Adipate-Co-Terephthalate) and Stereocomplex PolylactideWith Enhanced Rheological, Mechanical Properties and Thermal Resistance. Colloid Polym. Sci. 2020, 298, 1–13. [CrossRef]
Related Documents