This content has been downloaded from IOPscience. Please scroll down to see the full text. Download details: IP Address: 78.141.79.233 This content was downloaded on 18/10/2013 at 04:06 Please note that terms and conditions apply. Preparation and characterization of ZrO 2 :Er 3+ , Yb 3+ nanoparticles using a high pressure assisted soft template View the table of contents for this issue, or go to the journal homepage for more 2010 Adv. Nat. Sci: Nanosci. Nanotechnol. 1 025008 (http://iopscience.iop.org/2043-6262/1/2/025008) Home Search Collections Journals About Contact us My IOPscience

Welcome message from author
This document is posted to help you gain knowledge. Please leave a comment to let me know what you think about it! Share it to your friends and learn new things together.
Transcript

This content has been downloaded from IOPscience. Please scroll down to see the full text.
Download details:
IP Address: 78.141.79.233
This content was downloaded on 18/10/2013 at 04:06
Please note that terms and conditions apply.
Preparation and characterization of ZrO2:Er3+, Yb3+ nanoparticles using a high pressure
assisted soft template
View the table of contents for this issue, or go to the journal homepage for more
2010 Adv. Nat. Sci: Nanosci. Nanotechnol. 1 025008
(http://iopscience.iop.org/2043-6262/1/2/025008)
Home Search Collections Journals About Contact us My IOPscience
IOP PUBLISHING ADVANCES IN NATURAL SCIENCES: NANOSCIENCE AND NANOTECHNOLOGY
Adv. Nat. Sci.: Nanosci. Nanotechnol. 1 (2010) 025008 (5pp) doi:10.1088/2043-6254/1/2/025008
Preparation and characterization ofZrO2:Er3+, Yb3+ nanoparticles using ahigh pressure assisted soft templateThi Kieu Giang Lam1, A Opalinska2, T Chudoba2, K Benkowski2,W Lojkowski2, Kim Anh Tran1, Thanh Binh Nguyen1 and Quoc Minh Le1
1 Institute of Materials Science, Vietnam Academy of Science and Technology,18 Hoang Quoc Viet Road, Cau Giay District, Hanoi, Vietnam2 High Pressure Research Center of the Polish Academy of Sciences, Sokolowska 29, Warsaw, Poland
E-mail: [email protected]
Received 17 March 2010Accepted for publication 18 June 2010Published 3 August 2010Online at stacks.iop.org/ANSN/1/025008
AbstractNanoparticles of ZrO2:Er3+, Yb3+ fabricated by a soft template method combined withmicrowave heating under high pressures were reported for the first time. Nano ZrO2:Er3+,Yb3+ in concentrations of 0.1–15 mol% have been fabricated in the presence of soft templateagent diethylene glycol or polyethylene glycol in a microwave reactor at pressures up to55 atm. The average size of the as-synthesized nanoparticles was found to be 5–13 nm.The upconversion luminescence of the ZrO2 : Er3+, Yb3+ was found in the red region of630–710 nm and in the green region of 510–570 nm, with excitation by an infrared diode laserat the wavelengths of 830 and 940 nm, respectively. The change in content ratio betweenmonoclinic and tetragonal phases when the annealing temperature increases from 600 to1200 ◦C was investigated. The tetragonal phase content decreases and disappears for thesamples annealed at 1200 ◦C. The increase in the content of the monoclinic phase is suggestedto be a main reason for the increase in the upconversion luminescent intensity of nanoZrO2:Er3+, Yb3+.
Keywords: Nano-ZrO2:Er 3+, Yb 3+, upconversion luminescence, soft template, high pressure
Classification numbers: 4.02, 5.01, 5.04
1. Introduction
Possessing excellent physico-chemical properties, includinglow optical propagation loss, large refractive index andespecially low phonon energy, ZrO2 ceramic material canbe used in optoelectronic and biomedical applications [1–5].According to a recent study, the Er3+-doped ZrO2 nanopowderhas shown an interesting property of visible upconversionluminescence under infrared excitation and therefore it haspotential for a new application in the fluorescent detection ofbiomedical molecules [6–8].
A number of synthesis methods have been reported tofabricate the nanomaterials: hydrothermal, co-precipitation,template assisted (hard and soft templates) [6–9], sol–gel[4, 5] and others incorporated with different techniques(microwave, ultrasonic vibration, high and low pressure)
[1, 3, 6, 7]. The synthesized nanoparticles were used asstarting materials for the next doping step with rare earth ionssuch as Er3+ or Yb3+. Recently, there have also been a numberof reports on the synthesis of rare earth oxides using a softtemplate of polymers and organic compounds [9, 10], andthe synthesis of ZrO2 nanopowder using a microwave methodunder high pressure [1, 6, 8].
In our work, we have developed the soft template methodincorporated with microwave heating under high pressure tofabricate (Er3+, Yb3+)-doped and (Er3+/Yb3+) co-doped ZrO2
nanopowder. The results from the synthesis, characterizationand upconversion luminescence properties of the studiednanopowder are reported. In addition, these results allowus to discuss the emission mechanisms of the upconversionluminescence in the visible region under infrared excitation.
2043-6254/10/025008+05$30.00 1 © 2010 Vietnam Academy of Science & Technology
Adv. Nat. Sci.: Nanosci. Nanotechnol. 1 (2010) 025008 T K G Lam et al
2. Experiment
ZrOCl2 · 8H2O, ErCl3 · 6H2O, YbCl3 · 6H2O, diethyleneglycol (DEG), polyethylene glycol (PEG) and NaOH, allwith a high purity from 99.9 to 99.99%, purchased fromMerck, were used as the starting chemicals. After adding asoft template agent to precursor solution at room temperature,the synthesis took place in the Eretec reaction system.
The experimental procedure can be divided in two mainsteps. Firstly, the solution containing the rare earth ions(Er3+, Yb3+) or (Er3+/Yb3+) and that of ZrOCl2 0.5 M werecarefully mixed together with a magnetic stirrer until a highhomogeneous dispersion of the mixture was obtained. TheDEG or PEG was added to the obtained mixture and was thenstirred regularly and continuously for 1 h. Finally, the NaOH10% was added drop-wise to the stirring solution until a pHof 8–12 was reached and a homogeneous suspension (sol) wasobtained.
In the second step, the above prepared sol at roomtemperature was transferred to a sealed Teflon container andheated in the high pressure microwave system. The microwavereactor in the high pressure system Fetec (Poland) was usedfor the synthesis of pure and RE3+-doped ZrO2 nanoparticles.At a temperature of about 315 ◦C and pressure of 55 atm,the reaction was carried out for 35 min. and subsequentlycooled down by water. The obtained products were washedthoroughly by deionized water and isopropanol, and thendried at 70 ◦C. After that, the prepared samples were annealedat temperatures ranging from 600 to 1200 ◦C. The rate ofthe annealing temperature was maintained at 5 ◦C min, andthe annealing time of 1 h was chosen. The morphologyof the nanocrystals was estimated by transmission electronmicroscopy (TEM, JEM-2010, JEOL), their crystalline phasestructure was determined by using an x-ray diffractometer(XRD, SIEMENS D5000), and their material density andspecific surface area (BET) were measured with a GEMINI2360 system (USA) at the Institute of High Pressure Physics(IHPP), Warsaw, Poland. The measurements on luminescencespectra were carried out on a fast and miniature CCDspectrophotometer (OceanOptics) with sensitivity from 340to 1000 nm at the Institute of Low Temperature and StructureResearch (ILTSR), Wroclaw, Poland, using an infrared laserexciting source at a wavelength of 830 nm and Microspec2300i spectrometer at the Institute of Materials Science(VAST, Hanoi), using an infrared laser exciting source atwavelengths of 830 and 940 nm, equipped with a CCD camerawith sensitivity from 300 to 1000 nm.
3. Results and discussions
3.1. Morphology and crystal structure of ZrO2:RE3+
nanopowder
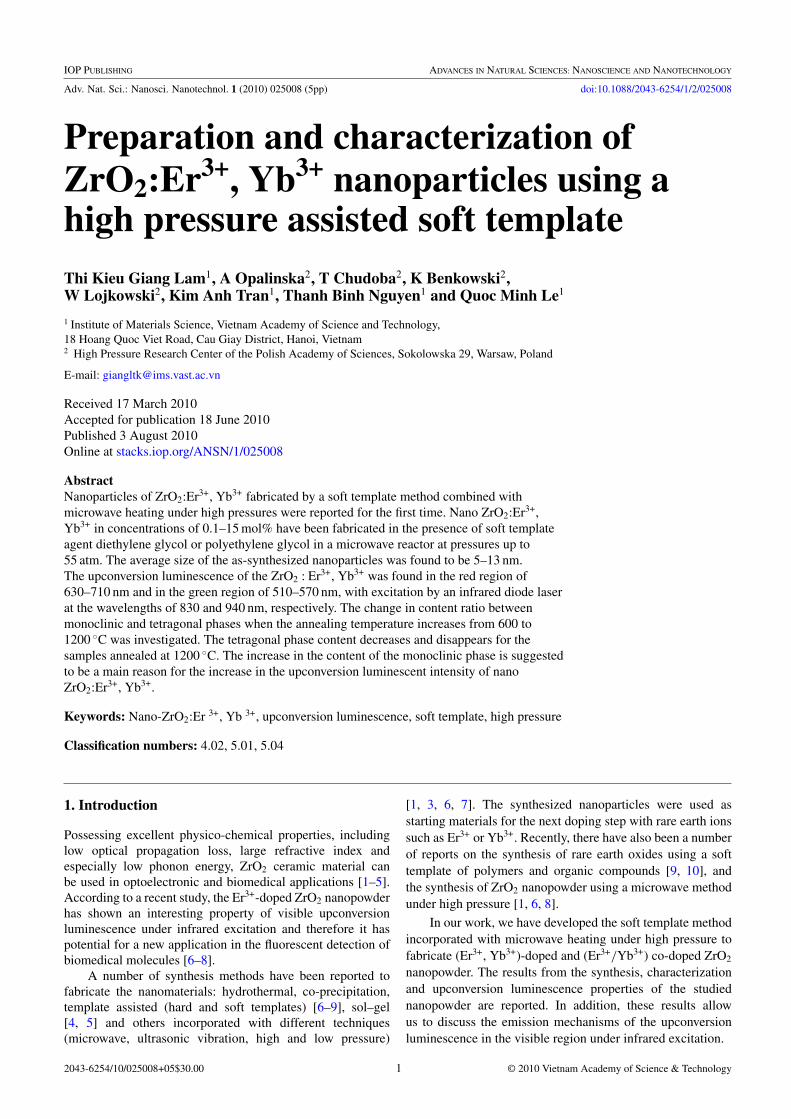
Figure 1 shows the TEM images of as-synthesized ZrO2
nanopowder doped with 1 mol% Er3+. One can see thatthe particles of our samples are small (5–13 nm), with anarrow size distribution and a high uniformity. This resultalso coincides with those from the calculation based onresults of structural analysis (XRD) and specific surface area.The uniformity in size of these particles may be due to the
a)
b)
Figure 1. (a) The TEM images of ZrO2:1 mol% Er3+ dried at 70 ◦Cin air. (b) The TEM images of ZrO2:1 mol% Er3+ annealing at600 ◦C, with a heating rate of 5 ◦C/min−1 for 1 h.
presence of a polymer soft template in the reaction solution.This uniformity was also found in our previous work on thesynthesis of nanocapsules of ZrO2 using a soft template agentwith PEG 4000 [7, 9, 10]. While the low pressure and softtemplate method have produced a powder in nanorod form [9],this high pressure assisted soft template method provides uswith spherical particles.
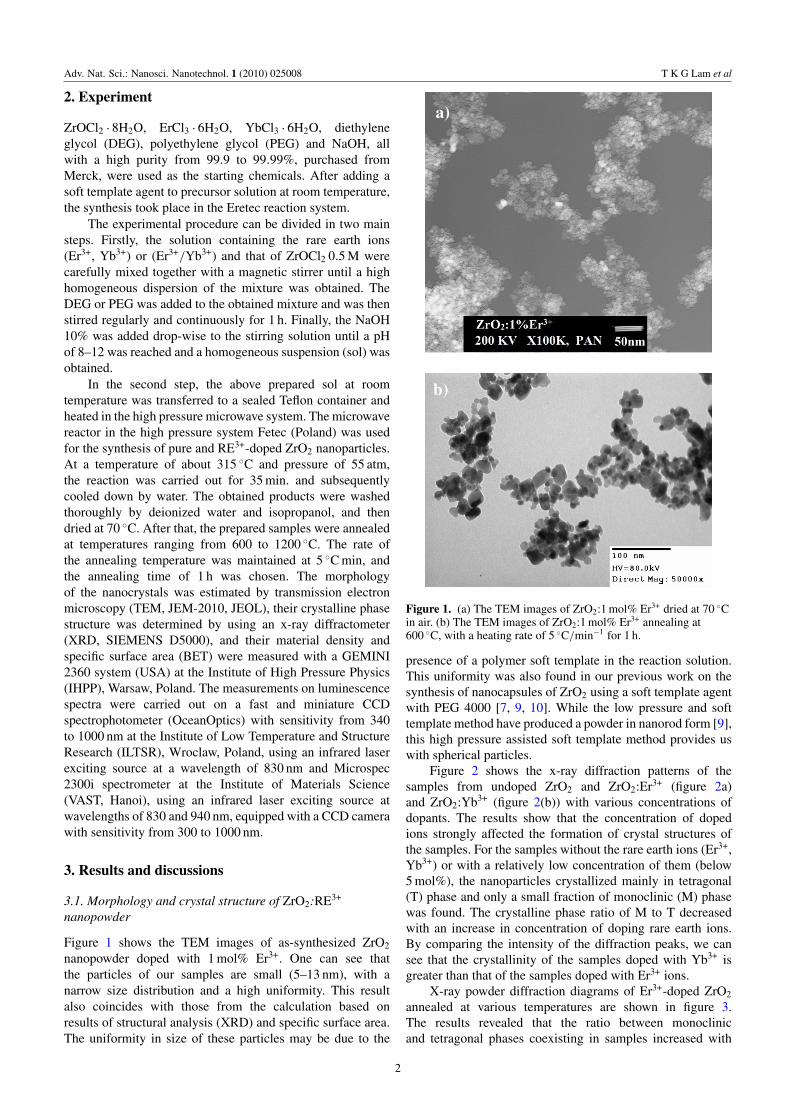
Figure 2 shows the x-ray diffraction patterns of thesamples from undoped ZrO2 and ZrO2:Er3+ (figure 2a)and ZrO2:Yb3+ (figure 2(b)) with various concentrations ofdopants. The results show that the concentration of dopedions strongly affected the formation of crystal structures ofthe samples. For the samples without the rare earth ions (Er3+,Yb3+) or with a relatively low concentration of them (below5 mol%), the nanoparticles crystallized mainly in tetragonal(T) phase and only a small fraction of monoclinic (M) phasewas found. The crystalline phase ratio of M to T decreasedwith an increase in concentration of doping rare earth ions.By comparing the intensity of the diffraction peaks, we cansee that the crystallinity of the samples doped with Yb3+ isgreater than that of the samples doped with Er3+ ions.
X-ray powder diffraction diagrams of Er3+-doped ZrO2
annealed at various temperatures are shown in figure 3.The results revealed that the ratio between monoclinicand tetragonal phases coexisting in samples increased with
2
Adv. Nat. Sci.: Nanosci. Nanotechnol. 1 (2010) 025008 T K G Lam et al
20 30 40 50 600
2000
4000
6000 TTT
M
In
tens
ity
(cou
nts/
sec
)
2 theta (deg.)
15
5
4
ZrO2 pure
T % Er3+
20 30 40 50 600
2000
4000
6000
M
Inte
nsit
y (c
ount
s/se
c)
2 theta (deg.)
ZrO2 pure
TTT
T
15
5
4
% Yb3+
a)
b)
Figure 2. (a) The XRD patterns of ZrO2 and ZrO2:Er3+ nano-particles with concentrations from 0 to 15 mol%. (b) The XRDpatterns of ZrO2 and ZrO2 : Yb3+ nanoparticles with concentrationsfrom 0 to 15 mol%.
20 30 40 50 600
4000
8000
12000
16000
M+T
M
1
2
3
4
5
6
ZrO2: 1 mol. %Er3+
Inte
nsit
y (c
ount
s/se
c)
2 theta (deg.)
Figure 3. The XRD patterns of ZrO2:1 mol% Er3+70 ◦C—24 h;(2) 600 ◦C—1 h; (3) 800 ◦C—1 h; (4) 1000 ◦C—1 h; (5)1200 ◦C—1 h; (6) 1200 ◦C—2 h.
annealing temperature ranging from 600 to 1200◦C for 1 h.The samples with only one crystalline phase of monoclinicwere obtained with an annealing temperature of 1200◦Cfor 2 h. These structural phase analyses showed that, in alldoped samples, no impurities were found. It proved that themicrowave-assisted soft template method under high pressureallows us to produce doped ZrO2 nanomaterials with a veryhigh doping concentration.
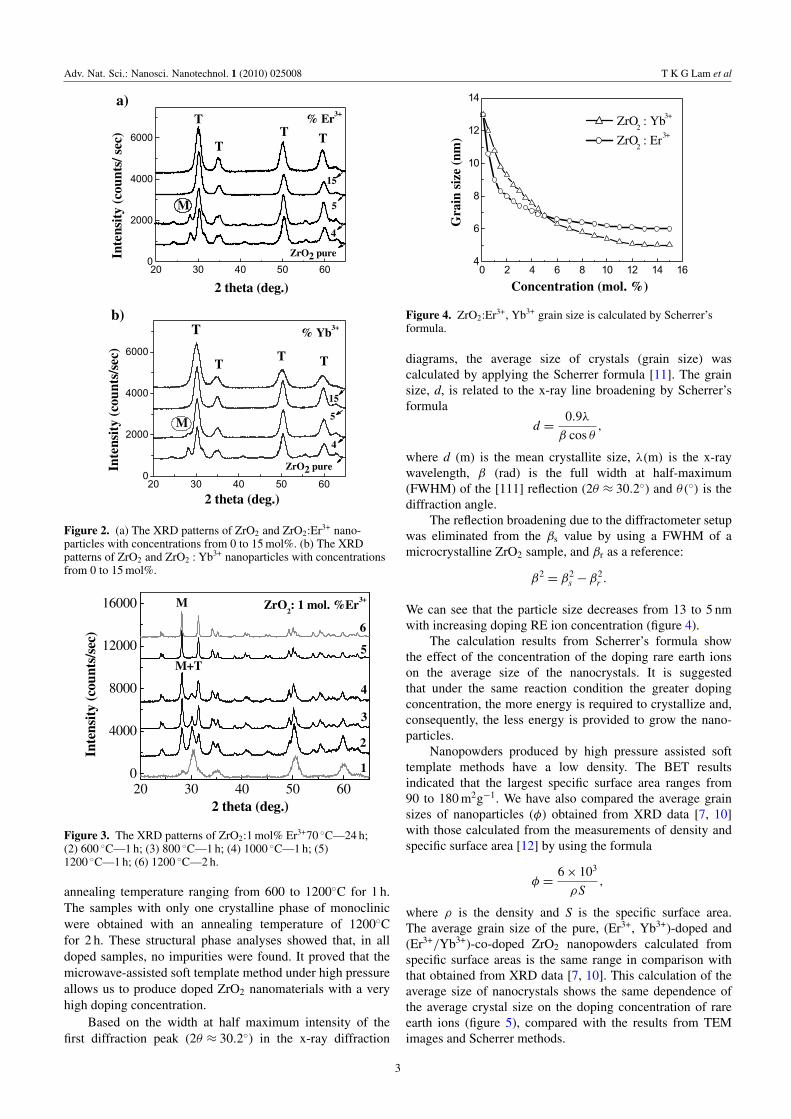
Based on the width at half maximum intensity of thefirst diffraction peak (2θ ≈ 30.2◦) in the x-ray diffraction
0 2 4 6 8 10 12 14 164
6
8
10
12
14
Gra
in s
ize
(nm
)
Concentration (mol. %)
ZrO2 : Yb 3+
ZrO2 : Er 3+
Figure 4. ZrO2:Er3+, Yb3+ grain size is calculated by Scherrer’sformula.
diagrams, the average size of crystals (grain size) wascalculated by applying the Scherrer formula [11]. The grainsize, d, is related to the x-ray line broadening by Scherrer’sformula
d =0.9λ
β cos θ,
where d (m) is the mean crystallite size, λ(m) is the x-raywavelength, β (rad) is the full width at half-maximum(FWHM) of the [111] reflection (2θ ≈ 30.2◦) and θ(◦) is thediffraction angle.
The reflection broadening due to the diffractometer setupwas eliminated from the βs value by using a FWHM of amicrocrystalline ZrO2 sample, and βr as a reference:
β2= β2
s − β2r .
We can see that the particle size decreases from 13 to 5 nmwith increasing doping RE ion concentration (figure 4).
The calculation results from Scherrer’s formula showthe effect of the concentration of the doping rare earth ionson the average size of the nanocrystals. It is suggestedthat under the same reaction condition the greater dopingconcentration, the more energy is required to crystallize and,consequently, the less energy is provided to grow the nano-particles.
Nanopowders produced by high pressure assisted softtemplate methods have a low density. The BET resultsindicated that the largest specific surface area ranges from90 to 180 m2g−1. We have also compared the average grainsizes of nanoparticles (φ) obtained from XRD data [7, 10]with those calculated from the measurements of density andspecific surface area [12] by using the formula
φ =6 × 10³
ρS,
where ρ is the density and S is the specific surface area.The average grain size of the pure, (Er3+, Yb3+)-doped and(Er3+/Yb3+)-co-doped ZrO2 nanopowders calculated fromspecific surface areas is the same range in comparison withthat obtained from XRD data [7, 10]. This calculation of theaverage size of nanocrystals shows the same dependence ofthe average crystal size on the doping concentration of rareearth ions (figure 5), compared with the results from TEMimages and Scherrer methods.
3
Adv. Nat. Sci.: Nanosci. Nanotechnol. 1 (2010) 025008 T K G Lam et al
0 2 4 6 8 10 12 14 164
6
8
10
12
14
Concentration (mol. %)
Gra
in s
ize
(nm
) ZrO
2 : Yb3+
ZrO2 : Er3+
Figure 5. Grain size is calculated from BET of ZrO2 : Er3+, Yb3+.
500 600 7000
50000
100000
*10 times
λλ λ λexc
= 830 nm
(d)(c)(b)(a)
Green
2H11/2
- 4I15/2
4S3/2
- 4I15/2
Red
a- 1200oC, 1 hb- 1000oC, 1 hc- 600oC, 1 hd- Dried 70 oC
4F9/2
- 4I15/2
PL
Int
ensi
ty (a
.u)
Wavelength (nm)
Figure 6. Upconversion luminescence spectra of theZrO2:1 mol% Er3+ under 830 nm excitation.
3.2. Upconversion luminescence properties
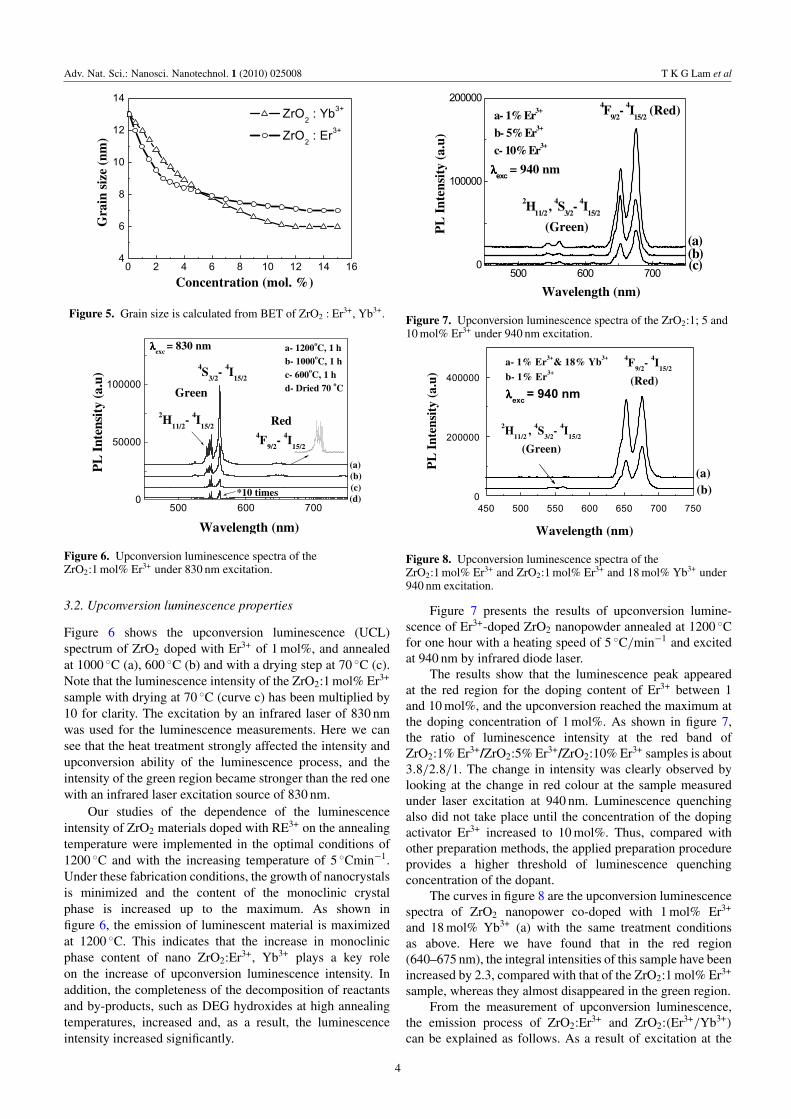
Figure 6 shows the upconversion luminescence (UCL)spectrum of ZrO2 doped with Er3+ of 1 mol%, and annealedat 1000 ◦C (a), 600 ◦C (b) and with a drying step at 70 ◦C (c).Note that the luminescence intensity of the ZrO2:1 mol% Er3+
sample with drying at 70 ◦C (curve c) has been multiplied by10 for clarity. The excitation by an infrared laser of 830 nmwas used for the luminescence measurements. Here we cansee that the heat treatment strongly affected the intensity andupconversion ability of the luminescence process, and theintensity of the green region became stronger than the red onewith an infrared laser excitation source of 830 nm.
Our studies of the dependence of the luminescenceintensity of ZrO2 materials doped with RE3+ on the annealingtemperature were implemented in the optimal conditions of1200 ◦C and with the increasing temperature of 5 ◦Cmin−1.Under these fabrication conditions, the growth of nanocrystalsis minimized and the content of the monoclinic crystalphase is increased up to the maximum. As shown infigure 6, the emission of luminescent material is maximizedat 1200 ◦C. This indicates that the increase in monoclinicphase content of nano ZrO2:Er3+, Yb3+ plays a key roleon the increase of upconversion luminescence intensity. Inaddition, the completeness of the decomposition of reactantsand by-products, such as DEG hydroxides at high annealingtemperatures, increased and, as a result, the luminescenceintensity increased significantly.
500 600 7000
100000
200000
λλλλexc = 940 nm
2H11/2
, 4S3/2
- 4I15/2
(Green)
4F9/2
- 4I15/2
(Red)a- 1% Er3+
b- 5% Er3+
c- 10% Er3+
PL
Int
ensi
ty (
a.u)
Wavelength (nm)
(a)(b)(c)
Figure 7. Upconversion luminescence spectra of the ZrO2:1; 5 and10 mol% Er3+ under 940 nm excitation.
450 500 550 600 650 700 7500
200000
400000
λλλλexc
= 940 nm
4F9/2
- 4I15/2
(Red)
2H11/2
, 4S3/2
- 4I15/2
(Green)
PL
Int
ensi
ty (
a.u)
Wavelength (nm)
(a)(b)
a- 1% Er3+& 18% Yb3+
b- 1% Er3+
Figure 8. Upconversion luminescence spectra of theZrO2:1 mol% Er3+ and ZrO2:1 mol% Er3+ and 18 mol% Yb3+ under940 nm excitation.
Figure 7 presents the results of upconversion lumine-scence of Er3+-doped ZrO2 nanopowder annealed at 1200 ◦Cfor one hour with a heating speed of 5 ◦C/min−1 and excitedat 940 nm by infrared diode laser.
The results show that the luminescence peak appearedat the red region for the doping content of Er3+ between 1and 10 mol%, and the upconversion reached the maximum atthe doping concentration of 1 mol%. As shown in figure 7,the ratio of luminescence intensity at the red band ofZrO2:1% Er3+/ZrO2:5% Er3+/ZrO2:10% Er3+ samples is about3.8/2.8/1. The change in intensity was clearly observed bylooking at the change in red colour at the sample measuredunder laser excitation at 940 nm. Luminescence quenchingalso did not take place until the concentration of the dopingactivator Er3+ increased to 10 mol%. Thus, compared withother preparation methods, the applied preparation procedureprovides a higher threshold of luminescence quenchingconcentration of the dopant.
The curves in figure 8 are the upconversion luminescencespectra of ZrO2 nanopower co-doped with 1 mol% Er3+
and 18 mol% Yb3+ (a) with the same treatment conditionsas above. Here we have found that in the red region(640–675 nm), the integral intensities of this sample have beenincreased by 2.3, compared with that of the ZrO2:1 mol% Er3+
sample, whereas they almost disappeared in the green region.From the measurement of upconversion luminescence,
the emission process of ZrO2:Er3+ and ZrO2:(Er3+/Yb3+)
can be explained as follows. As a result of excitation at the
4
Adv. Nat. Sci.: Nanosci. Nanotechnol. 1 (2010) 025008 T K G Lam et al
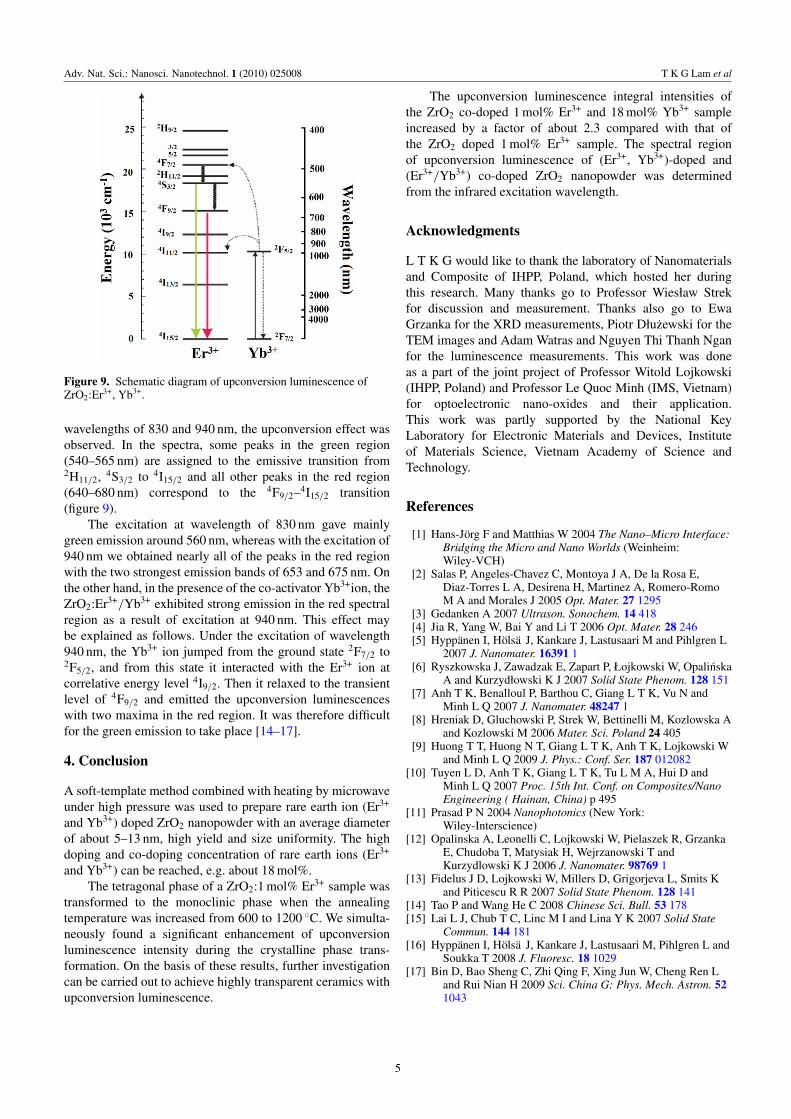
Figure 9. Schematic diagram of upconversion luminescence ofZrO2:Er3+, Yb3+.
wavelengths of 830 and 940 nm, the upconversion effect wasobserved. In the spectra, some peaks in the green region(540–565 nm) are assigned to the emissive transition from2H11/2, 4S3/2 to 4I15/2 and all other peaks in the red region(640–680 nm) correspond to the 4F9/2–4I15/2 transition(figure 9).
The excitation at wavelength of 830 nm gave mainlygreen emission around 560 nm, whereas with the excitation of940 nm we obtained nearly all of the peaks in the red regionwith the two strongest emission bands of 653 and 675 nm. Onthe other hand, in the presence of the co-activator Yb3+ion, theZrO2:Er3+/Yb3+ exhibited strong emission in the red spectralregion as a result of excitation at 940 nm. This effect maybe explained as follows. Under the excitation of wavelength940 nm, the Yb3+ ion jumped from the ground state 2F7/2 to2F5/2, and from this state it interacted with the Er3+ ion atcorrelative energy level 4I9/2. Then it relaxed to the transientlevel of 4F9/2 and emitted the upconversion luminescenceswith two maxima in the red region. It was therefore difficultfor the green emission to take place [14–17].
4. Conclusion
A soft-template method combined with heating by microwaveunder high pressure was used to prepare rare earth ion (Er3+
and Yb3+) doped ZrO2 nanopowder with an average diameterof about 5–13 nm, high yield and size uniformity. The highdoping and co-doping concentration of rare earth ions (Er3+
and Yb3+) can be reached, e.g. about 18 mol%.The tetragonal phase of a ZrO2:1 mol% Er3+ sample was
transformed to the monoclinic phase when the annealingtemperature was increased from 600 to 1200 ◦C. We simulta-neously found a significant enhancement of upconversionluminescence intensity during the crystalline phase trans-formation. On the basis of these results, further investigationcan be carried out to achieve highly transparent ceramics withupconversion luminescence.
The upconversion luminescence integral intensities ofthe ZrO2 co-doped 1 mol% Er3+ and 18 mol% Yb3+ sampleincreased by a factor of about 2.3 compared with that ofthe ZrO2 doped 1 mol% Er3+ sample. The spectral regionof upconversion luminescence of (Er3+, Yb3+)-doped and(Er3+/Yb3+) co-doped ZrO2 nanopowder was determinedfrom the infrared excitation wavelength.
Acknowledgments
L T K G would like to thank the laboratory of Nanomaterialsand Composite of IHPP, Poland, which hosted her duringthis research. Many thanks go to Professor Wiesław Strekfor discussion and measurement. Thanks also go to EwaGrzanka for the XRD measurements, Piotr Dłuzewski for theTEM images and Adam Watras and Nguyen Thi Thanh Nganfor the luminescence measurements. This work was doneas a part of the joint project of Professor Witold Lojkowski(IHPP, Poland) and Professor Le Quoc Minh (IMS, Vietnam)for optoelectronic nano-oxides and their application.This work was partly supported by the National KeyLaboratory for Electronic Materials and Devices, Instituteof Materials Science, Vietnam Academy of Science andTechnology.
References
[1] Hans-Jörg F and Matthias W 2004 The Nano–Micro Interface:Bridging the Micro and Nano Worlds (Weinheim:Wiley-VCH)
[2] Salas P, Angeles-Chavez C, Montoya J A, De la Rosa E,Diaz-Torres L A, Desirena H, Martinez A, Romero-RomoM A and Morales J 2005 Opt. Mater. 27 1295
[3] Gedanken A 2007 Ultrason. Sonochem. 14 418[4] Jia R, Yang W, Bai Y and Li T 2006 Opt. Mater. 28 246[5] Hyppänen I, Hölsä J, Kankare J, Lastusaari M and Pihlgren L
2007 J. Nanomater. 16391 1[6] Ryszkowska J, Zawadzak E, Zapart P, Łojkowski W, Opalinska
A and Kurzydłowski K J 2007 Solid State Phenom. 128 151[7] Anh T K, Benalloul P, Barthou C, Giang L T K, Vu N and
Minh L Q 2007 J. Nanomater. 48247 1[8] Hreniak D, Gluchowski P, Strek W, Bettinelli M, Kozlowska A
and Kozlowski M 2006 Mater. Sci. Poland 24 405[9] Huong T T, Huong N T, Giang L T K, Anh T K, Lojkowski W
and Minh L Q 2009 J. Phys.: Conf. Ser. 187 012082[10] Tuyen L D, Anh T K, Giang L T K, Tu L M A, Hui D and
Minh L Q 2007 Proc. 15th Int. Conf. on Composites/NanoEngineering ( Hainan, China) p 495
[11] Prasad P N 2004 Nanophotonics (New York:Wiley-Interscience)
[12] Opalinska A, Leonelli C, Lojkowski W, Pielaszek R, GrzankaE, Chudoba T, Matysiak H, Wejrzanowski T andKurzydlowski K J 2006 J. Nanomater. 98769 1
[13] Fidelus J D, Lojkowski W, Millers D, Grigorjeva L, Smits Kand Piticescu R R 2007 Solid State Phenom. 128 141
[14] Tao P and Wang He C 2008 Chinese Sci. Bull. 53 178[15] Lai L J, Chub T C, Linc M I and Lina Y K 2007 Solid State
Commun. 144 181[16] Hyppänen I, Hölsä J, Kankare J, Lastusaari M, Pihlgren L and
Soukka T 2008 J. Fluoresc. 18 1029[17] Bin D, Bao Sheng C, Zhi Qing F, Xing Jun W, Cheng Ren L
and Rui Nian H 2009 Sci. China G: Phys. Mech. Astron. 521043
5
Related Documents


