PREPARATION AND CHARACTERISATION OF CHEMICAL MANGANESE DIOXIDE: EFFECT OF THE OPERATING CONDITIONS Pagnanelli, F. a *; Sambenedetto, C. a ; Furlani, G. a ; Vegliò, F. b , Toro, L. a a Department of Chemistry, “La Sapienza” University of Rome, P.le A. Moro, 5, 00185 Roma, Italy b Dipartimento di Chimica, Ingegneria Chimica e Materiali, Università degli Studi di L’Aquila, 67040 Monteluco di Roio, L’Aquila, Italy Abstract In this study MnO 2 preparation by chemical methods is investigated for possible applications in dry cell batteries of Chemical Manganese Dioxide (CMD) instead of Electrolytic Manganese Dioxide (EMD). Three preparation procedures were tested: precipitation-oxidation by air plus acid activation (two-step-air), precipitation-oxidation by H 2 O 2 plus acid activation (two-step-H 2 O 2 ), precipitation-oxidation by KClO 3 (single-step-ClO 3 ). Replicated factorial designs and related statistical analysis of experimental data by analysis of variance were performed in order both to obtain a preliminary optimization of the operating conditions and to take into account the intrinsic sample heterogeneity associated to each specific procedure. Comparisons among three different preparations denoted that in the investigated conditions two-step preparations give larger yields of activated solid in comparison with single-step preparation. Preliminary optimized conditions denoted final solid yields (80-86%) for both two-step procedures. The effect of operating conditions on the chemical, structural and electrochemical properties of CMDs produced in preliminary optimised conditions was investigated and compared with those of a commercial EMD sample by acid and acid-reducing leaching for Mn speciation in solid phase, potentiometric titrations, X-Ray and IR spectra and cyclic voltammetry. These characterisation tests denoted the significant effect of acid activation in both preparation procedures to obtain CMD samples with high % of * Manuscript text (double-spaced)

Welcome message from author
This document is posted to help you gain knowledge. Please leave a comment to let me know what you think about it! Share it to your friends and learn new things together.
Transcript

PREPARATION AND CHARACTERISATION OF CHEMICAL MANGANESE DIOXIDE:
EFFECT OF THE OPERATING CONDITIONS
Pagnanelli, F.a*; Sambenedetto, C. a; Furlani, G. a; Vegliò, F.b, Toro, L.a
a Department of Chemistry, “La Sapienza” University of Rome, P.le A. Moro, 5, 00185 Roma, Italy
b Dipartimento di Chimica, Ingegneria Chimica e Materiali, Università degli Studi di L’Aquila,
67040 Monteluco di Roio, L’Aquila, Italy
Abstract
In this study MnO2 preparation by chemical methods is investigated for possible applications in dry
cell batteries of Chemical Manganese Dioxide (CMD) instead of Electrolytic Manganese Dioxide
(EMD). Three preparation procedures were tested: precipitation-oxidation by air plus acid
activation (two-step-air), precipitation-oxidation by H2O2 plus acid activation (two-step-H2O2),
precipitation-oxidation by KClO3 (single-step-ClO3). Replicated factorial designs and related
statistical analysis of experimental data by analysis of variance were performed in order both to
obtain a preliminary optimization of the operating conditions and to take into account the intrinsic
sample heterogeneity associated to each specific procedure. Comparisons among three different
preparations denoted that in the investigated conditions two-step preparations give larger yields of
activated solid in comparison with single-step preparation. Preliminary optimized conditions
denoted final solid yields (80-86%) for both two-step procedures. The effect of operating conditions
on the chemical, structural and electrochemical properties of CMDs produced in preliminary
optimised conditions was investigated and compared with those of a commercial EMD sample by
acid and acid-reducing leaching for Mn speciation in solid phase, potentiometric titrations, X-Ray
and IR spectra and cyclic voltammetry. These characterisation tests denoted the significant effect of
acid activation in both preparation procedures to obtain CMD samples with high % of
* Manuscript text (double-spaced)
Mn(IV)oxides. Potentiometric titrations of solid samples obtained by first and second steps denoted
that both procedures gives two CMD samples with the same acid-base properties, which in
comparison with commercial EMD present a residual dissociation in the basic pH range (similar
structure and proton insertion properties for CMDs and EMD, but different structural defects). X-
Ray and IR spectra of solid samples by first and second steps denoted highly disordered systems
and the presence of Mn2O3 in first step products and of γ-MnO2 in second step product.
Voltammetric cycles denoted that CMD samples obtained after acid digestion present similar peaks
than commercial EMD but with higher current intensity.
Keywords: Chemical Manganese Dioxide, factorial designs, solid characterisation.
* Corresponding author: e-mail: [email protected]; Fax: +39 06 490631

1. INTRODUCTION
1.1 Applications and productions of manganese dioxides
Synthetic manganese dioxides found application in different production fields. From a commercial
point of view the most important Mn dioxides are those that are electrochemically active and
therefore used in dry cell batteries. Another commercial form is used in the manufacture of high-
purity manganese oxides as ferrites and thermistors for the electronic industry. Manganese dioxides
have been also increasingly used as oxidation catalysts, especially for air pollution abetment
(removal of volatile organics, destruction of ozone).
Synthetic manganese dioxides can be prepared for different specific end uses either by chemical
procedures (chemical manganese dioxide, CMD) or by electrochemical methods (electrolytic
manganese dioxide, EMD) starting from Mn salts or solutions (leach liquors) or thermal activated
products of natural ores.
Chemical manganese dioxide for dry cell batteries can be produced by heating MnCO3 (with air at
320 °C), obtaining a higher manganese dioxide (approximate composition MnO1.85) and completing
oxidation by treatment with NaClO3 in presence of sulphuric acid (Sedema process). Other methods
for the preparation of active manganese dioxide involve the oxidation of Mn(II) salts by using
different oxidants such as KMnO4, NaClO3 and O3 [1].
Electrolytic manganese dioxide can be produced by purified manganese sulphate solutions,
acidified by H2SO4 and subjected to electrolysis at 90-98°C. By this way MnO2 is deposited (14-20
days) as a solid coating on the anode with yields ranging from 70 to >90%. Nowadays this
technology is generally employed for synthetic manganese dioxide used in the manufacture of dry
cells and electronic materials such as ferrites. Nevertheless the need for simple production
equipments and low energy and time consuming processes re-directs the attention also towards the
optimisation of other chemical productions [1-5] also taking into account the constant increase of
oil cost and that the production of primary alkaline cell batteries requires up to 10 times energy
consumption of the expected energy output [1]. In this contest the optimisation of the operating
conditions in CMD production should be strictly related to the product characterisation because
even slight changes in the synthesis conditions can lead to manganese dioxide samples with
different electrochemical properties [1,3]. This aspect is strictly related to the complexity of
discharge mechanisms in dry cell batteries and also to the rich variety of allotropic polymorphs of
MnO2.
1.2 Electrochemical behaviour and mineral structure
The mechanism of MnO2 discharge in alkaline electrolytes involves the insertion of an electron
from the external circuit to reduce Mn4+ to Mn3+. For charge electroneutrality, protons formed by
water decomposition at the solid/electrolyte interface are also inserted in the structure. Electrons
and protons diffuse under the gradient between the surface and the bulk through the tunnels of the
crystallographic matrix by hopping between adjacent sites (oxygen ions for protons and Mn4+ ions
for electron). This first electron homogeneous reduction continues until all Mn4+ is consumed, and
then Mn3+ species (MnOOH) were reduced heterogeneously (dissolution of solid MnOOH to
[Mn(OH)6]3-, heterogeneous reduction to less soluble [Mn(OH)6]4-, and final precipitation of
Mn(OH)2 [6,7]:
γ-MnO2 + H2O + e- MnOOH + OH- (1)
MnOOH + H2O + e- Mn(OH)2 + OH- (2)
According to this mechanism, the electrochemical activity of manganese dioxide is especially
connected to the crystal structure, the chemical purity and in particular to the cationic mobility in
the structure itself (being the proton diffusion the rate limiting step of the previously described
process) [6,7]. Allotropic polymorphs of MnO2 differ in the distribution of Mn ions in the
interstices of a more or less closed-packed network of oxygen atoms. More than 20 predominantly
Mn(IV) oxide phases have been recognise as mineral species [8]. Among these γ-MnO2 is
commonly used as cathodic material for primary cell batteries. This specific allotropic phase can be
described as hexagonal closed packed array of oxide anions, in which half of the octahedral sites are
selectively filled with Mn(IV) ions.
Different models have been proposed in the literature to describe the structure of γ-MnO2 in relation
to the solid electroactivity. After studying X-ray diffraction patterns, De Wolff [9] described γ-
MnO2 structure as a random intergrowth of pyrolusite layers in a ramsdellite matrix. The
introduction of pyrolusite domains into ramsdellite matrix generates two kinds of tunnels in the γ-
MnO2 structure: [1x1] tunnels in pyrolusite domains and [1x2] tunnels in ramsdellite domains.
Structural studies and related models indicated that, within the range of useful potential for MnO2
reduction, protons diffuse mainly along [1x2] tunnels in the ramsdellite domain.
Electroactivity related to ramsdellite was also modelled by Ruetschi [10] introducing a cation
vacancy model which assumes non stoichiometry only in the cationic lattice of ramsdellite domains
(such as Mn4+ vacancies and Mn4+ cations replaced by Mn3+ cations). For charge balance, Mn4+
vacancies result in structural water and in the presence of an initial proton concentration making
ramsdellite electrochemically more active than pyrolusite [11].
The electrochemical behaviour of γ-MnO2 was also successfully correlated to the mineral structure
by introducing two structural defects in an idealised ramsdellite host phase. The first is based on
the De Wolff disorder model and is related to the percent pyrolusite amount (Pr). The second defect
is microtwinning (Tw), packaging faults which does not modify the oxygen sub-lattice and
corresponds to simple change in the distribution of Mn4+/vacancies within the octahedral voids of
the anionic network [12]. These authors denoted possible relations between microtwinning and
Mn4+ vacancies: microtwinning generates new local environments for manganese atoms located in
the twinning plane. This arrangement with more short Mn4+-Mn4+ distances is expected to be less
stable than regular geometry being a likely site for cationic defects.
The relative amounts of pyrolusite intergrowth can be determined from X-ray diffractograms
measuring the position of the orthorhombic peak (110 line) in comparison with the calculated
values (a shift to higher angle corresponds to higher Pr) [12,13].

Microtwinning defects can be denoted by the difference between the positions of 121/140 and
221/240 lines of ramsdellite: a narrowing of the distance between these couples of lines means an
increase of Tw [12,14,15].
γ-MnO2 samples can be then classified according to Pr and Tw showing that the most promising
cathode materials are those with minimum Pr and maximum Tw [15] in comparison with
commercial EMD, which are characterised by Pr≅ 50 and Tw>50 [12].
1.3 Aim of the work
The aim of this study is investigating the effect of operating conditions on the electrochemical
properties of chemical manganese dioxides for possible applications in dry cell batteries. Despite
similar works reported in the literature [1-4], the effect of preparation conditions was studied by
performing replicated full factorial designs, choosing the better operating conditions by statistical
analysis accounting for sample variability observed even in controlled conditions. On the base of
preliminary data reported in the literature, three preparation procedures were tested: precipitation-
oxidation by air plus acid activation, precipitation-oxidation by H2O2 plus acid activation,
precipitation-oxidation by KClO3. Solid samples (before and after acid activation) were
characterised by X-Ray and IR to identify the operative conditions in which electroactive γ-MnO2 is
produced in larger amounts. Potentiometric titrations and voltammetric tests were performed to
denote possible correlations among surface groups, structural phase and electroactivity of the
produced samples.
2. MATERIALS AND METHODS
2.1 Preparation procedures
Chemical manganese dioxide was prepared according to three procedures:
- Two-step-air preparation
- Two-step-H2O2 preparation
- One-step-NaClO3 preparation

Two-step procedures consisted of a first step precipitation in oxidising conditions giving a mixed
oxide precipitate, which is subjected to a second step activation in hot acid medium. One-step
procedure consisted only of a single precipitation step in hot acidic conditions.
Experimental procedures adopted for these preparations were detailed in sections 2.1.1, 2.1.2 and
2.1.3. Specific operating conditions of preliminary tests and factorial designs were reported in Table
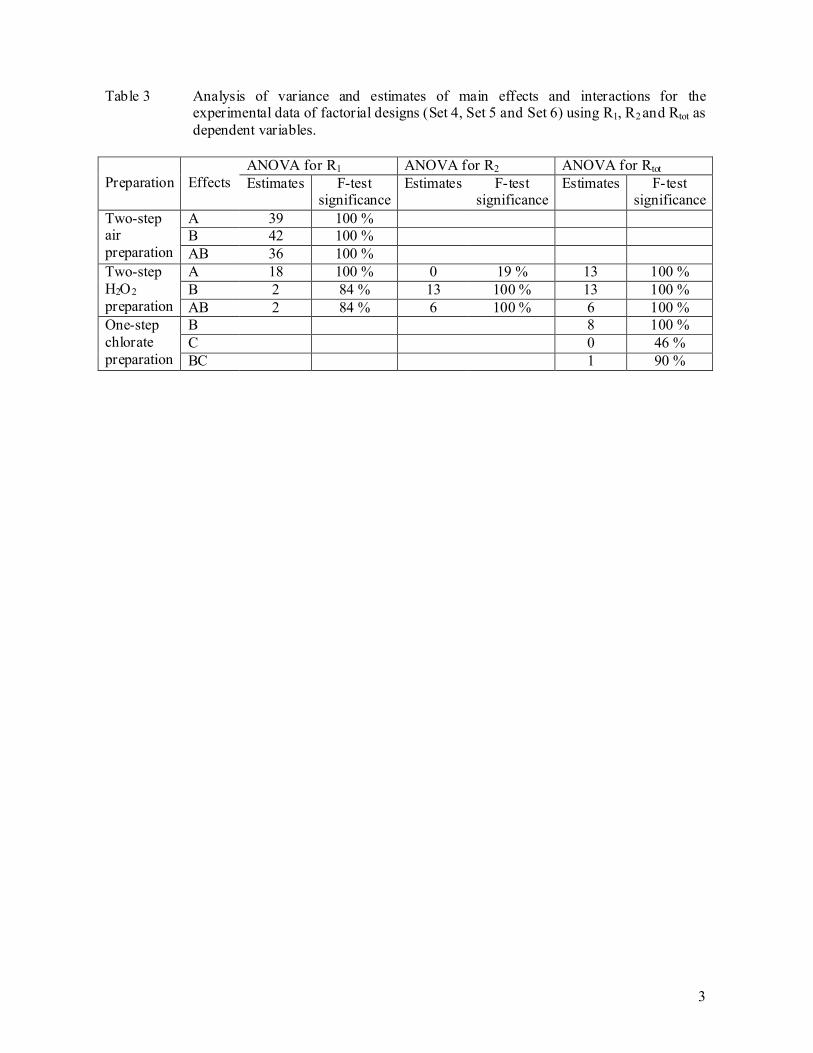
1 and Table 2, respectively. The estimates of the main effect and interactions investigated in
factorial designs, along with their significance were evaluated by analysis of variance (ANOVA)
(Table 3) [16].
2.1.1 Two-step-air preparation
150 ml samples of a MnNO3 solution (1.67 M) were used for two-step-air preparation. Each
solution was kept at the selected level of pH conditions by manual additions of NaOH (1 and 5 M).
Precipitation (I step) was performed under air flux (except as differently specified for Set 1 in Table
1) at 25°C under magnetic stirring for two hours. The solid was separated by centrifugation (10
minutes at 10000 rpm) and dried in a oven at 70°C for 48 hours. Initial (C0) and final (CI)
concentrations of Mn in the liquid phase were measured by an Inductively Coupled Plasma
Spectrophotometer (ICP) to evaluate the solid yield of this first step:
100VC
VCVCR00
II00
1 ⋅−
= (3)
where V0 and VI are the initial and final volumes of the solution.
The solid was activated (II step) by using 1 M HNO3 (2 g of solid in 100 ml) at 90°C under stirring
for 1 hour. After the activation the solid was separated by centrifugation (10 minutes at 10000 rpm),
washed by distilled water to eliminate the acid excess and dried in a oven at 70 °C for 48h. The
final Mn concentration (C) in the acid medium was measured by ICP to evaluate the solid yield of
this second step
100VCVC
CVVCVCR II
00
II00
2 ⋅−
−−= (4)
where VI and V are the initial and final volume of the solution used for activation.
2.1.2 Two-step-H2O2 preparation
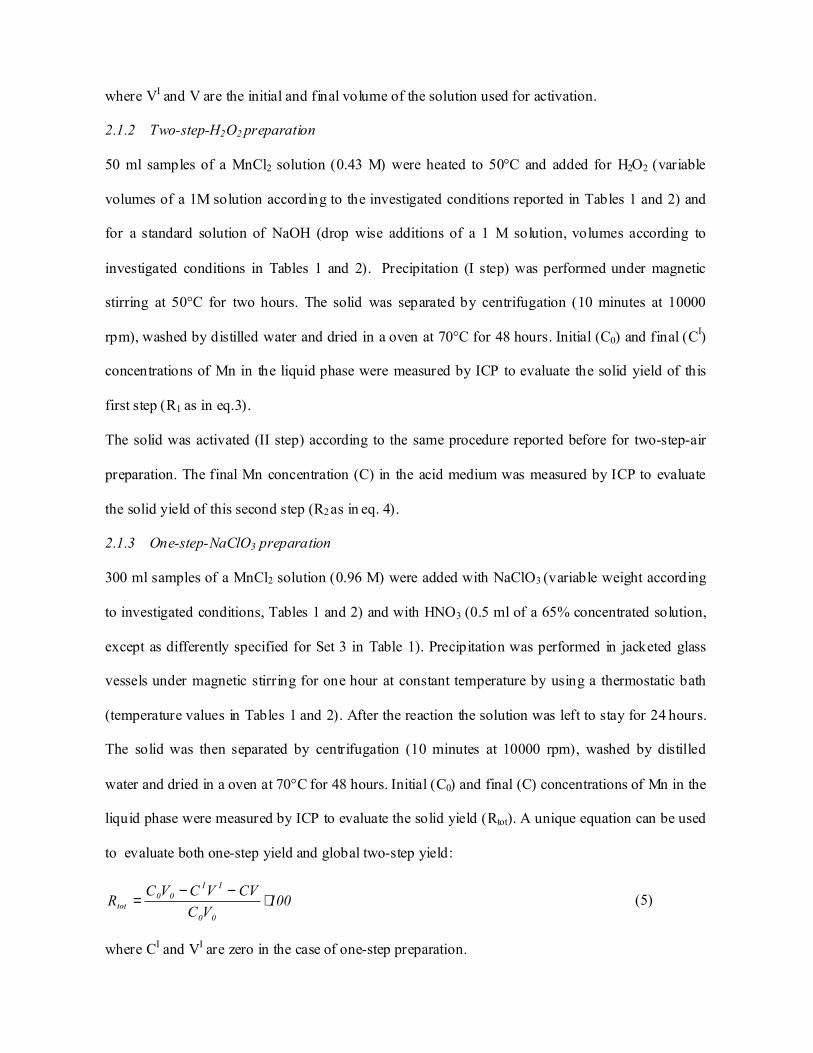
50 ml samples of a MnCl2 solution (0.43 M) were heated to 50°C and added for H2O2 (variable
volumes of a 1M solution according to the investigated conditions reported in Tables 1 and 2) and
for a standard solution of NaOH (drop wise additions of a 1 M solution, volumes according to
investigated conditions in Tables 1 and 2). Precipitation (I step) was performed under magnetic
stirring at 50°C for two hours. The solid was separated by centrifugation (10 minutes at 10000
rpm), washed by distilled water and dried in a oven at 70°C for 48 hours. Initial (C0) and final (CI)
concentrations of Mn in the liquid phase were measured by ICP to evaluate the solid yield of this
first step (R1 as in eq.3).
The solid was activated (II step) according to the same procedure reported before for two-step-air
preparation. The final Mn concentration (C) in the acid medium was measured by ICP to evaluate
the solid yield of this second step (R2 as in eq. 4).
2.1.3 One-step-NaClO3 preparation
300 ml samples of a MnCl2 solution (0.96 M) were added with NaClO3 (variable weight according
to investigated conditions, Tables 1 and 2) and with HNO3 (0.5 ml of a 65% concentrated solution,
except as differently specified for Set 3 in Table 1). Precipitation was performed in jacketed glass
vessels under magnetic stirring for one hour at constant temperature by using a thermostatic bath
(temperature values in Tables 1 and 2). After the reaction the solution was left to stay for 24 hours.
The solid was then separated by centrifugation (10 minutes at 10000 rpm), washed by distilled
water and dried in a oven at 70°C for 48 hours. Initial (C0) and final (C) concentrations of Mn in the
liquid phase were measured by ICP to evaluate the solid yield (Rtot). A unique equation can be used
to evaluate both one-step yield and global two-step yield:
100VC
CVVCVCR
00
II00
tot ⋅−−
= (5)
where CI and VI are zero in the case of one-step preparation.
2.2 Preparation
CMD samples of both two-step productions were prepared according to the previously described
procedures (paragraphs 2.1.2 and 2.1.3) using abair condition for two-step air preparation and bH2O2
for two-step H2O2 preparation (see Table 2). Different batch productions of each preparation were
performed using 250 ml of Mn(II) solutions. For each preparation procedure all the solids produced
by the first step were washed by distilled water, joined together and dried in a oven at 70 °C for 48
hours. Two pools of solid material (one for each preparation) were then obtained as representative
of the first step product (CMOair and CMOH2O2). Particle size distribution of these pool was
determined by an automatic sieve. Size-fractionated samples were used for the second step
activation and/or for the characterisation tests as described in the follow.
2.3 Characterisation tests
2.3.1 Acid leaching and acid-reducing leaching
Acid leaching for the determination of Mn(II) in solid samples was performed by using the solids
obtained from the first and second steps of both procedures. 1 g samples were suspended in 50 ml
of deionised water with 5 ml of 17N H2SO4. The suspension was thermostated at 90 °C and kept
under magnetic stirring for 12 hours. The final product was diluted to a known volume, the residual
solid (composed of Mn(IV) oxides not leached without a reducing agent) was separated by
centrifugation, and Mn concentration in solution was determined by ICP.
Acid-reducing leaching for the determination of total Mn in CMO and CMD samples was
performed as reported above for acid leaching with the only difference that also 1 g glucose was
added as reducing agent according to the following global reaction stoichiometry [17]:
C6H12O6 + 12 MnO2 + 24 H+ = 6CO2 + 12 Mn2+ + 18 H2O (6)
Final Mn concentrations (determined as in the case of acid leaching) correspond in this case to
Mn(II) plus Mn(VI).

Both acid and acid-reducing leaching were performed twice for each sample; medium values and
maximum dispersions were reported in Table 4.
2.3.2 Potentiometric titrations
Solid samples obtained from the first and second steps of both procedures and a commercial EMD
sample were potentiometrically titrated to determine their acid base properties. Two distinct
suspensions were prepared for each solid samples (0.5 g of solid with particle size between 45 and
63 µm in 30 ml of deionised water). After preliminary fluxing by N2 to remove CO2, both
suspensions obtained for each solid sample were titrated, one using 0.1 N NaOH standard solution
(positive abscissa axis in Figures 2) and the other with 0.1 N HCl standard solution (negative
abscissa axis in Figures 2). After each addition of titrant (NaOH or HNO3) the pH of suspension
was allowed to reach the equilibrium under magnetic stirring and then measured by a pH meter.
2.3.3 X-Ray diffraction analyses
Solid samples obtained from the first and second steps of both procedures (size fractionated samples
45-63 µm) and a commercial EMD sample (with the same particle range) were analysed by X-Ray
diffraction.
2.3.4 IR spectroscopic analyses
IR spectra were performed by using KBr as transparent component for the dilution of solid samples
produced by first and second steps of both procedures. Manganese oxide-bearing disk of KBr were
prepared by two successive dilutions: 0.002 g samples of each solid (size fractionated samples 45-
63 µm) were mixed with 0.3 g of KBr; 0.03 g of this mixture were diluted again with other 0.3 g of
KBr. 0.15 g samples of this second mixture were pressed and used for disk preparation. The signals
of CO2 and aqueous vapour in the air and possible impurities of KBr were subtracted from all the
spectra by collecting a background spectrum. Eight scansions between 400 and 4000 cm-1 were
performed for each spectrum.
2.3.5 Cyclic voltammetry
Charge and discharge processes of commercial EMD and of solid samples from the first and
second steps of both procedures were characterised by cyclic voltammetry by using a polarograph
with two Zn electrodes (reference and auxiliary) in 0.1M ZnSO4 alkaline solution (0.1M KOH). The
working electrode was prepared by mixing the solid sample to be tested (45-63 µm) with graphite
and polyvinyl fluoride with the following proportion in weight 8:2:2 (weight of EMD and CMD
samples used for electrode preparation 0.080±0.05 g). The mixture obtained was pressed over a
platinum disk electrode [18]. Potential scansions during voltammetric cycles were performed in the
range 1,7V - 0,8V at a speed of 2mV/sec.
3. RESULTS AND DISCUSSION
3.1 Preliminary tests
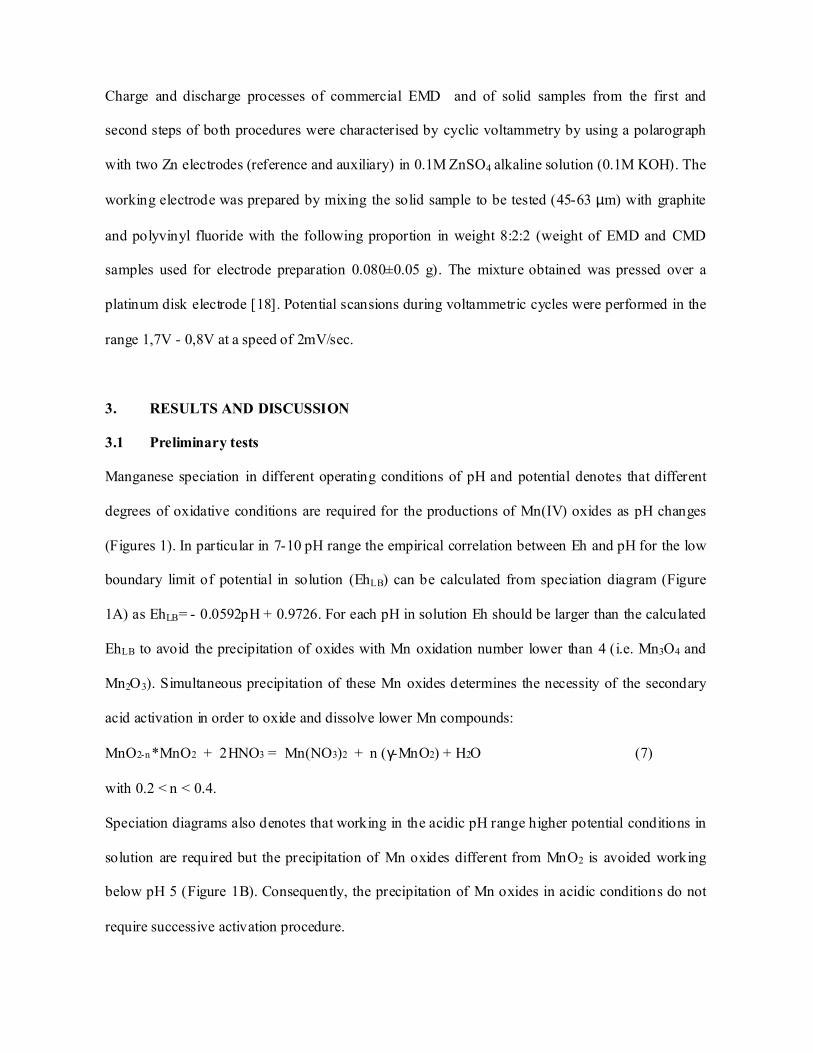
Manganese speciation in different operating conditions of pH and potential denotes that different
degrees of oxidative conditions are required for the productions of Mn(IV) oxides as pH changes
(Figures 1). In particular in 7-10 pH range the empirical correlation between Eh and pH for the low
boundary limit of potential in solution (EhLB) can be calculated from speciation diagram (Figure
1A) as EhLB= - 0.0592pH + 0.9726. For each pH in solution Eh should be larger than the calculated
EhLB to avoid the precipitation of oxides with Mn oxidation number lower than 4 (i.e. Mn3O4 and
Mn2O3). Simultaneous precipitation of these Mn oxides determines the necessity of the secondary
acid activation in order to oxide and dissolve lower Mn compounds:
MnO2-n *MnO2 + 2HNO3 = Mn(NO3)2 + n (γ-MnO2) + H2O (7)
with 0.2 < n < 0.4.
Speciation diagrams also denotes that working in the acidic pH range higher potential conditions in
solution are required but the precipitation of Mn oxides different from MnO2 is avoided working
below pH 5 (Figure 1B). Consequently, the precipitation of Mn oxides in acidic conditions do not
require successive activation procedure.

The analysis of these speciation diagrams suggests two main operative possibilities for increasing
MnO2 yields during precipitation from Mn(II) solutions:
- using high potential conditions in alkaline pH range to reduce the precipitation of less
oxidised Mn oxides;
- working in acidic conditions with strong oxidants to avoid the following acid activation.
MnO2 precipitation in alkaline conditions reported in the literature [2] does not account for possible
variation of potential conditions in order to increase Mn oxidation state in the solid. In this paper the
precipitation of Mn is performed in improved oxidative conditions by forced aeration and addition
of H2O2.
3.1.1 Two-step-air preparation
A preliminary validation of the advantages of aeration during precipitation was found by
performing Mn precipitation in conditions similar to those reported in the literature [2] with and
without aeration (Set 1 tests in Table 1). In this case the aeration determines a significant increase of
the yield of the first step, R1 (eq. 3). In particular without aeration R1 is 3% and with aeration
becomes 75%.
The confirmation of the effective increase of Mn oxidation state in the solid obtained with aeration
is given by the yield after second step of activation (R2). In fact the precipitated obtained with
aeration was only partially dissolved during acid activation (R2=69%) denoting a high percentage of
MnO2, which necessitates a reducing agent to be dissolved.
According to these preliminary results, the following factorial design aims to optimise this two-step
production with particular attention to the effect of pH and aeration (Set 4 in Table 2). The
temperature during the first step was kept constant at 25°C according to the literature results
showing that the oxidation degree of precipitated Mn oxides conditions is inversely proportional to
the rate of precipitation which decreases lowering the temperature [2] (Table 1).
3.1.2 Two-step-H2O2 preparation

Preliminary tests were performed to evaluate possible applications of H2O2 (Set 2 tests in Table 1).
These tests denoted the positive effect of increasing H2O2/Mn ratio with R1 changing from 49 to
85% and with similar values for the second step (50-60%).
According to these preliminary results, the following experimental design aims to optimise this
two-step production with particular attention to the effect of pH and oxidant concentration (Set 5 in
Table 2), while the temperature during the first step precipitation was chosen at 50° C according to
the literature [4] (Table 1).
3.1.3 One-step-NaClO3 preparation
CMD in acidic conditions by a single step precipitation was attempted by using sodium chlorate as
oxidant agent in solution according to literature data [3], which denoted that sodium salt gave better
results for γ-MnO2 production with respect to KClO3. Using the experimental conditions analogous
to those reported in the literature (Set 3 tests in Table 1) a strong effect of pH was observed on the
solid yield (Rtot). Single step production yield is 40% for pH 2 and 17% for pH=0, lower than the
overall yields of the two-step procedures (77 and 66-76% by using aeration and H2O2, respectively).
According to these preliminary results, the following factorial design aims to optimise the single-
step production with particular attention to the effect of the temperature and oxidant concentration
(Set 6 in Table 2) on the chemical and electrochemical characteristics of the Mn oxides produced.
In this case the effect of temperature was also considered aiming to reduce both energy
consumption and the rate of gas dispersion generated by chlorate reduction. pH was kept at 0
according to preliminary data showing a strong reduction of solid yield for pH raising from 0 to 2.
3.2 Factorial designs
3.2.1 Two-step-air preparation
Experimental data from replicated factorial design for Mn oxides precipitation (set 4 in Table 2)
clearly show the synergic effect of pH and aeration on the solid yield (R1) for the first step of air-
based procedure.

Statistical significance for each main factor and interaction confirm this obvious results showing the
100% significance for F-tests related to mean square estimates of ANOVA (Table 3). This finding
is in agreement with Mn speciation reported in Figure 1A showing that Mn oxide precipitation
prevails for simultaneous basic pH and oxidative conditions. Even though all main factors and
interaction are significant (their change from lower to higher level causes a significant yield
increase), only ab conditions allow semi-quantitative Mn precipitation.
Second step activation was performed only for abair and ab’air samples neglecting the other samples
because of the very low yield not suggesting practical applications for those conditions. The high
yields associated with acid activation mean that the quite totality of Mn oxides precipitated in the
first step were already mainly made up of Mn(IV) oxides, not dissolved during acid treatment (see
also characterisation by acid leaching and acid-reducing leaching, 3.4.1).
At this stage abair combination was then chosen in the following preparation of CMD samples for
two-step-air procedure.
3.2.2 Two-step-H2O2 preparation
Experimental data from replicated factorial design for Mn oxides precipitation with H2O2 (set 5 in
Table 2) show that quantitative solid yields can be obtained for aH2O2 and abH2O2 conditions.
ANOVA confirms that factor A (pH) is the only factor whose change in the investigated range
causes a significant increase of the yield R1 . Nevertheless not only solid yield but also solid
characteristics should be evaluated for the optimisation of operating conditions. In particular the
colour of the solid samples obtained by this procedure in the different conditions can be a clearly
hint of the chemical composition of the solids. In fact pure Mn(IV) oxides are dark black coloured,
while light brown-reddish samples are generally characterised by hydrated oxides with oxidation
number lower than 4. The colour of the samples obtained from first step of Set 5 tests were light
brown for 1H2O2 and aH2O2 conditions, dark brown for bH2O2 and reddish for abH2O2. This means that
the conditions giving the largest yield of solid (aH2O2 and abH2O2) are not the same characterised by
the darkest solid (bH2O2). The choice of the best conditions for this procedure was then also based on

the results of the second step activation. The largest yields R2 associated to bH2O2 condition
confirmed the chromatic hint from first step solids. ANOVA confirms this result showing that only
B main effect factor and AB interaction are significative (F-test significance larger than 95%).
According to these finding bH2O2 condition was chosen for CMD preparation by two-step-H2O2
procedure.
3.2.3 One-step-NaClO3 preparation
Experimental data from replicated factorial design for CMD preparation with NaClO3 (set 6 in
Table 2) show that very low solid yields were obtained in all the investigated conditions. Even
though the solids produced in bClO3, cClO3 and bcClO3 conditions are dark black and ANOVA results
suggest possible yield improvement by increasing ClO3 concentration (B is the only significant
factor for set 6 tests), the advantages of using a single step procedure instead of two-step ones seem
not to be sufficient to continue experiments with chlorate, also considering the environmental
concerns related to this reagent. For this reasons single-step-chlorate procedure was not used in the
following preparation and characterisation phases of CMD.
3.3 Preparation of CMD samples
CMD samples were prepared according to abair condition for two-step air preparation and bH2O2 for
two-step H2O2 preparation (Table 2). It is noteworthy remembering that the solids obtained by
different batches of each procedure were joined together to obtain a pool of material representative
not only of the specific procedure, but also of the intrinsic variability associated to each preparation
procedure. Solid samples obtained from the first steps (generic Chemical Manganese Oxides,
CMOair and CMOH2O2) and the second steps (Chemical Manganese Dioxides CMDair and CMDH2O2)
of both procedures were characterised in the follow according to different experimental tests in
order to evaluate their characteristics and performances in comparison with commercial sample of
EMD.
3.4 Characterisation of CMD samples

3.4.1 Mn speciation in the solid samples by acid and acid-reducing leaching
Solid samples obtained from the first and second steps of both procedures were leached in acid
medium with and without glucose to determine total manganese amount (MnTOT) and its speciation
as Mn(IV) and Mn(II). The amount of Mn(IV) can be obtained as the difference between the total
manganese extracted by acid-reducing leaching and Mn(II) dissolved by acid leaching (Mn(IV) can
not be dissolved without a reducing agent).
Percent compositions of manganese as total and Mn(IV) for the four CMD samples were reported in
Table 4. Experimental data denoted the significant effect of acid activation in both procedures in
order to augment final percent of Mn(IV) in solid samples.
3.4.2 Surface acidity by potentiometric titrations
Surface characterisation by potentiometric titration have been considered to investigate and to
enhance the rate of charge-transfer process at the solid/electrolyte interface. In fact taking into
account that proton diffusion is the rate limiting step of the previously described discharge process,
knowledge of acid surface properties and correlation with bulk crystal structure and electroactivity
can guide the optimisation of the preparation procedures. Metal oxides as manganese dioxides in
presence of water tend to form surface hydroxyl groups with acid and basic properties (dissociative
chemisorption) [6,19] and different degree of polarization depending on different factors such as
metal ion coordination and metal-oxygen bond length [20].
Experimental results of potentiometric titrations of the solid samples obtained by first step (CMOair)
and second step (CMDair) of air-based preparation and by first step (CMOH2O2) and second step
(CMDH2O2) of H2O2-based preparation were reported in Figures 2A and 2B, respectively. The effect
of activation on the acidic properties of the surface functional groups was analysed using EMD
titration as a standard reference of final desired characteristics. In particular EMD titration does not
denote distinct flex points resembling sites dissociation, meaning that in the investigated range of
pH this test can not reveal significant dissociation reactions (continuous line in figures 2). On the
other side considering the samples of CMD produced, this characterisation test denoted the
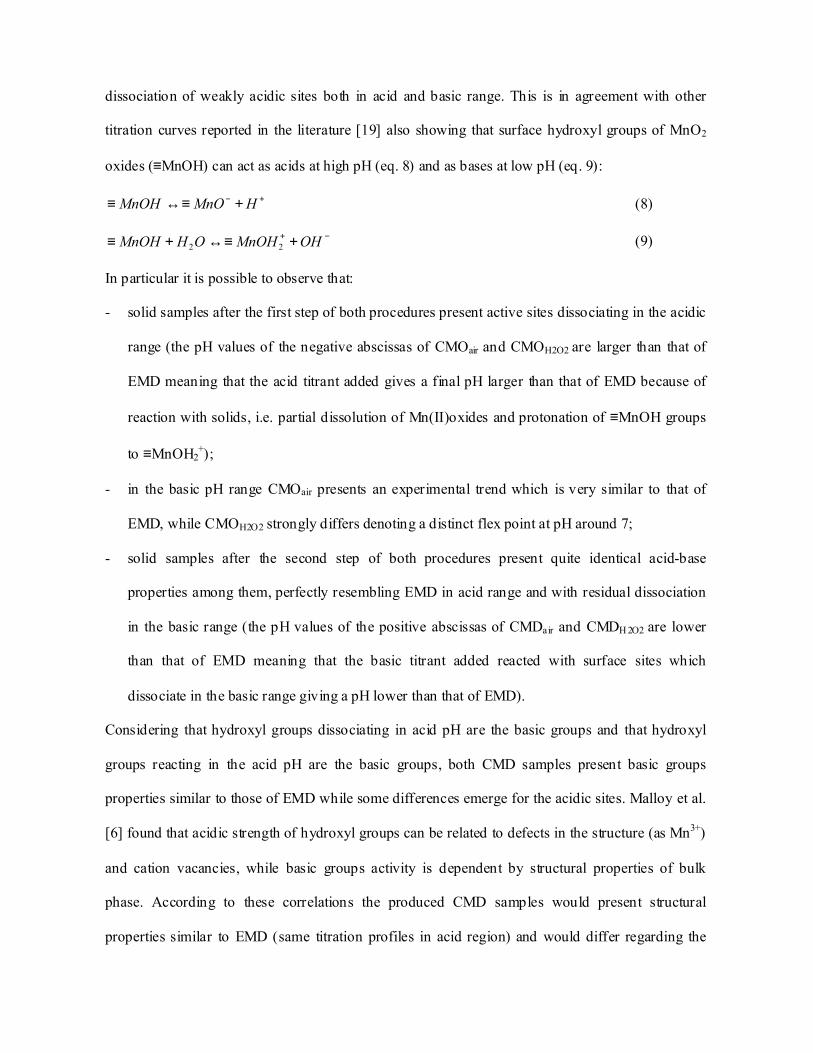
dissociation of weakly acidic sites both in acid and basic range. This is in agreement with other
titration curves reported in the literature [19] also showing that surface hydroxyl groups of MnO2
oxides (≡MnOH) can act as acids at high pH (eq. 8) and as bases at low pH (eq. 9):
+− +↔≡≡ HMnOMnOH (8)
−+ +↔≡+≡ OHMnOHOHMnOH 22 (9)
In particular it is possible to observe that:
- solid samples after the first step of both procedures present active sites dissociating in the acidic
range (the pH values of the negative abscissas of CMOair and CMOH2O2 are larger than that of
EMD meaning that the acid titrant added gives a final pH larger than that of EMD because of
reaction with solids, i.e. partial dissolution of Mn(II)oxides and protonation of ≡MnOH groups
to ≡MnOH2+);
- in the basic pH range CMOair presents an experimental trend which is very similar to that of
EMD, while CMOH2O2 strongly differs denoting a distinct flex point at pH around 7;
- solid samples after the second step of both procedures present quite identical acid-base
properties among them, perfectly resembling EMD in acid range and with residual dissociation
in the basic range (the pH values of the positive abscissas of CMDair and CMDH 2O2 are lower
than that of EMD meaning that the basic titrant added reacted with surface sites which
dissociate in the basic range giving a pH lower than that of EMD).
Considering that hydroxyl groups dissociating in acid pH are the basic groups and that hydroxyl
groups reacting in the acid pH are the basic groups, both CMD samples present basic groups
properties similar to those of EMD while some differences emerge for the acidic sites. Malloy et al.
[6] found that acidic strength of hydroxyl groups can be related to defects in the structure (as Mn3+)
and cation vacancies, while basic groups activity is dependent by structural properties of bulk
phase. According to these correlations the produced CMD samples would present structural
properties similar to EMD (same titration profiles in acid region) and would differ regarding the

defects of such structure (different titration profiles in basic region). Nevertheless Malloy et al. [6]
also found that in alkaline conditions proton insertion mainly occurs by the action of basic hydroxyl
groups which present similar properties for EMD and CMD samples. These preliminary observation
about structural and electrochemical properties are further addressed by other tests of
characterisation reported in the follow.
3.4.3 X-Ray diffractograms
X-Ray analyses denoted highly disordered structures for the solids obtained from the first and
second steps of both procedures. In particular CMOair and CMOH2O2 diffractograms (data not
reported here) do not present the typical signals of γ-MnO2, but are characterised by some
similarities with other Mn oxides classified in the literature as Mn2O3 [13]. Both activated samples
(CMDair and CMDH2O2) present the characteristic peaks of γ-MnO2 for (110), (021), (121/140) and
(221/240) lines [7,14] (Figure 3). In particular the wide shape of (110) line peak and its shifting
towards high angles (up to 25° against a calculated value of 22° (Qu, 2004)) denoted high pyrolusite
amounts. In addition both lines (121/140) and (221/240) are single peaks confirming the high
structural disorder associated with microtwinning defects [14,21].
3.4.4 IR spectra
Considering that X-Ray powder diffraction analysis of γ-MnO2 are characterised by poor quality
and a number of sharp and broad peaks over a diffuse background noise, IR spectroscopy analysis
can be an alternative or a supplement to X-Ray being sensitive also to amorphous components and
to the structural environment of the hydrous components, which can be diagnostic for a specific
mineral phase of MnO2 [8]. IR of manganese dioxides can denote the presence of OH groups and
H2O as bound water in the mineral structure (adsorption around 3400 and 1620 cm-1), while the
bands in the region 1000-400 cm-1 reveal information about MnO6 octahedra. In particular OH
bending vibration at 1620 cm-1 was considered characteristic of the structural water in ramsdellite

domains of γ-MnO2 and distortions in MnO6 octaedra (and the associated partial amorphisation
typical of highly performing samples) could be recognised in the 1000-400 cm-1 region in
comparison with natural nsutite samples [8,22].
IR spectra of the solids obtained from the first and second steps of both procedures present intense
peaks at 3430 and 1634 cm-1 related to OH stretching and bending, respectively.
IR spectra of CMOair and CMOH2O2 samples were both characterised by distinct peaks at 525 and
630 cm-1 due to different valence of Mn in the solid structure [22] in accordance with Mn2O3
identification by X-Ray. In the range 500-800 cm-1 CMDair and CMDH2O2 are characterised by large
bands considered as characteristics of γ-MnO2 [2].
The intense peak at 1384 cm-1 can be associated to the interaction of Mn with surrounding species
such as O, OH, H+ and K+, with larger peak intensities in CMD than in CMO related to higher
electrochemical activities [22].
3.4.5 Voltammetric cycles
Voltammetry is the most powerful tool for assessing the electrochemical activity of manganese
oxides. In particular the shape, the number and the position of the different peak resembling the
redox processes can provide additional information for material characterisation and selection of
production methods. According to two-step discharge mechanism (eq.s 1 and 2), γ-MnO2 reduction
is generally characterised by two or three cathodic peaks: in alkaline solutions the first step is
observed in the range between 200 and -350 mV (multiple signals), and the second step between -
350 and -850 mV by using Hg/HgO/9N KOH as reference electrode [13,18,23-27].
Cyclic voltammetry was then chosen for the preliminary electrochemical characterisation of CMD
samples in comparison with commercial EMD. In figure 5A the first, the fifth and the tenth cycle
obtained for EMD were reported. The shape of the cycle is strongly dependent on the number of
cycle. The current intensity of each cycle peak diminishes during the test probably because of
significant loss of material due to Mn(III) dissolution, but also for the formation of heteroalite
(ZnMn2O4) not as easily discharged as MnOOH and thus increasing cell impedance [28]. The

discharge process is characterised by a wide peak ranging from 900 to 1200 mV being the
composition of two distinct peaks with the high-voltage component becoming less intense with
respect to the low-voltage, as cycling goes on. This behaviour has been already observed for
manganese dioxide samples [18,27] and can be explained by assuming that the two peaks around
1200 and 1000 mV are related to the two reduction steps of MnO2 (eq.s 1-2). These peaks have
been observed in a wide range of potential values also depending on the analytical technique used
for voltammetric characterisation. Using similar experimental equipments (abrasive stripping
voltammetry) with Hg/HgO/9N KOH reference electrode I step is generally observed between 0
and -200mV and the II step between -200 and -400 mV [18,27]. Considering an approximate
equivalence of -400 mV versus Hg/HgO/9N KOH reference electrode to 1000 mV of an alkaline
Zn-MnO2 cell [13] the peak observed at 1000 mV in our system (resembling cell components)
corresponds to -400 mV peak obtained with Hg/HgO electrode and then to the II step, and
analogously the peak at 1200 corresponds to that at -200 vs. Hg/HgO and then to the I step. This
association even if coming from approximate assumptions seems to be quite reasonable and also in
accordance with the inversion of intensity of the two peaks observed during cycling. This finding
was already observed during abrasive stripping voltammetry of MnO2 samples and can be explained
by taking into account the specific electrode preparation technique [18,27]. In fact using
compressed assembly of CMD particles enhances the diffusion of dissolved [Mn(OH)6]3- favouring
the II step reduction in comparison with composites electrodes.
Figures 5B and 5C report voltammetric cycles for activated CMD samples obtained from
preliminarily optimised preparation conditions using air and H2O2 as oxidants (CMDair and
CMDH2O 2). Voltammetric cycles on the same samples before acid treatment (experimental data not
reported here) do not show any distinct peak confirming the importance of the second activation
step for CMD electrochemical properties. CMD samples present a strong variability during cycling
with the I reduction process ranging from 1550 to 1300 mV and the II reduction process from 1080
to 920 mV. Some oxidation signals are also observable for CMDs around 1500-1600 mV. As in the
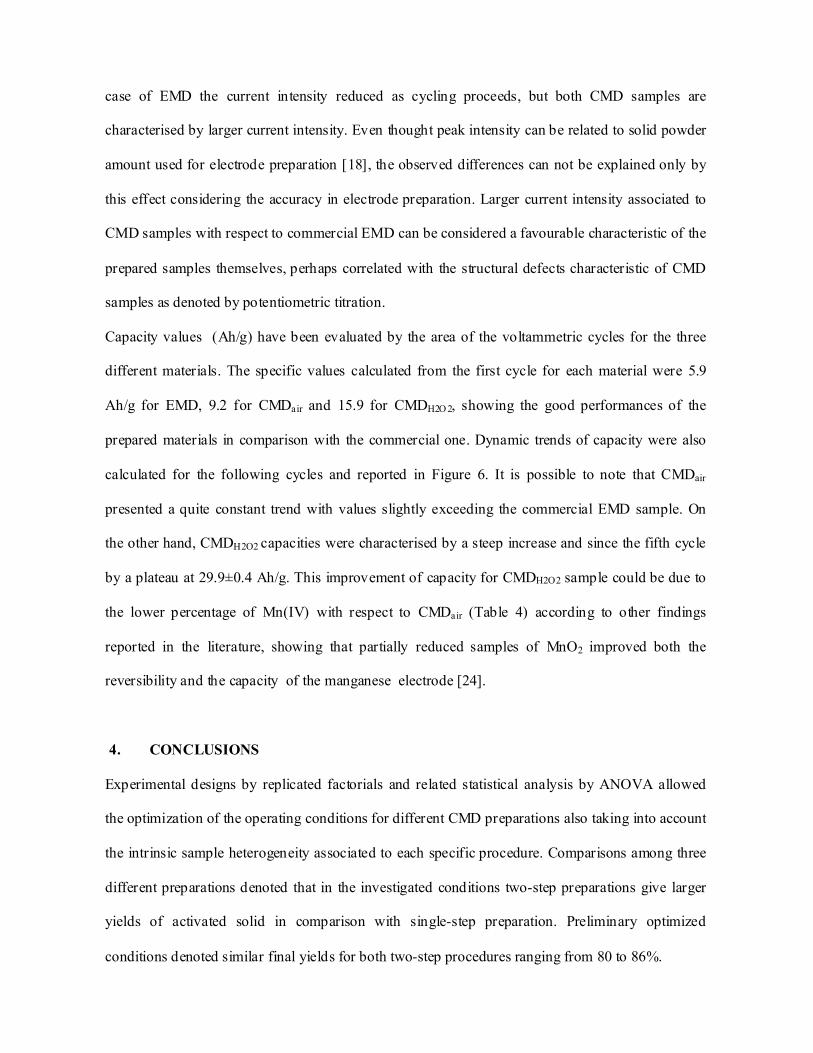
case of EMD the current intensity reduced as cycling proceeds, but both CMD samples are
characterised by larger current intensity. Even thought peak intensity can be related to solid powder
amount used for electrode preparation [18], the observed differences can not be explained only by
this effect considering the accuracy in electrode preparation. Larger current intensity associated to
CMD samples with respect to commercial EMD can be considered a favourable characteristic of the
prepared samples themselves, perhaps correlated with the structural defects characteristic of CMD
samples as denoted by potentiometric titration.
Capacity values (Ah/g) have been evaluated by the area of the voltammetric cycles for the three
different materials. The specific values calculated from the first cycle for each material were 5.9
Ah/g for EMD, 9.2 for CMDair and 15.9 for CMDH2O 2, showing the good performances of the
prepared materials in comparison with the commercial one. Dynamic trends of capacity were also
calculated for the following cycles and reported in Figure 6. It is possible to note that CMDair
presented a quite constant trend with values slightly exceeding the commercial EMD sample. On
the other hand, CMDH2O2 capacities were characterised by a steep increase and since the fifth cycle
by a plateau at 29.9±0.4 Ah/g. This improvement of capacity for CMDH2O2 sample could be due to
the lower percentage of Mn(IV) with respect to CMDair (Table 4) according to other findings
reported in the literature, showing that partially reduced samples of MnO2 improved both the
reversibility and the capacity of the manganese electrode [24].
4. CONCLUSIONS
Experimental designs by replicated factorials and related statistical analysis by ANOVA allowed
the optimization of the operating conditions for different CMD preparations also taking into account
the intrinsic sample heterogeneity associated to each specific procedure. Comparisons among three
different preparations denoted that in the investigated conditions two-step preparations give larger
yields of activated solid in comparison with single-step preparation. Preliminary optimized
conditions denoted similar final yields for both two-step procedures ranging from 80 to 86%.

Main findings by characterisation tests for solid samples obtained in the chosen conditions for both
procedures can be resumed as follow:
- Mn speciation in solid phase by acid and acid-reducing leaching denoted the significant effect of
acid activation in both preparation procedures to obtain CMD samples quite completely made
up of Mn(IV)oxides.
- Potentiometric titrations of solid samples obtained by first and second steps denoted that both
procedures gives two CMD samples with the same acid-base properties, which in comparison
with commercial EMD present a residual dissociation in the basic pH range (similar structure
and proton insertion properties for CMDs and EMD, but different structural defects).
- X-Ray and IR spectra of solid samples by first and second steps denoted highly disordered
systems and the presence of Mn2O3 in CMOair and CMOH2O2 and of highly disordered γ-MnO2
in both CMDair and CMDH2O2.
- Voltammetric cycles denoted that CMD samples obtained after acid digestion present similar
peaks than commercial EMD but with higher current intensity.
The preliminary results reported in this work denoted that Mn(IV) samples obtained by chemical
oxidation in preliminary optimised conditions present similar properties of those of a commercial
EMD sample in terms of acid-base properties, chemical and structural composition and
electroactivity. This encourages further tests in order to improve product yields and characteristics
and to compare EMD and CMD processes in terms of economics and environmental impacts by
Life Cycle Assessment.
REFERENCES
[1] S.W. Donne, G.A. Lawrence, A.J. Swinkels, Materials Research Bulletin, 30 (1995) 859-
869.
[2] Y.V. Kuz’minskii, A.A. Andriiko, L.I. Nyrkova, J. Power Sources, 52 (1994) 49-53.
[3] J.B. Fernandes, B. Desai, V.N. Kamat Dalal, Electrochimica Acta 28 (1983) 309-315.

[4] K.K. Sen Gupta, B.A. Bilkins, Carbohyd. Res., 315 (1999) 70-75.
[5] L. Yuan, Z. Li, J. Sun, K. Zhang, Y. Zhous, Mater. Lett., 57 (2003) 1945-1948.
[6] A.P. Malloy, G.J. Browning, S.W. Donne, J. Colloid Interf. Sci., 285 (2005) 653-664.
[7] D. Qu, Electrochim. Acta, 49 (2004) 657-665.
[8] R.M. Potter, G.R. Rossman, Am. Mineral., 64 (1979) 1199-1218.
[9] P. M. De Wolff, Acta Cryst., 12 (1959) 341-345.
[10] P. Ruetschi, J. Electrochemical Society, 131 (1984) 2737-2744.
[11] D. Balachandran, D. Morgan, G. Ceder, A. van de Walle, J. Solid State Chem., 173 (2003)
462-475.
[12] Y. Chabre, J. Pannetier, Prog. Solid State Ch., 23 (1995) 1-130.
[13] D.K. Walanda, G.A. Lawrence, S.W. Donne, J. Power Sources, 139 (2005) 325-341.
[14] L.I. Hill, A. Verbaere, D. Guyomard, J. Power Sources, 119-121 (2003) 226-231.
[15] K.S. Abou-El-Sherbini, J. Solid State Chem., 166 (2002) 375-381.
[16] D.C. Montgomery, Design and analysis of experiments, John Wiley & Sons, 1991.
[17] M. Trifoni, F. Vegliò, G. Taglieri, L. Toro, Miner. Eng., 13 (2000) 217-221.
[18] D.A. Fiedler, J.O. Besenhard, M.H. Fooken, J. Power Sources, 69 (1997) 157-160.
[19] H. Tamura, T. Oda, M. Nagayama, R. Furuichi, J. Electrochemical Society, 136 (1989)
2782-2786.
[20] J. Westall, H. Hohl, Adv. Colloid Interfac., 12 (1980) 265-94.
[21] J.R. Hill, C.M. Freeman, M.H. Rossouw, J. Solid State Chem., 177 (2004) 165-175.
[22] M.V. Ananth, S. Pethkar, K. Dakshinaurthi, J. Power Sources, 75 (1998) 278-282.
[23] G.G. Kumar, S. Sampath, Solid State Ionics, 160 (2003) 289-300.
[24] X. Xia, C. Zhang, Z. Guo, Z. Liu, G. Walter, J. Power Sources, 109 (2002) 11-16.
[25] V.K. Nartey, L. Binder, A. Huber, J. Power Sources, 87 (2000) 205-211.

[26] W. Jantscher, L. Binder, D.A. Fiedler, R. Andreaus, K. Kordesh, J. Power Sources, 79
(1999) 9-18.
[27] D.A. Fiedler, J. Solid State Electrochemistry, 2 (1998) 315-320.
[28] D. Linden, Handbook of Batteries and Fuel Cells, 1984.
Acknowledgment
Authors are grateful to Prof. Ruggero Caminiti and Mr. Claudio Cozza for their helpful
collaboration in the experimental work.

1
Table 1 Preliminary tests: operating conditions used in the two-step preparations (air-based and H2O2-based) and one-step chlorate preparation; relative yields of single steps (R1 and R2) and overall yields (Rtot).
Preparation procedure
Literature conditions Operating conditions for preliminary tests
test [Mn(NO3)2] (M)
air pH R1 R2 Rtot
O2 (a) 1.67 no 8 3%
Two-step air preparation (Set 1)
[Mn(NO3)2] = 1M pH = 7 T=25°C [2]
O2 (b) 1.67 yes 8 75% 69% 53%
test [MnCl2] (M)
1M NaOH volume
(ml)
1M H2O2 volume
(ml)
R1 R2 Rtot
H2O2 (a) 1 5 (pH=12)
25 49% 50% 24%
Two-step H2O2 preparation (Set 2)
[MnCl2] = 0.43 M [H2O2] =0.8 M pH=? (1 g NaOH in 75ml) T=? (warmed) [4] H2O2 (b) 0.45 3
(pH=10) 25 85% 60% 51%
test [MnCl2] (M)
[NaClO3] (M)
17M HNO3 volume (ml)
Rtot
NaClO3 (a) 0.78 1.75 5 41%
One-step chlorate preparation (Set 3)
MnC l2 *4H2O = 57 g NaClO3 =69.5 g T=100°C pH=? (sufficient amount of concentrated acid nitric) N.B. volume not specified [3]
NaClO3 (b) 0.55 1.24 drops 18%
Table(s)

2
Table 2 Factorial designs: operating conditions used in the two-step preparations (air-based and H2O2-based) and one-step chlorate preparation: relative yields of single steps (R1 and R2) and overall yields (Rtot).
Preparation Factorial design Yields
A pH
B aeration
Test
R1 (%)
R2 (%)
Rtot (%)
1 air 1 7 no 1'air 1 a air 7 8 no a'air 8 b air 5 7 yes b'air 6 ab air 83 98 81
Two-step air preparation (Set 4)
8 yes ab'air 82 96 79
A Volume (ml) of 1M NaOH (pH)
B Volume (ml) of 1M H2O2
Test
R1 (%)
R2 (%)
Rtot (%)
1 H2O2 82 64 53 2.5 (7.0) (6.9)
25 1'H2O2 78 64 50 a H2O2 100 71 71 5.0 (13.2)
(12.9) 25
a' H2O2 100 69 69 b H2O2 83 83 69 2.5 (6.7)
(7.2) 75
b' H2O2 85 84 71 ab H2O2 100 78 78
Two-step H2O2 preparation (Set 5)
5.0 (13.4) (13.2)
75 ab' H2O2 100 77 77
B [ClO3] (M)
C Temperature (°C)
Test
Rtot (%)
1 ClO3 5 0.6 50 1'ClO3 4 b ClO3 15 1.5 50 b' ClO3 14 c ClO3 6 0.6 90 c' ClO3 6 bc ClO3 12
One-step chlorate preparation (Set 6)
1.5 90 bc' ClO3 14
3
Table 3 Analysis of variance and estimates of main effects and interactions for the experimental data of factorial designs (Set 4, Set 5 and Set 6) using R1, R2 and Rtot as dependent variables.
ANOVA for R1 ANOVA for R2 ANOVA for Rtot
Preparation Effects Estimates F-test
significance Estimates F-test
significance Estimates F-test
significance A 39 100 % B 42 100 %
Two-step air preparation AB 36 100 %
A 18 100 % 0 19 % 13 100 % B 2 84 % 13 100 % 13 100 %
Two-step H2O2 preparation AB 2 84 % 6 100 % 6 100 %
B 8 100 % C 0 46 %
One-step chlorate preparation BC 1 90 %

4
Table 4 Total manganese and Mn(IV) contents in solid samples obtained by first step (CMOair) and second step (CMDair) of air-based preparation and by first step (CMOH2O2) and second step (CMDH2O2) of H2O2-based preparation.
Preparation procedure Samples MnTOT (%) Mn(IV) (%) CMOair 40±2 13±6 Two-step-air preparation CMDair 52±3 97±3 CMO H2O 2 37±4 15±5 Two-step-H2O2 preparation CMD H2O 2 54±3 87±3

Figures Captions
Figure 1 Predominance diagrams Eh versus pH for manganese species in two different
solution systems: 1M Mn(NO3)2 (A) and 0.3M MnCl2 + 0.7M NaClO3 (B).
Figure 2 Potentiometric titrations of EMD and solid samples obtained by first step (CMOair)
and second step (CMDair) of air-based preparation (A) and by first step (CMO H2O2)
and second step (CMD H2O2) of H2O2-based preparation (B). (Negative part of
abscissa axes refers to acid titrant additions and positive part to basic titrant addition)
Figure 3 X-Ray spectra for solid samples obtained by second step (CMDH2O2) of H2O2-based
preparation.
Figure 4 IR spectra for solid samples obtained by first step (CMOair) and second step
(CMDair) of air-based preparation and by first step (CMOH2O2) and second step
(CMD H2O2) of H2O2-based preparation.
Figure 5 Voltammetric cycles for solid samples obtained by first step (CMOair) and second
step (CMDair) of air-based preparation and by first step (CMOH2O2) and second step
(CMDH2O2) of H2O2-based preparation (current is normalised to mass of manganese
oxides used for electrode preparation).
Figure 6. Capacity of EMD and CMDs calculated for the different voltammetric cycles.
Figure Captions

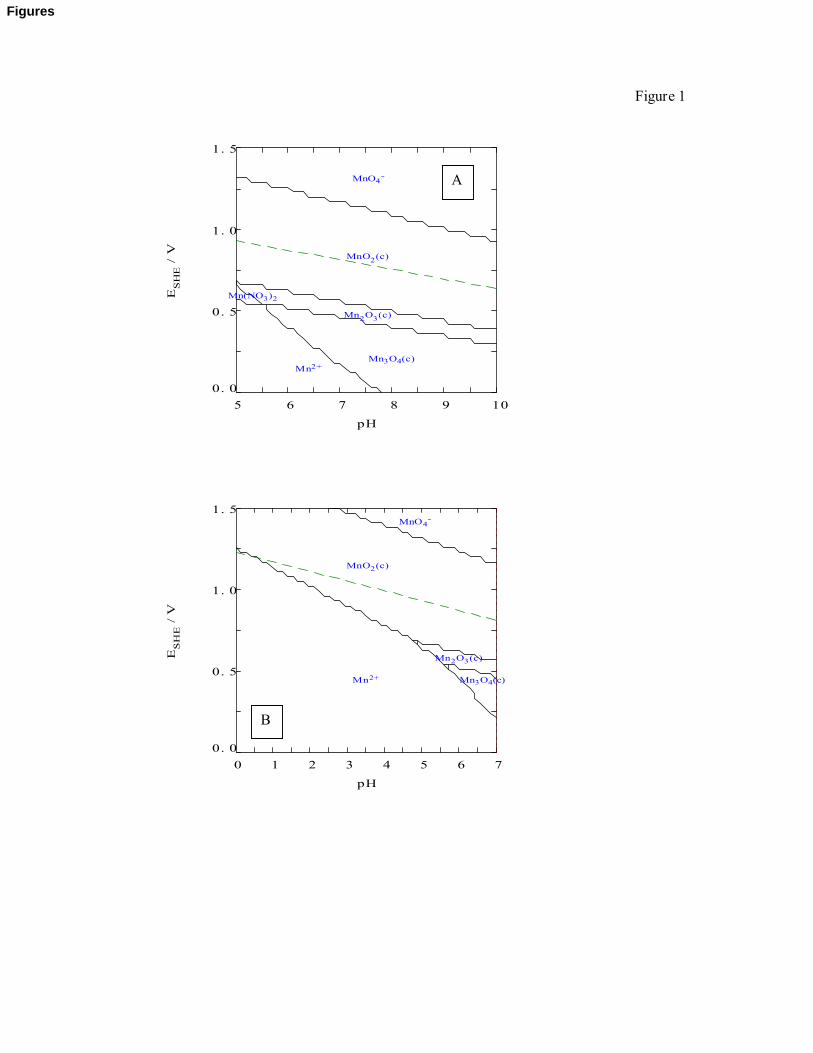
Figure 1
5 6 7 8 9 100. 0
0. 5
1. 0
1. 5
ES
HE /
V
pH
Mn2+
Mn(NO3)2
MnO4−
Mn3O4(c)
MnO2(c)
Mn2O3(c)
[Mn2+]TOT= 1.00 M [NO3−]TOT= 2.00 M
t= 25°C
0 1 2 3 4 5 6 70. 0
0. 5
1. 0
1. 5
ES
HE /
V
pH
Mn2+
MnO4−
Mn3O4(c)
MnO2(c)
Mn2O3(c)
[Mn2+]TOT= 300.00 mM [ClO3−]TOT= 700.00 mM
t= 25°C
A
B
Figures

Figure 2
0
2
4
6
8
10
12
14
-20 -10 0 10 20
Volume of titrant (ml)
pHEMDCMOairCMDair
0
2
4
6
8
10
12
14
-20 -10 0 10 20
Volume of titrant (ml)
pHEMDCMOH2O2CMDH2O2
A
B

Figure 3
(110)
(021)
(121/140) (221/240)
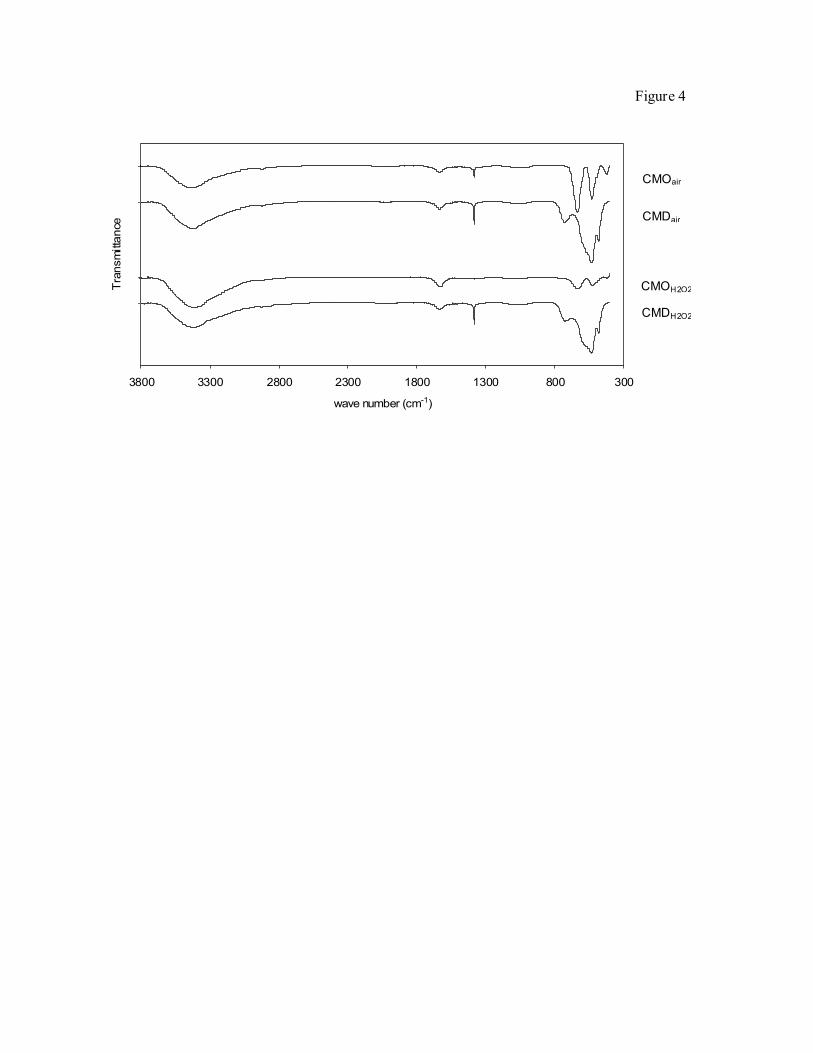
Figure 4
300800130018002300280033003800
wave number (cm-1)
Tran
smitt
ance
CMOair
CMDair
CMOH2O2
CMDH2O2

Figure 5
EMD
-120
-100
-80
-60
-40
-20
0
20
600 800 1000 1200 1400 1600 1800
Potential vs. Zn/Zn2+ (mV)
Curre
nt (A
/g).
1st cycle5th cycle10th cycle
CMDair
-300
-200
-100
0
100
200
600 800 1000 1200 1400 1600 1800
Potential vs. Zn/Zn2+ (mV)
Curre
nt (A
/g).
CMDH2O2
-600
-400
-200
0
200
400
600
600 800 1000 1200 1400 1600 1800
Potential vs. Zn/Zn2+ (mV)
Curre
nt (A
/g).

Figure 6
0
5
10
15
20
25
30
35
0 1 2 3 4 5 6 7 8 9 10number of cycles
Cap
acity
(Ah/
g)
EMDCMDairCMDH2O2
Related Documents