Preoperative Evaluation of Ovarian Tumors RIIKKA NIEMI Tampere University Dissertations 27

Welcome message from author
This document is posted to help you gain knowledge. Please leave a comment to let me know what you think about it! Share it to your friends and learn new things together.
Transcript

Preoperative Evaluationof Ovarian Tumors
RIIKKA NIEMI
Tampere University Dissertations 27


Responsible supervisor and Custos
Pre-examiners
Opponent

To my dearest ones Esa, Helmi, Saimi & Vilho


ABSTRACT
Ovarian tumors involve a wide range of neoplasms, from innocuous benign tumors to aggressive cancers. Not seldom are they found by chance, without any notable symptoms, and, as cancers, they may already have metastasized at that point. The diagnostic golden standard includes vaginal ultrasound (US) along with serum biomarkers, traditionally CA125, to assess tumor characteristics. The correct preoperative diagnosis of cancer is essential, as it allows a prompt referral to a center, where the operations are performed by gynecologic oncologists. In ovarian cancer (OC), effective and correct primary surgery is the most important prognostic factor. On the other hand, conservative follow-up may be sufficient for benign tumors.
Against this background, the aim of this thesis was to study advanced US modalities and to discover new possible biomarkers or methods to distinguish ovarian pathology preoperatively. First, we examined 100 at least 50-year-old women scheduled for surgery with an unclear ovarian tumor using traditional US and comparing it to various US scoring methods and three-dimensional ultrasound (3D US) with power Doppler (PD). The findings were compared with the results of examinations made by another experienced US examiner and also with histopathological diagnoses. None of the advanced US methods exceeded the accuracy of the subjective opinion of an expert. In addition, the 3D US with PD added no significant value to traditional methods. However, the results produced by two examiners were in good agreement.
To extend our investigation, we collected urine samples from 71 women with indefinite adnexal masses and from 22 controls, and analyzed urinary polyamines using liquid chromatography-tandem mass spectrometry (LC-MS/MS). Polyamines are naturally occurring components of all mammalian cells and have many functions, including cell growth. They are linked to carcinogenesis, and especially their diacetylated forms are found to be elevated in many cancers, although not previously in OC. In Study II, we showed that diacetylated spermine (DiAcSpm) was significantly elevated in urine from OC patients. While the levels of DiAcSpm differed even between low-stage OCs and benign ovarian tumors, the highest levels were found in high-grade OCs. Urinary DiAcSpm was even more sensitive than
serum CA125 with its commonly used cutoff value (35 U/mL): their respective sensitivities were 86.5% and 75.7%.
Based on previous experiments on the ability of dogs to detect the odor of cancer, urine samples (60 from women with adnexal tumors and 18 from controls) were also examined using field asymmetric waveform ion mobility spectrometry (FAIMS), a novel artificial olfactory technology. In our proof-of-concept Study III, we used FAIMS to differentiate between ovarian malignancy and benign tumors or controls with respective accuracies of 77.3% and 81.3%. When only high-grade cancers were taken into account, the accuracy in distinguishing them from low-grade cancers was 88.7%. Even low-grade cancers were differentiated from benign tumors with an accuracy of 83.9%.
Metabolic alterations, including lipid changes, in blood and tissues are associated with OC. However, it is unclear which specific lipids or lipid species are altered. A previous study showed decreases in levels of nearly all lipid species in blood samples from high-grade serous ovarian carcinoma patients, compared with women with benign gynecological disorders. In Study IV, our aim was to validate those previous results in a larger population, including also low-grade and early-stage cancers and histological pathology other than only serous. Lipidomic analysis was performed on 354 blood samples from women with OCs or benign gynecological pathologies; the women were from Finland or Germany. The results were compared with the previous results from 250 women. A total of 39 lipids were altered consistently and significantly in both early and late stages in all three cohorts (Finnish, German and previous study), 23 of them in all histological subtypes. Results showed lower levels of most of the lipids; there were higher levels of only one ceramide (Cer[d18:1/18:0]) and triacylglycerol (TAG[18:1/18:1/20:4]) in all stages and histologies. Combinations of some lipids and lipid ratios with CA125 improved the diagnostic value of serum CA125.
In conclusion, the subjective evaluation of two-dimensional US by an expert remains the most reliable preoperative diagnostic tool of adnexal masses. Emerging objective biochemical and biophysical methods include urinary polyamine analysis, FAIMS technology, and serum lipidomic profile.

TIIVISTELMÄ
Munasarjakasvaimet ovat ryhmä hyvin erilaisia kasvaimia viattomasta hyvänlaatuisesta kasvaimesta aggressiiviseen syöpään. Ne ovat usein sattumalöydöksiä oireettomilla naisilla, jopa levinneessä syövässä. Diagnostiikan kulmakivi on emättimen kautta tehtävä ultraäänitutkimus yhdistettynä verestä mitattaviin merkkiaineisiin, joista perinteisesti käytetyin on CA125-merkkiaine. Oikea ja mahdollisimman varhainen diagnoosi vaikuttaa kasvaimen hoitolinjoihin ja ennusteeseen, joka heikkenee merkittävästi levinneessä syövässä verrattuna alkuvaiheen munasarjasyöpään. Riittävän laaja leikkaushoito on merkittävin munasarjasyövän ennusteeseen vaikuttava tekijä. Toisaalta hyvänlaatuisten kasvaimien kohdalla konservatiivinen seurantalinja voi olla riittävä hoito, jolloin voidaan välttää turhia leikkausriskejä.
Väitöskirjan tavoitteena oli tutkia kehittyneempiä ultraäänitutkimusmenetelmiä ja -luokitteluja verrattuna perinteiseen kaksiulotteiseen ultraäänitutkimukseen, sekä etsiä uusia menetelmiä ja mahdollisia merkkiaineita munasarjakasvaimien erotusdiagnostiikkaan. Ensimmäisessä osatyössä tutkittiin 100 vähintään 50-vuotiasta naista, jotka odottivat munasarjakasvaimen vuoksi tehtävää leikkausta. Naiset tutkittiin ennen leikkausta kolmiulotteisella ultraäänitutkimuksella sekä moderneilla kaksiulotteiseen ultraäänitutkimukseen perustuvilla luokitteluilla, ja löydöksiä verrattiin keskenään. Mikään menetelmä ei ollut parempi kuin kokeneen ultraäänitutkijan oma arvio (ns. expert opinion) kaksiulotteisesta ultraäänitutkimuksesta. Kolmiulotteinen ultraäänitutkimus ei tuonut merkittävää lisäarvoa perinteisiin menetelmiin verrattuna. Jälkikäteen toinen kokenut ultraäänitutkija arvioi samat potilaat tallennettujen ultraäänikuvien perusteella, ja löydösten arviointi oli hyvin yhteneväistä tutkijoiden kesken.
Tutkimuksia laajennettiin keräämällä ennen leikkausta 71 munasarjakasvain- ja 22 kontrollipotilailta virtsanäytteitä, joista analysoitiin ja mitattiin nestekromatografia-massaspektrometrialla polyamiineja. Polyamiinit ovat nisäkässoluissa esiintyviä mm. solujen kasvulle välttämättömiä molekyylejä, joiden on todettu liittyvän myös karsinogeneesiin. Erityisesti asetyloituneiden polyamiinien kohonneita pitoisuuksia elimistön nesteissä on todettu useissa syövissä. Toisessa osatyössä osoitettiin ensimmäistä kertaa diasetyloituneen spermiinin (DiAcSpm) pitoisuuden olevan

kohonneen myös munasarjasyöpäpotilaiden virtsassa verrattuna kontrolleihin ja naisiin, joilla on hyvänlaatuinen munasarjakasvain. Korkeimmat virtsan DiAcSpm-pitoisuudet mitattiin potilailla, joilla oli huonosti erilaistunut ja levinnyt munasarjasyöpä (high-grade syöpä). Virtsan DiAcSpm oli tutkimuksessa jopa herkempi merkkiaine kuin yleisesti käytetty seerumin CA125 raja-arvolla 35 U/ml (86.5% vs. 75.7%).
Koirakokeissa on todettu, että koulutettu koira tunnistaa hajuaistin avulla syöpäkudoksen ja syöpäpotilaan eritteet. Nykyteknologia mahdollistaa analytiikan, jolla näytteen sisältämien orgaanisten yhdisteiden muodostama hajuspektri analysoidaan mm. koneellisen nenän (elektroninen nenä, eNose) avulla. Kolmannessa osatyössä virtsanäytteet (51 munasarjakasvain- ja 18 kontrollipotilailta) tutkittiin FAIMS (field asymmetric waveform ion mobility spectrometry)-teknologialla, joka on ionimobiliteettispektrometrian muunnelma sijoittuen massaspektrometrian ja elektronisen nenän välimaastoon. FAIMS-teknologian avulla munasarjasyöpäpotilaiden virtsa erotettiin kontrollien sekä hyvänlaatuisten kasvainpotilaiden virtsasta 81.3%:n ja 77.3%:n tarkkuuksilla. High-grade munasarjasyöpää sairastavien potilaiden virtsa oli erotettavissa varhaisvaiheen (low-grade) munasarjasyöpää sairastavien naisten virtsasta, joka puolestaan erosi hyvänlaatuisten kasvainpotilaiden virtsasta.
Munasarjasyövän metaboliatutkimuksissa on todettu muutoksia myös rasva-aineiden (lipidi) aineenvaihdunnassa syöpäpotilailla. On kuitenkin ollut epäselvää, mitkä lipidiryhmät muuttuvat erityisesti. Aiemmassa suomalais-saksalaisessa tutkimuksessa todettiin lähes kaikkien lipidien pitoisuuden laskevan high-grade seröösiä munasarjasyöpää sairastavien potilaiden veressä verrattuna naisiin, joilla oli hyvänlaatuinen gynekologinen sairaus. Neljännessä osatyössä lipidiaineenvaihdunnan muutoksia tutkittiin 354 verinäytteestä, jotka oli otettu varhais- ja levinneen vaiheen sekä erilaisia syöpäkasvaintyyppejä (muitakin kuin seröösi) sairastavilta munasarjasyöpäpotilailta ja hyvänlaatuista gynekologista sairautta sairastavilta naisilta. Yhteensä 39 lipidiä oli samansuuntaisesti ja pääosin tilastollisesti merkitsevästi muuttunut sekä varhais- että myöhäisasteen syövissä, ja 23 näistä lipideistä oli muuttunut myös kaikissa kasvaintyypeissä. Pääosin lipidipitoisuudet olivat vähentyneet syöpäpotilaiden veressä verrattuna ei-syöpäpotilaiden verinäytteisiin. Vain yksi keramidi (Cer[d18:1/18:0]) ja triasyyliglyseroli (TAG[18:1/18:1/20:4]) olivat kohonneet kaikissa levinneisyysasteissa ja kudostyypeissä. Lipidiyhdistelmät yhdessä seerumin CA125-pitoisuuden kanssa paransivat diagnostista osuvuutta yksittäiseen CA125-arvoon verrattuna.

Kokeneen tutkijan oma arvio kasvaimen laadusta perinteisessä kaksiulotteisessa ultraäänitutkimuksessa on edelleen luotettavin ultraäänitutkimusmenetelmä munasarjakasvaimien laatua arvioitaessa. Virtsan polyamiinien mittaaminen, FAIMS- teknologia ja seerumin lipidiprofiilin tutkiminen ovat lupaavia uusia objektiivisia tutkimusmenetelmiä munasarjakasvainten arvioinnissa.

TABLE OF CONTENTS
LIST OF ORIGINAL PUBLICATIONS ................................................................................... 15
ABBREVIATIONS ......................................................................................................................... 16
1 INTRODUCTION ............................................................................................................. 19
2 REVIEW OF THE LITERATURE ................................................................................ 22 2.1 Ovarian neoplasms .................................................................................................. 22
2.1.1 Benign ovarian tumors ......................................................................... 24 2.1.2 Borderline ovarian tumors ................................................................... 24 2.1.3 Ovarian cancer ....................................................................................... 25 2.1.4 Treatment ............................................................................................... 26
2.1.4.1 Benign ovarian tumors ...................................................... 26 2.1.4.2 Borderline ovarian tumors ................................................ 27 2.1.4.3 Epithelial ovarian cancer ................................................... 27 2.1.4.4 Non-epithelial malignant ovarian tumors ....................... 29
2.1.5 Ovarian cancer screening ..................................................................... 30 2.2 Preoperative assessment of ovarian tumors with biomarkers .......................... 31
2.2.1 Cancer antigen 125 ................................................................................ 31 2.2.2 Human epididymis protein 4 ............................................................... 32 2.2.3 The risk of malignancy algorithm ....................................................... 34 2.2.4 Other biomarkers .................................................................................. 35
2.3 Preoperative assessment of ovarian tumors with imaging ................................ 36 2.3.1 Two-dimensional sonography with Doppler ................................... 36
2.3.1.1 Risk of malignancy index .................................................. 38 2.3.1.2 IOTA Logistic regression models 1 and 2 ..................... 39 2.3.1.3 IOTA Simple rules ............................................................. 41 2.3.1.4 The Assessment of different neoplasias in the
adnexa (ADNEX) model .................................................. 42 2.3.1.5 Subjective assessment by an expert ultrasound
examiner and comparison of various predictive methods ................................................................................ 43
2.3.2 Three-dimensional sonography .......................................................... 45 2.3.2.1 Three-dimensional gray-scale morphologic
ultrasound ............................................................................ 46 2.3.2.2 Three-dimensional power Doppler angiography .......... 47
2.3.3 Ultrasound contrast agents .................................................................. 48 2.3.4 Magnetic resonance imaging ............................................................... 49
2.3.5 Computed tomography ........................................................................ 51 2.3.6 Positron emission tomography/Computed tomography ............... 51
2.4 Polyamines................................................................................................................. 52 2.4.1 Overview of polyamine metabolism .................................................. 52
2.4.1.1 Polyamines in cancer .......................................................... 54 2.4.2 Analysis of polyamines ......................................................................... 55 2.4.3 Polyamines as tumor markers.............................................................. 56
2.5 Detection of volatile organic compounds ............................................................ 60 2.5.1 Overview ................................................................................................. 60 2.5.2 Technical analytical methods ............................................................... 61
2.5.2.1 Field asymmetric waveform ion mobility spectrometry ........................................................................ 62
2.5.3 Detection of cancer ............................................................................... 63 2.6 Lipidomics ................................................................................................................. 65
2.6.1 Overview of lipids ................................................................................. 65 2.6.2 Analytical methods for lipidomics ...................................................... 66 2.6.3 Lipid metabolism in cancer .................................................................. 67
2.6.3.1 Lipidomics in ovarian cancer ............................................ 70
3 AIMS OF THE STUDY ..................................................................................................... 74
4 PATIENTS, MATERIALS AND METHODS ............................................................. 75 4.1 Patients and study design (Studies I-IV) .............................................................. 75 4.2 Methods ..................................................................................................................... 78
4.2.1 Two- and three-dimensional sonography with power Doppler (Study I) .................................................................................. 78 4.2.1.1 Ultrasound-based scoring methods ................................. 78 4.2.1.2 Three-dimensional power Doppler angiography .......... 79 4.2.1.3 Interobserver agreement .................................................... 80
4.2.2 Polyamine analysis by liquid chromatography-tandem mass spectrometry (Study II) ............................................................... 80
4.2.3 The FAIMS analytical technique (Study III) ..................................... 81 4.2.4 Lipidomic analysis by liquid chromatography-tandem
mass spectrometry (Study IV) ............................................................. 82 4.3 Statistical analysis ..................................................................................................... 83 4.4 Ethical considerations ............................................................................................. 85
5 RESULTS .............................................................................................................................. 86 5.1 Ultrasound scoring methods (Study I) ................................................................. 87
5.1.1 Three-dimensional power Doppler angiography ............................. 89 5.1.2 Interobserver agreement ...................................................................... 90
5.2 Urinary polyamines (Study II) ................................................................................ 91 5.2.1 Diagnostic performance of urinary diacetylspermine ..................... 91
5.3 FAIMS analysis of urine (Study III) ...................................................................... 94

5.4 Lipidomic analysis (Study IV) ................................................................................ 95 5.4.1 Lipidomic changes in early- and advanced-stage ovarian
cancer and in various histological subtypes ...................................... 96 5.4.2 Lipidomic analysis in borderline ovarian tumors ............................. 98
6 DISCUSSION ...................................................................................................................... 99 6.1 Three-dimensional sonography does not seem to offer significantly
more benefit than two-dimensional sonographic scoring methods (Study I) ..................................................................................................................... 99
6.2 Urinary DiAcSpm as a possible biomarker in ovarian cancer (Study II) ................................................................................................................. 101 6.3 Detection of volatile organic compounds from urine of ovarian
cancer patients is possible with the aid of FAIMS (Study III) ....................... 102 6.4 Lipidomic changes in blood occur even in early stages of ovarian
cancer (Study IV) ................................................................................................... 103 6.5 Strengths and weaknesses ..................................................................................... 105 6.6 Future prospects .................................................................................................... 107
7 SUMMARY AND CONCLUSIONS ............................................................................ 108
8 ACKNOWLEDGEMENTS ........................................................................................... 110
9 REFERENCES .................................................................................................................. 113
10 ORIGINAL PUBLICATIONS ...................................................................................... 137

15
LIST OF ORIGINAL PUBLICATIONS
This thesis is based on the following original publications, which are referred to by the Roman numerals I-IV as assigned below.
I. Niemi RJ, Saarelainen SK, Luukkaala TH, Mäenpää JU. Reliability of preoperative evaluation of postmenopausal ovarian tumors. Journal of Ovarian Research 2017; 10(1): 15.
II. Niemi RJ, Roine AN, Häkkinen MR, Kumpulainen PS, Keinänen TA, Vepsäläinen JJ, Lehtimäki T, Oksala NK, Mäenpää JU. Urinary polyamines as biomarkers for ovarian cancer. International Journal of Gynecological Cancer 2017; 27(7): 1360-1366.
III. Niemi RJ, Roine AN, Eräviita E, Kumpulainen PS, Mäenpää JU, Oksala NK. FAIMS analysis of urine gaseous headspace is capable of differentiating ovarian cancer. Gynecologic Oncology 2018; 151(3): 519-524.
IV. Niemi RJ, Braicu EI, Kulbe H, Koistinen KM, Sehouli J, Puistola U, Mäenpää JU, Hilvo M. Ovarian tumors of different histologic type and clinical stage induce similar changes in lipid metabolism. British Journal of Cancer 2018; 119(7): 847-854.
The original publications are reproduced with permission of the copyright holders. In addition, some unpublished data are presented.
16
ABBREVIATIONS
2D US Two-dimensional ultrasound 3D US Three-dimensional ultrasound 3D-PD Three-dimensional power Doppler ADC Apparent diffusion coefficient ADNEX Assessment of different neoplasias in the adnexa ATX Autotoxin AUC Area under the curve BEP Bleomycin-etoposide-cisplatin BOT Borderline ovarian tumor CA125 Cancer antigen 12-5 CEA Carcinoembryonic antigen Cer Ceramide CI Confidence interval CT Computed tomography DCE MRI Dynamic contrast-enhanced magnetic resonance imaging DFMO DL-α-difluoromethylornithine DiAcSpd N1, N8-diacetylspermidine DiAcSpm N1, N12-diacetylspermine DWI Diffusion-weighted imaging ELISA Enzyme-linked immunosorbent assay eNose Electronical nose FAIMS Field asymmetric waveform ion mobility spectrometry FAS Fatty acid synthase FDA Food and Drug Administration FI Flow index FIGO International Federation of Gynecology and Obstetrics GC Gas chromatography HDL High density lipoprotein
17
HGSOC High-grade serous ovarian carcinoma HE4 Human epididymis protein 4 HPLC High-performance liquid chromatography IOTA International Ovarian Tumor Analysis IS Internal standard LC Liquid chromatography LC-MS(/MS) Liquid chromatography-mass spectrometry (-tandem mass
spectrometry) LDA Linear discriminant analysis LGSC Low-grade serous carcinoma LPA Lysophosphatidic acid LR1 & 2 Logistic regression models 1 & 2 MRI Magnetic resonance imaging MS Mass spectrometry OC Ovarian cancer PD Power Doppler PET Position emission tomography PI Pulsatility index PLA2 Phospholipase A2 QDA Quadratic discriminant analysis RI Resistance index RMI Risk of malignancy index ROC Receiver operating characteristics ROMA Risk of malignancy algorithm SSAT Spermidine/spermine N1-acetyltransferase TAG Triacylglycerol TATI Tumor-associated trypsin inhibitor US Ultrasound VFI Vascularity flow index VI Vascularity index VOC Volatile organic compound VOCAL Virtual Organ Computer-Aided Analysis WHO World Health Organization

18

19
1 INTRODUCTION
Approximately 239,000 new ovarian cancer (OC) cases are found annually worldwide, and the peak incidence rate is among postmenopausal women (Ferlay et al. 2015). At the same time, OC is the most lethal gynecological cancer and the fifth leading cause of cancer deaths in the U.S.. The five-year relative survival rate has improved significantly in the U.S., from 36% to 46% in 1975-2011, a rate that is still quite poor compared to the localized OC survival rate of 92% (Siegel et al. 2016). In Finland, the published overall five-year survival for OC patients was 43% in 2013-2015 (Finnish Cancer Registry 2018). Because the prognosis improves remarkably when OC is diagnosed at an early-stage, better diagnostic methods are urgently needed.
Accurate preoperative classification of ovarian tumors is necessary for the appropriate treatment of tumors, especially classification into benign and malignant tumors. Women with suspected OC should be operated on and treated in specialized centers because optimal cytoreductive surgery is one of the main prognostic factors in the treatment (Bristow et al. 2002). On the other hand, a majority of ovarian neoplasms are benign, and an accurate diagnosis is needed to avoid unnecessary or overly radical surgery in order to reduce the risk of surgical procedures.
The symptoms of OC are non-specific and can mimic other conditions such as upper-abdominal disease. At early stages of the disease, most women are asymptomatic. Large ovarian tumors can be palpable in a clinical examination, but often a further evaluation of the pelvis using vaginal ultrasound (US) is performed to diagnose and classify the ovarian mass as either benign or malignant. Previous studies have determined sonographic morphological and vascular features of adnexal masses that specify their nature. The gold standard of ovarian tumor markers is CA125, which – together with US findings – is typically used in predicting the malignancy of an adnexal tumor. The disadvantage of CA125 is that increased serum levels are associated more with advanced and serous OCs than with low-stage cancers or other histological subtypes. Also, serum CA125 has a quite poor
20
specificity for OC because it can also be elevated in some non-ovarian cancers and in benign gynecological conditions (Jacobs & Bast 1989).
Several predictive models have been created to optimize the diagnostic performance of sonography, including different scoring systems, logistic regression analysis and neural networks. The risk of malignancy index (RMI) is the first score criterion that takes into consideration US findings, serum CA125 level, and patient age and menopausal status (Jacobs et al. 1990). In 2008, the International Ovarian Tumor Analysis (IOTA) group published simple US-based rules which can be used to correctly classify most ovarian tumors (Timmerman et al. 2008).
Polyamines are molecules necessary for eukaryotes and essential for cellular proliferation, also in carcinogenesis. Increased polyamine concentrations have been found in many cancers (Gerner & Meyskens 2004). New technology has permitted the simultaneous large-pattern analysis of both acetylated and unacetylated polyamines from urine (Häkkinen et al. 2013).
Some cancers have distinct odors caused by volatile organic compounds (VOCs) which can be detected in urine, blood and breath by a canine’s olfactory sense (Lippi & Cervellin 2012). In addition to canine studies, various new technical methods have been studied, e.g. the so-called electronic nose (eNose) and lately more modern variants such as field asymmetric waveform ion mobility spectrometry (or FAIMS) (Covington et al. 2015).
Several metabolic alterations occur in cancer cells due to the increased demand for energy. Metabolomic profiling is a new diagnostic tool in understanding these metabolic changes. In OC, altered serum metabolites have been shown to include ketone bodies, carbohydrates, amino acids, lipids and fatty acids (Hilvo et al. 2016). Especially alterations in the phospho- and sphingolipid metabolism are associated with malignancies, and changes in those lipids have also been found in OC (Furuya et al. 2011; Tania et al. 2010). To date, there are no validation studies of the most-altered lipids in OC (Ke et al. 2015).
In this thesis, new preoperative diagnostic methods are demonstrated to distinguish between benign and malignant ovarian processes. First, women with unclear ovarian masses were examined using various sonographic predictive methods, including three-dimensional power Doppler (3D-PD) US before surgery. Preoperatively collected urine samples were investigated, employing liquid chromatography-tandem mass spectrometry (LC-MS/MS) to explore the polyamine concentrations in women with and without ovarian neoplasms. The urine samples

21
were also tested using FAIMS to determine the ability of the system to detect volatile compounds in the urine of OC patients. Finally, lipidomic analysis of blood samples from women with ovarian tumors and benign gynecological diseases was performed to identify possible alterations in lipidomic profiling.
22
2 REVIEW OF THE LITERATURE
2.1 Ovarian neoplasms
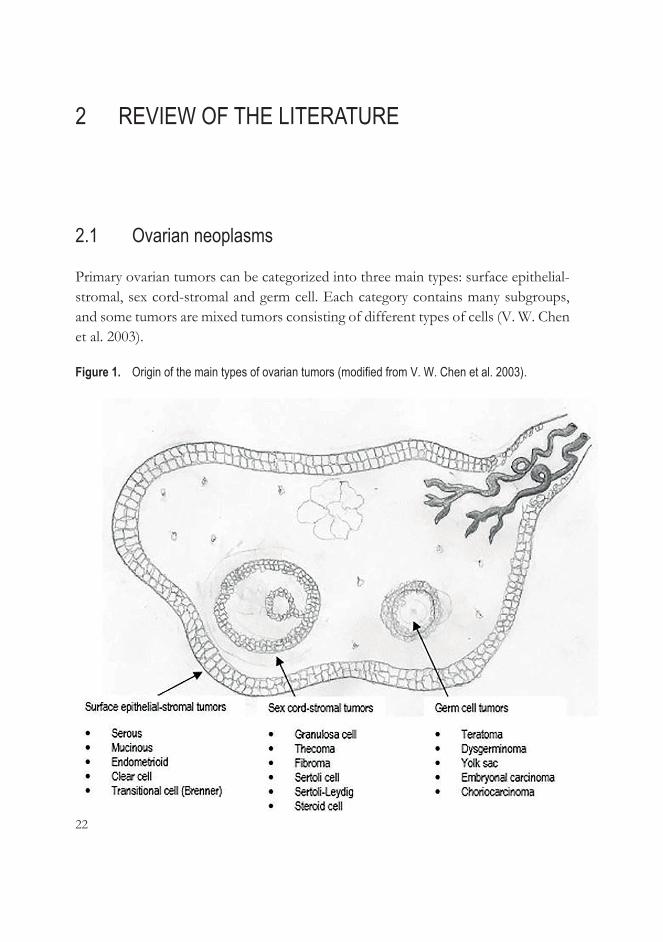
Primary ovarian tumors can be categorized into three main types: surface epithelial-stromal, sex cord-stromal and germ cell. Each category contains many subgroups, and some tumors are mixed tumors consisting of different types of cells (V. W. Chen et al. 2003).
Figure 1. Origin of the main types of ovarian tumors (modified from V. W. Chen et al. 2003).

23
In recent years, molecular, genetic and epigenetic studies have improved knowledge about the pathology of ovarian tumors, so the World Health Organization (WHO) revised the classification of cancers of the ovaries, fallopian tubes and peritoneum in 2014 (Kurman et al. 2014; see Table 1). It is based mainly on histopathological findings and takes into account the pathogenesis and prognosis of the OC subtypes (Meinhold-Heerlein et al. 2015; Meinhold-Heerlein et al. 2016). In parallel with WHO reclassification, the International Federation of Gynecology and Obstetrics (FIGO) introduced a new surgical staging classification for cancers of the ovary, fallopian tubes and peritoneum. It recognizes that OCs are a heterogenous group of malignant tumors with different characteristics and outcomes (Zeppernick & Meinhold-Heerlein 2014).
Table 1. The current (2014) WHO classification of epithelial ovarian tumors (Kurman et al. 2014). Serous tumors Benign type
Cystadenoma Adenofibroma Surface papilloma
Borderline (SBOT) SBOT/atypical proliferating tumor SBOT, micropapillary type/ non-invasive, serous low-grade carcinoma
Malignant type Serous low-grade carcinoma Serous high-grade carcinoma
Mucinous tumors Benign type Cystadenoma Adenofibroma
Borderline (MBOT) MBOT/atypical proliferating mucinous tumor
Malignant type Mucinous carcinoma
Endometrioid tumors Benign type Endometriosis cyst Endometrioid cystadenoma Endometrioid cystadenofibroma
Borderline (EBOT) EBOT/atypical proliferating endometrioid tumor
Malignant type Endometrioid carcinoma
Clear cell tumors Benign type Cystadenoma
Borderline (CBOT) CBOT/atypical proliferating clear cell tumor
Malignant type Clear cell carcinoma
Brenner tumors Benign type Brenner tumor
Borderline Borderline Brenner tumor/atypical proliferating Brenner tumor
Malignant type Malignant Brenner tumor
Seromucinous tumors Benign type Seromucinous cystadenoma Seromucinous adenofibroma
Borderline Seromucinous borderline tumor/atypical proliferating seromucinous tumor
Malignant type Seromucinous carcinoma
Undifferentiated carcinoma

24
2.1.1 Benign ovarian tumors
While epithelial tumors form the majority of ovarian malignancies, germ cell tumors, or mature cystic teratomas (dermoid cysts), represent the most common benign ovarian neoplasms, appearing mainly among youth and younger women of reproductive age (Koonings et al. 1989; Park et al. 2015). They are assumed to originate from primordial germ cells of yolk sac migrated along the coelomic cavity to the ovary (Koonings et al. 1989).
The most common benign ovarian tumor among women over 50 years old is serous cystadenoma (Koonings et al. 1989). Mucinous cystadenomas often occur as large cystic masses and represent approximately 10-15% of benign ovarian neoplasms. Epithelial cystadenomas are believed to be formed from coelomic inclusion cysts that undergo metaplasia (Brown & Frumovitz 2014; Koonings et al. 1989).
2.1.2 Borderline ovarian tumors
Borderline ovarian tumors (BOTs) are neoplasms classified between the benign and malignant categories. They are low-malignancy potential tumors that have an elevated mitotic activity and slight nuclear atypia without marked stromal invasion. Most of them are serous and mucinous subtypes (Silverberg et al. 2004). BOTs occur also in younger women, when correct diagnosis and treatment options must also take into account fertility preservation issues. Serous BOTs share molecular and genetic similarities with low-grade serous carcinomas (LGSCs), and they can exist at advanced stages with peritoneal implants and/or lymph node involvement. Non-serous BOTs occur mainly at Stage I. The new WHO classification reformed the terminology of microinvasion: microinvasive foci have dimensions of maximum 5 mm, but if they have solid nests or cribriform glands histologically reminiscent of LGSCs, they are classified as LGSCs despite the size of the microinvasion (Hauptmann et al. 2017).
The recent classification of WHO also mentioned micropapillary serous BOT as a distinct variant of BOT. It is also determined as a non-invasive LGSC. Micropapillary pattern of serous BOT is not an independent prognostic factor, but it is more often associated with poor clinicopathological factors e.g. found at advanced stages (Hauptmann et al. 2017). Previously the peritoneal implants of

25
serous BOT were divided into invasive and non-invasive while the new WHO classification considers the invasive foci as peritoneal LGSC (Meinhold-Heerlein et al. 2016).
2.1.3 Ovarian cancer
One in 75 women develops OC during her lifetime. The risk is higher in the U.S. and Europe than in Asia (Reid et al. 2017).
At least 90% of ovarian malignancies are of epithelial origin, and the main subtype is high-grade serous (HGSC; 70%), followed by endometrioid (10%), clear cell (10%), mucinous (3%), and LGSC (<5%) (Zeppernick & Meinhold-Heerlein 2014). Malignant sex cord-stromal (mainly granulosa cell tumors) and germ cell tumors (dysgerminomas, yolk sac tumors and immature teratomas) represent respectively 1-2% and 3% of OCs (Prat & FIGO Committee on Gynecologic Oncology 2014).
Nowadays epithelial OC is roughly divided into two groups: type I and type II (Koshiyama et al. 2017; Kurman & Shih 2016; Labidi-Galy et al. 2017).
Table 2. The characteristics of type I and II epithelial ovarian carcinoma. Type I ovarian cancer Type II ovarian cancer
Behavior Slow-growing Aggressive
Origin → Histological subtype
Endometriosis → Endometrioid carcinoma, Clear cell carcinoma, Seromucinous carcinoma Fallopian tube → LGSC Germ cell (via mature teratoma) → Mucinous carcinoma? Transitional cell → Mucinous carcinoma?, Malignant Brenner tumor
Fallopian tube → HGSC, Carcinosarcoma, Undifferentiated carcinoma
Stage Frequently early stage Mostly advanced stage
Precursor
A benign precursor cyst or atypical proliferative (borderline) tumor
Mostly STICs (de novo starting)
Proliferative activity
Usually low Always high
BRCA1 / BRCA2 mutation
Low High
TP53 mutation Low High
Chromosomal instability
Low High
Homologous recombination repair
Rarely defective Often defective
Clinical outcome Usually good Often poor LGSC: low-grade serous carcinoma; HGSC: high-grade serous carcinoma; STIC: serous tubal intraepithelial carcinoma.
26
2.1.4 Treatment
2.1.4.1 Benign ovarian tumors
Examination by an experienced sonographist is essential for the accurate diagnosis of ovarian tumors and making decisions regarding their treatment. Asymptomatic adnexal tumors can be managed conservatively by appropriate follow-up, which diminishes surgical risks by minimizing unnecessary surgery. The effect of a tumor or surgery on hormonal status should also be considered. On the other hand, ovarian tumors with a suspicion of malignancy must be referred to a gynecologic oncologist.
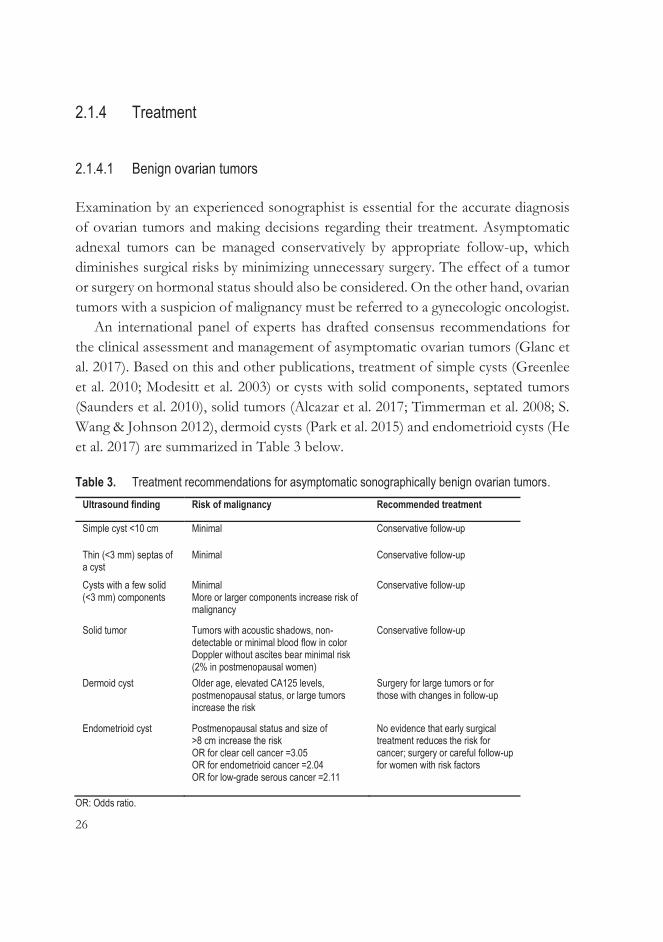
An international panel of experts has drafted consensus recommendations for the clinical assessment and management of asymptomatic ovarian tumors (Glanc et al. 2017). Based on this and other publications, treatment of simple cysts (Greenlee et al. 2010; Modesitt et al. 2003) or cysts with solid components, septated tumors (Saunders et al. 2010), solid tumors (Alcazar et al. 2017; Timmerman et al. 2008; S. Wang & Johnson 2012), dermoid cysts (Park et al. 2015) and endometrioid cysts (He et al. 2017) are summarized in Table 3 below.
Table 3. Treatment recommendations for asymptomatic sonographically benign ovarian tumors. Ultrasound finding Risk of malignancy Recommended treatment
Simple cyst <10 cm Minimal Conservative follow-up
Thin (<3 mm) septas of a cyst
Minimal Conservative follow-up
Cysts with a few solid (<3 mm) components
Minimal More or larger components increase risk of malignancy
Conservative follow-up
Solid tumor Tumors with acoustic shadows, non-detectable or minimal blood flow in color Doppler without ascites bear minimal risk (2% in postmenopausal women)
Conservative follow-up
Dermoid cyst Older age, elevated CA125 levels, postmenopausal status, or large tumors increase the risk
Surgery for large tumors or for those with changes in follow-up
Endometrioid cyst Postmenopausal status and size of >8 cm increase the risk OR for clear cell cancer =3.05 OR for endometrioid cancer =2.04 OR for low-grade serous cancer =2.11
No evidence that early surgical treatment reduces the risk for cancer; surgery or careful follow-up for women with risk factors
OR: Odds ratio.

27
2.1.4.2 Borderline ovarian tumors
Borderline ovarian tumors occur in younger women than epithelial OC, and therefore more conservative surgery is often discussed in order to retain fertility. The prognosis for BOTs is generally excellent because they are mainly diagnosed at a non-advanced stage. The five-year survival for Stage I patients is 95-97%; because recurrences can appear late, the ten-year survival is 70-95%. In turn, the five-year survival for women with Stage II or III BOT is 65-87% (Fischerova et al. 2012).
Recurrences are associated more often with conservative treatment than with radical surgery. In the study of Suh-Burgmann (2006), 193 women with BOTs, mainly Stage I disease, were treated conservatively. The patients who underwent cystectomy relapsed more often than the patients who underwent oophorectomy (23% vs. 7% respectively). Two women (1%) saw a recurrence with malignant OC in the three years after their first surgery.
The standard surgery for BOTs remains bilateral salpingo-oophorectomy with or without hysterectomy, including FIGO staging procedures, and it is recommended for women without wish to remain fertile. In these cases, preoperative counselling before conservative surgery is important. Routine lymphadenectomy is not recommended (Fischerova et al. 2012; Gershenson 2017). Adequate staging includes appendicectomy in the case of mucinous BOTs (Morice et al. 2012).
To date, there is no data evidencing the benefits of adjuvant chemotherapy, even at advanced stages of BOTs (Fischerova et al. 2012). Still, for women with serous BOTs and invasive peritoneal implants, platinum-based chemotherapy is recommended. Increasingly, these BOTs are called low-grade carcinomas (Gershenson 2017).
2.1.4.3 Epithelial ovarian cancer
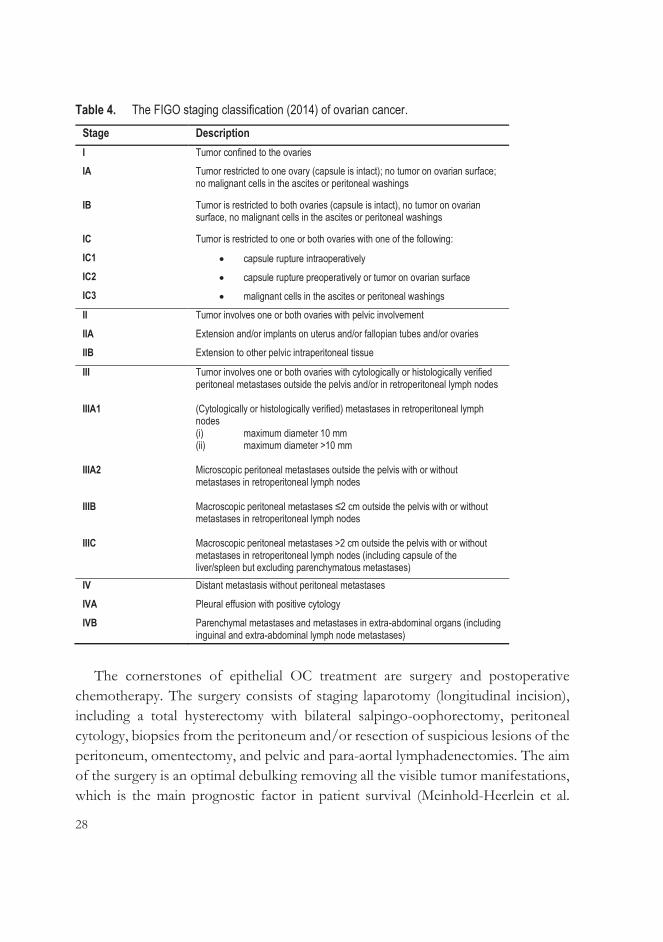
The histopathological evaluation of tissue samples is needed to confirm the diagnosis of OC; surgery is often required to obtain such samples. The main targets of the surgery are to verify the diagnosis, determine the stage of the cancer and achieve maximal removal of the tumor. Both the histopathological type of tumor (WHO classification) and the surgical stage of tumor (FIGO classification) are important in therapeutic decisions regarding OC. The FIGO staging classification from 2014 is shown in Table 4 (Prat & FIGO Committee on Gynecologic Oncology 2014).
28
Table 4. The FIGO staging classification (2014) of ovarian cancer. Stage Description I Tumor confined to the ovaries
IA Tumor restricted to one ovary (capsule is intact); no tumor on ovarian surface; no malignant cells in the ascites or peritoneal washings
IB Tumor is restricted to both ovaries (capsule is intact), no tumor on ovarian surface, no malignant cells in the ascites or peritoneal washings
IC Tumor is restricted to one or both ovaries with one of the following:
IC1 capsule rupture intraoperatively IC2 capsule rupture preoperatively or tumor on ovarian surface IC3 malignant cells in the ascites or peritoneal washings
II Tumor involves one or both ovaries with pelvic involvement
IIA Extension and/or implants on uterus and/or fallopian tubes and/or ovaries
IIB Extension to other pelvic intraperitoneal tissue
III Tumor involves one or both ovaries with cytologically or histologically verified peritoneal metastases outside the pelvis and/or in retroperitoneal lymph nodes
IIIA1 (Cytologically or histologically verified) metastases in retroperitoneal lymph nodes (i) maximum diameter 10 mm (ii) maximum diameter >10 mm
IIIA2 Microscopic peritoneal metastases outside the pelvis with or without metastases in retroperitoneal lymph nodes
IIIB Macroscopic peritoneal metastases ≤2 cm outside the pelvis with or without metastases in retroperitoneal lymph nodes
IIIC Macroscopic peritoneal metastases >2 cm outside the pelvis with or without metastases in retroperitoneal lymph nodes (including capsule of the liver/spleen but excluding parenchymatous metastases)
IV Distant metastasis without peritoneal metastases
IVA Pleural effusion with positive cytology
IVB Parenchymal metastases and metastases in extra-abdominal organs (including inguinal and extra-abdominal lymph node metastases)
The cornerstones of epithelial OC treatment are surgery and postoperative
chemotherapy. The surgery consists of staging laparotomy (longitudinal incision), including a total hysterectomy with bilateral salpingo-oophorectomy, peritoneal cytology, biopsies from the peritoneum and/or resection of suspicious lesions of the peritoneum, omentectomy, and pelvic and para-aortal lymphadenectomies. The aim of the surgery is an optimal debulking removing all the visible tumor manifestations, which is the main prognostic factor in patient survival (Meinhold-Heerlein et al.

29
2015). Neoadjuvant chemotherapy may decrease postoperative morbidity in patients in poor condition or with co-morbidities and may improve the likelihood of optimal surgery, but it cannot improve the prognosis of a patient (Hacker & Rao 2017).
A review of Chiva et al. (2016) collected information from 12,000 patients with Stage III-IV OC. The patients with completely resected disease had a median overall survival of 70 months compared with patients with a minimal macroscopic residual disease of 0.1-0.5 cm or suboptimal debulking (residual disease >0.5-1 cm), who survived 53 and 30-40 months respectively. Melamed et al. (2017) established that optimal cytoreductive surgery was an important prognostic factor in Stage IIIC-IV OC of the serous, clear cell and mucinous histological subtypes. To achieve complete primary cytoreduction, extensive ultra-radical surgery is performed in the management of advanced OCs. This aggressive surgery may include procedures such as diaphragm peritonectomy, splenectomy, bowel resection and liver resection (Chang et al. 2015).
Platinum- and taxane-based chemotherapy is the standard first-line treatment for early- and advanced-stage epithelial OC after primary surgery. Adjuvant chemotherapy is not recommended for patients whose disease is restricted to the ovary (Stage IA or IB) and of a low histological grade, because they have a five-year survival of >90% after successful surgery (Young et al. 1990). The chemotherapy is received in six cycles every three weeks, although shorter courses of chemotherapy may be sufficient for patients with a non-serous histology (Webber & Friedlander 2017). The addition of bevacizumab to standard chemotherapy has improved the overall survival of OC patients with a high risk of cancer progression (Oza et al. 2015).
2.1.4.4 Non-epithelial malignant ovarian tumors
Malignant germ cell ovarian tumors are mainly unilateral and restricted only to the ovary, which enables fertility-sparing surgery such as unilateral salpingo-oophorectomy. The extent of surgical staging depends, for example, on the age of the patient. A careful evaluation of the abdominal cavity is performed with cytological samples, peritoneal biopsies, palpation of the omentum or omentectomy, and lymph node biopsies or lymphadenectomies are performed as in epithelial OC staging (Brown et al. 2014; Gershenson 2007). Cisplatin-based adjuvant chemotherapy, bleomycin-etoposide-cisplatin (BEP), has been a postoperative
30
standard (Brown et al. 2014). However, women with Stage IA dysgerminomas and highly differentiated Stage IA immature teratomas can be treated with surgery alone (Colombo et al. 2012).
The surgical treatment of malignant sex cord-stromal ovarian tumors is similar to that of epithelial OCs, but systematic lymphadenectomies are not recommended. Young women with localized tumors (Stage IA) can have conservative surgery that spares the contralateral adnex. According to the recommendations, postoperative chemotherapy (e.g. BEP) is utilized only in advanced stages: granulosa cell tumors Stages IIA-IV and Sertoli-Leydig cell tumors with poor differentiation (Colombo et al. 2012).
2.1.5 Ovarian cancer screening
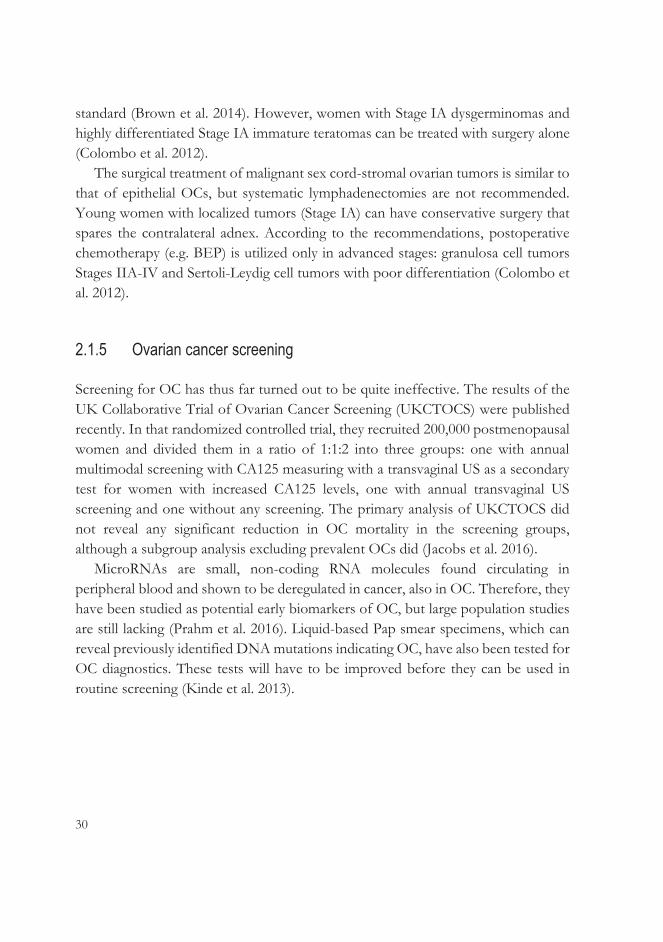
Screening for OC has thus far turned out to be quite ineffective. The results of the UK Collaborative Trial of Ovarian Cancer Screening (UKCTOCS) were published recently. In that randomized controlled trial, they recruited 200,000 postmenopausal women and divided them in a ratio of 1:1:2 into three groups: one with annual multimodal screening with CA125 measuring with a transvaginal US as a secondary test for women with increased CA125 levels, one with annual transvaginal US screening and one without any screening. The primary analysis of UKCTOCS did not reveal any significant reduction in OC mortality in the screening groups, although a subgroup analysis excluding prevalent OCs did (Jacobs et al. 2016).
MicroRNAs are small, non-coding RNA molecules found circulating in peripheral blood and shown to be deregulated in cancer, also in OC. Therefore, they have been studied as potential early biomarkers of OC, but large population studies are still lacking (Prahm et al. 2016). Liquid-based Pap smear specimens, which can reveal previously identified DNA mutations indicating OC, have also been tested for OC diagnostics. These tests will have to be improved before they can be used in routine screening (Kinde et al. 2013).
31
2.2 Preoperative assessment of ovarian tumors with biomarkers
2.2.1 Cancer antigen 125
Cancer antigen 125 (CA125) is the most studied OC biomarker; it was described as elevated in epithelial OC patients in 1983 by Bast et al. (Jacobs & Bast 1989). CA125 is an antigen on a high-molecular-weight membrane glycoprotein recognized by the corresponding monoclonal antibody OC125, which was discovered when mice were immunized with an ovarian cancer cell line. It is expressed in Müllerian and coelomic epithelia, but originally it was not found on normal adult and fetal ovarian surfaces. Later studies showed immunohistochemical CA125 expression also in normal ovarian epithelium tissue (Jacobs & Bast 1989). In turn, CA125 promotes ovarian cancer cell proliferation and suppresses an anti-cancer immune response, and is therefore overexpressed in epithelial cancers (Bast & Spriggs 2011). It has been detected in, for example, normal seminal fluid, fallopian tubes and the endometrium, but also in the lungs and conjunctiva, although its physiological function remains unclear (Bast & Spriggs 2011). The original CA125 test reacts only to OC125, and serum levels of CA125 are considered to be normal if ≤35 U/mL (van Nagell & Miller 2016).
The serum CA125 marker is used to distinguish OC from benign ovarian tumors, to check therapeutic response and to detect recurrence of OC (Bast et al. 2005). It is elevated in over 80% of epithelial OC patients, but mucinous or early-stage (FIGO Stage I) cancers are associated with lower CA125 values (Duffy et al. 2005). CA125 detects epithelial OC in postmenopausal women at an early- and advanced-stage with a specificity of 90% and a respective sensitivity of 50-60% and 80-90% (Muinao et al. 2018). In a study by Chen et al., women with type II OC were shown to have higher CA125 levels than women with type I OC: the respective median CA125 levels were 937 U/mL and 171 U/mL (X. Chen et al. 2013).
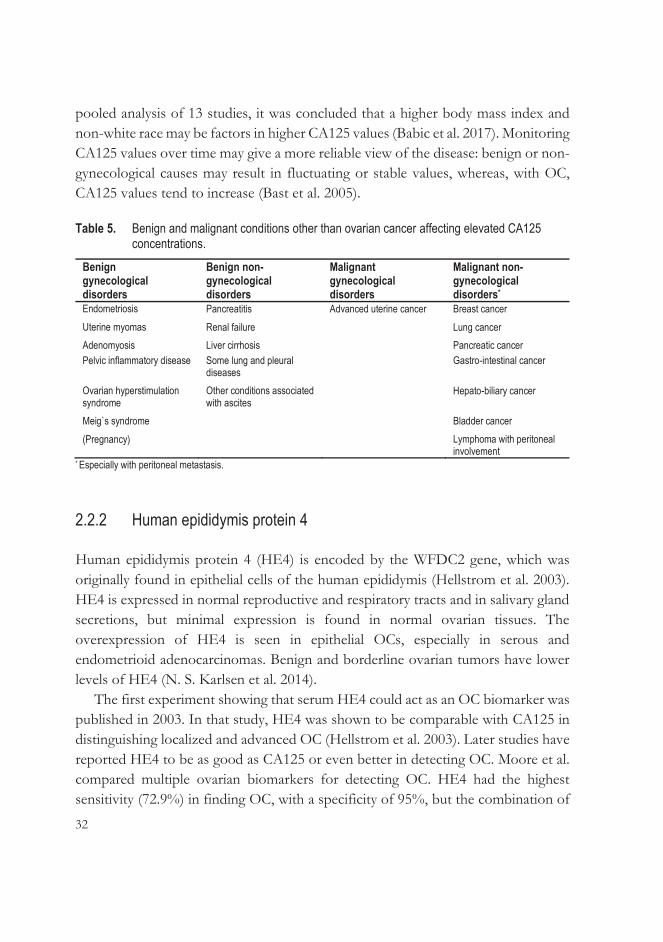
CA125 levels may be elevated due to many benign or extraovarian malignant causes, which attenuates its usefulness as a diagnostic biomarker (Duffy et al. 2005; Jacobs & Bast 1989; Sevinc et al. 2007; see Table 5). The predictive value of CA125 is better for postmenopausal than premenopausal women, who can be healthy and still have higher CA125 levels. Pregnancy increases CA125 levels, which also fluctuate during the menstrual cycle (Duffy et al. 2005; Jacobs & Bast 1989). In a
32
pooled analysis of 13 studies, it was concluded that a higher body mass index and non-white race may be factors in higher CA125 values (Babic et al. 2017). Monitoring CA125 values over time may give a more reliable view of the disease: benign or non-gynecological causes may result in fluctuating or stable values, whereas, with OC, CA125 values tend to increase (Bast et al. 2005).
Table 5. Benign and malignant conditions other than ovarian cancer affecting elevated CA125 concentrations.
Benign gynecological disorders
Benign non-gynecological disorders
Malignant gynecological disorders
Malignant non-gynecological disorders*
Endometriosis Pancreatitis Advanced uterine cancer Breast cancer Uterine myomas Renal failure Lung cancer Adenomyosis Liver cirrhosis Pancreatic cancer Pelvic inflammatory disease Some lung and pleural
diseases Gastro-intestinal cancer
Ovarian hyperstimulation syndrome
Other conditions associated with ascites
Hepato-biliary cancer
Meig`s syndrome Bladder cancer (Pregnancy) Lymphoma with peritoneal
involvement * Especially with peritoneal metastasis.
2.2.2 Human epididymis protein 4
Human epididymis protein 4 (HE4) is encoded by the WFDC2 gene, which was originally found in epithelial cells of the human epididymis (Hellstrom et al. 2003). HE4 is expressed in normal reproductive and respiratory tracts and in salivary gland secretions, but minimal expression is found in normal ovarian tissues. The overexpression of HE4 is seen in epithelial OCs, especially in serous and endometrioid adenocarcinomas. Benign and borderline ovarian tumors have lower levels of HE4 (N. S. Karlsen et al. 2014).
The first experiment showing that serum HE4 could act as an OC biomarker was published in 2003. In that study, HE4 was shown to be comparable with CA125 in distinguishing localized and advanced OC (Hellstrom et al. 2003). Later studies have reported HE4 to be as good as CA125 or even better in detecting OC. Moore et al. compared multiple ovarian biomarkers for detecting OC. HE4 had the highest sensitivity (72.9%) in finding OC, with a specificity of 95%, but the combination of
33
CA125 and HE4 improved the sensitivity to 76.4%. HE4 was found to be also the best biomarker to differentiate Stage I OC from benign tumors, although the sensitivity of HE4 was quite low, 45.9%, with a specificity of 95%, and a combination with CA125 did not improve the results (Moore et al. 2008). In a study by Holcomb et al. (2011), serum HE4 performed better (sensitivity 88.9% and specificity 91.8%) compared with CA125 (83.3% and 59.5% respectively) in distinguishing between benign and malignant adnexal masses in premenopausal women
In 2008, the Food and Drug Administration (FDA) in the U.S. approved serum HE4 as a diagnostic tool for OC (N. S. Karlsen et al. 2014). Urinary HE4 has also been proven to be a feasible non-invasive diagnostic biomarker for OC. One meta-analysis of seven studies estimated a sensitivity of 76% and specificity of 92% for urine HE4 in detecting OC (Jia et al. 2017).
The advantage of HE4 over CA125 is its very low production in normal ovarian tissue. Consequently, while CA125 levels are often elevated in premenopausal women with endometriomas or other benign ovarian tumors, serum levels of HE4 remain normal (Huhtinen et al. 2009; Moore et al. 2008). The commonly used cutoff value for serum HE4 concentration is 70 pmol/L (Moore et al. 2008). Serum levels of HE4 increase along age and smoking (Bolstad et al. 2012). Pregnant women in every trimester have lower levels of HE4 than other premenopausal women (Moore et al. 2012). In contrast with HE4, serum levels of CA125 in postmenopausal women are significantly lower than in premenopausal women (Bon et al. 1996), which means it is more useful than HE4 with postmenopausal women. The guidelines of the Royal College of Obstetricians and Gynaecologists do not recommend the routine use of serum HE4 instead of CA125 in the diagnosis of postmenopausal ovarian neoplasms due to insufficient data (Royal College of Obstetricians and Gynaecologists 2016).
Higher HE4 levels can be associated with some non-malignant diseases, of which renal failure is the most significant, featuring HE4 levels that increase with the serum creatine concentration (Escudero et al. 2011). Serum HE4 levels are elevated in acute and chronic heart failure correlating with severity of the disease and renal function (de Boer et al. 2013; Piek et al. 2017). Significantly elevated HE4 levels are also found in malignancies, not only in epithelial OC but also in endometrial cancer, lung adenocarcinoma and transitional cell carcinoma. Patients with liver metastases from any cancer origin have been found to have elevated HE4 levels (Escudero et al. 2011; N. S. Karlsen et al. 2014).
34
2.2.3 The risk of malignancy algorithm
The serum HE4 biomarker has been studied and used mostly as a complementary biomarker for CA125. Moore et al. evaluated the risk of malignancy algorithm (ROMA) as a diagnostic marker for the prediction of ovarian tumors and combined serum CA125 and HE4 into two logistic regression algorithms depending on patients’ menopausal status. The ROMA algorithm classified tumors as a low or high risk in post- and premenopausal groups with sensitivities of 92% and 77% respectively and specificities of 75% in both groups (Moore et al. 2009). FDA approved ROMA as a preoperative test in evaluating ovarian tumors in 2011 (Miller & Ueland 2012).
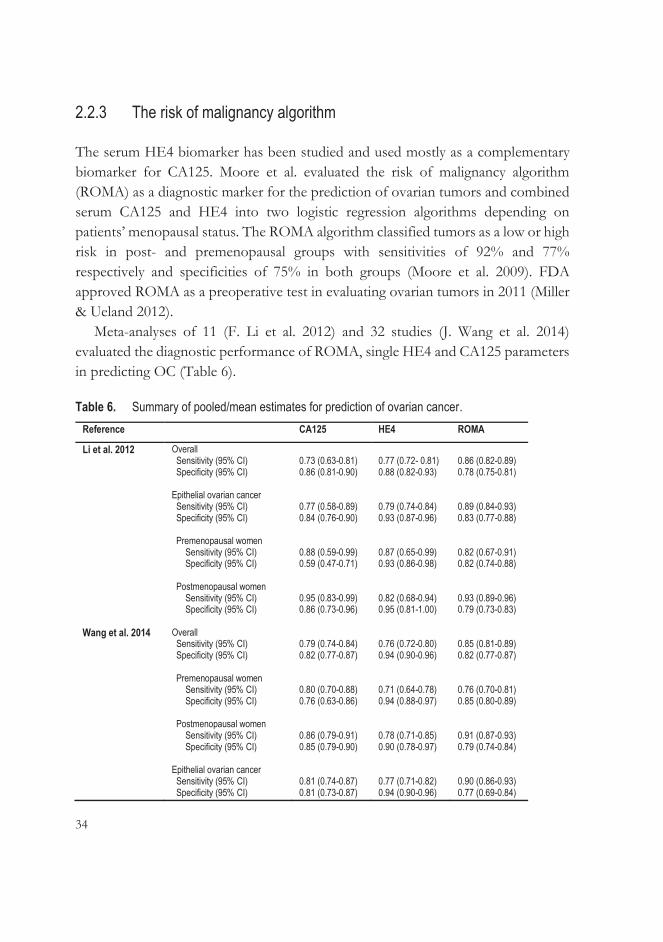
Meta-analyses of 11 (F. Li et al. 2012) and 32 studies (J. Wang et al. 2014) evaluated the diagnostic performance of ROMA, single HE4 and CA125 parameters in predicting OC (Table 6).
Table 6. Summary of pooled/mean estimates for prediction of ovarian cancer. Reference CA125 HE4 ROMA
Li et al. 2012 Overall Sensitivity (95% CI) Specificity (95% CI) Epithelial ovarian cancer Sensitivity (95% CI) Specificity (95% CI) Premenopausal women Sensitivity (95% CI) Specificity (95% CI) Postmenopausal women Sensitivity (95% CI) Specificity (95% CI)
0.73 (0.63-0.81) 0.86 (0.81-0.90) 0.77 (0.58-0.89) 0.84 (0.76-0.90) 0.88 (0.59-0.99) 0.59 (0.47-0.71) 0.95 (0.83-0.99) 0.86 (0.73-0.96)
0.77 (0.72- 0.81) 0.88 (0.82-0.93) 0.79 (0.74-0.84) 0.93 (0.87-0.96) 0.87 (0.65-0.99) 0.93 (0.86-0.98) 0.82 (0.68-0.94) 0.95 (0.81-1.00)
0.86 (0.82-0.89) 0.78 (0.75-0.81) 0.89 (0.84-0.93) 0.83 (0.77-0.88) 0.82 (0.67-0.91) 0.82 (0.74-0.88) 0.93 (0.89-0.96) 0.79 (0.73-0.83)
Wang et al. 2014 Overall Sensitivity (95% CI) Specificity (95% CI) Premenopausal women Sensitivity (95% CI) Specificity (95% CI) Postmenopausal women Sensitivity (95% CI) Specificity (95% CI) Epithelial ovarian cancer Sensitivity (95% CI) Specificity (95% CI)
0.79 (0.74-0.84) 0.82 (0.77-0.87) 0.80 (0.70-0.88) 0.76 (0.63-0.86) 0.86 (0.79-0.91) 0.85 (0.79-0.90) 0.81 (0.74-0.87) 0.81 (0.73-0.87)
0.76 (0.72-0.80) 0.94 (0.90-0.96) 0.71 (0.64-0.78) 0.94 (0.88-0.97) 0.78 (0.71-0.85) 0.90 (0.78-0.97) 0.77 (0.71-0.82) 0.94 (0.90-0.96)
0.85 (0.81-0.89) 0.82 (0.77-0.87) 0.76 (0.70-0.81) 0.85 (0.80-0.89) 0.91 (0.87-0.93) 0.79 (0.74-0.84) 0.90 (0.86-0.93) 0.77 (0.69-0.84)
35
In a prospective study of 1,218 patients with an adnexal tumor, HE4 and CA125 were measured and combined in a ROMA index. All three biomarkers were compared with the RMI, which considers CA125 value, menopausal status and US findings. Both ROMA and RMI indices improved the specificities of single CA125 and HE4 markers with a similar sensitivity. The areas under the curve (AUCs) of ROMA and the RMI were equivalent in distinguishing between OC and benign tumors but did not differ considerably from AUCs of CA125 or HE4 alone, whereas RMI was slightly more sensitive and specific than ROMA among premenopausal women (M. A. Karlsen et al. 2012).
2.2.4 Other biomarkers
CA125 lacks specificity in premenopausal ovarian tumors and sensitivity in the diagnosis of early-stage and mucinous OC, which is why many ovarian tumor markers have been tested together with CA125 to complement it (Duffy et al. 2005).
In 2009, the FDA approved a multivariate index assay, OVA1, to help in the clinical decision of whether to refer patients with undetermined ovarian tumors to a gynecologic oncologist. The OVA1 test includes five biomarkers: two upregulated (CA125 and β-2 microglobulin) and three downregulated proteins (transferrin, prealbumin and apolipoprotein A1). An appropriate software program, OvaCalc, combines the values of each protein and uses a multivariate index assay logarithm to form an ovarian malignancy risk index. The numeric results vary from 0.0 to 10.0, indicating a high probability of OC in premenopausal and postmenopausal women with respective values ≥5.0 and 4.4 (Miller & Ueland 2012).
In a study of Ueland et al. (2011), the sensitivity of OVA1 in identifying epithelial OC was 99%, compared to 83% with CA125. Even in premenopausal early-stage OCs (FIGO Stage I or II), the sensitivity was 93%, compared to 36% with CA125. It has been emphasized that the OVA1 test should be used only for decision-making regarding where ovarian tumor surgery should be performed. The cost of the test limits its availabity (Muller 2010).
Subsequently, a second-generation multivariate index assay has been developed that includes three OVA1 markers (CA125, transferrin and apolipoprotein A1) and two other markers (follicle-stimulating hormone and HE4). It achieved better specificity and positive predictive values than the previous OVA1 test, although the sensitivity and negative predictive value did not change (Coleman et al. 2016).
36
There are no good serum biomarkers for mucinous ovarian tumors. However, carcinoembryonic antigen (CEA) is considered to be the most applicable tumor marker (Brown & Frumovitz 2014), and tumor-associated trypsin inhibitor (TATI) combined with CA125 have achieved better accuracy than CA125 or TATI alone (Medl et al. 1995; Mogensen et al. 1990).
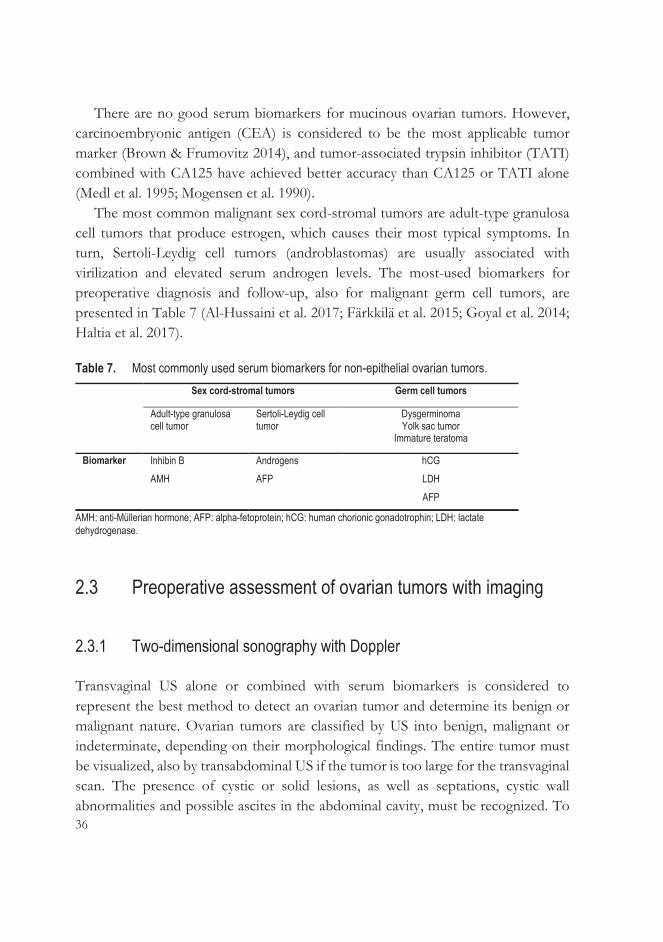
The most common malignant sex cord-stromal tumors are adult-type granulosa cell tumors that produce estrogen, which causes their most typical symptoms. In turn, Sertoli-Leydig cell tumors (androblastomas) are usually associated with virilization and elevated serum androgen levels. The most-used biomarkers for preoperative diagnosis and follow-up, also for malignant germ cell tumors, are presented in Table 7 (Al-Hussaini et al. 2017; Färkkilä et al. 2015; Goyal et al. 2014; Haltia et al. 2017).
Table 7. Most commonly used serum biomarkers for non-epithelial ovarian tumors. Sex cord-stromal tumors Germ cell tumors
Adult-type granulosa cell tumor
Sertoli-Leydig cell tumor
Dysgerminoma Yolk sac tumor
Immature teratoma
Biomarker Inhibin B AMH
Androgens AFP
hCG LDH AFP
AMH: anti-Müllerian hormone; AFP: alpha-fetoprotein; hCG: human chorionic gonadotrophin; LDH: lactate dehydrogenase.
2.3 Preoperative assessment of ovarian tumors with imaging
2.3.1 Two-dimensional sonography with Doppler
Transvaginal US alone or combined with serum biomarkers is considered to represent the best method to detect an ovarian tumor and determine its benign or malignant nature. Ovarian tumors are classified by US into benign, malignant or indeterminate, depending on their morphological findings. The entire tumor must be visualized, also by transabdominal US if the tumor is too large for the transvaginal scan. The presence of cystic or solid lesions, as well as septations, cystic wall abnormalities and possible ascites in the abdominal cavity, must be recognized. To
37
optimize the diagnostic performance of transvaginal US, many scoring and predicting models have been developed. In order to standardize the morphological terms, definitions and the US measurement and examination techniques, an international IOTA group of, currently, approximately 50 contributing clinical centers was founded in 1999 (Abramowicz & Timmerman 2017), and a consensus paper was published (Timmerman et al. 2000).
The assessment of the vascularity of ovarian tumors by color or power Doppler is combined with gray-scale morphologic sonography in the differential diagnosis of ovarian tumors. It is based on the increased neovascularization of malignant tumors, leading to low-impedance blood flow due to anatomical differences between normal blood vessels and those developed by tumor angiogenesis, which lack smooth muscle in their walls, resulting in a reduced resistance to flow (Miller & Ueland 2012). The impedance of the vascularity can be measured by using pulsatility (PI) and resistance indices (RI).
There have been attempts to determine cutoff levels for PI and RI, but the levels of benign and malignant tumors have been overlapping (Fleischer et al. 1991; Salem et al. 1994; Tekay & Jouppila 1992). While the entire tumor should be examined with color Doppler, PIs and RIs can be measured only from the areas selected. Additionally, the measurements are angle-dependent, which means decreased intra- and interobserver reproducibility.
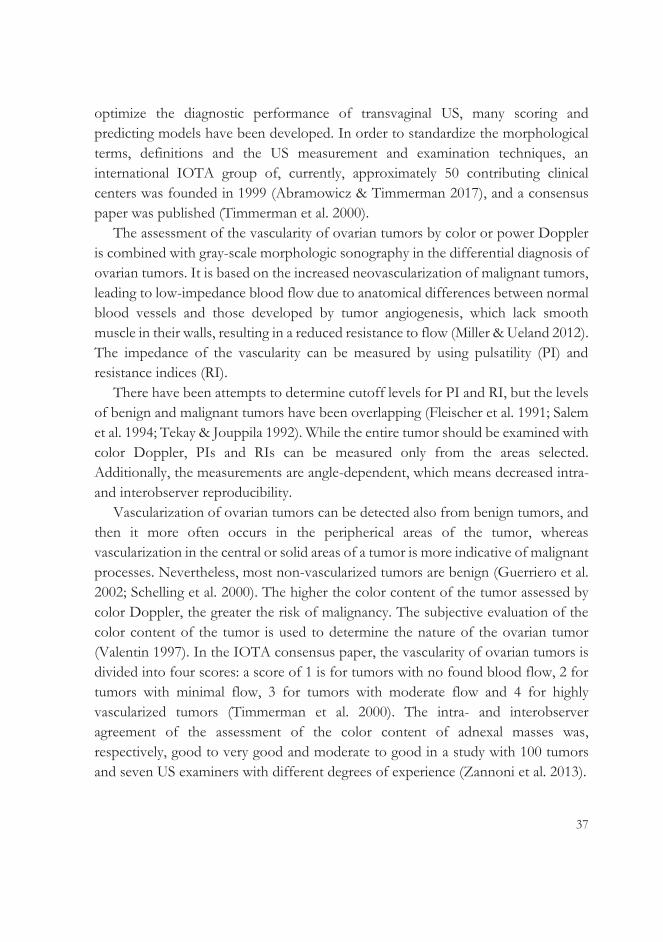
Vascularization of ovarian tumors can be detected also from benign tumors, and then it more often occurs in the peripherical areas of the tumor, whereas vascularization in the central or solid areas of a tumor is more indicative of malignant processes. Nevertheless, most non-vascularized tumors are benign (Guerriero et al. 2002; Schelling et al. 2000). The higher the color content of the tumor assessed by color Doppler, the greater the risk of malignancy. The subjective evaluation of the color content of the tumor is used to determine the nature of the ovarian tumor (Valentin 1997). In the IOTA consensus paper, the vascularity of ovarian tumors is divided into four scores: a score of 1 is for tumors with no found blood flow, 2 for tumors with minimal flow, 3 for tumors with moderate flow and 4 for highly vascularized tumors (Timmerman et al. 2000). The intra- and interobserver agreement of the assessment of the color content of adnexal masses was, respectively, good to very good and moderate to good in a study with 100 tumors and seven US examiners with different degrees of experience (Zannoni et al. 2013).
38
Figure 2. Vascularization of an ovarian tumor examined using color Doppler.
2.3.1.1 Risk of malignancy index
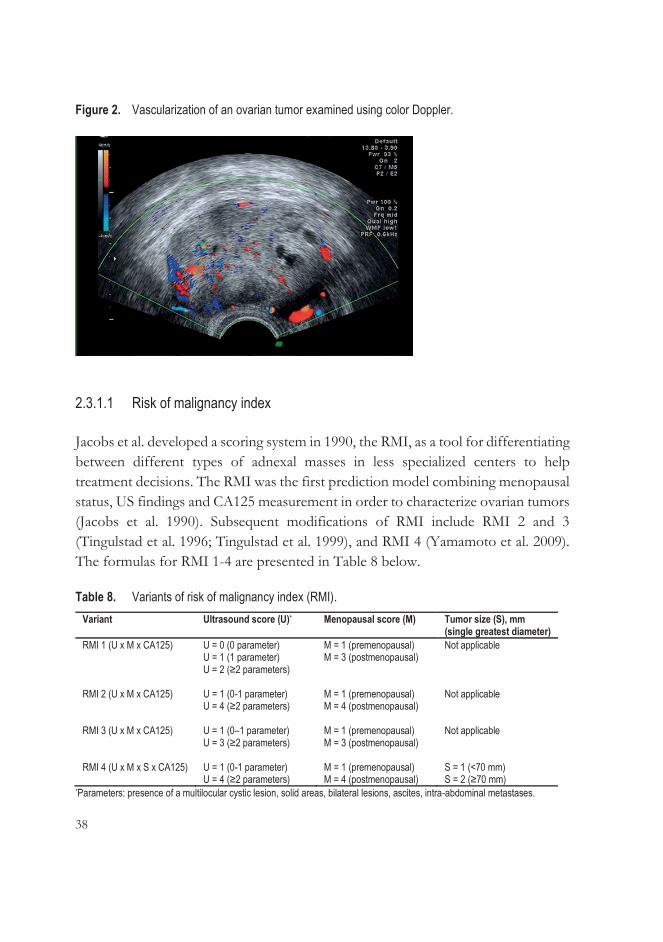
Jacobs et al. developed a scoring system in 1990, the RMI, as a tool for differentiating between different types of adnexal masses in less specialized centers to help treatment decisions. The RMI was the first prediction model combining menopausal status, US findings and CA125 measurement in order to characterize ovarian tumors (Jacobs et al. 1990). Subsequent modifications of RMI include RMI 2 and 3 (Tingulstad et al. 1996; Tingulstad et al. 1999), and RMI 4 (Yamamoto et al. 2009). The formulas for RMI 1-4 are presented in Table 8 below.
Table 8. Variants of risk of malignancy index (RMI). Variant Ultrasound score (U)* Menopausal score (M) Tumor size (S), mm
(single greatest diameter) RMI 1 (U x M x CA125) U = 0 (0 parameter)
U = 1 (1 parameter) U = 2 (≥2 parameters)
M = 1 (premenopausal) M = 3 (postmenopausal)
Not applicable
RMI 2 (U x M x CA125) U = 1 (0-1 parameter) U = 4 (≥2 parameters)
M = 1 (premenopausal) M = 4 (postmenopausal)
Not applicable
RMI 3 (U x M x CA125) U = 1 (0–1 parameter) U = 3 (≥2 parameters)
M = 1 (premenopausal) M = 3 (postmenopausal)
Not applicable
RMI 4 (U x M x S x CA125) U = 1 (0-1 parameter) U = 4 (≥2 parameters)
M = 1 (premenopausal) M = 4 (postmenopausal)
S = 1 (<70 mm) S = 2 (≥70 mm)
*Parameters: presence of a multilocular cystic lesion, solid areas, bilateral lesions, ascites, intra-abdominal metastases.

39
RMI 1 and RMI 2 have been assessed in 16 and seven clinical studies respectively. With a cutoff value of 200, their pooled sensitivity was 78% and specificity 87% (Geomini et al. 2009). The RMI may be above the threshold of 200 in many benign conditions and, on the other hand, may not in early malignancies. Therefore a cutoff level of 250 for the RMI is sometimes utilized, with a poorer sensitivity, 70%, but a better specificity, i.e. 90% (Royal College of Obstetricians and Gynaecologists 2016).
Three variants of RMI (RMI 1-3) were validated in a retrospective study of 152 women with pelvic masses. There were no significant differences between those three variants in identifying OC (Manjunath et al. 2001). RMI 4 proved to be the most accurate of all RMI variants in differentiating OC (Yamamoto et al. 2009), but later no significant differences were found in the performances of RMI 1-4 in another study (Campos et al. 2016). The original, RMI 1, is the most validated, and the other RMIs have not been found to be clinically more beneficial than RMI 1; therefore it is recommended as the scoring system for triaging ovarian tumors (Royal College of Obstetricians and Gynaecologists 2016).
2.3.1.2 IOTA Logistic regression models 1 and 2
After the standardization of the US terms and examination protocols (Timmerman et al. 2000), the IOTA group developed and internally validated, in 1999-2002, various risk prediction models from their database of 1,066 women for the preoperative evaluation of ovarian tumors. Subsequently, the most workable models were temporally and later externally validated in a new patient data set and compared with the other existing scoring models such as the RMI between 2002 and 2007 (Kaijser et al. 2013). A total of 11 mathematical prediction models developed by IOTA were validated using different statistical models and compared with various previously developed scoring and mathematical models. In an external validation study, the IOTA models performed similarly to and better than non-IOTA models (Van Holsbeke et al. 2012). However, the more complex statistical techniques did not improve the diagnostic performances of two more simple logistic regression models designed by IOTA called LR1 and LR2 (see Table 9; Kaijser et al. 2013).
40
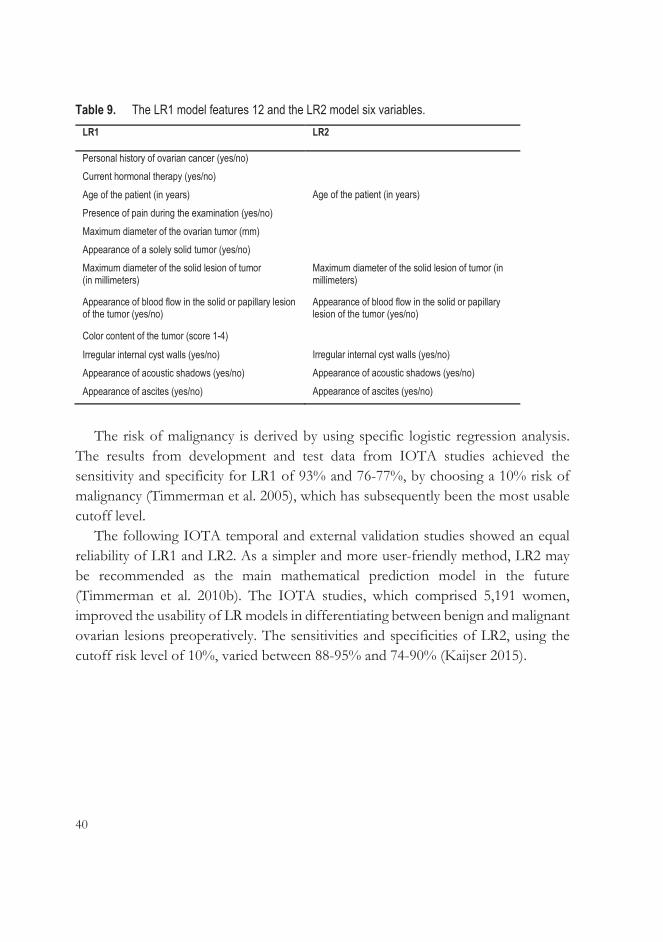
Table 9. The LR1 model features 12 and the LR2 model six variables. LR1
LR2
Personal history of ovarian cancer (yes/no) Current hormonal therapy (yes/no) Age of the patient (in years) Age of the patient (in years) Presence of pain during the examination (yes/no) Maximum diameter of the ovarian tumor (mm) Appearance of a solely solid tumor (yes/no) Maximum diameter of the solid lesion of tumor (in millimeters)
Maximum diameter of the solid lesion of tumor (in millimeters)
Appearance of blood flow in the solid or papillary lesion of the tumor (yes/no)
Appearance of blood flow in the solid or papillary lesion of the tumor (yes/no)
Color content of the tumor (score 1-4)
Irregular internal cyst walls (yes/no) Irregular internal cyst walls (yes/no) Appearance of acoustic shadows (yes/no) Appearance of acoustic shadows (yes/no) Appearance of ascites (yes/no) Appearance of ascites (yes/no)
The risk of malignancy is derived by using specific logistic regression analysis.
The results from development and test data from IOTA studies achieved the sensitivity and specificity for LR1 of 93% and 76-77%, by choosing a 10% risk of malignancy (Timmerman et al. 2005), which has subsequently been the most usable cutoff level.
The following IOTA temporal and external validation studies showed an equal reliability of LR1 and LR2. As a simpler and more user-friendly method, LR2 may be recommended as the main mathematical prediction model in the future (Timmerman et al. 2010b). The IOTA studies, which comprised 5,191 women, improved the usability of LR models in differentiating between benign and malignant ovarian lesions preoperatively. The sensitivities and specificities of LR2, using the cutoff risk level of 10%, varied between 88-95% and 74-90% (Kaijser 2015).
41
2.3.1.3 IOTA Simple rules
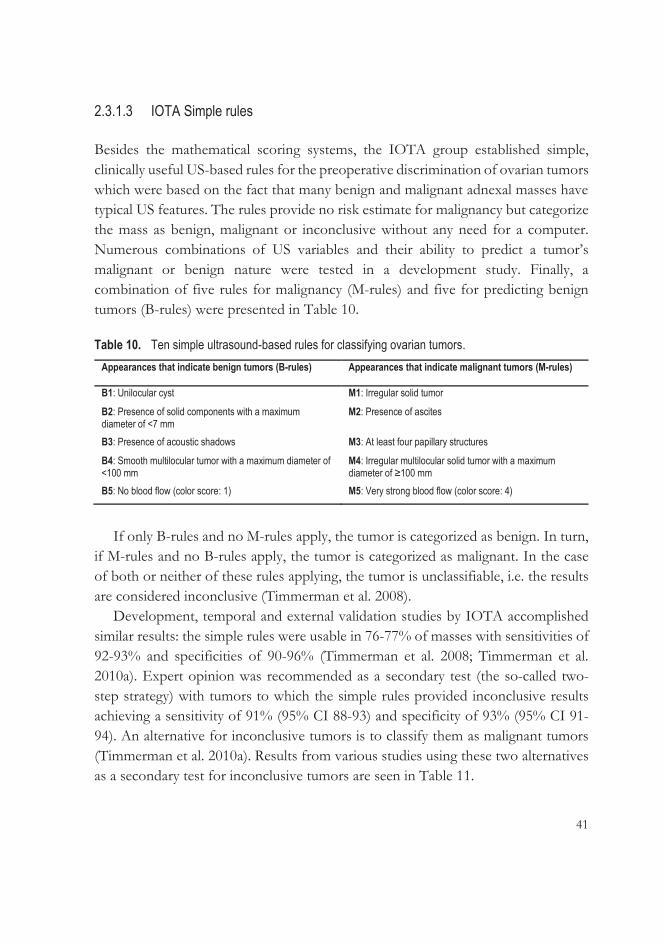
Besides the mathematical scoring systems, the IOTA group established simple, clinically useful US-based rules for the preoperative discrimination of ovarian tumors which were based on the fact that many benign and malignant adnexal masses have typical US features. The rules provide no risk estimate for malignancy but categorize the mass as benign, malignant or inconclusive without any need for a computer. Numerous combinations of US variables and their ability to predict a tumor’s malignant or benign nature were tested in a development study. Finally, a combination of five rules for malignancy (M-rules) and five for predicting benign tumors (B-rules) were presented in Table 10.
Table 10. Ten simple ultrasound-based rules for classifying ovarian tumors. Appearances that indicate benign tumors (B-rules)
Appearances that indicate malignant tumors (M-rules)
B1: Unilocular cyst M1: Irregular solid tumor
B2: Presence of solid components with a maximum diameter of <7 mm
M2: Presence of ascites
B3: Presence of acoustic shadows M3: At least four papillary structures
B4: Smooth multilocular tumor with a maximum diameter of <100 mm
M4: Irregular multilocular solid tumor with a maximum diameter of ≥100 mm
B5: No blood flow (color score: 1) M5: Very strong blood flow (color score: 4)
If only B-rules and no M-rules apply, the tumor is categorized as benign. In turn,
if M-rules and no B-rules apply, the tumor is categorized as malignant. In the case of both or neither of these rules applying, the tumor is unclassifiable, i.e. the results are considered inconclusive (Timmerman et al. 2008).
Development, temporal and external validation studies by IOTA accomplished similar results: the simple rules were usable in 76-77% of masses with sensitivities of 92-93% and specificities of 90-96% (Timmerman et al. 2008; Timmerman et al. 2010a). Expert opinion was recommended as a secondary test (the so-called two-step strategy) with tumors to which the simple rules provided inconclusive results achieving a sensitivity of 91% (95% CI 88-93) and specificity of 93% (95% CI 91-94). An alternative for inconclusive tumors is to classify them as malignant tumors (Timmerman et al. 2010a). Results from various studies using these two alternatives as a secondary test for inconclusive tumors are seen in Table 11.
42
Initially, the IOTA models (LR1, LR2 and simple rules) were validated by US experts, although the original idea was to utilize them as predictive tools for inexperienced clinicians for referrals to tertiary centers. Sayasneh et al. (2013) validated the LR models and simple rules in examiners with variable US experience and training. Their findings were in accordance with previous results from IOTA external studies showing IOTA predicting models working well also among non-experts. In fact, IOTA models demonstrated a better test performance than the RMI among examiners.
2.3.1.4 The Assessment of different neoplasias in the adnexa (ADNEX) model
The IOTA group also developed a mathematical polytomous risk-scoring model in order to distinguish between not only benign and malignant ovarian tumors but also to differentiate between benign, borderline, Stage I invasive, Stage II-IV, and secondary metastatic adnexal masses from each other. The need to categorize into four different types of malignancy arises from the desire to provide the optimal treatment and surgery and to plan it better preoperatively. The data from the first prospective diagnostic study originated in 5,909 nonpregnant women with adnexal tumors waiting for the surgery. The prediction model was designed to contain nine variables. The predictors included three clinical findings (age, serum CA125 level and the type of treatment center, i.e. tertiary oncological hospitals vs. other hospital types) and six US findings (maximum diameter of lesion, proportion of solid tissue, more than ten cystic locules, existence of acoustic shadows or/and ascites, and the number of papillary projections): the CA125 value and the solid portion of the tumor were the strongest ones. The ADNEX model calculates a total risk of malignancy and probabilities of the four types of malignancy. The developed risk scoring model is available for use on the website of the IOTA group and in mobile applications. When the 10% prediction level for malignancy was used, it yielded a sensitivity of 96.5% and a specificity of 71.3%. The AUCs classifying the four subtypes of malignancies varied from 0.71 to 0.95 (Van Calster et al. 2014). The cutoff level for malignancy can be modified depending on the local protocols in order to choose either a higher sensitivity, i.e. lower than 10% as the cutoff level, or a higher specificity, i.e. higher than 10% as the cutoff level (Van Calster et al. 2015).
43
A recent validation study compared the subjective assessment of an expert US examiner and four malignancy prediction models in differentiating the nature of an ovarian tumor preoperatively (Meys et al. 2017). The results are shown in Table 11.
2.3.1.5 Subjective assessment by an expert ultrasound examiner and comparison of various predictive methods
One of the best methods for preoperative analysis of ovarian tumors is subjective assessment (also called pattern recognition) of US findings after an accurate transvaginal examination by an experienced US examiner using two-dimensional (2D) sonography with Doppler (Valentin et al. 2001). However, in the hands of an expert, about 7% of the adnexal masses examined could not be distinguished as benign or malignant tumors, and the RMI or LR did not improve the classification. Tumors difficult to classify were multilocular cystic tumors with solid components, and histopathological diagnoses were borderline tumors, cystadeno(fibro)mas and fibromas (Valentin et al. 2011).
The IOTA methods and other scoring systems have been compared with subjective assessment, although they were developed more as diagnostic tools to help relatively inexperienced clinicians using US in primary and secondary centers. Table 11 shows the sensitivities and specificities of different scoring methods from three publications, or the IOTA Phase III study (Testa et al. 2014), the meta-analysis of 47 articles (Meys et al. 2016) and the external validation study of the ADNEX model (Meys et al. 2017).
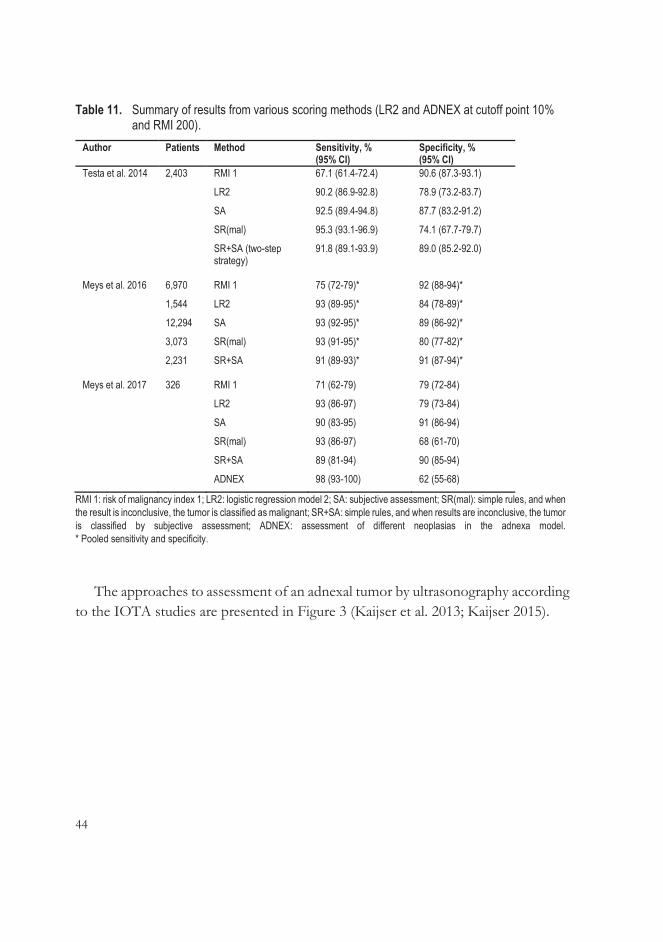
44
Table 11. Summary of results from various scoring methods (LR2 and ADNEX at cutoff point 10% and RMI 200).
Author Patients Method Sensitivity, % (95% CI)
Specificity, % (95% CI)
Testa et al. 2014 2,403 RMI 1 67.1 (61.4-72.4) 90.6 (87.3-93.1)
LR2 90.2 (86.9-92.8) 78.9 (73.2-83.7)
SA 92.5 (89.4-94.8) 87.7 (83.2-91.2)
SR(mal) 95.3 (93.1-96.9) 74.1 (67.7-79.7)
SR+SA (two-step strategy)
91.8 (89.1-93.9) 89.0 (85.2-92.0)
Meys et al. 2016 6,970 RMI 1 75 (72-79)* 92 (88-94)*
1,544 LR2 93 (89-95)* 84 (78-89)*
12,294 SA 93 (92-95)* 89 (86-92)*
3,073 SR(mal) 93 (91-95)* 80 (77-82)*
2,231 SR+SA 91 (89-93)* 91 (87-94)*
Meys et al. 2017 326 RMI 1 71 (62-79) 79 (72-84)
LR2 93 (86-97) 79 (73-84)
SA 90 (83-95) 91 (86-94)
SR(mal) 93 (86-97) 68 (61-70)
SR+SA 89 (81-94) 90 (85-94)
ADNEX 98 (93-100) 62 (55-68)
RMI 1: risk of malignancy index 1; LR2: logistic regression model 2; SA: subjective assessment; SR(mal): simple rules, and when the result is inconclusive, the tumor is classified as malignant; SR+SA: simple rules, and when results are inconclusive, the tumor is classified by subjective assessment; ADNEX: assessment of different neoplasias in the adnexa model. * Pooled sensitivity and specificity.
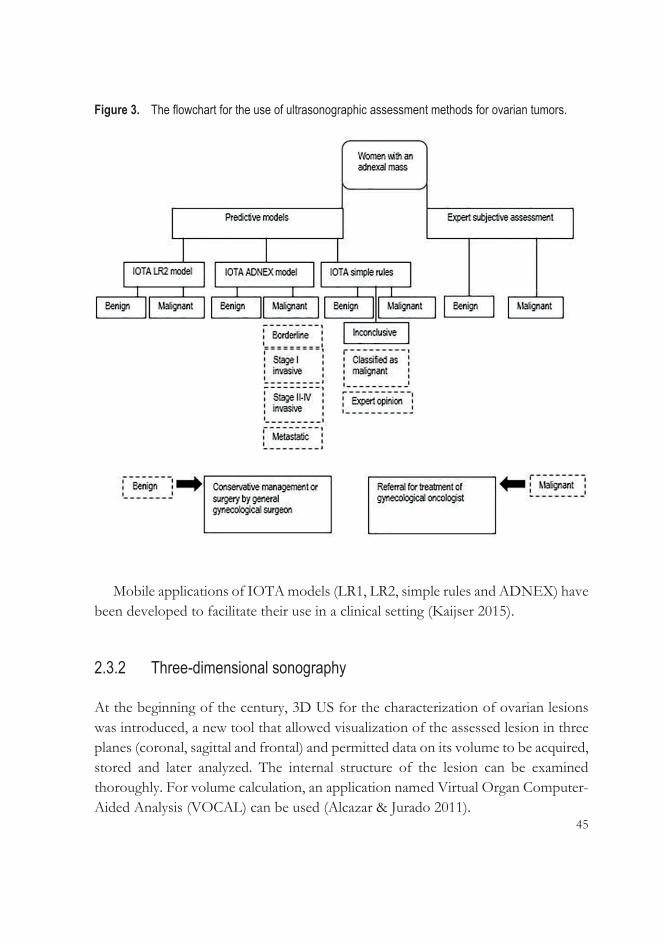
The approaches to assessment of an adnexal tumor by ultrasonography according to the IOTA studies are presented in Figure 3 (Kaijser et al. 2013; Kaijser 2015).
45
Figure 3. The flowchart for the use of ultrasonographic assessment methods for ovarian tumors.
Mobile applications of IOTA models (LR1, LR2, simple rules and ADNEX) have
been developed to facilitate their use in a clinical setting (Kaijser 2015).
2.3.2 Three-dimensional sonography
At the beginning of the century, 3D US for the characterization of ovarian lesions was introduced, a new tool that allowed visualization of the assessed lesion in three planes (coronal, sagittal and frontal) and permitted data on its volume to be acquired, stored and later analyzed. The internal structure of the lesion can be examined thoroughly. For volume calculation, an application named Virtual Organ Computer-Aided Analysis (VOCAL) can be used (Alcazar & Jurado 2011).

46
In addition to its morphology, the vascularization and flow pattern of the entire adnexal mass can be visualized using 3D-PD and VOCAL software. The term “Doppler imaging” usually refers to normal or color Doppler, which is based on Doppler frequency shifts relative to the velocity of blood flow. In turn, PD is based on the amplitude shift proportional to the number of blood cells detected. Compared to normal color Doppler, PD has some benefits like its sensitivity in noticing blood flow and characterizing vascular patterns (Alcazar & Castillo 2005). With the aid of 3D-PD, the architecture and density of the vascularity of the target can be described. Using the clinically popular 4D View software (GE Medical Systems, Zipf, Austria) and its histogram facility, the PD signal can be quantitatively measured. First, the examiner specifies the volume of interest whose PD signal intensities are demonstrated by histogram using VOCAL. Secondly, three vascular indices, vascularization index (VI), flow index (FI) and vascularization-flow index (VFI) are calculated with the aid of histogram utility. VI reflects the proportion of blood vessels within the assessed volume and is reported as a percentage. FI represents the mean PD intensity during the 3D sweep and is presented as a value of 0-100, as is the VFI, which is a combination of VI and FI. These indices are influenced by various internal and external factors: the local erythrocyte concentration, flow rate and number of vessels in the examined lesion, including its distance from the transducer, can affect them. Nevertheless, VI and VFI seemed to have a linear relationship with the changes in confounding factors in a phantom study (Raine-Fenning et al. 2008a). Many Doppler settings – especially gain, signal power and pulse repetition frequency – seem to have significant effects on the 3D-PD indices. Therefore, it is important to perform examinations using similar settings when comparing indices between persons and for the same patient (Raine-Fenning et al. 2008b).
2.3.2.1 Three-dimensional gray-scale morphologic ultrasound
Several studies comparing 3D US with traditional 2D US in determining malignant ovarian tumors have been published. These reports used 3D rendering or a multiplanar view to determine benign or malignant morphological characteristics such as irregular inner wall surface, papillary projection or thick septa, mostly solid tumor and echogenity of the tumor (Alcazar et al. 2003; Alcazar et al. 2007; Bonilla-Musoles et al. 1995; Chan et al. 1997; Hata et al. 1999; Kurjak et al. 2001).

47
The results are conflicting. Some studies found 3D US to provide positive additional value compared with 2D US (Bonilla-Musoles et al. 1995; Hata et al. 1999; Kurjak et al. 2001); other studies failed to demonstrate significant benefits over 2D US in classifying adnexal lesions (Alcazar et al. 2003; Alcazar et al. 2007). An explanation for this discrepancy may be that both the 2D US and 3D gray scale US methods are based on the subjective opinion of the examiner (Hata et al. 2011).
2.3.2.2 Three-dimensional power Doppler angiography
There are two approaches to the use of 3D-PD in evaluating adnexal tumors. One is evaluating the morphological changes in vessels suspected of malignancy, and the other is using an objective quantification of vascularity by the VOCAL program or some other software. The characteristics in vessels that can change with malignancy are density, caliber, tortuosity, irregular branching, and bridges between vessels (Sladkevicius et al. 2007).
The sensitivities and specificities of 3D-PD vs. 2D US varied between 77-100% vs. 94-100% and 50-99% vs. 50-97% in a review of seven studies involving the use of 3D-PD vascular tree assessment in detecting OC (Alcazar & Jurado 2011). Only one of seven studies showed a significant difference (p <0.05) between the detection ability of 3D-PD and 2D US, but it indicated that 2D US had an advantage (Dai et al. 2008). Nor did the review by Hata et al. (2011) find any significant or reported differences in the accuracies of 2D US and 3D-PD.
Alcazar et al. reported their results regarding quantification of 3D-PD vascular indices. They used a focused sampling from the most vascularized and suspected areas, and the indices were calculated automatically from that area using the VOCAL program. All PD indices differed significantly in ovarian malignancies compared with benign tumors (Alcazar et al. 2005), but the VIs and VFIs from ovarian tumors were significantly higher in advanced or metastasized OC than in early-stage cancers (Alcazar 2006). In a subsequent study of Geomini et al. (2007), only FI – and not VI or VFI – showed significantly higher levels in malignant tumors than in benign tumors when assessed from the whole tumor.
Modified approaches to vascular sampling have been developed based on automatically calculated 1-5 cm3 spherical samples from the most vascularized areas. The 3D-PD indices significantly separated benign and malignant tumors (Jokubkiene et al. 2007; Kudla & Alcazar 2010). Vascular sampling can also take place by manually

48
outlining the highly vascularized areas. Both methods can be used, but spherical sampling is not possible in all small tumors (Alcazar & Prka 2009).
Repeatability in assessments of 3D-PD indices in offline analyses from the stored 3D volumes has proved to be good, as is the intra- and interobserver agreement, regardless of the method used for vascular sampling (Alcazar et al. 2008; Alcazar & Prka 2009; Jokubkiene et al. 2007). The agreement of offline analysis with the real-time US results in the diagnosis of benign or malignant tumor was good, with a similar diagnostic performance (Alcazar et al. 2012). The IOTA US rules, color score system (scores 1-4), simple rules, LR1 and LR2 models, and expert opinion were analyzed later by other US examiners using stored 3D data. The intra- and interobserver agreement, also between examiners with different experience, varied mainly between moderate and good (Guerriero et al. 2013; Pineda et al. 2014; Ruiz de Gauna et al. 2014; Sladkevicius & Valentin 2013). However, it has been stated that offline analyses are not comparable with real-time US because they lack the interactive nature of examinations (Sladkevicius & Valentin 2013). In general, the use of 3D-PD indices and their importance in practical work is restricted by a lack of standardization and complete understanding of their significance (Guerriero et al. 2015).
2.3.3 Ultrasound contrast agents
Neovascularization, i.e. increased intratumoral microvascularization, is characteristic of malignancies, and color and power Doppler sonography is used to describe it. However, these techniques cannot detect vessels with a diameter of less than 0.1 mm. Intratumoral Doppler signals can be enhanced with the aid of intravascular sonographic contrast agents, which may promote earlier detection of OC (Testa et al. 2005).
Ultrasound contrast agents used intravenously contain microbubbles that are smaller than erythrocytes and can flow into capillaries, allowing the depiction of low volume blood flow. Pulse-inversion techniques with related software enable the description of contrast agent microbubbles in normal and neovascularized tumor tissues (Fleischer et al. 2010).
With the aid of modern software, second-generation contrast agents such as Definity® (perflutren, Lantheus Medical Imaging, North Billerica, MA), available in the U.S., and SonoVue® (sulfur hexafluoride, Bracco Imaging S.p.A, Milan, Italy)

49
can be detected by the harmonic response of microbubbles to US signals at a low acoustic pressure (Fleischer et al. 2010). The major advantage of SonoVue® is that microbubbles insonated by US persist in the blood for a few minutes (Testa et al. 2005).
The preliminary study by Testa et al. (2005) showed that SonoVue®, together with contrast-tuned imaging technology, allows for a higher number of intratumoral vessels in ovarian tumors to be detectable in a PD examination than without contrast media. Studies evaluating the kinetic parameters of second-generation contrast agents in US examinations have shown significantly different results in malignant and benign tumors (Fleischer et al. 2008; Testa et al. 2009; J. Wang et al. 2011), although the AUC of the best contrast variable was smaller than that of an expert opinion (Testa et al. 2009). The benefit of contrast-enhanced US appears to be uncertain because there is overlapping in the parameters of benign, borderline and malignant ovarian tumors; contrast agents are also rather expensive (Testa et al. 2009).
The ability of SonoVue®-enhanced US in discriminating ovarian tumors has also been studied in 3D sonography in small study series, also compared with 2D-enhanced US (Hu et al. 2014; Xiang et al. 2013). 3D-enhanced US may help especially in classifying early diagnoses of small ovarian malignancies, but larger validation studies are warranted to evaluate the possible advantages of combining 3D US technology and contrast-enhanced US.
2.3.4 Magnetic resonance imaging
The advantage of magnetic resonance imaging (MRI) is its high-contrast resolution, especially soft tissue contrast, without an exposure to ionizing radiation (Foti et al. 2016). The European Society of Urogenital Radiology has published guidelines that recommend the use of MRI together with an algorithm approach as an additional tool in identifying indeterminate ovarian masses. This protocol divides the unclear tumors into three categories based on the findings in T1- and T2- weighted sequences. The categories include additional imaging sequences – for example, fat-saturated T1-weighted or oblique sequences – or the assessment of intravenous gadolium-contrast enhancement (Spencer et al. 2010).
A meta-analysis of various preoperative methods determined the optimal method in presurgical identification of ovarian masses. The pooled sensitivity and specificity
50
from 24 datasets for conventional MRI techniques was 91.9% and 88.4% respectively and was similar to transvaginal 2D and 3D US (Dodge et al. 2012). In turn, earlier meta-analysis demonstrated that contrast-enhanced MRI appears to be more sensitive and specific than unenhanced MRI but increases only specificity as compared with 2D Doppler US (sensitivities 81% vs. 76% vs. 84%, and specificities 98% vs. 97% vs. 82% respectively) (Kinkel et al. 2005).
The addition of functional imaging via diffusion-weighted imaging (DWI) has provided controversial results in the literature. DWI measures randomly moving water molecules in tissues affected by hypercellularity and changes in cellular membrane integrity. The apparent diffusion coefficient (ADC) values derived from DWI provide information on the diffusivity of the imaged tissue (Sharma et al. 2016). A meta-analysis of 21 studies revealed no significant difference between the ADC values of benign and malignant ovarian tumors, although subgroup analysis of benign tumors produced higher ADC values than malignant ones. However, overlapping of ADC values was seen, as especially endometriomas and teratomas produced the very low ADCs typical of malignant tumors (Kim et al. 2016).
The use of dynamic contrast-enhanced MRI (DCE MRI) produces information on the vascularity and permeability of tumor as time-intensity curves after the injection of contrast agent (Sharma et al. 2016). The use of DWI and DCE MRI enables a morphologic and vascular assessment of tumors and improves the differentiation of complex ovarian lesions as well as peritoneal dissemination (Fujii et al. 2008; Sala et al. 2010; Thomassin-Naggara et al. 2008; Thomassin-Naggara et al. 2009; Thomassin-Naggara et al. 2011). The use of functional sequences, DWI and DCE MRI provided new criteria for ovarian tumor imaging and resulted in the development of an MRI scoring system for adnexal tumors (ADNEX MR scoring) (Thomassin-Naggara et al. 2013).
By virtue of these additional tools for ovarian tumor imaging, the guidelines by the European Society of Urogenital Radiology were reconsidered in 2016. The new guidelines recommend the use of DWI and DCE MRI especially in the cases of solid and complex cystic adnexal tumors (Forstner et al. 2016).
51
2.3.5 Computed tomography
Contrast-enhanced computed tomography (CT) is preferred for a preoperative evaluation of the extent of suspected OC and the likelihood of successful cytoreductive surgery, and for postoperative assessment of residual tumor tissue after surgery. The advantages of CT are its easy availability, shorter duration of examinations, and lower cost compared with MRI. In turn, the use of iodine-based contrast agent may be contraindicated, and exposure to radiation restricts its use (Fischerova & Burgetova 2014).
CT has a lower soft-tissue contrast than MRI, and will only miss small early-stage adnexal lesions (Bharwani et al. 2011). Contrast-enhanced MRI and CT are equally accurate modalities in the preoperative staging of OC. Their accuracy in detecting metastasized lymph nodes and peritoneal implants depends on their size, location and possible ascites. In one series, MRI was superior to CT in detecting pathological lymph nodes (p <0.04) while being equivalent for peritoneal implants (p <0.91) (Tempany et al. 2000).
2.3.6 Positron emission tomography/Computed tomography
Positron emission tomography (PET) uses a positron-emitting radiolabeled tracer, commonly 18F-2-fluoro-2-deoxy-D-glucose, which accumulates in the tissues and cells whose glucose metabolism is high, such as cancer cells. If PET is combined with CT (PET-CT), this enhanced glucose uptake can be anatomically localized to specific areas (Fischerova & Burgetova 2014).
PET-CT is not recommended for the primary diagnosis of OC due to a reported sensitivity of only 58% and a specificity of 76%. Elevated metabolic activity has been reported in inflammatory processes, endometriomas and premenopausal ovaries, depending on the phase of the menstrual cycle, resulting in false-positive results. In turn, false-negative results have been reported in borderline tumors and early-stage OCs (Fenchel et al. 2002).
PET-CT may, however, be of some use in the preoperative staging of OC. PET-CT is accurate in detecting regional lymph node and distant metastasis. There are studies showing better sensitivity for PET-CT in diagnosing pathological lymph nodes, especially retroperitoneal or supradiaphragmatic, than CT or MRI (Fischerova & Burgetova 2014; Khiewvan et al. 2017).

52
A summary of various imaging modalities and their main roles in imaging ovarian tumors is seen Table 12 (Fischerova et al. 2012; Fleischer et al. 2010; Guerriero et al. 2015; Khiewvan et al. 2017; Tempany et al. 2000).
Table 12. Summary of imaging modalities in ovarian cancer. Imaging modality
2D ultrasound 3D ultrasound Contrast-enhanced ultrasound
CT Dynamic contrast-enhanced MRI
PET-CT
First line evaluation of adnexal masses
Potential aid in preoperative discrimination of indeterminate tumors
Potential aid in preoperative discrimination of indeterminate tumors
Preoperative staging in advanced cancer (especially evaluation of peritoneal implants, sub-diaphragmatic space and hepatic surface)
Potential aid in preoperative discrimination of indeterminate tumors
Preoperative staging in advanced cancer? (especially evaluation of supra-diaphragmatic and retroperitoneal space)
Preoperative staging in advanced cancer as a supplement for CT or MRI (especially evaluation of liver and lymph nodes)
Preoperative staging in advanced cancer (especially evaluation of peritoneal implants, sub-diaphragmatic space, and hepatic surface)
In recurrent cancer
2.4 Polyamines
2.4.1 Overview of polyamine metabolism
Polyamines are low-molecular-weight polycations derived from amino acids, predominantly ornithine and methionine (Miller-Fleming et al. 2015). They are found in most living organisms, and nearly all cells can produce them. In addition to biosynthesis, polyamines are acquired from dietary sources and produced by the intestinal bacteria (Hussain et al. 2017). The most common polyamines in mammals

53
are putrescine, spermidine and spermine with respectively two, three and four amino groups in a hydrocarbon chain, followed by cadaverine and 1,3-diaminopropane (Miller-Fleming et al. 2015).
Ornithine, produced from arginine in the urea cycle, is converted to putrescine, which is the precursor for spermidine and spermine. Intracellular polyamine quantity is regulated by the monoacetylation of spermidine and the mono- and diacetylation of spermine. These acetylated polyamines can be either excreted to the urine or converted back to putrescine. Putrescine, spermidine and spermine can also be transported into the intracellular space (Gerner & Meyskens 2004). Synopsis of polyamine metabolism and key enzymes are presented in Figure 4.
Figure 4. Polyamine metabolism (modified from Gerner & Meyskens 2004; Seiler 2004; Soda 2011).
ODC: ornithine decarboxylase; N8SAT: spermidine-N8-acetyltransferase; SRM: spermidine synthase; SMS: spermine synthase; SSAT: spermidine/spermine N1-acetyltransferase; SMO: spermine oxidase; APAO: acetylpolyamine oxidase; DAX: diamine exporter.
Polyamines are involved in many body functions affecting cellular proliferation,
tissue growth and development, including gene transcription, posttranscriptional regulation, cell apoptosis, the control of ion channel activity, and the modulation of cell cycles, cell membrane structure and cell function. Polyamines also have anti-inflammatory properties and effects on protein synthesis (Hussain et al. 2017; Igarashi & Kashiwagi 2010; Pegg & Casero 2011).
54
2.4.1.1 Polyamines in cancer
An overactivation of polyamine synthesis is associated with carcinogenesis. It leads to elevated polyamine concentrations and the overexpression of genes and enzymes involved in polyamine biosynthesis in cancer cells (Thomas & Thomas 2003). Levels of the enzyme ornithine decarboxylase are increased in cancer tissues, and it is not only a target for Myc- and Ras-oncogenes, but also a potential oncogene itself because its overexpression can alter cell lines alone or together with other oncogenes (Casero et al. 2018; Gerner & Meyskens 2004; Miller-Fleming et al. 2015). Increased polyamine levels stimulate cell proliferation and decrease apoptosis, both of which are characteristic of cancer. Polyamines are also needed for angiogenesis in tumorigenesis (Gerner & Meyskens 2004).
In a hypoxic situation, cancer cells advance metastasizing and invasion by decreasing cell adhesion. Also, polyamine uptake from extracellular space is elevated due to hypoxia. The expression of the adhesion molecules CD44 and E-cadherin is reportedly diminished in malignancies, which promotes invasion and metastatic potential. Increased spermine levels in cells are shown to be involved in decreased CD44 expression (Tsujinaka et al. 2011), and they may also prevent normal antitumor immune cell function by decreasing the chemokine and cytokine production of immune cells and enabling tumor progression (Kano et al. 2007).
Arising from the association between cancer and polyamine metabolism, many therapeutical cancer treatments have been developed, albeit without great clinical success thus far. The most studied one is DL-α-difluoromethylornithine (DFMO), an irreversible binding inhibitor of ornithine decarboxylase (Bae et al. 2018; Murray-Stewart et al. 2016). DFMO has been found to reduce tumor growth in animal experiments and to have chemopreventive properties, also in clinical trials and mainly combined with other chemotherapeutic medications, e.g. in gliomas (Alexiou et al. 2017; Casero et al. 2018).
Elevated polyamine concentrations in the urine of cancer patients were first reported by Russell et al. over 45 years ago (Russell et al. 1971). They analyzed 24-hour urine samples using liquid chromatography-mass spectrometry (LC-MS), but, interestingly, the highest concentrations of putrescine, spermine and spermidine were found in a patient with a large solid benign ovarian teratoma. Polyamine levels dropped after tumor removal. Increased polyamine levels in the blood of cancer patients have also been found (Russell 1983; Uehara et al. 1980). Serum polyamine concentrations are correlated with urinary levels (Durie et al. 1977), demonstrating
55
that polyamines produced by malignancies are delivered to the circulation and excreted via the kidneys to urine (Soda 2011).
Polyamines are also produced in non-cancerous tissues and transferred to various organs such as the intestinal mucosa, where they can also be produced by the intestinal microbiota (Soda 2011; Timmons et al. 2012). In one study, an elevated polyamine nutritional intake over two months increased serum polyamine levels in mice and in humans (Soda et al. 2009). Thus, these factors must be taken into account in analyzing the polyamine levels in cancer patients. In addition, the individual variation in polyamine concentrations in healthy people is high, which makes it difficult to determine whether values are abnormal (Hiramatsu et al. 1995; Soda 2011). Furthermore, benign diseases such as polymyositis, hemolytic anemia and inflammatory bowel diseases can increase polyamine levels (Hiramatsu et al. 2005; Suh et al. 1997). Urinary polyamine concentrations are highest in the morning and higher in men than in women (Pöyhönen et al. 1990). In women, estrogen may affect at least some polyamine levels: premenopausal women with breast cancer have been found to have higher polyamine concentrations in serum, in contrast to postmenopausal patients and healthy controls (Byun et al. 2009).
2.4.2 Analysis of polyamines
Polyamines are found in cells in free and conjugated forms, and, in physiological fluids, mainly in acetylated forms. In healthy people, monoacetylated polyamines form the major component of polyamines in urine. Levels of N1, N12-diacetylspermine (DiAcSpm) and N1, N8-diacetylspermidine (DiAcSpd) in normal urine are 0.46% and 1.4% of total polyamines (Hiramatsu et al. 1995).
Several analytical methods used for polyamine analysis are based on LC and gas chromatography (GC). Most of these methods require pre- or post-column derivatization, and these different derivates can be detected with selective detectors, e.g. by measuring ultraviolet absorbance or fluorescence, or using mass spectrometry (MS). However, diacetylated polyamines without a free amino group cannot be derivatized and detected using conventional methods (Häkkinen et al. 2013; Jeevanandam & Petersen 2001).
For a long time, the polyamine field lacked a method of analyzing free, mono- and diacetylated amines simultaneously. Byun et al. (2008) reported a LC/MS method using an extractive carbamoylation to analyze ten polyamines simultaneously
56
from serum and urine of healthy women and patients with breast cancer. However, these polyamines did not include diacetylated forms. Häkkinen et al. (2013) published a LC-MS/MS method for the concurrent analysis of 14 urinary polyamines (free, mono- and diacetylated forms) without any derivatization.
DiAcSpd and DiAcSpm were first identified in normal human urine using high-performance liquid chromatography (HPLC) combined with an enzyme reactor (Hiramatsu et al. 1995). Because these diacetylated polyamines are studied as diagnostic and prognostic biomarkers, there was a demand for convenient and less-time-consuming analytics. Highly specific antibodies for DiAcSpd and DiAcSpm have been produced and enzyme-linked immunosorbent assays (ELISA) developed for urinary detection as alternatives to HPLC analysis (Hiramatsu et al. 1997; Hiramatsu et al. 1998). Concentrations of DiAcSpm and DiAcSpd measured by these ELISA-based methods have been shown to be comparable to concentrations obtained with HPLC. However, minimal cross-reaction with monoacetylated spermine and spermidine should be taken account in the analysis (Hamaoki et al. 2002). Subsequently, a kit for urinary DiAcSpm detection based on colloidal gold aggregation with automatic analyzers was developed for commercial use (Kawakita et al. 2011).
2.4.3 Polyamines as tumor markers
As a consequence of the first finding of elevated polyamine concentrations in the urine of cancer patients (Russell et al. 1971), the potential of polyamines to act as tumor markers for cancer was evaluated. Levels of monoacetylated polyamines, or the amount of N1-acetylspermidine and the ratio of N1-acetylspermidine to N8-acetylspermidine, were higher in the urine of patients with lymphoma (Abdel-Monem et al. 1982). However, their clinical use was proven to be limited due to their elevated concentrations also in benign disorders and a wide normal variation in the population (Kawakita & Hiramatsu 2006). Sugimoto et al. (1995) showed that the total amount of urinary polyamines and N1-acetylspermidine did not differ significantly in patients with and without cancer, and N1-acetylspermidine levels were often elevated in patients with benign diseases. However, the concentrations of DiAcSpd and DiAcSpm in cancer patients were significantly higher than in controls or people with benign disorders. This strongly promoted further research into DiAcSpd and DiAcSpm as tumor markers.

57
The metabolism of DiAcSpm and DiAcSpd is not totally clear: several mechanisms may lead to increased excretion. The source of DiAcSpm in cancer patients may be spermine produced either by cancerous or non-cancerous tissues (Takahashi, Sakaguchi et al. 2015). Levels of DiAcSpm are elevated in colorectal cancer tissues and even in precancerous lesions, which could be a sign that cancer cells produce DiAcSpm (Kuwata et al. 2013). The increased activity of the SSAT enzyme may also stimulate cancer cells to increase the excretion of acetylated polyamines as a feedback mechanism for elevated intracellular polyamine levels to control the polyamine homeostasis (Kawakita & Hiramatsu 2006). Despite the secretion of DiAcSpm into the circulation, its content in urine remains quite stable without any relevant decrease because it is not reabsorbed from the kidneys (Miki et al. 2005). Therefore, the glomerular clearance of DiAcSpm is analogous with that of creatinine, and the DiAcSpm concentrations are usually normalized in relation to creatinine concentrations (Takahashi, Horio et al. 2015). Provided this normalization with creatinine has been undertaken, single urine samples taken at any time of day, can be considered to reflect the general urinary concentration level of DiAcSpm of a given individual. However, the gender, age and menstrual cycle of the patient have effect on the concentrations (Hiramatsu et al. 2014).
The molecular character of the enzyme responsible for DiAcSpd is not identified, which may explain why studies of DiAcSpd as a tumor marker have waned (Kawakita & Hiramatsu 2006). On the other hand, DiAcSpm has been widely studied as a tumor and prognostic factor in malignancies including leukemias and urogenital, hepatocellular, colorectal, breast, pancreaticobiliary and non-small cell lung cancers (see Table 13). It is notable that, in studies of colorectal cancer, urinary DiAcSpm seems to be a more reliable tumor marker than CEA (Hiramatsu et al. 2005; Nakayama et al. 2012; Umemori et al. 2010).
Although increased concentrations of free and monoacetylated polyamines have previously been found in the urine of OC patients (Lawton et al. 1989; Suh et al. 1997), to the best of my knowledge, no previous literature on diacetylated polyamines involving OC is available.

58
Tabl
e 13.
Ove
rview
of st
udies
invo
lving
urina
ry N1 ,
N12-d
iacety
lsper
mine
(DiA
cSpm
) as a
tumo
r or p
rogn
ostic
mar
ker in
vario
us ca
ncer
s. St
udy
P
atien
ts
Meth
od
Resu
lts
Extra
Hira
mat
su et
al. 1
997
31 ur
ogen
ital c
ance
rs 42
benig
n uro
genit
al dis
orde
rs HP
LC w
ith
electr
oche
mica
l dete
ction
↑
sign
ifican
tly in
canc
ers
DiAc
Spd a
lso ↑
in ca
ncer
s. Pr
ogno
sis of
canc
er w
as go
od
when
DiA
cSpm
and D
iAcS
pd
norm
alize
d afte
r tre
atmen
t.
Lee e
t al. 1
998
43
leuk
emias
32
healt
hy co
ntrols
GC
with
nitro
gen-
phos
phor
us de
tectio
n ↑
signif
icantl
y in l
euke
mias
Enjo
ji et a
l. 200
4 53
hepa
tocell
ular c
ance
rs (S
tages
I-IV
) 18
2 ben
ign liv
er di
seas
es
ELIS
A 65
.5% se
nsitiv
ity an
d 76.0
%
spec
ificity
in ca
ncer
s 63
.8% se
nsitiv
ity fo
r AFP
. Di
AcSp
m va
lues i
ncre
ased
alon
g the
stag
e.
Hira
mat
su et
al. 2
005
248 c
olon c
ance
rs (S
tages
0-IV
) 83
brea
st ca
ncer
s (St
ages
I-IV
) 51
benig
n gas
troint
estin
al dis
ease
s
ELIS
A 75
.8% se
nsitiv
ity in
all c
olon
canc
ers (
62.5%
and 9
0.5%
in
Stag
e I an
d IV
colon
canc
ers)
and
61.4%
sens
itivity
in al
l bre
ast
canc
ers
39.5%
sens
itivity
for C
EA in
all
colon
canc
ers.
(1
0.0%
and 6
6.7%
in S
tage I
and
Stag
e IV
canc
ers).
Yam
aguc
hi et
al. 2
005
32 pa
ncre
atico
biliar
y can
cers
(Stag
es
IIb-IV
) 52
benig
n pan
creati
cobil
iary d
iseas
es
ELIS
A 75
% se
nsitiv
ity an
d 81%
spec
ificity
in
canc
ers
44%
sens
itivity
and 9
2% sp
ecific
ity
for C
EA.
75%
sens
itivity
and 8
0% sp
ecific
ity
for C
A 19
-9.
Umem
ori e
t al. 2
010
33 co
lorec
tal ca
ncer
s (St
ages
I-IV
) 28
brea
st ca
ncer
s (St
ages
0-IV
) EL
ISA
69.6%
sens
itivity
in co
lorec
tal
canc
ers a
nd 46
.4% se
nsitiv
ity in
br
east
canc
ers
46.8%
of se
nsitiv
ity fo
r CEA
in
color
ectal
canc
ers.
Naka
yam
a et a
l. 201
2 11
3 colo
recta
l can
cers
Collo
idal g
old ag
greg
ation
69
.0% of
canc
ers h
ad po
sitive
ra
tios o
f DiA
cSpm
(66.7
% in
early
an
d 69.2
% in
adva
nced
canc
ers)
44.2%
of ca
ncer
s had
posit
ive
ratio
s of s
erum
CEA
(11.1
% in
ea
rly an
d 47.1
% in
adva
nced
ca
ncer
s).
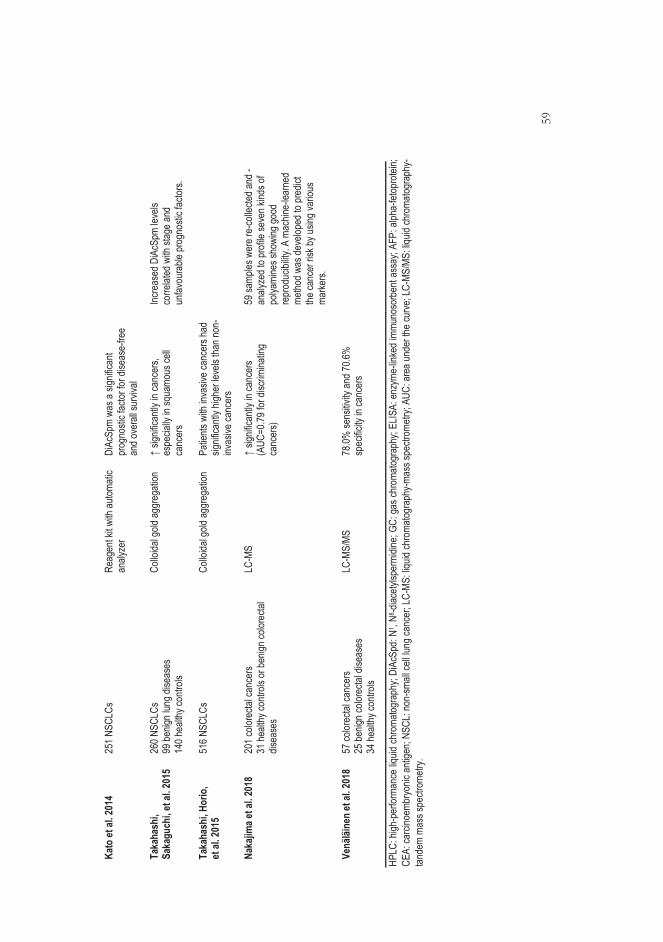
59
Kato
et al
. 201
4 25
1 NSC
LCs
Reag
ent k
it with
autom
atic
analy
zer
DiAc
Spm
was a
sign
ifican
t pr
ogno
stic f
actor
for d
iseas
e-fre
e an
d ove
rall s
urviv
al
Taka
hash
i, Sa
kagu
chi, e
t al. 2
015
Taka
hash
i, Hor
io,
et al
. 201
5
260 N
SCLC
s 99
benig
n lun
g dise
ases
14
0 hea
lthy c
ontro
ls 51
6 NSC
LCs
Collo
idal g
old ag
greg
ation
Co
lloida
l gold
aggr
egati
on
↑ sig
nifica
ntly i
n can
cers,
es
pecia
lly in
squa
mous
cell
canc
ers
Patie
nts w
ith in
vasiv
e can
cers
had
signif
icantl
y high
er le
vels
than n
on-
invas
ive ca
ncer
s
Incre
ased
DiA
cSpm
leve
ls co
rrelat
ed w
ith st
age a
nd
unfav
oura
ble pr
ogno
stic f
actor
s.
Naka
jima e
t al. 2
018
201 c
olore
ctal c
ance
rs 31
healt
hy co
ntrols
or be
nign c
olore
ctal
disea
ses
LC-M
S ↑
signif
icantl
y in c
ance
rs (A
UC=0
.79 fo
r disc
rimina
ting
canc
ers)
59 sa
mples
wer
e re-
colle
cted a
nd -
analy
zed t
o pro
file se
ven k
inds o
f po
lyami
nes s
howi
ng go
od
repr
oduc
ibility
. A m
achin
e-lea
rned
me
thod w
as de
velop
ed to
pred
ict
the ca
ncer
risk b
y usin
g var
ious
marke
rs.
Ve
näläi
nen
et al
. 201
8 57
color
ectal
canc
ers
25 be
nign c
olore
ctal d
iseas
es
34 he
althy
contr
ols
LC-M
S/MS
78
.0% se
nsitiv
ity an
d 70.6
%
spec
ificity
in ca
ncer
s
HPLC
: high
-per
forma
nce
liquid
chro
matog
raph
y; Di
AcSp
d: N
1 , N8 -d
iacety
lsper
midin
e; GC
: gas
chro
matog
raph
y; EL
ISA:
enz
yme-
linke
d im
muno
sorb
ent a
ssay
; AFP
: alph
a-fet
opro
tein;
CEA:
carci
noem
bryo
nic a
ntige
n; NS
CL: n
on-sm
all ce
ll lun
g can
cer;
LC-M
S: liq
uid ch
roma
togra
phy-m
ass s
pectr
ometr
y; AU
C: a
rea u
nder
the
curve
; LC-
MS/M
S: liq
uid ch
roma
togra
phy-
tande
m ma
ss sp
ectro
metry
.
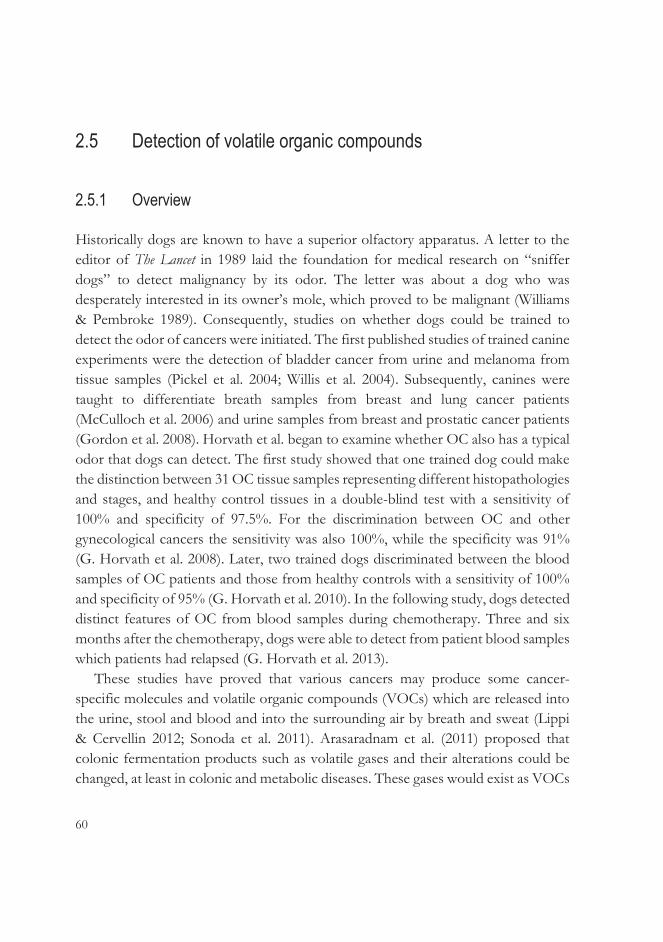
60
2.5 Detection of volatile organic compounds
2.5.1 Overview
Historically dogs are known to have a superior olfactory apparatus. A letter to the editor of The Lancet in 1989 laid the foundation for medical research on “sniffer dogs” to detect malignancy by its odor. The letter was about a dog who was desperately interested in its owner’s mole, which proved to be malignant (Williams & Pembroke 1989). Consequently, studies on whether dogs could be trained to detect the odor of cancers were initiated. The first published studies of trained canine experiments were the detection of bladder cancer from urine and melanoma from tissue samples (Pickel et al. 2004; Willis et al. 2004). Subsequently, canines were taught to differentiate breath samples from breast and lung cancer patients (McCulloch et al. 2006) and urine samples from breast and prostatic cancer patients (Gordon et al. 2008). Horvath et al. began to examine whether OC also has a typical odor that dogs can detect. The first study showed that one trained dog could make the distinction between 31 OC tissue samples representing different histopathologies and stages, and healthy control tissues in a double-blind test with a sensitivity of 100% and specificity of 97.5%. For the discrimination between OC and other gynecological cancers the sensitivity was also 100%, while the specificity was 91% (G. Horvath et al. 2008). Later, two trained dogs discriminated between the blood samples of OC patients and those from healthy controls with a sensitivity of 100% and specificity of 95% (G. Horvath et al. 2010). In the following study, dogs detected distinct features of OC from blood samples during chemotherapy. Three and six months after the chemotherapy, dogs were able to detect from patient blood samples which patients had relapsed (G. Horvath et al. 2013).
These studies have proved that various cancers may produce some cancer-specific molecules and volatile organic compounds (VOCs) which are released into the urine, stool and blood and into the surrounding air by breath and sweat (Lippi & Cervellin 2012; Sonoda et al. 2011). Arasaradnam et al. (2011) proposed that colonic fermentation products such as volatile gases and their alterations could be changed, at least in colonic and metabolic diseases. These gases would exist as VOCs

61
and be detected in the urine of patients with colorectal inflammatory disease and diabetes.
Clinical use of the excellent canine sense of olfaction is challenging, because the dogs require highly specified and intensive training and, even then, their ability to detect odors differs from individual to individual, even in the case of the same dog. Therefore, artificial methods to replace the canine olfactory system have been developed.
2.5.2 Technical analytical methods
The gold standard for the analysis of VOCs is GC-MS. Analyzing volatile molecules by MS is a quantitative method; however, it has limitations in clinical settings, e.g. large and expensive equipment which requires well-trained operators and time-consuming procedures. Due to these restrictions, there has been an interest in developing new non-invasive, simple and rapid methods of detecting VOCs. The utilization of the eNose in the medical field began in the nineties; a range of applications have subsequently been developed (D'Amico et al. 2012). An eNose consists of an array of non-selective sensors which recognize not simply one VOC but, rather, respond to all the volatile information from the sample by creating a qualitative spectrum reflecting it (Bernabei et al. 2008; Z. Zhang & Li 2010). The principles for all techniques that mimic human olfactory system are similar (Wilson & Baietto 2011).
Figure 5. The process of VOC analytics.
First, the sample is processed by a sampling technique responsible for introducing odors to the analyzer. The aim of such a technique is to collect an optimal and homogenous sample by enriching and cleaning the sample, and then amplifying it. Static headspace extraction is one of the most common ways of delivering the sample to the sensor. The sample is stored in a hermetic container from which accumulated volatile gases can be extracted when an equilibrium has been reached between the

62
matrix and the gas phase in the headspace. In the dynamic headspace technique, the VOCs of the sample are removed by the continuous gas flow that conveys the molecules to the sensor. Solid-phase microextraction employs a fiber-coated solid material in the headspace of the sample in which volatile compounds are adsorbed. The volatile molecules are extracted from the headspace and released from the material via heating (S. Chen et al. 2013).
The first eNose sensor arrays were metal oxide semiconductor sensors, and more advanced technologies for gas sensing have since been established (S. Chen et al. 2013). Information generated from sensor arrays is analyzed by data computing systems using pattern recognition methods. The analysis begins when signals from sensors are obtained and stored in the computer. Signal preprocessing is conducted to remove noise, optimize signal quality and select the descriptive patterns of the arrays and create a vector from them for further processing. Pattern recognition methods are unsupervised and supervised learning procedures. In unsupervised learning, different algorithms learn to extract features from the vectors that might classify these odor vectors without any knowledge of the status of the samples. Principal component analysis is the technique most often used to accomplish this. In supervised learning, the unknown odor is classified according to the previously existing knowledge about the feature. Typically, this pattern recognition method requires several samples in order to form this knowledge basis. With supervised learning, the classifier is given the information regarding the status of the sample (eg. healthy or diseased). The classifier then attempts to find the features that distinguish the two groups from each other with maximum accuracy. Linear discriminant analysis (LDA) is an example of supervised learning methods. When the classifier of the odor data has been found, it must be cross-validated to avoid overfitting, a phenomenon in which samples are discriminated according to unique features of the dataset that do not generalize to another population. Thus, all eNose results should be cross-validated by an independent sample population or in smaller datasets by leave-one-out cross-validation (S. Chen et al. 2013).
2.5.2.1 Field asymmetric waveform ion mobility spectrometry
ENose technology suffers from poor repeatability and sensitivity due to indiscriminate chemical interactions between the sample and the sensors. Ion mobility spectrometry is a variant of eNose technology between MS and traditional
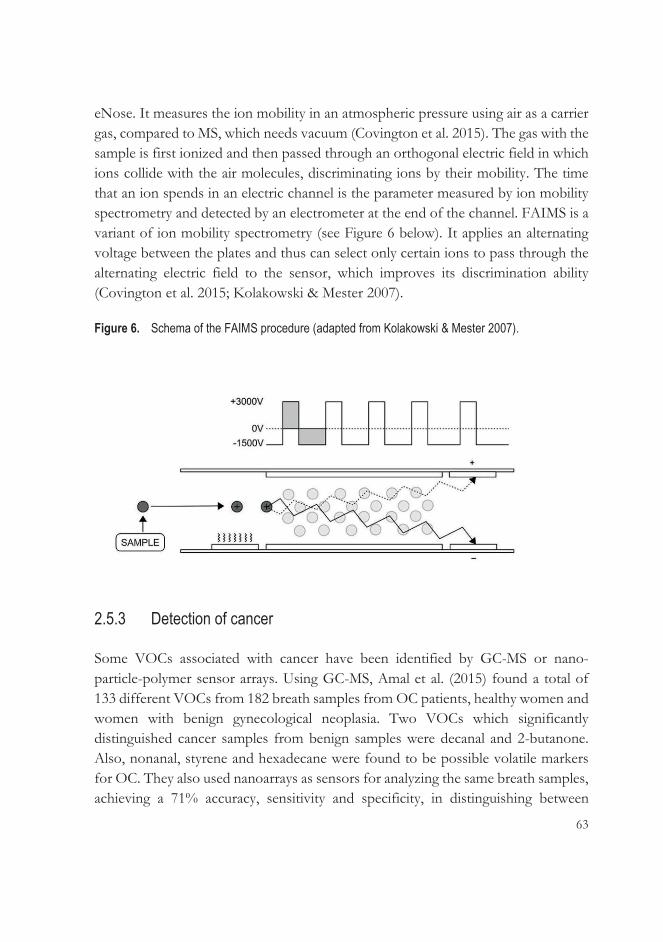
63
eNose. It measures the ion mobility in an atmospheric pressure using air as a carrier gas, compared to MS, which needs vacuum (Covington et al. 2015). The gas with the sample is first ionized and then passed through an orthogonal electric field in which ions collide with the air molecules, discriminating ions by their mobility. The time that an ion spends in an electric channel is the parameter measured by ion mobility spectrometry and detected by an electrometer at the end of the channel. FAIMS is a variant of ion mobility spectrometry (see Figure 6 below). It applies an alternating voltage between the plates and thus can select only certain ions to pass through the alternating electric field to the sensor, which improves its discrimination ability (Covington et al. 2015; Kolakowski & Mester 2007).
Figure 6. Schema of the FAIMS procedure (adapted from Kolakowski & Mester 2007).
2.5.3 Detection of cancer
Some VOCs associated with cancer have been identified by GC-MS or nano-particle-polymer sensor arrays. Using GC-MS, Amal et al. (2015) found a total of 133 different VOCs from 182 breath samples from OC patients, healthy women and women with benign gynecological neoplasia. Two VOCs which significantly distinguished cancer samples from benign samples were decanal and 2-butanone. Also, nonanal, styrene and hexadecane were found to be possible volatile markers for OC. They also used nanoarrays as sensors for analyzing the same breath samples, achieving a 71% accuracy, sensitivity and specificity, in distinguishing between

64
samples from OC patients and all other samples. Subsequently, another breath array for OC diagnostics was reported, based on modified gold nanoparticles as sensors. An array of ten sensors was exposed to the VOCs previously linked to OC. The researchers analyzed breath samples from 26 healthy controls and 17 women with epithelial OC. The analysis of all sensors separated the groups with an accuracy of 83.7%, a sensitivity of 82.3% and a specificity of 84.6% (Kahn et al. 2015).
The ability of various applications of the eNose to detect cancer has been investigated with various malignancies. Lung cancer has been studied most by eNose. The first examination of breath samples discriminated lung cancer patients from controls with an accuracy of 90.3% (Di Natale et al. 2003). Later, bladder (Bernabei et al. 2008; Weber et al. 2011) and prostate (Bernabei et al. 2008; Roine et al. 2014) cancers were detected from urinary headspace and breast, colorectal and prostatic cancers from breath samples (Peng et al. 2010), as well as colorectal cancer from fecal headspace (de Meij et al. 2014) with the eNose.
Horvath et al. tested the capability of eNose to discriminate OC tissue odor from that of healthy gynecological tissue. A total of 23 tissue samples from grade 3 seropapillary carcinomas were analyzed in a pilot and external validation study. The overall sensitivity of the results was 84% and the specificity 86.8% (G. Horvath, Chilo et al. 2010).
There are only two studies published in which FAIMS was used as a detector of cancer. With the aid of FAIMS, colorectal cancer was detected in urine samples of 83 cancer patients compared to 50 healthy controls, with a sensitivity of 88% and specificity of 60% (Arasaradnam et al. 2014). From urine headspace, FAIMS differentiated between pancreatic cancer patients (N=81) and healthy controls (N=81) with a sensitivity of 91% and specificity of 83%. Even the urine from early-stage cancer patients was differentiated significantly from that from controls (Arasaradnam et al. 2018).
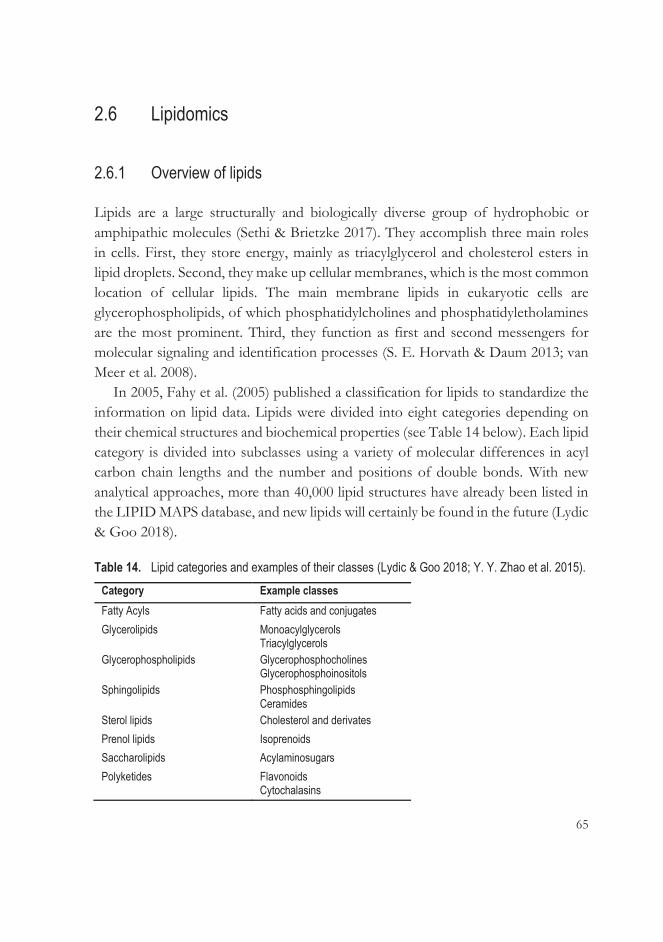
65
2.6 Lipidomics
2.6.1 Overview of lipids
Lipids are a large structurally and biologically diverse group of hydrophobic or amphipathic molecules (Sethi & Brietzke 2017). They accomplish three main roles in cells. First, they store energy, mainly as triacylglycerol and cholesterol esters in lipid droplets. Second, they make up cellular membranes, which is the most common location of cellular lipids. The main membrane lipids in eukaryotic cells are glycerophospholipids, of which phosphatidylcholines and phosphatidyletholamines are the most prominent. Third, they function as first and second messengers for molecular signaling and identification processes (S. E. Horvath & Daum 2013; van Meer et al. 2008).
In 2005, Fahy et al. (2005) published a classification for lipids to standardize the information on lipid data. Lipids were divided into eight categories depending on their chemical structures and biochemical properties (see Table 14 below). Each lipid category is divided into subclasses using a variety of molecular differences in acyl carbon chain lengths and the number and positions of double bonds. With new analytical approaches, more than 40,000 lipid structures have already been listed in the LIPID MAPS database, and new lipids will certainly be found in the future (Lydic & Goo 2018).
Table 14. Lipid categories and examples of their classes (Lydic & Goo 2018; Y. Y. Zhao et al. 2015). Category Example classes Fatty Acyls Fatty acids and conjugates Glycerolipids Monoacylglycerols
Triacylglycerols Glycerophospholipids Glycerophosphocholines
Glycerophosphoinositols Sphingolipids Phosphosphingolipids
Ceramides Sterol lipids Cholesterol and derivates Prenol lipids Isoprenoids Saccharolipids Acylaminosugars Polyketides Flavonoids
Cytochalasins

66
Daily nutrition, genetic background and diseases have an influence on lipid contents and concentrations in plasma. Plasma lipids are transported by lipoproteins into the circulation and tissues. Lipoproteins, which consist of lipids and apolipoproteins, are separated into different classes: chylomicron, very low-density lipoprotein (VLDL), low-density lipoprotein (LDL) and high-density lipoprotein (HDL). Each lipoprotein has its own function in plasma lipid delivery (Lydic & Goo 2018).
2.6.2 Analytical methods for lipidomics
Lipidomics is a branch of metabolomics that characterizes, identifies and quantifies lipid species and their multiple biological roles (Y. Y. Zhao et al. 2015). It emerged in the literature in 2003 (Han & Gross 2003; Lagarde et al. 2003) and has progressed since then, especially with recent technological advancements. Lipid profiling from cells, biological fluids and tissues provides new insights into pathophysiology, diagnostics and treatment of different diseases (Lydic & Goo 2018).
There are two ways to analyze lipids: targeted and non-targeted analysis. In targeted analysis, specific lipids are investigated using an accurate method for quantification. The principle behind non-targeted analysis is to analyze all possible lipid species simultaneously (Sethi & Brietzke 2017). A lipidomic analysis involves multiple processes in the workflow to identify and quantify many lipids at the same time (Figure 7).
Figure 7. The workflow for lipidomics (modified from Lydic & Goo 2018; Yang & Han 2016).
LC: liquid chromatography; GC: gas chromatography; NMR: nuclear magnetic resonance.
67
Normally, a 5-100 μL of plasma or serum or 1-100 mg of tissue is required for lipid profiling. The first step in lipidomic analysis is the extraction of lipids from the sample to remove proteins, saccharides and other compounds (Sethi & Brietzke 2017). Liquid-liquid extraction developed by Folch et al. (1957) is the most common method of isolating lipids, and the organic solvent used is a combination of chloroform and methanol. Other solvents have also been used for extraction, depending on the hydrophobicity and amount of lipids in the sample. Liquid-liquid extraction is well-suited for a diverse spectrum of lipids in non-targeted lipidomics. Other extraction methods have also been developed in recent years, e.g. solid-phase extraction, a rapid method that performs better in targeted lipidomics (Lydic & Goo 2018; Y. Y. Zhao et al. 2015).
MS- or non-MS-based methods such as nuclear magnetic resonance (NMR) spectroscopy are utilized in lipidomics to detect lipids. After lipid extraction, various chromatographic methods such as GC, LC, thin layer chromatography and HPLC are often used to separate a broad range of lipids from complex samples before detection. Another option is to infuse lipids after ionization directly into MS for detection without prior separation. This method, called shotgun lipidomics, is rapid but more suitable for untargeted lipid profiling than chromatography with MS. These two methods are considered to complement each other (Lydic & Goo 2018; Sethi & Brietzke 2017; Y. Y. Zhao et al. 2015).
The profusion of lipid species is identified from the chromatographic (e.g. LC-MS) and MS/MS spectral data and quantified by comparisons of peak areas and ion peak intensities against standards (Lydic & Goo 2018). The data processed by lipidomics is enormous because each sample can contain a large number of lipid species. Therefore, there are several data-processing software options, in addition to analytical lipid databases, that can be used to aid such efforts (Sethi & Brietzke 2017). Pathway analysis is one method used to understand lipidomics findings in a biological context; there are biotechnological software platforms available to facilitate lipid pathway analysis (Lydic & Goo 2018).
2.6.3 Lipid metabolism in cancer
Cancer cells share characteristic metabolic alterations as a response to increased cellular growth and proliferation. The Warburg effect is the well-known metabolic adaptation in cancer cells: cells produce energy by non-oxidative glycolysis, i.e.
68
fermentation of pyruvate to lactate in cytoplasm, in contrast to the oxidative phosphorylation in mitochondria in healthy cells (Warburg 1956). An increased glutamine metabolism is also a commonly detected disturbance in cancer cells. Glutamine can be converted to citrate, which is needed by acetyl groups for fatty acid synthesis (Currie et al. 2013).
There are several reported changes in lipid metabolism in cancer in response to cellular proliferation and the increased need for lipids. Most human cells obtain lipids from blood circulation as free fatty acids or combined with proteins such as lipoproteins. These lipids are acquired from dietary sources or synthesized de novo mainly in the liver, adipose tissue and lactating breasts. As early as the 1950s, it was noted that human neoplastic tissues can produce lipids through de novo synthesis (C. R. Santos & Schulze 2012; Swinnen et al. 2006). Increased lipogenesis in cancer leads to the elevated expression and activity of lipogenic enzymes. The enzymes showing increased activity in malignancies, also in OC, include ATP citrate lyase, acetyl-CoA carboxylase and fatty acid synthase (FAS), which are regulated by several signaling pathways (Pyragius et al. 2013). The increased expression of FAS is shown to correlate with the aggressiveness of OC (Ueda et al. 2010). Lipid rafts in cellular membranes which are synthesized from cholesterol and phospholipids, are increased in number in cancer cells. They are specialized microdomains which act as platforms for signaling molecules and receptors (Beloribi-Djefaflia et al. 2016; A. L. Santos & Preta 2018). One of the most studied pro-oncogenic signaling pathway is phosphatidylinositol-3-kinase (PI3K)-AKT which can enhance the expression of FAS (Yellen & Foster 2014). Oncoproteins and tumor suppressors such as p53 regulate fatty acid synthesis by influencing the fatty acid precursors created from glucose and glutamine metabolism (Pyragius et al. 2013). The mevalonate pathway, which facilitates cholesterol synthesis, belongs to important processes in cancer. Cholesterol is especially needed for membranes. Lipid droplets, which contain triacylglycerols and cholesteryl esters, are more abundant in malignant cells than in healthy ones (C. R. Santos & Schulze 2012; Swinnen et al. 2006; see Figure 8). Inhibitory molecules targeting lipogenic enzymes are being developed for inhibiting tumor growth and metastatic spread (Beloribi-Djefaflia et al. 2016; Cha & Lee 2016; Q. Liu et al. 2017).
Obesity is a contributing factor in many cancers, mainly due to its insulin resistance. An excess of adipose tissue leads to increased insulin secretion from pancreatic beta cells and the enhanced availability of insulin-like growth factor 1,

69
both of which stimulate the proliferation of tumor cells and protect them from apoptosis. Inflammatory cytokines secreted by adipose tissue can enhance tumor cell proliferation (C. R. Santos & Schulze 2012). A recent meta-analysis showed that a high consumption of nutritional fats may increase the risk of OC, which could be partly due to a stimulated secretion of extra-ovarian estrogen, which may promote tumor activity (Qiu et al. 2016). On the other hand, the cachexia commonly seen in connection with advanced cancer is caused by the reduction of fat stores through an increased lipolysis in adipose tissue. The breakdown of lipids leads to an increased amount of circulating free fatty acids and production of glycerol for gluconeogenesis in the liver, which supplies energy to the tumor cells (C. R. Santos & Schulze 2012).
An altered lipid metabolism and increased synthesis of long-chain fatty acids promotes cancer development in many ways. Cancer cells need more lipids for membrane building, which is also essential for tumor cell growth and proliferation. De novo lipid synthesis and the elevated levels of available lipid droplets support the survival of tumor cells under oxidative and energy stress. An increase in fatty acid and cholesterol synthesis may stimulate signaling in tumorigenesis. Cancer cells have a high glycolysis rate due to their energy demand and therefore an increased lactate production. Lipids may also play a stabilizing role in the oxidation-reduction balance (C. R. Santos & Schulze 2012).

70
Figure 8. Lipid metabolism in cancer cells (modified from C. R. Santos & Schulze 2012; Swinnen et al. 2006).
LDH: lactate dehydrogenase; ACL: ATP citrate lyase; ACC: acetyl-CoA carboxylase; FAS: fatty acid synthase.
2.6.3.1 Lipidomics in ovarian cancer
Phospholipids, the major component of cellular membranes, are associated with malignancies. They are associated with OC in many forms, such as increased levels of lysophosphatidic acid (LPA) and altered activity of phospholipase A2 (PLA2), phospholipase D and autotoxin (ATX) (Tania et al. 2010). LPA acts as an extracellular signaling molecule that binds to cell surface G protein-coupled receptors and activates the proliferation, survival and migration of cancer cells
71
(Pyragius et al. 2013), and LPA levels are elevated in the ascites and plasma of OC patients (Ren et al. 2006). LPA is produced by the activity of PLA2 and ATX enzymes. Elevated levels of PLA2 have been found in ascites and tissue samples in patients with epithelial OC (Cai et al. 2012), and blocking the ATX enzyme seems to inhibit the production of LPA. Phospholipase D is an enzyme essential for the formation of phosphatidic acid, a precursor of LPA (Tania et al. 2010).
Altered sphingolipids have also been connected to malignancies. Ceramides (Cers), short-chain sphingolipids, are most often studied in carcinogenesis due to their role in the induction of apoptosis. Another sphingolipid, sphingosine-1-phosphate, plays an opposite role in promoting cancer cell survival (Furuya et al. 2011). Cers are formed by the hydrolysis of sphingomyelin or by de novo synthesis, and they can be converted back to sphingomyelin or to glycosphingolipids, including e.g. sulphatides (Furuya et al. 2011; Hajj et al. 2015). Sulphatides are shown to be elevated in OC tissues, although their role in the development of OC is unclear (Y. Liu et al. 2010).
Activation of lipid metabolism is involved in early carcinogenesis, but lipids also feature in cancer development and progression. Therefore, lipid profiling of the body fluids, tissues and cells of cancer patients has been researched in recent years to detect novel biomarkers for the early diagnosis (Yang & Han 2016) and prognosis of cancer, as well as to find therapeutic targets (Lydic & Goo 2018). Table 15 summarizes the lipid studies in human samples as potential diagnostic or prognostic factors in OC, showing alteration (decrease or increase) of lipids in cancer patients compared with controls.
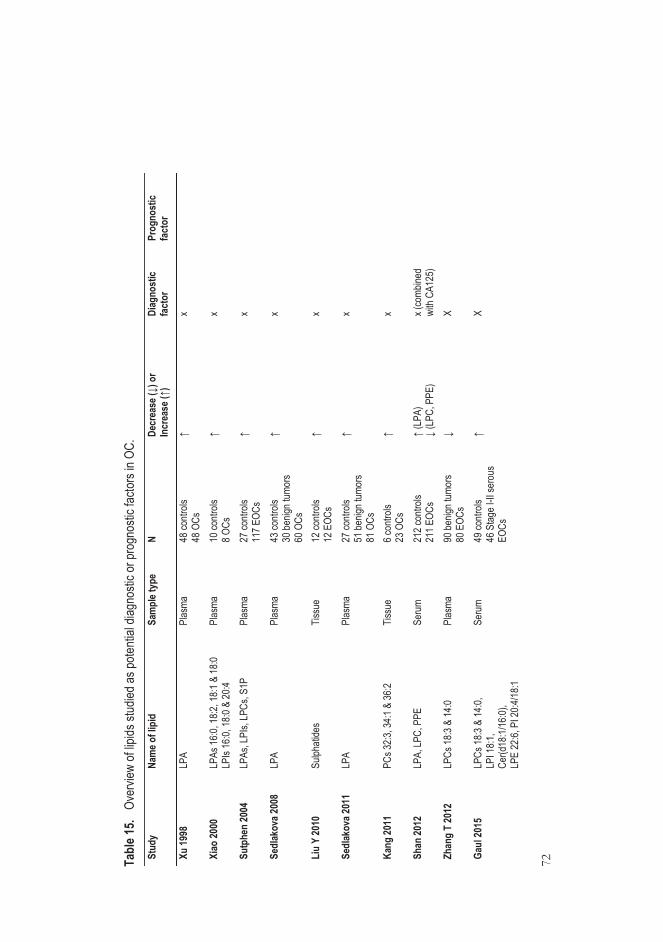
72
Tabl
e 15.
Ove
rview
of lip
ids st
udied
as po
tenti
al dia
gnos
tic or
prog
nosti
c fac
tors
in OC
. St
udy
Nam
e of l
ipid
Sa
mpl
e typ
e N
Decr
ease
(↓) o
r In
crea
se (↑
) Di
agno
stic
fact
or
Prog
nost
ic fa
ctor
Xu 19
98
LPA
Plas
ma
48 co
ntrols
48
OCs
↑
x
Xiao
2000
LP
As 16
:0, 18
:2, 18
:1 &
18:0
LPIs
16:0,
18:0
& 20
:4 Pl
asma
10
contr
ols
8 OCs
↑
x
Sutp
hen
2004
LP
As, L
PIs,
LPCs
, S1P
Plas
ma
27 co
ntrols
11
7 EOC
s ↑
x
Sedl
akov
a 200
8 LP
A Pl
asma
43
contr
ols
30 be
nign t
umor
s 60
OCs
↑ x
Liu
Y 20
10
Sulph
atide
s Tis
sue
12 co
ntrols
12
EOC
s ↑
x
Sedl
akov
a 201
1 LP
A Pl
asma
27
contr
ols
51 be
nign t
umor
s 81
OCs
↑ x
Kang
2011
PC
s 32:3
, 34:1
& 36
:2 Tis
sue
6 con
trols
23 O
Cs
↑ x
Shan
2012
LP
A, LP
C, P
PE
Seru
m 21
2 con
trols
211 E
OCs
↑ (L
PA)
↓ (L
PC, P
PE)
x (co
mbine
d wi
th CA
125)
Zhan
g T
2012
LP
Cs 18
:3 &
14:0
Plas
ma
90 be
nign t
umor
s 80
EOC
s ↓
X
Gaul
2015
LP
Cs 18
:3 &
14:0,
LP
I 18:1
, Ce
r(d18
:1/16
:0),
LPE
22:6,
PI 2
0:4/18
:1
Seru
m 49
contr
ols
46 S
tage I
-II se
rous
EO
Cs
↑ X
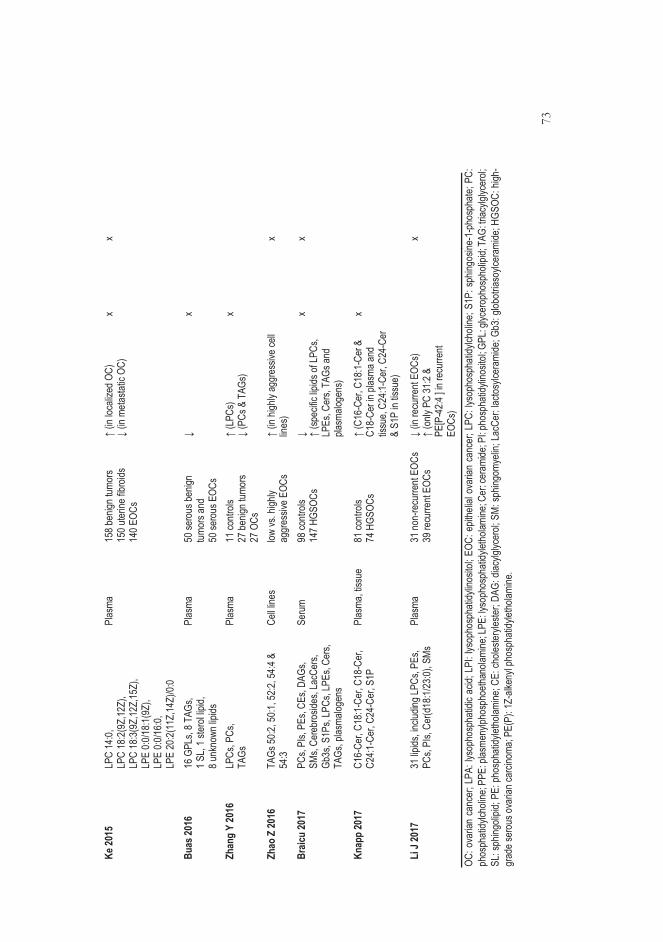
73
Ke 20
15
LPC
14:0,
LP
C 18
:2(9Z
,12Z)
, LP
C 18
:3(9Z
,12Z,
15Z)
, LP
E 0:0
/18:1(
9Z),
LPE
0:0/16
:0,
LPE
20:2(
11Z,
14Z)
/0:0
Plas
ma
158 b
enign
tumo
rs 15
0 uter
ine fib
roids
14
0 EOC
s
↑ (in
loca
lized
OC)
↓
(in m
etasta
tic O
C)
x x
Buas
2016
16
GPL
s, 8 T
AGs,
1 SL,
1 ster
ol lip
id,
8 unk
nown
lipids
Plas
ma
50 se
rous
benig
n tum
ors a
nd
50 se
rous
EOC
s
↓ x
Zhan
g Y
2016
LP
Cs, P
Cs,
TAGs
Pl
asma
11
contr
ols
27 be
nign t
umor
s 27
OCs
↑ (L
PCs)
↓ (P
Cs &
TAG
s) x
Zhao
Z 20
16
TAGs
50:2,
50:1,
52:2,
54:4
& 54
:3 Ce
ll line
s low
vs. h
ighly
aggr
essiv
e EOC
s ↑
(in hi
ghly
aggr
essiv
e cell
lin
es)
x
Braic
u 20
17
PCs,
PIs,
PEs,
CEs,
DAGs
, SM
s, Ce
rebr
oside
s, La
cCer
s, Gb
3s, S
1Ps,
LPCs
, LPE
s, Ce
rs,
TAGs
, plas
malog
ens
Seru
m 98
contr
ols
147 H
GSOC
s ↓ ↑
(spec
ific lip
ids of
LPCs
, LP
Es, C
ers,
TAGs
and
plasm
aloge
ns)
x x
Knap
p 20
17
C16-
Cer,
C18:1
-Cer
, C18
-Cer
, C2
4:1-C
er, C
24-C
er, S
1P
Plas
ma, ti
ssue
81
contr
ols
74 H
GSOC
s ↑
(C16
-Cer
, C18
:1-Ce
r &
C18-
Cer in
plas
ma an
d tis
sue,
C24:1
-Cer
, C24
- Cer
&
S1P
in tis
sue)
x
Li J
2017
31
lipids
, inclu
ding L
PCs,
PEs,
PCs,
PIs,
Cer(d
18:1/
23:0)
, SMs
Pl
asma
31
non-
recu
rrent
EOCs
39
recu
rrent
EOCs
↓
(in re
curre
nt EO
Cs)
↑ (o
nly P
C 31
:2 &
PE
[P-4
2:4 ] i
n rec
urre
nt EO
Cs)
x
OC: o
varia
n ca
ncer
; LPA
: lys
opho
spha
tidic
acid;
LPI
: lys
opho
spha
tidyli
nosit
ol; E
OC: e
pithe
lial o
varia
n ca
ncer
; LPC
: lys
opho
spha
tidylc
holin
e; S1
P: s
phing
osine
-1-p
hosp
hate;
PC:
ph
osph
atidy
lcholi
ne; P
PE: p
lasme
nylph
osph
oetha
nolam
ine; L
PE: ly
soph
osph
atidy
letho
lamine
; Cer
: cer
amide
; PI: p
hosp
hatid
ylino
sitol;
GPL
: glyc
erop
hosp
holip
id; TA
G: tri
acylg
lycer
ol;
SL: s
phing
olipid
; PE:
pho
spha
tidyle
tholam
ine; C
E: ch
oleste
ryles
ter; D
AG: d
iacylg
lycer
ol; S
M: sp
hingo
myeli
n; La
cCer
: lacto
sylce
rami
de; G
b3: g
lobotr
iasoy
lcera
mide
; HGS
OC: h
igh-
grad
e ser
ous o
varia
n car
cinom
a; PE
(P):
1Z-a
lkeny
l pho
spha
tidyle
tholam
ine.
74
3 AIMS OF THE STUDY
This study was undertaken to assess whether new methods could improve preoperative diagnostics of ovarian cancer. The specific aims of the study were:
1. To evaluate the feasibility of the various ultrasound scoring systems and
three-dimensional power Doppler sonography in the assessment of ovarian tumors (Study I).
2. To explore whether urinary polyamines analyzed by liquid chromatography-tandem mass spectrometry discriminate benign and malignant ovarian tumors (Study II).
3. To test whether field asymmetric ion mobility spectrometry can distinguish between the urine of women with benign and malignant ovarian tumors (Study III).
4. To examine if there are alterations in lipid metabolism that can be found in serum/plasma samples obtained from patients with early- and advanced-stage ovarian cancer of various histological subtypes (Study IV).
75
4 PATIENTS, MATERIALS AND METHODS
4.1 Patients and study design (Studies I-IV)
A total of 119 women aged at least 50 years with an indefinite ovarian tumor scheduled for surgery were prospectively enrolled into Study I. Obviously benign or malignant-looking ovarian tumors were not included, such as simple cysts or tumors with abundant ascites (the diameter of the largest ascites pouch was >10 cm). In addition, the entire tumor had to be visible in the transvaginal US assessment which was performed during the period of two weeks immediately prior to surgery. However, the stored US data of 19 women was lost due to the breakdown of the hard disk of the US machine. In connection with the preoperative laboratory tests, which included a CA125 sample, an extra serum sample was obtained from 111 women to be stored in a freezer.
The study population was partly the same in the three studies: 22 women in Study I were also in Study II, and 13 women in Study I were in Study III. For Studies II and III, we recruited postmenopausal women 50 and older with an unspecified adnexal mass waiting for surgery along with women scheduled for genital prolapse or urinary incontinence operations as controls. A total of 107 women gave their informed consent to the study, but only 98 women gave a urine sample; of them, 93 were eligible for the Study II polyamine analysis and, later, 78 were eligible for the Study III FAIMS analysis. Sixty-six women were included in both Studies II and III. All women provided a urine sample on the morning of their operation, and the samples were stored in two tubes at -70°C to be analyzed later. All the operations in Studies I-III were performed at the Tampere University Hospital.
Study IV was conducted in cooperation with the Oulu University Hospital in Finland and the Charitè Medical University in Berlin, Germany. Serum samples from Study I were included in the Study IV population. Also included were 54 preoperatively collected plasma samples from the Oulu University Hospital and 189 serum samples from the Tumor Bank-Ovarian Cancer Network of the Charité Medical University from women with adnexal masses. These were the two study

76
cohorts (Finland and Charité in Germany). The blood samples from these two cohorts were compared with previously analyzed data from 250 serum samples from Charitè (Braicu et al. 2017).
The characteristics of the study groups after exclusions are presented in Table 16.
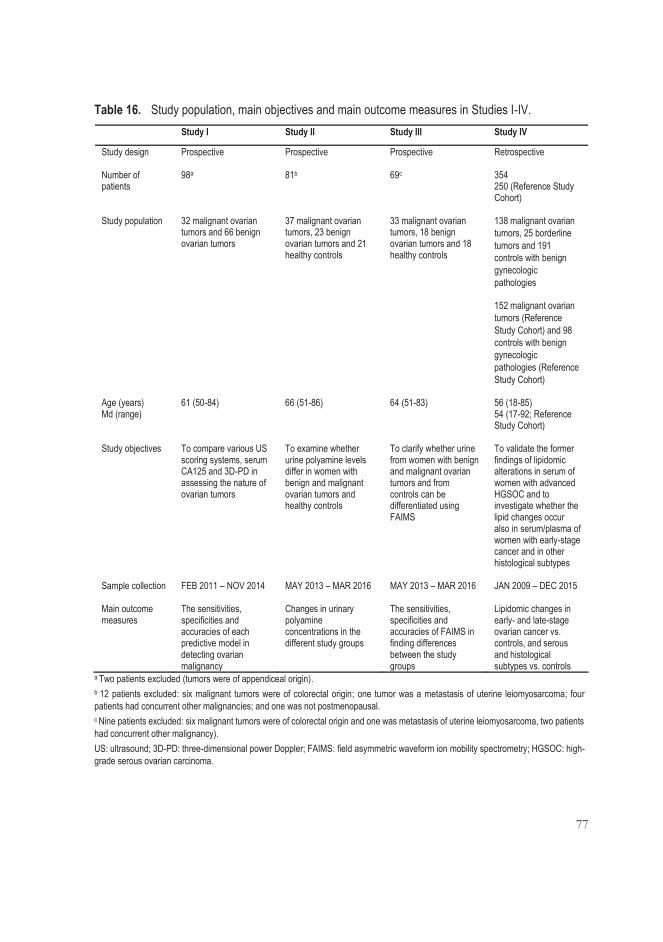
77
Table 16. Study population, main objectives and main outcome measures in Studies I-IV. Study I Study II Study III Study IV
Study design Prospective Prospective Prospective Retrospective
Number of patients
98a 81b 69c 354 250 (Reference Study Cohort)
Study population 32 malignant ovarian tumors and 66 benign ovarian tumors
37 malignant ovarian tumors, 23 benign ovarian tumors and 21 healthy controls
33 malignant ovarian tumors, 18 benign ovarian tumors and 18 healthy controls
138 malignant ovarian tumors, 25 borderline tumors and 191 controls with benign gynecologic pathologies
152 malignant ovarian tumors (Reference Study Cohort) and 98 controls with benign gynecologic pathologies (Reference Study Cohort)
Age (years) Md (range)
61 (50-84) 66 (51-86) 64 (51-83) 56 (18-85) 54 (17-92; Reference Study Cohort)
Study objectives To compare various US scoring systems, serum CA125 and 3D-PD in assessing the nature of ovarian tumors
To examine whether urine polyamine levels differ in women with benign and malignant ovarian tumors and healthy controls
To clarify whether urine from women with benign and malignant ovarian tumors and from controls can be differentiated using FAIMS
To validate the former findings of lipidomic alterations in serum of women with advanced HGSOC and to investigate whether the lipid changes occur also in serum/plasma of women with early-stage cancer and in other histological subtypes
Sample collection FEB 2011 – NOV 2014 MAY 2013 – MAR 2016 MAY 2013 – MAR 2016 JAN 2009 – DEC 2015
Main outcome measures
The sensitivities, specificities and accuracies of each predictive model in detecting ovarian malignancy
Changes in urinary polyamine concentrations in the different study groups
The sensitivities, specificities and accuracies of FAIMS in finding differences between the study groups
Lipidomic changes in early- and late-stage ovarian cancer vs. controls, and serous and histological subtypes vs. controls
a Two patients excluded (tumors were of appendiceal origin). b 12 patients excluded: six malignant tumors were of colorectal origin; one tumor was a metastasis of uterine leiomyosarcoma; four patients had concurrent other malignancies; and one was not postmenopausal. c Nine patients excluded: six malignant tumors were of colorectal origin and one was metastasis of uterine leiomyosarcoma, two patients had concurrent other malignancy). US: ultrasound; 3D-PD: three-dimensional power Doppler; FAIMS: field asymmetric waveform ion mobility spectrometry; HGSOC: high-grade serous ovarian carcinoma.

78
4.2 Methods
The results from the assessed diagnostic methods were correlated with the final histopathology of the tumors. The offline evaluation of stored sonography data and 3D volumes (Study I), the analysis of polyamines by LC-MS/MS (Study II) and the FAIMS urinary analysis (Study III) were performed blinded to the histopathological results. In Study IV, blood samples were randomized within each cohort before LC-MS/MS lipidomic analyses were performed.
4.2.1 Two- and three-dimensional sonography with power Doppler (Study I)
All US examinations were conducted using a Voluson 730 Expert unit (GE Medical Systems, Zipf, Austria) with a multifrequency endovaginal probe (5-9 MHz) by one examiner (R.N.) The routine B-mode examination was performed first and the dimensions of the ovarian tumor were measured. If bilateral ovarian tumors existed, the more complex tumor was included in the study. The adnexal tumor was first evaluated using 2D US, and the vascularization of tumor was scored from 1 to 4 using the IOTA classification system: 1 was no Doppler signal detected, and 4 was a highly vascularized tumor with abundant Doppler signals detected (Timmerman et al. 2000). The following PD settings were used: a frequency of 6 MHz, a power Doppler gain of -0.6, the wall motion filter on low 1, and a pulse repetition frequency of 0.6 kHz.
In the beginning of the 3D evaluation, the size of the volume box was adjusted to cover the contours of the ovarian mass. The acquisition angle was set to 85 degrees. The women hyperventilated briefly and then held their breath during the 3D sweep. Once a volume was obtained and accepted as fulfilling the requirements (no movement artifacts, and the entire tumor was within the volume box), it was stored on a hard disk with the previously stored 2D data to be analyzed later offline.
4.2.1.1 Ultrasound-based scoring methods
After each US examination, the investigator categorized the tumor as benign or malignant (expert opinion). The RMI was calculated using the original formula (Jacobs et al. 1990). Tumors were analyzed from stored 2D data using the IOTA
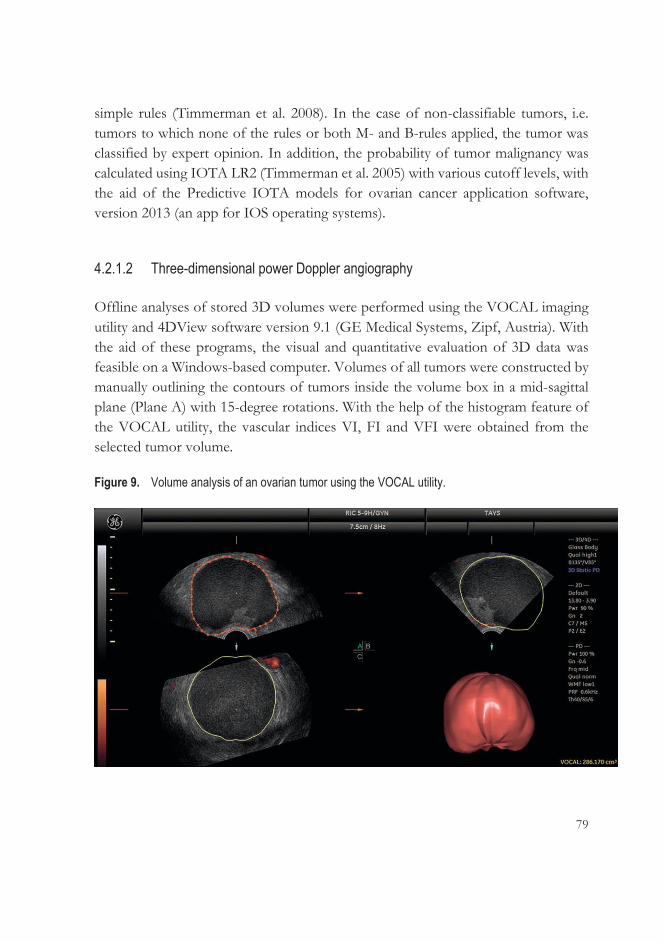
79
simple rules (Timmerman et al. 2008). In the case of non-classifiable tumors, i.e. tumors to which none of the rules or both M- and B-rules applied, the tumor was classified by expert opinion. In addition, the probability of tumor malignancy was calculated using IOTA LR2 (Timmerman et al. 2005) with various cutoff levels, with the aid of the Predictive IOTA models for ovarian cancer application software, version 2013 (an app for IOS operating systems).
4.2.1.2 Three-dimensional power Doppler angiography
Offline analyses of stored 3D volumes were performed using the VOCAL imaging utility and 4DView software version 9.1 (GE Medical Systems, Zipf, Austria). With the aid of these programs, the visual and quantitative evaluation of 3D data was feasible on a Windows-based computer. Volumes of all tumors were constructed by manually outlining the contours of tumors inside the volume box in a mid-sagittal plane (Plane A) with 15-degree rotations. With the help of the histogram feature of the VOCAL utility, the vascular indices VI, FI and VFI were obtained from the selected tumor volume.
Figure 9. Volume analysis of an ovarian tumor using the VOCAL utility.
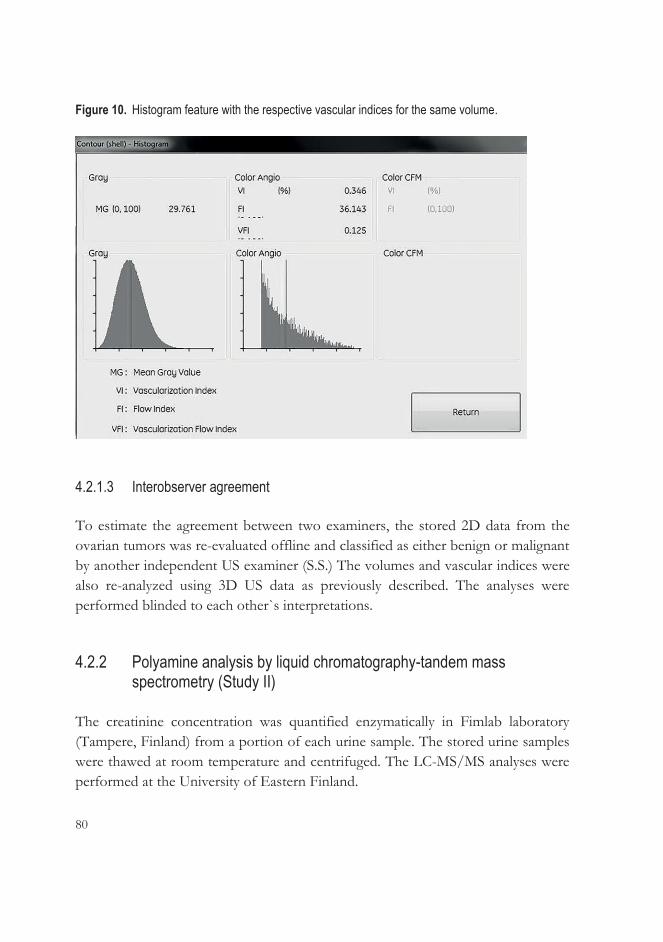
80
Figure 10. Histogram feature with the respective vascular indices for the same volume.
4.2.1.3 Interobserver agreement
To estimate the agreement between two examiners, the stored 2D data from the ovarian tumors was re-evaluated offline and classified as either benign or malignant by another independent US examiner (S.S.) The volumes and vascular indices were also re-analyzed using 3D US data as previously described. The analyses were performed blinded to each other`s interpretations.
4.2.2 Polyamine analysis by liquid chromatography-tandem mass spectrometry (Study II)
The creatinine concentration was quantified enzymatically in Fimlab laboratory (Tampere, Finland) from a portion of each urine sample. The stored urine samples were thawed at room temperature and centrifuged. The LC-MS/MS analyses were performed at the University of Eastern Finland.
81
Urine specimens were first mixed with water and an internal standard (IS) working solution, which contained isotope-labeled molecules for each analyzed polyamine mimicking the target molecules in the LC but still distinguishable from them. The urine samples were filtered through the solid-phase extraction cartridge before LC-MS/MS analysis.
The chromatographic separations of polyamines were performed using a reversed phase column with 0.1% heptafluorobutyric acid as an evaporative ion-pairing agent. The samples were ionized using a positive electrospray ionization source and then detected with an Agilent 6410 Triple Quadrupole MS. Deuterated ISs of each polyamine were used in the quantification, and the polyamine concentrations were normalized using creatinine concentrations. The obtained data was processed and quantified using Agilent Masshunter Workstation software (Agilent Technologies, Palo Alto, CA, USA).
A detailed description of this LC-MS/MS technique has been reported by Häkkinen et al. (2013). This technique was validated and calibrated for quantitation limits for each polyamine. The amounts of polyamines remained stable in urine matrix and in water dilutions and did not change even after longer storages or several freezing-thawing procedures. Water dilution is needed in case polyamine concentrations are very high. Some urine compounds may have effect on sensitivity of the analyte (matrix effect) which was compensated using deuterated ISs. Also, the accuracy and precision of this technique were tested in intra- and inter-day analysis according to the FDA validation guideline using <15% as an acceptable variation value.
4.2.3 The FAIMS analytical technique (Study III)
For the FAIMS analysis, we used a commercial Lonestar (Owlstone, Cambridge, United Kingdom) device with an ATLAS sampling unit to standardize the analytical circumstances. The stored urine specimens were thawed to room temperature. The urine samples were mixed using a vortex and 5 mL of urine sample was pipetted into a 30 mL glass vial, which was heated to 40°C. Clean air was streamed over the sample, transferring VOCs into the device at a total flow rate of 2500 mL/min. Inside the Lonestar, the sample stream was ionized with nickel-63 isotope. Subsequently, the sample was passed into the electric field where it was analyzed by alternating the compensation voltage range between -6V and +6V in 512 steps for
82
field strengths of 0-90% in 51 steps. Each sample was scanned three times; afterwards, five scans with sterilized water were made to clean the device and reduce carryover.
The FAIMS technique used has not been standardized due to its experimental nature but the other published studies have also utilized the same technique (Arasaradnam et al. 2014; Arasaradnam et al. 2018). I am not aware of previous studies of repeatability of FAIMS analysis. However, the urine samples were randomized before analysis in order to prevent any systematic bias.
4.2.4 Lipidomic analysis by liquid chromatography-tandem mass spectrometry (Study IV)
The blood samples stored at -70°C were thawed to a temperature of +4°C. Two lipidomic platforms, a global screening method and a phosphosphingolipid platform were used to perform the lipidomic profiling at the laboratory of Zora Biosciences Oy (Espoo, Finland). The isolation of lipids for the global screening method was performed by modified Folch extraction (Folch et al. 1957). A 10 μL sample was aliquoted into 96 wells of the plate, and a solvent containing chloroform, methanol and a mixture of synthetic ISs was added to the plate to extract lipids. In turn, a 25 μL sample was aliquoted into a 96-well plate to which methanol and 0.1% butylated hydroxytoluene with a mixture of synthetic ISs was added for phosphosphingolipid extraction.
A hybrid triple quadrupole/linear ion trap mass spectrometer with ultra-high-performance liquid chromatography was used. Lipid detection was performed by MS analysis in the positive ion mode for both platforms. The data from the lipidomics screening platform was collected using a scheduled multiple reaction monitoring algorithm and from the phosphosphingolipid platform using multiple reaction monitoring. The lipidomics data was analyzed using Analyst and MultiQuant 3.0 software (AB Sciex, Concors, Canada), and normalization with IS amount and sample volume was done in relation to the area or height ratios of each analyte and its respective IS peak. The analyzed lipid species and the mean coefficient of variation of each analyzed lipid, which varied between the analyses, are shown in Table 17.
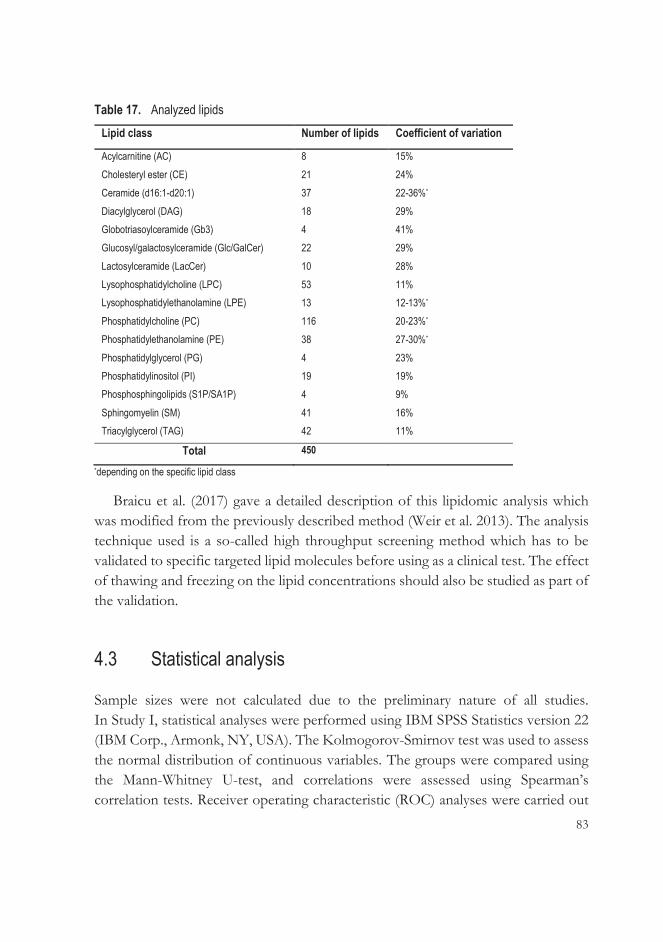
83
Table 17. Analyzed lipids Lipid class Number of lipids Coefficient of variation
Acylcarnitine (AC) 8 15% Cholesteryl ester (CE) 21 24% Ceramide (d16:1-d20:1) 37 22-36%*
Diacylglycerol (DAG) 18 29% Globotriasoylceramide (Gb3) 4 41% Glucosyl/galactosylceramide (Glc/GalCer) 22 29% Lactosylceramide (LacCer) 10 28% Lysophosphatidylcholine (LPC) 53 11% Lysophosphatidylethanolamine (LPE) 13 12-13%*
Phosphatidylcholine (PC) 116 20-23%*
Phosphatidylethanolamine (PE) 38 27-30%*
Phosphatidylglycerol (PG) 4 23% Phosphatidylinositol (PI) 19 19% Phosphosphingolipids (S1P/SA1P) 4 9% Sphingomyelin (SM) 41 16% Triacylglycerol (TAG) 42 11%
Total 450
*depending on the specific lipid class
Braicu et al. (2017) gave a detailed description of this lipidomic analysis which was modified from the previously described method (Weir et al. 2013). The analysis technique used is a so-called high throughput screening method which has to be validated to specific targeted lipid molecules before using as a clinical test. The effect of thawing and freezing on the lipid concentrations should also be studied as part of the validation.
4.3 Statistical analysis
Sample sizes were not calculated due to the preliminary nature of all studies. In Study I, statistical analyses were performed using IBM SPSS Statistics version 22 (IBM Corp., Armonk, NY, USA). The Kolmogorov-Smirnov test was used to assess the normal distribution of continuous variables. The groups were compared using the Mann-Whitney U-test, and correlations were assessed using Spearman’s correlation tests. Receiver operating characteristic (ROC) analyses were carried out

84
for each continuous variable to evaluate its performance as a predictive test. Appropriate cutoff levels for variables were calculated based on sensitivity, specificity, negative and positive predictive values. Categorical variables were tested using Pearson’s chi-square test or Fisher’s exact test. The concordance of US features as noted by two observers was calculated using Cohen’s kappa index, and the concordance of 3D-PD vascular indices using the related-samples Wilcoxon signed rank test.
In Study II, MATLAB Version R2016b (Mathworks Inc., Natick, MA, USA) was used for statistical analysis. The distributions of continuous variables were evaluated using the Kolmogorov-Smirnov test. The comparisons in polyamine concentrations were assessed between all groups (controls, benign tumors and malignant tumors) using the Wilcoxon rank sum test; p <0.05 between the groups was considered statistically significant. The ROC curves for predictive biomarkers, urinary DiAcSpm and serum CA125 were computed and used to identify the optimal cutoff level for DiAcSpm. For CA125, the cutoff level selected was the commonly used 35 kU/L. Sensitivities and specificities for these threshold levels were measured.
In Study III, data from the third scan of each urine sample, including both positive and negative ion channels, were discovered to be comparable with the average of all three scans. The data were processed using LDA and quadratic discriminant analysis (QDA) to create classification parameters. Subsequently, the data were cross-validated by 10-fold cross-validation to avoid overfitting. The statistical analyses were conducted using MATLAB Version R2017b (Mathworks Inc, Natick, MA, USA).
In Study IV, we used R version 3.4.2, which is non-commercial software, for statistical analyses. Two groups (women with tumors vs. women controls) were compared by calculating the mean relative differences between the groups, and p-values were calculated by unpaired t-tests on log-transformed concentrations. Heatmaps were visualized by Tableau software version 10.1. Logistic regression models obtained from the Charité cohort were tested in the Finnish cohort, and the AUC values were calculated using a pROC package.

85
4.4 Ethical considerations
In conducting our studies, we complied with the Declaration of Helsinki. The sample collection and protocols for Studies I-IV were approved by the Pirkanmaa Hospital District Ethics Committee. Each patient gave written informed consent for the study. The local ethics committees of the Oulu University Hospital (Finland) and the Charitè Medical University (Berlin, Germany) also approved Study IV.
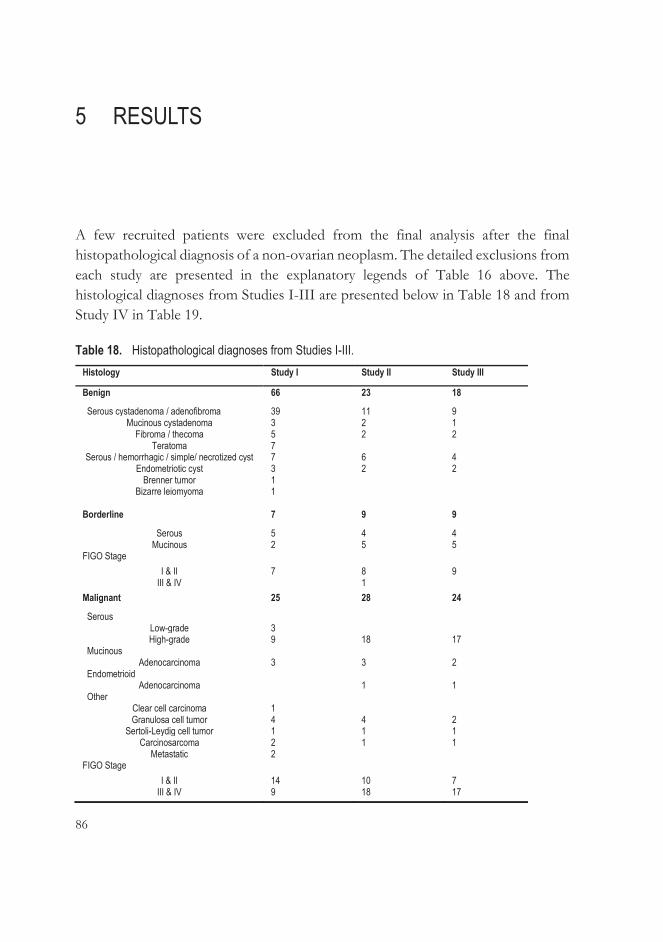
86
5 RESULTS
A few recruited patients were excluded from the final analysis after the final histopathological diagnosis of a non-ovarian neoplasm. The detailed exclusions from each study are presented in the explanatory legends of Table 16 above. The histological diagnoses from Studies I-III are presented below in Table 18 and from Study IV in Table 19.
Table 18. Histopathological diagnoses from Studies I-III. Histology Study I Study II Study III
Benign 66 23 18
Serous cystadenoma / adenofibroma 39 11 9 Mucinous cystadenoma 3 2 1
Fibroma / thecoma 5 2 2 Teratoma 7
Serous / hemorrhagic / simple/ necrotized cyst 7 6 4 Endometriotic cyst 3 2 2
Brenner tumor 1 Bizarre leiomyoma
1
Borderline 7 9 9
Serous 5 4 4 Mucinous 2 5 5
FIGO Stage I & II 7 8 9
III & IV 1 Malignant 25 28 24
Serous Low-grade 3 High-grade 9 18 17
Mucinous Adenocarcinoma 3 3 2
Endometrioid Adenocarcinoma 1 1
Other Clear cell carcinoma 1 Granulosa cell tumor 4 4 2
Sertoli-Leydig cell tumor 1 1 1 Carcinosarcoma 2 1 1
Metastatic 2 FIGO Stage
I & II 14 10 7 III & IV 9 18 17
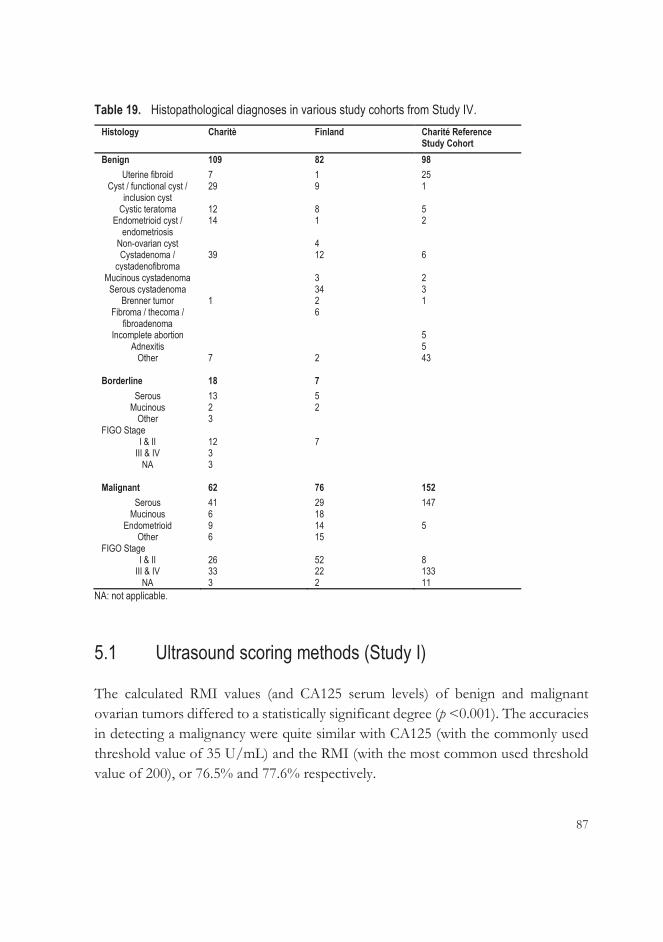
87
Table 19. Histopathological diagnoses in various study cohorts from Study IV. Histology Charitè Finland Charité Reference
Study Cohort Benign 109 82 98
Uterine fibroid 7 1 25 Cyst / functional cyst /
inclusion cyst 29 9 1
Cystic teratoma 12 8 5 Endometrioid cyst /
endometriosis 14 1 2
Non-ovarian cyst 4 Cystadenoma /
cystadenofibroma 39 12 6
Mucinous cystadenoma 3 2 Serous cystadenoma 34 3
Brenner tumor 1 2 1 Fibroma / thecoma /
fibroadenoma 6
Incomplete abortion 5 Adnexitis 5
Other 7 2 43
Borderline 18 7 Serous 13 5
Mucinous 2 2 Other 3
FIGO Stage I & II 12 7
III & IV 3 NA 3
Malignant 62 76 152
Serous 41 29 147 Mucinous 6 18
Endometrioid 9 14 5 Other 6 15
FIGO Stage I & II 26 52 8
III & IV 33 22 133 NA 3 2 11
NA: not applicable.
5.1 Ultrasound scoring methods (Study I)
The calculated RMI values (and CA125 serum levels) of benign and malignant ovarian tumors differed to a statistically significant degree (p <0.001). The accuracies in detecting a malignancy were quite similar with CA125 (with the commonly used threshold value of 35 U/mL) and the RMI (with the most common used threshold value of 200), or 76.5% and 77.6% respectively.

88
Using the IOTA simple rules, 76 of 98 tumors could be classified, 68 of which were correct. The 22 remaining unclassifiable tumors were evaluated by an US examiner (R.N.), and 17 of 22 were correctly classified. The accuracy of the IOTA simple rules with the aid of expert opinion was 86.7%, compared with the accuracy of expert opinion alone, which was 90.8%. The sensitivity of the IOTA simple rules together with an expert opinion reached 90.6% but the specificity was poorer than expert opinion alone, i.e. 84.6% vs. 92.4% respectively. Attention must also be paid to the number of patients, which means that the difference between these two methods is not that great.
Another IOTA method, LR2 (with a threshold value of 25%), achieved a sensitivity in detecting malignancies that was similar to that of the simple rules. However, LR2 failed – by comparison with the simple rules – in its specificity and accuracy. The vascularity of the tumors as analyzed by 2D PD was significantly higher in malignant than in benign tumors (p <0.001), and this method was as accurate and sensitive as LR2.
The diagnostic performances of all the methods studied in Study I are presented in Table 20 below.
Table 20. Ultrasound-based scoring methods, including serum CA125, of differentiating between benign and malignant ovarian tumors.
Method Sensitivity (%) (95% CI)
Specificity (%) (95% CI)
Accuracy (%)
CA125a 59.4 (40.6-76.3)
84.9 (73.9-92.5)
76.5
RMIb 71.9 (53.3- 86.3)
80.3 (68.7-89.1)
77.6
Simple rulesc 90.6 (75.0-98.0)
84.6 (73.9-92.5)
86.7
Expert opinion 87.5 (71.0-96.5)
92.4 (83.2-97.5)
90.8
Tumor vascularityd 90.6 (75.0-98.0)
77.3 (65.3-86.7)
81.6
LR2e 90.6 (75.0-98.0)
77.3 (65.3-86.7)
81.6
CI: confidence interval. a Cutoff value 35 kU/L. b Cutoff value 200. c When the result was inconclusive, the expert evaluated the tumor. d Two-dimensional vascular score 1-2 vs. 3-4. e Cutoff value 25%.
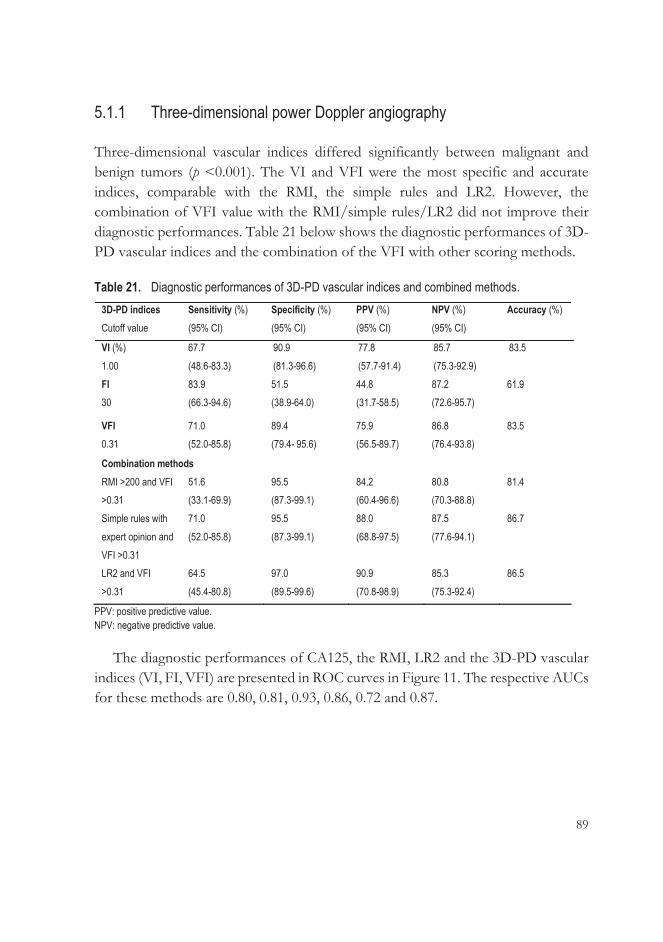
89
5.1.1 Three-dimensional power Doppler angiography
Three-dimensional vascular indices differed significantly between malignant and benign tumors (p <0.001). The VI and VFI were the most specific and accurate indices, comparable with the RMI, the simple rules and LR2. However, the combination of VFI value with the RMI/simple rules/LR2 did not improve their diagnostic performances. Table 21 below shows the diagnostic performances of 3D-PD vascular indices and the combination of the VFI with other scoring methods.
Table 21. Diagnostic performances of 3D-PD vascular indices and combined methods. 3D-PD indices Cutoff value
Sensitivity (%) (95% CI)
Specificity (%) (95% CI)
PPV (%) (95% CI)
NPV (%) (95% CI)
Accuracy (%)
VI (%) 1.00
67.7 (48.6-83.3)
90.9 (81.3-96.6)
77.8 (57.7-91.4)
85.7 (75.3-92.9)
83.5
FI 30
83.9 (66.3-94.6)
51.5 (38.9-64.0)
44.8 (31.7-58.5)
87.2 (72.6-95.7)
61.9
VFI 0.31
71.0 (52.0-85.8)
89.4 (79.4- 95.6)
75.9 (56.5-89.7)
86.8 (76.4-93.8)
83.5
Combination methods RMI >200 and VFI >0.31
51.6 (33.1-69.9)
95.5 (87.3-99.1)
84.2 (60.4-96.6)
80.8 (70.3-88.8)
81.4
Simple rules with expert opinion and VFI >0.31
71.0 (52.0-85.8)
95.5 (87.3-99.1)
88.0 (68.8-97.5)
87.5 (77.6-94.1)
86.7
LR2 and VFI >0.31
64.5 (45.4-80.8)
97.0 (89.5-99.6)
90.9 (70.8-98.9)
85.3 (75.3-92.4)
86.5
PPV: positive predictive value. NPV: negative predictive value.
The diagnostic performances of CA125, the RMI, LR2 and the 3D-PD vascular indices (VI, FI, VFI) are presented in ROC curves in Figure 11. The respective AUCs for these methods are 0.80, 0.81, 0.93, 0.86, 0.72 and 0.87.
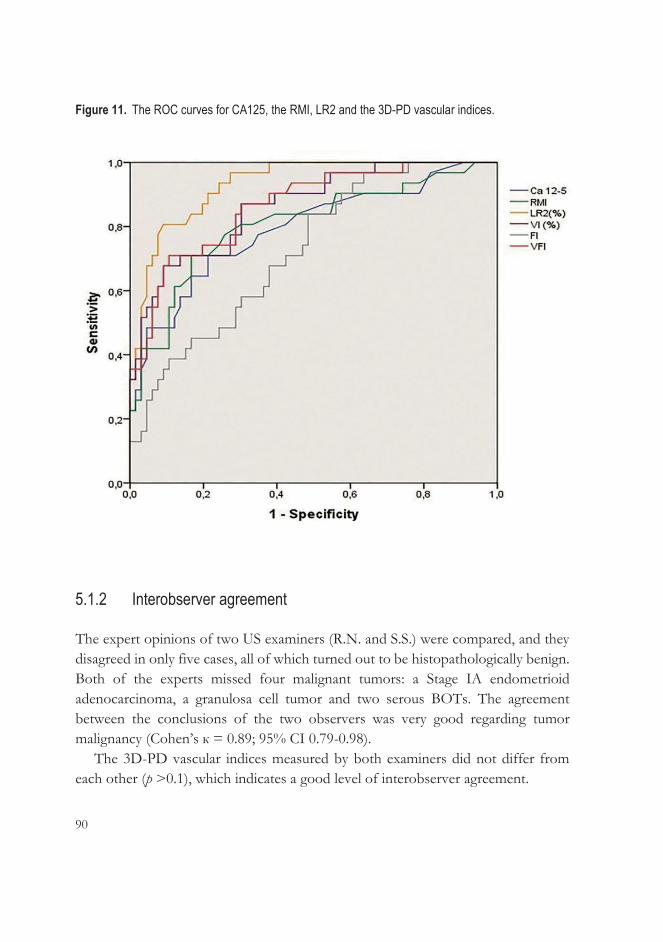
90
Figure 11. The ROC curves for CA125, the RMI, LR2 and the 3D-PD vascular indices.
5.1.2 Interobserver agreement
The expert opinions of two US examiners (R.N. and S.S.) were compared, and they disagreed in only five cases, all of which turned out to be histopathologically benign. Both of the experts missed four malignant tumors: a Stage IA endometrioid adenocarcinoma, a granulosa cell tumor and two serous BOTs. The agreement between the conclusions of the two observers was very good regarding tumor malignancy (Cohen’s к = 0.89; 95% CI 0.79-0.98).
The 3D-PD vascular indices measured by both examiners did not differ from each other (p >0.1), which indicates a good level of interobserver agreement.
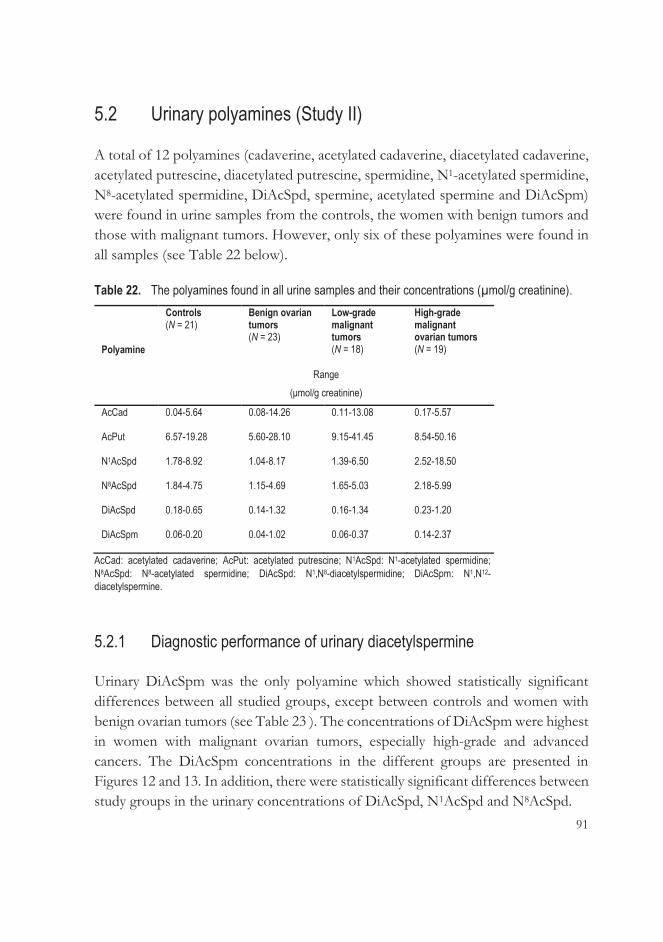
91
5.2 Urinary polyamines (Study II)
A total of 12 polyamines (cadaverine, acetylated cadaverine, diacetylated cadaverine, acetylated putrescine, diacetylated putrescine, spermidine, N1-acetylated spermidine, N8-acetylated spermidine, DiAcSpd, spermine, acetylated spermine and DiAcSpm) were found in urine samples from the controls, the women with benign tumors and those with malignant tumors. However, only six of these polyamines were found in all samples (see Table 22 below).
Table 22. The polyamines found in all urine samples and their concentrations (μmol/g creatinine).
Polyamine
Controls (N = 21)
Benign ovarian tumors (N = 23)
Low-grade malignant tumors (N = 18)
High-grade malignant ovarian tumors (N = 19)
Range (μmol/g creatinine)
AcCad
0.04-5.64
0.08-14.26
0.11-13.08
0.17-5.57
AcPut
6.57-19.28
5.60-28.10
9.15-41.45
8.54-50.16
N1AcSpd
1.78-8.92
1.04-8.17
1.39-6.50
2.52-18.50
N8AcSpd
1.84-4.75
1.15-4.69
1.65-5.03
2.18-5.99
DiAcSpd
0.18-0.65
0.14-1.32
0.16-1.34
0.23-1.20
DiAcSpm
0.06-0.20
0.04-1.02
0.06-0.37
0.14-2.37
AcCad: acetylated cadaverine; AcPut: acetylated putrescine; N1AcSpd: N1-acetylated spermidine; N8AcSpd: N8-acetylated spermidine; DiAcSpd: N1,N8-diacetylspermidine; DiAcSpm: N1,N12-diacetylspermine.
5.2.1 Diagnostic performance of urinary diacetylspermine
Urinary DiAcSpm was the only polyamine which showed statistically significant differences between all studied groups, except between controls and women with benign ovarian tumors (see Table 23 ). The concentrations of DiAcSpm were highest in women with malignant ovarian tumors, especially high-grade and advanced cancers. The DiAcSpm concentrations in the different groups are presented in Figures 12 and 13. In addition, there were statistically significant differences between study groups in the urinary concentrations of DiAcSpd, N1AcSpd and N8AcSpd.
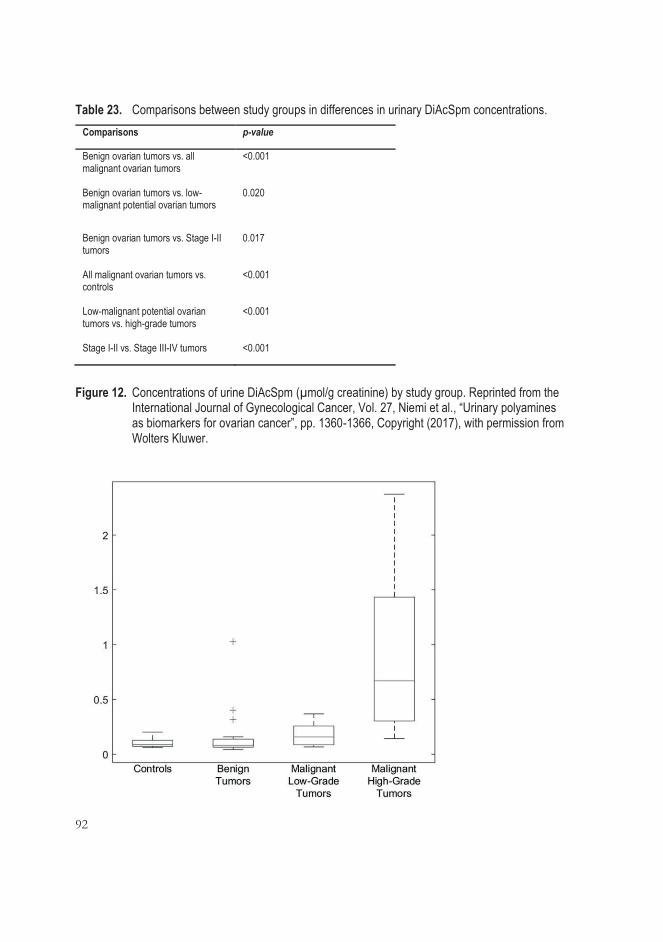
92
Table 23. Comparisons between study groups in differences in urinary DiAcSpm concentrations. Comparisons p-value
Benign ovarian tumors vs. all malignant ovarian tumors
<0.001
Benign ovarian tumors vs. low-malignant potential ovarian tumors
0.020
Benign ovarian tumors vs. Stage I-II tumors
0.017
All malignant ovarian tumors vs. controls
<0.001
Low-malignant potential ovarian tumors vs. high-grade tumors
<0.001
Stage I-II vs. Stage III-IV tumors <0.001
Figure 12. Concentrations of urine DiAcSpm (μmol/g creatinine) by study group. Reprinted from the International Journal of Gynecological Cancer, Vol. 27, Niemi et al., “Urinary polyamines as biomarkers for ovarian cancer”, pp. 1360-1366, Copyright (2017), with permission from Wolters Kluwer.

93
Figure 13. Concentrations of urine DiAcSpm (μmol/g creatinine) by study group. Reprinted from the International Journal of Gynecological Cancer, Vol. 27, Niemi et al., “Urinary polyamines as biomarkers for ovarian cancer”, pp. 1360-1366, Copyright (2017), with permission from Wolters Kluwer.
Serum CA125 levels in all women with ovarian tumors had a sensitivity of 75.7%
and specificity of 69.6% in distinguishing malignant tumors. Urinary DiAcSpm proved to be at least as good tumor marker as CA125, with a sensitivity of 86.5% and specificity of 65.2% (Figure 14).
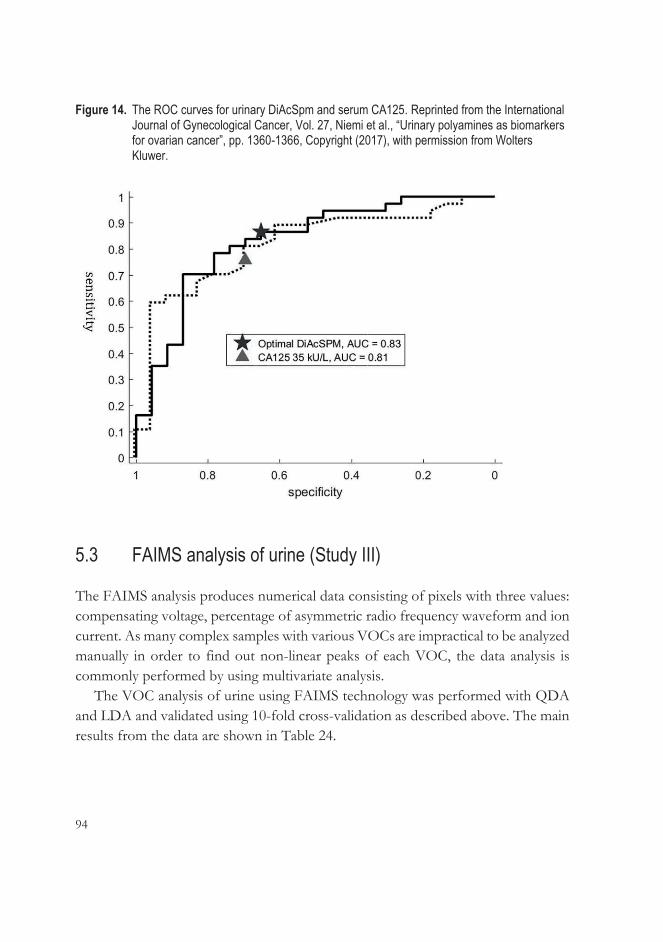
94
Figure 14. The ROC curves for urinary DiAcSpm and serum CA125. Reprinted from the International Journal of Gynecological Cancer, Vol. 27, Niemi et al., “Urinary polyamines as biomarkers for ovarian cancer”, pp. 1360-1366, Copyright (2017), with permission from Wolters Kluwer.
5.3 FAIMS analysis of urine (Study III)
The FAIMS analysis produces numerical data consisting of pixels with three values: compensating voltage, percentage of asymmetric radio frequency waveform and ion current. As many complex samples with various VOCs are impractical to be analyzed manually in order to find out non-linear peaks of each VOC, the data analysis is commonly performed by using multivariate analysis.
The VOC analysis of urine using FAIMS technology was performed with QDA and LDA and validated using 10-fold cross-validation as described above. The main results from the data are shown in Table 24.

95
Table 24. Results from the FAIMS signal data using both QDA and LDA classification.
QDA: quadratic data analysis. LDA: linear data analysis.
5.4 Lipidomic analysis (Study IV) A total of 450 lipids were analyzed, 155 of which were found to discriminate between OC patients and controls in the Charité and Finland study cohorts, as well as in the Charité Reference Study Group. The alteration between patients and controls was significant at least in two of those study cohort groups. This range of lipids was analyzed further.
Classification pairs
QDA
LDA
Sensitivity (%) (±2 Std)
Specificity (%) (±2 Std)
Accuracy (%) (±2 Std)
Sensitivity (%) (±2 Std)
Specificity (%) (±2 Std)
Accuracy (%) (±2 Std)
Benign ovarian tumors vs. controls Controls vs. malignant ovarian tumors Controls vs. high-grade ovarian cancers
93.4 (±11.4) 91.2 (±7.2) 89.1 (±2.8)
90.4 (±14.4) 63.1 (±16.0) 74.6 (±9.6)
91.9 (±9.8) 81.3 (±8.2) 81.9 (±5.2)
86.0 (±11.2) 90.4 (±5.2) 88.7 (±3.2)
86.1 (±12.2) 64.3 (±12.8) 75.6 (±11.8)
86.1 (±9.6) 81.2 (±5.8) 82.1 (±6.0)
Benign vs. malignant ovarian tumors
91.5 (±6.4)
51.4 (±32.0)
77.3 (±13.8)
87.1 (±9.0)
27.1 (±38.6)
65.9 (±13.8)
Benign ovarian tumors vs. low-grade ovarian cancers Benign ovarian tumors vs. high-grade ovarian cancers
73.1 (±41.4) 85.3 (±15.0)
92.9 (±11.4) 79.7 (±12.0)
83.9 (±23.4) 82.5 (±10.0)
35.9 (±14.0) 85.0 (±15.0)
78.8 (±5.8) 79.9 (±11.2)
59.3 (±7.0) 82.5 (±9.6)
Low-grade vs. high-grade ovarian cancers
87.8 (±12.8)
89.6 (±16.6)
88.7 (±11.2)
84.3 (±16.0)
79.7 (±13.4)
82.0 (±10.8)

96
5.4.1 Lipidomic changes in early- and advanced-stage ovarian cancer and in various histological subtypes
To examine whether lipidomic changes occur in earlier stages of OC (FIGO I-II), we selected lipids that showed a consistent increase or decrease in both FIGO Stage I-II vs. controls and FIGO Stage III-IV vs. controls, and were also significantly altered, at least in the Stage III-IV groups in the Finnish and Charité cohorts. With this approach, we found 39 lipids that were mainly decreased in OC patients. Only some ceramide and triacylglycerol species, depending on their fatty acid chains, showed increases in samples from OC patients. Typically, these lipid changes were more often statistically significant in samples from patients with advanced OC.
In order to investigate whether these lipid alterations also exist in histological subtypes (endometrioid and mucinous) other than serous OC, we selected the lipids that showed same direction of change in both the Charité and Finnish cohorts in all histological subtypes. We found 23 lipids that were significant in either endometrioid or mucinous subtypes in both of the cohorts, and all of them were significant in serous OC. Levels of only two of these 23 lipids, Cer(d18:1/18:0) and TAG(18:1/18:1/20:4), were elevated in all subtypes of OC. Levels of all other lipids were decreased.
Figure 15 shows all the lipids that were altered in early-stage OC, also in different histological subtypes.

97
Figure 15. The most promising lipids showing alterations in all stages and various histologies.
Cer: ceramide; LPC: lysophosphatidylcholine; PC: phosphatidylcholine; PC P: alkenyl-linked phosphatidylcholine; PI: phosphatidylinositol; SM: sphingomyelin; TAG: triacylglycerol. To investigate whether lipid changes in ovarian malignancies could improve the
diagnostic value of serum CA125, we added lipids or lipid ratios to CA125. The increased serum/plasma levels of lipids in OC and CA125 were used as numerators in ratio calculations, and decreased lipids as denominators. Adding lipid data to CA125 improved the AUC values both in the Charité and Finnish study cohorts, and the increases were seen especially in Stage I-II ovarian tumors. Some of the models with the greatest improvements are presented in Table 25.
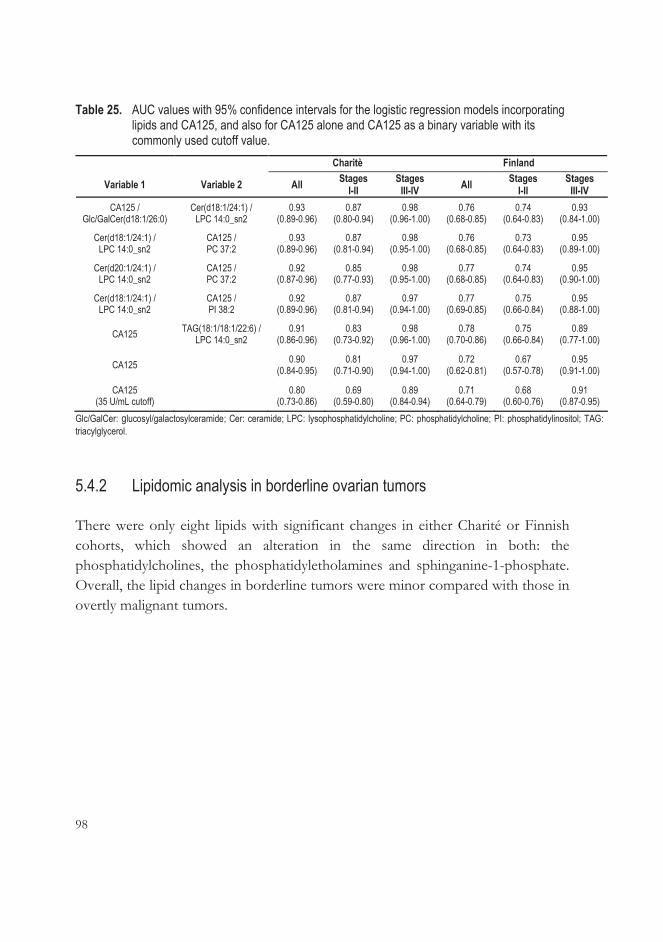
98
Table 25. AUC values with 95% confidence intervals for the logistic regression models incorporating lipids and CA125, and also for CA125 alone and CA125 as a binary variable with its commonly used cutoff value.
Charitè Finland
Variable 1 Variable 2 All Stages I-II
Stages III-IV All Stages
I-II Stages
III-IV CA125 /
Glc/GalCer(d18:1/26:0) Cer(d18:1/24:1) /
LPC 14:0_sn2 0.93
(0.89-0.96) 0.87
(0.80-0.94) 0.98
(0.96-1.00) 0.76
(0.68-0.85) 0.74
(0.64-0.83) 0.93
(0.84-1.00)
Cer(d18:1/24:1) / LPC 14:0_sn2
CA125 / PC 37:2
0.93 (0.89-0.96)
0.87 (0.81-0.94)
0.98 (0.95-1.00)
0.76 (0.68-0.85)
0.73 (0.64-0.83)
0.95 (0.89-1.00)
Cer(d20:1/24:1) / LPC 14:0_sn2
CA125 / PC 37:2
0.92 (0.87-0.96)
0.85 (0.77-0.93)
0.98 (0.95-1.00)
0.77 (0.68-0.85)
0.74 (0.64-0.83)
0.95 (0.90-1.00)
Cer(d18:1/24:1) / LPC 14:0_sn2
CA125 / PI 38:2
0.92 (0.89-0.96)
0.87 (0.81-0.94)
0.97 (0.94-1.00)
0.77 (0.69-0.85)
0.75 (0.66-0.84)
0.95 (0.88-1.00)
CA125 TAG(18:1/18:1/22:6) / LPC 14:0_sn2
0.91 (0.86-0.96)
0.83 (0.73-0.92)
0.98 (0.96-1.00)
0.78 (0.70-0.86)
0.75 (0.66-0.84)
0.89 (0.77-1.00)
CA125 0.90 (0.84-0.95)
0.81 (0.71-0.90)
0.97 (0.94-1.00)
0.72 (0.62-0.81)
0.67 (0.57-0.78)
0.95 (0.91-1.00)
CA125 (35 U/mL cutoff) 0.80
(0.73-0.86) 0.69
(0.59-0.80) 0.89
(0.84-0.94) 0.71
(0.64-0.79) 0.68
(0.60-0.76) 0.91
(0.87-0.95) Glc/GalCer: glucosyl/galactosylceramide; Cer: ceramide; LPC: lysophosphatidylcholine; PC: phosphatidylcholine; PI: phosphatidylinositol; TAG: triacylglycerol.
5.4.2 Lipidomic analysis in borderline ovarian tumors
There were only eight lipids with significant changes in either Charité or Finnish cohorts, which showed an alteration in the same direction in both: the phosphatidylcholines, the phosphatidyletholamines and sphinganine-1-phosphate. Overall, the lipid changes in borderline tumors were minor compared with those in overtly malignant tumors.
99
6 DISCUSSION
Further investigations are still necessary in preoperative OC diagnostics so that early diagnosis can improve and lead to better treatment results and survival rates for the patients. Serum biomarkers tend to increase as late as in the advanced stages, and the possibility of using imaging modalities is restricted in symptomless early-stage tumors.
6.1 Three-dimensional sonography does not seem to offer significantly more benefit than two-dimensional sonographic scoring methods (Study I)
Several 2D US-based prediction models and algorithms have been developed since the RMI was published in 1990 (Jacobs et al. 1990) in order to improve diagnostics of ovarian tumors. The IOTA study is the largest diagnostic study which has first standardized morphological and Doppler US features, and secondly collected a large database to test and compare former developed models and the subjective assessment of an experienced US examiner to novel IOTA US models and logarithms, which include simple rules, LR1 and 2 and ADNEX model. These IOTA models have been externally validated in various study groups after development and internal validation tests to discover the most optimal model for clinicians to triage suspected ovarian malignancies for appropriate surgery and on the other hand find out the tumors which may be treated conservatively or with minimal invasive surgery (Kaijser 2015).
According to the literature, the benefit of 3D US for the evaluation of ovarian tumors is conflicting. The assessment of 3D-PD vascularity has shown some value in estimating adnexal masses (Alcazar & Jurado 2011). Our purpose was to collect many validated 2D US prediction models and examine if 3D-PD vascular indices have advantages alone or together with 2D US models in ovarian tumor discrimination.

100
In our series of 100 ovarian tumors, we found that expert opinion possessed the best accuracy (90.8%) and specificity (92.4%) in diagnosing ovarian malignancy. However, the sensitivities of the IOTA simple rules, LR2 and evaluation of tumor vascularity by 2D vascular scores were slightly better than that of expert opinion, although they could not achieve the accuracy and specificity of that method. The diagnostic performance of the RMI and serum CA125, with accuracies below 80%, was poorer than that of the IOTA models.
Of the 3D-PD vascular indices, the VI and VFI were as accurate as and even more specific than LR2 and 2D US evaluation of vascularity, but they were distinctly less sensitive. The specificity of the test improved when the VFI was combined with the RMI, simple rules and LR2, with a coincidental decrease of sensitivity.
Another US expert re-evaluated the stored data by giving his opinion of each tumor and re-measured the 3D-PD vascular indices. The interobserver agreement on the nature of the tumors (expert opinion) and on the 3D-PD measurements was very good/good.
Our results indicating the superiority of subjective assessment by an expert are in concordance with a large-scale meta-analysis that proved expert opinion to be the best predictive US method in discriminating ovarian tumors preoperatively with a pooled sensitivity of 94% and specificity of 85% for postmenopausal women. LR2 proved to be as good a diagnostic as expert opinion for postmenopausal women in this meta-analysis (Meys et al. 2016). When preoperative US examinations were performed by examiners with broad and varied experience, the RMI and simple rules were more reliable than subjective assessment (Sayasneh et al. 2013). The general recommendation is to use the RMI, simple rules and LR2 as a first-stage test and refer the unclear or inconclusive tumors for a second-opinion US examination by an expert (a two-step strategy). Another two-step strategy (simple rules and expert opinion) in a group of 1,049 postmenopausal women led to a sensitivity of 93% and specificity of 83% (Testa et al. 2014), which is comparable to our respective results of 91% and 85%.
The 3D-PD vascular indices have been found to be elevated in ovarian malignancies (Alcazar et al. 2005), which our study also showed. Our results resembled those of a previous study which showed that 3D-PD vascular indices did not improve the results of 2D evaluation of vascularity (Silvestre et al. 2015). However, that study did not consider the menopausal status of patients.

101
Future studies should concentrate on combining different multimodal risk-scoring models to test them as screening tests for ovarian malignancies in symptomatic and asymptomatic women in large populations. Future IOTA studies will include the validation tests for the ADNEX model and the use of MRI and 3D-PD as a secondary test for inconclusive tumors. There is currently an ongoing large-scale IOTA-based follow-up cohort study of conservatively treated ovarian cysts. The objective of the study is to add information to be used in decision-making regarding surgical intervention and on the risks of conservative treatment (Kaijser 2015). Large-scale multicenter studies are needed to discover the most effective, reliable and safe method of making decisions regarding patient treatment and, in the future, hopefully also screening.
6.2 Urinary DiAcSpm as a possible biomarker in ovarian cancer (Study II)
Studies have found elevated levels of polyamines during highly proliferative processes such as those occurring in connection with cancer (Bae et al. 2018). They exist mainly in acetylated forms in urine (Hiramatsu et al. 1995), and especially diacetylated forms increase most in cancer, although their amounts in urine are very small (Kawakita et al. 2011; Sugimoto et al. 1995). However, the mechanism for elevated urinary polyamines such as DiAcSpm is unclear. It is assumed that the body can increase secretion of DiAcSpm as a response to the higher intracellular concentrations of DiAcSpm caused by tumor proliferation (Kawakita & Hiramatsu 2006; Umemori et al. 2010).
In our study, we used a previously described method, LC-MS/MS, for polyamine analysis (Häkkinen et al. 2013). We managed to measure all polyamines simultaneously, as opposed to previous studies, which have suffered from incomplete polyamine arrays and poor reproducibility. DiAcSpm from the urine of ovarian cancer patients was elevated compared with the levels found in women with benign ovarian tumors. Although the concentration of DiAcSpm intensifies as the cancer advances, even early-stage and low-malignant potential ovarian tumors showed higher concentrations than did benign tumors and controls. These novel OC results are concordant with previous results from other cancers (Enjoji et al. 2004; Hiramatsu et al. 2005; Yamaguchi et al. 2005). Our study showed that urinary
102
DiAcSpm was even more sensitive than serum CA125 in distinguishing between benign and malignant ovarian tumors.
In some cancers, DiAcSpm has proved to be not only a diagnostic biomarker, but also a prognostic biomarker for evaluating the efficacy of cancer treatment and the possibility of recurrence (Casero et al. 2018; Kato et al. 2014). Commercial kits for determining urinary DiAcSpm levels are available, which increases the potential of DiAcSpm as a non-invasive biomarker also in the early diagnosis of cancer (Kawakita et al. 2011). However, DiAcSpm is not a tumor-specific marker, as it may be elevated also in some benign proliferative processes (Kawakita & Hiramatsu 2006).
Polyamines seem to amplify the progression of cancer by increasing the metastatic capability of cancer cells and inhibiting the immune response against tumors (Soda 2011). Thus, one potential target of future anti-cancer treatment could be to diminish the polyamine uptake by cells, as an inhibition of polyamine synthesis by DFMO has had some preliminary efficacy in clinical trials (Alexiou et al. 2017; Murray-Stewart et al. 2016).
6.3 Detection of volatile organic compounds from urine of ovarian cancer patients is possible with the aid of FAIMS (Study III)
In canine studies, it has been discovered that cancers may have distinct odors that can be detected by dogs. The source of odors characteristic to cancer is released into the surrounding air in the form of VOCs (Lippi & Cervellin 2012). Tissue and blood samples from OC patients were also detected by trained dogs with a good sensitivity and specificity (G. Horvath et al. 2008; G. Horvath et al. 2010; G. Horvath et al. 2013). These studies demonstrate that also OC may have its own distinct smell. Nevertheless, training of canines is time-consuming and the validation of studies also rather difficult. Therefore, more effortless and validated methods for the artificial recognition of VOCs have been developed for clinical use.
Further studies generated technical counterparts such as the eNose to mimic the olfactory system and detect VOCs. Several studies have been published on various eNose applications aimed at detecting different cancers from exhaled breath, urine and blood (Bernabei et al. 2008; Turner & Magan 2004; Xue et al. 2008). Also OC

103
was identified from tissue and breath samples using the eNose (G. Horvath et al. 2010) and nanoarray analysis (Amal et al. 2015).
FAIMS is a special variant of ion mobility spectrometry based on measurements of the different movements of ionized molecules in samples in very high electric fields. It provides a qualitative spectrum derived from the complex chemical structures found in biological samples. Compared to the traditional eNose apparatus, FAIMS is more reproducible and sensitive. Also, FAIMS technology is better suited for portable equipment, which is beneficial for practical use (Arasaradnam et al. 2014; Arasaradnam et al. 2018).
Our third study demonstrated the potential of FAIMS in distinguishing urine from women with OC from controls and women with benign ovarian tumors. The sensitivity was good (91.2% and 91.5% respectively) but the specificity was weaker – improving, however, when only high-grade tumors were being distinguished from controls and benign tumors. FAIMS also seemed to differentiate urine from patients with low- and high-grade ovarian tumors. Our study reproduced the feasibility of using FAIMS for cancer detection in urine that was shown in previous positive results from patients with colorectal and pancreatic cancers (Arasaradnam et al. 2014; Arasaradnam et al. 2018).
Future research should explore the potential of FAIMS in using urine samples to monitor the effect of therapy and recognize any recurrences of cancer after treatment. As a sensitive and non-invasive method, the FAIMS analysis of urine could even have potential as a screening method. First, however, a large collection of data from urine samples of OC patients should be analyzed to form a database.
6.4 Lipidomic changes in blood occur even in early stages of ovarian cancer (Study IV)
Many cancers cause the same metabolic changes in order to provide more energy for the abnormally rapid growth and proliferation of cancer cells (Currie et al. 2013). Metabolic profiling of blood and tissue samples from OC patients has been performed to identify the main metabolic pathways in OC: these investigations have shown alterations also in lipid metabolism (Buas et al. 2016; Denkert et al. 2006; Fong et al. 2011; Ke et al. 2015). A study by Braicu et al. (2017) showed specific lipid
104
changes in blood from HGSOC patients. Study IV was conducted to validate those results at an early-stage and in non-HGSOC, or in endometrioid and mucinous OC.
Our results are in line with earlier studies showing that levels of most of the analyzed lipids were decreased in OC (Bachmayr-Heyda et al. 2017; Buas et al. 2016). Only some Cers and TAGs showed higher levels in the blood samples from OC patients. Study IV confirms that levels of Cer(d18:1/18:0), Cer(d18:0/18:0) and TAG(18:1/18:1/20:4) are higher even in the early stages (Stages I-II) of OC, but their concentrations intensify further in the advanced stages (Stages III-IV). Levels of Cer(d18:1/18:0) and TAG(18:1/18:1/20:4) were elevated not only in serous but also in mucinous and endometrioid OCs.
Earlier results from other studies of lipids in OC vary, but phospho- and sphingolipids have been studied most. Phospholipids form the cellular membrane and take part in cellular signaling (Pyragius et al. 2013). Sphingolipids, especially Cers, induce apoptosis and may thus affect cancer development (Hajj et al. 2015). In pathway analysis, glycerophospholipid metabolism proved to be the main dysregulated pathway in OC, but also glycerolipid (including TAGs) and sphingolipid metabolism was altered (Y. Zhang et al. 2016). There is evidence that levels of some glycerophospholipids are elevated in localized cancer but decreased in advanced cancer (Jones et al. 2015). This could be explained by the excess consumption of lipids by rapidly growing tumors or the decrease of HDL in the blood of OC patients (Sun et al. 2016), while glycerophospholipids occur abundantly precisely in HDL particles (Hilvo et al. 2018). However, this phenomenon does not elucidate why there is an increase of some lipid species in OC and indicates that there must be some indeterminate mechanisms.
We are not aware of other such extensive lipid analyses from OC patients. As a validation study, this study shows that lipid alterations exist at all stages of OC, and also in endometrioid and mucinous carcinomas other than HGSOC both in pre- and postmenopausal subjects. Lipid combinations combined with CA125 improved especially the detection of Stage I or II OCs, and could provide possible diagnostic and prognostic biomarkers for OC in the future.
105
6.5 Strengths and weaknesses
The population in Study I consisted of one hundred women with adnexal tumors which were evaluated preoperatively by various US methods. The study group was small when one takes into account the fact that many validation studies of US methods include hundreds or thousands of patients with ovarian tumors. In addition, some of the US methods were originally not intended for use as preoperative differential diagnostics tools for expert US examiners but, rather, for the triage of adnexal tumors by non-expert examiners. However, in Study I, all of the patients were examined by the same US examiner. To our knowledge, there are no previous publications that include so many different US methods used on the same patients. In addition, another expert evaluated the same data blindly afterwards, and the agreement on results by these two examiners was good. However, one US examiner made a subjective evaluation of the tumor from real-time US and the other from saved static US images. It has been shown that real-time diagnosis is more accurate than a diagnosis based on static images (Van Holsbeke et al. 2008). We estimated tumor vascularity by calculating 3D-PD vascularity indices from the entire tumor. Other possible methods could have been to assess vascularity only from solid vascularized areas (Alcazar et al. 2005) or to use automatic spherical sampling from the most vascularized areas (Jokubkiene et al. 2007). Our method may have influenced the results in the case of large cystic tumors which are not entirely vascularized. However, it has been shown that the size of the calculated spherical area does not affect the 3D-PD indices (Kudla & Alcazar 2010).
In Study II, we were the first to publish a standardized analysis of 12 polyamines in a single run with urine samples of women with ovarian tumors. The results should be regarded as interesting even though they are preliminary, but also the availability of this non-invasive method should increase interest in future validation studies in larger study populations.
The strength of Study III lies in its proof-of-concept nature, which makes the results more interesting and may even offset the quite-small size of its study population. Another advantage of Study III is its non-invasive nature and good sensitivity, which is as yet the first known study to use FAIMS technology in the differential diagnostics of ovarian tumors. We have only found two earlier published studies that utilized FAIMS technology in cancer detection (Arasaradnam et al. 2014; Arasaradnam et al. 2018). The disadvantage of Study III is the long storage time of
106
the urine samples before analysis: this may have had an influence on VOC emissions and thus on the final results, according to a British study (Esfahani et al. 2016). The black box-approach of FAIMS analysis makes the interpretation of the result challenging for the clinician. In order to validate the method for clinical use, considerable emphasis should be given on evaluation of the repeatability of the method. This underlines the need of a rigorous study on the analytical performance of the technology that could be conducted with a reference sample that is created by spiking pooled urine with known concentrations of target molecules or creating a completely artificial sample that could be used as reference for the method.
It would have been ideal to use the same study population in Studies I, II and III (and partly in Study IV as well). However, Study I included only tumors with a maximum diameter of 10 cm because the entire tumor had to fit into the transvaginal scan. Studies II-IV had no limitations as to the size of the tumor, and they also included women with advanced OC with ascites.
Studies I-III featured relatively many non-epithelial OCs and low malignant potential ovarian tumors as well, making the study group heterogenous, and this may have influenced the results. However, in Studies II and III, the differences in results were seen between women with low malignant potential and benign ovarian tumors and not only in women with advanced OC.
Studies I-III included women who were at least 50 years old, but their menopausal status was not confirmed by laboratory measurements. However, women whose last menstrual periods had occurred more than six months previously were classified as postmenopausal. Study IV included also women of fertile age. Consequently, the different preoperative evaluation methods or potential biomarkers used in our studies cannot be directly compared with each other. As mentioned above, the best option in comparing the accuracy of the methods would have been to have the same large study group in Studies I-III. As it is, only a few women were in all of these three studies.
In Study IV, we were able to validate previously published lipid changes in the serum of patients with HGSOC (Braicu et al. 2017) in a larger and more heterogenous study population, which showed that the lipidomic alterations in OC are seen also beyond HGSOC. Study data sets consisted not only of serum samples, but also plasma ones, but the lipid changes we discovered did not differ in the plasma dataset compared with the serum cohorts. Neither serum lipoprotein levels nor body mass index scores in the study population were available, and they may have had
107
some effect on lipid results in blood. Also, the blood samples were not collected from patients in a fasting condition, but we assumed that the differences in lipid alterations between patients with OC and with a benign tumor would have been even greater in fasting samples. However, we had study cohorts from Finland and Germany, and the lipid alterations were apparent in all cohorts, which means that the results may be generalizable.
6.6 Future prospects
Future areas of investigation could include a combination of urinary DiAcSpm analysis and FAIMS technology to discover whether elevated DiAcSpm levels correlate with the FAIMS results. On the other hand, it would be relevant to compare urine polyamines, especially DiAcSpm, with serum lipidomic analysis to see whether the main lipidomic changes in serum correlate with the increase in DiAcSpm levels in urine, and whether these two together, combined with serum CA125, would improve the diagnostic value of CA125.
Currently, US findings with serum CA125 are the main diagnostic tools used to estimate ovarian tumor malignancy. In future, it should be studied whether urinary DiAcSpm alone or serum lipidomic changes alone or whether they together combined with US findings would be more sensitive and specific than CA125.
To organize these studies, a large population of women with ovarian tumors should be recruited and systematically examined by US, with serum and urine samples collected from them as well.
108
7 SUMMARY AND CONCLUSIONS
The goal of this study was to evaluate the performance of traditional US methods in the preoperative diagnostics of adnexal masses, and to search for novel biochemical and biophysical methods to be used in addition to or instead of traditional US. To accomplish this, we evaluated the benefit of 3D-PD examination added to conventional 2D US, serum CA125 and various 2D US scoring methods in the preoperative discrimination between benign and malignant ovarian masses (Study I). In addition, preoperative urine samples from controls and from women with benign and malignant ovarian tumors were analyzed using LC-MS/MS to detect polyamines and compare their concentrations across study groups (Study II). A novel method using FAIMS technology was assessed to detect ovarian malignancies from preoperatively collected urine samples (Study III). Finally, the lipidomic alterations in early- and advanced-stage OC and in various histological subtypes were examined from preoperative blood samples (Study IV).
The main findings and conclusions of this Thesis are as follows: 1. Clinical expert opinion based on 2D US examination discriminates best
between malignant and benign ovarian tumors, with an accuracy of 90.8%, a sensitivity of 87.5% and a specificity of 92.4%. The diagnostic value of 3D-PD vascular indices is not significantly better than the RMI. Adding 3D-PD indices to the RMI and other 2D US scoring methods does not provide any noticeable improvement.
2. Six mono- and diacetylated polyamines were found in all urine samples, but only urinary concentrations of DiAcSpm showed significant elevation (p <0.001) in women with malignant ovarian tumors compared with benign ovarian tumors and controls.
3. VOC analysis of urine with FAIMS technology is able to discriminate women with ovarian malignancy from controls and women with benign ovarian tumors with accuracies of 81.3% and 77.3%, respectively.
4. There were parallel alterations in 39 lipids which exist both at early- and late-stage OC. Mostly, these lipid changes are significant as early as in Stages I and

109
II, but intensify as the cancer advances. Twenty-three of those lipids were altered, not only in serous but also in mucinous and endometrioid OC. The addition of lipids or lipid ratios to serum CA125 increased the AUC values, especially in the case of early-stage OCs.
110
8 ACKNOWLEDGEMENTS
This study was carried out at the Department of Obstetrics and Gynecology of Tampere University Hospital, the Faculty of Medicine and Life Sciences of the University of Tampere, School of Pharmacy and Biocenter Kuopio of the University of Eastern Finland, and Zora Biosciences Oy in Espoo, Finland.
First of all, I would like to express my deepest gratitude to my supervisor Professor Johanna Mäenpää for her constant encouragement, patience and trust in me. Her extensive experience in scientific research has been priceless for me over these years. I admire her dedication both to research and to treating patients with her incredibly profound knowledge of medicine. She has always found supportive words in my desperate moments and rejoiced with me in the moments of success.
I had a possibility to work with many brilliant professionals in this project. I owe my warm gratitude to Professor Niku Oksala whose role was essential in Studies II and III. His enthusiastic ideas and quick responses to my questions have impressed me. Thank you for introducing me totally new “world” with eNoses and polyamines! The initiator of that co-operation is MD, PhD Antti Roine who has been a very important person and co-author in Studies II and III. I am deeply grateful for all the help and advice during these years. His easygoing and helpful attitude has been invaluable for me and I truly appreciate it.
I want to thank Docent Mika Hilvo for the research idea of Study IV. His profound knowledge on the lipid research was not only essential for me but moreover, his help, advice and messages were always given in such a friendly way which made our collaboration very easy and simple.
All co-authors have been necessary and I am grateful for the contribution of them all. My warm thanks go to my good colleague and friend MD, PhD Sami Saarelainen whose help is always altruistic and kind, with a shared Eastern Finnish sense of humor. I would not have managed without his concrete teaching of 3D ultrasound field and advice with the computer software. Special thanks to: MSc Tiina Luukkaala for her important advice in the statistical analysis in Study I; PhD Merja Häkkinen for the analysis of polyamines; PhD Tuomo Keinänen for guiding me in the field of

111
polyamines; Professor Jouko Vepsäläinen and Professor Terho Lehtimäki for their contribution in the polyamine study; MSc Pekka Kumpulainen for conducting the statistical analysis in Studies II and III; Medical student Emmi Eräviita for conducting the FAIMS analysis; PhD Kaisa Koistinen for conducting the lipid analysis, and MD, PhD Elena Braicu, MD, PhD Hagen Kulbe, Professor Jalid Sehouli and Professor Ulla Puistola for on one hand providing blood samples and on the other hand participating in writing.
I am very grateful for the official reviewers of this thesis, Docent Maarit Anttila and Professor Kari Punnonen, for their professional evaluation and valuable comments to improve the final result.
I warmly thank Docent Eija Tomás and Docent Kari Nieminen, the members of the follow-up group of my thesis. They have always supported and believed in me, being also significant persons in my whole gynecological career.
The patients who took part in my studies deserve my special gratitude for making this work possible.
Special thanks to my chief and friend Kirsi Kuismanen for understanding and encouraging me. And thanks to all colleagues and coworkers at the Department of Obstetrics and Gynecology in Tampere University Hospital for the humorous and supportive team spirit! I am grateful for easy co-operation to Kati Tihtonen and for cheery company to Synnöve Staff and Piritta Hynninen as also to other “Gynen Ellit”. Thanks to Minna Mäenpää for many practical tips when finalizing this doctoral thesis.
I want to thank all my friends from childhood to present time. You have filled my life with joy and happiness. Hopefully you all know that I appreciate our friendship! Especially I am grateful to Pia, my “unbiological sister” and trusty beloved friend. Sharing our lives since medical school has brought me so much pleasure, power and laughter! Thanks for my mental well-being also to my charming friends Leila Alivuotila, Tuija Hämäläinen and sister-in-law Tuija Tarkiainen who have reminded me of life outside the medical world.
My heartfelt gratitude goes to my family which is the most important for me. My mom and dad, Riitta and Heikki, have always encouraged me to study and reach my dreams not forgetting to enjoy life. Your love and concern have been a solid foundation to my life. Thank you for helping us in many ways and being wonderful grandparents!

112
Finally, my lovely children Helmi, Saimi and Vilho, you are my greatest achievements and number ones. I am very proud of you three! My dear husband Esa, without equal parenting and your caring love I would not have succeeded. You all have taught me so much about love and happiness. Therefore I feel privileged and lucky.
This work has been financially supported by research grants from the competitive research funding of Pirkanmaa Hospital District, Finnish Cancer Foundation, the research funding of Division Four, Tampere University Hospital, and Research Foundation of Obstetrics and Gynecology.
Tampere, January 2019

113
9 REFERENCES
Abdel-Monem MM, Merdink JL & Theologides A. (1982) Urinary excretion of monoacetyl polyamines in patients with non-Hodgkin's lymphoma. Cancer Research 42(5): 2097.
Abramowicz JS & Timmerman D. (2017) Ovarian mass-differentiating benign from malignant: The value of the international ovarian tumor analysis ultrasound rules. Am J Obstet Gynecol 217(6): 652-660.
Alcazar JL, Galan MJ, Garcia-Manero M, et al. (2003) Three-dimensional sonographic morphologic assessment in complex adnexal masses: Preliminary experience. J Ultrasound Med 22(3): 249-254.
Alcazar JL & Castillo G. (2005) Comparison of 2-dimensional and 3-dimensional power-Doppler imaging in complex adnexal masses for the prediction of ovarian cancer. Am J Obstet Gynecol 192(3): 807-812.
Alcazar JL, Merce LT & Garcia Manero M. (2005) Three-dimensional power Doppler vascular sampling: A new method for predicting ovarian cancer in vascularized complex adnexal masses. J Ultrasound Med 24(5): 689-696.
Alcazar JL. (2006) Tumor angiogenesis assessed by three-dimensional power Doppler ultrasound in early, advanced and metastatic ovarian cancer: A preliminary study. Ultrasound Obstet Gynecol 28(3): 325-329.
Alcazar JL, Garcia-Manero M & Galvan R. (2007) Three-dimensional sonographic morphologic assessment of adnexal masses: A reproducibility study. J Ultrasound Med 26(8): 1007-1011.
Alcazar JL, Rodriguez D, Royo P, et al. (2008) Intraobserver and interobserver reproducibility of 3-dimensional power Doppler vascular indices in assessment of solid and cystic-solid adnexal masses. J Ultrasound Med 27(1): 1-6.
Alcazar JL & Prka M. (2009) Evaluation of two different methods for vascular sampling by three-dimensional power Doppler angiography in solid and cystic-solid adnexal masses. Ultrasound Obstet Gynecol 33(3): 349-354.
114
Alcazar JL & Jurado M. (2011) Three-dimensional ultrasound for assessing women with gynecological cancer: A systematic review. Gynecol Oncol 120(3): 340-346.
Alcazar JL, Iturra A, Sedda F, et al. (2012) Three-dimensional volume off-line analysis as compared to real-time ultrasound for assessing adnexal masses. Eur J Obstet Gynecol Reprod Biol 161(1): 92-95.
Alcazar JL, Pascual MA, Marquez R, et al. (2017) Malignancy risk of sonographically benign appearing purely solid adnexal masses in asymptomatic postmenopausal women. Menopause 24(6): 613-616.
Alexiou GA, Lianos GD, Ragos V, et al. (2017) Difluoromethylornithine in cancer: New advances. Future Oncol 13(9): 809-819.
Al-Hussaini M, Al-Othman Y, Hijazi E, et al. (2017) A report of ovarian Sertoli-Leydig cell tumors with heterologous intestinal-type glands and alpha fetoprotein elevation and review of the literature. Int J Gynecol Pathol 37(3): 275-283.
Amal H, Shi DY, Ionescu R, et al. (2015) Assessment of ovarian cancer conditions from exhaled breath. Int J Cancer 136(6): 614.
Arasaradnam RP, Quraishi N, Kyrou I, et al. (2011) Insights into 'fermentonomics': Evaluation of volatile organic compounds (VOCs) in human disease using an electronic 'e-nose'. J Med Eng Technol 35(2): 87-91.
Arasaradnam RP, McFarlane MJ, Ryan-Fisher C, et al. (2014) Detection of colorectal cancer (CRC) by urinary volatile organic compound analysis. PLoS One 9(9): e108750.
Arasaradnam RP, Wicaksono A, O'Brien H, et al. (2018) Noninvasive diagnosis of pancreatic cancer through detection of volatile organic compounds in urine. Gastroenterology 154(3): 485-487.
Babic A, Cramer DW, Kelemen LE, et al. (2017) Predictors of pretreatment CA125 at ovarian cancer diagnosis: A pooled analysis in the ovarian cancer association consortium. Cancer Causes Control 28(5): 459-468.
Bachmayr-Heyda A, Aust S, Auer K, et al. (2017) Integrative systemic and local metabolomics with impact on survival in high-grade serous ovarian cancer. Clin Cancer Res 23(8): 2081-2092.
Bae DH, Lane DJR, Jansson PJ, et al. (2018) The old and new biochemistry of polyamines. Biochim Biophys Acta Gen Subj 1862(9): 2053-2068.
115
Bast RC,Jr, Badgwell D, Lu Z, et al. (2005) New tumor markers: CA125 and beyond. Int J Gynecol Cancer 15(Suppl. 3): 274-281.
Bast RC,Jr & Spriggs DR. (2011) More than a biomarker: CA125 may contribute to ovarian cancer pathogenesis. Gynecol Oncol 121(3): 429-430.
Beloribi-Djefaflia S, Vasseur S & Guillaumond F. (2016) Lipid metabolic reprogramming in cancer cells. Oncogenesis 5: e189.
Bernabei M, Pennazza G, Santonico M, et al. (2008) A preliminary study on the possibility to diagnose urinary tract cancers by an electronic nose. Sensors & Actuators: B. Chemical 131(1): 1-4.
Bharwani N, Reznek RH & Rockall AG. (2011) Ovarian cancer management: The role of imaging and diagnostic challenges. Eur J Radiol 78(1): 41-51.
Bolstad N, Oijordsbakken M, Nustad K, et al. (2012) Human epididymis protein 4 reference limits and natural variation in a Nordic reference population. Tumour Biol 33(1): 141-148.
Bon GG, Kenemans P, Verstraeten R, et al. (1996) Serum tumor marker immunoassays in gynecologic oncology: Establishment of reference values. Am J Obstet Gynecol 174(1 Pt 1): 107-114.
Bonilla-Musoles F, Raga F & Osborne NG. (1995) Three-dimensional ultrasound evaluation of ovarian masses. Gynecol Oncol 59(1): 129-135.
Braicu EI, Darb-Esfahani S, Schmitt WD, et al. (2017) High-grade ovarian serous carcinoma patients exhibit profound alterations in lipid metabolism. Oncotarget 8(61): 102912-102922.
Bristow RE, Tomacruz RS, Armstrong DK, et al. (2002) Survival effect of maximal cytoreductive surgery for advanced ovarian carcinoma during the platinum era: A meta-analysis. J Clin Oncol 20(5): 1248-1259.
Brown J & Frumovitz M. (2014) Mucinous tumors of the ovary: Current thoughts on diagnosis and management. Curr Oncol Rep 16(6): 389.
Brown J, Friedlander M, Backes FJ, et al. (2014) Gynecologic cancer intergroup (GCIG) consensus review for ovarian germ cell tumors. Int J Gynecol Cancer 24(9 Suppl. 3): 48.
Buas MF, Gu H, Djukovic D, et al. (2016) Identification of novel candidate plasma metabolite biomarkers for distinguishing serous ovarian carcinoma and benign serous ovarian tumors. Gynecol Oncol 140(1): 138-144.
116
Byun JA, Lee SH, Jung BH, et al. (2008) Analysis of polyamines as carbamoyl derivatives in urine and serum by liquid chromatography-tandem mass spectrometry. Biomed Chromatogr 22(1): 73-80.
Byun JA, Choi MH, Moon MH, et al. (2009) Serum polyamines in pre- and post-operative patients with breast cancer corrected by menopausal status. Cancer Lett 273(2): 300-304.
Cai Q, Zhao Z, Antalis C, et al. (2012) Elevated and secreted phospholipase A(2) activities as new potential therapeutic targets in human epithelial ovarian cancer. FASEB J 26(8): 3306-3320.
Campos C, Sarian LO, Jales RM, et al. (2016) Performance of the risk of malignancy index for discriminating malignant tumors in women with adnexal masses. J Ultrasound Med 35(1): 143-152.
Casero RA,Jr, Murray Stewart T & Pegg AE. (2018) Polyamine metabolism and cancer: Treatments, challenges and opportunities. Nat Rev Cancer 18(11): 681-695.
Cha JY & Lee HJ. (2016) Targeting lipid metabolic reprogramming as anticancer therapeutics. J Cancer Prev 21(4): 209-215.
Chan L, Lin WM, Uerpairojkit B, et al. (1997) Evaluation of adnexal masses using three-dimensional ultrasonographic technology: Preliminary report. J Ultrasound Med 16(5): 349-354.
Chang SJ, Bristow RE, Chi DS, et al. (2015) Role of aggressive surgical cytoreduction in advanced ovarian cancer. J Gynecol Oncol 26(4): 336-342.
Chen S, Wang Y & Choi S. (2013) Applications and technology of electronic nose for clinical diagnosis. Open Journal of Applied Biosensor 2: 39-50.
Chen VW, Ruiz B, Killeen JL, et al. (2003) Pathology and classification of ovarian tumors. Cancer 97(Suppl. 10): 2631-2642.
Chen X, Zhang J, Cheng W, et al. (2013) CA-125 level as a prognostic indicator in type I and type II epithelial ovarian cancer. Int J Gynecol Cancer 23(5): 815-822.
Chiva LM, Castellanos T, Alonso S, et al. (2016) Minimal macroscopic residual disease (0.1-1 cm). Is it still a surgical goal in advanced ovarian cancer? Int J Gynecol Cancer 26(5): 906-911.
117
Coleman RL, Herzog TJ, Chan DW, et al. (2016) Validation of a second-generation multivariate index assay for malignancy risk of adnexal masses. Am J Obstet Gynecol 215(1): e11.
Colombo N, Peiretti M, Garbi A, et al. (2012) Non-epithelial ovarian cancer: ESMO clinical practice guidelines for diagnosis, treatment and follow-up. Ann Oncol 23(Suppl. 7): 6.
Covington JA, van der Schee MP, Edge AS, et al. (2015) The application of FAIMS gas analysis in medical diagnostics. Analyst 140(20): 6775-6781.
Currie E, Schulze A, Zechner R, et al. (2013) Cellular fatty acid metabolism and cancer. Cell Metab 18(2): 153-161.
Dai SY, Hata K, Inubashiri E, et al. (2008) Does three-dimensional power Doppler ultrasound improve the diagnostic accuracy for the prediction of adnexal malignancy? J Obstet Gynaecol Res 34(3): 364-370.
D'Amico A, Di Natale C, Falconi C, et al. (2012) Detection and identification of cancers by the electronic nose. Expert Opinion on Medical Diagnostics 6(3): 175-185.
de Boer RA, Cao Q, Postmus D, et al. (2013) The WAP four-disulfide core domain protein HE4: A novel biomarker for heart failure. JACC Heart Fail 1(2): 164-169.
de Meij TG, Larbi IB, van der Schee MP, et al. (2014) Electronic nose can discriminate colorectal carcinoma and advanced adenomas by fecal volatile biomarker analysis: Proof of principle study. Int J Cancer 134(5): 1132-1138.
Denkert C, Budczies J, Kind T, et al. (2006) Mass spectrometry-based metabolic profiling reveals different metabolite patterns in invasive ovarian carcinomas and ovarian borderline tumors. Cancer Res 66(22): 10795-10804.
Di Natale C, Macagnano A, Martinelli E, et al. (2003) Lung cancer identification by the analysis of breath by means of an array of non-selective gas sensors. Biosens Bioelectron 18(10): 1209-1218.
Dodge JE, Covens AL, Lacchetti C, et al. (2012) Preoperative identification of a suspicious adnexal mass: A systematic review and meta-analysis. Gynecol Oncol 126(1): 157-166.
Duffy MJ, Bonfrer JM, Kulpa J, et al. (2005) CA125 in ovarian cancer: European group on tumor markers guidelines for clinical use. Int J Gynecol Cancer 15(5): 679-691.
Durie BG, Salmon SE & Russell DH. (1977) Polyamines as markers of response and disease activity in cancer chemotherapy. Cancer Res 37(1): 214-221.
118
Enjoji M, Nakamuta M, Arimura E, et al. (2004) Clinical significance of urinary N1,N12-diacetylspermine levels in patients with hepatocellular carcinoma. Int J Biol Markers 19(4): 322-327.
Escudero JM, Auge JM, Filella X, et al. (2011) Comparison of serum human epididymis protein 4 with cancer antigen 125 as a tumor marker in patients with malignant and nonmalignant diseases. Clin Chem 57(11): 1534-1544.
Esfahani S, Sagar NM, Kyrou I, et al. (2016) Variation in gas and volatile compound emissions from human urine as it ages, measured by an electronic nose. Biosensors (Basel) 6(1): 4.
Fahy E, Subramaniam S, Brown HA, et al. (2005) A comprehensive classification system for lipids. J Lipid Res 46(5): 839-861.
Fenchel S, Grab D, Nuessle K, et al. (2002) Asymptomatic adnexal masses: Correlation of FDG PET and histopathologic findings. Radiology 223(3): 780-788.
Ferlay J, Soerjomataram I, Dikshit R, et al. (2015) Cancer incidence and mortality worldwide: Sources, methods and major patterns in GLOBOCAN 2012. Int J Cancer 136(5): 359.
Finnish Cancer Registry. (2018) Syöpätilastot. https://syoparekisteri.fi/tilastot/tautitilastot/
Fischerova D, Zikan M, Dundr P, et al. (2012) Diagnosis, treatment, and follow-up of borderline ovarian tumors. Oncologist 17(12): 1515-1533.
Fischerova D & Burgetova A. (2014) Imaging techniques for the evaluation of ovarian cancer. Best Pract Res Clin Obstet Gynaecol 28(5): 697-720.
Fleischer AC, Rodgers WH, Rao BK, et al. (1991) Assessment of ovarian tumor vascularity with transvaginal color Doppler sonography. J Ultrasound Med 10(10): 563-568.
Fleischer AC, Lyshchik A, Jones HW,Jr, et al. (2008) Contrast-enhanced transvaginal sonography of benign versus malignant ovarian masses: Preliminary findings. J Ultrasound Med 27(7): 1011-18.
Fleischer AC, Lyshchik A, Andreotti RF, et al. (2010) Advances in sonographic detection of ovarian cancer: Depiction of tumor neovascularity with microbubbles. AJR Am J Roentgenol 194(2): 343-348.
Folch J, Lees M & Sloane Stanley GH. (1957) A simple method for the isolation and purification of total lipides from animal tissues. J Biol Chem 226(1): 497-509.
119
Fong MY, McDunn J & Kakar SS. (2011) Identification of metabolites in the normal ovary and their transformation in primary and metastatic ovarian cancer. PLoS One 6(5): e19963.
Forstner R, Thomassin-Naggara I, Cunha TM, et al. (2016) ESUR recommendations for MR imaging of the sonographically indeterminate adnexal mass: An update. Eur Radiol 27(6): 2248-2257.
Foti PV, Attina G, Spadola S, et al. (2016) MR imaging of ovarian masses: Classification and differential diagnosis. Insights Imaging 7(1): 21-41.
Fujii S, Matsusue E, Kanasaki Y, et al. (2008) Detection of peritoneal dissemination in gynecological malignancy: Evaluation by diffusion-weighted MR imaging. Eur Radiol 18(1): 18-23.
Furuya H, Shimizu Y & Kawamori T. (2011) Sphingolipids in cancer. Cancer Metastasis Rev 30(3-4): 567-576.
Färkkilä A, Koskela S, Bryk S, et al. (2015) The clinical utility of serum anti-Mullerian hormone in the follow-up of ovarian adult-type granulosa cell tumors - A comparative study with inhibin B. Int J Cancer 137(7): 1661-1671.
Gaul DA, Mezencev R, Long TQ, et al. (2015) Highly-accurate metabolomic detection of early-stage ovarian cancer. Sci Rep 5: 16351.
Geomini P, Coppus SF, Kluivers KB, et al. (2007) Is three-dimensional ultrasonography of additional value in the assessment of adnexal masses? Gynecol Oncol 106(1): 153-159.
Geomini P, Kruitwagen R, Bremer GL, et al. (2009) The accuracy of risk scores in predicting ovarian malignancy: A systematic review. Obstet Gynecol 113(2 Pt 1): 384-394.
Gerner EW & Meyskens FL,Jr. (2004) Polyamines and cancer: Old molecules, new understanding. Nat Rev Cancer 4(10): 781-792.
Gershenson DM. (2007) Management of ovarian germ cell tumors. J Clin Oncol 25(20): 2938-2943.
Gershenson DM. (2017) Management of borderline ovarian tumours. Best Pract Res Clin Obstet Gynaecol 41: 49-59.
Glanc P, Benacerraf B, Bourne T, et al. (2017) First international consensus report on adnexal masses: Management recommendations. J Ultrasound Med 36(5): 849-863.
120
Gordon RT, Schatz CB, Myers LJ, et al. (2008) The use of canines in the detection of human cancers. Journal of alternative and complementary medicine (New York, N.Y.) 14(1): 61-67.
Goyal LD, Kaur S & Kawatra K. (2014) Malignant mixed germ cell tumour of ovary - an unusual combination and review of literature. J Ovarian Res 7: 5.
Greenlee RT, Kessel B, Williams CR, et al. (2010) Prevalence, incidence, and natural history of simple ovarian cysts among women >55 years old in a large cancer screening trial. Am J Obstet Gynecol 202(4): 373.e9.
Guerriero S, Alcazar JL, Coccia ME, et al. (2002) Complex pelvic mass as a target of evaluation of vessel distribution by color Doppler sonography for the diagnosis of adnexal malignancies: Results of a multicenter European study. J Ultrasound Med 21(10): 1105-1111.
Guerriero S, Saba L, Ajossa S, et al. (2013) Assessing the reproducibility of the IOTA simple ultrasound rules for classifying adnexal masses as benign or malignant using stored 3D volumes. Eur J Obstet Gynecol Reprod Biol 171(1): 157-160.
Guerriero S, Saba L, Alcazar JL, et al. (2015) Past, present and future ultrasonographic techniques for analyzing ovarian masses. Womens Health (Lond) 11(3): 369-383.
Hacker NF & Rao A. (2017) Surgery for advanced epithelial ovarian cancer. Best Pract Res Clin Obstet Gynaecol 41: 71-87.
Hajj C, Becker-Flegler KA & Haimovitz-Friedman A. (2015) Novel mechanisms of action of classical chemotherapeutic agents on sphingolipid pathways. Biol Chem 396(6-7): 669-679.
Haltia UM, Hallamaa M, Tapper J, et al. (2017) Roles of human epididymis protein 4, carbohydrate antigen 125, inhibin B and anti-Mullerian hormone in the differential diagnosis and follow-up of ovarian granulosa cell tumors. Gynecol Oncol 144(1): 83-89.
Hamaoki M, Hiramatsu K, Suzuki S, et al. (2002) Two enzyme-linked immunosorbent assay (ELISA) systems for N1,N8-diacetylspermidine and N1,N12-diacetylspermine using monoclonal antibodies. J Biochem 132(5): 783-788.
Han X & Gross RW. (2003) Global analyses of cellular lipidomes directly from crude extracts of biological samples by ESI mass spectrometry: A bridge to lipidomics. J Lipid Res 44(6): 1071-1079.
Hata T, Yanagihara T, Hayashi K, et al. (1999) Three-dimensional ultrasonographic evaluation of ovarian tumours: A preliminary study. Hum Reprod 14(3): 858-861.
121
Hata T, Hata K, Noguchi J, et al. (2011) Ultrasound for evaluation of adnexal malignancy: From 2D to 3D ultrasound. J Obstet Gynaecol Res 37(10): 1255-1268.
Hauptmann S, Friedrich K, Redline R, et al. (2017) Ovarian borderline tumors in the 2014 WHO classification: Evolving concepts and diagnostic criteria. Virchows Arch 470(2): 125-142.
He ZX, Shi HH, Fan QB, et al. (2017) Predictive factors of ovarian carcinoma for women with ovarian endometrioma aged 45 years and older in China. J Ovarian Res 10(1): 2.
Hellstrom I, Raycraft J, Hayden-Ledbetter M, et al. (2003) The HE4 (WFDC2) protein is a biomarker for ovarian carcinoma. Cancer Res 63(13): 3695-3700.
Hilvo M, de Santiago I, Gopalacharyulu P, et al. (2016) Accumulated metabolites of hydroxybutyric acid serve as diagnostic and prognostic biomarkers of ovarian high-grade serous carcinomas. Cancer Res 76(4): 796-804.
Hilvo M, Simolin H, Metso J, et al. (2018) PCSK9 inhibition alters the lipidome of plasma and lipoprotein fractions. Atherosclerosis 269: 159-165.
Hiramatsu K, Sugimoto M, Kamei S, et al. (1995) Determination of amounts of polyamines excreted in urine: Demonstration of N1,N8-diacetylspermidine and N1,N12-diacetylspermine as components commonly occurring in normal human urine. J Biochem 117(1): 107-112.
Hiramatsu K, Miura H, Sugimoto K, et al. (1997) Preparation of antibodies highly specific to N1,N8-diacetylspermidine, and development of an enzyme-linked immunosorbent assay (ELISA) system for its sensitive and specific detection. J Biochem 121(6): 1134-1138.
Hiramatsu K, Miura H, Kamei S, et al. (1998) Development of a sensitive and accurate enzyme-linked immunosorbent assay (ELISA) system that can replace HPLC analysis for the determination of N1,N12-diacetylspermine in human urine. J Biochem 124(1): 231-236.
Hiramatsu K, Takahashi K, Yamaguchi T, et al. (2005) N1,N12-diacetylspermine as a sensitive and specific novel marker for early- and late-stage colorectal and breast cancers. Clin Cancer Res 11(8): 2986-2990.
Hiramatsu K, Sakaguchi K, Fujie N, et al. (2014) Excretion of N1, N12-diacetylspermine in the urine of healthy individuals. Ann Clin Biochem 51(Pt 4): 459-467.
Holcomb K, Vucetic Z, Miller MC, et al. (2011) Human epididymis protein 4 offers superior specificity in the differentiation of benign and malignant adnexal masses in premenopausal women. Am J Obstet Gynecol 205(4): 358.e6.
122
Horvath G, Jarverud GA, Jarverud S, et al. (2008) Human ovarian carcinomas detected by specific odor. Integr Cancer Ther 7(2): 76-80.
Horvath G, Andersson H & Paulsson G. (2010) Characteristic odour in the blood reveals ovarian carcinoma. BMC Cancer 10: 643.
Horvath G, Chilo J & Lindblad T. (2010) Different volatile signals emitted by human ovarian carcinoma and healthy tissue. Future Oncol 6(6): 1043-1049.
Horvath G, Andersson H & Nemes S. (2013) Cancer odor in the blood of ovarian cancer patients: A retrospective study of detection by dogs during treatment, 3 and 6 months afterward. BMC Cancer 13: 396.
Horvath SE & Daum G. (2013) Lipids of mitochondria. Prog Lipid Res 52(4): 590-614.
Hu R, Xiang H, Mu Y, et al. (2014) Combination of 2- and 3-dimensional contrast-enhanced transvaginal sonography for diagnosis of small adnexal masses. J Ultrasound Med 33(11): 1889-1899.
Huhtinen K, Suvitie P, Hiissa J, et al. (2009) Serum HE4 concentration differentiates malignant ovarian tumours from ovarian endometriotic cysts. Br J Cancer 100(8): 1315-1319.
Hussain T, Tan B, Ren W, et al. (2017) Polyamines: Therapeutic perspectives in oxidative stress and inflammatory diseases. Amino Acids 49(9): 1457-1468.
Häkkinen MR, Roine A, Auriola S, et al. (2013) Analysis of free, mono- and diacetylated polyamines from human urine by LC-MS/MS. J Chromatogr B Analyt Technol Biomed Life Sci 941: 81-89.
Igarashi K & Kashiwagi K. (2010) Modulation of cellular function by polyamines. Int J Biochem Cell Biol 42(1): 39-51.
Jacobs I & Bast RC,Jr. (1989) The CA 125 tumour-associated antigen: A review of the literature. Hum Reprod 4(1): 1-12.
Jacobs I, Oram D, Fairbanks J, et al. (1990) A risk of malignancy index incorporating CA 125, ultrasound and menopausal status for the accurate preoperative diagnosis of ovarian cancer. Br J Obstet Gynaecol 97(10): 922-929.
Jacobs I, Menon U, Ryan A, et al. (2016) Ovarian cancer screening and mortality in the UK collaborative trial of ovarian cancer screening (UKCTOCS): A randomised controlled trial. Lancet 387(10022): 945-956.
123
Jeevanandam M & Petersen SR. (2001) Clinical role of polyamine analysis: Problem and promise. Curr Opin Clin Nutr Metab Care 4(5): 385-390.
Jia MM, Deng J, Cheng XL, et al. (2017) Diagnostic accuracy of urine HE4 in patients with ovarian cancer: A meta-analysis. Oncotarget 8(6): 9660-9671.
Jokubkiene L, Sladkevicius P & Valentin L. (2007) Does three-dimensional power Doppler ultrasound help in discrimination between benign and malignant ovarian masses? Ultrasound Obstet Gynecol 29(2): 215-225.
Jones CM, Monge ME, Kim J, et al. (2015) Metabolomic serum profiling detects early-stage high-grade serous ovarian cancer in a mouse model. J Proteome Res 14(2): 917-927.
Kahn N, Lavie O, Paz M, et al. (2015) Dynamic nanoparticle-based flexible sensors: Diagnosis of ovarian carcinoma from exhaled breath. Nano Lett 15(10): 7023-7028.
Kaijser J, Bourne T, Valentin L, et al. (2013) Improving strategies for diagnosing ovarian cancer: A summary of the International Ovarian Tumor Analysis (IOTA) studies. Ultrasound Obstet Gynecol 41(1): 9-20.
Kaijser J. (2015) Towards an evidence-based approach for diagnosis and management of adnexal masses: Findings of the International Ovarian Tumour Analysis (IOTA) studies. Facts Views Vis Obgyn 7(1): 42-59.
Kang S, Lee A, Park YS, et al. (2011) Alteration in lipid and protein profiles of ovarian cancer: Similarity to breast cancer. Int J Gynecol Cancer 21(9): 1566-1572.
Kano Y, Soda K, Nakamura T, et al. (2007) Increased blood spermine levels decrease the cytotoxic activity of lymphokine-activated killer cells: A novel mechanism of cancer evasion. Cancer Immunol Immunother 56(6): 771-781.
Karlsen MA, Sandhu N, Hogdall C, et al. (2012) Evaluation of HE4, CA125, risk of ovarian malignancy algorithm (ROMA) and risk of malignancy index (RMI) as diagnostic tools of epithelial ovarian cancer in patients with a pelvic mass. Gynecol Oncol 127(2): 379-383.
Karlsen NS, Karlsen MA, Hogdall CK, et al. (2014) HE4 tissue expression and serum HE4 levels in healthy individuals and patients with benign or malignant tumors: A systematic review. Cancer Epidemiol Biomarkers Prev 23(11): 2285-2295.
Kato M, Onishi H, Matsumoto K, et al. (2014) Prognostic significance of urine N1, N12-diacetylspermine in patients with non-small cell lung cancer. Anticancer Res 34(6): 3053-3059.

124
Kawakita M & Hiramatsu K. (2006) Diacetylated derivatives of spermine and spermidine as novel promising tumor markers. J Biochem 139(3): 315-322.
Kawakita M, Hiramatsu K, Yanagiya M, et al. (2011) Determination of N1,N12-diacetylspermine in urine: A novel tumor marker. Methods Mol Biol 720: 367-378.
Ke C, Hou Y, Zhang H, et al. (2015) Large-scale profiling of metabolic dysregulation in ovarian cancer. Int J Cancer 136(3): 516-526.
Khiewvan B, Torigian DA, Emamzadehfard S, et al. (2017) An update on the role of PET/CT and PET/MRI in ovarian cancer. Eur J Nucl Med Mol Imaging 44(6): 1079-1091.
Kim HJ, Lee SY, Shin YR, et al. (2016) The value of diffusion-weighted imaging in the differential diagnosis of ovarian lesions: A meta-analysis. PLoS One 11(2): e0149465.
Kinde I, Bettegowda C, Wang Y, et al. (2013) Evaluation of DNA from the Papanicolaou test to detect ovarian and endometrial cancers. Sci Transl Med 5(167): 167ra4.
Kinkel K, Lu Y, Mehdizade A, et al. (2005) Indeterminate ovarian mass at US: Incremental value of second imaging test for characterization - meta-analysis and Bayesian analysis. Radiology 236(1): 85-94.
Knapp P, Bodnar L, Blachnio-Zabielska A, et al. (2017) Plasma and ovarian tissue sphingolipids profiling in patients with advanced ovarian cancer. Gynecol Oncol 147(1): 139-144.
Kolakowski BM & Mester Z. (2007) Review of applications of high-field asymmetric waveform ion mobility spectrometry (FAIMS) and differential mobility spectrometry (DMS). Analyst 132(9): 842-864.
Koonings PP, Campbell K, Mishell DR,Jr, et al. (1989) Relative frequency of primary ovarian neoplasms: A 10-year review. Obstet Gynecol 74(6): 921-926.
Koshiyama M, Matsumura N & Konishi I. (2017) Subtypes of ovarian cancer and ovarian cancer screening. Diagnostics (Basel) 7(1): E12.
Kudla MJ & Alcazar JL. (2010) Does sphere volume affect the performance of three-dimensional power Doppler virtual vascular sampling for predicting malignancy in vascularized solid or cystic-solid adnexal masses? Ultrasound Obstet Gynecol 35(5): 602-608.
Kurjak A, Kupesic S, Sparac V, et al. (2001) Preoperative evaluation of pelvic tumors by Doppler and three-dimensional sonography. J Ultrasound Med 20(8): 829-840.

125
Kurman RJ, Carcangiu ML & Herrington CS. (2014) WHO classification of tumours of female reproductive organs. Lyon: International Agency for Research on Cancer.
Kurman RJ & Shih I. (2016) The dualistic model of ovarian carcinogenesis: Revisited, revised, and expanded. Am J Pathol 186(4): 733-747.
Kuwata G, Hiramatsu K, Samejima K, et al. (2013) Increase of N1, N12-diacetylspermine in tissues from colorectal cancer and its liver metastasis. J Cancer Res Clin Oncol 139(6): 925-932.
Labidi-Galy SI, Papp E, Hallberg D, et al. (2017) High grade serous ovarian carcinomas originate in the fallopian tube. Nat Commun 8(1): 1093.
Lagarde M, Geloen A, Record M, et al. (2003) Lipidomics is emerging. Biochim Biophys Acta 1634(3): 61.
Lawton F, Griffin M, Slack J, et al. (1989) Urinary polyamine excretion patterns in patients with epithelial ovarian cancer. Gynecol Obstet Invest 28(4): 212-214.
Lee SH, Suh JW, Chung BC, et al. (1998) Polyamine profiles in the urine of patients with leukemia. Cancer Lett 122(1-2): 1-8.
Li F, Tie R, Chang K, et al. (2012) Does risk for ovarian malignancy algorithm excel human epididymis protein 4 and CA125 in predicting epithelial ovarian cancer: A meta-analysis. BMC Cancer 12: 258.
Li J, Xie H, Li A, et al. (2017) Distinct plasma lipids profiles of recurrent ovarian cancer by liquid chromatography-mass spectrometry. Oncotarget 8(29): 46834-46845.
Lippi G & Cervellin G. (2012) Canine olfactory detection of cancer versus laboratory testing: Myth or opportunity? Clin Chem Lab Med 50(3): 435-439.
Liu Q, Luo Q, Halim A, et al. (2017) Targeting lipid metabolism of cancer cells: A promising therapeutic strategy for cancer. Cancer Lett 401: 39-45.
Liu Y, Chen Y, Momin A, et al. (2010) Elevation of sulfatides in ovarian cancer: An integrated transcriptomic and lipidomic analysis including tissue-imaging mass spectrometry. Mol Cancer 9: 186.
Lydic TA & Goo YH. (2018) Lipidomics unveils the complexity of the lipidome in metabolic diseases. Clin Transl Med 7(1): 9.
126
Manjunath AP, Pratapkumar, Sujatha K, et al. (2001) Comparison of three risk of malignancy indices in evaluation of pelvic masses. Gynecol Oncol 81(2): 225-229.
McCulloch M, Jezierski T, Broffman M, et al. (2006) Diagnostic accuracy of canine scent detection in early- and late-stage lung and breast cancers. Integr Cancer Ther 5(1): 30-39.
Medl M, Ogris E, Peters-Engl C, et al. (1995) TATI (tumour-associated trypsin inhibitor) as a marker of ovarian cancer. Br J Cancer 71(5): 1051-1054.
Meinhold-Heerlein I, Fotopoulou C, Harter P, et al. (2015) Statement by the kommission ovar of the AGO: The new FIGO and WHO classifications of ovarian, fallopian tube and primary peritoneal cancer. Geburtshilfe Frauenheilkd 75(10): 1021-1027.
Meinhold-Heerlein I, Fotopoulou C, Harter P, et al. (2016) The new WHO classification of ovarian, fallopian tube, and primary peritoneal cancer and its clinical implications. Arch Gynecol Obstet 293(4): 695-700.
Melamed A, Manning-Geist B, Bregar AJ, et al. (2017) Associations between residual disease and survival in epithelial ovarian cancer by histologic type. Gynecol Oncol 147(2): 250-256.
Meys EM, Kaijser J, Kruitwagen RF, et al. (2016) Subjective assessment versus ultrasound models to diagnose ovarian cancer: A systematic review and meta-analysis. Eur J Cancer 58: 17-29.
Meys EM, Jeelof LS, Achten NMJ, et al. (2017) Estimating risk of malignancy in adnexal masses: External validation of the ADNEX model and comparison with other frequently used ultrasound methods. Ultrasound Obstet Gynecol 49(6): 784-792.
Miki T, Hiramatsu K & Kawakita M. (2005) Interaction of N1,N12-diacetylspermine with polyamine transport systems of polarized porcine renal cell line LLC-PK1. J Biochem 138(4): 479-484.
Miller RW & Ueland FR. (2012) Risk of malignancy in sonographically confirmed ovarian tumors. Clin Obstet Gynecol 55(1): 52-64.
Miller-Fleming L, Olin-Sandoval V, Campbell K, et al. (2015) Remaining mysteries of molecular biology: The role of polyamines in the cell. J Mol Biol 427(21): 3389-3406.
Modesitt SC, Pavlik EJ, Ueland FR, et al. (2003) Risk of malignancy in unilocular ovarian cystic tumors less than 10 centimeters in diameter. Obstet Gynecol 102(3): 594-599.
127
Mogensen O, Mogensen B & Jakobsen A. (1990) Tumour-associated trypsin inhibitor (TATI) and cancer antigen 125 (CA 125) in mucinous ovarian tumours. Br J Cancer 61(2): 327-329.
Moore RG, Brown AK, Miller MC, et al. (2008) The use of multiple novel tumor biomarkers for the detection of ovarian carcinoma in patients with a pelvic mass. Gynecol Oncol 108(2): 402-408.
Moore RG, McMeekin DS, Brown AK, et al. (2009) A novel multiple marker bioassay utilizing HE4 and CA125 for the prediction of ovarian cancer in patients with a pelvic mass. Gynecol Oncol 112(1): 40-46.
Moore RG, Miller MC, Eklund EE, et al. (2012) Serum levels of the ovarian cancer biomarker HE4 are decreased in pregnancy and increase with age. Am J Obstet Gynecol 206(4): 349.e7.
Morice P, Uzan C, Fauvet R, et al. (2012) Borderline ovarian tumour: Pathological diagnostic dilemma and risk factors for invasive or lethal recurrence. Lancet Oncol 13(3): 103.
Muinao T, Deka Boruah HP & Pal M. (2018) Diagnostic and prognostic biomarkers in ovarian cancer and the potential roles of cancer stem cells - an updated review. Exp Cell Res 362(1): 1-10.
Muller CY. (2010) Doctor, should I get this new ovarian cancer test-OVA1? Obstet Gynecol 116(2 Pt 1): 246-247.
Murray-Stewart TR, Woster PM & Casero RA,Jr. (2016) Targeting polyamine metabolism for cancer therapy and prevention. Biochem J 473(19): 2937-2953.
Nakajima T, Katsumata K, Kuwabara H, et al. (2018) Urinary polyamine biomarker panels with machine-learning differentiated colorectal cancers, benign disease, and healthy controls. Int J Mol Sci 19(3): E756.
Nakayama Y, Torigoe T, Minagawa N, et al. (2012) The clinical usefulness of urinary N1,N12-diacetylspermine (DiAcSpm) levels as a tumor marker in patients with colorectal cancer. Oncol Lett 3(5): 970-974.
Oza AM, Cook AD, Pfisterer J, et al. (2015) Standard chemotherapy with or without bevacizumab for women with newly diagnosed ovarian cancer (ICON7): Overall survival results of a phase 3 randomised trial. Lancet Oncol 16(8): 928-936.
Park CH, Jung MH & Ji YI. (2015) Risk factors for malignant transformation of mature cystic teratoma. Obstet Gynecol Sci 58(6): 475-480.

128
Pegg AE & Casero RA,Jr. (2011) Current status of the polyamine research field. Methods Mol Biol 720: 3-35.
Peng G, Hakim M, Broza YY, et al. (2010) Detection of lung, breast, colorectal, and prostate cancers from exhaled breath using a single array of nanosensors. Br J Cancer 103(4): 542-551.
Pickel D, Manucy GP, Walker DB, et al. (2004) Evidence for canine olfactory detection of melanoma. Applied Animal Behaviour Science 89(1): 107-116.
Piek A, Meijers WC, Schroten NF, et al. (2017) HE4 serum levels are associated with heart failure severity in patients with chronic heart failure. Journal of Cardiac Failure 23(1): 12-19.
Pineda L, Salcedo E, Vilhena C, et al. (2014) Interobserver agreement in assigning IOTA color score to adnexal masses using three-dimensional volumes or digital videoclips: Potential implications for training. Ultrasound Obstet Gynecol 44(3): 361-364.
Prahm KP, Novotny GW, Hogdall C, et al. (2016) Current status on microRNAs as biomarkers for ovarian cancer. APMIS 124(5): 337-355.
Prat J & FIGO Committee on Gynecologic Oncology. (2014) Staging classification for cancer of the ovary, fallopian tube, and peritoneum. Int J Gynaecol Obstet 124(1): 1-5.
Pyragius CE, Fuller M, Ricciardelli C, et al. (2013) Aberrant lipid metabolism: An emerging diagnostic and therapeutic target in ovarian cancer. Int J Mol Sci 14(4): 7742-7756.
Pöyhönen MJ, Uusitalo UM, Kari A, et al. (1990) Urinary excretion of polyamines: Importance of circadian rhythm, age, sex, menstrual cycle, weight, and creatinine excretion. Am J Clin Nutr 52(4): 746-751.
Qiu W, Lu H, Qi Y, et al. (2016) Dietary fat intake and ovarian cancer risk: A meta-analysis of epidemiological studies. Oncotarget 7(24): 37390-37406.
Raine-Fenning NJ, Nordin NM, Ramnarine KV, et al. (2008a) Determining the relationship between three-dimensional power Doppler data and true blood flow characteristics: An in-vitro flow phantom experiment. Ultrasound Obstet Gynecol 32(4): 540-550.
Raine-Fenning NJ, Nordin NM, Ramnarine KV, et al. (2008b) Evaluation of the effect of machine settings on quantitative three-dimensional power Doppler angiography: An in-vitro flow phantom experiment. Ultrasound Obstet Gynecol 32(4): 551-559.
Reid BM, Permuth JB & Sellers TA. (2017) Epidemiology of ovarian cancer: A review. Cancer Biol Med 14(1): 9-32.

129
Ren J, Xiao YJ, Singh LS, et al. (2006) Lysophosphatidic acid is constitutively produced by human peritoneal mesothelial cells and enhances adhesion, migration, and invasion of ovarian cancer cells. Cancer Res 66(6): 3006-3014.
Roine A, Veskimäe E, Tuokko A, et al. (2014) Detection of prostate cancer by an electronic nose: A proof of principle study. J Urol 192(1): 230-234.
Royal College of Obstetricians and Gynaecologists. (2016) The management of ovarian cysts in postmenopausal women (Green-top Guideline no 34).
Ruiz de Gauna B, Sanchez P, Pineda L, et al. (2014) Interobserver agreement in describing adnexal masses using the International Ovarian Tumor Analysis simple rules in a real-time setting and using three-dimensional ultrasound volumes and digital clips. Ultrasound Obstet Gynecol 44(1): 95-99.
Russell DH, Levy CC, Schimpff SC, et al. (1971) Urinary polyamines in cancer patients. Cancer Res 31(11): 1555-1558.
Russell DH. (1983) Clinical relevance of polyamines. Crit Rev Clin Lab Sci 18(3): 261-311.
Sala E, Rockall A, Rangarajan D, et al. (2010) The role of dynamic contrast-enhanced and diffusion weighted magnetic resonance imaging in the female pelvis. Eur J Radiol 76(3): 367-385.
Salem S, White LM & Lai J. (1994) Doppler sonography of adnexal masses: The predictive value of the pulsatility index in benign and malignant disease. AJR Am J Roentgenol 163(5): 1147-1150.
Santos AL & Preta G. (2018) Lipids in the cell: Organisation regulates function. Cell Mol Life Sci 75(11): 1909-1927.
Santos CR & Schulze A. (2012) Lipid metabolism in cancer. FEBS J 279(15): 2610-2623.
Saunders BA, Podzielinski I, Ware RA, et al. (2010) Risk of malignancy in sonographically confirmed septated cystic ovarian tumors. Gynecol Oncol 118(3): 278-282.
Sayasneh A, Wynants L, Preisler J, et al. (2013) Multicentre external validation of IOTA prediction models and RMI by operators with varied training. Br J Cancer 108(12): 2448-2454.
Schelling M, Braun M, Kuhn W, et al. (2000) Combined transvaginal B-mode and color Doppler sonography for differential diagnosis of ovarian tumors: Results of a multivariate logistic regression analysis. Gynecol Oncol 77(1): 78-86.
130
Sedlakova I, Vavrova J, Tosner J, et al. (2008) Lysophosphatidic acid: An ovarian cancer marker. Eur J Gynaecol Oncol 29(5): 511-514.
Sedlakova I, Vavrova J, Tosner J, et al. (2011) Lysophosphatidic acid (LPA) - a perspective marker in ovarian cancer. Tumour Biol 32(2): 311-316.
Seiler N. (2004) Catabolism of polyamines. Amino Acids 26(3): 217-233.
Sethi S & Brietzke E. (2017) Recent advances in lipidomics: Analytical and clinical perspectives. Prostaglandins Other Lipid Mediat 128-129: 8-16.
Sevinc A, Adli M, Kalender ME, et al. (2007) Benign causes of increased serum CA-125 concentration. Lancet Oncol 8(12): 1054-1055.
Shan L, Chen YA, Davis L, et al. (2012) Measurement of phospholipids may improve diagnostic accuracy in ovarian cancer. PLoS One 7(10): e46846.
Sharma SK, Nemieboka B, Sala E, et al. (2016) Molecular imaging of ovarian cancer. J Nucl Med 57(6): 827-833.
Siegel RL, Miller KD & Jemal A. (2016) Cancer statistics, 2016. CA Cancer J Clin 66(1): 7-30.
Silverberg SG, Bell DA, Kurman RJ, et al. (2004) Borderline ovarian tumors: Key points and workshop summary. Hum Pathol 35(8): 910-917.
Silvestre L, Martins WP & Candido-Dos-Reis FJ. (2015) Limitations of three-dimensional power Doppler angiography in preoperative evaluation of ovarian tumors. J Ovarian Res 8: 47.
Sladkevicius P, Jokubkiene L & Valentin L. (2007) Contribution of morphological assessment of the vessel tree by three-dimensional ultrasound to a correct diagnosis of malignancy in ovarian masses. Ultrasound Obstet Gynecol 30(6): 874-882.
Sladkevicius P & Valentin L. (2013) Intra- and interobserver agreement when describing adnexal masses using the International Ovarian Tumor Analysis terms and definitions: A study on three-dimensional ultrasound volumes. Ultrasound Obstet Gynecol 41(3): 318-327.
Soda K, Kano Y, Sakuragi M, et al. (2009) Long-term oral polyamine intake increases blood polyamine concentrations. J Nutr Sci Vitaminol (Tokyo) 55(4): 361-366.
Soda K. (2011) The mechanisms by which polyamines accelerate tumor spread. J Exp Clin Cancer Res 30: 95.

131
Sonoda H, Kohnoe S, Yamazato T, et al. (2011) Colorectal cancer screening with odour material by canine scent detection. Gut 60(6): 814-819.
Spencer JA, Forstner R, Cunha TM, et al. (2010) ESUR guidelines for MR imaging of the sonographically indeterminate adnexal mass: An algorithmic approach. Eur Radiol 20(1): 25-35.
Sugimoto M, Hiramatsu K, Kamei S, et al. (1995) Significance of urinary N1,N8-diacetylspermidine and N1,N12-diacetylspermine as indicators of neoplastic diseases. J Cancer Res Clin Oncol 121(5): 317-319.
Suh JW, Lee SH, Chung BC, et al. (1997) Urinary polyamine evaluation for effective diagnosis of various cancers. J Chromatogr B Biomed Sci Appl 688(2): 179-186.
Suh-Burgmann E. (2006) Long-term outcomes following conservative surgery for borderline tumor of the ovary: A large population-based study. Gynecol Oncol 103(3): 841-847.
Sun Y, Meng H, Jin Y, et al. (2016) Serum lipid profile in gynecologic tumors: A retrospective clinical study of 1,550 patients. Eur J Gynaecol Oncol 37(3): 348-352.
Sutphen R, Xu Y, Wilbanks GD, et al. (2004) Lysophospholipids are potential biomarkers of ovarian cancer. Cancer Epidemiol Biomarkers Prev 13(7): 1185-1191.
Swinnen JV, Brusselmans K & Verhoeven G. (2006) Increased lipogenesis in cancer cells: New players, novel targets. Curr Opin Clin Nutr Metab Care 9(4): 358-365.
Takahashi Y, Horio H, Sakaguchi K, et al. (2015) Significant correlation between urinary N1, N12-diacetylspermine and tumor invasiveness in patients with clinical Stage IA non-small cell lung cancer. BMC Cancer 15: 65.
Takahashi Y, Sakaguchi K, Horio H, et al. (2015) Urinary N1, N12-diacetylspermine is a non-invasive marker for the diagnosis and prognosis of non-small-cell lung cancer. Br J Cancer 113(10): 1493-1501.
Tania M, Khan MA & Song Y. (2010) Association of lipid metabolism with ovarian cancer. Curr Oncol 17(5): 6-11.
Tekay A & Jouppila P. (1992) Validity of pulsatility and resistance indices in classification of adnexal tumors with transvaginal color Doppler ultrasound. Ultrasound Obstet Gynecol 2(5): 338-344.

132
Tempany CM, Zou KH, Silverman SG, et al. (2000) Staging of advanced ovarian cancer: Comparison of imaging modalities - report from the radiological diagnostic oncology group. Radiology 215(3): 761-767.
Testa AC, Ferrandina G, Fruscella E, et al. (2005) The use of contrasted transvaginal sonography in the diagnosis of gynecologic diseases: A preliminary study. J Ultrasound Med 24(9): 1267-1278.
Testa AC, Timmerman D, Van Belle V, et al. (2009) Intravenous contrast ultrasound examination using contrast-tuned imaging (CnTI) and the contrast medium SonoVue for discrimination between benign and malignant adnexal masses with solid components. Ultrasound Obstet Gynecol 34(6): 699-710.
Testa AC, Kaijser J, Wynants L, et al. (2014) Strategies to diagnose ovarian cancer: New evidence from phase 3 of the multicentre international IOTA study. Br J Cancer 111(4): 680-688.
Thomas T & Thomas TJ. (2003) Polyamine metabolism and cancer. J Cell Mol Med 7(2): 113-126.
Thomassin-Naggara I, Darai E, Cuenod CA, et al. (2008) Dynamic contrast-enhanced magnetic resonance imaging: A useful tool for characterizing ovarian epithelial tumors. J Magn Reson Imaging 28(1): 111-120.
Thomassin-Naggara I, Darai E, Cuenod CA, et al. (2009) Contribution of diffusion-weighted MR imaging for predicting benignity of complex adnexal masses. Eur Radiol 19(6): 1544-1552.
Thomassin-Naggara I, Toussaint I, Perrot N, et al. (2011) Characterization of complex adnexal masses: Value of adding perfusion- and diffusion-weighted MR imaging to conventional MR imaging. Radiology 258(3): 793-803.
Thomassin-Naggara I, Aubert E, Rockall A, et al. (2013) Adnexal masses: Development and preliminary validation of an MR imaging scoring system. Radiology 267(2): 432-443.
Timmerman D, Valentin L, Bourne TH, et al. (2000) Terms, definitions and measurements to describe the sonographic features of adnexal tumors: A consensus opinion from the International Ovarian Tumor Analysis (IOTA) group. Ultrasound Obstet Gynecol 16(5): 500-505.
Timmerman D, Testa AC, Bourne T, et al. (2005) Logistic regression model to distinguish between the benign and malignant adnexal mass before surgery: A multicenter study by the International Ovarian Tumor Analysis group. J Clin Oncol 23(34): 8794-8801.
133
Timmerman D, Testa AC, Bourne T, et al. (2008) Simple ultrasound-based rules for the diagnosis of ovarian cancer. Ultrasound Obstet Gynecol 31(6): 681-690.
Timmerman D, Ameye L, Fischerova D, et al. (2010a) Simple ultrasound rules to distinguish between benign and malignant adnexal masses before surgery: Prospective validation by IOTA group. BMJ 341: c6839.
Timmerman D, Van Calster B, Testa AC, et al. (2010b) Ovarian cancer prediction in adnexal masses using ultrasound-based logistic regression models: A temporal and external validation study by the IOTA group. Ultrasound Obstet Gynecol 36(2): 226-234.
Timmons J, Chang ET, Wang JY, et al. (2012) Polyamines and gut mucosal homeostasis. J Gastrointest Dig Syst 2(Suppl. 7): 11-21.
Tingulstad S, Hagen B, Skjeldestad FE, et al. (1996) Evaluation of a risk of malignancy index based on serum CA125, ultrasound findings and menopausal status in the pre-operative diagnosis of pelvic masses. Br J Obstet Gynaecol 103(8): 826-831.
Tingulstad S, Hagen B, Skjeldestad FE, et al. (1999) The risk-of-malignancy index to evaluate potential ovarian cancers in local hospitals. Obstet Gynecol 93(3): 448-452.
Tsujinaka S, Soda K, Kano Y, et al. (2011) Spermine accelerates hypoxia-initiated cancer cell migration. Int J Oncol 38(2): 305-312.
Turner AP & Magan N. (2004) Electronic noses and disease diagnostics. Nat Rev Microbiol 2(2): 161-166.
Ueda SM, Yap KL, Davidson B, et al. (2010) Expression of fatty acid synthase depends on NAC1 and is associated with recurrent ovarian serous carcinomas. J Oncol 2010: 285191.
Uehara N, Shirakawa S, Uchino H, et al. (1980) Elevated contents of spermidine and spermine in the erythrocytes of cancer patients. Cancer 45(1): 108-111.
Ueland FR, Desimone CP, Seamon LG, et al. (2011) Effectiveness of a multivariate index assay in the preoperative assessment of ovarian tumors. Obstet Gynecol 117(6): 1289-1297.
Umemori Y, Ohe Y, Kuribayashi K, et al. (2010) Evaluating the utility of N1,N12-diacetylspermine and N1,N8-diacetylspermidine in urine as tumor markers for breast and colorectal cancers. Clin Chim Acta 411(23-24): 1894-1899.
Valentin L. (1997) Gray scale sonography, subjective evaluation of the color Doppler image and measurement of blood flow velocity for distinguishing benign and malignant tumors of suspected adnexal origin. Eur J Obstet Gynecol Reprod Biol 72(1): 63-72.
134
Valentin L, Hagen B, Tingulstad S, et al. (2001) Comparison of 'pattern recognition' and logistic regression models for discrimination between benign and malignant pelvic masses: A prospective cross validation. Ultrasound Obstet Gynecol 18(4): 357-365.
Valentin L, Ameye L, Savelli L, et al. (2011) Adnexal masses difficult to classify as benign or malignant using subjective assessment of gray-scale and Doppler ultrasound findings: Logistic regression models do not help. Ultrasound Obstet Gynecol 38(4): 456-465.
Van Calster B, Van Hoorde K, Valentin L, et al. (2014) Evaluating the risk of ovarian cancer before surgery using the ADNEX model to differentiate between benign, borderline, early and advanced stage invasive, and secondary metastatic tumours: Prospective multicentre diagnostic study. BMJ 349: g5920.
Van Calster B, Van Hoorde K, Froyman W, et al. (2015) Practical guidance for applying the ADNEX model from the IOTA group to discriminate between different subtypes of adnexal tumors. Facts Views Vis Obgyn 7(1): 32-41.
Van Holsbeke C, Yazbek J, Holland TK, et al. (2008) Real-time ultrasound vs. evaluation of static images in the preoperative assessment of adnexal masses. Ultrasound Obstet Gynecol 32(6): 828-831.
Van Holsbeke C, Van Calster B, Bourne T, et al. (2012) External validation of diagnostic models to estimate the risk of malignancy in adnexal masses. Clin Cancer Res 18(3): 815-825.
van Meer G, Voelker DR & Feigenson GW. (2008) Membrane lipids: Where they are and how they behave. Nat Rev Mol Cell Biol 9(2): 112-124.
van Nagell JR,Jr & Miller RW. (2016) Evaluation and management of ultrasonographically detected ovarian tumors in asymptomatic women. Obstet Gynecol 127(5): 848-858.
Venäläinen MK, Roine AN, Häkkinen MR, et al. (2018) Altered polyamine profiles in colorectal cancer. Anticancer Res 38(6): 3601-3607.
Wang J, Lv F, Fei X, et al. (2011) Study on the characteristics of contrast-enhanced ultrasound and its utility in assessing the microvessel density in ovarian tumors or tumor-like lesions. Int J Biol Sci 7(5): 600-606.
Wang J, Gao J, Yao H, et al. (2014) Diagnostic accuracy of serum HE4, CA125 and ROMA in patients with ovarian cancer: A meta-analysis. Tumour Biol 35(6): 6127-6138.
Wang S & Johnson S. (2012) Prediction of benignity of solid adnexal masses. Arch Gynecol Obstet 285(3): 721-726.

135
Warburg O. (1956) On the origin of cancer cells. Science 123(3191): 309-314.
Webber K & Friedlander M. (2017) Chemotherapy for epithelial ovarian, fallopian tube and primary peritoneal cancer. Best Pract Res Clin Obstet Gynaecol 41: 126-138.
Weber CM, Cauchi M, Patel M, et al. (2011) Evaluation of a gas sensor array and pattern recognition for the identification of bladder cancer from urine headspace. Analyst 136(2): 359-364.
Weir JM, Wong G, Barlow CK, et al. (2013) Plasma lipid profiling in a large population-based cohort. J Lipid Res 54(10): 2898-2908.
Williams H & Pembroke A. (1989) Sniffer dogs in the melanoma clinic? Lancet 1(8640): 734.
Willis CM, Church SM, Guest CM, et al. (2004) Olfactory detection of human bladder cancer by dogs: Proof of principle study. BMJ 329(7468): 712.
Wilson AD & Baietto M. (2011) Advances in electronic-nose technologies developed for biomedical applications. Sensors (Basel) 11(1): 1105-1176.
Xiang H, Huang R, Cheng J, et al. (2013) Value of three-dimensional contrast-enhanced ultrasound in the diagnosis of small adnexal masses. Ultrasound Med Biol 39(5): 761-768.
Xiao Y, Chen Y, Kennedy AW, et al. (2000) Evaluation of plasma lysophospholipids for diagnostic significance using electrospray ionization mass spectrometry (ESI-MS) analyses. Ann N Y Acad Sci 905: 242-259.
Xu Y, Shen Z, Wiper DW, et al. (1998) Lysophosphatidic acid as a potential biomarker for ovarian and other gynecologic cancers. JAMA 280(8): 719-723.
Xue R, Dong L, Zhang S, et al. (2008) Investigation of volatile biomarkers in liver cancer blood using solid-phase microextraction and gas chromatography/mass spectrometry. Rapid Commun Mass Spectrom 22(8): 1181-1186.
Yamaguchi K, Nakamura M, Shirahane K, et al. (2005) Urine diacetylspermine as a novel tumour maker for pancreatobiliary carcinomas. Dig Liver Dis 37(3): 190-194.
Yamamoto Y, Yamada R, Oguri H, et al. (2009) Comparison of four malignancy risk indices in the preoperative evaluation of patients with pelvic masses. Eur J Obstet Gynecol Reprod Biol 144(2): 163-167.
Yang K & Han X. (2016) Lipidomics: Techniques, applications, and outcomes related to biomedical sciences. Trends Biochem Sci 41(11): 954-969.

136
Yellen P & Foster DA. (2014) Inhibition of fatty acid synthase induces pro-survival akt and ERK signaling in K-ras-driven cancer cells. Cancer Lett 353(2): 258-263.
Young RC, Walton LA, Ellenberg SS, et al. (1990) Adjuvant therapy in Stage I and Stage II epithelial ovarian cancer. Results of two prospective randomized trials. N Engl J Med 322(15): 1021-1027.
Zannoni L, Savelli L, Jokubkiene L, et al. (2013) Intra- and interobserver reproducibility of assessment of Doppler ultrasound findings in adnexal masses. Ultrasound Obstet Gynecol 42(1): 93-101.
Zeppernick F & Meinhold-Heerlein I. (2014) The new FIGO staging system for ovarian, fallopian tube, and primary peritoneal cancer. Arch Gynecol Obstet 290(5): 839-842.
Zhang T, Wu X, Yin M, et al. (2012) Discrimination between malignant and benign ovarian tumors by plasma metabolomic profiling using ultra performance liquid chromatography/mass spectrometry. Clin Chim Acta 413(9-10): 861-868.
Zhang Y, Liu Y, Li L, et al. (2016) High resolution mass spectrometry coupled with multivariate data analysis revealing plasma lipidomic alteration in ovarian cancer in Asian women. Talanta 150: 88-96.
Zhang Z & Li G. (2010) A review of advances and new developments in the analysis of biological volatile organic compounds. Microchemical Journal 95(2): 127-139.
Zhao YY, Cheng XL, Lin RC, et al. (2015) Lipidomics applications for disease biomarker discovery in mammal models. Biomark Med 9(2): 153-168.
Zhao Z, Cai Q & Xu Y. (2016) The lipidomic analyses in low and highly aggressive ovarian cancer cell lines. Lipids 51(2): 179-187.

137
10 ORIGINAL PUBLICATIONS

138

RESEARCH Open Access
Reliability of preoperative evaluation ofpostmenopausal ovarian tumorsRiikka Johanna Niemi1*, Sami Kristian Saarelainen1, Tiina Hannele Luukkaala2 and Johanna Unelma Mäenpää1,3
Abstract
Background: Preoperative evaluation of ovarian tumors is challenging. This study was undertaken to evaluate theperformance of conventional two-dimensional (2D) ultrasound and CA125 in predicting malignant or benign natureof pelvic masses, and to investigate if three-dimensional power Doppler (3DPD) ultrasound provides any addedvalue. Ninety-six postmenopausal and four perimenopausal women with supposed ovarian tumors were examinedby standardized 2D and 3DPD ultrasounds preoperatively. The tumors were evaluated using the risk of malignancyindex (RMI), International Ovarian Tumors Analysis (IOTA) group simple rules, expert opinion, IOTA logistic regressionmodel 2 (LR2) and 3D vascular indices, and were postoperatively compared to histopathological results.
Results: Ninety-eight tumors turned out to be ovarian in origin. Of these, 66 were benign and 32 malignant. RMI(cut-off value 200), simple rules, expert opinion and LR2 (cut-off value 25) were used to predict malignant nature ofthe tumors and had sensitivities of 71.9, 90.6, 87.5 and 90.6%, and specificities of 80.3, 84.6, 92.4 and 77.3%, respectively.When the 3D vascularization flow index (VFI) was added to RMI and LR2, the accuracy of the test improved from 77.6to 81.4% and from 81.6 to 86.5%, respectively, at the expense of sensitivity, while VFI gave no added benefit for simplerules and expert opinion. Agreement between two examiners using expert opinion was good (Cohen’s kappa = 0.89).
Conclusions: The subjective opinion of an expert seems to be the most reliable method in assessing ovarian tumors,and the 3DPD indices seem to provide no significant added value.
Keywords: Expert opinion, IOTA LR2, IOTA simple rules, Ovarian cancer, Ovarian tumor, Power doppler, Three-dimensional ultrasound
BackgroundOvarian cancer has the leading mortality rate of allgynecological cancers, and the incidence of ovarian can-cer is at its peak among postmenopausal women. Theoptimal treatment of ovarian neoplasms requires correctpreoperative characterization of tumors. The surgicaltreatment of ovarian cancer should be reserved forgynecological oncologists, while benign tumors can beoperated on less radically by general gynecologists, oreven managed conservatively.Preoperatively ultrasound features combined with the
measurements of CA125 has been used to predict themalignancy of a pelvis mass (Risk of Malignancy Index,RMI) since early 1990’s [1]. However, subjective assess-ment by an experienced ultrasound examiner has been
considered to be the best diagnostic method for ovariantumors [2, 3]. While not all gynecologists are so well ac-customed to ultrasound examinations, in 2008 the Inter-national Ovarian Tumors Analysis (IOTA) grouppresented simple ultrasound-based rules that includefive rules for predicting malignant tumors (M-rules) andfive for predicting benign tumors (B-rules). If one ormore M-rules with absence of B-rules or B-rules withabsence of M-rules are present, the tumor is supposedto be malignant or benign, respectively. In a multicenterstudy, these rules were applicable for 76% of all tumorsand showed a sensitivity of 95% and specificity of 91%[4]. If none of the rules is valid or if both M- and B-rulesare present, a tumor is considered to be inconclusive[4, 5]. In that case the opinion of an expert ultra-sound examiner is needed, which is called a two-stepstrategy [6]. In addition, the IOTA group developedtwo logistic regression models (LR1 and LR2) [7].LR1 is based on 12 different variables, and LR2 is
* Correspondence: [email protected] of Obstetrics and Gynecology, Tampere University Hospital, P.O.Box 2000FI-33521 Tampere, FinlandFull list of author information is available at the end of the article
© The Author(s). 2017 Open Access This article is distributed under the terms of the Creative Commons Attribution 4.0International License (http://creativecommons.org/licenses/by/4.0/), which permits unrestricted use, distribution, andreproduction in any medium, provided you give appropriate credit to the original author(s) and the source, provide a link tothe Creative Commons license, and indicate if changes were made. The Creative Commons Public Domain Dedication waiver(http://creativecommons.org/publicdomain/zero/1.0/) applies to the data made available in this article, unless otherwise stated.
Niemi et al. Journal of Ovarian Research (2017) 10:15 DOI 10.1186/s13048-017-0309-4

based on 6, including patient history, clinical signsand ultrasound features. These models have shownsensitivities of 92–95% and 89–95% with specificitiesof 74–87% and 73–86% in detecting ovarian malig-nancies, respectively [8]. Nevertheless, in several stud-ies, the impression of an expert ultrasound examinerhas still been considered to be the best method, or atleast equivalent to LR1 and LR2, for diagnosing ovar-ian pathology [8, 9].An increased density of microvessels and abnormal
vascular tree of the tumor are characteristic of malignantovarian processes [10, 11]. These phenomena have givennew insight for the use of three-dimensional (3D) ultra-sound and 3D power Doppler (3DPD) in evaluating thevascularization of ovarian tumors to discriminate be-tween benign and malignant tumors. Unfortunately,there are no clear cut-off rules for 3D ultrasound fea-tures, limiting their clinical utility [12].The purpose of this study was to examine if 3DPD
ultrasound can offer additional benefits over conven-tional two-dimensional ultrasound and other diagnosticmethods as a useful tool for predicting malignancy of anadnexal mass. The aim was to find the most applicableand reliable preoperative diagnostic approach for post-menopausal women.
MethodsBetween February 2011 and November 2014, one hun-dred women over 50 years of age presenting with an ab-normal adnexal mass(es) at the Department ofObstetrics and Gynecology of Tampere University Hos-pital, were recruited to the study. All patients were des-tined for surgery. Overtly benign or malignant lookingtumors like unilocular simple ovarian cysts and tumorsassociated with marked ascites (depth of the greatestpool over 10 cm) were excluded. In principle, the max-imum allowed diameter of the tumors was 10 cm, allow-ing the entire tumor to be assessible transvaginally.However, there were five tumors, the maximum diam-eter of which exceeded 10 cm at the final examination,but it never exceeded 12 cm.According to preoperative findings, the patients were
operated on by either a gynecological oncologist or ageneral gynecologist, using either laparoscopic or opentechnique.The patients were assessed within 2 weeks prior to
surgery by vaginal two-dimensional (2D) and 3D ultra-sound examination with power Doppler. In the case ofbilateral ovarian tumors, both masses were examined,and the more complex tumor was assessed for the study.All ultrasound examinations were performed by anexperienced gynecologist or the author R.J.N., using aVoluson 730 Expert unit (GE Medical Systems, Zipf,Austria) with a multifrequency transvaginal transducer
(5–9 MHz). A normal B-mode ultrasound assessmentincluded the calculation of the size of the adnexal mass.The power Doppler settings were standardized: fre-quency, 6 MHz; power Doppler gain, -0.6; wall motionfilter (WMF), low 1; pulse repetition filter (PRF),0.6 kHz. The extent of vascularization of the tumor wasdescribed by a score from 1 to 4 (1 = no blood flow de-tected, 4 = high blood flow detected) [13]. 3DPD wasused to examine the ovarian tumor after the 2D evalu-ation. The acquisition sweep angle was set to 85°.A serum sample was obtained preoperatively, and RMI
was calculated by using the original formula of Jacobs etal. in which the serum CA125 level, ultrasound scan re-sult and patient’s menopausal status are taken into ac-count [1]. The ultrasound data were stored on a harddisk for later evaluation. Based on the ultrasound exam-ination, the examiner classified the adnexal tumor as be-nign or malignant (expert opinion), immediatelyfollowing the actual examination. From the 2D data, thetumors were classified by using the IOTA simple rules.If none of these rules applied or if both M- and B-ruleswere applicable, the tumor could not be classified. Insuch case, the tumor was evaluated subjectively by theexaminer as benign or malignant.The IOTA LR2 was implemented by using the Predict-
ive IOTA models for ovarian cancer application soft-ware, version 2013 (App for IOS operating systems). Inthe LR2 model, the six variables used are age of the pa-tient, presence/absence of ascites, presence/absence ofpapillations/papillary projections with blood flow, max-imum diameter of the largest solid component, irregularcyst walls and presence/absence of acoustic shadows.This calculated model yields the probability of malig-nancy of an ovarian tumor.The analyses of the stored 3D volumes were per-
formed by the same investigator (R.J.N.) using a virtualorgan computer-aided analysis (VOCAL™) imaging pro-gram and 4D-View software (GE Healthcare, v 9.1). Thevolume of each adnexal tumor was measured by manualdelineation of the contour of the mass with a 15°-rota-tion step. Using the VOCAL software’s histogram fea-ture, three vascular indices were calculated from theadnexal tumors: vascularization index (VI), flow index(FI) and vascularization flow index (VFI). VI representsthe number of vessels in the studied volume and isexpressed as a percentage. FI reflects the intensity ofblood flow at the time of the 3D sweep. VFI is inter-preted to be a combination of VI and FI representingboth vascularization and blood flow. FI and VFI areexpressed as values ranging from 0 to 100 [12, 14, 15].To estimate the interobserver agreement, another ex-
perienced ultrasound examiner (S.K.S.) re-evaluated thestored ultrasound data and classified the malignancy oftumors (expert opinion), and analysed 3D volumes.
Niemi et al. Journal of Ovarian Research (2017) 10:15 Page 2 of 7

The ultrasound examinations and off-line assessmentswere performed blinded for each other’s results and thehistopathological diagnoses while analyzing the tumors.The preoperative findings were finally compared to post-operative histopathological diagnoses. For the purpose ofthis analysis, the borderline and low grade ovarian tu-mors were classified as malignant because normally alsothey are staged surgically. All participants gave their in-formed consent to the study, which was approved by theEthics Committee of Tampere University Hospital (ETLR10080, 6 August 2010).
Statistical analysisNo sample size calculation was performed due to thepreliminary descriptive nature of this study. All datawere analyzed using IBM SPSS Statistics for Windows,version 22 (Armonk, NY, IBM Corp.). The normality ofthe distributions of continuous variables was evaluatedby Kolmogorov-Smirnov tests. Due to the skewness ofthe distributions, the comparisons of groups were per-formed using Mann-Whitney U-tests, and correlationswere evaluated using Spearman’s correlation tests. Re-ceiver operating characteristics curves (ROC) were usedfor evaluating the performance of serum CA125, RMI,LR2 and 3D vascular indices as predictive tests formalignancy. The best cut-off values of the models werecalculated in consideration of sensitivity, specificity,positive predictive value and negative predictive value.Binomial variables were evaluated by Fischer’s exact testsor Pearson Chi-Square tests when appropriate.The agreement of ultrasound features by both ultra-
sound examiners (R.J.N. and S.K.S.) was estimated by cal-culating the Cohen’s kappa index. A kappa value of lessthan 0.20 indicates poor agreement, 0.21–0.40 moderateagreement, 0.61–0.80 good agreement and 0.81–1.00 verygood agreement [16]. Interobserver agreement of 3DPDindices were analyzed by related-samples Wilcoxon signedrank test.
ResultsIn 100 patients with supposed adnexal masses, thetumors of 98 patients turned out to be true ovariantumors, while the remaining two were appendiceal inorigin. Of the 98 ovarian tumors, sixty-six (67.3%) werebenign, of which 19 were bilateral. Respectively, 32(32.7%) of the tumors were malignant, of which six werebilateral. Of the malignant tumors, 17 were epithelialserous, five epithelial mucinous, and eight of other path-ology. Two of the malignant tumors were metastases ofintestinal cancer. The histologic diagnoses of adnexalmasses are presented in Table 1.The median age of the patients was 61 (range, 50–84)
years. Tumor pathology did not depend on the age ofthe women or the bilaterality of the tumors. Three of
the women in the benign ovarian tumor group and onein the malignant group were in fact perimenopausal, be-cause they had experienced menstrual bleeding duringthe previous 6 months. Systemic hormone replacementtherapy was used before surgery by 17 women with be-nign tumors and by five with malignant tumors. Themedian body mass index was 26 (range, 20–44) forwomen with benign tumors and respectively 27 (range,19–39) for women with malignant tumors. The mediandiameters of the tumors in the groups were 6 (range,3–11) and 7 (range, 3–12) cm, respectively. The me-dian serum CA125 levels were 15 (range, 6–127) and50 (range, 9–3195) kU/L, respectively, and the differ-ence between the groups was significant (p < 0.001).The calculated median values of RMI for benign andmalignant cases were 99 (range, 10–1143) and 360(range, 27–7488), respectively (p < 0.001). The age ofthe patients, body mass indexes and CA125 levels didnot correlate with each other.The performances of the assessed methods are given
in Table 2. Seventy-six (77.6%) of the tumors were
Table 1 Histology of the tumors
Histologic type Number Percent
Benign 66 (67.3)
Serous cystadenoma/adenofibroma 39
Fibroma/thecoma 5
Teratoma 7
Brenner tumor 1
Endometrioma 3
Mucinous cystadenoma 3
Serous/hemorrhagic cyst 7
Bizarre leiomyoma 1
Malignant 32 (32.7)
Epithelial tumors
Serous
High grade 9
Low grade 3
Borderline 5
Mucinous
Adenocarcinoma 3
Borderline 2
Clear cell carcinoma 1
Carcinosarcoma 2
Non-epithelial tumors
Granulosa cell tumor 4
Sertoli-Leydig cell tumor 1
Metastatica 2
Total 98 (100.0)aPrimary tumors: sigmoid carcinoma and carcinoma of the appendix
Niemi et al. Journal of Ovarian Research (2017) 10:15 Page 3 of 7
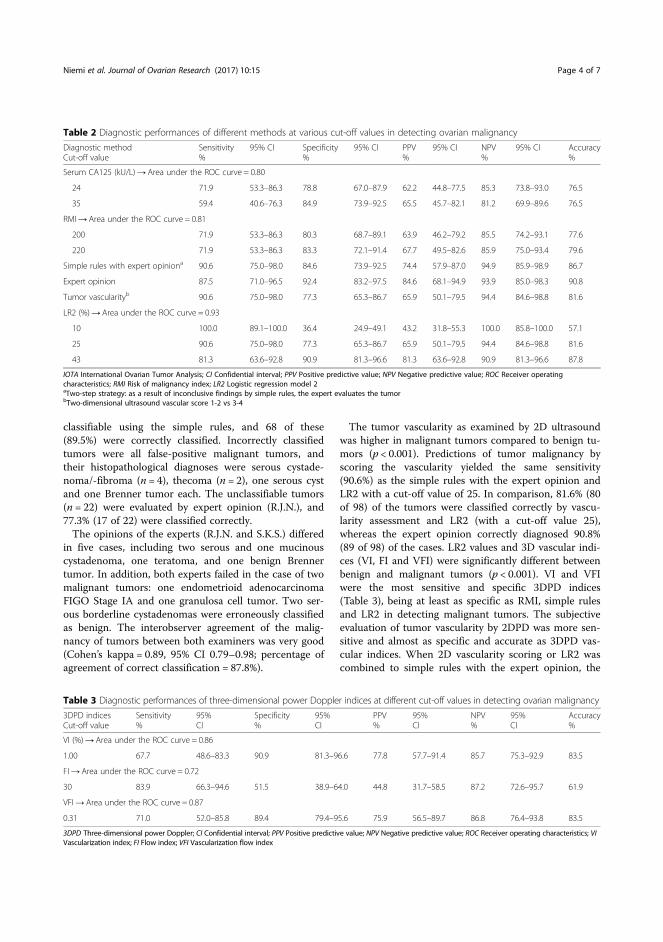
classifiable using the simple rules, and 68 of these(89.5%) were correctly classified. Incorrectly classifiedtumors were all false-positive malignant tumors, andtheir histopathological diagnoses were serous cystade-noma/-fibroma (n = 4), thecoma (n = 2), one serous cystand one Brenner tumor each. The unclassifiable tumors(n = 22) were evaluated by expert opinion (R.J.N.), and77.3% (17 of 22) were classified correctly.The opinions of the experts (R.J.N. and S.K.S.) differed
in five cases, including two serous and one mucinouscystadenoma, one teratoma, and one benign Brennertumor. In addition, both experts failed in the case of twomalignant tumors: one endometrioid adenocarcinomaFIGO Stage IA and one granulosa cell tumor. Two ser-ous borderline cystadenomas were erroneously classifiedas benign. The interobserver agreement of the malig-nancy of tumors between both examiners was very good(Cohen’s kappa = 0.89, 95% CI 0.79–0.98; percentage ofagreement of correct classification = 87.8%).
The tumor vascularity as examined by 2D ultrasoundwas higher in malignant tumors compared to benign tu-mors (p < 0.001). Predictions of tumor malignancy byscoring the vascularity yielded the same sensitivity(90.6%) as the simple rules with the expert opinion andLR2 with a cut-off value of 25. In comparison, 81.6% (80of 98) of the tumors were classified correctly by vascu-larity assessment and LR2 (with a cut-off value 25),whereas the expert opinion correctly diagnosed 90.8%(89 of 98) of the cases. LR2 values and 3D vascular indi-ces (VI, FI and VFI) were significantly different betweenbenign and malignant tumors (p < 0.001). VI and VFIwere the most sensitive and specific 3DPD indices(Table 3), being at least as specific as RMI, simple rulesand LR2 in detecting malignant tumors. The subjectiveevaluation of tumor vascularity by 2DPD was more sen-sitive and almost as specific and accurate as 3DPD vas-cular indices. When 2D vascularity scoring or LR2 wascombined to simple rules with the expert opinion, the
Table 2 Diagnostic performances of different methods at various cut-off values in detecting ovarian malignancy
Diagnostic methodCut-off value
Sensitivity%
95% CI Specificity%
95% CI PPV%
95% CI NPV%
95% CI Accuracy%
Serum CA125 (kU/L)→ Area under the ROC curve = 0.80
24 71.9 53.3–86.3 78.8 67.0–87.9 62.2 44.8–77.5 85.3 73.8–93.0 76.5
35 59.4 40.6–76.3 84.9 73.9–92.5 65.5 45.7–82.1 81.2 69.9–89.6 76.5
RMI→ Area under the ROC curve = 0.81
200 71.9 53.3–86.3 80.3 68.7–89.1 63.9 46.2–79.2 85.5 74.2–93.1 77.6
220 71.9 53.3–86.3 83.3 72.1–91.4 67.7 49.5–82.6 85.9 75.0–93.4 79.6
Simple rules with expert opiniona 90.6 75.0–98.0 84.6 73.9–92.5 74.4 57.9–87.0 94.9 85.9–98.9 86.7
Expert opinion 87.5 71.0–96.5 92.4 83.2–97.5 84.6 68.1–94.9 93.9 85.0–98.3 90.8
Tumor vascularityb 90.6 75.0–98.0 77.3 65.3–86.7 65.9 50.1–79.5 94.4 84.6–98.8 81.6
LR2 (%)→ Area under the ROC curve = 0.93
10 100.0 89.1–100.0 36.4 24.9–49.1 43.2 31.8–55.3 100.0 85.8–100.0 57.1
25 90.6 75.0–98.0 77.3 65.3–86.7 65.9 50.1–79.5 94.4 84.6–98.8 81.6
43 81.3 63.6–92.8 90.9 81.3–96.6 81.3 63.6–92.8 90.9 81.3–96.6 87.8
IOTA International Ovarian Tumor Analysis; CI Confidential interval; PPV Positive predictive value; NPV Negative predictive value; ROC Receiver operatingcharacteristics; RMI Risk of malignancy index; LR2 Logistic regression model 2aTwo-step strategy: as a result of inconclusive findings by simple rules, the expert evaluates the tumorbTwo-dimensional ultrasound vascular score 1-2 vs 3-4
Table 3 Diagnostic performances of three-dimensional power Doppler indices at different cut-off values in detecting ovarian malignancy
3DPD indicesCut-off value
Sensitivity%
95%CI
Specificity%
95%CI
PPV%
95%CI
NPV%
95%CI
Accuracy%
VI (%)→ Area under the ROC curve = 0.86
1.00 67.7 48.6–83.3 90.9 81.3–96.6 77.8 57.7–91.4 85.7 75.3–92.9 83.5
FI→ Area under the ROC curve = 0.72
30 83.9 66.3–94.6 51.5 38.9–64.0 44.8 31.7–58.5 87.2 72.6–95.7 61.9
VFI→ Area under the ROC curve = 0.87
0.31 71.0 52.0–85.8 89.4 79.4–95.6 75.9 56.5–89.7 86.8 76.4–93.8 83.5
3DPD Three-dimensional power Doppler; CI Confidential interval; PPV Positive predictive value; NPV Negative predictive value; ROC Receiver operating characteristics; VIVascularization index; FI Flow index; VFI Vascularization flow index
Niemi et al. Journal of Ovarian Research (2017) 10:15 Page 4 of 7
specificity slightly increased, albeit at the expense ofsensitivity (data not shown).The interobserver agreement between the two experts
was good also in the case of calculated 3DPD indices, asshown in Table 4.By combining RMI and LR2 with VFI and using suit-
able cut-off values, the accuracies and specificities ofRMI and LR2 improved, while their sensitivities de-creased. On the other hand, combining these 3DPDindices with simple rules or the expert opinion did notimprove either method’s accuracy. Newly created com-bination models are given in Table 5.
DiscussionTo the best of our knowledge, this is the first study tocompare such a large spectrum of various preoperativemethods (serum CA125, RMI, simple ultrasound rules,expert opinion, 2DPD and IOTA LR2) along with 3DPDindices for discrimination between benign and malignantovarian tumors. The results of the present study implythat clinical expert opinion still provides the bestmethod for diagnosing malignant ovarian tumors, withno additional benefit provided by use of 3DPD indices.Regarding the specificity of 3DPD indices, VI and VFIare only as specific as the traditional methods CA125and RMI, but the combination of them with LR2 andRMI provides a clear improvement of specificity, butunfortunately at the expense of sensitivity.The present results regarding the superiority of ex-
pert opinion are in accordance with previous studies.Timmerman et al. [5] found in their prospective studycomparing IOTA-based simple rules, LR1 and LR2,and subjective assessment of the sonologist that ex-pert’s opinion is either better or equivalent to thescoring systems.A weakness of this study is the rather small number of
patients, but on the other hand, all the patients were ex-amined by the same investigator, which in turn can beconsidered to be an advantage. Moreover, the data wasassessed by another examiner yielding a very good agree-ment between both examiners. Another advantage is aquite homogenous patient population, with only four
perimenopausal women among 96 postmenopausal pa-tients. A potential bias of the study is that although RMIwas originally developed as a triage test for use by a lessexperienced ultrasound examiner to predict the malig-nancy of a tumor, in this study it was rather used by anultrasound expert in parallel with simple rules and LR2designed to triage patients who should be operated onby a gynecologic oncologist [5, 8]. The main rationalefor including also RMI was to provide a reader less expe-rienced in ultrasound, with a familiar comparator for themore specific triage methods.CA125 is widely used as a tumor marker for epithelial
ovarian cancer. It is quite accurate among postmeno-pausal women, while the relatively great number offalse-positive results limits its utility in premenopausalsetting. Our cut-off value was 35 kU/L, whereas somereports have used lower cut-offs, which might explainthe lower sensitivity of CA125 (59.4%) in our study. In areview article on seven studies, the pooled sensitivityand specificity of CA125 in postmenopausal womenwere 85.9 and 85.2%, respectively [17]. We also tested alower cut-off value of 24 kU/L, which clearly improvedsensitivity, while somewhat weakening specificity.In their original study, Jacobs et al. described a sensi-
tivity of 85% and a specificity of 97% for a RMI cut-offlevel of 200 [1]. A review of RMI on 13 studies showedthat for a cut-off level of 200, the pooled estimate forsensitivity was 78% (95% CI 71–85%) and for specificitywas 87% (95% CI 83–91%), which is still better than inour study [18]. The reason for this may be our ratherlimited sample size, or the fact that the majority of themalignant tumors were of low malignant potential i.e.borderline epithelial, granulosa and Sertoli-Leydig celltumors, which may have contributed to the less-than-optimal performance of RMI.An IOTA-based protocol classified a woman as being
at high risk for ovarian malignancy if the estimated LR2risk was at least 25%, at intermediate risk if LR2 was be-tween 5 and 25% and at low risk if LR2 was below 5%[19]. It has been presumed that the LR2-based protocolis more accurate than the RMI-based protocol, and isrecommended to be used instead of RMI in discriminat-ing ovarian tumors and concluding treatment protocols[19]. In the multicenter study of Testa et al., LR2 andRMI achieved AUC values of 0.90 and 0.85, respectivelyin 1,049 postmenopausal patients [6]. The correspondingAUC values in the present study were quite similar, 0.93and 0.81. We argue that LR2 ≥ 25% risk is the most prac-tical value in clinical work because in our study itachieved a negative predictive value of 94.4%.Different preoperative scoring systems of ovarian tu-
mors were evaluated in the meta-analysis of Kaijser et al.The pooled sensitivity and specificity of simple rules infive validated studies were found to be 93 and 81%,
Table 4 Interobserver agreement between two experts usingthree-dimensional power Doppler (3DPD) indices
3DPDindices
Expert opinion 1 Expert opinion 2 p-valuea
Median(25–75% quartiles)
Median(25–75% quartiles)
VI 0.337 (0.069–1.098) 0.259 (0.066–0.894) 0.151
FI 31.796 (25.308–35.821) 31.693 (26.351–36.638) 0.839
VFI 0.112 (0.019–0.397) 0.079 (0.019–0.292) 0.257
3DPD Three-dimensional power Doppler; VI Vascularization index; FI Flowindex; VFI Vascularization flow indexaCalculated by related-samples Wilcoxon signed rank test
Niemi et al. Journal of Ovarian Research (2017) 10:15 Page 5 of 7

respectively [20]. However, the inconclusive cases wereassessed to be malignant, which differs from our studywhere in the inconclusive results obtained by the simplerules protocol, the tumors were subjectively classified asbeing either benign or malignant by the same examiner.This is described as a two-step strategy [6]. In our data85/98 of tumors were classified correctly by using thistwo-step strategy. Only three of 13 incorrectly classifiedtumors were false negative, or they were malignant al-though they were classified as benign. We reachedequivalent results as the meta-analysis by Testa et al.,which yielded a sensitivity of 93% and specificity of 83%for the two-step strategy in postmenopausal women [6].Our results are also in line with a large database ofIOTA studies which has shown that the pattern recogni-tion by an experienced clinician is the best method inassessing ovarian tumors [8]. Recently, Piovano et al.showed that when serum CA125 was added to simplerules with subjective assessment for diagnosing ovariantumors, the diagnostic accuracy increased, with an ac-ceptable cost/benefit ratio [21].In recent years, several studies have been published,
where 3D ultrasound assessment has been used ingynecological cancers, including ovarian cancer. It hasbeen shown that 3DPD vascular indices are elevated inmalignant ovarian tumors [22]. Jokubkiene et al. alsofound this difference, but quantitative 3DPD indices ofan ovarian tumor measured by another expert did notadd any significant information to subjective quantita-tion by the original examiner of 2DPD findings [23].Similarly, Guerriero et al. reported that 3DPD indicesfailed to improve accuracy as a secondary test for ovar-ian tumors alongside the evaluation of centralvascularization by 2DPD [24]. On the contrary, Geominiet al. found that 3D ultrasonography significantly im-proved the discrimination of ovarian pathology, whenthey compared 2D to 3D ultrasound models [25]. Twomethods of vascular sampling, manual [22] and spherical[23], have been purported to be alternatives to measur-ing the vascularity of the whole tumor, but based on ourexperience, the entire tumor should be taken account. Insupport of this, Kudla and Alcazar have shown that thesize of the sphere volume does not affect power Dopplerindices [26].
Our results do not differ from those of the only previ-ous study that compared simple rules and 3DPD. Thestudy of Silvestre et al. assessed 3DPD examination andsimple rules in the identification of ovarian tumors [27].They did not use other preoperative diagnostic methods,and the menopausal status of the patients was ignored.Similar to our study, the ovarian tumors were classifiedby conventional 2DPD according to IOTA vascularscores. They found that VI and VFI differentiated malig-nant tumors from benign ones, but they were not moreaccurate than 2D vascular scores. The use of 3D vascularindices did not decrease the number of false positiveresults obtained by simple rules.
ConclusionsCombining the 3DPD vascular index VFI with RMI orLR2 may increase the specificity of the diagnostic test, butan ultrasound examination by an experienced clinician stillseems to be the most reliable method in the preoperativework-up of ovarian tumors.
Abbreviations2D: Two-dimensional; 2DPD: Two-dimensional power Doppler;3D: Three-dimensional; 3DPD: Three-dimensional power Doppler;FI: Flow index; IOTA: International Ovarian Tumors Analysis; LR: Logisticregression model; RMI: Risk of malignancy index; VFI: Vascularizationflow index; VI: Vascularization index
AcknowledgementsNot applicable.
FundingThe study was supported by Finnish Cancer Society and CompetitiveResearch Funding of the Tampere University Hospital (Grant 9S040).
Availability of data and materialsThe datasets used and analysed during the current study are available andcan be provided by the corresponding author upon request.
Authors’ contributionsRN did all the ultrasound examinations and wrote the first draft of themanuscript. SS evaluated the stored data as the second investigator andreviewed the manuscript. TL did the statistical analysis. JM presented theoriginal idea, supervised the study, and revised the manuscript. All authorsread and approved the final manuscript.
Authors’ informationNot applicable.
Competing interestsThe authors declare that they have no competing interests.
Table 5 Diagnostic performances of combined methods to detect malignancy at specific cut-off values
Developed method Sensitivity%
95% CI Specificity%
95% CI PPV%
95% CI NPV%
95% CI Accuracy%
RMI > 200 and VFI > 0.31 51.6 33.1–69.9 95.5 87.3–99.1 84.2 60.4–96.6 80.8 70.3–88.8 81.4
Simple rules with expert opiniona and VFI > 0.31 71.0 52.0–85.8 95.5 87.3–99.1 88.0 68.8–97.5 87.5 77.6–94.1 86.7
LR2 > 25 and VFI > 0.31 64.5 45.4–80.8 97.0 89.5–99.6 90.9 70.8–98.9 85.3 75.3–92.4 86.5
IOTA International Ovarian Tumor Analysis; CI Confidential interval; PPV Positive predictive value; NPV Negative predictive value; RMI Risk of malignancy index; VFIVascularization flow index; LR2 Logistic regression model 2aTwo step-strategy: As a result of inconclusive by simple rules, the expert evaluates the tumor
Niemi et al. Journal of Ovarian Research (2017) 10:15 Page 6 of 7
Consent for publicationNot applicable.
Ethics approval and consent to participateAll participants gave their informed consent to the study, which wasapproved by the Ethics Committee of Tampere University Hospital (ETLR10080, 6 August 2010).
Publisher’s NoteSpringer Nature remains neutral with regard to jurisdictional claims inpublished maps and institutional affiliations.
Author details1Department of Obstetrics and Gynecology, Tampere University Hospital, P.O.Box 2000FI-33521 Tampere, Finland. 2Research and Innovation Center,Tampere University Hospital and Faculty of Social Sciences, University ofTampere, FI-33014 Tampere, Finland. 3Faculty of Medicine and Life Sciences,University of Tampere, FI-33014 Tampere, Finland.
Received: 22 December 2016 Accepted: 2 March 2017
References1. Jacobs I, Oram D, Fairbanks J, Turner J, Frost C, Grudzinskas JG. A risk of
malignancy index incorporating CA 125, ultrasound and menopausal statusfor the accurate preoperative diagnosis of ovarian cancer. Br J ObstetGynaecol. 1990;97(10):922–9.
2. Valentin L, Hagen B, Tingulstad S, Eik-Nes S. Comparison of ‘patternrecognition’ and logistic regression models for discrimination betweenbenign and malignant pelvic masses: a prospective cross validation.Ultrasound Obstet Gynecol. 2001;18(4):357–65.
3. Timmerman D. The use of mathematical models to evaluate pelvic masses;can they beat an expert operator? Best Pract Res Clin Obstet Gynaecol.2004;18(1):91–104.
4. Timmerman D, Testa AC, Bourne T, Ameye L, Jurkovic D, Van Holsbeke C,et al. Simple ultrasound-based rules for the diagnosis of ovarian cancer.Ultrasound Obstet Gynecol. 2008;31(6):681–90.
5. Timmerman D, Ameye L, Fischerova D, Epstein E, Melis GB, Guerriero S,et al. Simple ultrasound rules to distinguish between benign and malignantadnexal masses before surgery: prospective validation by IOTA group. BMJ.2010;341:c6839.
6. Testa A, Kaijser J, Wynants L, Fischerova D, Van Holsbeke C, Franchi D, et al.Strategies to diagnose ovarian cancer: new evidence from phase 3 of themulticentre international IOTA study. Br J Cancer. 2014;111(4):680–8.
7. Timmerman D, Testa AC, Bourne T, Ferrazzi E, Ameye L, Konstantinovic ML,et al. Logistic regression model to distinguish between the benign andmalignant adnexal mass before surgery: a multicenter study by theInternational Ovarian Tumor Analysis Group. J Clin Oncol. 2005;23(34):8794–801.
8. Kaijser J, Bourne T, Valentin L, Sayasneh A, Van Holsbeke C, Vergote I, et al.Improving strategies for diagnosing ovarian cancer: a summary of theInternational Ovarian Tumor Analysis (IOTA) studies. Ultrasound ObstetGynecol. 2013;41(1):9–20.
9. Meys EM, Kaijser J, Kruitwagen RF, Slangen BF, Van Calster B, Aertgeerts B, etal. Subjective assessment versus ultrasound models to diagnose ovariancancer: A systematic review and meta-analysis. Eur J Cancer. 2016;58:17–29.
10. Orre M, Lotfi-Miri M, Mamers P, Rogers PA. Increased microvessel density inmucinous compared with malignant serous and benign tumours of theovary. Br J Cancer. 1998;77(12):2204–9.
11. Konerding MA, Malkusch W, Klapthor B, van Ackern C, Fait E, Hill SA, et al.Evidence for characteristic vascular patterns in solid tumours: quantitativestudies using corrosion casts. Br J Cancer. 1999;80(5-6):724–32.
12. Alcazar JL, Rodriguez D. Three-dimensional power Doppler vascularsonographic sampling for predicting ovarian cancer in cystic-solid and solidvascularized masses. J Ultrasound Med. 2009;28(3):275–81.
13. Timmerman D, Valentin L, Bourne TH, Collins WP, Verrelst H, Vergote I.Terms, definitions and measurements to describe the sonographic featuresof adnexal tumors: a consensus opinion from the International OvarianTumor Analysis (IOTA) Group. Ultrasound Obstet Gynecol. 2000;16(5):500–5.
14. Alcazar JL, Jurado M. Three-dimensional ultrasound for assessingwomen with gynecological cancer: a systematic review. Gynecol Oncol.2011;120(3):340–6.
15. Pairleitner H, Steiner H, Hasenoehrl G, Staudach A. Three-dimensional powerDoppler sonography: imaging and quantifying blood flow and vascularization.Ultrasound Obstet Gynecol. 1999;14(2):139–43.
16. Brennan P, Silman A. Statistical methods for assessing observer variability inclinical measures. BMJ. 1992;304(6840):1491–4.
17. Wang J, Gao J, Yao H, Wu Z, Wang M, Qi J. Diagnostic accuracy of serumHE4, CA125 and ROMA in patients with ovarian cancer: a meta-analysis.Tumour Biol. 2014;35(6):6127–38.
18. Geomini P, Kruitwagen R, Bremer GL, Cnossen J, Mol BW. The accuracy ofrisk scores in predicting ovarian malignancy: a systematic review. ObstetGynecol. 2009;113(2 Pt 1):384–94.
19. Van Calster B, Timmerman D, Valentin L, McIndoe A, Ghaem-Maghami S,Testa AC, et al. Triaging women with ovarian masses for surgery:observational diagnostic study to compare RCOG guidelines with anInternational Ovarian Tumour Analysis (IOTA) group protocol. BJOG. 2012;119(6):662–71.
20. Kaijser J, Sayasneh A, Van Hoorde K, Ghaem-Maghami S, Bourne T,Timmerman D, et al. Presurgical diagnosis of adnexal tumours usingmathematical models and scoring systems: a systematic review andmeta-analysis. Hum Reprod Update. 2014;20(3):449–62.
21. Piovano E, Cavallero C, Fuso L, Viora E, Ferrero A, Gregori G, et al. diagnosticaccuracy and cost-effectiveness of different strategies to triage adnexalmasses: a prospective study. Ultrasound Obstet Gynecol. 2016; doi: 10.1002/uog.17320.
22. Alcazar JL, Merce LT, Garcia MM. Three-dimensional power Doppler vascularsampling: a new method for predicting ovarian cancer in vascularizedcomplex adnexal masses. J Ultrasound Med. 2005;24(5):689–96.
23. Jokubkiene L, Sladkevicius P, Valentin L. Does three-dimensional powerDoppler ultrasound help in discrimination between benign and malignantovarian masses? Ultrasound Obstet Gynecol. 2007;29(2):215–25.
24. Guerriero S, Ajossa S, Piras S, Gerada M, Floris S, Garau N, et al. Three-dimensional quantification of tumor vascularity as a tertiary test after B-modeand power Doppler evaluation for detection of ovarian cancer. J UltrasoundMed. 2007;26(10):1271–8.
25. Geomini PM, Coppus SF, Kluivers KB, Bremer GL, Kruitwagen RF, Mol BW. Isthree-dimensional ultrasonography of additional value in the assessment ofadnexal masses? Gynecol Oncol. 2007;106(1):153–9.
26. Kudla MJ, Alcazar JL. Does sphere volume affect the performance of three-dimensional power Doppler virtual vascular sampling for predictingmalignancy in vascularized solid or cystic-solid adnexal masses? UltrasoundObstet Gynecol. 2010;35(5):602–8.
27. Silvestre L, Martins WP, Candido-Dos-Reis FJ. Limitations of three-dimensional power Doppler angiography in preoperative evaluation ofovarian tumors. J Ovarian Res. 2015;8:47. 015-0174-y.
• We accept pre-submission inquiries
• Our selector tool helps you to find the most relevant journal
• We provide round the clock customer support
• Convenient online submission
• Thorough peer review
• Inclusion in PubMed and all major indexing services
• Maximum visibility for your research
Submit your manuscript atwww.biomedcentral.com/submit
Submit your next manuscript to BioMed Central and we will help you at every step:
Niemi et al. Journal of Ovarian Research (2017) 10:15 Page 7 of 7

Urinary Polyamines as Biomarkers for Ovarian Cancer
Riikka Johanna Niemi, MD,* Antti N. Roine, MD, PhD,Þ Merja R. Hakkinen, PhD,þPekka S. Kumpulainen, DSc,§ Tuomo A. Keinanen, PhD,þ Jouko J. Vepsalainen, PhD,þ
Terho Lehtimaki, MD, PhD,|| Niku K. Oksala, MD, PhD, DSc,¶#and Johanna U. Maenpaa, MD, PhD***
Objectives: Elevated concentrations of polyamines have been found in urine of patientswith malignant tumors, including ovarian cancer. Previous research has suffered from poorlystandardized detection methods. Our liquid chromatographyYtandem mass spectrometry(LC-MS/MS) method is capable of simultaneous standardized analysis of most knownpolyamines. Liquid chromatographyYtandem mass spectrometry has not previously beenused in the differential diagnostics of ovarian tumors in postmenopausal women.Materials and Methods: In this prospective study, postmenopausal women (n = 71)presenting with an adnexal mass and, as controls, women with genital prolapse or urinaryincontinence scheduled for surgery (n = 22) were recruited in the study. For analysis of thepolyamines, a morning urine sample was obtained before surgery. Preoperative serumCA125 concentrations were determined in the study group.Results: Twenty-three women with benign and 37 with malignant ovarian tumors wereeligible. Of all analyzed polyamines, only urinary N1,N12-diacetylspermine showed sta-tistically significant differences between all groups except controls versus benign tumors.N1,N12-diacetylspermine was elevated in malignant versus benign tumors (P G 0.001), inhigh-grade versus low malignant potential tumors (P G 0.001), in stage III to IV versus stageI to II cancers (P G 0.001), and even in early-stage cancer (stage IYII) versus benign tumors(P = 0.017). N1,N12-diacetylspermine had better sensitivity (86.5%) but lower specificity(65.2%) for distinguishing benign and malignant ovarian tumors than CA125 with a cut-offvalue of 35 kU/L (sensitivity, 75.7%; specificity, 69.6%).Conclusions: Urinary N1,N12-diacetylspermine seems to be able to distinguish benign andmalignant ovarian tumors as well as early and advanced stage, and low malignant potentialand high-grade ovarian cancers from each other, respectively.
Key Words: LC-MS/MS, Ovarian tumor, Ovarian cancer, DiAcSpm, Polyamine
Received February 6, 2017, and in revised form March 30, 2017.Accepted for publication April 1, 2017.
(Int J Gynecol Cancer 2017;27: 1360Y1366)
ORIGINAL STUDY
1360 International Journal of Gynecological Cancer & Volume 27, Number 7, September 2017
*Department of Obstetrics and Gynecology, Tampere University Hos-pital; †Faculty of Medicine and Life Sciences, University of Tampere,Tampere; ‡School of Pharmacy, Biocenter Kuopio, University of EasternFinland, Kuopio; §Digital Health Solutions; ||Department of ClinicalChemistry, Fimlab Laboratories and Faculty of Medicine and LifeSciences; ¶Department of Surgery, Faculty of Medicine and Life Sci-ences, University of Tampere; #Department of Vascular Surgery,Tampere University Hospital; and **Department of Obstetrics andGynecology, Faculty of Medicine and Life Sciences, University ofTampere, Tampere, Finland.
Address correspondence and reprint requests to Riikka JohannaNiemi, MD, Department of Obstetrics and Gynecology, TampereUniversity Hospital, P.O. Box 2000, FI-33521 Tampere, Finland.E-mail: [email protected].
This project was financially supported by the Competitive ResearchFunding of the Tampere University Hospital (grant X51001 toT.L., grant 9S040 to J.M., grant 9S045 to N.O.) and by thestrategic funding from University of Eastern Finland (to M.H.,T.K., and J.V.), Cancer Foundation of Finland (to J.M., T.L., andN.O.), Elna Kaarina Savolainen’s Cancer Research Fund (to N.O.),Seppo Nieminen’s Testament Fund (to N.O.), TampereTuberculosis Foundation (to N.O.), and Finnish Funding Agencyfor Technology and Innovation (TEKES) (to N.O.).
The authors declare no conflicts of interest.N.K.O. and J.U.M. contributed equally in the study.
Copyright * 2017 by IGCS and ESGOISSN: 1048-891XDOI: 10.1097/IGC.0000000000001031
Copyright © 2017 by IGCS and ESGO. Unauthorized reproduction of this article is prohibited.
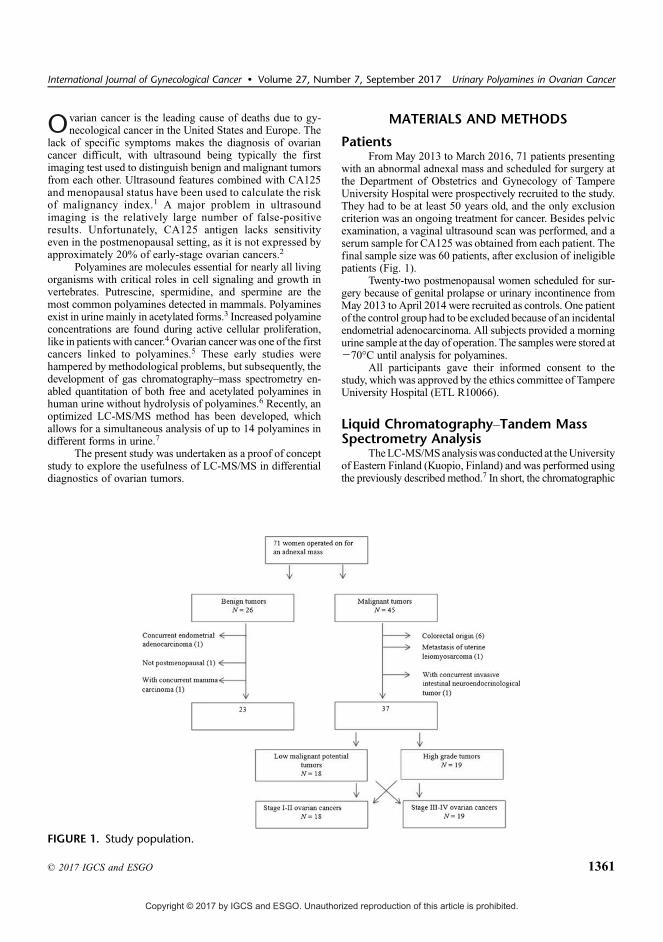
Ovarian cancer is the leading cause of deaths due to gy-necological cancer in the United States and Europe. The
lack of specific symptoms makes the diagnosis of ovariancancer difficult, with ultrasound being typically the firstimaging test used to distinguish benign and malignant tumorsfrom each other. Ultrasound features combined with CA125and menopausal status have been used to calculate the riskof malignancy index.1 A major problem in ultrasoundimaging is the relatively large number of false-positiveresults. Unfortunately, CA125 antigen lacks sensitivityeven in the postmenopausal setting, as it is not expressed byapproximately 20% of early-stage ovarian cancers.2
Polyamines are molecules essential for nearly all livingorganisms with critical roles in cell signaling and growth invertebrates. Putrescine, spermidine, and spermine are themost common polyamines detected in mammals. Polyaminesexist in urine mainly in acetylated forms.3 Increased polyamineconcentrations are found during active cellular proliferation,like in patientswith cancer.4 Ovarian cancer was one of the firstcancers linked to polyamines.5 These early studies werehampered by methodological problems, but subsequently, thedevelopment of gas chromatographyYmass spectrometry en-abled quantitation of both free and acetylated polyamines inhuman urine without hydrolysis of polyamines.6 Recently, anoptimized LC-MS/MS method has been developed, whichallows for a simultaneous analysis of up to 14 polyamines indifferent forms in urine.7
The present study was undertaken as a proof of conceptstudy to explore the usefulness of LC-MS/MS in differentialdiagnostics of ovarian tumors.
MATERIALS AND METHODS
PatientsFrom May 2013 to March 2016, 71 patients presenting
with an abnormal adnexal mass and scheduled for surgery atthe Department of Obstetrics and Gynecology of TampereUniversity Hospital were prospectively recruited to the study.They had to be at least 50 years old, and the only exclusioncriterion was an ongoing treatment for cancer. Besides pelvicexamination, a vaginal ultrasound scan was performed, and aserum sample for CA125 was obtained from each patient. Thefinal sample size was 60 patients, after exclusion of ineligiblepatients (Fig. 1).
Twenty-two postmenopausal women scheduled for sur-gery because of genital prolapse or urinary incontinence fromMay 2013 to April 2014 were recruited as controls. One patientof the control group had to be excluded because of an incidentalendometrial adenocarcinoma. All subjects provided a morningurine sample at the day of operation. The sampleswere stored atj70-C until analysis for polyamines.
All participants gave their informed consent to thestudy, which was approved by the ethics committee of TampereUniversity Hospital (ETL R10066).
Liquid ChromatographyYTandem MassSpectrometry Analysis
TheLC-MS/MSanalysiswas conducted at theUniversityof Eastern Finland (Kuopio, Finland) and was performed usingthe previously described method.7 In short, the chromatographic
FIGURE 1. Study population.
International Journal of Gynecological Cancer & Volume 27, Number 7, September 2017 Urinary Polyamines in Ovarian Cancer
* 2017 IGCS and ESGO 1361
Copyright © 2017 by IGCS and ESGO. Unauthorized reproduction of this article is prohibited.
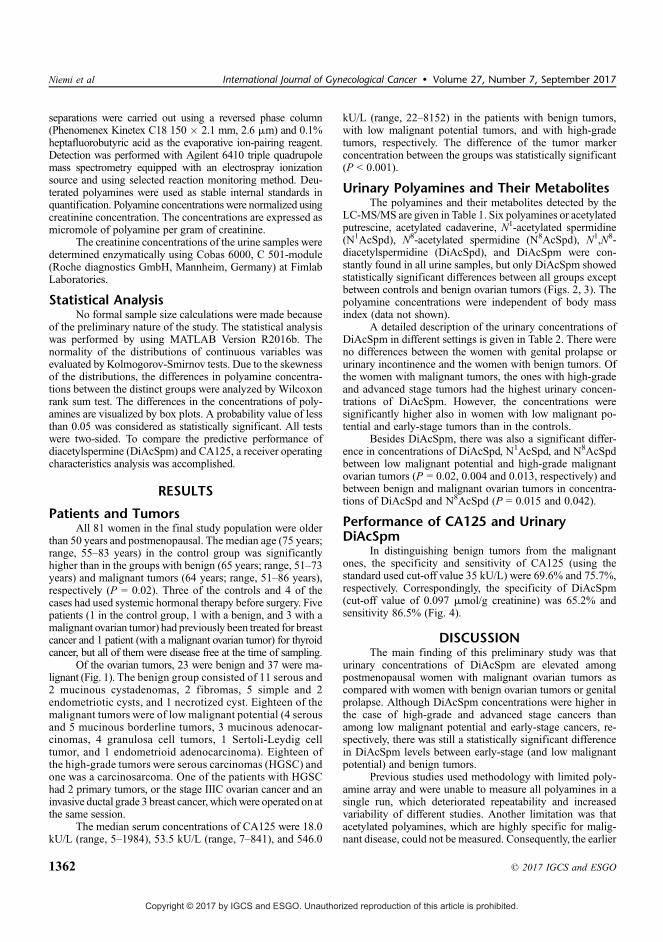
separations were carried out using a reversed phase column(Phenomenex Kinetex C18 150 � 2.1 mm, 2.6 Km) and 0.1%heptafluorobutyric acid as the evaporative ion-pairing reagent.Detection was performed with Agilent 6410 triple quadrupolemass spectrometry equipped with an electrospray ionizationsource and using selected reaction monitoring method. Deu-terated polyamines were used as stable internal standards inquantification. Polyamine concentrations were normalized usingcreatinine concentration. The concentrations are expressed asmicromole of polyamine per gram of creatinine.
The creatinine concentrations of the urine samples weredetermined enzymatically using Cobas 6000, C 501-module(Roche diagnostics GmbH, Mannheim, Germany) at FimlabLaboratories.
Statistical AnalysisNo formal sample size calculations were made because
of the preliminary nature of the study. The statistical analysiswas performed by using MATLAB Version R2016b. Thenormality of the distributions of continuous variables wasevaluated by Kolmogorov-Smirnov tests. Due to the skewnessof the distributions, the differences in polyamine concentra-tions between the distinct groups were analyzed by Wilcoxonrank sum test. The differences in the concentrations of poly-amines are visualized by box plots. A probability value of lessthan 0.05 was considered as statistically significant. All testswere two-sided. To compare the predictive performance ofdiacetylspermine (DiAcSpm) and CA125, a receiver operatingcharacteristics analysis was accomplished.
RESULTS
Patients and TumorsAll 81 women in the final study population were older
than 50 years and postmenopausal. The median age (75 years;range, 55Y83 years) in the control group was significantlyhigher than in the groups with benign (65 years; range, 51Y73years) and malignant tumors (64 years; range, 51Y86 years),respectively (P = 0.02). Three of the controls and 4 of thecases had used systemic hormonal therapy before surgery. Fivepatients (1 in the control group, 1 with a benign, and 3 with amalignant ovarian tumor) had previously been treated for breastcancer and 1 patient (with a malignant ovarian tumor) for thyroidcancer, but all of them were disease free at the time of sampling.
Of the ovarian tumors, 23 were benign and 37 were ma-lignant (Fig. 1). The benign group consisted of 11 serous and2 mucinous cystadenomas, 2 fibromas, 5 simple and 2endometriotic cysts, and 1 necrotized cyst. Eighteen of themalignant tumors were of low malignant potential (4 serousand 5 mucinous borderline tumors, 3 mucinous adenocar-cinomas, 4 granulosa cell tumors, 1 Sertoli-Leydig celltumor, and 1 endometrioid adenocarcinoma). Eighteen ofthe high-grade tumors were serous carcinomas (HGSC) andone was a carcinosarcoma. One of the patients with HGSChad 2 primary tumors, or the stage IIIC ovarian cancer and aninvasive ductal grade 3 breast cancer, whichwere operated on atthe same session.
The median serum concentrations of CA125 were 18.0kU/L (range, 5Y1984), 53.5 kU/L (range, 7Y841), and 546.0
kU/L (range, 22Y8152) in the patients with benign tumors,with low malignant potential tumors, and with high-gradetumors, respectively. The difference of the tumor markerconcentration between the groups was statistically significant(P G 0.001).
Urinary Polyamines and Their MetabolitesThe polyamines and their metabolites detected by the
LC-MS/MS are given in Table 1. Six polyamines or acetylatedputrescine, acetylated cadaverine, N1-acetylated spermidine(N1AcSpd), N8-acetylated spermidine (N8AcSpd), N1,N8-diacetylspermidine (DiAcSpd), and DiAcSpm were con-stantly found in all urine samples, but only DiAcSpm showedstatistically significant differences between all groups exceptbetween controls and benign ovarian tumors (Figs. 2, 3). Thepolyamine concentrations were independent of body massindex (data not shown).
A detailed description of the urinary concentrations ofDiAcSpm in different settings is given in Table 2. There wereno differences between the women with genital prolapse orurinary incontinence and the women with benign tumors. Ofthe women with malignant tumors, the ones with high-gradeand advanced stage tumors had the highest urinary concen-trations of DiAcSpm. However, the concentrations weresignificantly higher also in women with low malignant po-tential and early-stage tumors than in the controls.
Besides DiAcSpm, there was also a significant differ-ence in concentrations of DiAcSpd, N1AcSpd, and N8AcSpdbetween low malignant potential and high-grade malignantovarian tumors (P = 0.02, 0.004 and 0.013, respectively) andbetween benign and malignant ovarian tumors in concentra-tions of DiAcSpd and N8AcSpd (P = 0.015 and 0.042).
Performance of CA125 and UrinaryDiAcSpm
In distinguishing benign tumors from the malignantones, the specificity and sensitivity of CA125 (using thestandard used cut-off value 35 kU/L) were 69.6% and 75.7%,respectively. Correspondingly, the specificity of DiAcSpm(cut-off value of 0.097 Kmol/g creatinine) was 65.2% andsensitivity 86.5% (Fig. 4).
DISCUSSIONThe main finding of this preliminary study was that
urinary concentrations of DiAcSpm are elevated amongpostmenopausal women with malignant ovarian tumors ascompared with women with benign ovarian tumors or genitalprolapse. Although DiAcSpm concentrations were higher inthe case of high-grade and advanced stage cancers thanamong low malignant potential and early-stage cancers, re-spectively, there was still a statistically significant differencein DiAcSpm levels between early-stage (and low malignantpotential) and benign tumors.
Previous studies used methodology with limited poly-amine array and were unable to measure all polyamines in asingle run, which deteriorated repeatability and increasedvariability of different studies. Another limitation was thatacetylated polyamines, which are highly specific for malig-nant disease, could not be measured. Consequently, the earlier
Niemi et al International Journal of Gynecological Cancer & Volume 27, Number 7, September 2017
1362 * 2017 IGCS and ESGO
Copyright © 2017 by IGCS and ESGO. Unauthorized reproduction of this article is prohibited.
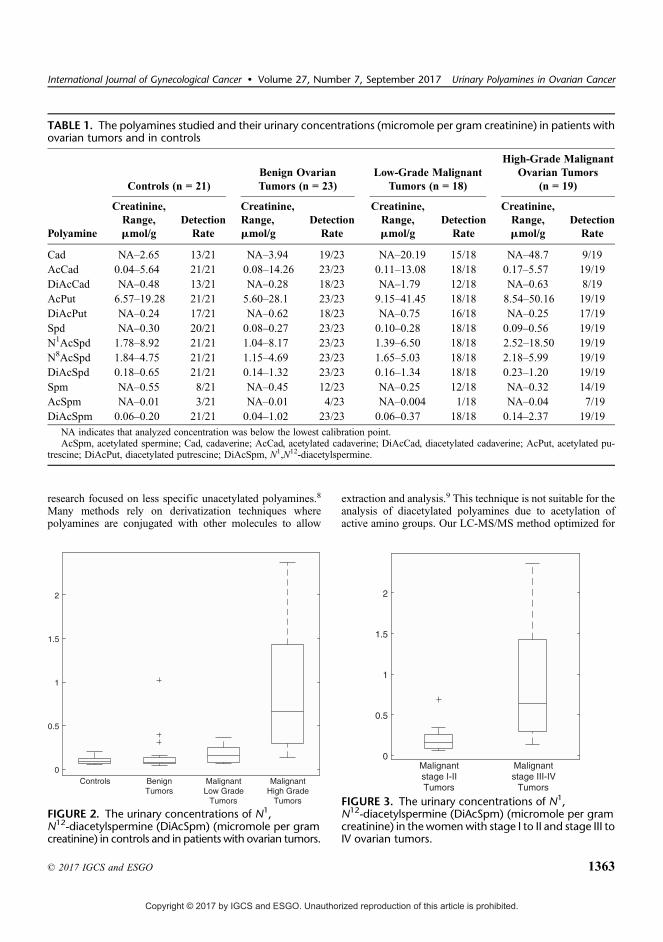
research focused on less specific unacetylated polyamines.8
Many methods rely on derivatization techniques wherepolyamines are conjugated with other molecules to allow
extraction and analysis.9 This technique is not suitable for theanalysis of diacetylated polyamines due to acetylation ofactive amino groups. Our LC-MS/MS method optimized for
TABLE 1. The polyamines studied and their urinary concentrations (micromole per gram creatinine) in patients withovarian tumors and in controls
Polyamine
Controls (n = 21)Benign OvarianTumors (n = 23)
Low-Grade MalignantTumors (n = 18)
High-Grade MalignantOvarian Tumors
(n = 19)
Creatinine,Range,Kmol/g
DetectionRate
Creatinine,Range,Kmol/g
DetectionRate
Creatinine,Range,Kmol/g
DetectionRate
Creatinine,Range,Kmol/g
DetectionRate
Cad NAY2.65 13/21 NAY3.94 19/23 NAY20.19 15/18 NAY48.7 9/19AcCad 0.04Y5.64 21/21 0.08Y14.26 23/23 0.11Y13.08 18/18 0.17Y5.57 19/19DiAcCad NAY0.48 13/21 NAY0.28 18/23 NAY1.79 12/18 NAY0.63 8/19AcPut 6.57Y19.28 21/21 5.60Y28.1 23/23 9.15Y41.45 18/18 8.54Y50.16 19/19DiAcPut NAY0.24 17/21 NAY0.62 18/23 NAY0.75 16/18 NAY0.25 17/19Spd NAY0.30 20/21 0.08Y0.27 23/23 0.10Y0.28 18/18 0.09Y0.56 19/19N1AcSpd 1.78Y8.92 21/21 1.04Y8.17 23/23 1.39Y6.50 18/18 2.52Y18.50 19/19N8AcSpd 1.84Y4.75 21/21 1.15Y4.69 23/23 1.65Y5.03 18/18 2.18Y5.99 19/19DiAcSpd 0.18Y0.65 21/21 0.14Y1.32 23/23 0.16Y1.34 18/18 0.23Y1.20 19/19Spm NAY0.55 8/21 NAY0.45 12/23 NAY0.25 12/18 NAY0.32 14/19AcSpm NAY0.01 3/21 NAY0.01 4/23 NAY0.004 1/18 NAY0.04 7/19DiAcSpm 0.06Y0.20 21/21 0.04Y1.02 23/23 0.06Y0.37 18/18 0.14Y2.37 19/19
NA indicates that analyzed concentration was below the lowest calibration point.AcSpm, acetylated spermine; Cad, cadaverine; AcCad, acetylated cadaverine; DiAcCad, diacetylated cadaverine; AcPut, acetylated pu-
trescine; DiAcPut, diacetylated putrescine; DiAcSpm, N1,N12-diacetylspermine.
FIGURE 2. The urinary concentrations of N1,N12-diacetylspermine (DiAcSpm) (micromole per gramcreatinine) in controls and in patients with ovarian tumors.
FIGURE 3. The urinary concentrations of N1,N12-diacetylspermine (DiAcSpm) (micromole per gramcreatinine) in the womenwith stage I to II and stage III toIV ovarian tumors.
International Journal of Gynecological Cancer & Volume 27, Number 7, September 2017 Urinary Polyamines in Ovarian Cancer
* 2017 IGCS and ESGO 1363
Copyright © 2017 by IGCS and ESGO. Unauthorized reproduction of this article is prohibited.

noninvasive and standardized single-run analysis of urine canbe used for simultaneous analysis of up to 14 polyamines infree, mono- and diacetylated forms in human urine,without anyderivatization.7 In the present study, however, 1,3-diaminopropaneand putrescine were not detectable. In addition, results con-cerning diacetylated cadaverine and diacetylated putrescineshould be interpreted with caution, because their analysis isonly semiquantitative.7
Although we are not aware of any subsequent studiessince the report by Suh et al,10 on the urinary polyamineprofile in ovarian cancer, our results are in accordance withprevious experience with other tumors. Patients with non-Hodgkin lymphoma or urogenital cancer (testicular, prostatic,renal, and bladder carcinoma) have been found to have elevatedurinary concentrations of DiAcSpm and those with urogenitalcancer also of DiAcSpd.6,11Y13 In breast cancer, even early-stage disease seems to be associated with elevated levels ofDiAcSpm in the urine.13 In colon cancer, urinary DiAcSpm
may be a better tumor marker than carcinoembryonic antigenor cancer antigen 19-9.13,14 Besides being predictivemarkers, there is a possibility that DiAcSpm and DiAcSpdcould be used also as prognostic markers, at least in testicularor prostatic cancer.11 Urinary DiAcSpm has been shown to beboth diagnostic and prognostic marker also for nonsmall celllung cancer.15,16
In the present study, the performance of CA125 used inthe preoperative diagnostic work-up of pelvic tumors waspoorer than in published large screening studies.1,17Y20 Thereason may be by chance only due to the rather limited samplesize, but the fact that a large portion of the malignant tumorswere of low malignant potential or borderline epithelial,granulosa, and Sertoli-Leydig cell tumorsmay have contributedto the less than optimal performance. In any case, urinaryDiAcSpm was a more sensitive marker of malignant ovariantumors than CA125 with a cut-off value 35 kU/L, while beingless specific.
FIGURE 4. Receiver operating characteristic curves for urinary N1,N12-diacetylspermine (DiAcSpm) and CA125 inbenign and malignant ovarian tumors with optimal (DiAcSpm 0.097 Kmol/g creatinine) and typically used(CA125 35 kU/L) thresholds.
TABLE 2. The urinary concentrations of N1,N12-diacetylspermine (DiAcSpm) (micromole per gram creatinine) inpatients with ovarian tumors and in controls and comparisons between the groups
N1,N12-diacetylspermine, Kmol/g creatinine
Mean (SD) Median Minimum Maximum Comparison P
Controls 0.10 (0.04) 0.09 0.06 0.20 Versus benign tumors NSBenign tumors 0.15 (0.21) 0.08 0.04 1.02All malignant tumors 0.54 (0.62) 0.26 0.06 2.37 Versus benign tumors
Versus controlsG0.001G0.001
Low malignant potentialtumors
0.17 (0.09) 0.16 0.06 0.37 Versus benign tumors 0.020
High-grade tumors 0.89 (0.72) 0.67 0.14 2.37 Versus low malignant potential tumors G0.001Stage IYII tumors 0.19 (0.15) 0.16 0.06 0.69 Versus benign tumors 0.017Stage IIIYIV tumors 0.87 (0.72) 0.64 0.14 2.37 Versus Stage IYII tumors G0.001
NS, not significant.
Niemi et al International Journal of Gynecological Cancer & Volume 27, Number 7, September 2017
1364 * 2017 IGCS and ESGO
Copyright © 2017 by IGCS and ESGO. Unauthorized reproduction of this article is prohibited.
Although the mechanism underlying elevated concen-trations of DiAcSpm in the urine of patients with cancer is notcompletely understood, an increased synthesis of polyaminesin proliferating cells, including malignant cells, is well doc-umented. It has been suggested that the increased secretion ofDiAcSpm may reflect a defense mechanism by the organismto lower intracellular polyamine concentrations by acetylatingand excreting polyamines and hence decreasing the growthrate of the tumor.8,13,21 It has also been purported that theproduction of DiAcSpm in tumorigenesis may be a result ofhost macrophage activation.22
The results of the present study are to be consideredas preliminary, to be confirmed in larger patient cohorts.Chronic inflammatory diseases may influence DiAcSpmconcentrations. However, in the study of pancreatico-biliarydiseases, the levels of DiAcSpm in urine were lower in be-nign inflammatory conditions than in cancers.23 Presence ofurinary tract infection may also have a confounding influenceon urinary polyamines, increasing especially the level ofputrescine.24 The impact of infection cannot totally be ruledout in the present study, because a routine urine sample fordiagnosing urinary infection was taken only from the patientsof the control group. Moreover, cadaverine in human urineis suggested to be derived from the gut microbial flora.24 Alimitation of the study is that there were no patients with abenign teratoma, because among benign tumors, teratomashave been associated with elevated levels of urinary poly-amines.5 On the other hand, teratomas are typically tumorsof adolescents and young adults and not of postmenopausalwomen, the risk population for ovarian cancer.
Ornithine decarboxylase is one of the key enzymes inpolyamine synthesis and is stimulated by estrogens in estrogen-responsive tissues.25 A previous study found that urinaryDiAcSpm values are higher in women than in men, whereaspostmenopausal women had lower concentrations than pre-menopausal ones.26 Accordingly, Byun et al27 showed thatpatients with premenopausal breast cancer had higher (free andmonoacetylated) polyamine levels in serum than postmeno-pausal ones, whose polyamine levels were similar to healthycontrols. In our study, allwomenwere postmenopausal, but 7 ofthem used hormone replacement therapy, creating a potentialbias. However, excluding these patients did not alter the results.The controlwomenwere older than the oneswith tumors,whichmay have had impact on the results. However, there was nosignificant difference between DiAcSpm levels of controlgroup and women with benign ovarian tumors. One patient inthe malignant tumor group had been treated for breast cancerfor 5 years, but she had no signs of recurrence. Another patienthad a grade 3 breast cancer concurrently with the stage IIICHGSC, whichmay have affected her DiAcSpm level. However,her urinary level of DiAcSpm was of similar magnitude as inthe patients with advanced high-grade tumors in general.
We used a morning urine sample in our study, which,however, may not have been necessary. According to a studyon healthy people, a spot urine sample at any time of the dayrepresents the true excretion rate of DiAcSpm after creatininenormalization.26 Although the LC-MS/MS method is veryaccurate, it is as such not suitable for routine clinical use, atleast not for time being.7 However, if only 1 (DiAcSpm) or a
few polyamines need to be analyzed, the analysis couldprobably be made faster and less expensive to perform. Alter-native methods to measure only urinary DiAcSpm in routineclinical practice include an enzyme-linked immunosorbentassay13,28 or a colloidal gold aggregation procedure.29
In conclusion, urinary levels of DiAcSpmwere elevatedin patients with malignant ovarian tumors, even in patientswith tumors of low malignant potential and early-stage tumors.These preliminary findings suggest that urinary DiAcSpmmayin the future become a useful diagnostic marker for malignantovarian tumors in the postmenopausal setting.
ACKNOWLEDGMENTThe authors thank Mrs Tuula Reponen for the technical
assistance.
REFERENCES1. Jacobs I, Oram D, Fairbanks J, et al. A risk of malignancy
index incorporating CA 125, ultrasound and menopausalstatus for the accurate preoperative diagnosis of ovarian cancer.Br J Obstet Gynaecol. 1990;97:922Y929.
2. Bast RC Jr. Status of tumor markers in ovarian cancer screening.J Clin Oncol. 2003;21:200sY205s.
3. Muskiet FA, Dorhout B, van den Berg GA, et al. Investigationof polyamine metabolism by high-performance liquidchromatographic and gas chromatographic profiling methods.J Chromatogr B Biomed Appl. 1995;667:189Y198.
4. Gerner EW, Meyskens FL Jr. Polyamines and cancer: oldmolecules, new understanding. Nat Rev Cancer.2004;4:781Y792.
5. Russell DH, Levy CC, Schimpff SC, et al. Urinarypolyamines in cancer patients. Cancer Res. 1971;31:1555Y1558.
6. van den Berg GA, Muskiet FA, Kingma AW, et al.Simultaneous gas-chromatographic determination of free andacetyl-conjugated polyamines in urine. Clin Chem.1986;32:1930Y1937.
7. Hakkinen MR, Roine A, Auriola S, et al. Analysis of free,mono- and diacetylated polyamines from human urine byLC-MS/MS. J Chromatogr B Analyt Technol Biomed Life Sci.2013;941:81Y89.
8. Kawakita M, Hiramatsu K. Diacetylated derivatives of spermineand spermidine as novel promising tumor markers. J Biochem.2006;139:315Y322.
9. Byun JA, Lee SH, Jung BH, et al. Analysis of polyamines ascarbamoyl derivatives in urine and serum by liquidchromatography-tandem mass spectrometry. BiomedChromatogr. 2008;22:73Y80.
10. Suh JW, Lee SH, Chung BC, et al. Urinary polyamine evaluationfor effective diagnosis of various cancers. J Chromatogr BBiomed Sci Appl. 1997;688:179Y186.
11. Hiramatsu K, Sugimoto M, Kamei S, et al. Diagnostic andprognostic usefulness of N1,N8-diacetylspermidine andN1,N12-diacetylspermine in urine as novel markers ofmalignancy. J Cancer Res Clin Oncol. 1997;123:539Y545.
12. Sugimoto M, Hiramatsu K, Kamei S, et al. Significanceof urinary N1,N8-diacetylspermidine and N1,N12-diacetylspermine as indicators of neoplastic diseases.J Cancer Res Clin Oncol. 1995;121:317Y319.
13. Hiramatsu K, Takahashi K, Yamaguchi T, et al. N(1),N(12)-Diacetylspermine as a sensitive and specific novel
International Journal of Gynecological Cancer & Volume 27, Number 7, September 2017 Urinary Polyamines in Ovarian Cancer
* 2017 IGCS and ESGO 1365
Copyright © 2017 by IGCS and ESGO. Unauthorized reproduction of this article is prohibited.
marker for early- and late-stage colorectal and breast cancers.Clin Cancer Res. 2005;11:2986Y2990.
14. Umemori Y, Ohe Y, Kuribayashi K, et al. Evaluating theutility of N1,N12-diacetylspermine and N1,N8-diacetylspermidine in urine as tumor markers for breast andcolorectal cancers. Clin Chim Acta. 2010;411:1894Y1899.
15. Takahashi Y, Sakaguchi K, Horio H, et al. Urinary N1,N12-diacetylspermine is a non-invasive marker for thediagnosis and prognosis of non-small-cell lung cancer. Br JCancer. 2015;113:1493Y1501.
16. Kato M, Onishi H, Matsumoto K, et al. Prognostic significanceof urine N1, N12-diacetylspermine in patients with non-smallcell lung cancer. Anticancer Res. 2014;34:3053Y3059.
17. Jacobs I, Bast RC Jr. The CA 125 tumour-associated antigen:a review of the literature. Hum Reprod. 1989;4:1Y12.
18. Patsner B, Mann WJ. The value of preoperative serum CA125 levels in patients with a pelvic mass. Am J Obstet Gynecol.1988;159:873Y876.
19. Einhorn N, Sjovall K, Knapp RC, et al. Prospective evaluationof serum CA 125 levels for early detection of ovarian cancer.Obstet Gynecol. 1992;80:14Y18.
20. Markowska J, Manys G, Kubaszewska M. Value of CA 125 as amarker of ovarian cancer. Eur J Gynaecol Oncol.1992;13:360Y365.
21. Park MH, Igarashi K. Polyamines and their metabolites asdiagnostic markers of human diseases. Biomol Ther (Seoul).2013;21:1Y9.
22. Hamaoki M, Nagata A. Host macrophages producediacetylspermine related with tumorigenesis. Cancer Lett.2006;243:128Y134.
23. Yamaguchi K, Nakamura M, Shirahane K, et al. Urinediacetylspermine as a novel tumour maker for pancreatobiliarycarcinomas. Dig Liver Dis. 2005;37:190Y194.
24. Satink HP, Hessels J, Kingma AW, et al. Microbial influenceson urinary polyamine excretion. Clin Chim Acta.1989;179:305Y314.
25. Russell DH, Taylor RL. Polyamine synthesis and accumulationin the castrated rat uterus after estradiol-17-beta stimulation.Endocrinology. 1971;88:1397Y1403.
26. Hiramatsu K, Sakaguchi K, Fujie N, et al. Excretion of N(1),N(12)-diacetylspermine in the urine of healthy individuals.Ann Clin Biochem. 2014;51:459Y467.
27. Byun JA, Choi MH, Moon MH, et al. Serum polyamines inpre- and post-operative patients with breast cancer correctedby menopausal status. Cancer Lett. 2009;273:300Y304.
28. Hiramatsu K, Miura H, Kamei S, et al. Development of asensitive and accurate enzyme-linked immunosorbent assay(ELISA) system that can replace HPLC analysis for thedetermination of N1,N12-diacetylspermine in human urine.J Biochem. 1998;124:231Y236.
29. Kawakita M, Hiramatsu K, Yanagiya M, et al. Determinationof N(1),N(1)(2)-diacetylspermine in urine: a novel tumormarker. Methods Mol Biol. 2011;720:367Y378.
Niemi et al International Journal of Gynecological Cancer & Volume 27, Number 7, September 2017
1366 * 2017 IGCS and ESGO
Copyright © 2017 by IGCS and ESGO. Unauthorized reproduction of this article is prohibited.

FAIMS analysis of urine gaseous headspace is capable of differentiatingovarian cancer
Riikka J. Niemi a,⁎, Antti N. Roine b, Emmi Eräviita b, Pekka S. Kumpulainen c,Johanna U. Mäenpää a,b, Niku Oksala b,d
a Department of Obstetrics and Gynecology, Tampere University Hospital, P.O. Box 2000, 33521 Tampere, Finlandb Faculty of Medicine and Life Sciences, University of Tampere, P.O. Box 100, 33014 Tampere, Finlandc Faculty of Biomedical Sciences and Engineering, Tampere University of Technology, P.O. Box 527, 33101 Tampere, Finlandd Department of Vascular Surgery, Tampere University Hospital, P.O. Box 2000, 33521 Tampere, Finland
H I G H L I G H T S
• Analysis of volatile organic compounds (VOCs) offers a new diagnostic method.• VOCs from urine can be analyzed by FAIMS (field asymmetric ion mobility spectrometry).• FAIMS distinguished urine from ovarian cancer patients compared to controls.• Patients with high vs. low grade ovarian cancer have also different VOC signatures.
a b s t r a c ta r t i c l e i n f o
Article history:Received 26 July 2018Received in revised form 15 September 2018Accepted 18 September 2018Available online 23 September 2018
Aim.We hypothesized that field asymmetric waveform ion mobility spectrometry (FAIMS) as a novel artifi-cial olfactory technology could differentiate urine of women with malignant ovarian tumors from controls andwomen with benign tumors, based on previous findings on the ability of canine olfactory system to “smell” can-cer.
Patients andmethods. Preoperative urine samples from 51womenwith ovarian tumors, both benign andma-lignant, and from 18 women with genital prolapse, as controls, were collected. The samples were analyzed byFAIMS device. Data analysis was processed by quadratic data analysis (QDA) and linear discriminant analysis(LDA), and cross-validated using 10-fold cross-validation.
Results. Thirty-threewomen hadmalignant ovarian tumors, ofwhich 18were high-grade cancers. FAIMS dis-tinguished controls from malignancies with the accuracy of 81.3% (sensitivity 91.2% and specificity 63.1%), andbenign tumors frommalignancies with the accuracy of 77.3% (sensitivity 91.5% and specificity 51.4%). Moreover,low grade tumors were also separated from high grade cancers and benign ovarian tumors with accuracies of88.7% (sensitivity 87.8% and specificity 89.6%) and 83.9% (sensitivity 73.1% and specificity 92.9%), respectively.
Conclusions. This proof of concept-study indicates that the FAIMS fromurinehas potential to discriminatema-lignant ovarian tumors from no tumor-bearing controls and benign tumors.
© 2018 Elsevier Inc. All rights reserved.
Keywords:FAIMSOvarian neoplasmOvarian cancerVOCOwlstone LonestarUrine
1. Introduction
Annually 22,000 new ovarian cancer (OC) cases are diagnosed in theUnited States, and the survival rates are poor due to the majority of OCsbeing detected at advanced stages [1]. While early diagnosis and ade-quate cytoreductive surgery improve prognosis, there is a need for bet-ter preoperative diagnostic methods for ovarian tumors.
Various ultrasound-basedmodels have been developed for preoper-ative evaluation of ovarianmasses. These include e.g. Risk ofMalignancyIndex (RMI) [2] and logistic regression analyses and ultrasound-basedrules from the International Ovarian Tumor Analysis (IOTA)-study. Al-though they have relatively high sensitivity and specificity, they arenon-applicable for about 20% of tumors [3].
Studies on urinary biomarkers for OC are relatively sparse. Urinaryprotein biomarkers, human epididymis protein 4 (HE4) andmesothelin,have shown to improve the early detection of serous OC compared toserum biomarkers [4]. Metabolite changes related to OC have been dis-covered as potential biomarkers [5,6], like N1,N12-diacetylspermine in
Gynecologic Oncology 151 (2018) 519–524
⁎ Corresponding author at: Tampere University Hospital, Department of Obstetrics andGynecology, P.O. Box 2000, FI-33521 Tampere, Finland.
E-mail address: [email protected] (R.J. Niemi).
https://doi.org/10.1016/j.ygyno.2018.09.0160090-8258/© 2018 Elsevier Inc. All rights reserved.
Contents lists available at ScienceDirect
Gynecologic Oncology
j ourna l homepage: www.e lsev ie r .com/ locate /ygyno
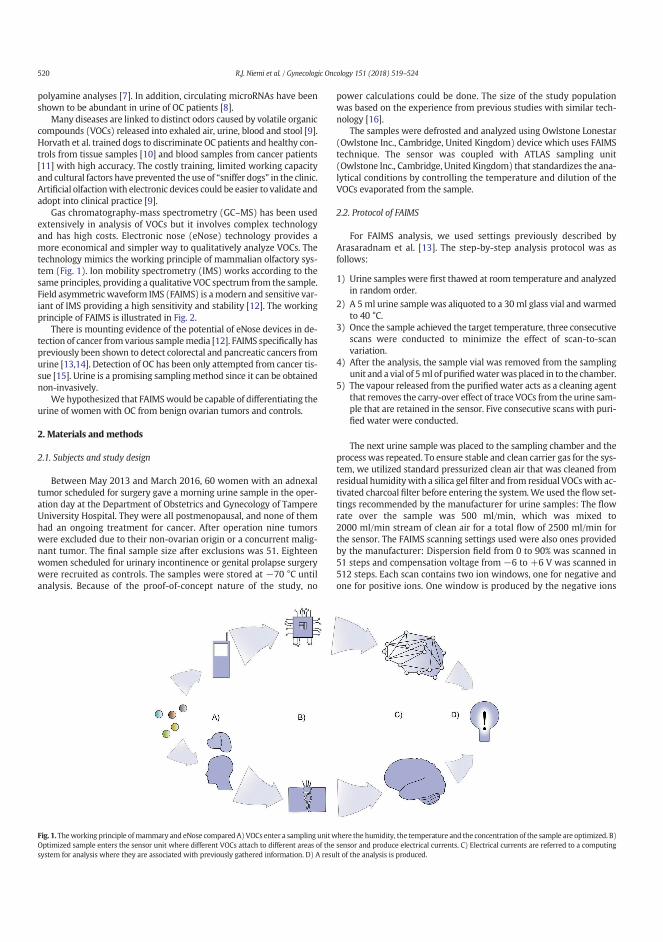
polyamine analyses [7]. In addition, circulating microRNAs have beenshown to be abundant in urine of OC patients [8].
Many diseases are linked to distinct odors caused by volatile organiccompounds (VOCs) released into exhaled air, urine, blood and stool [9].Horvath et al. trained dogs to discriminate OC patients and healthy con-trols from tissue samples [10] and blood samples from cancer patients[11] with high accuracy. The costly training, limited working capacityand cultural factors have prevented the use of “sniffer dogs” in the clinic.Artificial olfactionwith electronic devices could be easier to validate andadopt into clinical practice [9].
Gas chromatography-mass spectrometry (GC–MS) has been usedextensively in analysis of VOCs but it involves complex technologyand has high costs. Electronic nose (eNose) technology provides amore economical and simpler way to qualitatively analyze VOCs. Thetechnology mimics the working principle of mammalian olfactory sys-tem (Fig. 1). Ion mobility spectrometry (IMS) works according to thesame principles, providing a qualitative VOC spectrum from the sample.Field asymmetric waveform IMS (FAIMS) is amodern and sensitive var-iant of IMS providing a high sensitivity and stability [12]. The workingprinciple of FAIMS is illustrated in Fig. 2.
There is mounting evidence of the potential of eNose devices in de-tection of cancer from various samplemedia [12]. FAIMS specifically haspreviously been shown to detect colorectal and pancreatic cancers fromurine [13,14]. Detection of OC has been only attempted from cancer tis-sue [15]. Urine is a promising samplingmethod since it can be obtainednon-invasively.
We hypothesized that FAIMSwould be capable of differentiating theurine of women with OC from benign ovarian tumors and controls.
2. Materials and methods
2.1. Subjects and study design
Between May 2013 and March 2016, 60 women with an adnexaltumor scheduled for surgery gave a morning urine sample in the oper-ation day at the Department of Obstetrics and Gynecology of TampereUniversity Hospital. They were all postmenopausal, and none of themhad an ongoing treatment for cancer. After operation nine tumorswere excluded due to their non-ovarian origin or a concurrent malig-nant tumor. The final sample size after exclusions was 51. Eighteenwomen scheduled for urinary incontinence or genital prolapse surgerywere recruited as controls. The samples were stored at −70 °C untilanalysis. Because of the proof-of-concept nature of the study, no
power calculations could be done. The size of the study populationwas based on the experience from previous studies with similar tech-nology [16].
The samples were defrosted and analyzed using Owlstone Lonestar(Owlstone Inc., Cambridge, United Kingdom) device which uses FAIMStechnique. The sensor was coupled with ATLAS sampling unit(Owlstone Inc., Cambridge, United Kingdom) that standardizes the ana-lytical conditions by controlling the temperature and dilution of theVOCs evaporated from the sample.
2.2. Protocol of FAIMS
For FAIMS analysis, we used settings previously described byArasaradnam et al. [13]. The step-by-step analysis protocol was asfollows:
1) Urine samples were first thawed at room temperature and analyzedin random order.
2) A 5 ml urine sample was aliquoted to a 30 ml glass vial and warmedto 40 °C.
3) Once the sample achieved the target temperature, three consecutivescans were conducted to minimize the effect of scan-to-scanvariation.
4) After the analysis, the sample vial was removed from the samplingunit and a vial of 5ml of purifiedwaterwasplaced in to the chamber.
5) The vapour released from the purifiedwater acts as a cleaning agentthat removes the carry-over effect of trace VOCs from the urine sam-ple that are retained in the sensor. Five consecutive scans with puri-fied water were conducted.
The next urine sample was placed to the sampling chamber and theprocess was repeated. To ensure stable and clean carrier gas for the sys-tem, we utilized standard pressurized clean air that was cleaned fromresidual humidity with a silica gel filter and from residual VOCswith ac-tivated charcoal filter before entering the system.We used the flow set-tings recommended by the manufacturer for urine samples: The flowrate over the sample was 500 ml/min, which was mixed to2000 ml/min stream of clean air for a total flow of 2500 ml/min forthe sensor. The FAIMS scanning settings used were also ones providedby the manufacturer: Dispersion field from 0 to 90% was scanned in51 steps and compensation voltage from −6 to +6 V was scanned in512 steps. Each scan contains two ion windows, one for negative andone for positive ions. One window is produced by the negative ions
Fig. 1. Theworking principle ofmammary and eNose compared A) VOCs enter a sampling unitwhere the humidity, the temperature and the concentration of the sample are optimized. B)Optimized sample enters the sensor unit where different VOCs attach to different areas of the sensor and produce electrical currents. C) Electrical currents are referred to a computingsystem for analysis where they are associated with previously gathered information. D) A result of the analysis is produced.
520 R.J. Niemi et al. / Gynecologic Oncology 151 (2018) 519–524
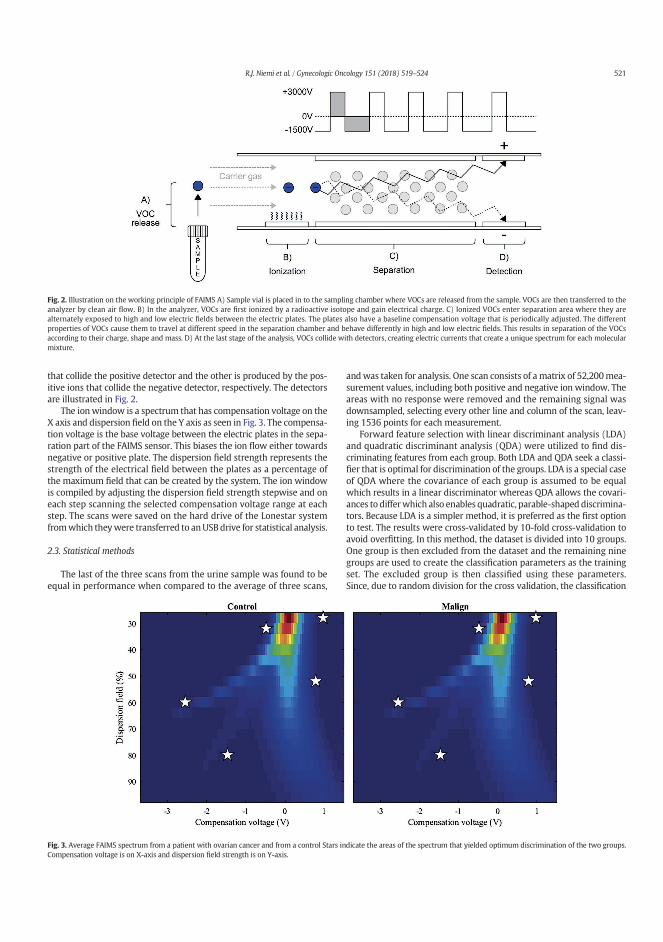
that collide the positive detector and the other is produced by the pos-itive ions that collide the negative detector, respectively. The detectorsare illustrated in Fig. 2.
The ionwindow is a spectrum that has compensation voltage on theX axis and dispersion field on the Y axis as seen in Fig. 3. The compensa-tion voltage is the base voltage between the electric plates in the sepa-ration part of the FAIMS sensor. This biases the ion flow either towardsnegative or positive plate. The dispersion field strength represents thestrength of the electrical field between the plates as a percentage ofthe maximum field that can be created by the system. The ion windowis compiled by adjusting the dispersion field strength stepwise and oneach step scanning the selected compensation voltage range at eachstep. The scans were saved on the hard drive of the Lonestar systemfromwhich theywere transferred to anUSBdrive for statistical analysis.
2.3. Statistical methods
The last of the three scans from the urine sample was found to beequal in performance when compared to the average of three scans,
andwas taken for analysis. One scan consists of a matrix of 52,200mea-surement values, including both positive and negative ion window. Theareas with no response were removed and the remaining signal wasdownsampled, selecting every other line and column of the scan, leav-ing 1536 points for each measurement.
Forward feature selection with linear discriminant analysis (LDA)and quadratic discriminant analysis (QDA) were utilized to find dis-criminating features from each group. Both LDA and QDA seek a classi-fier that is optimal for discrimination of the groups. LDA is a special caseof QDA where the covariance of each group is assumed to be equalwhich results in a linear discriminator whereas QDA allows the covari-ances to differwhich also enables quadratic, parable-shaped discrimina-tors. Because LDA is a simpler method, it is preferred as the first optionto test. The results were cross-validated by 10-fold cross-validation toavoid overfitting. In this method, the dataset is divided into 10 groups.One group is then excluded from the dataset and the remaining ninegroups are used to create the classification parameters as the trainingset. The excluded group is then classified using these parameters.Since, due to random division for the cross validation, the classification
Fig. 2. Illustration on the working principle of FAIMS A) Sample vial is placed in to the sampling chamber where VOCs are released from the sample. VOCs are then transferred to theanalyzer by clean air flow. B) In the analyzer, VOCs are first ionized by a radioactive isotope and gain electrical charge. C) Ionized VOCs enter separation area where they arealternately exposed to high and low electric fields between the electric plates. The plates also have a baseline compensation voltage that is periodically adjusted. The differentproperties of VOCs cause them to travel at different speed in the separation chamber and behave differently in high and low electric fields. This results in separation of the VOCsaccording to their charge, shape and mass. D) At the last stage of the analysis, VOCs collide with detectors, creating electric currents that create a unique spectrum for each molecularmixture.
Fig. 3. Average FAIMS spectrum from a patient with ovarian cancer and from a control Stars indicate the areas of the spectrum that yielded optimum discrimination of the two groups.Compensation voltage is on X-axis and dispersion field strength is on Y-axis.
521R.J. Niemi et al. / Gynecologic Oncology 151 (2018) 519–524

parameters change to a certain extend in every run, the process was re-peated 100 times to reduce the effect of variation and to calculate aver-ages and standard deviations for classification results. The analysis wasconducted with MATLAB R2017b (MathWorks Inc., Natick, MA, USA).
3. Results
Characteristics of the final study population are presented in Table 1.The averages and standard deviations of the 100 runs of QDA and LDAanalysis are given in Table 2. The performances of QDA and LDA seemto bemostly equal yet there is a notable difference in comparisons of be-nign tumors with low grade vs. high grade malignant tumors, respec-tively. The data produced by FAIMS is nonlinear by nature [17], and itis likely that nonlinear methods such as QDA yield better results inmost cases, especiallywhen the differences between groups are less dis-tinct. By QDA analysis, benign ovarian tumors were distinguished frommalignant tumorswith sensitivity and specificity of 91.5% and 51.4%, re-spectively. However, the specificity improved to 79.7% when they werecompared only to high-grade ovarian cancers. Even low grade ovarianmalignancies were discriminated from high grade ovarian cancerswith sensitivity of 87.8% and specificity of 89.6%, and from benign ovar-ian tumors with sensitivity of 73.1% and specificity of 92.9%,respectively.
Fig. 3 shows average FAIMS outputs from urine sample of a controland of a woman with ovarian cancer.
4. Discussion
This study provides preliminary evidence that FAIMS analysis ofVOCs can discriminate urine samples from OC patients, patients withnon-malignant tumors and healthy controls. High grade ovarian cancersseem to be separated from low grade ovarian cancers, benign ovariantumors and controls.
The study further demonstrates that OC is associated with distinctodor [18–20]. The fact that this phenomenon is apparent in urine sug-gests that a systemic process is involved. It is apparent that metastatic,systemic cancer may elicit profound changes in urine compositionthat may be an indication of decreasing renal function. However, inthe case of colorectal cancer, even early stage cancers could be detected[13]. There is in fact mounting body of evidence that cancer releasesVOCs to systemic circulation that consequently are released through al-veoli to breath and via glomerular filtration to urine [21]. This suggeststhat breath and urine can be considered alternative sampling methodsfor same VOCs. The feasibility of FAIMS/IMS has been demonstrated inboth sampling sources [13,22]. Reliable sampling from exhaled breathis challenging [23] and the performance of breath VOC analysis in OCseems to be inferior to our results obtained from urine [18,24]. Since
urine can be obtained non-invasively, we consider it as a more promis-ing sampling source for VOC analysis in OC.
VOCs in different sample mediums and cancers seem to have com-mon features, which are related to oxidation such as benzene deriva-tives [13,18,21]. The metabolic origin and function of most of theseVOCs are unclear. They can originate from endogenous and exogenoussources and may thus be a result also from environmental exposure in-stead of the cancer [21]. In this studywe achieved a good discriminationof high grade and low grade cancers. It has been suggested that KRASand TP3 mutations play a role as a watershed in development of highor low grade serous OC, i.e. type I and II OCs [25]. These singlemutationshave resulted in VOC changes in cellular model [26] that reflect thosefound in urine in other cancers [13]. We speculate that the VOC alter-ations concerning various mutations should be studied in future alsoin ovarian cancer.
This studymust be considered as preliminary, and the results shouldbe verified in larger patient cohorts with this repeatable method. How-ever, there is urgent need for early detection of especially aggressivetype II OCs, with an ultimate goal to improve the prognosis of this dev-astating disease [25]. An important topic in future FAIMS research is toexamine if cytoreductive surgery and immunosuppressive therapyhave influences on VOC emissions of urine samples. FAIMS technologyitself has advantages compared to GC–MS- and eNose implications;the technology by nature is sensitive to trace concentrations of mole-cules, is considerably more economical than MS-based methods, anddoes not suffer stability problems of other eNose technologies [27]. Incontrast to canine studies, FAIMS is standardized and repeatable,whereas it is almost impossible to replicate research settings of caninestudies because of variation in dogs.
Our study has also limitations. First, the present results cannot assuch be generalized to unselected populations, but rather should beconsidered valid in the setting of tertiary hospitals, as part of the diag-nostic work-up of adnexal tumors. Second, the number of analyzedurine samples was quite small. However, the proportions of three pa-tient groups (controls, benign and malignant tumors) were balanced.Third, the considerable number of lowmalignant potential and border-line ovarian tumors in our study certainly has an influence on our re-sults comparing benign and malignant ovarian tumors, and may havecontributed to the rather great deviation seen between comparisonsof benign tumors and all or low-grade malignant tumors. However,the comparisons between benign ovarian tumors or controls and highgrade ovarian tumors aremore accurate and specific. Fourth, the storagetime of our samples was several years, which may have reduced theVOC emissions and thus differences between groups, as has beenshown in a recent study examining the effect of storage on VOC profilesof urine [28]. In addition, the effects of the diet and possiblemedicationsmay have had influence on the concentration and composition of urinealthough the samples were collected in the morning after at least 4 h
Table 1Demographic data of study population.
Malignant tumors Benign tumors Controls
n 33 18 18Age (years)Median (range)
64(51–82)
64(51–73)
71(55–83)
Diagnosis (n) Low grade cancers (15)- mucinous adenocarcinoma Stage IA and IC (1 + 1)- endometrioid adenocarcinoma Stage IA (1)- mucinous borderline Stage IA (5)- serous borderline Stage IA (4)- Sertoli-Leydig cell tumor Stage IIIC (1)- Granulosa cell tumor Stage IA (2)
High grade cancers (18)- carcinosarcomaStage IIIC (1)- high grade serous adenocarcinoma
• Stage IC (1)• Stage IIC (1)• Stage III/IV (15)
Serous cystadenoma (9)Mucinous cystadenoma (1)Fibroma (2)Simple cyst (3)Endometriotic cyst (2)Necrotized cyst (1)
Genital prolapse or urinaryincontinence (18)
522 R.J. Niemi et al. / Gynecologic Oncology 151 (2018) 519–524

fasting. The fact that the highest discrimination rate was achieved forbenign tumors and controls suggests that there is a degree of bias be-tween patient groups. This may also result from the larger and moreheterogenous nature of cancer group.
5. Conclusion
According to our results,wepropose that theVOC signature of urine ofovarian cancer patients can be recognized by FAIMS and that it has poten-tial for being a non-invasive method in the detection of ovarian malig-nancy. Our novel study encourages us to examine further possibilities ofFAIMS for diagnostics and follow-up of gynecological malignancies.
Funding
The study was supported by the Finnish Cancer Foundation (J.M.Grant MS738), Competitive Research Funding of Tampere UniversityHospital (J.M. Grant 9U036, N.O. Grants 150618, 9S045, 9T044, 9V044,151B03 and 9U042), Tampere Tuberculosis Foundation (N.O. Grant)and Emil Aaltonen Foundation (N.O. Grant).
Role of the funding source
Researchers received funding for governmental bodies and non-profit organizations. These parties had no role in planning and execu-tion of the study or in the analysis and writing process of the article.
Conflict of interest statement
RJN, EE and JUM declare no conflicts of interest. NO, PSK and ANR are shareholders ofOlfactomics Ltd. which is about to commercialize proprietary technology for the detectionof diseases by ion mobility spectrometry.
Ethical conduct of research
All participants gave their informed consent to the study, and the in-vestigationwas approved by the Ethic committee of TampereUniversityHospital.
Acknowledgements
The authors thank medical student Elina Jokiniitty for technicalassistance.
References
[1] K.D. Miller, R.L. Siegel, C.C. Lin, A.B. Mariotto, J.L. Kramer, J.H. Rowland, et al., Cancertreatment and survivorship statistics, 2016, CA Cancer J. Clin. 66 (2016) 271–289.
[2] I. Jacobs, D. Oram, J. Fairbanks, J. Turner, C. Frost, J.G. Grudzinskas, A risk of malignancyindex incorporating CA 125, ultrasound andmenopausal status for the accurate preop-erative diagnosis of ovarian cancer, Br. J. Obstet. Gynaecol. 97 (1990) 922–929.
[3] J. Kaijser, Towards an evidence-based approach for diagnosis and management ofadnexal masses: findings of the international ovarian tumour analysis (IOTA) stud-ies, Facts Views Vis. Obgyn. 7 (2015) 42–59.
[4] I. Hellstrom, K.E. Hellstrom, fTwo novel biomarkers, mesothelin and HE4, for diag-nosis of ovarian carcinoma, Expert Opin. Med. Diagn. 5 (2011) 227–240.
[5] J.J. Sandow, A. Rainczuk, G. Infusini, M. Makanji, M. Bilandzic, A.L. Wilson, et al., Dis-covery and validation of novel protein biomarkers in ovarian cancer patient urine,Proteomics Clin. Appl. 12 (2018), e1700135. .
[6] O. Turkoglu, A. Zeb, S. Graham, T. Szyperski, J.B. Szender, K. Odunsi, et al., Metabolo-mics of biomarker discovery in ovarian cancer: a systematic review of the currentliterature, Metabolomics 12 (2016) 60.
[7] R.J. Niemi, A.N. Roine, M.R. Hakkinen, P.S. Kumpulainen, T.A. Keinanen, J.J.Vepsalainen, et al., Urinary polyamines as biomarkers for ovarian cancer, Int. J.Gynecol. Cancer 27 (2017) 1360–1366.
[8] V. Mandilaras, M. Vernon, M. Meryet-Figuière, K. Karakasis, B. Lambert, L. Poulain,et al., Updates and current challenges in microRNA research for personalized med-icine in ovarian cancer, Expert. Opin. Biol. Ther. 17 (2017) 927–943.
[9] G. Lippi, G. Cervellin, Canine olfactory detection of cancer versus laboratory testing:myth or opportunity? Clin. Chem. Lab. Med. 50 (2012) 435–439.
[10] G. Horvath, G.A. Jarverud, S. Jarverud, I. Horvath, Human ovarian carcinomas de-tected by specific odor, Integr. Cancer Ther. 7 (2008) 76–80.
[11] G. Horvath, H. Andersson, G. Paulsson, Characteristic odour in the blood revealsovarian carcinoma, BMC Cancer 10 (2010) 643.
[12] J.A. Covington,M.P. vander Schee, A.S. Edge, B. Boyle, R.S. Savage, R.P. Arasaradnam, Theapplication of FAIMS gas analysis in medical diagnostics, Analyst 140 (2015)6775–6781.
[13] R.P. Arasaradnam, M.J. McFarlane, C. Ryan-Fisher, E. Westenbrink, P. Hodges, M.G.Thomas, et al., Detection of colorectal cancer (CRC) by urinary volatile organic com-pound analysis, PLoS One 9 (2014), e108750. .
[14] R.P. Arasaradnam, A. Wicaksono, H. O'Brien, H.M. Kocher, J.A. Covington, T.Crnogorac-Jurcevic, Noninvasive diagnosis of pancreatic cancer through detec-tion of volatile organic compounds in urine, Gastroenterology 154 (2018)485–487.
[15] G. Horvath, J. Chilo, T. Lindblad, Different volatile signals emitted by human ovariancarcinoma and healthy tissue, Future Oncol. 6 (2010) 1043–1049.
[16] A. Roine, E. Veskimae, A. Tuokko, P. Kumpulainen, J. Koskimaki, T.A. Keinanen, et al.,Detection of prostate cancer by an electronic nose: a proof of principle study, J. Urol.192 (2014) 230–234.
[17] D. Guo, Y. Wang, L. Li, X.Wang, J. Luo, Precise determination of nonlinear function ofion mobility for explosives and drugs at high electric fields for microchip FAIMS, J.Mass Spectrom. 50 (2015) 198–205.
[18] H. Amal, D.Y. Shi, R. Ionescu, W. Zhang, Q.L. Hua, Y.Y. Pan, et al., Assessment of ovar-ian cancer conditions from exhaled breath, Int. J. Cancer 136 (2015) 614.
[19] G. Horvath, H. Andersson, S. Nemes, Cancer odor in the blood of ovarian cancer pa-tients: a retrospective study of detection by dogs during treatment, 3 and 6 monthsafterward, BMC Cancer 13 (2013) 396.
[20] G. Horvath, J. Chilo, T. Lindblad, Different volatile signals emitted by human ovariancarcinoma and healthy tissue, Future Oncol. 6 (2010) 1043–1049.
[21] H. Haick, Y.Y. Broza, P.Mochalski, V. Ruzsanyi, A. Amann, Assessment, origin, and im-plementation of breath volatile cancer markers, Chem. Soc. Rev. 43 (2014)1423–1449.
[22] M. Westhoff, P. Litterst, L. Freitag, W. Urfer, S. Bader, J.I. Baumbach, Ion mobil-ity spectrometry for the detection of volatile organic compounds in exhaledbreath of patients with lung cancer: results of a pilot study, Thorax 64(2009) 744–748.
[23] C. Lourenco, C. Turner, Breath analysis in disease diagnosis: methodological consid-erations and applications, Metabolites 4 (2014) 465–498.
Table 2Results of FAIMS signal data and QDA and LDA classification.
Classification pairs QDA LDA
Accuracy (%)(±2 Std)
Sensitivity (%)(±2 Std)
Specificity (%)(±2 Std)
Accuracy (%)(±2 Std)
Sensitivity (%)(±2 Std)
Specificity (%)(±2 Std)
Benign ovarian tumors vs. controls 91.9(±9.8)
93.4(±11.4)
90.4(±14.4)
86.1(±9.6)
86.0(±11.2)
86.1(±12.2)
Controls vs. malignant ovarian tumors 81.3(±8.2)
91.2(±7.2)
63.1(±16.0)
81.2(±5.8)
90.4(±5.2)
64.3(±12.8)
Controls vs. high grade ovarian cancers 81.9(±5.2)
89.1(±2.8)
74.6(±9.6)
82.1(±6.0)
88.7(±3.2)
75.6(±11.8)
Benign vs. malignant ovarian tumors 77.3(±13.8)
91.5(±6.4)
51.4(±32.0)
65.9(±13.8)
87.1(±9.0)
27.1(±38.6)
Benign ovarian tumors vs. low grade ovarian cancers 83.9(±23.4)
73.1(±41.4)
92.9(±11.4)
59.3(±7.0)
35.9(±14.0)
78.8(±5.8)
Benign ovarian tumors vs. high grade ovarian cancers 82.5(±10.0)
85.3(±15.0)
79.7(±12.0)
82.5(±9.6)
85.0(±15.0)
79.9(±11.2)
Low grade vs. high grade ovarian cancers 88.7(±11.2)
87.8(±12.8)
89.6(±16.6)
82.0(±10.8)
84.3(±16.0)
79.7(±13.4)
QDA, quadratic data analysis; LDA, linear data analysis.
523R.J. Niemi et al. / Gynecologic Oncology 151 (2018) 519–524

[24] N. Kahn, O. Lavie, M. Paz, Y. Segev, H. Haick, Dynamic nanoparticle-based flexiblesensors: diagnosis of ovarian carcinoma from exhaled breath, Nano Lett. 15(2015) 7023–7028.
[25] R.J. Kurman, I. Shih, The origin and pathogenesis of epithelial ovarian cancer: a pro-posed unifying theory, Am. J. Surg. Pathol. 34 (2010) 433–443.
[26] M.P. Davies, O. Barash, R. Jeries, N. Peled, M. Ilouze, R. Hyde, et al., Uniquevolatolomic signatures of TP53 and KRAS in lung cells, Br. J. Cancer 111 (2014)1213–1221.
[27] Z.Ma, G. Luo, K. Qin, N.Wang,W. Niu, Online sensor drift compensation for e-Nose sys-tems using domain adaptation and extreme learning machine, Sensors (Basel) 18(2018) 742.
[28] S. Esfahani, N.M. Sagar, I. Kyrou, E. Mozdiak, N. O'Connell, C. Nwokolo, et al., Varia-tion in gas and volatile compound emissions from human urine as it ages, measuredby an electronic nose, Biosensors (Basel) 6 (2016) 4.
524 R.J. Niemi et al. / Gynecologic Oncology 151 (2018) 519–524
Ovarian tumors of different histologic type and clinical stage induce similar changes 1
in lipid metabolism 2
Running title: Various ovarian tumors affect blood lipidome 3
4
Riikka J Niemi1,*, Elena I Braicu2,*, Hagen Kulbe2, Kaisa M Koistinen3, Jalid Sehouli2, 5
Ulla Puistola4, Johanna U Mäenpää1,5 and Mika Hilvo3,# 6
7
1Department of Obstetrics and Gynecology, Tampere University Hospital, Tampere, Finland; 8
2Charité – Universitätsmedizin Berlin, corporate member of Freie Universität Berlin Humboldt-9
Universität zu Berlin, and Berlin Institute of Health, Department of Gynecology, Berlin, Germany; 10
3Zora Biosciences Oy, Espoo, Finland; 4Department of Obstetrics and Gynecology, PEDEGO 11
Research Unit, Medical Research Center Oulu, University of Oulu and University Hospital of Oulu, 12
Oulu, Finland; 5Faculty of Medicine and Life Sciences, University of Tampere, Tampere, Finland 13
14
*These authors contributed equally to this work 15
16
#Corresponding author at: Zora Biosciences Oy, Biologinkuja 1, FI-02150 Espoo, Finland. 17
e-mail: [email protected], tel: +358-50-5347782 18
19
20
2
Abstract 21
22
Background: Previous results obtained from serum samples of late-stage, high-grade serous ovarian 23
carcinoma patients showed large alterations in lipid metabolism. To validate and extend the results, 24
we studied lipidomic changes in early-stage ovarian tumors. In addition to serous ovarian cancer, we 25
investigated whether these changes occur in mucinous and endometrioid histological subtypes as 26
well. 27
Methods: Altogether, 354 serum or plasma samples were collected from three centers, one from 28
Germany and two from Finland. We performed lipidomic analysis of samples from patients with 29
malignant (N=138) or borderline (N=25) ovarian tumors, and 191 controls with benign pathology. 30
These results were compared to previously published data. 31
Results: We found 39 lipids that showed consistent alteration both in early- and late-stage ovarian 32
cancer patients as well as in pre- and postmenopausal women. Most of these changes were already 33
significant at an early stage and progressed with increasing stage. Furthermore, 23 lipids showed 34
similar alterations in all investigated histological subtypes. 35
Conclusion: Changes in lipid metabolism due to ovarian cancer occur in early-stage disease but 36
intensify with increasing stage. These changes occur also in other histological subtypes besides high 37
grade serous carcinoma. Understanding lipid metabolism in ovarian cancer may lead to new 38
therapeutic and diagnostic alternatives. 39
40
Key words: ovarian cancer; lipid; lipidomic; diagnostic; early-stage; histology; biomarker 41
42
43
3
Background 44
Prognosis of ovarian cancer improves remarkably if the disease is diagnosed at an early-stage, as 45
early detection affords better opportunities for curative treatment. Current diagnostic methods 46
primarily include vaginal ultrasound combined with the blood test to measure cancer antigen 125 (CA 47
125) levels. These methods lack specificity and sensitivity, especially in non-advanced ovarian 48
cancer.1 Therefore, there is a demand for new detection methods and biomarkers for distinguishing 49
benign and borderline ovarian tumors, as well as early-stage and advanced ovarian cancer. 50
51
Malignant tumors, including ovarian cancer, adopt many metabolic abnormalities to meet the 52
increased energy demand associated with increased cellular proliferation and tumor growth.2 In 53
ovarian cancer, the metabolic alterations in tissues and body fluids have been investigated by 54
metabolic profiling to identify biomarkers for early detection and reliable prognosis.3-5 Recently, 55
using liquid chromatography-mass spectrometry (LC-MS), Gaul et al. found from serum 16 56
diagnostic metabolites, including many lipids and fatty acids, that distinguish early-stage ovarian 57
cancer samples from healthy control samples.6 In a lipidomic study, Buas et al. showed 34 58
significantly altered metabolites between serous ovarian carcinoma and benign serous ovarian tumor 59
patients, and the plasma levels of the lipids were reduced in patients with a malignant disease.7 60
Recently, our metabolomic analyses of tumor and blood samples from high-grade serous ovarian 61
carcinoma (HGSOC) patients showed elevated concentrations of hydroxybutyric acids, implicating 62
that these molecules could act as diagnostic and prognostic biomarkers.8 Subsequently, lipidomic 63
profiling of the same samples showed an overall reduction in the levels of most of the lipid species 64
but elevations in specific ceramide (Cer) and triacylglycerol (TAG) lipids in metastatic ovarian cancer 65
patients.9 66
67
4
Despite several studies showing lipidomic alterations in ovarian cancer, we are not aware of any 68
studies that confirm which lipid species are the most consistently altered. To this end, as well as to 69
validate our published lipidomic results and extend the analyses to low malignant potential 70
(borderline) ovarian tumors and early-stage ovarian cancers, we applied the same previously used 71
methodology9 to analyze blood samples from patients with early-stage ovarian cancers. These results 72
were subsequently compared to the results obtained from patients with benign gynecological disease. 73
Our further aim was to investigate whether the lipidomic alterations found in patients with HGSOC 74
can be applied to other histological subtypes, i.e., to mucinous and endometrioid ovarian carcinoma. 75
5
Materials and methods 76
Patients and samples 77
We performed lipidomic profiling on two study cohorts, one from Charitè (N=189) and another from 78
Finland (N=165, from Tampere (N=111) and Oulu (N=54) University Hospitals). In addition, we 79
used data from an independent, previously published study9, referred herein as the Charité discovery 80
(N=250). The Charité discovery study included 5 additional samples from patients with endometrioid 81
tumors that were excluded from the original publication.9 Clinical characteristics of these three study 82
cohorts are shown in Table 1. The samples from both Charité studies were serum samples, while the 83
Finnish samples were a mixture of serum and plasma, as shown in Table 1. All samples were 84
collected preoperatively. In total, in these three studies, 290 samples were collected from patients 85
with malignant ovarian tumors, 25 samples from subjects with borderline ovarian tumors, and 289 86
from women with benign gynecological tumors, endometriosis, infection, or other conditions. The 87
diagnosis of invasive and borderline ovarian tumors was based on the WHO Classification.10 The 88
gynae-pathologists at the respective hospitals (University Hospitals of Oulu and Tampere, Finland, 89
and Charité, Berlin, Germany) did the histological analyses, and immunohistochemistry was used 90
when needed. The Charité samples were collected at the Tumor Bank - Ovarian Cancer Network 91
(www.toc-network.de) at the Charitè Medical University (Berlin, Germany) between 07/2013 and 92
09/2016. The Finnish samples, from Tampere University Hospital and Oulu University Hospital, 93
were collected between 2/2011-11/2014 and between 01/2009-12/2015, respectively. 94
95
Lipidomic analysis of serum samples (LC-MS/MS) 96
The samples were randomized within each cohort before lipidomic analysis. The lipidomic analysis 97
has been previously described in detail.9 Briefly, lipidomic analyses were performed using two 98
platforms, a global screening method and a phosphosphingolipid platform. For the screening method, 99
10 µl of sample was needed for the extraction of the lipids using a modified Folch extraction.11 For 100
6
the phosphosphingolipid method, 25 µl of sample was needed for the extraction of lipids using protein 101
precipitation in methanol. 102
103
Lipidomic screening and phosphosphingolipid platforms were both analyzed on a hybrid triple 104
quadrupole/linear ion trap mass spectrometer (QTRAP 5500, AB Sciex, Concords, Canada) equipped 105
with ultra-high-performance liquid chromatography (UHPLC) (Nexera-X2, Shimadzu, Kyoto, 106
Japan). Chromatographic separation of the lipidomic screening platform was performed on an 107
Acquity BEH C18, 2.1 × 50 mm id. 1.7 µm column (Waters Corporation, Milford, MA, USA). 108
Chromatographic separation of the phosphosphingolipid platform was performed on an AQUASIL 109
C18, 2.1 × 50 mm, 5 µm (Thermo Fisher Scientific, Waltham, MA, USA) column set at 60 °C. For 110
the MS analysis, a targeted approach in the positive ion mode was used for both platforms. The data 111
were collected using a scheduled multiple reaction monitoring (sMRM™) algorithm for the 112
lipidomics screening platform12 and multiple reaction monitoring (MRM) for phosphosphingolipids. 113
The lipidomic data were processed using Analyst and MultiQuant 3.0 software (AB Sciex), and the 114
area or height ratios of the analyte and its corresponding IS peak were normalized with the IS amount 115
and the sample volume. The details of the chromatography and mass spectrometry conditions have 116
been previously described.9 117
118
The number of lipids and the mean coefficient of variation for each lipid class, determined from the 119
quality control samples (6 in each 96-well plate), are shown in Supplementary Table S1. The list of 120
all analyzed lipids has been published previously.9 121
122
Statistical analyses 123
Group comparisons (patients vs. controls) were performed by calculating the mean relative difference 124
between the groups, and the p-values were determined by parametric t-tests on log-transformed 125
concentrations. R version 3.4.2 was used for all statistical analyses. Tableau 10.1 was used for 126

7
heatmap visualizations. For diagnostic calculations, logistic regression models were developed using 127
all samples in the Charité cohort and tested in the Finnish cohort. The AUC values were determined 128
using the pROC package.13 The top models presented in the article were selected by calculating the 129
sum of the AUC values in both cohorts, and selecting the models with the highest values. 130
131
8
Results 132
Validation of altered lipidomic profile in ovarian cancer patients 133
To validate the lipidomic alterations detected in ovarian cancer patients, we determined which lipids 134
were similarly altered between the patients and the controls in the two study cohorts (Charité and 135
Finland), in addition to the previously published Charité discovery cohort (Table 1), provided that 136
the change between the patients and the controls was significant in at least two cohorts. The results 137
confirmed that ovarian cancer causes wide lipidomic changes as 155 lipids showed the same direction 138
of change in all cohorts, and most of these changes were also statistically significant in all three 139
independent cohorts (Supplementary Table S2). All further analyses were limited to these 155 140
lipids. 141
142
Lipidomic changes emerge in early-stage ovarian cancer patients 143
To identify which lipids have the best diagnostic potential, or those already altered in early-stage 144
(I/II) cancer, we selected lipids that showed consistent increase or decrease both in stage I/II vs. 145
controls and stage III/IV vs. controls, including all cohorts and histological subtypes. In addition, the 146
lipids had to be significantly altered at least in stage III/IV patients in the Charité and Finnish cohorts. 147
This approach resulted in 39 lipids which are shown in a heatmap in Figure 1. Samples from patients 148
with ovarian cancer revealed a consistent decrease in the concentration of most of the analyzed lipid 149
classes and included phospholipids (phosphatidylcholines (PCs), lysophosphatidylcholines (LPCs) 150
and phosphatidylinositols (PIs)), cholesteryl esters (CEs), glucosyl/galactosyl ceramides 151
(Glc/GalCers) and sphingomyelins (SMs). In turn, an increase was observed in many ceramides 152
(Cers) with certain fatty acyl (FA) side chain compositions. Cers with 18:0, 20:0 and 24:1 FAs were 153
increased, while 24:0 FA-containing Cers were decreased. The TAG lipid species also showed a 154
variable trend depending on the FA side chains; TAGs with shorter FA side chains were decreased, 155
whereas those with longer FA side chains were increased. In many lipid species, the alterations were 156

9
more significant in advanced stage (III/IV) patients but were already present in early-stage patients 157
(I/II) (Figure 1). The lipidomic changes were consistent in both pre- and postmenopausal patient 158
populations (Figure 1). 159
160
Tumors of various histological subtypes induce similar lipid changes 161
As the previous results were derived from HGSOC patients only9, we investigated whether some 162
changes in lipid species are also significant in patients with other histological subtypes (mucinous 163
and endometrioid). Thus, we selected lipids showing the same direction of alteration in all histological 164
subtypes of the Charité and Finnish cohorts. In addition, the selected lipids had to be significant in 165
either mucinous or endometrioid subtypes in either of the cohorts. Twenty-one of 23 lipids were 166
decreased in all histological subtypes (Figure 2), and only Cer(d18:1/18:0) and TAG(18:1/18:1/20:4) 167
were increased. The most significant alterations were observed in PCs and LPCs. All lipid changes 168
were significant in the serous subtype, which was expected based on the large number of cases in 169
both cohorts. Interestingly, CA 125 was not significantly altered in mucinous subtype samples, while 170
most lipid changes were significant in the Charité cohort despite a low number of mucinous cases 171
(N=6). For endometrioid histology, none of the lipids were significant in the Charité cohort (N=9), 172
whereas the Finnish cohort, with a slightly greater number of cases (N=14), showed significant 173
alterations. 174
175
Fewer lipid changes are seen in borderline tumors than in malignant tumors 176
We also analyzed whether the observed lipidome alterations are present in borderline ovarian tumors. 177
When only those lipids that were altered in the same direction in both cohorts and significant in at 178
least one of them were selected, there were only a few significant alterations (Figure 3). Thus, it 179
appears that borderline tumors do not cause as much of a change to the lipidome as malignant tumors. 180
181
10
Lipids improve the diagnostic value of CA125 for the detection of early-stage cancer 182
Finally, we investigated whether lipids can improve the diagnostic value of CA 125. As lipid ratios 183
have shown diagnostic value in other diseases14, we investigated combinations of all lipids and lipid 184
ratios together with CA125. The lipids used for this analysis are shown in Figure 1. For the ratio 185
calculations, the increased lipids in ovarian cancer patients and CA 125 were used as numerators, and 186
all other lipids were used as denominators. To find more robust biomarkers, those lipids and lipid 187
ratios were excluded that were significantly different (t-test p<0.05 and mean relative change > 10%) 188
between control samples of the Charité and Finland cohorts. The models were generated using all 189
subjects in the Charité cohort, and tested in the stage I/II and III/IV ovarian cancer patients separately, 190
in addition to the validation in the Finnish cohort. As an example, the models with the highest 191
improvement in both the Charité and Finnish cohorts are shown in Table 2. In the Charité cohort, CA 192
125 as a continuous variable instead of using the 35 U/mL cut-off improved the AUC values, and 193
further improvement was seen for the detection of early-stage cases with incorporation of lipids, but 194
not for late-stage cases where already CA 125 alone performed well. In the Finnish cohort, which had 195
a higher proportion of other than serous malignant tumors, the AUC values for CA 125 and also the 196
models with lipids were lower than in the Charité, but again the lipids improved the diagnostic value 197
of CA 125 for the detection of stage I/II cancers. 198
199
200

11
Discussion 201
The present global lipidomics study investigating early- and advanced-stage ovarian cancer of various 202
histological subtypes was performed to validate and extend our previous results on lipid changes in 203
HGSOC patients. Altered lipid metabolism seems to be linked to ovarian cancer, but specific findings 204
are still strikingly variable. Our data are in line with those earlier studies showing an overall decrease 205
in the serum/plasma concentration of lipid metabolites7 and glycerophospholipids15,16 in ovarian 206
cancer patients. The intensification of lipid changes in the advanced stage ovarian cancer patients 207
suggests that the tumors are exploiting circulating lipids and lipoproteins with proportion to their size. 208
The overall decrease of PCs may be associated with reduction of HDL cholesterol and ApoA1 in the 209
ovarian cancer patients17,18, as PCs are known to be abundant especially in the HDL particles.19 210
However, this phenomenon cannot be used to explain the increase of lipid species in ovarian cancer 211
patients. It has been suggested that changes in lipid metabolism during ovarian cancer pathogenesis 212
reflect higher levels of cell division20, enhanced fatty acid β-oxidation5, and increased cellular 213
proliferation or motility due to increased PI3-kinase activity21, yet there are likely to be additional 214
mechanisms explaining the alterations of specific lipids. 215
216
These results confirm our previous report describing an increase in the serum concentration of 217
Cer(d18:1/18:0), Cer(d18:0/18:0) and TAG(18:1/18:1/20:4) in ovarian cancer patients.9 Moreover, 218
the phenomenon is evident at the early stages of disease development, i.e. stage I/II, but was found 219
to become more pronounced with disease progression. In addition to HGSOC, Cer(d18:1/18:0) and 220
TAG(18:1/18:1/20:4) were also significantly increased in mucinous and endometrioid ovarian cancer 221
samples from the Finnish cohort. However, the number of mucinous and endometrioid carcinoma 222
samples was likely too low in the Charitè cohort to show any significant difference. Interestingly, 223
Cer(d18:1/18:0) and its precursor Cer(d18:0/18:0) have been associated with the development of 224
insulin resistance and type 2 diabetes.22-24 Taken together, these alterations to the lipid profile and 225

12
other metabolic changes, such as increase of ketone bodies8, suggest that the metabolic profile of 226
ovarian cancer patients resemble a diabetic phenotype. 227
228
Sphingolipids, especially Cers, have been linked to the development and progression of cancer25, but 229
results appear vary depending on the type of tumor.26 Cers are considered to have anti-cancer 230
properties, to act as second messengers for cell apoptosis25 and to modulate cell growth.27 Another 231
sphingolipid, sphingosine-1-phosphate (S1P), has opposing cellular effects to Cers.26 The role of 232
sphingolipid metabolism in ovarian cancer has been investigated in a recent study in which 74 women 233
with HGSOC were found to have significantly elevated plasma and tissue concentrations of C16-Cer, 234
C18:1-Cer and C18-Cer compared to those of healthy controls28, which is in line with our results. 235
The researchers speculated that the increased amounts of Cers would be associated with particularly 236
aggressive epithelial ovarian cancer cases and that the increased Cer concentrations would lead to 237
increased conversion to S1P, as they found an elevated S1P concentration in tumor tissue. However, 238
congruent with our data, elevation of S1P could not be observed in blood. 239
240
Buas et al. have shown reduction of all measured TAGs in the plasma of ovarian cancer patients.7 241
However, in a lipidomic analysis of low and highly aggressive ovarian cancer cell lines, TAGs 242
increased dramatically along aggressiveness of the cells and were assumed to be the largest source of 243
cellular energy.29 In a mouse model of HGSOC, compared to healthy mice, the serum levels of 244
LPE(16:0) and PIs were decreased, while TAG(55:7) was significantly increased at early-stage cancer 245
development.30 On the other hand, decreased levels of TAGs in epithelial ovarian cancer patients 246
have been shown to predict early recurrence of cancer.31 In our study, only the concentrations of 247
TAGs with longer fatty acid chains were increased or not altered, while those TAGs with short fatty 248
acid chains were decreased. Our former study proposed that this result could be explained by genetics 249
13
via low expression of the ABCD1 gene9 which is associated with transport of long-chain fatty acids 250
into the peroxisome for β-oxidation.32 251
252
Phospho- and sphingolipids are the most studied lipids in regard to the pathogenesis of ovarian 253
cancer.33 In 2004, it was shown that plasma levels of lysophospholipids varied between healthy 254
controls and ovarian cancer patients, as well as pre- and postoperatively.34 Moreover, in a pathway 255
analysis, glycerophospholipid (LPCs and PCs) metabolism was a main dysregulated pathway in the 256
pathogenesis of ovarian carcinoma.35 Alteration of LPC levels may be caused by the binding and 257
activation of specific cell surface G protein-coupled receptors (GPCRs), which can activate cell 258
growth and proliferation.36 Altered LPCs and lysophosphatidylethanolamines (LPEs) contribute to 259
genetic instability and cancer initiation via enhanced phospholipase A2 (PLA2) activity37 and 260
inflammation.3 Phospholipids are needed in cancer cells to generate the cellular membrane and 261
maintain membrane integrity.3 A large metabolic profiling study3 of 448 plasma samples from 262
epithelial ovarian cancer patients identified 53 specific metabolites that distinguished early- and late-263
stage ovarian cancer with an AUC of 0.88. These metabolites included LPCs and LPEs which were 264
elevated in localized ovarian cancer but reduced in metastasized ovarian cancer. A potential 265
explanation for the reduced levels of LPCs and LPEs in advanced cancer could be that rapidly 266
proliferating tumors consume more phospholipids in their attempt to maintain membrane integrity, 267
leading to an exhaustion of substrates.30 Also lysophosphatidic acid (LPA) has been purported to be 268
a possible biomarker because some studies have shown LPA to be elevated in plasma samples of 269
ovarian cancer patients.34,38, but we could not confirm this as we did not monitor LPAs in our 270
lipidomic method. 271
272
Borderline ovarian tumors have low malignant potential and elevated mitotic activity without stromal 273
invasion. They commonly occur in younger women compared to ovarian cancer patients and have 274
14
lower recurrence rates.39 Denkert et al. found significantly different metabolite levels (including 275
metabolites from glycerolipid metabolism and free fatty acids) in borderline ovarian tumor tissues 276
compared to invasive ovarian carcinomas using gas chromatography/time-of-flight mass 277
spectrometry.20 However, they had only nine borderline tumors in their study. Based on the present 278
study, lipid metabolism in borderline ovarian tumors differs from that in invasive cancers. The Charité 279
cohort had more borderline ovarian tumors (N=18) than the Finnish cohort. These samples were 280
mainly serous epithelial tumors. Significant differences were observed only for occasional 281
plasmalogens as compared to benign controls. 282
283
In the Charitè cohort, the results were evaluated by menopausal status. Greater alterations in Cer 284
d16:1, d18:0 and d18:1 were observed in postmenopausal women. However, in some PC lipids, 285
premenopausal changes were stronger. A serum lipidomics study of ovariectomized healthy rats 286
showed that Cers and phospholipids increased in response to estrogen deficiency while TAGs 287
decreased, which was contrary to earlier studies.40 Our study lacks data on possible hormone 288
replacement or hormone therapy in the Charitè premenopausal group. The samples from the Finnish 289
cohort were postmenopausal with no current hormone therapy. 290
291
Our study had some limitations. First, changes in lipoprotein levels can at least partly explain the 292
overall decrease of lipids among cancer patients, but unfortunately, we did not have lipoprotein levels 293
available from the patients. Neither did we have the information on BMI, which may also affect lipid 294
levels. Second, in the Finnish cohort, the sample sets contained both serum and plasma samples, 295
which may affect the lipid levels. However, it is worth noting that the lipid changes were consistent 296
with the two other data sets, and thus, it can be assumed that the difference does not significantly 297
affect the results. Moreover, the logistic regression models developed in the Charité cohort showed 298
high AUC values in the Finnish cohort, which also supports the validity of the results. Third, there 299

15
was an age imbalance in the cohorts, as the Charité cohort patients were older than the controls. 300
However, the results were consistent with the Finnish cohort, where the controls were older than the 301
patients. This finding and our previous age-adjusted lipidomic analyses9 suggest that age does not 302
explain the differences in lipid metabolism observed in ovarian cancer patients. Fourth, the blood 303
samples were not collected during a fasting condition, which may affect the results. However, it is 304
worth noting that there were no differences between groups and that it is expected that fasting samples 305
might have given a better separation between the ovarian cancer patients and the subjects with benign 306
disease. 307
308
We have shown that blood lipidomic changes occur in several patient cohorts and already at the early-309
stage ovarian cancer, but intensify with the progression of the disease. Many of the lipid changes are 310
similar in patients with serous, mucinous and endometrioid ovarian carcinoma, suggesting that 311
rewiring of lipid metabolism is an integral part of ovarian carcinogenesis. The results provide an 312
excellent basis for further development of diagnostics and the future investigations should also 313
explore the potential of exploiting the altered ovarian cancer lipid metabolism for therapeutic 314
purposes. 315
316
16
Additional information 317
Ethics approval and consent to participate 318
All patients gave their informed consent to the study, and the investigation was approved by the local 319
Ethical Committees of Charité, Oulu and Tampere University Hospitals. The study was performed in 320
accordance with the Declaration of Helsinki. 321
Availability of data and materials’ statement 322
The datasets generated during and/or analysed during the current study are available for non-323
commercial use from the corresponding author on reasonable request. 324
Conflict of interest 325
MH and KMK are employed by Zora Biosciences Oy, which holds patent disclosures for diagnostic 326
tests of ovarian cancer using small molecules, including lipids. JUM reports grants and personal fees 327
from Roche, AstraZeneca, Tesaro, SOBI and Clovis, outside the submitted work. RJN, EIB, HK, JS 328
and UP declare no conflicts of interest. 329
Funding 330
No external funding was used for conducting this study. 331
Authorship 332
JUM, EIB, UP, JS, RJN and HK conducted patient enrollment and clinical work. KMK performed 333
lipidomic mass spectrometry experiments, and MH statistical analyses. RJN, MH and JUM wrote the 334
manuscript. All authors have revised and approved the manuscript. 335
336
Supplementary information is available at the British Journal of Cancer`s website. 337
338
17
References 339
1. Gupta D, Lis CG. Role of CA125 in predicting ovarian cancer survival - a review of the 340
epidemiological literature. J Ovarian Res 2009; 2: 13. 341
2. Sciacovelli M, Gaude E, Hilvo M, Frezza C. The metabolic alterations of cancer cells. Methods 342
Enzymol 2014; 542: 1-23. 343
3. Ke C, Hou Y, Zhang H, Fan L, Ge T, Guo B, et al. Large-scale profiling of metabolic dysregulation 344
in ovarian cancer. Int J Cancer 2015; 136: 516-526. 345
4. Odunsi K, Wollman RM, Ambrosone CB, Hutson A, McCann SE, Tammela J, et al. Detection of 346
epithelial ovarian cancer using 1H-NMR-based metabonomics. Int J Cancer 2005; 113: 782-788. 347
5. Fong MY, McDunn J, Kakar SS. Identification of metabolites in the normal ovary and their 348
transformation in primary and metastatic ovarian cancer. PLoS One 2011; 6: e19963. 349
6. Gaul DA, Mezencev R, Long TQ, Jones CM, Benigno BB, Gray A, et al. Highly-accurate 350
metabolomic detection of early-stage ovarian cancer. Sci Rep 2015; 5: 16351. 351
7. Buas MF, Gu H, Djukovic D, Zhu J, Drescher CW, Urban N, et al. Identification of novel candidate 352
plasma metabolite biomarkers for distinguishing serous ovarian carcinoma and benign serous ovarian 353
tumors. Gynecol Oncol 2016; 140: 138-144. 354
8. Hilvo M, de Santiago I, Gopalacharyulu P, Schmitt WD, Budczies J, Kuhberg M, et al. 355
Accumulated Metabolites of Hydroxybutyric Acid Serve as Diagnostic and Prognostic Biomarkers 356
of Ovarian High-Grade Serous Carcinomas. Cancer Res 2016; 76: 796-804. 357
18
9. Braicu EI, Darb-Esfahani S, Schmitt WD, Koistinen KM, Heiskanen L, Poho P, et al. High-grade 358
ovarian serous carcinoma patients exhibit profound alterations in lipid metabolism. Oncotarget 2017; 359
8: 102912-102922. 360
10. Carcangiu ML, Kurman RJ, Carcangiu ML, Herrington CS. WHO Classification of Tumours of 361
Female Reproductive Organs. Lyon: International Agency for Research on Cancer (I A R C) (UN); 362
2014. 363
11. Folch J, Lees M, Sloane Stanley GH. A simple method for the isolation and purification of total 364
lipides from animal tissues. J Biol Chem 1957; 226: 497-509. 365
12. Weir JM, Wong G, Barlow CK, Greeve MA, Kowalczyk A, Almasy L, et al. Plasma lipid 366
profiling in a large population-based cohort. J Lipid Res 2013; 54: 2898-2908. 367
13. Robin X, Turck N, Hainard A, Tiberti N, Lisacek F, Sanchez JC, et al. pROC: an open-source 368
package for R and S+ to analyze and compare ROC curves. BMC Bioinformatics 2011; 12: 77. 369
14. Laaksonen R, Ekroos K, Sysi-Aho M, Hilvo M, Vihervaara T, Kauhanen D, et al. Plasma 370
ceramides predict cardiovascular death in patients with stable coronary artery disease and acute 371
coronary syndromes beyond LDL-cholesterol. Eur Heart J 2016; 37: 1967-1976. 372
15. Bachmayr-Heyda A, Aust S, Auer K, Meier SM, Schmetterer KG, Dekan S, et al. Integrative 373
Systemic and Local Metabolomics with Impact on Survival in High-Grade Serous Ovarian Cancer. 374
Clin Cancer Res 2017; 23: 2081-2092. 375
16. Zhang T, Wu X, Yin M, Fan L, Zhang H, Zhao F, et al. Discrimination between malignant and 376
benign ovarian tumors by plasma metabolomic profiling using ultra performance liquid 377
chromatography/mass spectrometry. Clin Chim Acta 2012; 413: 861-868. 378
19
17. Sun Y, Meng H, Jin Y, Shi X, Wu Y, Fan D, et al. Serum lipid profile in gynecologic tumors: a 379
retrospective clinical study of 1,550 patients. Eur J Gynaecol Oncol 2016; 37: 348-352. 380
18. Kozak KR, Su F, Whitelegge JP, Faull K, Reddy S, Farias-Eisner R. Characterization of serum 381
biomarkers for detection of early stage ovarian cancer. Proteomics 2005; 5: 4589-4596. 382
19. Hilvo M, Simolin H, Metso J, Ruuth M, Oorni K, Jauhiainen M, et al. PCSK9 inhibition alters 383
the lipidome of plasma and lipoprotein fractions. Atherosclerosis 2018; 269: 159-165. 384
20. Denkert C, Budczies J, Kind T, Weichert W, Tablack P, Sehouli J, et al. Mass spectrometry-based 385
metabolic profiling reveals different metabolite patterns in invasive ovarian carcinomas and ovarian 386
borderline tumors. Cancer Res 2006; 66: 10795-10804. 387
21. Shayesteh L, Lu Y, Kuo WL, Baldocchi R, Godfrey T, Collins C, et al. PIK3CA is implicated as 388
an oncogene in ovarian cancer. Nat Genet 1999; 21: 99-102. 389
22. Meikle PJ, Wong G, Barlow CK, Weir JM, Greeve MA, MacIntosh GL, et al. Plasma lipid 390
profiling shows similar associations with prediabetes and type 2 diabetes. PLoS One 2013; 8: e74341. 391
23. Wigger L, Cruciani-Guglielmacci C, Nicolas A, Denom J, Fernandez N, Fumeron F, et al. Plasma 392
Dihydroceramides Are Diabetes Susceptibility Biomarker Candidates in Mice and Humans. Cell Rep 393
2017; 18: 2269-2279. 394
24. Hilvo M, Salonurmi T, Havulinna AS, Kauhanen D, Pedersen ER, Tell GS, et al. Ceramide stearic 395
to palmitic acid ratio predicts incident diabetes. Diabetologia 2018; 61: 1424-1434. 396
25. Hajj C, Becker-Flegler KA, Haimovitz-Friedman A. Novel mechanisms of action of classical 397
chemotherapeutic agents on sphingolipid pathways. Biol Chem 2015; 396: 669-679. 398

20
26. Furuya H, Shimizu Y, Kawamori T. Sphingolipids in cancer. Cancer Metastasis Rev 2011; 30: 399
567-576. 400
27. Segui B, Andrieu-Abadie N, Jaffrezou JP, Benoist H, Levade T. Sphingolipids as modulators of 401
cancer cell death: potential therapeutic targets. Biochim Biophys Acta 2006; 1758: 2104-2120. 402
28. Knapp P, Bodnar L, Blachnio-Zabielska A, Swiderska M, Chabowski A. Plasma and ovarian 403
tissue sphingolipids profiling in patients with advanced ovarian cancer. Gynecol Oncol 2017; 147: 404
139-144. 405
29. Zhao Z, Cai Q, Xu Y. The Lipidomic Analyses in Low and Highly Aggressive Ovarian Cancer 406
Cell Lines. Lipids 2016; 51: 179-187. 407
30. Jones CM, Monge ME, Kim J, Matzuk MM, Fernandez FM. Metabolomic serum profiling detects 408
early-stage high-grade serous ovarian cancer in a mouse model. J Proteome Res 2015; 14: 917-927. 409
31. Li J, Xie H, Li A, Cheng J, Yang K, Wang J, et al. Distinct plasma lipids profiles of recurrent 410
ovarian cancer by liquid chromatography-mass spectrometry. Oncotarget 2017; 8: 46834-46845. 411
32. van Roermund CW, Visser WF, Ijlst L, Waterham HR, Wanders RJ. Differential substrate 412
specificities of human ABCD1 and ABCD2 in peroxisomal fatty acid beta-oxidation. Biochim 413
Biophys Acta 2011; 1811: 148-152. 414
33. Pyragius CE, Fuller M, Ricciardelli C, Oehler MK. Aberrant lipid metabolism: an emerging 415
diagnostic and therapeutic target in ovarian cancer. Int J Mol Sci 2013; 14: 7742-7756. 416
34. Sutphen R, Xu Y, Wilbanks GD, Fiorica J, Grendys EC,Jr, LaPolla JP, et al. Lysophospholipids 417
are potential biomarkers of ovarian cancer. Cancer Epidemiol Biomarkers Prev 2004; 13: 1185-1191. 418
21
35. Zhang Y, Liu Y, Li L, Wei J, Xiong S, Zhao Z. High resolution mass spectrometry coupled with 419
multivariate data analysis revealing plasma lipidomic alteration in ovarian cancer in Asian women. 420
Talanta 2016; 150: 88-96. 421
36. Murph M, Tanaka T, Pang J, Felix E, Liu S, Trost R, et al. Liquid chromatography mass 422
spectrometry for quantifying plasma lysophospholipids: potential biomarkers for cancer diagnosis. 423
Methods Enzymol 2007; 433: 1-25. 424
37. Li H, Zhao Z, Wei G, Yan L, Wang D, Zhang H, et al. Group VIA phospholipase A2 in both host 425
and tumor cells is involved in ovarian cancer development. FASEB J 2010; 24: 4103-4116. 426
38. Xu Y, Shen Z, Wiper DW, Wu M, Morton RE, Elson P, et al. Lysophosphatidic acid as a potential 427
biomarker for ovarian and other gynecologic cancers. JAMA 1998; 280: 719-723. 428
39. Trimble CL, Trimble EL. Management of epithelial ovarian tumors of low malignant potential. 429
Gynecol Oncol 1994; 55: 52. 430
40. Vinayavekhin N, Sueajai J, Chaihad N, Panrak R, Chokchaisiri R, Sangvanich P, et al. Serum 431
lipidomics analysis of ovariectomized rats under Curcuma comosa treatment. J Ethnopharmacol 432
2016; 192: 273-282. 433
434
435
436

22
Figure 1. Heatmap showing lipidomic changes in early- (I/II) and late-stage (III/IV) ovarian cancer 437
patients. In addition, the results are shown in pre- and postmenopausal patients of all stages. The 438
difference is calculated relative to controls. The color scale (from -70% to 100%) is adjusted 439
according to the lipids, in cancer patients CA 125 showed mean elevation higher than 100%. ***, 440
p<0.001; **, p<0.01; *, p<0.05. Charité study had 60 premenopausal controls and 17 cancer cases as 441
well as 48 postmenopausal controls and 42 cancer cases. 442
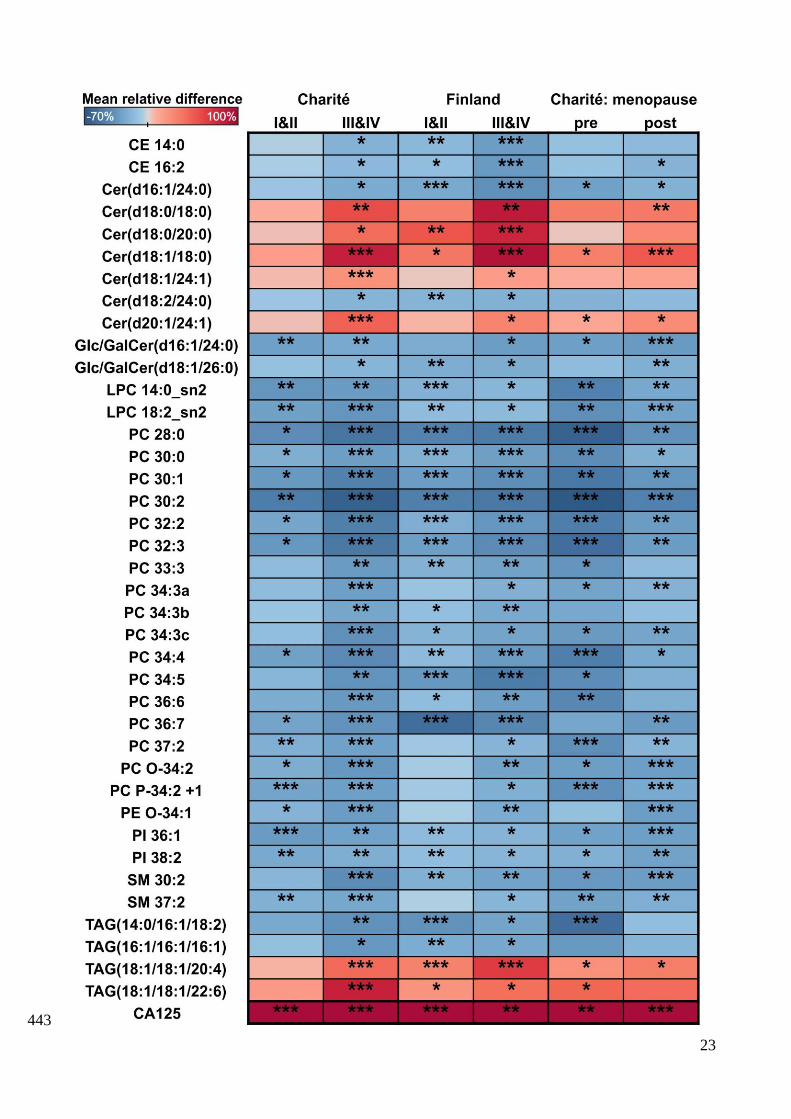
23
443
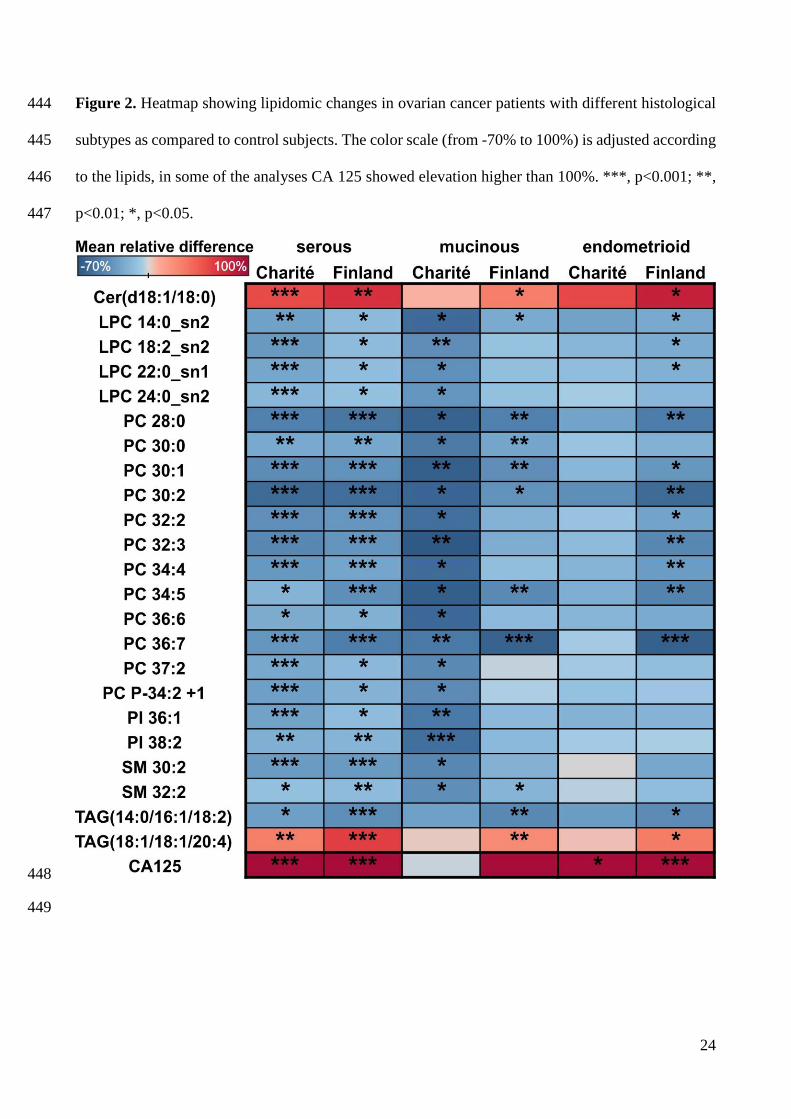
24
Figure 2. Heatmap showing lipidomic changes in ovarian cancer patients with different histological 444
subtypes as compared to control subjects. The color scale (from -70% to 100%) is adjusted according 445
to the lipids, in some of the analyses CA 125 showed elevation higher than 100%. ***, p<0.001; **, 446
p<0.01; *, p<0.05. 447
448
449

25
Figure 3. Heatmap showing lipidomic changes in patients with borderline tumors as compared to 450
control subjects. The color scale is adjusted according to the lipids (from -70% to 100%), CA 125 451
showed elevation higher than 100% in the Charité cohort. ***, p<0.001; **, p<0.01; *, p<0.05. 452
453
454
455
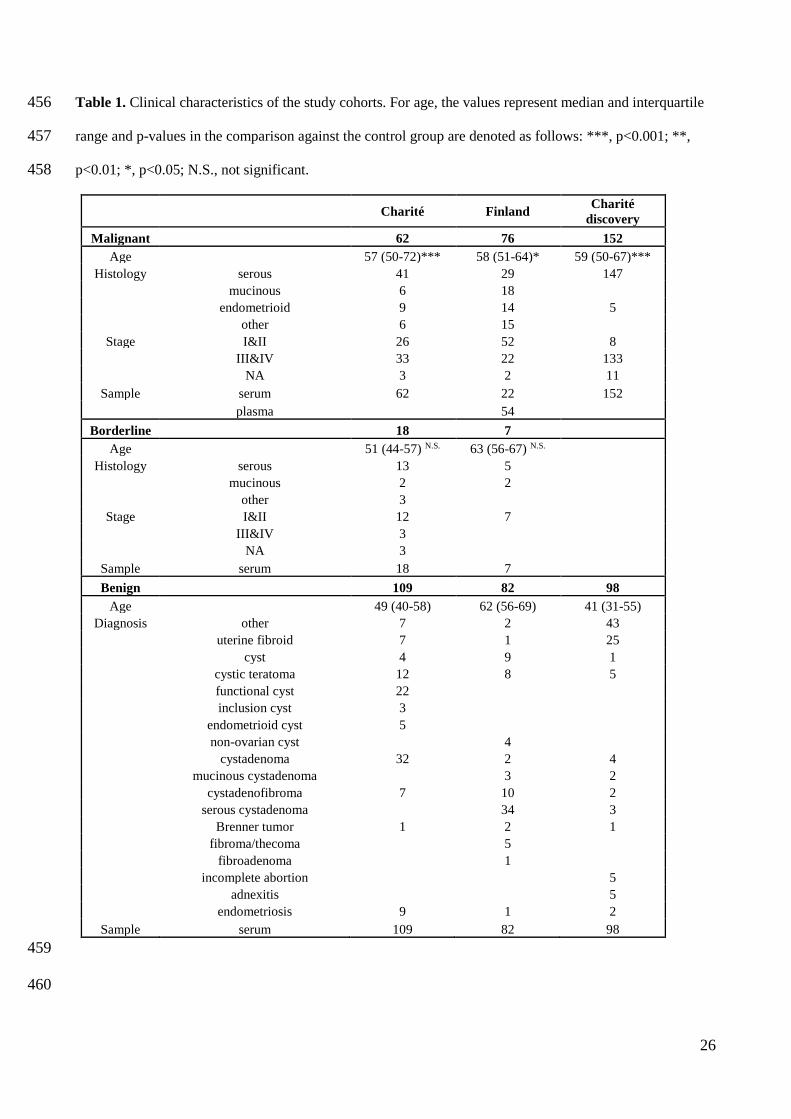
26
Table 1. Clinical characteristics of the study cohorts. For age, the values represent median and interquartile 456
range and p-values in the comparison against the control group are denoted as follows: ***, p<0.001; **, 457
p<0.01; *, p<0.05; N.S., not significant. 458
Charité Finland Charité
discovery
Malignant 62 76 152
Age 57 (50-72)*** 58 (51-64)* 59 (50-67)***
Histology serous 41 29 147
mucinous 6 18
endometrioid 9 14 5
other 6 15
Stage I&II 26 52 8
III&IV 33 22 133
NA 3 2 11
Sample serum 62 22 152
plasma 54
Borderline 18 7
Age 51 (44-57) N.S. 63 (56-67) N.S.
Histology serous 13 5
mucinous 2 2
other 3
Stage I&II 12 7
III&IV 3
NA 3
Sample serum 18 7
Benign 109 82 98
Age 49 (40-58) 62 (56-69) 41 (31-55)
Diagnosis other 7 2 43
uterine fibroid 7 1 25
cyst 4 9 1
cystic teratoma 12 8 5
functional cyst 22
inclusion cyst 3
endometrioid cyst 5
non-ovarian cyst 4
cystadenoma 32 2 4
mucinous cystadenoma 3 2
cystadenofibroma 7 10 2
serous cystadenoma 34 3
Brenner tumor 1 2 1
fibroma/thecoma 5
fibroadenoma 1
incomplete abortion 5
adnexitis 5
endometriosis 9 1 2
Sample serum 109 82 98
459
460
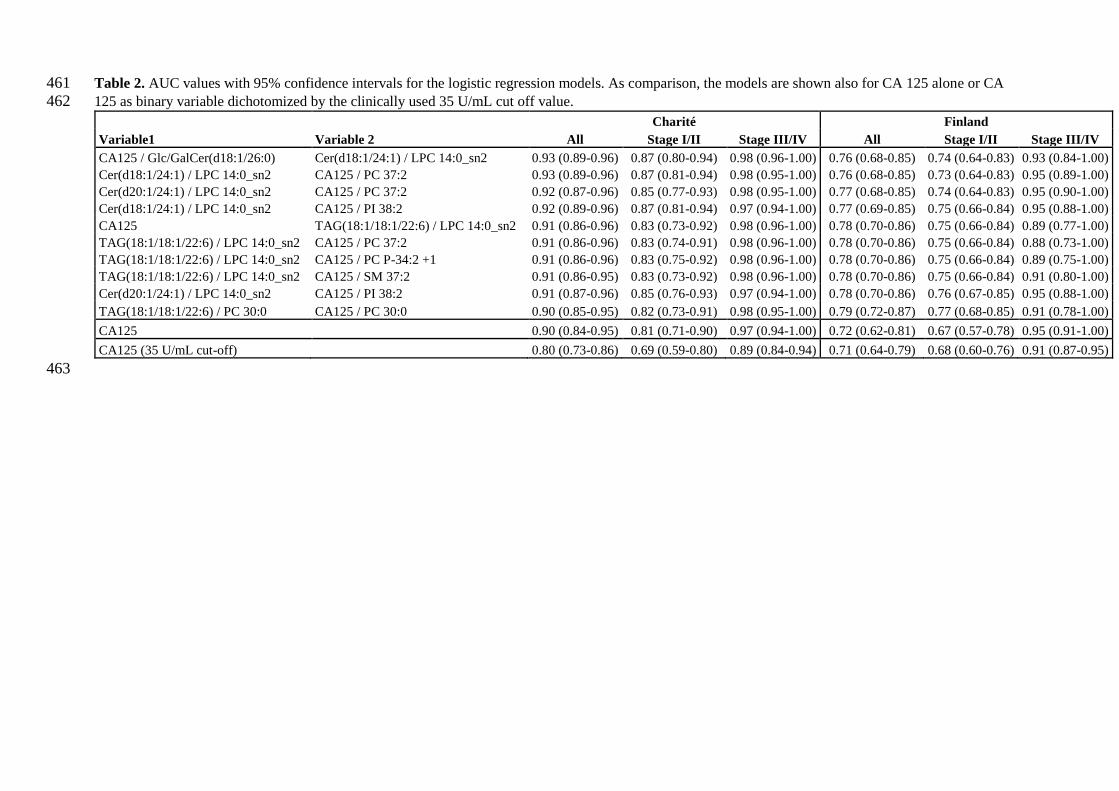
Table 2. AUC values with 95% confidence intervals for the logistic regression models. As comparison, the models are shown also for CA 125 alone or CA 461
125 as binary variable dichotomized by the clinically used 35 U/mL cut off value. 462
Charité Finland
Variable1 Variable 2 All Stage I/II Stage III/IV All Stage I/II Stage III/IV
CA125 / Glc/GalCer(d18:1/26:0) Cer(d18:1/24:1) / LPC 14:0_sn2 0.93 (0.89-0.96) 0.87 (0.80-0.94) 0.98 (0.96-1.00) 0.76 (0.68-0.85) 0.74 (0.64-0.83) 0.93 (0.84-1.00)
Cer(d18:1/24:1) / LPC 14:0_sn2 CA125 / PC 37:2 0.93 (0.89-0.96) 0.87 (0.81-0.94) 0.98 (0.95-1.00) 0.76 (0.68-0.85) 0.73 (0.64-0.83) 0.95 (0.89-1.00)
Cer(d20:1/24:1) / LPC 14:0_sn2 CA125 / PC 37:2 0.92 (0.87-0.96) 0.85 (0.77-0.93) 0.98 (0.95-1.00) 0.77 (0.68-0.85) 0.74 (0.64-0.83) 0.95 (0.90-1.00)
Cer(d18:1/24:1) / LPC 14:0_sn2 CA125 / PI 38:2 0.92 (0.89-0.96) 0.87 (0.81-0.94) 0.97 (0.94-1.00) 0.77 (0.69-0.85) 0.75 (0.66-0.84) 0.95 (0.88-1.00)
CA125 TAG(18:1/18:1/22:6) / LPC 14:0_sn2 0.91 (0.86-0.96) 0.83 (0.73-0.92) 0.98 (0.96-1.00) 0.78 (0.70-0.86) 0.75 (0.66-0.84) 0.89 (0.77-1.00)
TAG(18:1/18:1/22:6) / LPC 14:0_sn2 CA125 / PC 37:2 0.91 (0.86-0.96) 0.83 (0.74-0.91) 0.98 (0.96-1.00) 0.78 (0.70-0.86) 0.75 (0.66-0.84) 0.88 (0.73-1.00)
TAG(18:1/18:1/22:6) / LPC 14:0_sn2 CA125 / PC P-34:2 +1 0.91 (0.86-0.96) 0.83 (0.75-0.92) 0.98 (0.96-1.00) 0.78 (0.70-0.86) 0.75 (0.66-0.84) 0.89 (0.75-1.00)
TAG(18:1/18:1/22:6) / LPC 14:0_sn2 CA125 / SM 37:2 0.91 (0.86-0.95) 0.83 (0.73-0.92) 0.98 (0.96-1.00) 0.78 (0.70-0.86) 0.75 (0.66-0.84) 0.91 (0.80-1.00)
Cer(d20:1/24:1) / LPC 14:0_sn2 CA125 / PI 38:2 0.91 (0.87-0.96) 0.85 (0.76-0.93) 0.97 (0.94-1.00) 0.78 (0.70-0.86) 0.76 (0.67-0.85) 0.95 (0.88-1.00)
TAG(18:1/18:1/22:6) / PC 30:0 CA125 / PC 30:0 0.90 (0.85-0.95) 0.82 (0.73-0.91) 0.98 (0.95-1.00) 0.79 (0.72-0.87) 0.77 (0.68-0.85) 0.91 (0.78-1.00)
CA125 0.90 (0.84-0.95) 0.81 (0.71-0.90) 0.97 (0.94-1.00) 0.72 (0.62-0.81) 0.67 (0.57-0.78) 0.95 (0.91-1.00)
CA125 (35 U/mL cut-off) 0.80 (0.73-0.86) 0.69 (0.59-0.80) 0.89 (0.84-0.94) 0.71 (0.64-0.79) 0.68 (0.60-0.76) 0.91 (0.87-0.95)
463
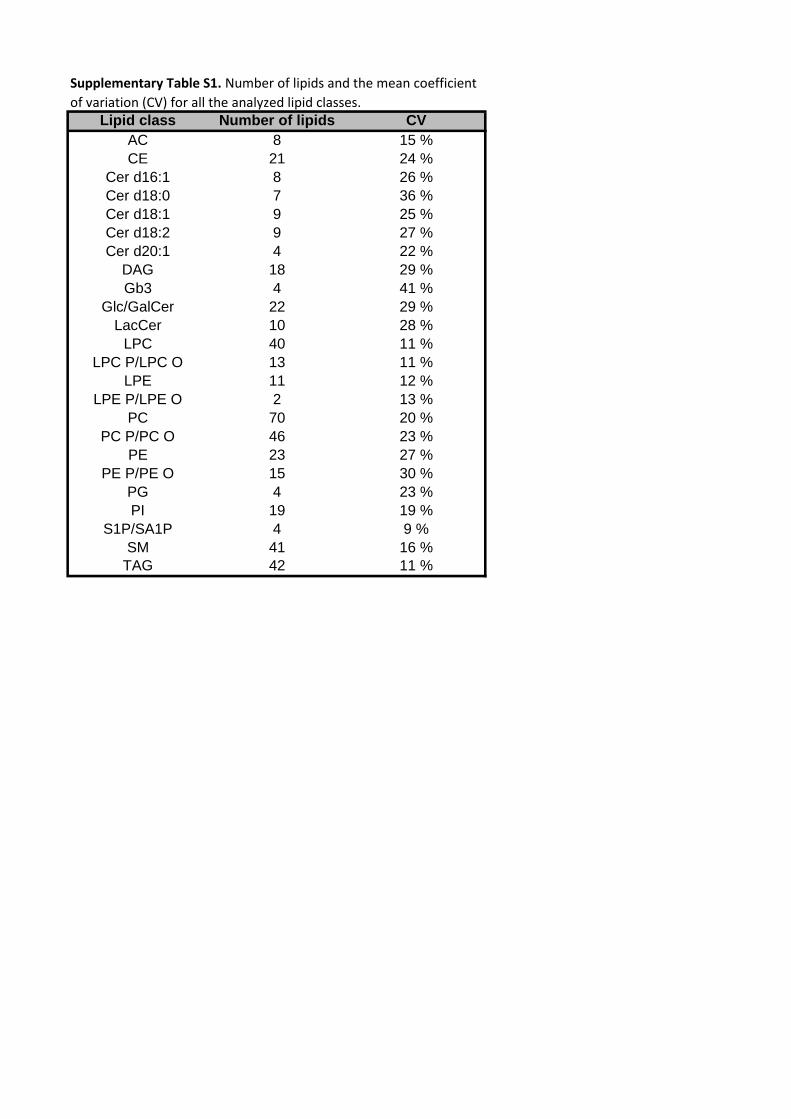
Lipid class Number of lipids CV
AC 8 15 %
CE 21 24 %
Cer d16:1 8 26 %
Cer d18:0 7 36 %
Cer d18:1 9 25 %
Cer d18:2 9 27 %
Cer d20:1 4 22 %
DAG 18 29 %
Gb3 4 41 %
Glc/GalCer 22 29 %
LacCer 10 28 %
LPC 40 11 %
LPC P/LPC O 13 11 %
LPE 11 12 %
LPE P/LPE O 2 13 %
PC 70 20 %
PC P/PC O 46 23 %
PE 23 27 %
PE P/PE O 15 30 %
PG 4 23 %
PI 19 19 %
S1P/SA1P 4 9 %
SM 41 16 %
TAG 42 11 %
Supplementary Table S1. Number of lipids and the mean coefficient
of variation (CV) for all the analyzed lipid classes.

Supplementary Table S2. Lipids that showed consistent alteration in all three and were significant in at least two study cohorts.
Lipid class Lipid name Change (%) p-value Change (%) p-value Change (%) p-value
CE 14:0 -10,5 0,113 -22,3 1,2E-05 -22,3 4,1E-06
CE 14:1 -13,0 0,247 -28,2 1,5E-04 -22,0 4,7E-05
CE 16:2 -11,8 0,060 -20,7 3,3E-04 -21,1 2,0E-07
CE 18:0 -9,8 0,113 -10,8 0,020 -26,7 4,9E-10
CE 18:2 -9,9 0,028 -2,1 0,568 -21,9 7,2E-10
Cer(d16:1/23:0) -7,0 0,300 -28,5 2,6E-06 -24,9 5,7E-04
Cer(d16:1/24:0) -17,7 0,027 -30,2 6,0E-07 -29,3 6,1E-08
Cer(d16:1/26:0) -15,7 0,055 -18,7 0,003 -17,1 0,004
Cer(d18:0/18:0) 36,1 0,001 45,0 0,044 49,7 5,7E-05
Cer(d18:0/20:0) 28,2 0,023 58,2 4,1E-04 22,0 0,018
Cer(d18:0/23:0) -8,8 0,158 -20,4 0,001 -17,4 0,004
Cer(d18:1/18:0) 56,2 2,9E-06 52,5 1,9E-04 71,4 7,2E-12
Cer(d18:1/20:0) 15,9 0,027 24,4 0,027 39,7 9,9E-08
Cer(d18:1/24:0) -4,4 0,570 -13,6 0,002 -11,9 0,009
Cer(d18:1/24:1) 18,8 0,003 6,9 0,477 30,5 1,1E-06
Cer(d18:2/18:0) 28,0 0,005 20,7 0,063 26,2 5,2E-04
Cer(d18:2/23:0) -10,9 0,190 -17,9 7,8E-04 -18,5 5,6E-04
Cer(d18:2/24:0) -13,4 0,105 -20,8 9,9E-05 -22,4 1,1E-05
Cer(d18:2/26:0) -10,7 0,298 -9,8 0,037 -14,2 0,040
Cer d20:1 Cer(d20:1/24:1) 29,1 6,8E-04 13,5 0,126 43,9 2,1E-07
DAG DAG(14:0/18:1) -24,0 0,203 -23,5 9,6E-04 -39,1 6,9E-04
Gb3 Gb3(d18:1/24:0) -16,8 0,011 -7,7 0,788 -23,1 8,6E-05
Glc/GalCer(d16:1/20:0) -21,6 0,011 -25,1 0,001 -16,8 9,7E-04
Glc/GalCer(d16:1/22:0) -19,0 0,015 -29,5 4,2E-05 -23,4 1,5E-05
Glc/GalCer(d16:1/23:0) -22,8 0,003 -22,5 0,008 -19,3 3,8E-04
Glc/GalCer(d16:1/24:0) -26,9 4,5E-04 -25,8 0,013 -23,1 5,0E-06
Glc/GalCer(d18:1/20:0) -15,4 0,019 -6,7 0,845 -19,7 9,2E-05
Glc/GalCer(d18:1/22:0) -18,8 0,001 -11,2 0,752 -25,9 2,6E-07
Glc/GalCer(d18:1/23:0) -19,4 0,003 -15,9 0,081 -23,8 7,8E-07
Glc/GalCer(d18:1/24:0) -17,2 0,002 -19,7 0,047 -24,2 4,7E-07
Glc/GalCer(d18:1/26:0) -16,3 0,016 -23,7 0,002 -21,0 9,4E-05
Glc/GalCer(d18:2/20:0) -19,9 0,003 -11,7 0,587 -23,3 1,7E-04
Glc/GalCer(d18:2/22:0) -19,2 0,002 -19,6 0,022 -17,9 5,0E-04
Glc/GalCer(d18:2/23:0) -22,2 0,003 -20,5 0,012 -21,6 5,2E-05
Glc/GalCer(d18:2/24:0) -17,1 0,002 -17,5 0,088 -23,9 4,8E-08
LacCer LacCer(d16:1/16:0) -3,9 0,495 -12,8 0,016 -21,1 5,3E-05
LPC 14:0_sn1 -31,2 1,9E-05 -13,7 0,001 -19,1 0,002
LPC 14:0_sn2 -34,0 3,1E-05 -21,0 3,4E-05 -30,3 2,3E-05
LPC 18:2_sn1 -32,0 1,1E-05 -5,0 0,147 -29,7 1,9E-07
LPC 18:2_sn2 -33,4 2,9E-06 -12,8 0,004 -34,7 2,3E-12
LPC 20:0_sn1 -24,5 6,2E-05 -2,7 0,308 -16,6 0,003
LPC 20:0_sn2 -25,2 9,9E-06 -6,9 0,085 -14,6 0,011
LPC 20:2_sn2 -25,4 6,7E-06 -7,0 0,067 -16,4 3,2E-05
LPC 20:3_sn2 -19,0 0,003 -2,6 0,226 -24,4 1,4E-06
LPC 22:0_sn1 -27,2 1,6E-07 -13,3 0,004 -28,7 6,3E-10
LPC 24:0_sn1 -21,0 3,4E-06 -10,0 0,015 -28,7 1,5E-12
LPC 24:0_sn2 -19,0 2,0E-05 -11,6 0,007 -28,9 2,3E-13
LPC O-20:0 -19,6 0,001 -6,0 0,095 -15,5 7,1E-04
LPC O-22:0 -15,6 0,007 -6,6 0,074 -25,3 4,8E-11
LPC O-22:1 -22,3 3,7E-04 -5,3 0,113 -17,5 0,002
LPC O-24:1 -15,3 0,019 -6,1 0,093 -17,8 8,2E-05
LPC O-24:2 -25,3 5,5E-05 -8,5 0,203 -33,0 1,2E-08
LPE 18:2_sn1 -37,7 5,8E-06 -1,3 0,288 -40,1 1,5E-11
LPE 18:2_sn2 -37,2 1,8E-06 -4,0 0,191 -35,4 4,6E-10
LPE P-16:0 -9,9 0,013 -23,3 1,5E-07 -12,4 0,197
LPE P-18:0 -13,2 0,005 -12,8 9,4E-05 -7,8 0,382
PC 28:0 -47,2 5,5E-06 -47,8 2,7E-07 -59,0 1,5E-15
PC 30:0 -26,4 0,001 -25,1 2,1E-05 -43,4 4,0E-15
PC 30:1 -39,4 2,1E-04 -34,6 1,2E-06 -52,1 2,4E-13
PC 30:2 -57,6 4,2E-08 -48,2 4,5E-07 -61,4 2,1E-14
PC 31:1 -14,8 0,311 -23,8 0,002 -36,9 1,9E-08
PC 32:1 -12,2 0,795 -15,0 0,016 -29,0 1,9E-06
PC 32:2 -38,0 8,7E-07 -26,7 1,9E-06 -52,5 4,0E-19
PC 32:3 -42,9 1,1E-05 -34,3 2,9E-07 -58,5 4,2E-17
PC 33:2 -18,0 0,010 -7,8 0,098 -35,6 6,9E-13
PC 33:3 -23,3 0,021 -23,4 1,9E-04 -42,0 4,2E-11
PC 34:2 -15,9 0,001 -5,8 0,198 -28,6 4,5E-10
PC 34:3a -22,1 5,0E-04 -14,2 0,010 -37,9 9,7E-14
PC 34:3b -19,2 0,025 -17,5 0,001 -35,8 3,9E-12
PC 34:3c -25,4 0,002 -21,8 0,010 -44,1 1,2E-13
PC 34:4 -35,4 1,3E-05 -22,1 4,5E-05 -52,1 5,6E-16
PC 34:5 -28,0 0,006 -39,4 2,9E-08 -41,3 1,4E-05
PC 35:2a -16,5 0,036 -0,4 0,931 -26,3 2,6E-06
PC 35:2b -16,1 0,006 -2,9 0,413 -28,1 1,1E-09
PC 35:3a -26,7 1,3E-05 -5,9 0,151 -39,8 3,1E-15
PC 35:3b -17,1 0,019 -4,5 0,206 -35,9 2,0E-09
PC 36:1 -16,3 0,033 -9,5 0,038 -12,5 0,053
PC 36:2 -22,6 7,2E-05 -7,7 0,103 -35,1 2,0E-13
PC 36:3a -30,8 3,2E-07 -3,8 0,280 -36,0 2,2E-14
PC 36:3b -14,6 0,040 -4,9 0,186 -29,2 1,9E-08
PC 36:5a -16,9 0,030 -10,6 0,097 -32,1 1,4E-07
PC 36:6 -28,8 7,7E-04 -20,3 7,5E-04 -46,4 2,0E-09
PC 36:7 -32,8 9,3E-04 -52,7 1,6E-13 -27,4 2,1E-05
PC 37:1 -16,8 0,004 -5,1 0,300 -20,5 4,6E-06
PC 37:2 -26,5 2,6E-05 -11,7 0,022 -36,3 6,0E-13
PC 37:3 -13,5 0,031 -2,2 0,432 -30,4 7,4E-09
PC 38:0 -10,9 0,049 -5,9 0,106 -29,1 5,0E-11
PC 38:3 -19,4 0,007 -3,0 0,262 -30,6 1,5E-09
PC 38:5b -4,4 0,564 -19,6 0,002 -16,1 0,003
PC 38:6a -28,1 9,3E-05 -9,9 0,051 -35,0 2,6E-10
PC 38:6b -33,2 1,3E-06 -5,8 0,446 -38,0 7,1E-13
PC 40:8 -22,0 0,004 -7,7 0,051 -33,4 6,8E-10
PC P PC P-34:2 -29,8 2,3E-06 -12,7 0,035 -33,3 2,7E-13
PC O-32:1 -17,6 0,011 -3,4 0,490 -31,3 7,1E-10
PC O-34:1 -13,4 0,012 -0,2 0,968 -22,2 1,2E-08
PC O-34:2 -29,9 1,0E-05 -12,6 0,031 -39,7 6,7E-17
PC O-36:1 -10,2 0,075 -9,8 0,026 -27,6 1,5E-07
Charité DiscoveryCharité Finland
LPC
LPC O
LPE
LPE P
PC O
PC
Glc/GalCer
CE
Cer d16:1
Cer d18:0
Cer d18:1
Cer d18:2
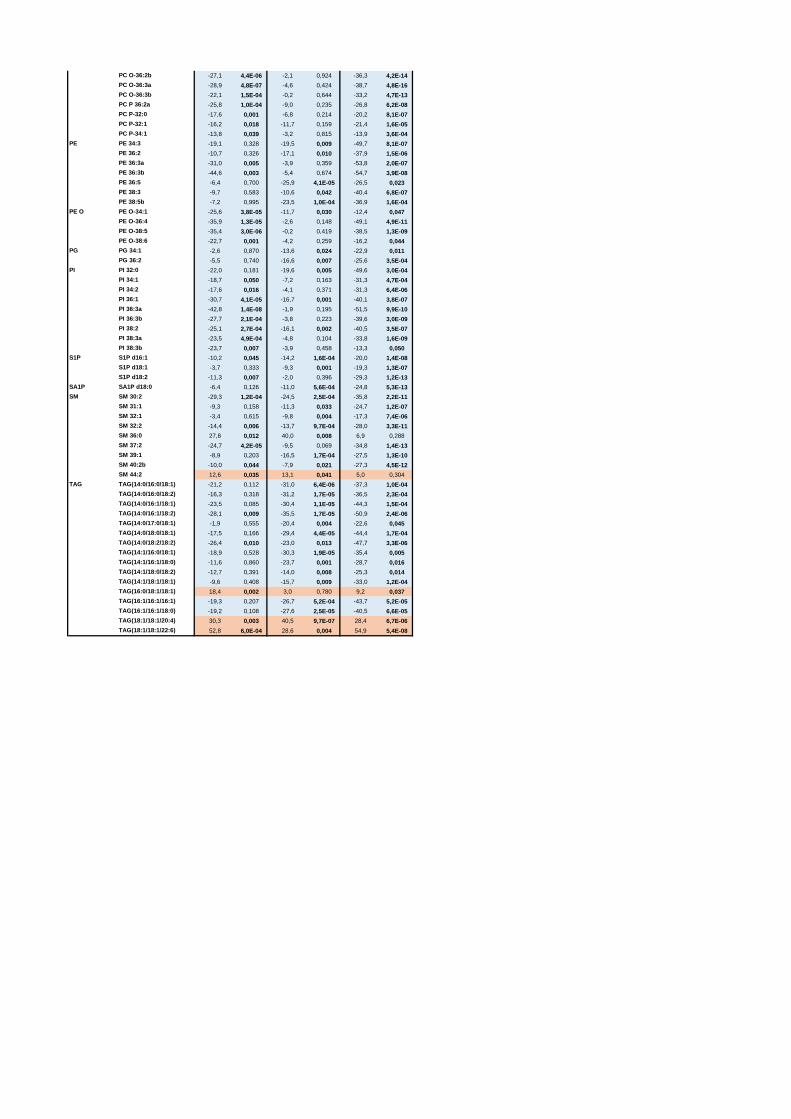
PC O-36:2b -27,1 4,4E-06 -2,1 0,924 -36,3 4,2E-14
PC O-36:3a -28,9 4,8E-07 -4,6 0,424 -38,7 4,8E-16
PC O-36:3b -22,1 1,5E-04 -0,2 0,644 -33,2 4,7E-13
PC P 36:2a -25,8 1,0E-04 -9,0 0,235 -26,8 6,2E-08
PC P-32:0 -17,6 0,001 -6,8 0,214 -20,2 8,1E-07
PC P-32:1 -16,2 0,018 -11,7 0,159 -21,4 1,6E-05
PC P-34:1 -13,8 0,039 -3,2 0,815 -13,9 3,6E-04
PE 34:3 -19,1 0,328 -19,5 0,009 -49,7 8,1E-07
PE 36:2 -10,7 0,326 -17,1 0,010 -37,9 1,5E-06
PE 36:3a -31,0 0,005 -3,9 0,359 -53,8 2,0E-07
PE 36:3b -44,6 0,003 -5,4 0,674 -54,7 3,9E-08
PE 36:5 -6,4 0,700 -25,9 4,1E-05 -26,5 0,023
PE 38:3 -9,7 0,583 -10,6 0,042 -40,4 6,8E-07
PE 38:5b -7,2 0,995 -23,5 1,0E-04 -36,9 1,6E-04
PE O-34:1 -25,6 3,8E-05 -11,7 0,030 -12,4 0,047
PE O-36:4 -35,9 1,3E-05 -2,6 0,148 -49,1 4,9E-11
PE O-38:5 -35,4 3,0E-06 -0,2 0,419 -38,5 1,3E-09
PE O-38:6 -22,7 0,001 -4,2 0,259 -16,2 0,044
PG 34:1 -2,6 0,870 -13,6 0,024 -22,9 0,011
PG 36:2 -5,5 0,740 -16,6 0,007 -25,6 3,5E-04
PI 32:0 -22,0 0,181 -19,6 0,005 -49,6 3,0E-04
PI 34:1 -18,7 0,050 -7,2 0,163 -31,3 4,7E-04
PI 34:2 -17,6 0,016 -4,1 0,371 -31,3 6,4E-06
PI 36:1 -30,7 4,1E-05 -16,7 0,001 -40,1 3,8E-07
PI 36:3a -42,8 1,4E-08 -1,9 0,195 -51,5 9,9E-10
PI 36:3b -27,7 2,1E-04 -3,8 0,223 -39,6 3,0E-09
PI 38:2 -25,1 2,7E-04 -16,1 0,002 -40,5 3,5E-07
PI 38:3a -23,5 4,9E-04 -4,8 0,104 -33,8 1,6E-09
PI 38:3b -23,7 0,007 -3,9 0,458 -13,3 0,050
S1P d16:1 -10,2 0,045 -14,2 1,6E-04 -20,0 1,4E-08
S1P d18:1 -3,7 0,333 -9,3 0,001 -19,3 1,3E-07
S1P d18:2 -11,3 0,007 -2,0 0,396 -29,3 1,2E-13
SA1P SA1P d18:0 -6,4 0,126 -11,0 5,6E-04 -24,8 5,3E-13
SM 30:2 -29,3 1,2E-04 -24,5 2,5E-04 -35,8 2,2E-11
SM 31:1 -9,3 0,158 -11,3 0,033 -24,7 1,2E-07
SM 32:1 -3,4 0,615 -9,8 0,004 -17,3 7,4E-06
SM 32:2 -14,4 0,006 -13,7 9,7E-04 -28,0 3,3E-11
SM 36:0 27,8 0,012 40,0 0,008 6,9 0,288
SM 37:2 -24,7 4,2E-05 -9,5 0,069 -34,8 1,4E-13
SM 39:1 -8,9 0,203 -16,5 1,7E-04 -27,5 1,3E-10
SM 40:2b -10,0 0,044 -7,9 0,021 -27,3 4,5E-12
SM 44:2 12,6 0,035 13,1 0,041 5,0 0,304
TAG(14:0/16:0/18:1) -21,2 0,112 -31,0 6,4E-06 -37,3 1,0E-04
TAG(14:0/16:0/18:2) -16,3 0,318 -31,2 1,7E-05 -36,5 2,3E-04
TAG(14:0/16:1/18:1) -23,5 0,085 -30,4 1,1E-05 -44,3 1,5E-04
TAG(14:0/16:1/18:2) -28,1 0,009 -35,5 1,7E-05 -50,9 2,4E-06
TAG(14:0/17:0/18:1) -1,9 0,555 -20,4 0,004 -22,6 0,045
TAG(14:0/18:0/18:1) -17,5 0,166 -29,4 4,4E-05 -44,4 1,7E-04
TAG(14:0/18:2/18:2) -26,4 0,010 -23,0 0,013 -47,7 3,3E-06
TAG(14:1/16:0/18:1) -18,9 0,528 -30,3 1,9E-05 -35,4 0,005
TAG(14:1/16:1/18:0) -11,6 0,860 -23,7 0,001 -28,7 0,016
TAG(14:1/18:0/18:2) -12,7 0,391 -14,0 0,008 -25,3 0,014
TAG(14:1/18:1/18:1) -9,6 0,408 -15,7 0,009 -33,0 1,2E-04
TAG(16:0/18:1/18:1) 18,4 0,002 3,0 0,780 9,2 0,037
TAG(16:1/16:1/16:1) -19,3 0,207 -26,7 5,2E-04 -43,7 5,2E-05
TAG(16:1/16:1/18:0) -19,2 0,108 -27,6 2,5E-05 -40,5 6,6E-05
TAG(18:1/18:1/20:4) 30,3 0,003 40,5 9,7E-07 28,4 6,7E-06
TAG(18:1/18:1/22:6) 52,8 6,0E-04 28,6 0,004 54,9 5,4E-08
TAG
PE
PE O
PG
PI
S1P
SM
PC O

Related Documents