1 Premotor cortex is sensitive to auditory-visual congruence for biological motion Wuerger, SM 1 , Parkes, L 2 , Lewis, PA 3 , Crocker-Buque, A 4 , Rutschmann, R 5 and Meyer GF 1 , 1 Department of Experimental Psychology, University of Liverpool 2 Imaging Sciences, Biomedical Imaging Institute, University of Manchester 3 School of Psychology, University of Manchester 4 Centre for Integrative Physiology, School of Biomedical Sciences, University of Edinburgh 5 Department of Experimental Psychology, University of Regensburg; Corresponding Author: Sophie Wuerger Department of Experimental Psychology University of Liverpool Eleanor Rathbone Building Bedford Street South Liverpool, L69 7ZA +44 151 794 2173/2967 (office/lab) http://www.liv.ac.uk/Psychology/staff/swuerger.html Email: [email protected]

Welcome message from author
This document is posted to help you gain knowledge. Please leave a comment to let me know what you think about it! Share it to your friends and learn new things together.
Transcript
1
Premotor cortex is sensitive to auditory-visual congruence for biological motion
Wuerger, SM1
, Parkes, L2 , Lewis, PA
3, Crocker-Buque, A
4, Rutschmann, R
5 and Meyer GF
1,
1Department of Experimental Psychology, University of Liverpool
2Imaging Sciences, Biomedical Imaging Institute, University of Manchester
3School of Psychology, University of Manchester
4 Centre for Integrative Physiology, School of Biomedical Sciences, University of Edinburgh
5Department of Experimental Psychology, University of Regensburg;
Corresponding Author:
Sophie Wuerger
Department of Experimental Psychology
University of Liverpool
Eleanor Rathbone Building
Bedford Street South
Liverpool, L69 7ZA
+44 151 794 2173/2967 (office/lab)
http://www.liv.ac.uk/Psychology/staff/swuerger.html
Email: [email protected]
2
ABSTRACT
The auditory and the visual perception systems have developed special processing strategies for
ecologically valid motion stimuli, utilising some of the statistical properties of the real world. A
well known example is the perception of biological motion, e.g. the perception of a human walker.
The aim of the current study was to identify the cortical network involved in the integration of
auditory and visual biological motion signals. We first determined the cortical regions of auditory
and visual co-activation (Experiment 1); a conjunction analysis based on unimodal brain
activations identified four regions: the Middle Temporal area (MT), Inferior Parietal Lobule (IPL),
Ventral Premotor Cortex (vPM) and the Cerebellum. The brain activations arising from bimodal
motion stimuli (Experiment 2) were then analysed within these regions of co-activation. Auditory
footsteps were presented concurrently with either an intact visual point-light-walker (biological
motion) or a scrambled point-light-walker; auditory and visual motion-in-depth (walking
direction) could either be congruent or incongruent. Our main finding is that motion
incongruency (across modalities) increases the activity in the Premotor cortex (vPM) but only if
the visual point-light-walker is intact. Our results extend our current knowledge by providing new
evidence consistent with the idea that the Premotor area assimilates information across the
auditory and visual modality by comparing the incoming sensory input to an internal
representation.
Keywords: fMRI, multisensorial integration, biological motion, motion-in-depth, auditory, visual
3
Introduction
When an object moves in the real world, its movement is usually associated with a sensory signal
in both the auditory and the visual modality (Baumann & Greenlee, 2007). These signals are
merged to yield a unified percept of the object in motion. The auditory and the visual perception
systems have developed special processing strategies for ecologically valid motion stimuli,
utilising some of the statistical properties of the real world (for a recent review see Blake &
Shiffrar, 2007) A prime example is the perception of biological movement, i.e. the perception of
human body motion, such as walking or running.
The cortical mechanisms underlying the processing of visual biological motion signals (such as
point-light-walkers) have received much attention and a network encompassing occipital, parietal
and temporal areas has been implicated in the processing of visual biological motion, including the
posterior superior temporal gyrus and superior temporal sulcus (Bonda, Petrides, Ostry, & Evans,
1996; Grossman & Blake, 2001; Grossman & Blake, 2002; Grossman et al., 2000; Howard et al.,
1996; Pelphrey et al., 2003; Pelphrey, Morris, Michelich, Allison, & McCarthy, 2005; Servos,
Osu, Santi, & Kawato, 2002; Thompson, Clarke, Stewart, & Puce, 2005), the lingual gyrus
(Vaina, Solomon, Chowdhury, Sinha, & Belliveau, 2001), motion-sensitive areas MT and MT+
(Grezes, 2001; Vaina et al., 2001), parietal areas (Bonda et al., 1996; Grezes, 2001; Vaina et al.,
2001), and other areas including the amygdala (Bonda et al., 1996).
The involvement of the pSTS/STG in biological motion processing is the most robust finding and
consistent with macaque physiology (for a review see Puce & Perrett, 2003). Many areas that are
selective for visual biological motion, are also responsive to auditory biological motion signals.
4
The pSTS is activated by auditory footsteps (Bidet-Caulet, Voisin, Bertrand, & Fonlupt, 2005),
hence suggesting that pSTS may be a supramodal integration area for human biological motion.
More recent experiments suggest that, in addition to the STS, Premotor areas play an important
role in the processing of visual biological motion (Schubotz & von Cramon, 2004) and studies
using a clinical (Saygin, 2007) or non-clinical population (Saygin, 2007; Saygin, Wilson, Hagler,
Bates, & Sereno, 2004) confirm that the Premotor cortex is necessary for intact biological motion
perception. Neuroimaging studies on humans have demonstrated that Premotor cortex is activated
during action observation (e.g. Bonini et al., 2010; Buch, Mars, Boorman, & Rushworth, 2010;
Calvo-Merino, Glaser, Grezes, Passingham, & Haggard, 2005; Jastorff, Begliomini, Fabbri-
Destro, Rizzolatti, & Orban, 2010; Pilgramm et al., 2010), and that auditory and visual motion
signals converge in the Premotor cortex (Bremmer et al., 2001). Taken together, these studies
suggest that the human Premotor cortex is a good candidate for the perceptual integration of
auditory and visual actions, such as human body motions.
Behavioural evidence suggests that different integration mechanisms are at work for highly
familiar auditory and visual signals (Arrighi, Alais, & Burr, 2006; Arrighi, Marini, & Burr, 2009;
Saygin, Driver, & de Sa, 2008). Reaction time studies with biological motion stimuli (point-light
walkers) showed that the integration of biological motion stimuli is constrained by the direction of
the auditory and visual motion signals and shorter reaction times are reported for congruent
biological motion (Brooks et al., 2007); the integration of random motion sequences is not affected
by the inconsistency of the auditory-visual motion direction (Brooks et al., 2007; Meyer &
Wuerger, 2001; Meyer, Wuerger, Roehrbein, & Zetzsche, 2005; Wuerger, Hofbauer, & Meyer,
2003). In the present imaging study we looked for neural correlates of these differential auditory-
visual integration mechanisms for biological and non-biological motion signals that have been
5
demonstrated behaviourally. As visual biological motion stimuli we used point-light walkers
(Johansson, 1973) since they give a compelling percept of a person walking and are yet highly
controllable; a ‘scrambled’ walker was obtained by randomising the starting position of each limb
hence keeping the local motion signals intact but destroying the percept; the auditory stimulus
consisted of synchronised footsteps. We focussed on the question whether the incongruent
auditory and visual motion direction has a differential effect on the brain activity arising from the
integration of biological (point-light walker and synchronised footsteps) and non-biological
motion signals (‘scrambled’ walker and synchronised footsteps). Our hypothesis was that
inconsistent motion across the auditory and visual modality (auditory: looming motion; visual:
receding motion) should have a greater effect when both modalities signal biological motion.
Materials and Methods
Experimental design
First we identified candidate regions (ROIs) of auditory-visual co-activation (Experiment 1:
Localiser); we then tested within these ROIs whether such differential neural activities were found
for biological compared to scrambled motion sequences (Experiment 2). In experiment 1
(Localiser), subjects were presented with visual (point-light walkers), auditory (footsteps) or
bimodal motion sequences and their task was to detect motion-in-depth (looming or receding
motion). fMRI scans were performed to reveal cortical activations common to the auditory and
the visual modality (Bremmer et al., 2001; Harrison, Wuerger, & Meyer, 2010). The main
purpose of the localiser experiment was to identify areas of auditory-visual co-activation by
performing a conjunction analysis (Friston, Penny, & Glaser, 2005) of the unimodal (auditory
only, visual only) brain activations. In experiment 2 we tested our main hypothesis by asking
whether auditory-visual motion congruency (same versus different directions of motion in the two
6
modalities) yields a differential effect on neural responses to biological motion in comparison to
meaningless motion sequences. fMRI was performed while subjects were presented with
incongruent and congruent bimodal motion sequences. The statistical analysis of the effect of
motion congruency on biological versus non-biological motion is then performed within the
regions of interest defined by experiment 1 (Meyer, Greenlee, & Wuerger, ; Szycik, Tausche, &
Münte, 2008). Behavioural performances for both experiments were obtained at least one day prior
to the scanning sessions under closely matched experimental conditions.
Subjects
Eighteen (15 naïve and three authors) healthy volunteers (eight females) with normal or corrected-
to normal vision participated in the experiments (mean age: 24 ± 5 years). All subjects gave
written consent and were screened for MRI contra-indications. The study was approved by the
Sefton Liverpool Research Ethics Committee.
Apparatus
Auditory stimuli were played back using a real-time signal processor (Tucker-Davis-Technologies,
RM1; USA) and presented via MRI-compatible MR Confon Optime 1 headphones (MR Confon,
Magdeburg, Germany). Visual stimuli were generated using a visual stimulus generator (ViSaGe;
Cambridge Research Systems LTD, Kent, UK) which was controlled by a standard PC (DELL
Precision 390). Stimuli were back projected with a LCD projector (PANASONIC PT-L785U) onto
a translucent circular screen, placed inside the scanner bore at 70 cm from the observer. The
projector ran at a refresh rate of 60Hz and a resolution of 800 x 600 pixels. The TDT system and
the ViSaGe system were interfaced via triggers to ensure that the auditory and visual stimuli were
7
synchronised. For stimulus presentation (auditory and visual) MatLab 7 (Mathworks) was used.
Responses were acquired using an MRI-compatible response box.
Behavioural data were obtained at least one day prior to the scanning session using a similar
experimental setup (ViSaGe interfaced with a TDT system). Subjects were seated in a sound-
proof booth (IAC 404-A), at a distance of 100cm from a CRT monitor (Mitsubishi DiamondPro
2070SB), running at a refresh rate of 60 Hz. Auditory stimuli were presented via conventional
headphones (Sennheiser HD25SP). Reaction times were acquired using an infrared response box
(Cambridge Research Systems Ltd, UK).
Stimuli
The auditory stimuli were natural recordings of footsteps (male walker) on gravel and lasted 1.8
secs (4 footsteps) (diotic presentation, Fs=44100Hz, 64 dB(A)). The visual stimuli were either
‘point light walkers’ (PLW; biological motion) or ‘scrambled point-light walkers’ (SCR),
subtending a visual angle of 3.8 deg (width) x 10 deg (height). The mean luminance of the display
was fixed at 50 cd/m2
; the contrast of the PLWs was 100% (black on grey). The PLW was defined
by 13 points (indicating the main joints and the head) representing the motion of the particular
position of the body over four steps. PLWs were always presented in their front/back view. The
view we presented was consistent with a front and a back view due to the inherent orthographic
ambiguity of PLWs (Vanrie & Verfaillie, 2006); it is also known that a concurrent auditory
looming/receding sound can bias the observer’s interpretation (Schouten, Troje, Vroomen, &
Verfaillie, 2011). Each point had a size of 3x3 pixels (0.09 x 0.09 deg) and one stimulus trial
lasted 1.8 secs. The ‘scrambled’ walkers were generated by using the same local limb movements
as present in the PLW, but the starting positions of the limb movements were randomised within a
kernel defined by the extent of the original figures, e.g. the knee movement could start near the
8
elbow and vice versa. New scrambled motion was generated on each trial to avoid that observers
learned the constellation of the scrambled walkers. The advantage of this control stimulus is that it
contains the same local motion signals (and hence the same spatio-temporal profile) as the point-
light walker but is not recognised as a walker (Grossman & Blake, 2002). Auditory and visual
motion stimuli could either be looming, receding, or neither looming nor receding. In the latter
case the point-light-walker is walking ‘on a treadmill’ (‘No Motion’). Receding visual motion was
generated by contracting the visual stimuli by a factor of 0.25; receding auditory motion was
generated by linearly decreasing the amplitude of the footsteps by the same factor. Looming
motion was generated by linearly increasing the amplitude/size. We added dynamic visual noise
to the visual stimuli in an attempt to roughly equate the saliency in both modalities, since the
scanner noise was always present in the auditory modality. New dynamic visual noise was
generated on each trial. To match the behavioural study (this was a separate experiment conducted
prior to the brain scans) as closely as possible with the scanning conditions, we recorded the
scanner noise using an optical microphone (MR Confon; Manufacturer: Sennheiser, Germany) and
then replayed the scanner noise in the sound-proof booth using loud speakers throughout the
experiment. The auditory stimulus (footsteps) was presented via headphones. The onset of the
(audio) footstep coincided with the (visual) foot touching the ground; this synchronization was
performed manually.
Task and Procedure
We performed two experiments: in experiment 1 we presented unimodal motion stimuli (auditory
footsteps (A), visual biological motion (VBIO), visual scrambled motion (VSCR) and congruent
bimodal stimuli (CONG_BIO=A+VBIO, CONG_SCR=A+VSCR). All five experimental stimuli
conveyed the same motion direction (receding) and each experimental condition was presented 12
9
times. We included a control condition of no interest, which consisted of ‘no motion’ (walking on
a treadmill) stimuli, presented either bimodally or unimodally. Each of the five control stimuli was
presented four times and the task of the participant was to press a button when no motion was
present. In addition, we included 20 null events (fixation target only) at random times. The stimuli
(experimental, control, null) were presented in a randomized order; each stimulus was presented
for 1.8 sec and the average times between stimuli was 3 sec with a randomized jitter between -0.5
and +0.5 sec. Altogether, experiment 1 consisted of 100 trials and lasted just under 7 min (200
scans).
In experiment 2 (main experiment), we tested whether auditory-visual congruency produces
differential brain responses to biological visual motion (VBIO) compared to scrambled visual
motion (VSCR). In the four experimental conditions, auditory and visual motion could either
move in the same direction (both receding: CONG_BIO, CONG_SRC) or in different directions
(auditory looming and visual receding: INCONG_BIO, INCONG_SCR). Within a single scan,
each of the experimental stimuli was presented 16 times. As in the localizer, we included two
control conditions of no interest, consisting of bimodal ‘no motion’ stimuli (A+VBIO or
A+VSCR) and each of the two control stimuli was presented 12 times. 22 null events were
included and all stimuli were presented in a randomized order. Altogether, experiment 2 consisted
of 110 trials and lasted slightly longer than 7 min (219 scans).
Each subject was in the scanner for less than one hour. First, the participant performed a short
practice experiment (less than 5 min); then two scan sessions of experiment 1 were run (each about
7 minutes) followed by a structural scan (12 min) and by two sessions of experiment 2 (each about
7 minutes). For half of the participants the order of experiments 1 and 2 was reversed. In the
scanner, the observers’ task was to press a button (with the right index finger) only when there was
10
‘no motion’ present (control condition). This ensures that the brain activity in response to the
motion conditions is not confounded with the button presses.
For reaction time measurements, apparatus, stimuli and procedure were the same as in the
scanning session; the only difference was that observers were asked to press one button when the
stimulus contained any motion and another button when no motion was present in order to match
the motor activity between the conditions. Participants were instructed to respond as fast and as
accurately as possible. Collecting behavioural reaction time data prior to the scanning ensured that
subjects were familiar with the stimuli and the task and no additional learning occurred during
scanning. To ascertain that the auditory and visual motion stimuli elicited reliable and comparable
motion percepts, performance for discriminating between looming (receding) motion and ‘no
motion’ was measured prior to the main experiments with the same set of observers. Performance
for discriminating between auditory motion and ‘no motion’: 93% correct (for looming motion),
86% (for receding motion) and 71% (for ‘no motion’ stimuli); visual biological motion vs. ‘no
motion’: 96% (looming), 91% (receding) and 96% (no motion); visual scrambled motion vs ‘no
motion’: 72% (looming), 89% (receding) and 88% (no motion). In the main neuro-imaging
experiment (experiment 2) we used auditory receding and visual receding motion to yield the
congruent bimodal motion condition and auditory looming and visual receding motion to yield the
incongruent biomodal motion condition. We are therefore confident that the stimuli used in the
scanner elicited reliable and comparable auditory and visual motion percepts. This was confirmed
in the localizer analysis (Figure 1; Table S1) which showed activation patterns typical for the
perception of auditory (Bidet-Caulet et al., 2005) or visual motion (e.g. Bremmer et al., 2001) .
Data Acquisition
11
Imaging was performed using a 3-Tesla MR whole body scanner (Siemens Trio, Erlangen,
Germany) located at MARIARC, University of Liverpool. In the functional scans, Blood oxygen
level-dependent (BOLD) responses were measured using a T2*-weighted echo planar imaging
(EPI) sequence (echo time (TE) = 30 ms; volume repetition time (TR) = 2.0 s; in plane
resolution = 3 × 3 mm; number of slices = 33, interleaved and ascending; slice thickness = 3 mm;
gap between slices = 0.3 mm; flip angle = 80o). 3D structural images of the whole brain were
acquired using a T1-weighted MDEFT Sequence of 1 mm isotropic resolution.
Data Analysis
Preprocessing and statistical data analysis were performed using SPM5 (Wellcome Department of
Imaging Neuroscience, London, UK, http://www.fil.ion.ucl.ac.uk/spm/) running under Matlab 7
(Mathworks, Natick, MA). Functional images of each participant were corrected for residual head
motion and realigned to the first image. Subsequently, all functional images were co-registered
and normalized to the MNI-152 template and re-sampled to 2 × 2 × 2 mm3 spatial resolution.
Spatial smoothing was applied to the functional images using an isotropic Gaussian kernel with a
full-width half-max (FWHM) of 8 mm. A general linear model (GLM) was constructed for each
participant in order to analyze the hemodynamic responses captured by the functional images. In
all functional scans, an event-related design was used; regressors were generated by convolving
unit impulses with the canonical hemodynamic function and also with the temporal derivative of
this function (e.g. Henson et al., 2001). A random effect analysis was used for the statistical fMRI
data analysis.
Experiment 1 was used to localize modality-unspecific motion-sensitive areas. The design matrix
consisted of 10 regressors, the five experimental stimulus conditions (A, VBIO, VSCR, A+ VBIO,
12
A+VSCR, all depicting receding motion) and the five control conditions (A, VBIO, VSCR, A+
VBIO, A+VSCR, all depicting a stationary ‘treadmill’ walker ). A second-level global null
analysis (as defined by Friston et al., 2005) was used to reveal areas that respond significantly
(whole brain family-wise error <0.05) to motion in the auditory or in the visual modality. We
confirmed that a conjunction null (as defined by Friston et al., 2005) revealed the same areas of
co-activation (at a different family-wise error), hence in our particular case this was not a critical
issue. These brain areas identified in experiment 1 by the global null analysis are then used as
regions of interest in experiment 2. These regions of interest (ROIs) were extracted using the
MarsBaR 0.38 toolbox for SPM (Brett, Anton, Valabregue, & Poline, 2002).
In experiment 2, we tested our main hypothesis, namely whether there is an interaction between
auditory-visual congruency (CONG vs INCONG) and motion type (BIO vs SCR). The design
matrix consisted of 6 regressors, the four experimental conditions (CONG_BIO, CONG_SCR,
INCONG_BIO, INCONG_SCR) and the two control conditions. Individual contrast estimates,
within the ROIs defined by experiment 1, were extracted for each observer and for each ROI
individually. They were then analysed with a two-way ANOVA (factor 1: motion type: BIO or
SCR; factor 2: motion congruency: congruent or incongruent). Stereotaxic Montreal Neurological
Institute (MNI) coordinates are used throughout this report. For the parietal lobe activations, the
centres of gravity of suprathreshold regions were localized using the Anatomy toolbox for SPM
(Eickhoff et al., 2005). For cortical areas where no probability maps were available in the
Anatomy toolbox, we used the WFU_PickAtlas toolbox for SPM (Maldjian, Laurienti, Kraft, &
Burdette, 2003).
To compute the correlations between the behavioural data (reaction times) and the brain
activations we use the mean reaction times for each individual observer for each of the four
13
experimental conditions (CONG_BIO, CONG_SCR, INCONG_BIO, INCONG_SCR) and the
individual contrast values associated with the four experimental conditions in each of the four
ROIs. These contrast values are proportional to signal change and were extracted with MarsBaR
(Brett et al., 2002); for the correlation analysis the mean contrast value averaged across all voxels
within the ROI was used. To test for interactions between motion type (BIO/SCR) and motion
congruency (CONG/INCONG) both in the behavioural reaction times and the fMRI contrasts we
performed a within-subject 2-way ANOVA (MatLab statistics toolbox).
The main hypothesis was tested as described in the previous paragraphs. For visualisation
purposes (Figures are supplied as Supporting Material), a whole brain analysis was conducted.
Using a flexible factorial design, several contrasts (CONG_BIO versus null; CONG_SRC versus
null; INCONG_BIO versus null; INCONG_SCR versus null) were calculated. The resulting SPM
T maps were superimposed with the selected threshold (family-wise error < 0.05) onto the
population average landmark and surface-based (PALS-B12) standard brain (Van Essen, 2005)
using Caret 5.6 (Van Essen et al., 2001).
Results
Localiser experiment: Areas of auditory-visual co-activation
In the localizer experiment, we observe very similar activation patterns for biological and
scrambled visual motion. The main purpose of the localiser experiment is to define regions of
interest in which the main hypothesis can be tested. The conjunction (‘Global Null’) analyses
(Friston et al., 2005) were performed on the unimodal brain activations ( (A > Rest) ∩ (V > Rest),
for both biological and scrambled visual motion, following Meyer et al (2011). The conjunction
‘A ∩ VBIO’ revealed four areas of significant co-activations common to the auditory and visual
modality: the right Premotor area (vPM; BA 6, bordering on BA 44), the right inferior parietal
14
lobule (BA 7) on the border to the superior parietal lobule (SPL), the right middle temporal area
(BA 39, bordering on BA 22 and BA 37) and the left Cerebellum. Figure 1a shows the SPM T
maps of this conjunction analysis (group results) superimposed on an inflated standard brain;
Figure 1b shows the saggital and coronal views. The co-activity in the Premotor Cortex, the
Inferior Parietal Lobule and area MT is lateralised in the right hemisphere; common activity in the
Cerebellum is only present in the left hemisphere. The corresponding figure for the conjunction
‘A ∩ VSCR’ is shown in the supporting material (Figure S1); the same regions of co-activations
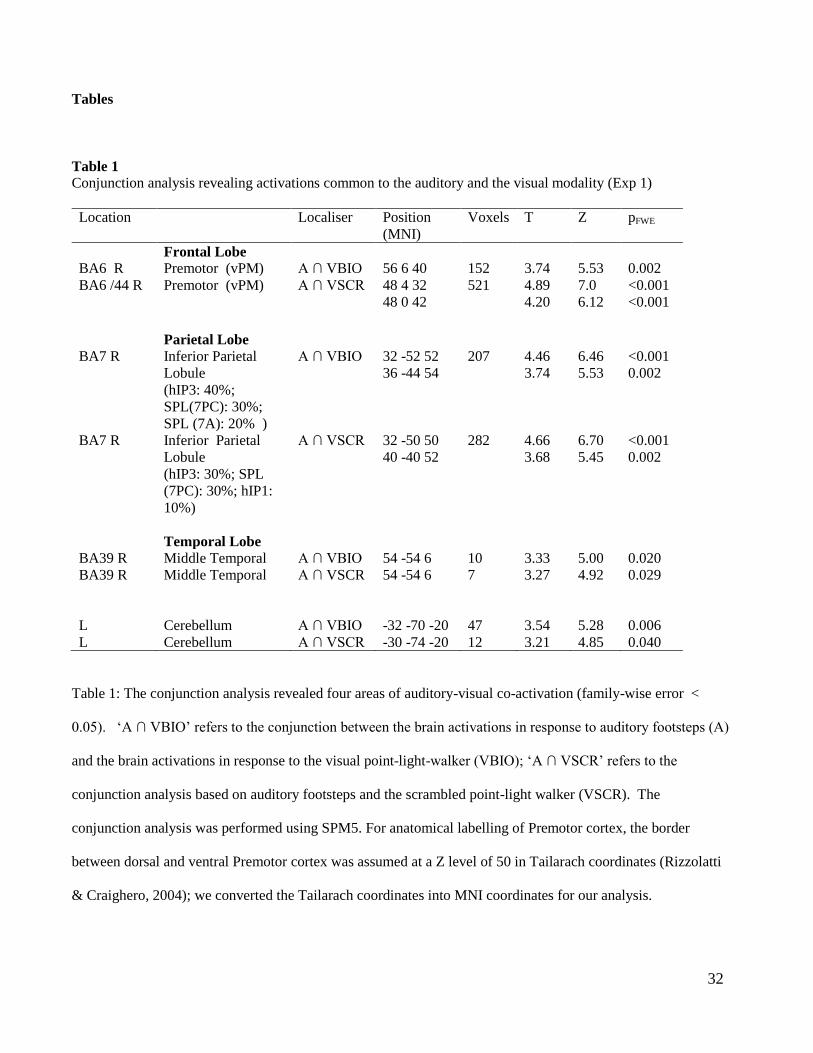
are revealed. Table 1 depicts the label of the ROI, the type of conjunction (A ∩ VBIO or A ∩
VSCR), the cortical location (MNI), and the number of significant voxels. Both T and Z values are
given; all neural activations are significant at p<0.05 (family-wise error). Since both localisers
reveal the very similar regions of interest, we will report the results of our main experiment for the
BIO localiser only; the corresponding (and identical) results for the SCR localiser can be found in
the supplementary material.
Figure 1: Conjunction analysis – about here
Table 1: Conjunction analysis – about here
Bimodal activations
Differential effects of auditory-visual motion incongruency on biological and scrambled visual
motion
The purpose of the main experiment (Experiment 2) was to test whether the type of visual motion
(biological or scrambled) interacts with motion incongruency (auditory and visual motion signal
the same direction = congruent motion; auditory and visual motion signal different motion
directions = incongruent motion). We measured activations for the four bimodal conditions:
15
congruent biological motion (CON BIO), incongruent biological motion (INCON BIO), congruent
scrambled motion (CON SCR) and incongruent scrambled motion (INCON SCR), and tested
within each region of interest (determined in experiment 1 using our localiser) whether there is an
interaction between motion type (BIO vs SCR) and auditory-visual motion incongruency
(Congruent vs incongruent), i.e. whether the differential activation (INCON-CON)SCR - (INCON-
CON)BIO differs from zero. Our main finding is that significant interactions are found only in the
right vPM.
Figure 2 shows the ROIs revealed by the localizer experiment (cf. Figure 1) superimposed onto an
MNI normalized flat map template (van Essen et al. 2001). BOLD contrasts within each ROI were
extracted for each individual observer and the mean contrast differences between incongruent and
congruent bimodal motion signals (‘INCON– CON’) for biological (green) and scrambled (purple)
motion are shown in the bar graphs for all four ROIs (for the numerical values of the contrast
differences consult Table 2). In the right vPM , incongruent auditory-visual motion leads to a
larger BOLD contrast increase when both modalities convey a biological motion signal in
comparison to scrambled visual motion; the interaction is significant only in the vPM (within-
subject two-way ANOVA: F(1,17)=5.74; p=0.028). No significant interactions were found in IPL
(F(1,17)=0.54; p=0.47), in MT (F(1,17)=0.23; p=0.63) or in the Cerebellum (F(1,17)<0.0001;
p=0.97). The significant interaction in vPM results from different BOLD contrasts for congruent
and incongruent biological motion (BIO: upper left panel of Figure S3a, in the supplementary
material); for the scrambled condition, congruent and incongruent motion yield the same BOLD
contrasts ( SCR: Figure S3a). No significant contrast differences between congruent and
incongruent motion were found in MT and the Cerebellum; in IPL, there was a trend for
16
incongruent biological motion to yield a higher BOLD contrast than congruent biological motion
(p=0.066; Figure S3a).
We obtain almost identical results when we use a localizer defined by A ∩ VSCR since the ROIs
are almost completely overlapping (see Exp 1): only the interaction in vPM is significant (see
Supplementary Material: Figure S1, S2, S3b; cf with Figures 1,2,S3a). This differential effect of
motion incongruency on biological motion can also be seen in the whole brain group analysis:
incongruent motion is associated with an increased vPM (BA 6) activity for biological motion
only, and only in the right hemisphere (Supplementary material: compare Figure S4a: RH with
S4b: LH).
Table 2: Differential (INCON-CON) contrasts – about here
Figure 2: Flat brain with differential contrasts – about here
In summary, our ROI analysis revealed a significant interaction in vPM (precentral; BA 6) in the
right hemisphere only: incongruent motion in the auditory and visual modality leads to an increase
in the activation in these areas only if the auditory and visual modality depict biological motion
signals.
Reaction times and their neural correlates
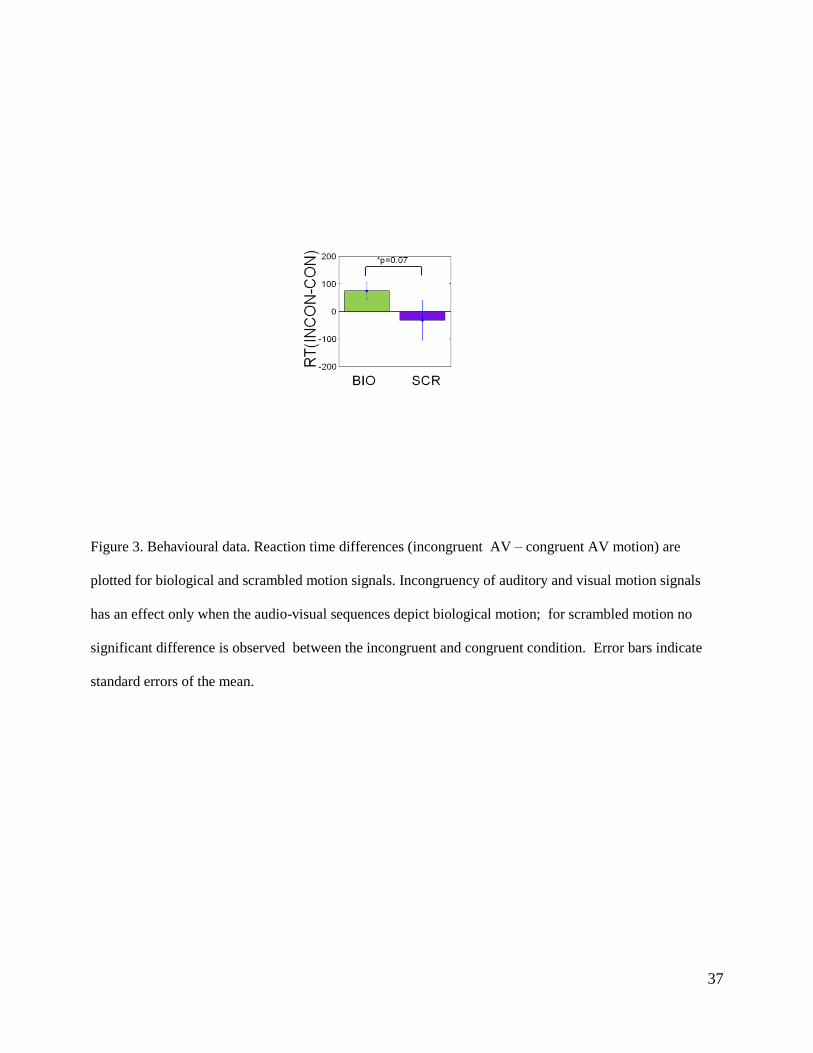
Figure 3 shows the differences in reaction times (INCON – CON) for biological and scrambled
visual motion. For biological motion, observers are slowed down (by 74 msec) when the auditory
and the visual modality signal different directions of motion; when the visual point-light-walker
was scrambled, there is no significant reaction time difference between incongruent and congruent
17
motion sequences (RT difference = -32 msec). There is a weak interaction between type of
motion (BIO/SCR) and motion incongruency (F(1,17)=3.73; p=0.07). In summary, observers are
slowed down by incongruent information from the auditory and visual modality if and only if both
the auditory and the visual motion sequences depict biological motion, which is consistent with
Brooks et al (Brooks et al., 2007) and replicates our previously reported behavioural results
(Wuerger et al., 2011).
Figure 3: Differential reaction times – about here
Comparison of the differential brain activations (Figure 2) with the differential reaction times
(Figure 3) reveals that the BOLD contrast in vPM (BA 6) shows the same pattern as the reaction
time, i.e. an increase in reaction times due to incongruent motion information from the auditory
and the visual modality is associated with an increased activation in the Premotor cortex. To
quantify the strength of association between reaction times and BOLD contrasts, we calculate the
correlation between the individual brain activations within the ROIs and the individual reaction
times (n=18) for all four experimental conditions (CON BIO; CON SCR; INCON BIO; INCON
SCR). We predict an association between reaction times and brain activity for all four conditions,
but only in vPM. An analysis of covariance (ANOCOVA; MatLab Statistics Toolbox) revealed
that, when separate lines are fitted for each of the four conditions, the slopes of these lines do not
differ significantly from each other (vPM: F(1,3)=0.31; p=0.82; IPL: F(1,3)=0.69; p=0.56; MT:
F(1,3)=0.05; p=0.98; Cerebellum: F(1,3)=0.65; p=0.58). When fitted in isolation for each
condition separately (see Supplementary Material, Figures S5a,b), the correlation between fMRI
contrast and reaction time does not reach statistical significance. We therefore fitted a single line
18
to all data, but separately for each region of interest. Only Premotor activity is significantly
correlated with reaction times (r ~0.3; p<0.05; Table 3).
Table 3: correlation between reaction times and activations
Discussion
Our aim was to identify the cortical network that differentiates between biologically plausible and
implausible auditory-visual inputs. We first determined the cortical regions of auditory-visual co-
activation by performing a conjunction analysis based on unimodal brain activations (Experiment
1: Localiser). The regions identified by this conjunction analysis were: MT, IPL, and vPM. The
brain activations arising from bimodal (auditory-visual) motion stimuli (Experiment 2) were then
analysed within these regions of co-activation. Our main finding is that the incongruency in the
auditory and visual motion direction of the walker only affects the activity in the right vPM and
only if the visual walker is intact. We therefore conclude that the right vPM not only plays a role
in recognising motion sequences in the visual and auditory modality in isolation, but is also
selective to the familiarity of the combined auditory-visual input.
Areas of auditory and visual co-activation in the right hemisphere
Our conjunction analysis (Experiment 1) revealed four regions of auditory-visual co-activation:
area MT (BA 39 bordering on BA 22 and BA 37), vPM (BA 6) and IPL (BA7; at the border to
SPL) in the right hemisphere and the Cerebellum in the left hemisphere (see Table 1, also Table S2
in supporting material). The strong right-lateralisation of brain activity in response to auditory
footsteps is consistent with the findings that auditory motion-in-depth (looming/receding) is
encoded in the right hemisphere (Baumgart, Gaschler-Markefski, Woldorff, Heinze, & Scheich,
19
1999; Seifritz et al., 2002), in particular in the right Premotor cortex (Schubotz & von Cramon,
2002). Brain activation for the (visual) point-light walker was also right-lateralised, in accordance
with experiments by Pelphrey et al. (2005). Lateralisation of auditory-visual co-activation in the
right ventral intraperietal cortex and Premotor cortex has also been found for random visual and
auditory motion stimuli (Bremmer et al., 2001); the right IPL has been identified as a region of
higher-level visual motion processing (Claeys, Lindsey, De Schutter, & Orban, 2003). In our
experiments, the intact as well as scrambled point-light walkers were embedded in dynamic visual
noise (to ensure comparable difficulty level to the auditory footsteps) which might also contribute
to the lateralisation in the right hemisphere as previously reported (Decety et al., 1997).
Auditory-visual co-activation in the parieto-premotor network
All three cortical ROIs identified as areas of auditory and visual co-activation (Experiment 1;
Table 1; Figure 1) are known to be part of the controversial ‘mirror neurone system’ (Dinstein,
Gardner, Jazayeri, & Heeger, 2008; Dinstein, Thomas, Behrmann, & Heeger, 2008; Rizzolatti &
Craighero, 2004). vPM (Rizolatti et al., 1996; Decety et al., 1997; Iacobini et al., 1999) and IPL
neurones (Buccino et al, 2001) are activated by the passive observation of actions. This parieto-
premotor network (IPL, vPM) is thought to receive input from the MTG/pSTS; pSTS neurones
are selective for biological motion, such as body, hand and lip movements (Barraclough, Xiao,
Baker, Oram, & Perrett, 2005; Puce & Perrett, 2003) and are engaged in the perception of
animacy (Schultz, Friston, O'Doherty, Wolpert, & Frith, 2005). The particular MT region
identified by our conjunction analysis (B39/BA22/BA19) is close to areas engaged in the
processing of body motions (Puce & Perrett, 2003) and is sometimes labelled as pSTS due to
functional similarities with pSTS (Materna, Dicke, & Thier, 2008); in this study we refer to it as
MT region. While all three areas, MT, IPL and vPM play a significant role in passive observation,
20
imitation, and motion imagery (Hamzei et al., 2002), their connectivity is still a matter of debate
(Bien, Roebroeck, Goebel, & Sack, 2009). A simple common framework for action observation
and imitation (Stanley & Miall, 2007) starts with a visual representation of action in the pSTS, an
area which is active during observation but not execution (Barraclough et al., 2005). Visual
information is then passed on to the IPL which codes for the predicted outcome of the action and,
subsequently, the intended action is translated into a motor programme in vPM; an efferent copy
of the planned action then returns to pSTS where it is compared to the original visual
representation. In addition, direct bi-directional connections exist between the MT/pSTS and both
the vPM and IPL (for a review see Pineda, 2008). Our localiser experiment suggests that MT, IPL
and vPM are areas that receive both auditory and visual input. The fourth ROI defined by our
localiser as an area of auditory-visual co-activation is the Cerebellum. The Cerebellum may play a
role in converting the visual representation into a motor codes, the ‘inverse model’ (Miall, 2003;
Stanley & Miall, 2007) by receiving information from the parietal lobe and forwarding it to the
Premotor cortex. The observed auditory-visual co-activation suggests that the involvement of the
Cerebellum in the inverse model may not be restricted to visual representations.
Increased activity for incongruent auditory-visual biological motion signals in vPM
In our main experiment (experiment 2) we compared the brain activation resulting from congruent
(same motion direction in the auditory and visual modality) with the activation resulting from
incongruent motion (different motion direction in the auditory and the visual modality) within the
areas of auditory-visual co-activation (derived in experiment 1). Incongruent auditory-visual
motion resulted in an increased brain activity only when both modalities signal biological motion;
for scrambled visual motion, congruent and incongruent AV motion is associated with the same
brain activations (Figure 2). A significant interaction is found only in one of the four ROIs,
21
namely in the vPM (BA 6). The vPM plays a role not only in visual action observation and
action imagery (Schubotz & von Cramon, 2001) but also responds to auditory actions (Bidet-
Caulet et al., 2005; Kaplan & Iacoboni, 2007; Schubotz & von Cramon, 2002). A common vPM
region is activated by visual motion imagery (Grafton, Arbib, Fadiga, & Rizzolatti, 1996), the
observation of biologically meaningful actions (Bien et al., 2009) and the observation of
meaningless (non-biological) sequences (Schubotz & von Cramon, 2004), consistent with our
findings that both biological and scrambled motion leads to vPM activation (Figure S1 and Table
S2, first row). Schubotz et al (2002, 2004) concluded that the vPM is able to generate short-term
action templates and that the vocabularly of motor acts stored in vPM is flexible and not innate.
In our experiment we find an increased Premotor activity for incongruent biological motion in
comparison to congruent biological motion (Figure 2; Figure S2a,b); this increased Premotor
activity is associated with longer reaction times (Figure 3; Table 3). Increased right PM activity
and associated increased reaction times have also been reported for incongruent visuomotor
conditions (Blakemore & Frith, 2005; Grezes, Armony, Rowe, & Passingham, 2003) and for
directionally imcompatible or antiphase limb movements (de Jong, Leenders, & Paans, 2002;
Wenderoth, Debaere, Sunaert, Hecke, & Swinnen, 2004). Increased right PM activity (Jeannerod,
2001) is therefore likely to reflect conflicting or incompatible signals within or across sensory
modalities as well as incompatible motor patterns. A very recent fMRI study using a entirely
different set of biological motion stimuli (auditory and visual drumming actions) showed similar
locations and patterns of activity changes as a function of expertise (Petrini et al., 2011): in the
right IPL and the right Premotor cortex, incongruent auditory-visual drumming actions leads to an
increase in neural activity, but only in expert drummers as opposed to novices.
22
One possible explanation for the increased Premotor activity for incongruent (i.e. a auditory-visual
discrepancy in motion direction) biological motion, is, in accordance with Schubotz et al. (2004),
the generation of novel motor templates based on the (inconsistent) sensory inputs across the
auditory and visual modalities. Since in this experimental condition, the auditory system signals a
looming walker and the visual system signals a receding walker, no stored amodal action template
provides a match to the bimodal sensory inputs hence necessitating the need for the generation of
novel motor patterns. Congruent biological motion, on the other hand, yields auditory and visual
motion signals that are likely to be matched to a single existing amodal template in the observer’s
motor repertoire, yielding less Premotor activity and shorter reaction times (cf Figures 2 and 3).
This account is consistent with equal vPM activation for both congruent and incongruent
scrambled motion (Suppl. Material S4a,b) since this hypothesis predicts that bimodal scrambled
motion does not result in conflicting motion information in vPM. An alternative explanation is
that the incongruent auditory-visual walker triggers two motor templates, one for a receding
walker (based on the visual input) and one for a looming walker (based on the auditory input).
Either explanation predicts increased activity (in the bimodal motion conditions) in vPM for
incongruent biological motion only.
Activity in vPM is also increased in the unimodal (vision only) condition when the visual point-
light-walker is not intact (scrambled point-light-walker (SCR) versus intact point-light walker
(BIO); Table S1, upper row; (see also Thompson et al., 2005). While neurones in vPM are likely
to respond to the components of the scrambled point-light-walker such as legs, arms etc, the
overall configuration is unlikely to match an existing action template hence generating more
activity in right vPM. Since new scrambled motion was generated on each trial, observers could
not learn specific constellations (see METHODS). The involvement of the vPM in human body
23
processing has been shown using TMS: the body inversion effect is absent when TMS is applied
in this area, hence suggesting that the vPM is involved in configural processing of human body
shapes (Urgesi, Calvo-Merino, Haggard, & Aglioti, 2007). In line with our findings, increased
right-lateralised vPM activity has been reported during the observation of meaningless hand
sequences (Decety et al., 1997; Decety & Grezes, 2006; Grezes, Costes, & Decety, 1999) ;
parietal areas (BA 7) may have a role in selecting and monitoring motion sequences with online
reference to a working memory in the right Premotor cortex (Sadato et al., 1996). The increased
activation of the right vPM in response to scrambled point-light walkers is consistent with the role
of the right parieto-premotor network in the processing of novel and complex visual stimuli
(Schubotz & von Cramon, 2002). Such an increase in stimulus complexity and novelty can be
brought about by conflicting information within or across modalities. This is consistent with the
idea that the right premotor network is not only involved in recognizing meaningful actions
within a single modality, but assimilates the information across the auditory and visual modality
by comparing it with a motor termplate, possible residing in the Premotor area (Sadato, Campbell,
Ibanez, Deiber, & Hallett, 1996; Schwarzbach, Sandrini, & Cattaneo, 2009).
Specialised neural machinery for biological motion?
Numerous studies have shown an increased activity for visual biological motion in pSTS (for a
review see Puce & Perrett, 2003) and also identified pSTS as an area for the integration of auditory
and visual biological motion signals. Our conjunction analysis (Figure 1) did not identify pSTS as
an area of auditory-visual co-activation, but area MT (BA 39, bordering on BA22 and BA 37),
IPL (BA 7) and vPM (BA 6). Within these areas of auditory-visual co-activation, activity for the
intact point-light-walker was less (vPM, IPL) or equal (MT) to the activity in response to the
scrambled walker (Figure S3a,b and Table S1). Equal activation in MT in response to intact and
24
scrambled point-light-walkers has been reported previously (Jastorff & Orban, 2009) and is at
odds with the proposed role of MT for biological motion (e.g. Grossman, Battelli, & Pascual-
Leone, 2005; Grossman et al., 2000). Furthermore, Jastorff & Oban (2009) proposed that the lack
of differential activation for biological vs scrambled motion in pSTS could be associated with task
complexity. This is consistent with the findings by Meyer et al. (2011) who documented a role of
the pSTS in the processing of biological motion stimuli closely matched to the ones used in this
experiment, but crucially employing a one-back task.
Another significant methodological difference between our study and previous studies using PLW
was that we used looming and receding PLWs (instead of a PLW walking on a ‘treadmill’) hence
signalling motion-in-depth which is not a stimulus feature STS is very sensitive to (Perrett,
Harries, Benson, Chitty, & Mistlin, 1990). The task of our observers was to judge whether there
was any motion-in-depth present as opposed to categorising or identifying the biological motion
(Meyer et al.); our task therefore also favours the involvement of the vPM (Kakei, Hoffman, &
Strick, 2001; Ochiai, Mushiake, & Tanji, 2005; Schubotz & von Cramon, 2002). Finally, to equate
the auditory and visual PLWs in difficulty, we added dynamic noise to the visual PLWs which
might also bias the activation towards area MT and the right parieto-Premotor network (Bremmer
et al., 2001; Pelphrey et al., 2005).
The increased activity in the right vPM for scrambled compared to intact point-light walkers is in
line with more recent imaging studies showing increased right-lateralised activity for incoherent vs
coherent action sequences in the right vPM (Bien et al., 2009). A right-lateralised decrease in
neural activity when novel stimuli become more familiar via training or prolonged observation
(Downar, Crawley, Mikulis, & Davis, 2002; Vogt et al., 2007) is consistent with the idea that
25
learned meaningless movements generate less cortical activity than unlearned meaningless
sequences since the neural population that represents the familiar stimuli have become more
selective during learning. Biological motion stimuli are special configurations of highly familiar
local limb movements; while numerous neurones are likely to respond to individual limb
movements (such as contained in a scrambled PLW), a small population of neurones is likely to
respond to the particular configuration of limb movements depicted in an intact PLW.
Our current findings are consistent with the idea that the right vPM is involved in the processing
of body movements by comparing sensorimotor representations of familiar body movements with
incoming sensory input. It extends our current knowledge by suggesting that vPM is also
involved in the integration of sensory inputs across the auditory and visual modality and compares
information across modalities with an amodal template, possibly residing in the Premotor area
(Sadato et al., 1996; Schwarzbach et al., 2009).
Previous studies identified both ventral Premotor areas, BA6, a homolog to monkey F4, and
BA 44 which is assumed to be a homolog to monkey F5, as areas activated by hand or arm
movements (for a review see Rizzolatti, Fogassi, & Gallese, 2002). In particular, there is evidence
that the vPM contains also motor-related presentations of space, in relation to one’s own body.
Makin et al. (2007) showed that vPM plays a role in representing perihand space; this study is
also consistent with the Premotor cortex as a site of sensory convergence, since strong PMv
activation required concurrent visual and tactile stimulation. Our own data show that vPM (border
of BA6 and BA44) is activated by a walker which is approaching or receding in relation to the
participant; whether the motion is defined by auditory or visual stimulation is irrelevant (see Table
S1 in the supporting material). Hence, an alternative interpretation of our data is that vPM is
encoding information about the closeness of objects/individuals in relation to one’s body, instead
26
of containing general motor templates as outlined above. In either case, vPM is a site which
contains both visual and auditory representations of moving stimuli and is involved in the
consolidation of these representations.
Acknowledgements
SMW’s stay at the University of Regensburg (in Professor Greenlee’s laboratory) was supported
by a Wellcome Trust Sabbatical Grant (GR/082831). The ViSaGe system was co-sponsored by
Cambridge Research Systems Ltd, Kent and the Wellcome Trust (GR/080205). Scanning costs
were covered by the Faculty of Medicine at the University of Liverpool. We thank Ingo Keck for
helpful comments on the manuscript.
References
Arrighi, R., Alais, D., & Burr, D. (2006). Perceptual synchrony of audiovisual streams for natural
and artificial motion sequences. Journal of Vision, 6(3), 260-268.
Arrighi, R., Marini, F., & Burr, D. (2009). Meaningful auditory information enhances perception
of visual biological motion. Journal of Vision, 9(4), 1-7.
Barraclough, N. E., Xiao, D., Baker, C. I., Oram, M. W., & Perrett, D. I. (2005). Integration of
Visual and Auditory Information by Superior Temporal Sulcus Neurons Responsive to the
Sight of Actions. Journal of Cognitive Neuroscience, 17(3), 377-391.
Baumann, O., & Greenlee, M. W. (2007). Neural Correlates of Coherent Audiovisual Motion
Perception. Cereb. Cortex, 17(6), 1433-1443.
Baumgart, F., Gaschler-Markefski, B., Woldorff, M. G., Heinze, H.-J., & Scheich, H. (1999). A
movement-sensitive area in auditory cortex. Nature, 400(6746), 724-726.
Bidet-Caulet, A., Voisin, J., Bertrand, O., & Fonlupt, P. (2005). Listening to a walking human
activates the temporal biological motion area. NeuroImage, 28(1), 132.
Bien, N., Roebroeck, A., Goebel, R., & Sack, A. T. (2009). The Brain's Intention to Imitate: The
Neurobiology of Intentional versus Automatic Imitation. Cereb. Cortex, bhn251.
Blake, R., & Shiffrar, M. (2007). Perception of Human Motion. Annual Review of Psychology,
58(1), 47-73.
Blakemore, S. J., & Frith, C. (2005). The role of motor contagion in the prediction of action.
Neuropsychologia, 43, 260 - 267.
Bonda, E., Petrides, M., Ostry, D., & Evans, A. (1996). Specific involvement of human parietal
systems and the amygdala in the perception of biological motion. Journal of Neuroscience,
16(11), 3737.
27
Bonini, L., Rozzi, S., Serventi, F. U., Simone, L., Ferrari, P. F., & Fogassi, L. (2010). Ventral
premotor and inferior parietal cortices make distinct contribution to action organization and
intention understanding. Cerebral Cortex, 2010(6), 1372.
Bremmer, F., Schlack, A., Shah, N. J., Zafiris, O., Kubischik, M., Hoffmann, K., et al. (2001).
Polymodal motion processing in posterior parietal and premotor cortex: a human fMRI
study strongly implies equivalencies between humans and monkeys. Neuron, 29(1), 287-
296.
Brett, M., Anton, J.-L., Valabregue, R., & Poline, J. B. (2002). Region of interest analysis using an
SPM toolbox Paper presented at the 8th International Conference on Functional Mapping
of the Human Brain,, Sendai, Japan.
Brooks, A., van der Zwan, R., Billard, A., Petreska, B., Clarke, S., & Blanke, O. (2007). Auditory
motion affects visual biological motion processing. Neuropsychologia, 45(3), 523-530.
Buch, E. R., Mars, R. B., Boorman, E. D., & Rushworth, M. F. S. (2010). A network centered on
ventral premotor cortex exerts both facilitatory and inhibitory control over primary motor
cortex during action reprogramming. The Journal of Neuroscience, 30(4), 1395.
Calvo-Merino, B., Glaser, D. E., Grezes, J., Passingham, R. E., & Haggard, P. (2005). Action
observation and acquired motor skills: an FMRI study with expert dancers. Cereb Cortex,
15, 1243 - 1249.
Claeys, K. G., Lindsey, D. T., De Schutter, E., & Orban, G. A. (2003). A higher order motion
region in human inferior parietal lobule: Evidence from fMRI. Neuron, 40(3), 631-642.
de Jong, B. M., Leenders, K. L., & Paans, A. M. J. (2002). Right Parieto-premotor Activation
Related to Limb-independent Antiphase Movement. Cereb. Cortex, 12(11), 1213-1217.
Decety, J., Grezes, J., Costes, N., Perani, D., Jeannerod, M., Procyk, E., et al. (1997). Brain
activity during observation of actions. Influence of action content and subject's strategy.
Brain, 120(10), 1763-1777.
Decety, J., & Grezes, J. (2006). The power of simulation: imagining one's own and other's
behavior. Brain Res, 1079, 4 - 14.
Dinstein, I., Gardner, J. L., Jazayeri, M., & Heeger, D. J. (2008). Executed and observed
movements have different distributed representations in human aIPS. J Neurosci, 28(44),
11231-11239.
Dinstein, I., Thomas, C., Behrmann, M., & Heeger, D. J. (2008). A mirror up to nature. Current
Biology, 18(1), R13-R18.
Downar, J., Crawley, A. P., Mikulis, D. J., & Davis, K. D. (2002). A Cortical Network Sensitive to
Stimulus Salience in a Neutral Behavioral Context Across Multiple Sensory Modalities. J
Neurophysiol, 87(1), 615-620.
Eickhoff, S. B., Stephan, K. E., Mohlberg, H., Grefkes, C., Fink, G. R., Amunts, K., et al. (2005).
A new SPM toolbox for combining probabilistic cytoarchitectonic maps and functional
imaging data. NeuroImage, 25(4), 1325-1335.
Friston, K. J., Penny, W. D., & Glaser, D. E. (2005). Conjunction revisited. NeuroImage, 25(3),
661-667.
Grafton, S. T., Arbib, M. A., Fadiga, L., & Rizzolatti, G. (1996). Localization of grasp
representations in humans by positron emission tomography. Experimental Brain
Research, 112(1), 103-111.
Grezes, J. (2001). Does perception of biological motion rely on specific brain regions?
NeuroImage, 13, 775-785.
Grezes, J., Armony, J. L., Rowe, J., & Passingham, R. E. (2003). Activations related to "mirror"
and "canonical" neurones in the human brain: an fMRI study. NeuroImage, 18, 928 - 937.
28
Grezes, J., Costes, N., & Decety, J. (1999). The effects of learning and intention on the neural
network involved in the perception of meaningless actions. Brain, 122(10), 1875-1887.
Grossman, E. D., Battelli, L., & Pascual-Leone, A. (2005). Repetitive TMS over STSp disrupts
perception of biological motion. Vis. Res., 45, 2847.
Grossman, E. D., & Blake, R. (2001). Brain activity evoked by inverted and imagined biological
motion. Vision Research, 41(10-11), 1475.
Grossman, E. D., & Blake, R. (2002). Brain Areas Active during Visual Perception of Biological
Motion. Neuron, 35(6), 1167.
Grossman, E. D., Donnelly, M., Price, R., Pickens, D., Morgna, V., Neighbour, G., et al. (2000).
Brain Areas involved in the perception of biological motion. Journal of Cognitive
Neuroscience, 12, 711-720.
Hamzei, F., Dettmers, C., Rijntjes, M., Glauche, V., Kiebel, S., Weber, B., et al. (2002).
Visuomotor control within a distributed parieto-frontal network. Experimental Brain
Research, 146(3), 273-281.
Harrison, N. R., Wuerger, S. M., & Meyer, G. F. (2010). Reaction time facilitation for horizontally
moving auditory–visual stimuli. Journal of Vision, 10(14), 1-21.
Howard, R. J., Brammer, M., Wright, I., Woodruff, P. W., Bullmore, E. T., & Zeki, S. (1996). A
direct demonstration of functional specialization within motion- related visual and auditory
cortex of the human brain. Current Biology, 6(8), 1015.
Jastorff, J., Begliomini, C., Fabbri-Destro, M., Rizzolatti, G., & Orban, G. A. (2010). Coding
observed motor acts: different organizational principles in the parietal and premotor cortex
of humans. Journal of Neurophysiology, 104(1), 128.
Jastorff, J., & Orban, G. A. (2009). Human Functional Magnetic Resonance Imaging Reveals
Separation and Integration of Shape and Motion Cues in Biological Motion Processing.
The Journal of Neuroscience, 29(22), 7315-7329.
Jeannerod, M. (2001). Neural Simulation of Action: A Unifying Mechanism for Motor Cognition.
NeuroImage, 14(1), S103-S109.
Johansson, G. (1973). Visual perception of biological motion and a model for its analysis.
Perception and Psychophysics, 14, 201-211.
Kakei, S., Hoffman, D. S., & Strick, P. L. (2001). Direction of action is represented in the ventral
premotor cortex. Nat Neurosci, 4, 1020 - 1025.
Kaplan, J., & Iacoboni, M. (2007). Multimodal action representation in human left ventral
premotor cortex. Cognitive Processing, 8(2), 103-113.
Makin, T. R., Holmes, N. P., & Zohary, E. (2007). Is That Near My Hand? Multisensory
Representation of Peripersonal Space in Human Intraparietal Sulcus. The Journal of
Neuroscience, 27(4), 731-740.
Maldjian, J. A., Laurienti, P. J., Kraft, R. A., & Burdette, J. H. (2003). An automated method for
neuroanatomic and cytoarchitectonic atlas-based interrogation of fMRI data sets.
NeuroImage, 19(3), 1233-1239.
Materna, S., Dicke, P. W., & Thier, P. (2008). Dissociable roles of the superior temporal sulcus
and the intraparietal sulcus in joint attention: A functional magnetic resonance imaging
study. J. Cognitive Neuroscience, 20(1), 108-119.
Meyer, G., Crocker-Buque, A., & Wuerger, S. (2007 ). Auditory-visual integration of biological
motion. Perception Supplement, 36, 171.
Meyer, G., & Wuerger, S. (2001). Cross-modal integration of auditory and visual motion signals.
NeuroReport, 12(11), 2557-2600.
29
Meyer, G., Wuerger, S., Roehrbein, F., & Zetzsche, C. (2005). Low-level integration of auditory
and visual motion signals requires spatial co-localisation. Experimental Brain Research,
166 (3 ), 538-547
Meyer, G. F., Greenlee, M., & Wuerger, S. (2011). Interactions between Auditory and Visual
Semantic Stimulus Classes: Evidence for Common Processing Networks for Speech and
Body Actions. Journal of Cognitive Neuroscience, 23(9), 2271-2288.
Miall, R. C. (2003). Connecting mirror neurons and forward models. Neuroreport, 14, 2135-2137.
Ochiai, T., Mushiake, H., & Tanji, J. (2005). Involvement of the Ventral Premotor Cortex in
Controlling Image Motion of the Hand During Performance of a Target-capturing Task.
Cereb. Cortex, 15(7), 929-937.
Pelphrey, K. A., Mitchell, T. V., McKeown, M. J., Goldstein, J., Allison, T., & McCarthy, G.
(2003). Brain Activity Evoked by the Perception of Human Walking: Controlling for
Meaningful Coherent Motion. J. Neurosci., 23(17), 6819-6825.
Pelphrey, K. A., Morris, J. P., Michelich, C. R., Allison, T., & McCarthy, G. (2005). Functional
anatomy of biological motion perception in posterior temporal cortex: An fMRI study of
eye, mouth and hand movements. Cerebral Cortex, 15(12), 1866.
Perrett, D. I., Harries, M. H., Benson, P. J., Chitty, A. J., & Mistlin, A. J. (1990). Retrieval of
structure from rigid and biological motion: an analysis of the visual responses of neurones
in the macaque temporal cortex. In A. Blake & T. Troscianko (Eds.), AI and the Eye (pp.
pp. 181-200): John Wiley & Sons Ltd.
Petrini, K., Pollick, F. E., Dahl, S., McAleer, P., McKay, L., Rocchesso, D., et al. (2011). Action
expertise reduces brain activity for audiovisual matching actions: An fMRI study with
expert drummers. NeuroImage, 56(3), 1480-1492.
Pilgramm, S., Lorey, B., Stark, R., Munzert, J., Vaitl, D., & Zentgraf, K. (2010). Differential
activation of the lateral premotor cortex during action observation. BMC Neuroscience,
11(1), 89.
Pineda, J. (2008). Sensorimotor cortex as a critical component of an 'extended' mirror neuron
system: Does it solve the development, correspondence, and control problems in
mirroring? Behavioral and Brain Functions, 4(1), 47.
Puce, A., & Perrett, D. (2003). Electrophysiology and brain imaging of biological motion. Philos
Trans R Soc Lond B Biol Sci, 358, 435 - 445.
Rizzolatti, G., & Craighero, L. (2004). The mirror-neuron system. Annual Review of Neuroscience,
27, 169-192.
Rizzolatti, G., Fogassi, L., & Gallese, V. (2002). Motor and cognitive functions of the ventral
premotor cortex. Current Opinion in Neurobiology, 12(2), 149-154.
Sadato, N., Campbell, G., Ibanez, V., Deiber, M., & Hallett, M. (1996). Complexity affects
regional cerebral blood flow change during sequential finger movements. J. Neurosci.,
16(8), 2691-2700.
Saygin, A. P. (2007). Superior temporal and premotor brain areas necessary for biological motion
perception. Brain, 130(9), 2452-2461.
Saygin, A. P., Driver, J., & de Sa, V. R. (2008). In the Footsteps of Biological Motion and
Multisensory Perception: Judgments of Audiovisual Temporal Relations Are Enhanced for
Upright Walkers. Psychological Science, 19(5), 469-475.
Saygin, A. P., Wilson, S. M., Hagler, D. J., Jr., Bates, E., & Sereno, M. I. (2004). Point-Light
Biological Motion Perception Activates Human Premotor Cortex. J. Neurosci., 24(27),
6181-6188.
30
Schouten, B., Troje, N. F., Vroomen, J., & Verfaillie, K. (2011). The Effect of Looming and
Receding Sounds on the Perceived In-Depth Orientation of Depth-Ambiguous Biological
Motion Figures. PloS one, 6(2), e14725.
Schubotz, R. I., & von Cramon, D. Y. (2001). Functional organization of the lateral premotor
cortex: fMRI reveals different regions activated by anticipation of object properties,
location and speed. Cognitive Brain Research, 11(1), 97-112.
Schubotz, R. I., & von Cramon, D. Y. (2002). Predicting Perceptual Events Activates
Corresponding Motor Schemes in Lateral Premotor Cortex: An fMRI Study. NeuroImage,
15(4), 787-796.
Schubotz, R. I., & von Cramon, D. Y. (2004). Sequences of Abstract Nonbiological Stimuli Share
Ventral Premotor Cortex with Action Observation and Imagery. J. Neurosci., 24(24), 5467-
5474.
Schultz, J., Friston, K. J., O'Doherty, J., Wolpert, D. M., & Frith, C. D. (2005). Activation in
Posterior Superior Temporal Sulcus Parallels Parameter Inducing the Percept of Animacy.
Neuron, 45(4), 625-635.
Schwarzbach, J. V., Sandrini, M., & Cattaneo, L. (2009). Neural populations in the parietal and
premotor cortices of humans perform abstract coding of motor acts: a TMS-adaptation
study. Paper presented at the ECVP Abstract Supplement Regensburg.
Seifritz, E., Neuhoff, J. G., Bilecen, D., Scheffler, K., Mustovic, H., Schächinger, H., et al. (2002).
Neural Processing of Auditory Looming in the Human Brain. Current Biology, 12(24),
2147.
Servos, P., Osu, R., Santi, A., & Kawato, M. (2002). The neural substrates of biological motion
perception: An fMRI study. Cerebral Cortex, 12(7), 772.
Stanley, J., & Miall, R. C. (2007). Functional activation in parieto-premotor and visual areas
dependent on congruency between hand movement and visual stimuli during motor-visual
priming. NeuroImage, 34(1), 290-299.
Szycik, G. R., Tausche, P., & Münte, T. F. (2008). A novel approach to study audiovisual
integration in speech perception: Localizer fMRI and sparse sampling. Brain Research,
1220, 142-149.
Thompson, J. C., Clarke, M., Stewart, T., & Puce, A. (2005). Configural Processing of Biological
Motion in Human Superior Temporal Sulcus. J. Neurosci., 25(39), 9059-9066.
Urgesi, C., Calvo-Merino, B., Haggard, P., & Aglioti, S. M. (2007). Transcranial Magnetic
Stimulation Reveals Two Cortical Pathways for Visual Body Processing. J. Neurosci.,
27(30), 8023-8030.
Vaina, L. M., Solomon, J., Chowdhury, S., Sinha, P., & Belliveau, J. W. (2001). Functional
neuroanatomy of biological motion perception in humans. Proceedings of the National
Academy of Sciences of the United States of America, 98(20), 11656-11661.
Van Essen, D. C. (2005). A Population-Average, Landmark- and Surface-based (PALS) atlas of
human cerebral cortex. NeuroImage, 28(3), 635-662.
Van Essen, D. C., Drury, H. A., Dickson, J., Harwell, J., Hanlon, D., & Anderson, C. H. (2001).
An Integrated Software Suite for Surface-based Analyses of Cerebral Cortex. J Am Med
Inform Assoc, 8(5), 443-459.
Vanrie, J., & Verfaillie, K. (2006). Perceiving depth in point-light actions. Attention, Perception,
& Psychophysics, 68(4), 601-612.
Vogt, S., Buccino, G., Wohlschläger, A. M., Canessa, N., Shah, N. J., Zilles, K., et al. (2007).
Prefrontal involvement in imitation learning of hand actions: Effects of practice and
expertise. NeuroImage, 37(4), 1371-1383.
31
Wenderoth, N., Debaere, F., Sunaert, S., Hecke, P. v., & Swinnen, S. P. (2004). Parieto-premotor
Areas Mediate Directional Interference During Bimanual Movements. Cereb. Cortex,
14(10), 1153-1163.
Wuerger, S. M., Hofbauer, M., & Meyer, G. F. (2003). The integration of auditory and visual
motion signals at threshold. Perception & Psychophysics, 65(8), 1188-1196.
Wuerger, S. M., A. Crocker-Buque & Meyer, G.F. (2011). Evidence for auditory-visual processing
specific to biological motion. Seeing and Perceiving (in press).
32
Tables
Table 1
Conjunction analysis revealing activations common to the auditory and the visual modality (Exp 1)
Location Localiser Position
(MNI)
Voxels T Z pFWE
Frontal Lobe
BA6 R Premotor (vPM) A ∩ VBIO 56 6 40 152 3.74 5.53 0.002
BA6 /44 R Premotor (vPM) A ∩ VSCR 48 4 32
48 0 42
521 4.89
4.20
7.0
6.12
<0.001
<0.001
Parietal Lobe
BA7 R
Inferior Parietal
Lobule
(hIP3: 40%;
SPL(7PC): 30%;
SPL (7A): 20% )
A ∩ VBIO 32 -52 52
36 -44 54
207 4.46
3.74
6.46
5.53
<0.001
0.002
BA7 R
Inferior Parietal
Lobule
(hIP3: 30%; SPL
(7PC): 30%; hIP1:
10%)
A ∩ VSCR 32 -50 50
40 -40 52
282 4.66
3.68
6.70
5.45
<0.001
0.002
Temporal Lobe
BA39 R Middle Temporal A ∩ VBIO 54 -54 6 10 3.33 5.00 0.020
BA39 R Middle Temporal A ∩ VSCR 54 -54 6 7 3.27 4.92 0.029
L Cerebellum A ∩ VBIO -32 -70 -20 47 3.54 5.28 0.006
L Cerebellum A ∩ VSCR -30 -74 -20 12 3.21 4.85 0.040
Table 1: The conjunction analysis revealed four areas of auditory-visual co-activation (family-wise error <
0.05). ‘A ∩ VBIO’ refers to the conjunction between the brain activations in response to auditory footsteps (A)
and the brain activations in response to the visual point-light-walker (VBIO); ‘A ∩ VSCR’ refers to the
conjunction analysis based on auditory footsteps and the scrambled point-light walker (VSCR). The
conjunction analysis was performed using SPM5. For anatomical labelling of Premotor cortex, the border
between dorsal and ventral Premotor cortex was assumed at a Z level of 50 in Tailarach coordinates (Rizzolatti
& Craighero, 2004); we converted the Tailarach coordinates into MNI coordinates for our analysis.
33
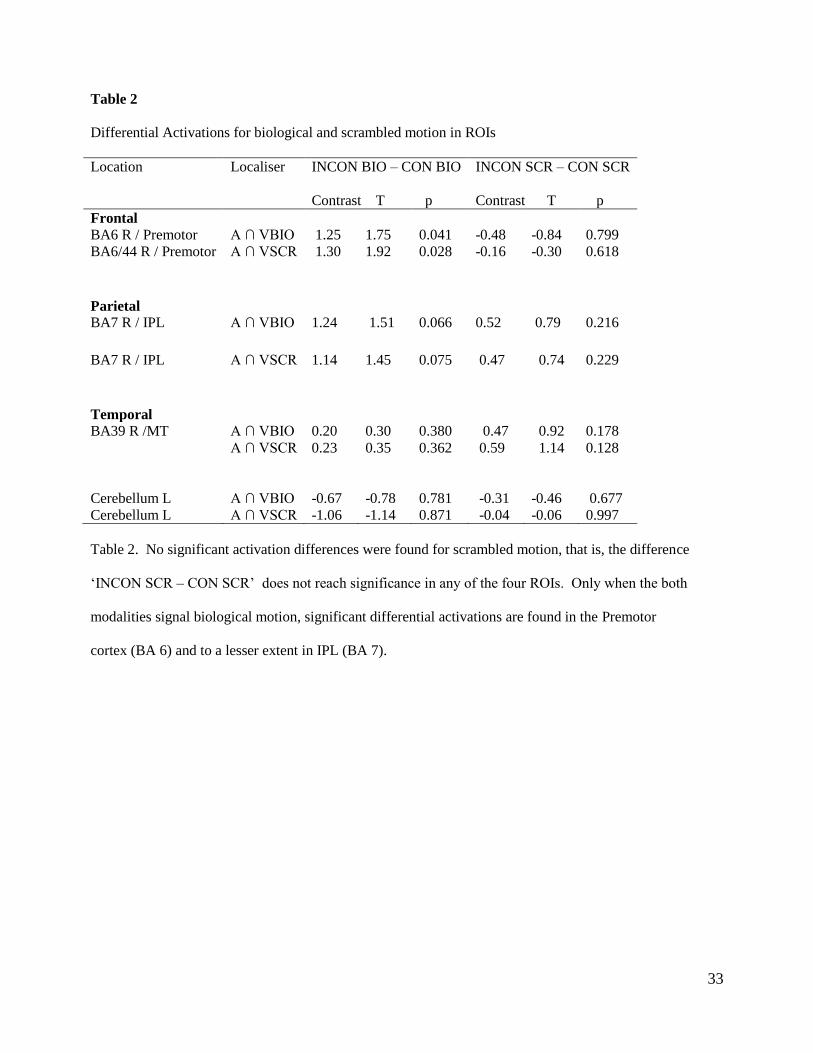
Table 2
Differential Activations for biological and scrambled motion in ROIs
Location Localiser INCON BIO – CON BIO INCON SCR – CON SCR
Contrast T p Contrast T p
Frontal
BA6 R / Premotor A ∩ VBIO 1.25 1.75 0.041 -0.48 -0.84 0.799
BA6/44 R / Premotor A ∩ VSCR 1.30 1.92 0.028 -0.16 -0.30 0.618
Parietal
BA7 R / IPL
A ∩ VBIO 1.24 1.51 0.066 0.52 0.79 0.216
BA7 R / IPL
A ∩ VSCR 1.14 1.45 0.075 0.47 0.74 0.229
Temporal
BA39 R /MT
A ∩ VBIO 0.20 0.30 0.380 0.47 0.92 0.178
A ∩ VSCR 0.23 0.35 0.362 0.59 1.14 0.128
Cerebellum L A ∩ VBIO -0.67 -0.78 0.781 -0.31 -0.46 0.677
Cerebellum L A ∩ VSCR -1.06 -1.14 0.871 -0.04 -0.06 0.997
Table 2. No significant activation differences were found for scrambled motion, that is, the difference
‘INCON SCR – CON SCR’ does not reach significance in any of the four ROIs. Only when the both
modalities signal biological motion, significant differential activations are found in the Premotor
cortex (BA 6) and to a lesser extent in IPL (BA 7).
34
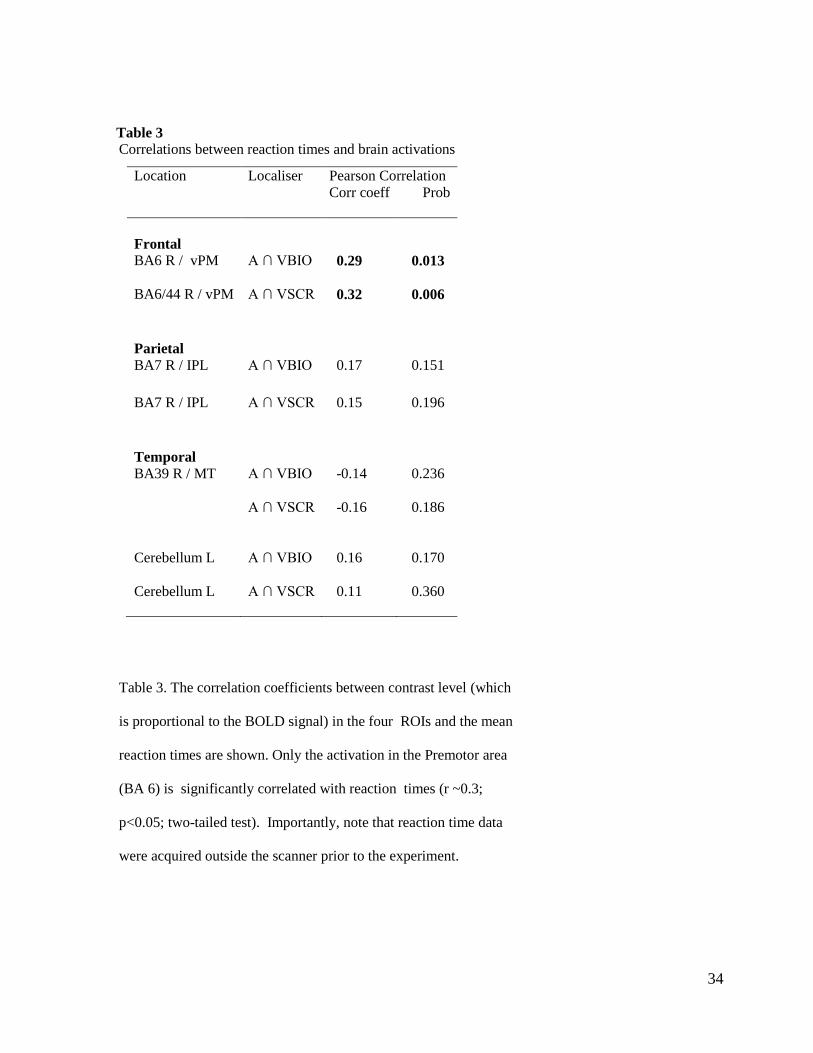
Table 3
Correlations between reaction times and brain activations
Table 3. The correlation coefficients between contrast level (which
is proportional to the BOLD signal) in the four ROIs and the mean
reaction times are shown. Only the activation in the Premotor area
(BA 6) is significantly correlated with reaction times (r ~0.3;
p<0.05; two-tailed test). Importantly, note that reaction time data
were acquired outside the scanner prior to the experiment.
Location Localiser Pearson Correlation
Corr coeff Prob
Frontal
BA6 R / vPM A ∩ VBIO 0.29
0.013
BA6/44 R / vPM A ∩ VSCR 0.32 0.006
Parietal
BA7 R / IPL
A ∩ VBIO 0.17
0.151
BA7 R / IPL
A ∩ VSCR 0.15
0.196
Temporal
BA39 R / MT
A ∩ VBIO -0.14
0.236
A ∩ VSCR -0.16 0.186
Cerebellum L A ∩ VBIO 0.16
0.170
Cerebellum L A ∩ VSCR 0.11
0.360
35
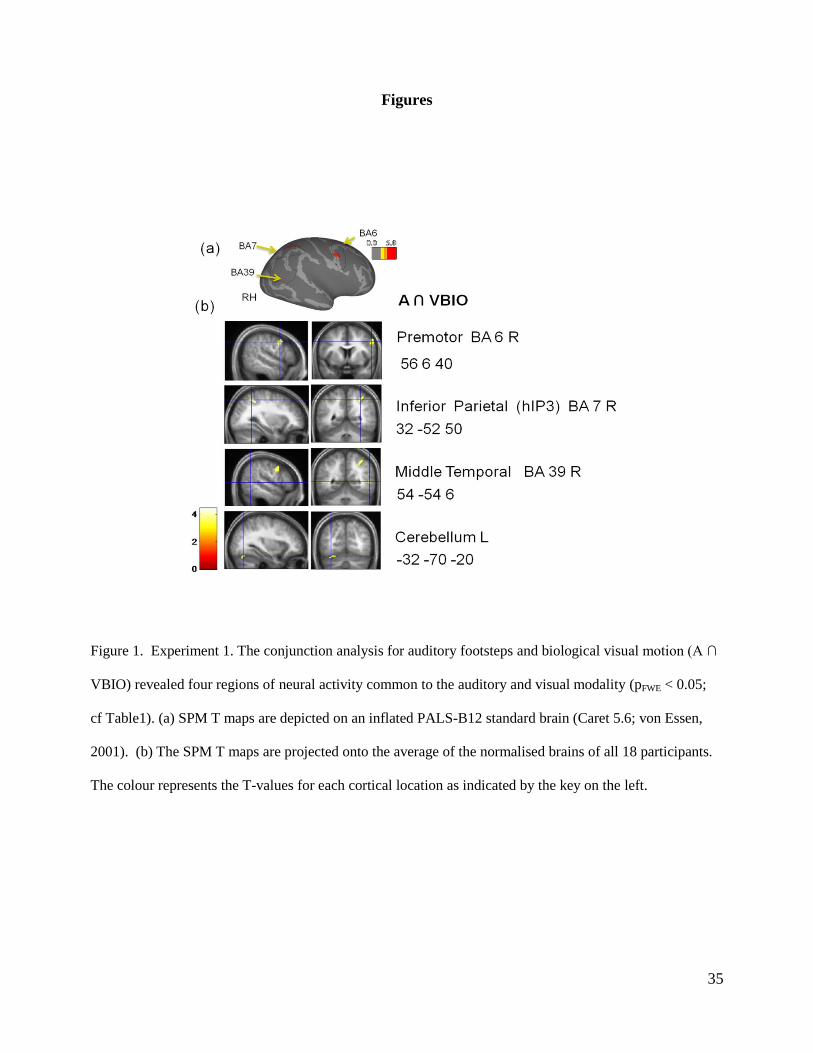
Figures
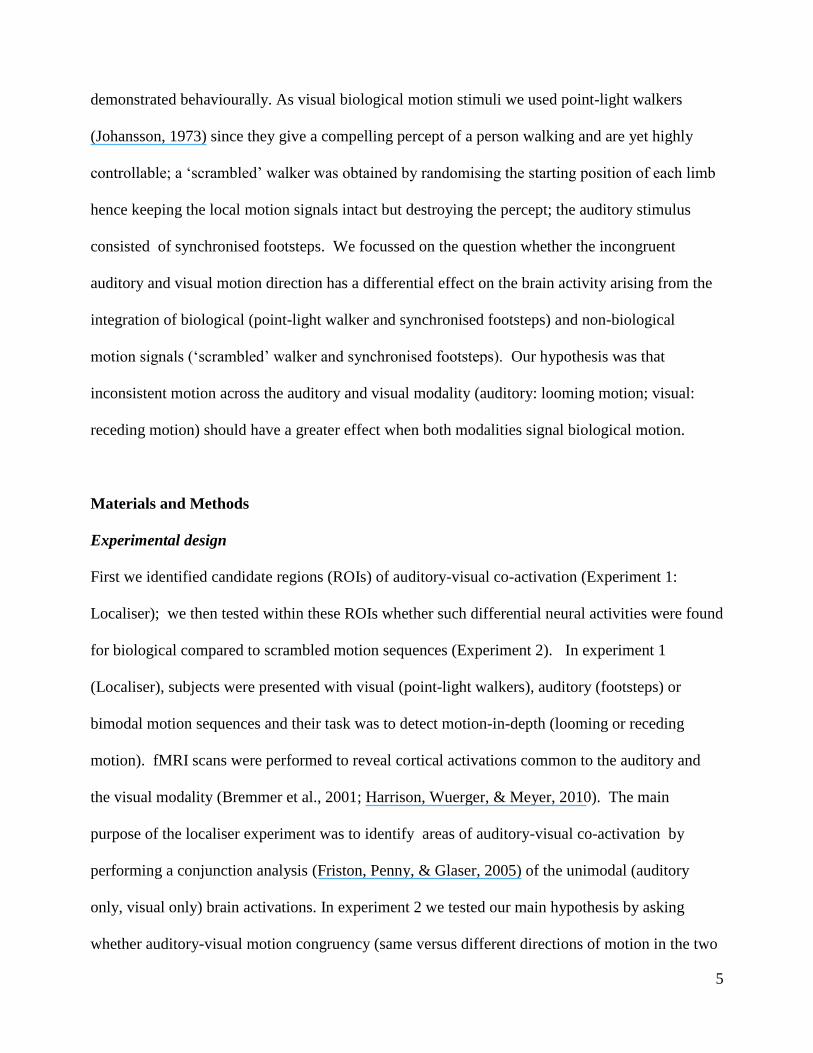
Figure 1. Experiment 1. The conjunction analysis for auditory footsteps and biological visual motion (A ∩
VBIO) revealed four regions of neural activity common to the auditory and visual modality (pFWE < 0.05;
cf Table1). (a) SPM T maps are depicted on an inflated PALS-B12 standard brain (Caret 5.6; von Essen,
2001). (b) The SPM T maps are projected onto the average of the normalised brains of all 18 participants.
The colour represents the T-values for each cortical location as indicated by the key on the left.
36
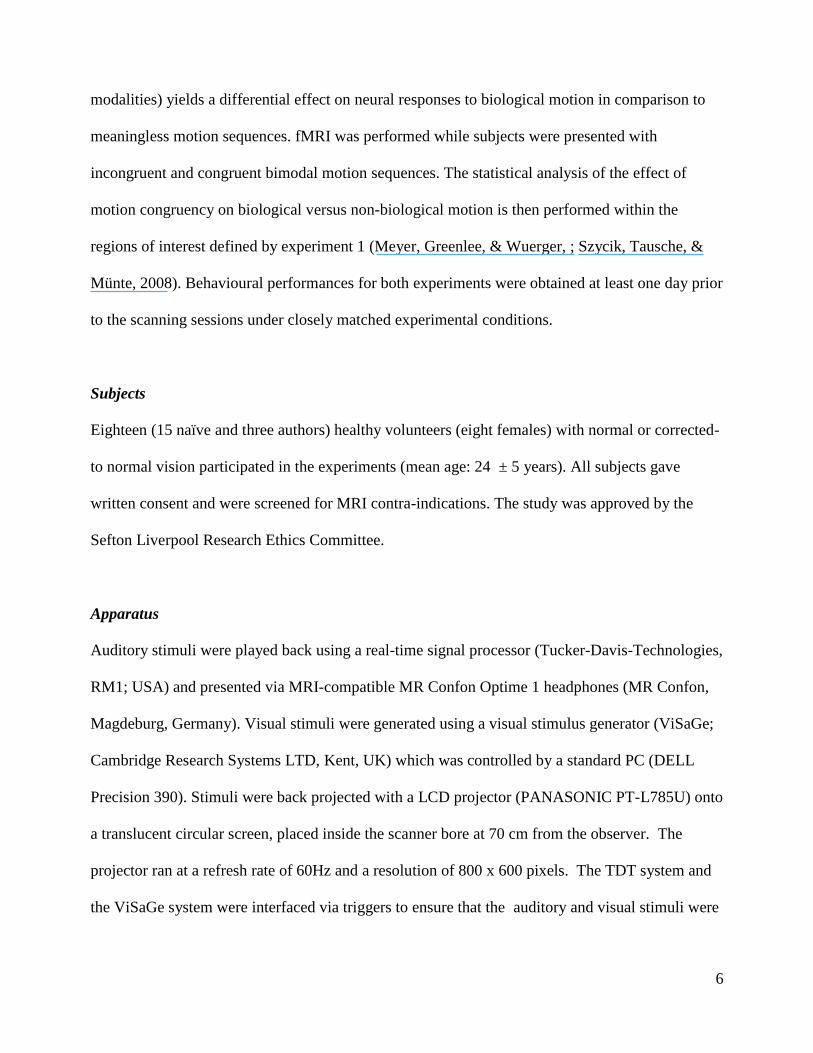
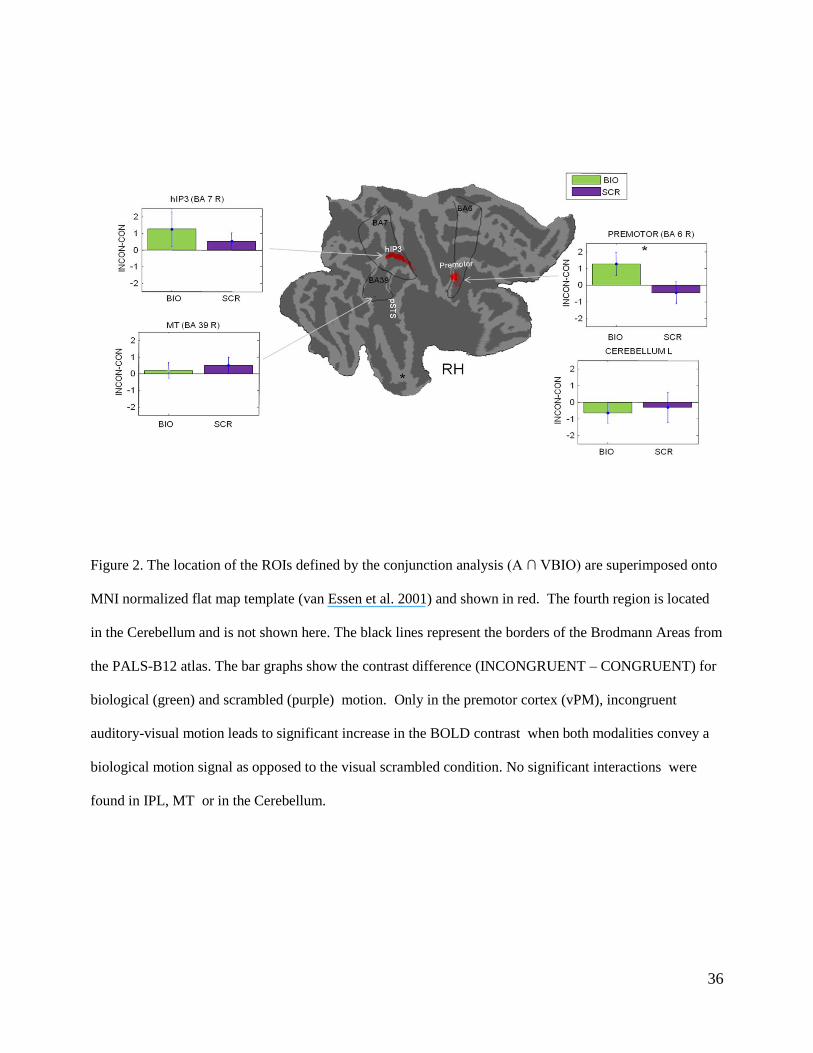
Figure 2. The location of the ROIs defined by the conjunction analysis (A ∩ VBIO) are superimposed onto
MNI normalized flat map template (van Essen et al. 2001) and shown in red. The fourth region is located
in the Cerebellum and is not shown here. The black lines represent the borders of the Brodmann Areas from
the PALS-B12 atlas. The bar graphs show the contrast difference (INCONGRUENT – CONGRUENT) for
biological (green) and scrambled (purple) motion. Only in the premotor cortex (vPM), incongruent
auditory-visual motion leads to significant increase in the BOLD contrast when both modalities convey a
biological motion signal as opposed to the visual scrambled condition. No significant interactions were
found in IPL, MT or in the Cerebellum.
37
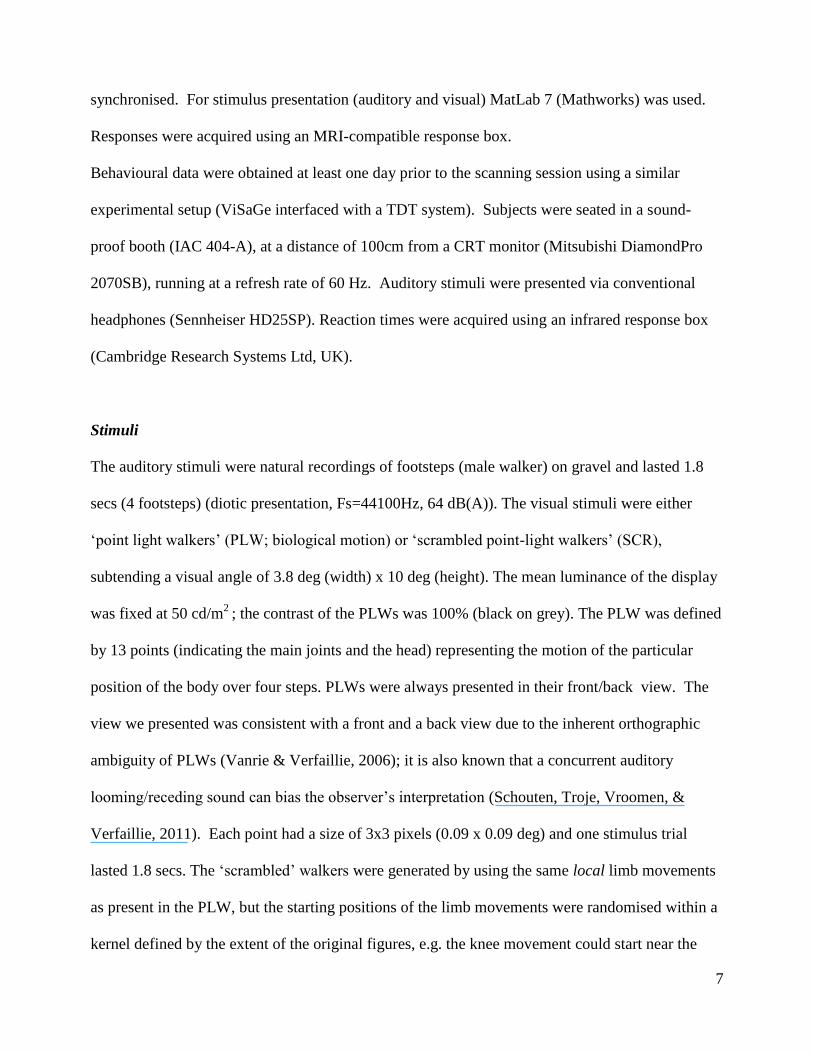
Figure 3. Behavioural data. Reaction time differences (incongruent AV – congruent AV motion) are
plotted for biological and scrambled motion signals. Incongruency of auditory and visual motion signals
has an effect only when the audio-visual sequences depict biological motion; for scrambled motion no
significant difference is observed between the incongruent and congruent condition. Error bars indicate
standard errors of the mean.

38
Supporting Material: Tables
39
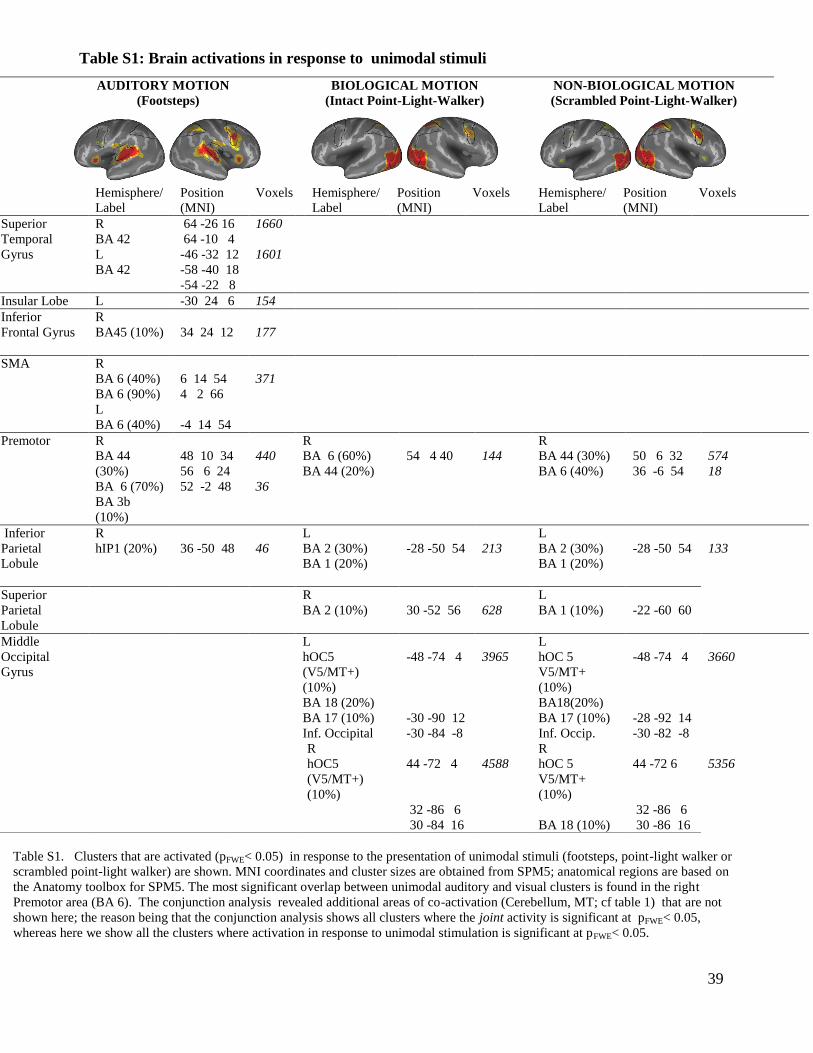
Table S1: Brain activations in response to unimodal stimuli
Table S1. Clusters that are activated (pFWE< 0.05) in response to the presentation of unimodal stimuli (footsteps, point-light walker or
scrambled point-light walker) are shown. MNI coordinates and cluster sizes are obtained from SPM5; anatomical regions are based on
the Anatomy toolbox for SPM5. The most significant overlap between unimodal auditory and visual clusters is found in the right
Premotor area (BA 6). The conjunction analysis revealed additional areas of co-activation (Cerebellum, MT; cf table 1) that are not
shown here; the reason being that the conjunction analysis shows all clusters where the joint activity is significant at pFWE< 0.05,
whereas here we show all the clusters where activation in response to unimodal stimulation is significant at pFWE< 0.05.
AUDITORY MOTION
(Footsteps)
BIOLOGICAL MOTION
(Intact Point-Light-Walker)
NON-BIOLOGICAL MOTION
(Scrambled Point-Light-Walker)
Hemisphere/
Label
Position
(MNI)
Voxels Hemisphere/
Label
Position
(MNI)
Voxels Hemisphere/
Label
Position
(MNI)
Voxels
Superior
Temporal
Gyrus
R
BA 42
64 -26 16
64 -10 4
1660
L
BA 42
-46 -32 12
-58 -40 18
-54 -22 8
1601
Insular Lobe L -30 24 6 154
Inferior
Frontal Gyrus
R
BA45 (10%)
34 24 12
177
SMA
R
BA 6 (40%)
BA 6 (90%)
6 14 54
4 2 66
371
L
BA 6 (40%)
-4 14 54
Premotor R
BA 44
(30%)
BA 6 (70%)
BA 3b
(10%)
48 10 34
56 6 24
52 -2 48
440
36
R
BA 6 (60%)
BA 44 (20%)
54 4 40
144
R
BA 44 (30%)
BA 6 (40%)
50 6 32
36 -6 54
574
18
Inferior
Parietal
Lobule
R
hIP1 (20%)
36 -50 48
46
L
BA 2 (30%)
BA 1 (20%)
-28 -50 54
213
L
BA 2 (30%)
BA 1 (20%)
-28 -50 54
133
Superior
Parietal
Lobule
R
BA 2 (10%)
30 -52 56
628
L
BA 1 (10%)
-22 -60 60
Middle
Occipital
Gyrus
L
hOC5
(V5/MT+)
(10%)
BA 18 (20%)
BA 17 (10%)
Inf. Occipital
-48 -74 4
-30 -90 12
-30 -84 -8
3965
L
hOC 5
V5/MT+
(10%)
-48 -74 4
3660
BA18(20%)
BA 17 (10%)
-28 -92 14
Inf. Occip. -30 -82 -8
R
hOC5
(V5/MT+)
(10%)
44 -72 4
4588
R
hOC 5
V5/MT+
(10%)
44 -72 6
5356
32 -86 6 32 -86 6
30 -84 16 BA 18 (10%) 30 -86 16
40
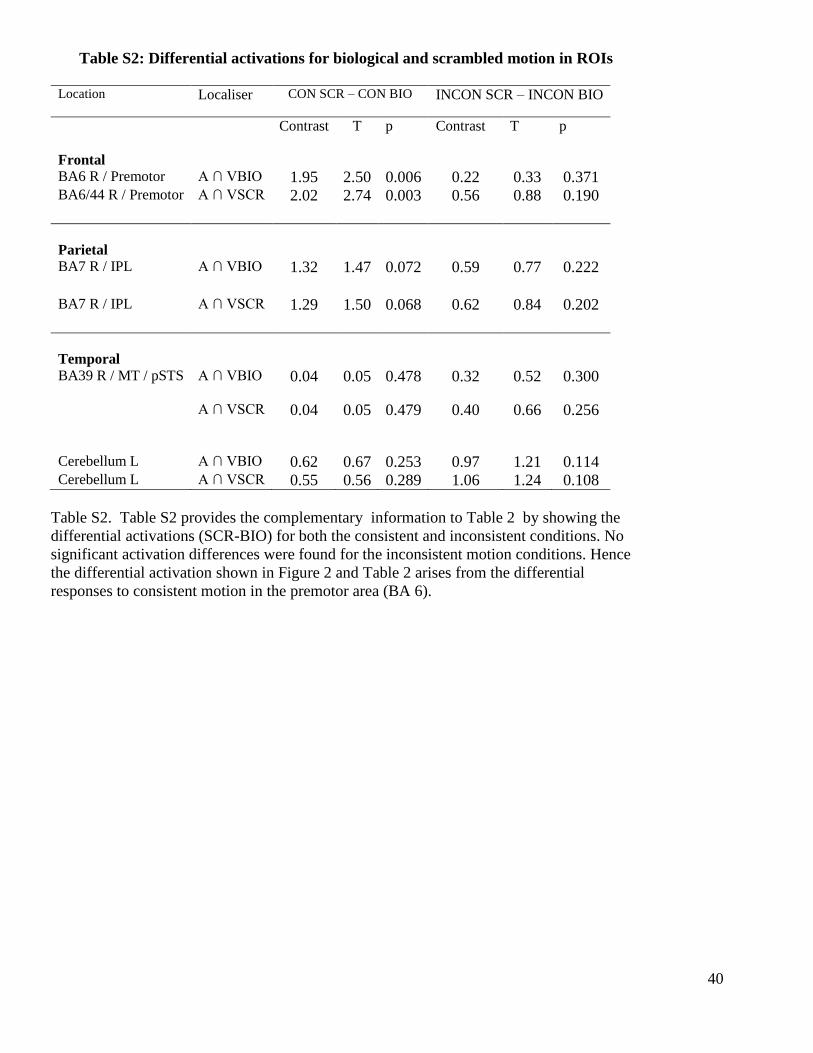
Table S2: Differential activations for biological and scrambled motion in ROIs
Location Localiser CON SCR – CON BIO
INCON SCR – INCON BIO
Frontal
Contrast T p Contrast T p
BA6 R / Premotor A ∩ VBIO 1.95 2.50 0.006 0.22 0.33 0.371 BA6/44 R / Premotor A ∩ VSCR 2.02 2.74 0.003 0.56 0.88 0.190
Parietal
BA7 R / IPL
A ∩ VBIO 1.32 1.47 0.072 0.59 0.77 0.222
BA7 R / IPL
A ∩ VSCR 1.29 1.50 0.068 0.62 0.84 0.202
Temporal
BA39 R / MT / pSTS
A ∩ VBIO 0.04 0.05 0.478 0.32 0.52 0.300
A ∩ VSCR 0.04 0.05 0.479 0.40 0.66 0.256
Cerebellum L A ∩ VBIO 0.62 0.67 0.253 0.97 1.21 0.114 Cerebellum L A ∩ VSCR 0.55 0.56 0.289 1.06 1.24 0.108
Table S2. Table S2 provides the complementary information to Table 2 by showing the
differential activations (SCR-BIO) for both the consistent and inconsistent conditions. No
significant activation differences were found for the inconsistent motion conditions. Hence
the differential activation shown in Figure 2 and Table 2 arises from the differential
responses to consistent motion in the premotor area (BA 6).
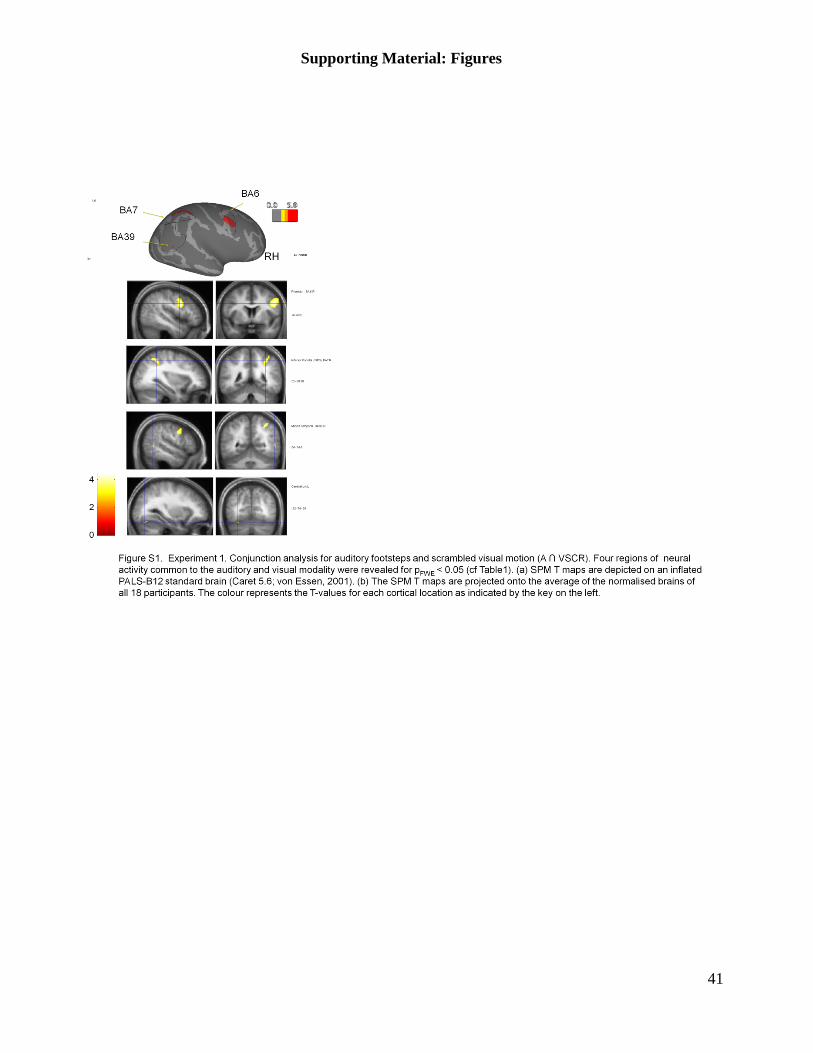
41
Supporting Material: Figures
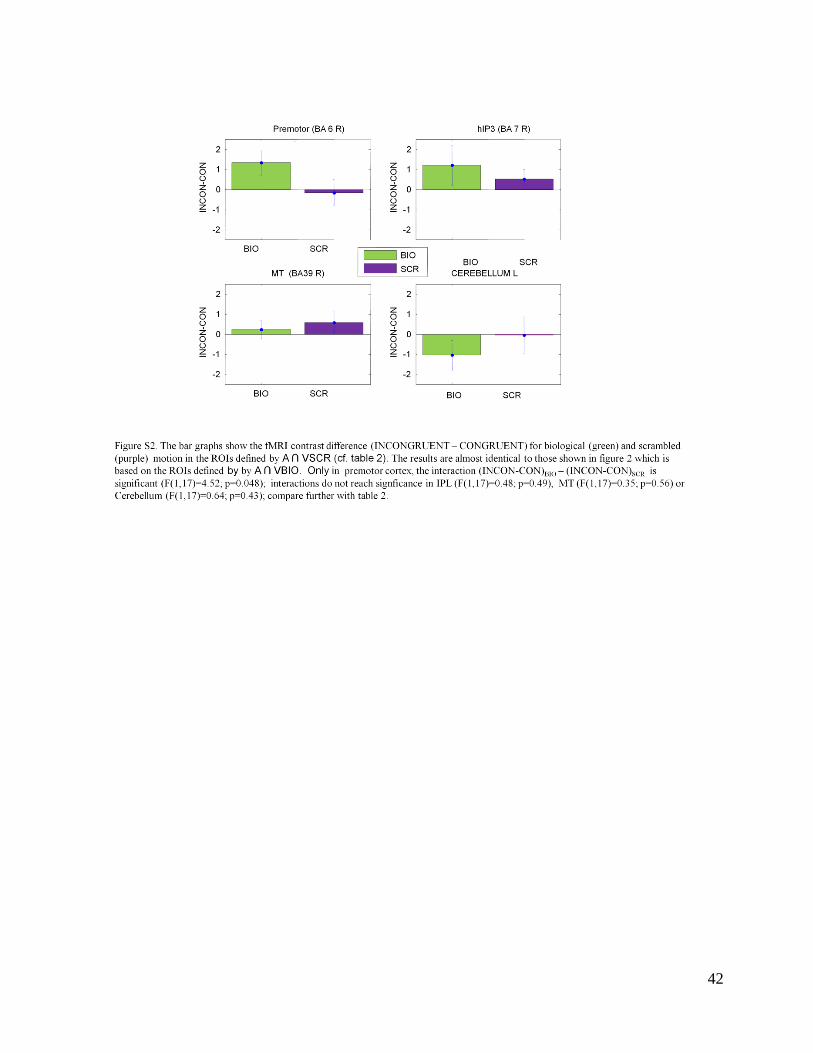
42
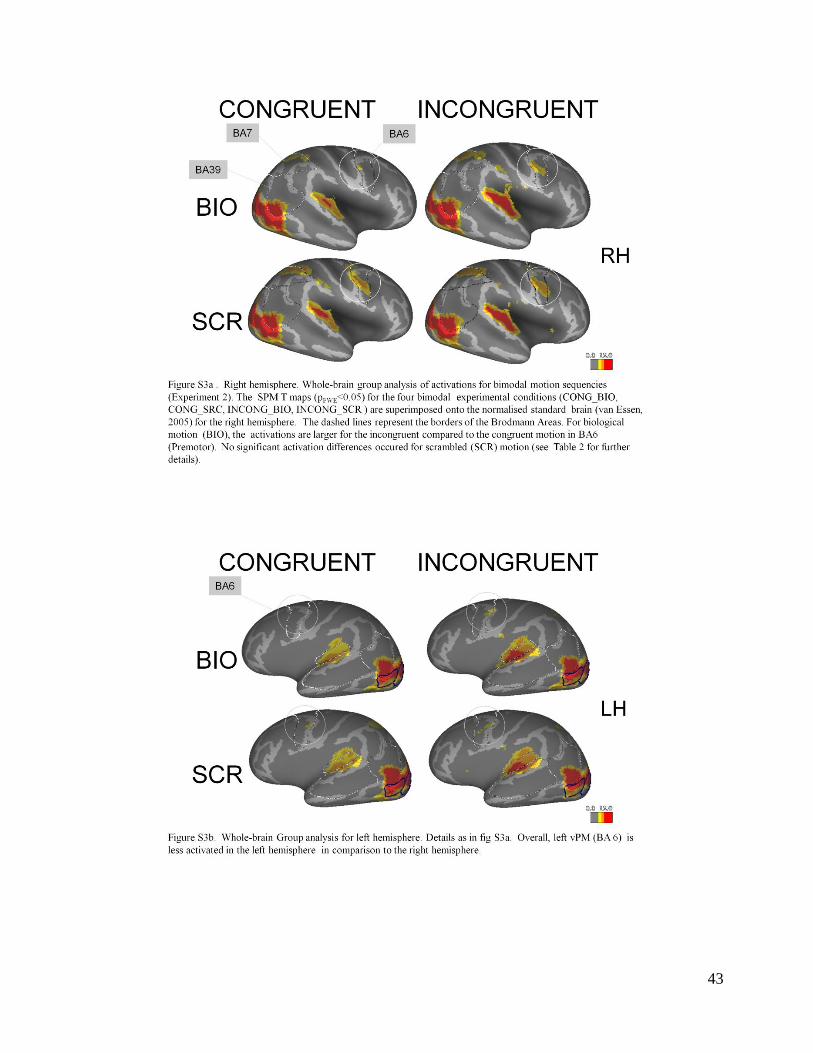
43
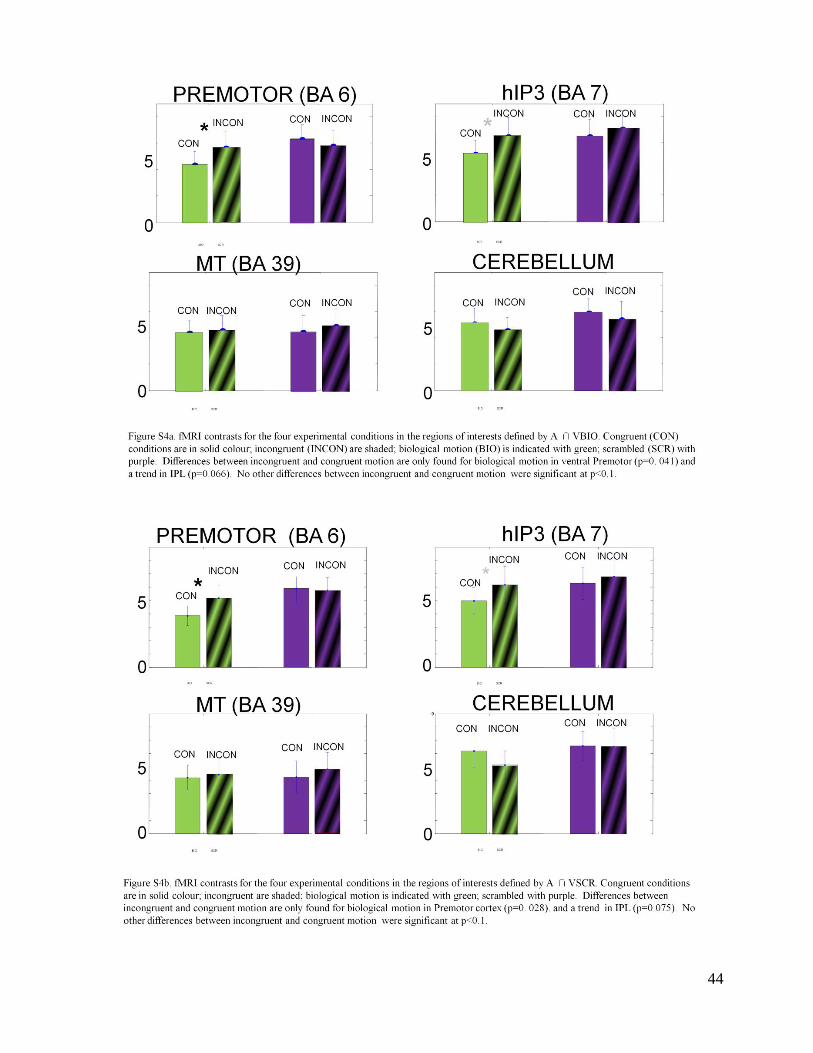
44
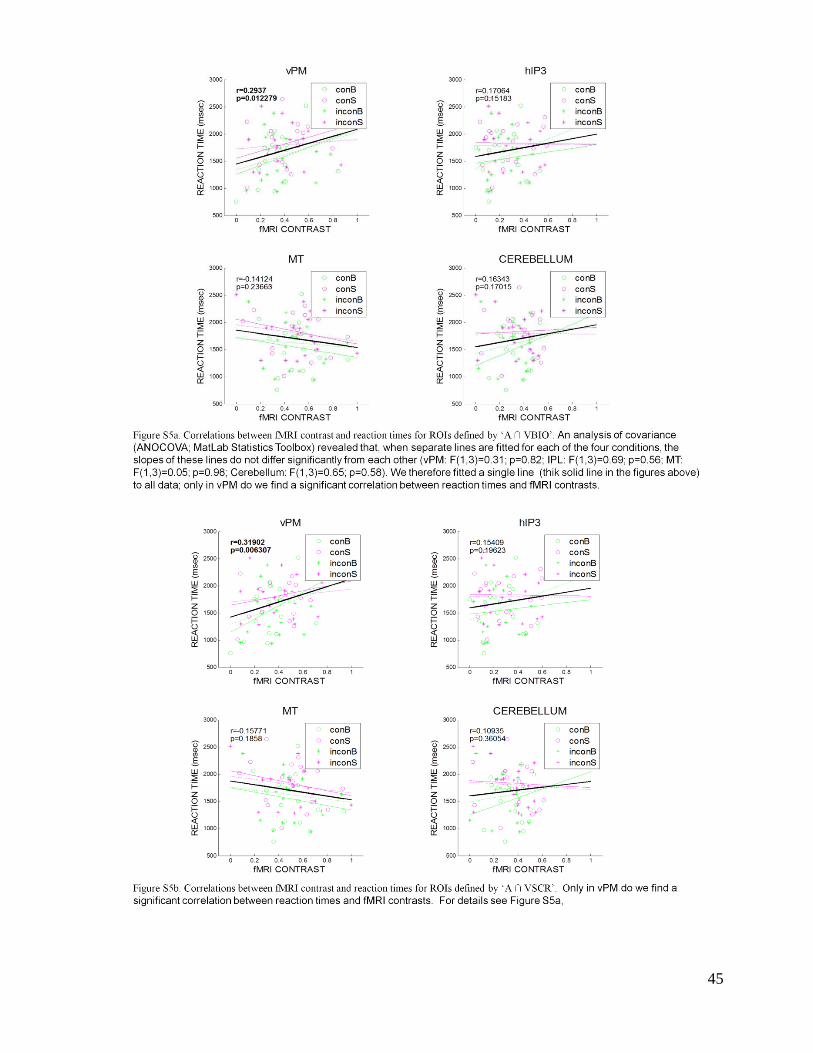
45
Related Documents


