“ 8th APRU Doctoral Students Conference” Keio University, Tokyo July 30 th – August 3 rd , 2007 Mohammad Sholichin, Faridah Othman, Shatirah Akib 1 Preliminary Study of Total Maximum Daily Load (TMDL) for Sediment and Nutrient at Lesti River Basin-Indonesia Mohammad Sholichin 1) , Faridah Othman 2) , and Shatirah Akib 3) 1) PhD Student, Department of Civil Engineering, Universiti Malaya, Lembah Pantai, Kuala Lumpur, Malaysia; [email protected]; [email protected] , and Lecturer, Water Resources Department, Brawijaya University, Malang East Java Indonesia 2) Senior Lecturer, Department of Civil Engineering, Universiti Malaya, Lembah Pantai, Kuala Lumpur, Malaysia; www.um.edu.my ; [email protected] 3) PhD Student, Department of Civil Engineering, Universiti Malaya, Lembah Pantai, Kuala Lumpur, Malaysia; www.um.edu.my ; [email protected]

Welcome message from author
This document is posted to help you gain knowledge. Please leave a comment to let me know what you think about it! Share it to your friends and learn new things together.
Transcript
“ 8th APRU Doctoral Students Conference” Keio University, Tokyo July 30th – August 3rd , 2007
Mohammad Sholichin, Faridah Othman, Shatirah Akib
1
Preliminary Study of Total Maximum Daily Load (TMDL) for
Sediment and Nutrient at Lesti River Basin-Indonesia
Mohammad Sholichin1), Faridah Othman2), and Shatirah Akib3)
1) PhD Student, Department of Civil Engineering, Universiti Malaya, Lembah Pantai, Kuala
Lumpur, Malaysia; [email protected]; [email protected] , and Lecturer, Water Resources Department, Brawijaya University, Malang East Java Indonesia
2) Senior Lecturer, Department of Civil Engineering, Universiti Malaya, Lembah Pantai, Kuala Lumpur, Malaysia; www.um.edu.my; [email protected]
3) PhD Student, Department of Civil Engineering, Universiti Malaya, Lembah Pantai, Kuala Lumpur, Malaysia; www.um.edu.my; [email protected]
“ 8th APRU Doctoral Students Conference” Keio University, Tokyo July 30th – August 3rd , 2007
Mohammad Sholichin, Faridah Othman, Shatirah Akib
2
ABSTRACT
At the present decade, water pollution in river is a serious problem. Increasing
population, as well as agricultural and industrial activities contributes to the additional
pollution discharge to the river. Sediment and nutrient are two most common pollutants
reported by State Minister for the Environment.
The total maximum daily load (TMDL) for suspended sediment and nutrient are the
maximum quantity of suspended sediment and nutrient that can enter a waterway without
affecting the beneficial uses of the waterway. It is calculated as the sum of permissible
allotments of point sources of suspended sediment and nutrient, permissible allotments of
non point sources of pollutant, background (natural) loading of suspended sediment, and a
margin of safety.
The aims of the preliminary study are to survey and identify the resources of
sediment and nutrient pollutants, to determine the total maximum daily load (TMDL) of
suspended sediment and nutrient as Nitrogen and Phosphorous, and to apply the
watershed modeling for assessment of TMDL at Lesti River basin. The watershed
modeling was used to analyze different management scenarios to minimize point and non-
point pollution, and applied in the total maximum daily load (TMDL) studies.
The best management practice were applied on these area and has shown that
intensive water quality monitoring program can result into the reduction of annual sediment
yield and nutrient load for long times. The output of the watershed modeling (AVSWAT
2000) was used to identify critical area of non point source loading for sediment as well as
nutrient sources.
Keywords: TMDLs, Sediment, Nutrient Load, River Basin
“ 8th APRU Doctoral Students Conference” Keio University, Tokyo July 30th – August 3rd , 2007
Mohammad Sholichin, Faridah Othman, Shatirah Akib
3
INTRODUCTION
Indonesia country has the world’s fourth largest population (207.6 million according
to the 2000 census) with over 92% being Muslim after China, India, and the United States
(Whitten et all., 1996). The population is comprised of nearly 300 ethnic groups that speak
about 538 different languages and dialects. The population density nationally is 108/km2,
but it varies considerably from island to island. Java, the archipelago’s most socially and
economically progressive island, has 7% of its land area and 59% of the population, with a
population density of 919/km2. (Kikkeri V, 2004). This huge population is resulting in
serious local environmental degradation, which includes the river environment.
In 1990, The Indonesian Government established the BAPEDAL (Environmental
Impact Management Agency) Agency to manage environmental protection. The Clean
River Program (PROKASIH), a national program under BAPEDAL’s coordination, was
established to improve river water quality. The program did not continuously in the present
time. (Sudaryanti, 2001)
Human population, agricultural and industrial activities have increased over the
past few years, have resulted into much Indonesian surface water, including the Brantas
River in East Java Province, and are in poor condition. Water quality problem, including
eutrophication, pollution by organic matter and toxicants, and sedimentation (Sudaryanti,
1998) are the concern of our river. Total pollution load by inhabitants within the Brantas
Basin is estimated to be about 380 tones BOD/day, and those from monitored industries
are estimated at about 2000 tones BOD/day (Perum Jasa Tirta, Unpub. Data). Pollutants
from the irrigated areas, livestock, and organic garbage, solid waste and natural source
also affect the river water quality (Japan International Cooperation Agency, 1998).
The ambient water quality standards of the East java province have been published
by the Governor of East Java (5th December, 1987). The water quality standards have
“ 8th APRU Doctoral Students Conference” Keio University, Tokyo July 30th – August 3rd , 2007
Mohammad Sholichin, Faridah Othman, Shatirah Akib
4
been established with emphasis on water quality and it’s suitable for specific water
utilization purpose. According to their functions, water can be classified as follows,
• Class A : Water which can be used directly as drinking water without treatment
• Class B : Water which can be used as raw water for drinking and other household
necessities after treatment
• Class C : Water which can be used for fishery or husbandry purposes
• Class D: Water which can be used for irrigation, industries, hydropower plants and
municipal water supply service.
• Class E : Water which cannot be used for the purposes in group A, B, C and D
In the few decade, Perum Jasa Tirta as Regulator of Brantas River Basin (include
Lesti river as sub basin) more intensively developed the water quality protection programs,
especially after eutrophication attack for Sutami Reservoir at 2002. This program is
heavily focused on the monitoring of pollution from industries wastewater, but does not
include assessment of total maximum daily load (TMDL) of suspended sediment and
nutrient load from all pollutant sources. Therefore TMDLs program was applied as a new
approach in Brantas River basin to assess the sediment and nutrient load at daily and
yearly load.
The total maximum daily load for sediment and nutrient was studied for the Lesti River
basin because the watershed has intensive agricultural activities and rapid rural
development. Lesti River Basin has a catchment area of 59,850 Ha and lies between 112O
10’’ and 112O 25’’ in longitude and between 7 O 40’’ and 7O 55’’ in latitude. It is dominated
by agricultural land (78%) and urban area (22 %). The main problems in Lesti River Basin
are not only soil erosion from hill slope area of Semeru Mountain, but also from both
agricultural activities and domestic area.
“ 8th APRU Doctoral Students Conference” Keio University, Tokyo July 30th – August 3rd , 2007
Mohammad Sholichin, Faridah Othman, Shatirah Akib
5
OBJECTIVES
The primary aim of the is to survey and identify the resources of sediment and
nutrient pollutant at Lesti River Basin, and to assess the determination of total maximum
daily load (TMDL) of suspended sediment and nutrient as Nitrogen and phosphorous. The
second aim of this study is to apply watershed modeling for assessment of TMDL at the
study area. The watershed modeling was used to analyze different management
scenarios to minimize point and non-point pollution, and applied in the total maximum daily
load (TMDL) studies.
MATERIAL AND METHODS
The Study Area
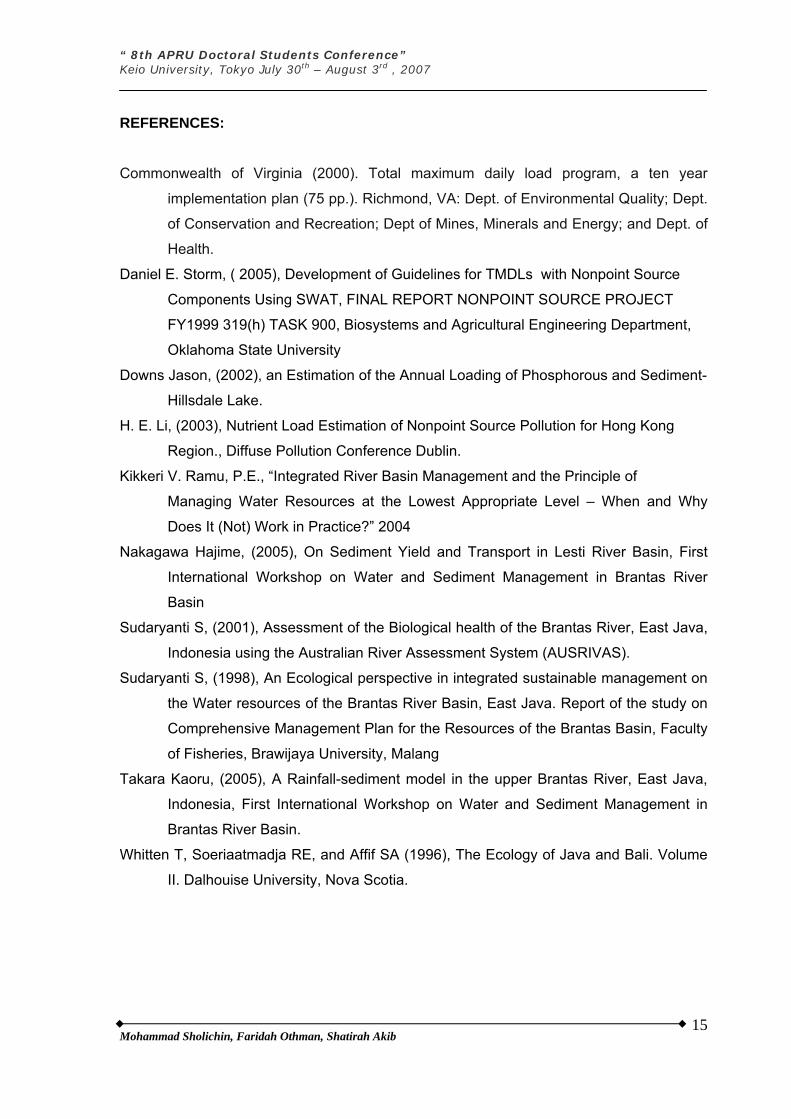
The Lesti River basin that has a catchment area about 60,519 Ha is located at the
upper Brantas River basin. The Lesti River flows together with the Brantas River to the
Sengguruh dam which was constructed in 1988. The Sengguruh dam contributes to the
reduction of both sediment deposit and nutrient pollutant at Sutami reservoir, which is
located downstream of Sengguruh dam, has gross storage capacity of 21.5 million m3.
(Figure 1.)
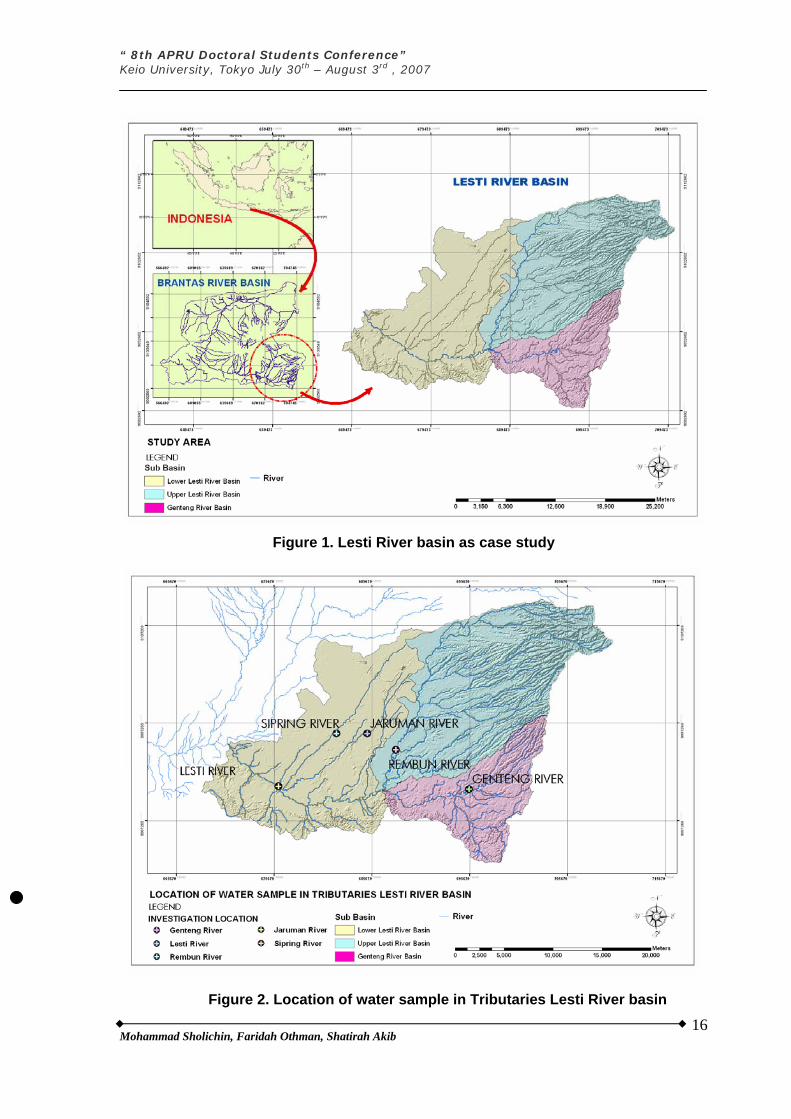
The water sampling was conducted in the upper-middle-lower section of Lesti River
basin, which cover an area of 60,519 Ha, and has three sub catchments-Upper Lesti
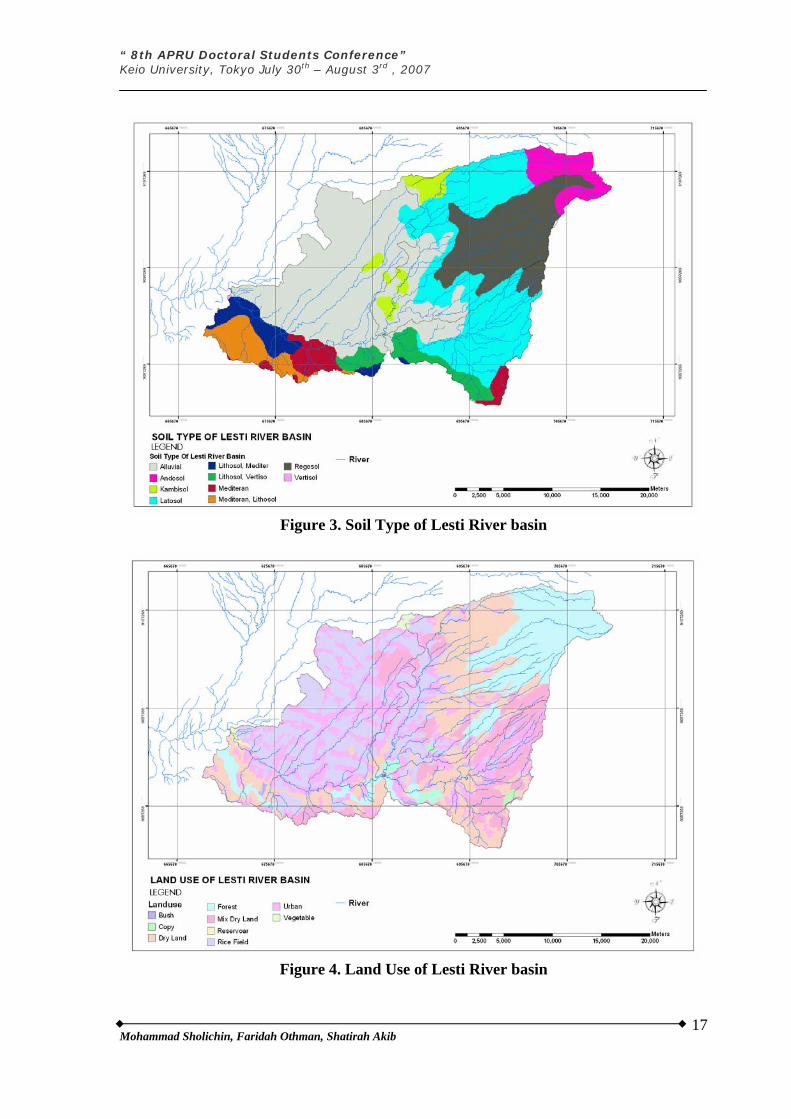
(24,858 ha), Lower Lesti (24,948 ha), and Genteng (10,614 Ha). The Soil types of Lesti
Basin are alluvial; Andosol, Kambisol, Lithosol, Mediteran, and Regosol (refer Table 1 and
figure 2). The main land use of Lesti Basin is dominated by forestry, agriculture and both
rural and urban (refer Table2 and figure 3). The distribution of average slope in study area
shown the highest slope is located in near of Semeru Mountain (refer Figure 4.)

“ 8th APRU Doctoral Students Conference” Keio University, Tokyo July 30th – August 3rd , 2007
Mohammad Sholichin, Faridah Othman, Shatirah Akib
6
Field Investigations.
Water quality samples were collected by Perum Jasa Tirta as periodic monthly at 2
sites (Sengguruh reservoir and Pendaringan Bridge). Samples were analyzed for a suite
of nutrient indicators, which helped determine nitrogen as the limiting nutrient. Total
suspended solid data was then analyzed to determine which sample site exceeds the
sediment target level and to observe the trends of sediment concentration.
The Sengguru dam is the most contaminated reservoir, with relative high values of
14.5 mg/l of COD, 0.27 mg/l of TP, 0.41 mg/l TN in term of 5 years average. The main
reason is that pollution load is flowing into the reservoir from upstream cities and village,
Mainly Kepanjen and Dampit City, and paper mill and tapioca factories along the Lesti
River and the Juwok River. The pollution load from the paper mill, PT Eka Mas Fortuna,
located near the reservoir, can be estimated from the PJT’s data which is approximately
9,000 kg/day of COD, 2.8 kg/day of TP, 6.3 kg/day TN.
In order to complete water quality data record in tributary of Lesti River that are not
monitored by PJT, water quality tests were made by the Author survey team. Water quality
samples have been taken from 5 tributary, namely; Lesti River, Sipring River, Jaruman
River, Rembun River and Genteng River. The completed data of survey can be seen in
Table 3.
Existing Pollution Sources
The main sources pollutants in the Lesti River basin are agricultural (primarily from
fertilizer and pesticide uses), domestic, industries, and natural sources such as soil erosion
from upland area.
1. Agricultural sources
Methods of fertilizer application and farm management practice can significantly affect
both N and P losses in surface runoff. Field studies have shown that both N and P
losses in surface are correlated with fertilizer rate. A usually, farmers used many
“ 8th APRU Doctoral Students Conference” Keio University, Tokyo July 30th – August 3rd , 2007
Mohammad Sholichin, Faridah Othman, Shatirah Akib
7
varieties of fertilizer such as Urea, KCL, ZA, and TSP more than factory
recommended. The variety of fertilizer used in study area can be seen in table 4.
2. Domestic wastewater
The population on the whole Lesti River basin is estimated at about 491,457 people
(Statistic of Malang Regency, 2006). Domestic wastewater is one of the important
sources of organic materials, nutrients, and microbiological water pollution in Lesti
River basin. A Like problem in development country, system sanitation in study area is
poor. Therefore, approximately about 25 % of amount population in study area was
directly throw away of faces in river system. Domestic pollution load can be estimated
by multiplying domestic pollutant load per human per day.
3. Industrial wastewater
The amount of industries that located in Lesti river basin can be classification with two
categories such as middle scale industry and small scale industry (refer Table 5). The
main industries than contributed of point source pollutant in the Lesti River basin can
be namely as follows:
- Pulp and paper factory ( PT Eka Mas Fortuna)
- Sugar (sugar from cane) factory ( PG Kebun Agung)
- Tapioca factory ( PT Intaf Turen)
- Food processing factory (PT Bumi M Internusa)
Description of TMDL
The total maximum daily load (TMDL) for suspended sediment and nutrient are the
maximum quantity of suspended sediment and nutrient that can enter a waterway without
affecting the beneficial uses of the waterway. It is calculated as the sum of permissible
allotments of point sources of suspended sediment and nutrient, permissible allotments of
non point sources of pollutant, background (natural) loading of suspended sediment, and a
margin of safety. The formulation of TMDLs is the following equation.

“ 8th APRU Doctoral Students Conference” Keio University, Tokyo July 30th – August 3rd , 2007
Mohammad Sholichin, Faridah Othman, Shatirah Akib
8
TMDL ≤ ∑WLA + ∑LA + MOS 1)
Where:
WLA = Sum of Waste Load Allocation (Point Sources)
LA = Sum of Load Allocation (Non-Point Sources)
MOS = Margin of Safety (10%)
Total daily nitrogen, phosphorus, and sediment loads were determined using the following
equations.
TN Load = ([NO3 -N] + [NO2-N] + [NH3-N]) * Flow 2)
TP Load = [TP] * Flow 3)
Sediment Load = (TSS) * Flow 4)
where TN Load is total daily nitrogen load (kg N/day), [NO3--N] is nitrate-nitrogen
concentration (mg N/L), [NO2--N] is nitrite-nitrogen concentration (mg N/L), [NH3-N] is
ammonia-nitrogen concentration (mg N/L), TP Load is total daily phosphorus load (kg
P/day), [TP] is total phosphorus concentration (mg P/L), Sediment Load is total daily
sediment load (kg sediment/day), [TSS] is Total Suspended Soil concentration (mg/L). The
mean annual loads and in-stream concentration estimates of nitrogen, phosphorus, and
sediment were derived for each watershed.
SOIL WATER ASSESSMENT TOOL
Introduction
The Soil Water Assessment Tool (SWAT) model was developed by the Agricultural
Research Service, the main research agency within the U.S. Department of Agriculture.
The model predicts the impact of land management practices on water, sediment and
agricultural chemical yields in large complex watersheds with varying soils, land use, and
management conditions over long periods of time. SWAT can analyze large watersheds
and river basins (greater than 100 square miles) by subdividing the area into homogenous
sub-watersheds. The model uses a daily time step, and can perform continuous simulation
“ 8th APRU Doctoral Students Conference” Keio University, Tokyo July 30th – August 3rd , 2007
Mohammad Sholichin, Faridah Othman, Shatirah Akib
9
for a period of one to 100 years. SWAT simulates hydrology, pesticide and nutrient cycling,
erosion and sediment transport. SWAT was applied to the Lesti River watershed in Malang
to support the development of total maximum daily loads (TMDLs) for nutrients and
sediments. This appendix provides an overview of the model and a description of the
modeling process.
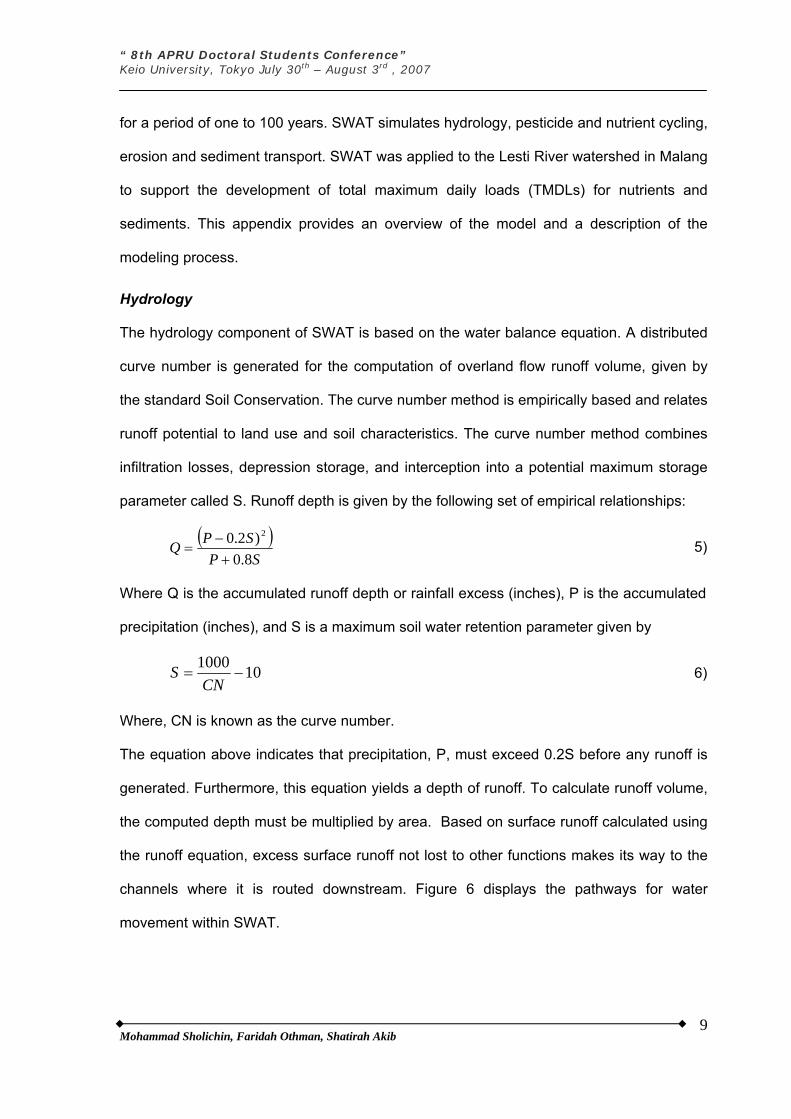
Hydrology
The hydrology component of SWAT is based on the water balance equation. A distributed
curve number is generated for the computation of overland flow runoff volume, given by
the standard Soil Conservation. The curve number method is empirically based and relates
runoff potential to land use and soil characteristics. The curve number method combines
infiltration losses, depression storage, and interception into a potential maximum storage
parameter called S. Runoff depth is given by the following set of empirical relationships:
( )SP
SPQ8.0
)2.0 2
+−
= 5)
Where Q is the accumulated runoff depth or rainfall excess (inches), P is the accumulated
precipitation (inches), and S is a maximum soil water retention parameter given by
101000−=
CNS 6)
Where, CN is known as the curve number.
The equation above indicates that precipitation, P, must exceed 0.2S before any runoff is
generated. Furthermore, this equation yields a depth of runoff. To calculate runoff volume,
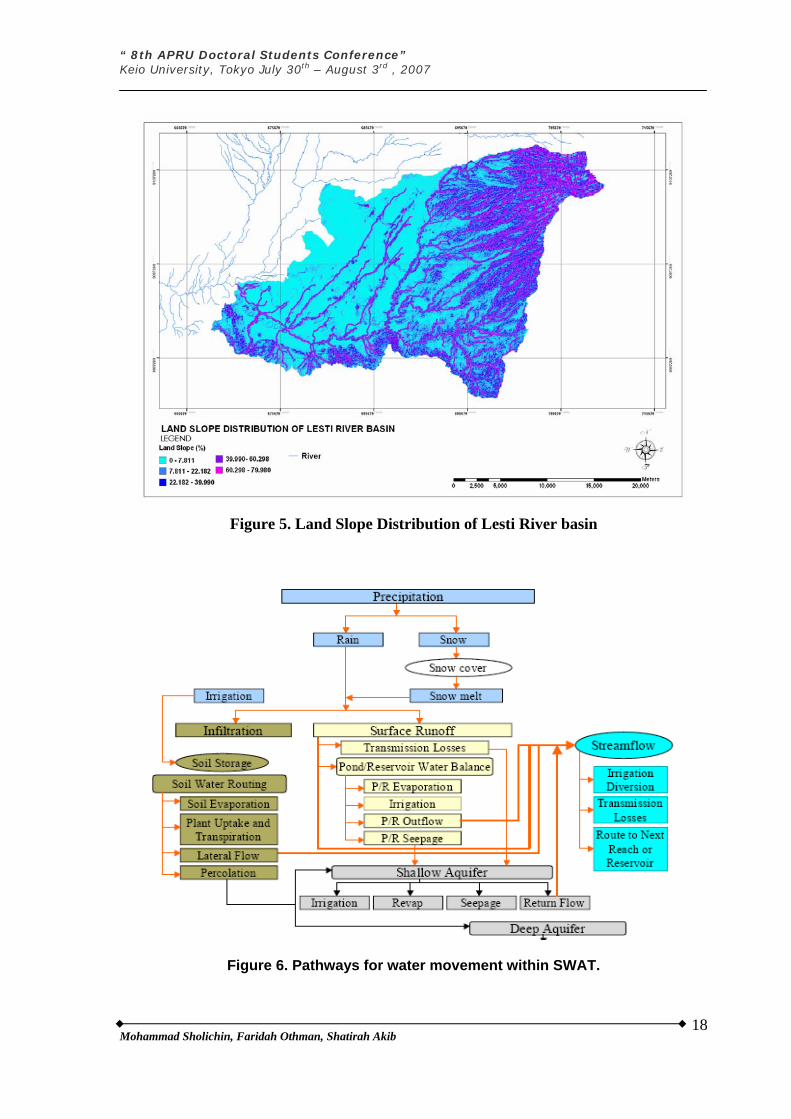
the computed depth must be multiplied by area. Based on surface runoff calculated using
the runoff equation, excess surface runoff not lost to other functions makes its way to the
channels where it is routed downstream. Figure 6 displays the pathways for water
movement within SWAT.
“ 8th APRU Doctoral Students Conference” Keio University, Tokyo July 30th – August 3rd , 2007
Mohammad Sholichin, Faridah Othman, Shatirah Akib
10
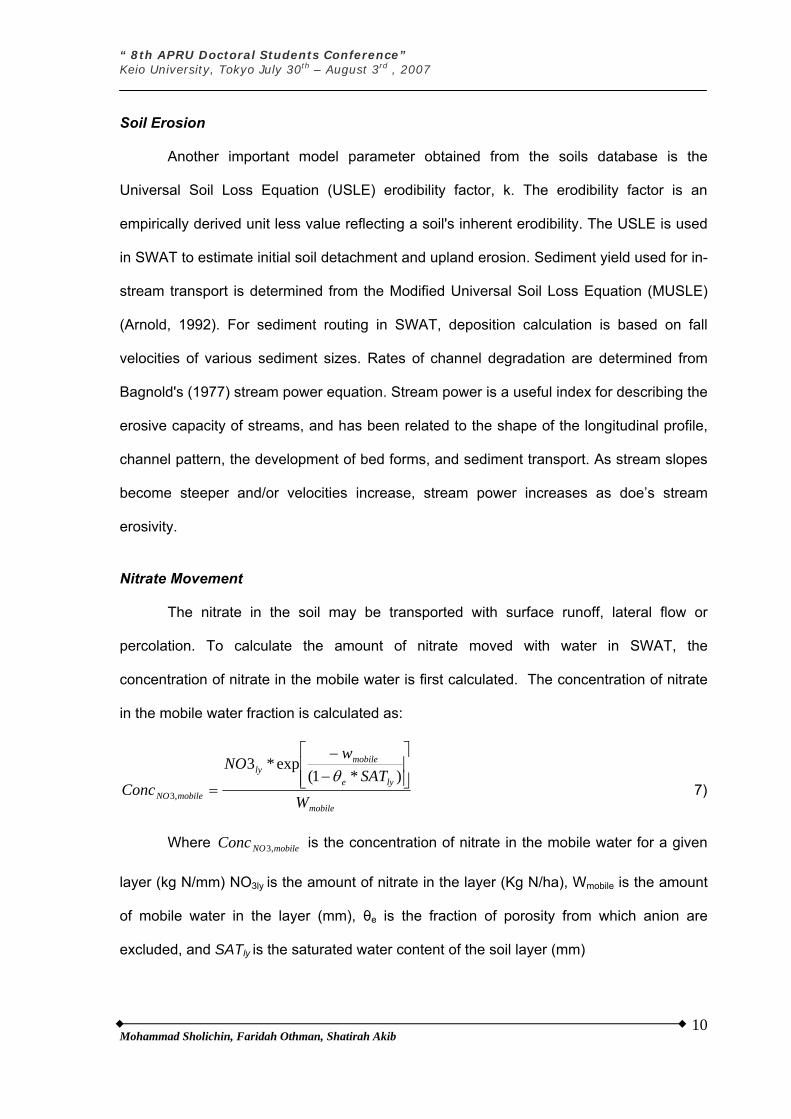
Soil Erosion
Another important model parameter obtained from the soils database is the
Universal Soil Loss Equation (USLE) erodibility factor, k. The erodibility factor is an
empirically derived unit less value reflecting a soil's inherent erodibility. The USLE is used
in SWAT to estimate initial soil detachment and upland erosion. Sediment yield used for in-
stream transport is determined from the Modified Universal Soil Loss Equation (MUSLE)
(Arnold, 1992). For sediment routing in SWAT, deposition calculation is based on fall
velocities of various sediment sizes. Rates of channel degradation are determined from
Bagnold's (1977) stream power equation. Stream power is a useful index for describing the
erosive capacity of streams, and has been related to the shape of the longitudinal profile,
channel pattern, the development of bed forms, and sediment transport. As stream slopes
become steeper and/or velocities increase, stream power increases as doe’s stream
erosivity.
Nitrate Movement
The nitrate in the soil may be transported with surface runoff, lateral flow or
percolation. To calculate the amount of nitrate moved with water in SWAT, the
concentration of nitrate in the mobile water is first calculated. The concentration of nitrate
in the mobile water fraction is calculated as:
mobile
lye
mobilely
mobileNO W
SATw
NO
Conc ⎥⎥⎦
⎤
⎢⎢⎣
⎡
−−
=)*1(
exp*3
,3
θ 7)
Where is the concentration of nitrate in the mobile water for a given
layer (kg N/mm) NO
mobileNOConc ,3
3ly is the amount of nitrate in the layer (Kg N/ha), Wmobile is the amount
of mobile water in the layer (mm), θe is the fraction of porosity from which anion are
excluded, and SATly is the saturated water content of the soil layer (mm)
“ 8th APRU Doctoral Students Conference” Keio University, Tokyo July 30th – August 3rd , 2007
Mohammad Sholichin, Faridah Othman, Shatirah Akib
11
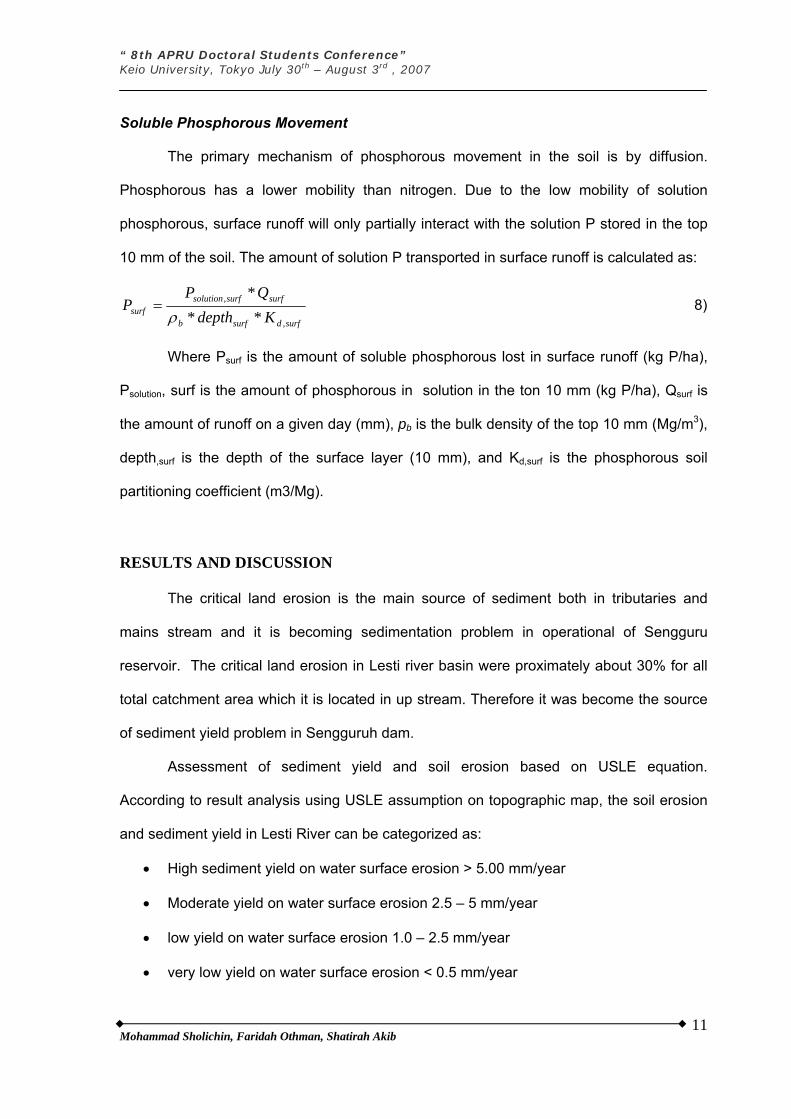
Soluble Phosphorous Movement
The primary mechanism of phosphorous movement in the soil is by diffusion.
Phosphorous has a lower mobility than nitrogen. Due to the low mobility of solution
phosphorous, surface runoff will only partially interact with the solution P stored in the top
10 mm of the soil. The amount of solution P transported in surface runoff is calculated as:
surfdsurfb
surfsurfsolutionsurf Kdepth
QPP
,
,
***
ρ= 8)
Where Psurf is the amount of soluble phosphorous lost in surface runoff (kg P/ha),
Psolution, surf is the amount of phosphorous in solution in the ton 10 mm (kg P/ha), Qsurf is
the amount of runoff on a given day (mm), pb is the bulk density of the top 10 mm (Mg/m3),
depth,surf is the depth of the surface layer (10 mm), and Kd,surf is the phosphorous soil
partitioning coefficient (m3/Mg).
RESULTS AND DISCUSSION
The critical land erosion is the main source of sediment both in tributaries and
mains stream and it is becoming sedimentation problem in operational of Sengguru
reservoir. The critical land erosion in Lesti river basin were proximately about 30% for all
total catchment area which it is located in up stream. Therefore it was become the source
of sediment yield problem in Sengguruh dam.
Assessment of sediment yield and soil erosion based on USLE equation.
According to result analysis using USLE assumption on topographic map, the soil erosion
and sediment yield in Lesti River can be categorized as:
• High sediment yield on water surface erosion > 5.00 mm/year
• Moderate yield on water surface erosion 2.5 – 5 mm/year
• low yield on water surface erosion 1.0 – 2.5 mm/year
• very low yield on water surface erosion < 0.5 mm/year
“ 8th APRU Doctoral Students Conference” Keio University, Tokyo July 30th – August 3rd , 2007
Mohammad Sholichin, Faridah Othman, Shatirah Akib
12
The predicted of average rate of sediment yield from Lesti river basin is 1,375,000
m3/year. Therefore the average daily load of sediment in Lesti River basin was 3,767
ton/day.
According of Water quality standard, The Lesti River was designed in class C, that
water which can be used for fishery or husbandry purposes. The maximum concentration
value for water that classification in C are, Nitrite (NO2), Nitrate (NO3), Ammonia (NH3),
and Phosphorous (PO4) as 0.06 mg/l, 10 mg/l, 0.02 mg/l and 0.5 mg/l, respectively.
The basic calculation for assessment of total maximum daily load of sediment and
nutrient in Lesti river basin was estimated with formula:
Pollutant Load (Kg/day) = pollutant concentration (mg/l) x flow (m3/day) x 1/1000
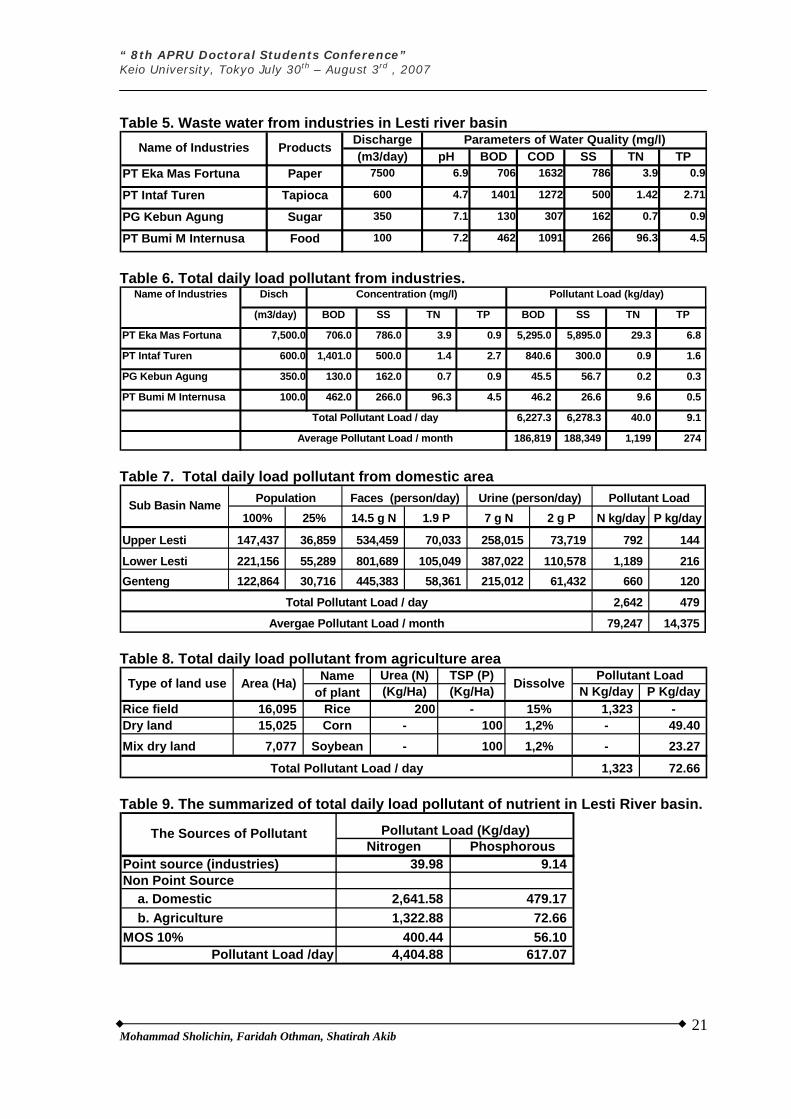
1. Point source pollution (Industries).
In Lesti River basin, the factories which middle scale throw away wastewater in Lesti
River and tributaries are, PT Eka Mas Fortuna, PT Intaf Turen, PG Kebun Agung, and
PT Bumi M Internusa. The Effluent discharge and concentration of pollutant are
average value recorded by Perum Jasa Tirta along 2000 to 2005 period. The summary
of total maximum daily loads from point source pollutant are 6,227 kg/day for BOD,
6278.3 kg/day for SS, 40 kg/day for Nitrogen, and 9.1 kg/day for Phosphorous,
respectively. Detail calculation of all parameters can bee seen in table 6.
2. Non Point source pollution from domestic
The minimum sanitation of sewage system on the Lesti River basin is one of problem
of pollution load from domestic area. According from Statistic of Malang Regency,
2006, population in Lesti River basin was approximately about 491,457 people, and 25
% of people directly removal of wastewater to Lesti river and tributaries. In human
faces was contain of 14.5 gram N /person/day and 1.9 gram P /person/day,
respectively and in the human urine was contain 7 gram N /person/day and 2 gram P
/person/day, respectively. The summary of total maximum daily load from domestic
“ 8th APRU Doctoral Students Conference” Keio University, Tokyo July 30th – August 3rd , 2007
Mohammad Sholichin, Faridah Othman, Shatirah Akib
13
area is 2,642 kg/day for Nitrogen and 14,375 kg/day for Phosphorous, respectively.
The detail calculation can bee seen in table 7.
3. Pollution load from Agriculture activities
The agriculture area was dominates the landscape of the Lesti river basin, it does
appear to be a primary contributor to the nitrogen and phosphorous in stream and Lesti
reservoir. The agriculture area was include of rich field (16,095 Ha), dry land (15,025
Ha), and mix- dry land (7,077 Ha). In rich field, a commonly formers planted rice two
times in one year. And the in dry land/mix-dry land, former planted of corn one time in
year. In rice field, the use of urea manure in rice filed 1 kg/ha will be absorbed in land
and water flow approximately become 15 %. And the use of TSP manures in dry land
1 Kg/ha will be absorbed in land and water flow approximately become 1.2 %.
According of assumption above, the total maximum daily load from agriculture area are
1,323 Kg/day for Nitrogen, 72.66 Kg/day for Phosphorous, respectively. The detail
calculation can bee seen in table 8. According for basic calculation above, the
maximum daily load for nutrient can be summarized in table 9 below.
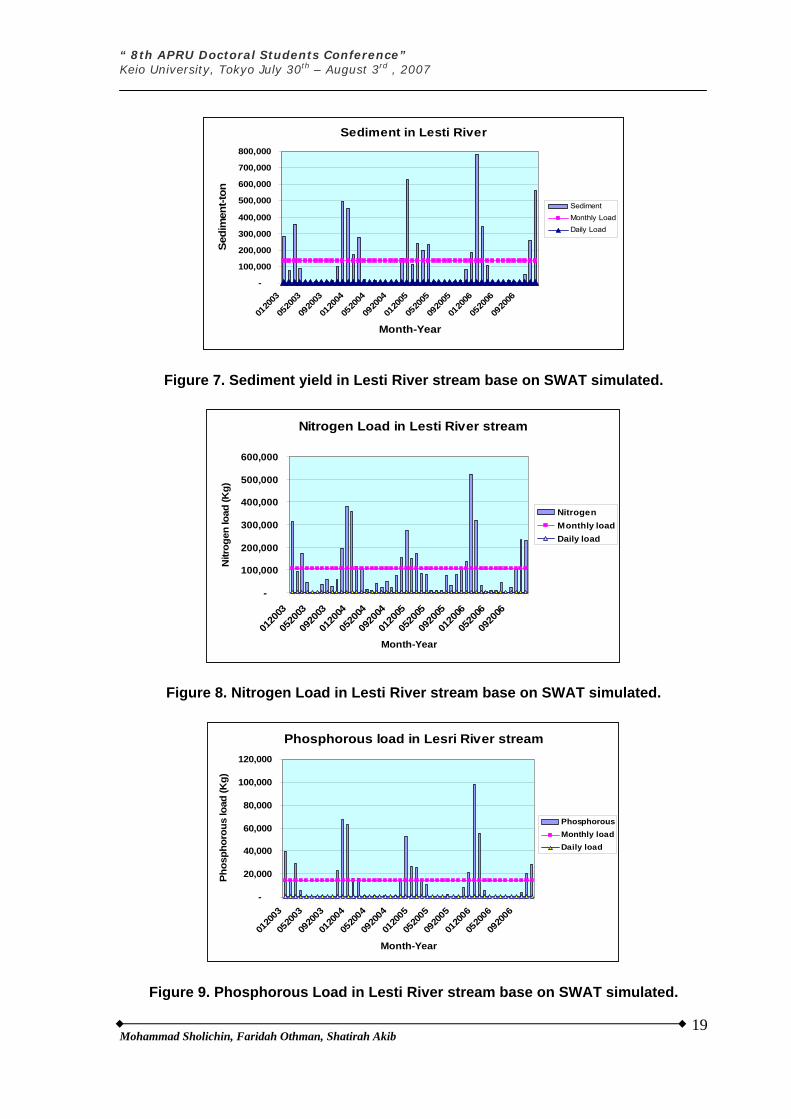
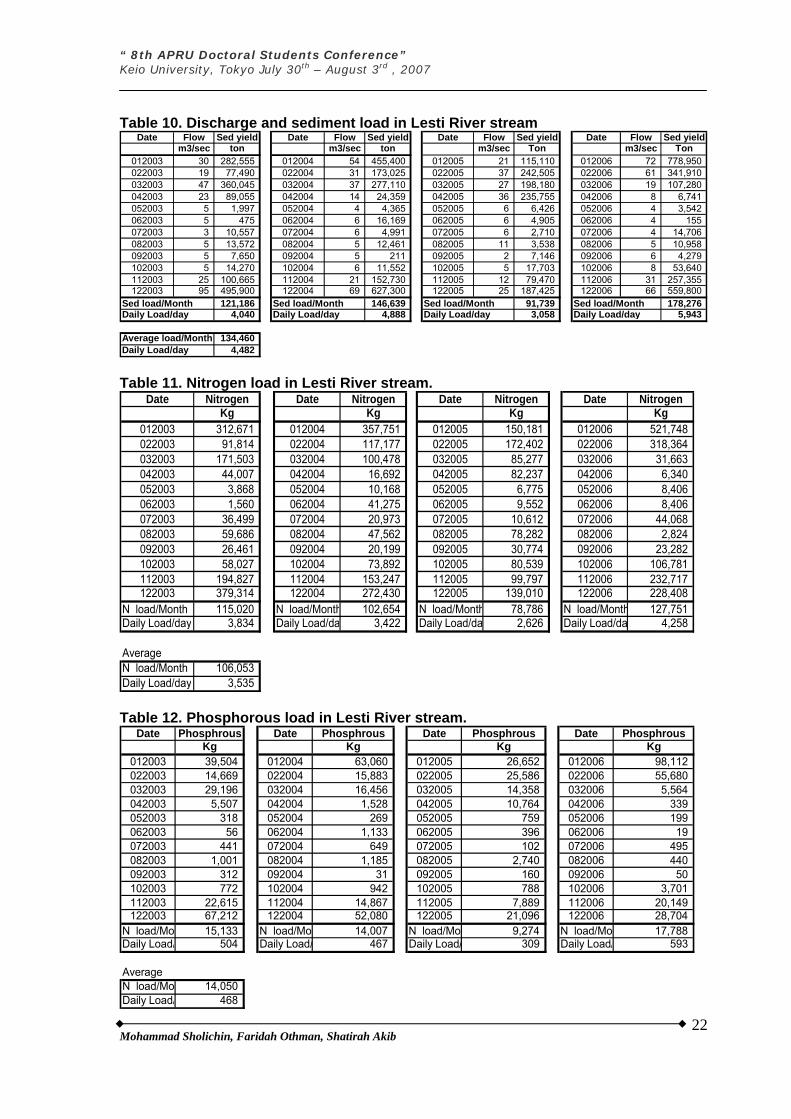
Simulation Result of SWAT
The main results of SWAT simulation with 1995-2006 periods are sediment yield, nitrogen
load, and phosphorous load in Lesti River stream. Detail of simulation results can bee
seen in Table 10, 11, and 12 also in figure 7, 8, and 9, respectively.
CONCLUSIONS
This paper has introduced an assessment of both sediment and nutrient load with
basic calculation and soil water assessment tool to determine the total maximum daily
load. Manual calculations have given 3,767 ton/day sediment yield while SWAT analysis
gives 4,482 ton/day.
“ 8th APRU Doctoral Students Conference” Keio University, Tokyo July 30th – August 3rd , 2007
Mohammad Sholichin, Faridah Othman, Shatirah Akib
14
Yield simulation from SWAT model have resulted lower value than from manual
calculation for prediction of total maximum daily load of nutrient. The value of Nitrogen
and Phosphorous load by SWAT model are 3,535 N kg/day and 468 P Kg/day,
respectively. The values of Nitrogen and Phosphorous by manual calculation are 4,404 N
Kg/day and 617 P kg/day, respectively.
Because of a few numbers of industries in Lesti River basin, the wastewaters from
Industries have not significant effect on the water quality in stream. However, the
industries may be a dominant factor for ecosystem in watershed management.
Pollutant load from domestic area can be reduced with developments of
wastewater treatment plant system and building an individual septic tank in every
household. Direct flow of wastewater from domestic area to river stream will be curbed
with regional law and punishment.
Pollutant loads from agriculture activities can be minimized by the reduction of
fertilizer use in rice field and change of fertilizer type from an inorganic (from fertilizer
factory) to organic type (natural type). Moreover, the participation from rural appraisal
program can be applied for farmer group to developed understanding about river
ecosystem.
Although lacking in some details of the input data, the SWAT model has produced
a reasonably assessment on determination of total maximum daily load of sediment and
nutrient in Lesti River basin.
ACKNOWLEDGMENTS
The authors are deeply grateful to University of Malaya, Malaysia and Brawijaya
University, Indonesia for supporting this study. Our thanks are also addressed to Perum
Jasa Tirta for providing the data.
“ 8th APRU Doctoral Students Conference” Keio University, Tokyo July 30th – August 3rd , 2007
Mohammad Sholichin, Faridah Othman, Shatirah Akib
15
REFERENCES:
Commonwealth of Virginia (2000). Total maximum daily load program, a ten year
implementation plan (75 pp.). Richmond, VA: Dept. of Environmental Quality; Dept.
of Conservation and Recreation; Dept of Mines, Minerals and Energy; and Dept. of
Health.
Daniel E. Storm, ( 2005), Development of Guidelines for TMDLs with Nonpoint Source
Components Using SWAT, FINAL REPORT NONPOINT SOURCE PROJECT
FY1999 319(h) TASK 900, Biosystems and Agricultural Engineering Department,
Oklahoma State University
Downs Jason, (2002), an Estimation of the Annual Loading of Phosphorous and Sediment-
Hillsdale Lake.
H. E. Li, (2003), Nutrient Load Estimation of Nonpoint Source Pollution for Hong Kong
Region., Diffuse Pollution Conference Dublin.
Kikkeri V. Ramu, P.E., “Integrated River Basin Management and the Principle of
Managing Water Resources at the Lowest Appropriate Level – When and Why
Does It (Not) Work in Practice?” 2004
Nakagawa Hajime, (2005), On Sediment Yield and Transport in Lesti River Basin, First
International Workshop on Water and Sediment Management in Brantas River
Basin
Sudaryanti S, (2001), Assessment of the Biological health of the Brantas River, East Java,
Indonesia using the Australian River Assessment System (AUSRIVAS).
Sudaryanti S, (1998), An Ecological perspective in integrated sustainable management on
the Water resources of the Brantas River Basin, East Java. Report of the study on
Comprehensive Management Plan for the Resources of the Brantas Basin, Faculty
of Fisheries, Brawijaya University, Malang
Takara Kaoru, (2005), A Rainfall-sediment model in the upper Brantas River, East Java,
Indonesia, First International Workshop on Water and Sediment Management in
Brantas River Basin.
Whitten T, Soeriaatmadja RE, and Affif SA (1996), The Ecology of Java and Bali. Volume
II. Dalhouise University, Nova Scotia.
“ 8th APRU Doctoral Students Conference” Keio University, Tokyo July 30th – August 3rd , 2007
Mohammad Sholichin, Faridah Othman, Shatirah Akib
16
Figure 1. Lesti River basin as case study
Figure 2. Location of water sample in Tributaries Lesti River basin
“ 8th APRU Doctoral Students Conference” Keio University, Tokyo July 30th – August 3rd , 2007
Mohammad Sholichin, Faridah Othman, Shatirah Akib
17
Figure 3. Soil Type of Lesti River basin
Figure 4. Land Use of Lesti River basin
“ 8th APRU Doctoral Students Conference” Keio University, Tokyo July 30th – August 3rd , 2007
Mohammad Sholichin, Faridah Othman, Shatirah Akib
18
Figure 5. Land Slope Distribution of Lesti River basin
Figure 6. Pathways for water movement within SWAT.
“ 8th APRU Doctoral Students Conference” Keio University, Tokyo July 30th – August 3rd , 2007
Mohammad Sholichin, Faridah Othman, Shatirah Akib
19
Sediment in Lesti River
-
100,000
200,000
300,000
400,000
500,000
600,000
700,000
800,000
0120
03
0520
03
0920
03
0120
04
0520
04
0920
04
0120
05
0520
05
0920
05
0120
06
0520
06
0920
06
Month-Year
Sedi
men
t-ton
SedimentMonthly LoadDaily Load
Figure 7. Sediment yield in Lesti River stream base on SWAT simulated.
Nitrogen Load in Lesti River stream
-
100,000
200,000
300,000
400,000
500,000
600,000
0120
03
0520
03
0920
03
0120
04
0520
04
0920
04
0120
05
0520
05
0920
05
0120
06
0520
06
0920
06
Month-Year
Nitr
ogen
load
(Kg)
NitrogenMonthly loadDaily load
Figure 8. Nitrogen Load in Lesti River stream base on SWAT simulated.
Phosphorous load in Lesri River stream
-
20,000
40,000
60,000
80,000
100,000
120,000
0120
03
0520
03
0920
03
0120
04
0520
04
0920
04
0120
05
0520
05
0920
05
0120
06
0520
06
0920
06
Month-Year
Phos
phor
ous
load
(Kg)
PhosphorousMonthly loadDaily load
Figure 9. Phosphorous Load in Lesti River stream base on SWAT simulated.

“ 8th APRU Doctoral Students Conference” Keio University, Tokyo July 30th – August 3rd , 2007
Mohammad Sholichin, Faridah Othman, Shatirah Akib
20
Table 1. Soil type in Lesti River Basin Soil Type Area (Ha) Percent (%)
Alluvial 254.15 42
Andosol 29.04 4.8
Kambisol 8.97 1.48
Latosol 150.44 24.86
Lithosol 34.01 5.62
Mediteran 30.35 5.01
Regosol 98.23 16.23
Total 60,519 100
Table 2. Land use in Lesti River Basin Land use Area (Ha) Percent (%)
Dry land 15,025 24.82
mix- dry land 7,077 11.69
Forestry 8,949 14.78
Rice field 16,095 26.59
Urban/Rural 13,373 22.09
Total 60,519 100
Table 3. Water quality data from survey investigation at 5 tributaries.
TSS NO3 NH4 PO4 (mg/l) (mg/l) (mg/l) (mg/l)
Lesti river 100 1.33 0.03 0.23 49.7
Sipring 100 2.67 0.03 0.2 28.7
Jurungan 100 1.33 0.02 0.19 30.3
Rembun 200 1.02 0.05 0.17 96.7
Genteng 100 1.33 0.02 0.08 38.9
Tributary name Turbidity (NTU)
Table 4. Fertilizer used for each plant.
Urea TSP KCL ZA
Rice field 300 100 75 100
Corn 200 100 50 100
Soybean 50 50 50 50
Plant NameFertilizer (Kg/Ha), Maximum
“ 8th APRU Doctoral Students Conference” Keio University, Tokyo July 30th – August 3rd , 2007
Mohammad Sholichin, Faridah Othman, Shatirah Akib
21
Table 5. Waste water from industries in Lesti river basin Discharge (m3/day) pH BOD COD SS TN TP
PT Eka Mas Fortuna Paper 7500 6.9 706 1632 786 3.9 0.9
PT Intaf Turen Tapioca 600 4.7 1401 1272 500 1.42 2.71
PG Kebun Agung Sugar 350 7.1 130 307 162 0.7 0.9
PT Bumi M Internusa Food 100 7.2 462 1091 266 96.3 4.5
Name of Industries Products Parameters of Water Quality (mg/l)
Table 6. Total daily load pollutant from industries.
Disch
(m3/day) BOD SS TN TP BOD SS TN TP
PT Eka Mas Fortuna 7,500.0 706.0 786.0 3.9 0.9 5,295.0 5,895.0 29.3 6.8
PT Intaf Turen 600.0 1,401.0 500.0 1.4 2.7 840.6 300.0 0.9 1.6
PG Kebun Agung 350.0 130.0 162.0 0.7 0.9 45.5 56.7 0.2 0.3
PT Bumi M Internusa 100.0 462.0 266.0 96.3 4.5 46.2 26.6 9.6 0.5
6,227.3 6,278.3 40.0 9.1
186,819 188,349 1,199 274 Average Pollutant Load / month
Pollutant Load (kg/day)
Total Pollutant Load / day
Name of Industries Concentration (mg/l)
Table 7. Total daily load pollutant from domestic area
100% 25% 14.5 g N 1.9 P 7 g N 2 g P N kg/day P kg/day
Upper Lesti 147,437 36,859 534,459 70,033 258,015 73,719 792 144
Lower Lesti 221,156 55,289 801,689 105,049 387,022 110,578 1,189 216 Genteng 122,864 30,716 445,383 58,361 215,012 61,432 660 120
2,642 479
79,247 14,375 Avergae Pollutant Load / month
Faces (person/day) Urine (person/day) Pollutant Load
Total Pollutant Load / day
Sub Basin Name Population
Table 8. Total daily load pollutant from agriculture area
Name Urea (N) TSP (P)of plant (Kg/Ha) (Kg/Ha) N Kg/day P Kg/day
Rice field 16,095 Rice 200 - 15% 1,323 -Dry land 15,025 Corn - 100 1,2% - 49.40 Mix dry land 7,077 Soybean - 100 1,2% - 23.27
1,323 72.66
Pollutant LoadDissolve
Total Pollutant Load / day
Type of land use Area (Ha)
Table 9. The summarized of total daily load pollutant of nutrient in Lesti River basin.
Nitrogen PhosphorousPoint source (industries) 39.98 9.14 Non Point Source a. Domestic 2,641.58 479.17 b. Agriculture 1,322.88 72.66 MOS 10% 400.44 56.10
Pollutant Load /day 4,404.88 617.07
Pollutant Load (Kg/day)The Sources of Pollutant
“ 8th APRU Doctoral Students Conference” Keio University, Tokyo July 30th – August 3rd , 2007
Mohammad Sholichin, Faridah Othman, Shatirah Akib
22
Table 10. Discharge and sediment load in Lesti River stream Date Flow Sed yield Date Flow Sed yield Date Flow Sed yield Date Flow Sed yield
m3/sec ton m3/sec ton m3/sec Ton m3/sec Ton012003 30 282,555 012004 54 455,400 012005 21 115,110 012006 72 778,950 022003 19 77,490 022004 31 173,025 022005 37 242,505 022006 61 341,910 032003 47 360,045 032004 37 277,110 032005 27 198,180 032006 19 107,280 042003 23 89,055 042004 14 24,359 042005 36 235,755 042006 8 6,741 052003 5 1,997 052004 4 4,365 052005 6 6,426 052006 4 3,542 062003 5 475 062004 6 16,169 062005 6 4,905 062006 4 155 072003 3 10,557 072004 6 4,991 072005 6 2,710 072006 4 14,706 082003 5 13,572 082004 5 12,461 082005 11 3,538 082006 5 10,958 092003 5 7,650 092004 5 211 092005 2 7,146 092006 6 4,279 102003 5 14,270 102004 6 11,552 102005 5 17,703 102006 8 53,640 112003 25 100,665 112004 21 152,730 112005 12 79,470 112006 31 257,355 122003 95 495,900 122004 69 627,300 122005 25 187,425 122006 66 559,800
Sed load/Month 121,186 Sed load/Month 146,639 Sed load/Month 91,739 Sed load/Month 178,276Daily Load/day 4,040 Daily Load/day 4,888 Daily Load/day 3,058 Daily Load/day 5,943
Average load/Month 134,460 Daily Load/day 4,482 Table 11. Nitrogen load in Lesti River stream.
Date Nitrogen Date Nitrogen Date Nitrogen Date NitrogenKg Kg Kg Kg
012003 312,671 012004 357,751 012005 150,181 012006 521,748 022003 91,814 022004 117,177 022005 172,402 022006 318,364 032003 171,503 032004 100,478 032005 85,277 032006 31,663 042003 44,007 042004 16,692 042005 82,237 042006 6,340 052003 3,868 052004 10,168 052005 6,775 052006 8,406 062003 1,560 062004 41,275 062005 9,552 062006 8,406 072003 36,499 072004 20,973 072005 10,612 072006 44,068 082003 59,686 082004 47,562 082005 78,282 082006 2,824 092003 26,461 092004 20,199 092005 30,774 092006 23,282 102003 58,027 102004 73,892 102005 80,539 102006 106,781 112003 194,827 112004 153,247 112005 99,797 112006 232,717 122003 379,314 122004 272,430 122005 139,010 122006 228,408
N load/Month 115,020 N load/Month 102,654 N load/Month 78,786 N load/Month 127,751 Daily Load/day 3,834 Daily Load/da 3,422 Daily Load/da 2,626 Daily Load/da 4,258
AverageN load/Month 106,053 Daily Load/day 3,535 Table 12. Phosphorous load in Lesti River stream.
Date Phosphrous Date Phosphrous Date Phosphrous Date PhosphrousKg Kg Kg Kg
012003 39,504 012004 63,060 012005 26,652 012006 98,112 022003 14,669 022004 15,883 022005 25,586 022006 55,680 032003 29,196 032004 16,456 032005 14,358 032006 5,564 042003 5,507 042004 1,528 042005 10,764 042006 339 052003 318 052004 269 052005 759 052006 199 062003 56 062004 1,133 062005 396 062006 19 072003 441 072004 649 072005 102 072006 495 082003 1,001 082004 1,185 082005 2,740 082006 440 092003 312 092004 31 092005 160 092006 50 102003 772 102004 942 102005 788 102006 3,701 112003 22,615 112004 14,867 112005 7,889 112006 20,149 122003 67,212 122004 52,080 122005 21,096 122006 28,704
N load/Mo 15,133 N load/Mo 14,007 N load/Mo 9,274 N load/Mo 17,788 Daily Load/ 504 Daily Load/ 467 Daily Load/ 309 Daily Load/ 593
AverageN load/Mo 14,050 Daily Load/ 468
Related Documents