1 PRELIMINARY STUDY OF RIETI EARTHQUAKE GROUND MOTION DATA V4 INGV: ITACA-ESM Working Group, 1 SHAKEMAP working group. 2 ReLUIS: Iunio Iervolino ([email protected]), 3 Georgios Baltzopoulos, 4 Eugenio Chioccarelli, 4 Akiko Suzuki. 3 Warning: This report may be subjected to editing and revisions, check www.reluis.it, esm.mi.ingv.it and www.itc.cnr.it for updates. INDEX 1. What’s New 2. Introduction 3. Geographic Information 4. Strong Motion Data 5. Data comparison with GMPE 6. Elastic and Inelastic Response Spectra 7. Comparison with the Italian seismic code 8. Pulse-like near-source ground motions Data and resources References Appendix 1 1 The ITACA-ESM Working Group is: Lucia Luzi ([email protected]); Francesca Pacor; Rodolfo Puglia; Maria D'Amico; Emiliano Russo; Chiara Felicetta; Giovanni Lanzano. INGV-Milano, Italy. 2 The SHAKEMAP Working Group is: Alberto Michelini ([email protected]); Licia Faenza; Valentino Lauciani. INGV-CNT, Italy. 3 Dipartimento di Strutture per l’Ingegneria e l’Architettura, Università degli Studi di Napoli Federico II, Italy. 4 Istituto per le Tecnologie della Costruzione ITC-CNR, URT Università degli Studi di Napoli Federico II, Italy. Cite as: ReLUIS-INGV Workgroup (2016), Preliminary study of Rieti earthquake ground motion records V4, available at http://www.reluis.it.

Welcome message from author
This document is posted to help you gain knowledge. Please leave a comment to let me know what you think about it! Share it to your friends and learn new things together.
Transcript

1
PRELIMINARY STUDY OF
RIETI EARTHQUAKE
GROUND MOTION DATA V4
INGV: ITACA-ESM Working Group,1 SHAKEMAP working group.2
ReLUIS: Iunio Iervolino ([email protected]),3 Georgios Baltzopoulos,4 Eugenio Chioccarelli,4 Akiko Suzuki.3
Warning: This report may be subjected to editing and revisions, check www.reluis.it, esm.mi.ingv.it
and www.itc.cnr.it for updates.
INDEX
1. What’s New
2. Introduction
3. Geographic Information
4. Strong Motion Data
5. Data comparison with GMPE
6. Elastic and Inelastic Response Spectra
7. Comparison with the Italian seismic code
8. Pulse-like near-source ground motions
Data and resources
References
Appendix 1
1 The ITACA-ESM Working Group is: Lucia Luzi ([email protected]); Francesca Pacor; Rodolfo Puglia; Maria
D'Amico; Emiliano Russo; Chiara Felicetta; Giovanni Lanzano. INGV-Milano, Italy. 2 The SHAKEMAP Working Group is: Alberto Michelini ([email protected]); Licia Faenza; Valentino
Lauciani. INGV-CNT, Italy. 3 Dipartimento di Strutture per l’Ingegneria e l’Architettura, Università degli Studi di Napoli Federico II, Italy. 4 Istituto per le Tecnologie della Costruzione ITC-CNR, URT Università degli Studi di Napoli Federico II, Italy.
Cite as: ReLUIS-INGV Workgroup (2016), Preliminary study of Rieti
earthquake ground motion records V4, available at http://www.reluis.it.

2
1. What’s New New elements of this version are:
● The “Comparison with the Italian seismic code” section has been enriched with the disaggregation
distributions.
● Elastic and inelastic response spectra have been added so that the report includes all recorded
ground motions with an epicentral distance Repi<50km; records from greater distances have been
omitted from the detailed (tabulated and plotted) presentation.
● Preliminary investigation for near-source pulse-like effects in ground motion added.
2. Introduction The Italian Accelerometric Network (RAN), managed by the Department of Civil Protection (DPC), and the
Italian seismic network (RSN), managed by the Istituto Nazionale di Geofisica e Vulcanologia (INGV) have
made available the records of the recent earthquake with epicenter located in the vicinity of Amatrice, central
Italy (date 24/08/2016 1.36:32 AM – UTC; Mw 6.0, ref. Bollettino Sismico INGV).
About 200 accelerometric signals, manually processed using the procedure by Paolucci et al (2011), are
used to evaluate the peak ground motion, acceleration and displacement spectral ordinates, integral parameters
and measures of duration. Corrected records and details of correction are available on the Engineering
Strong-Motion database website (http://esm.mi.ingv.it). The unprocessed records are available at
http://ran.protezionecivile.it/IT/index.php?evid=340867 for the RAN network and at the European
Integrated Data Archive (http://www.orfeus-eu.org/data/eida/) for the RSN, that also distributes local
networks (University of Genova, University of Trieste, OGS, AMRA, among others).
In order to analyze peak values and spectral acceleration (Sa or PSA), data have been processed and
compared to the Ground Motion Prediction Equation (GMPE) by Bindi et al (2011) for rock and soil. The
geometric mean of the horizontal components are used in the analysis. As a function of epicentral distance and
for fixed spectral ordinate, the average attenuation law (and its standard deviation) have been compared with the
points corresponding to the values recorded at the various stations.
Moreover, Peak Ground Acceleration (PGA), Peak Ground Velocity (PGV) and Peak Ground
Displacement (PGD) are calculated for the three components and they are reported in Tables 1. Arias Intensity
(IA) and Housner Intensity (or spectral intensity - SI) are the integral parameters computed for each record.
Durations is computed for each record as Significant Duration estimated between 5% and 95% (D5-95) and
between 5% and 75% (D5-75) of the IA. In Tables 2 are reported integral parameters and duration for the three
directions of each record.

3
3. Geographic Information
An earthquake of Mw 6.0 struck central Italy on 2016-08-24 at 01:36:32 GMT (Bollettino sismico INGV),
in the vicinity of Amatrice, causing diffuse building collapse and about 270 casualties. The causative fault is
normal, the prevalent style of faulting in the area. The location of the epicentre and the distribution of strong-
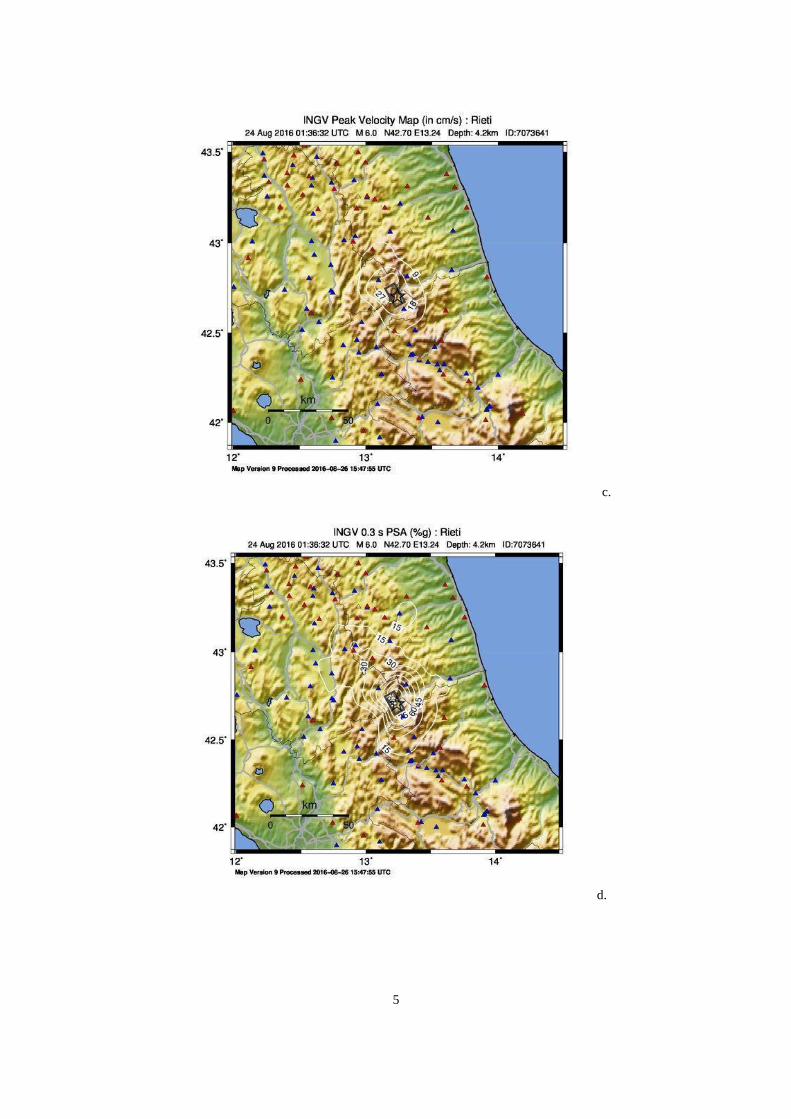
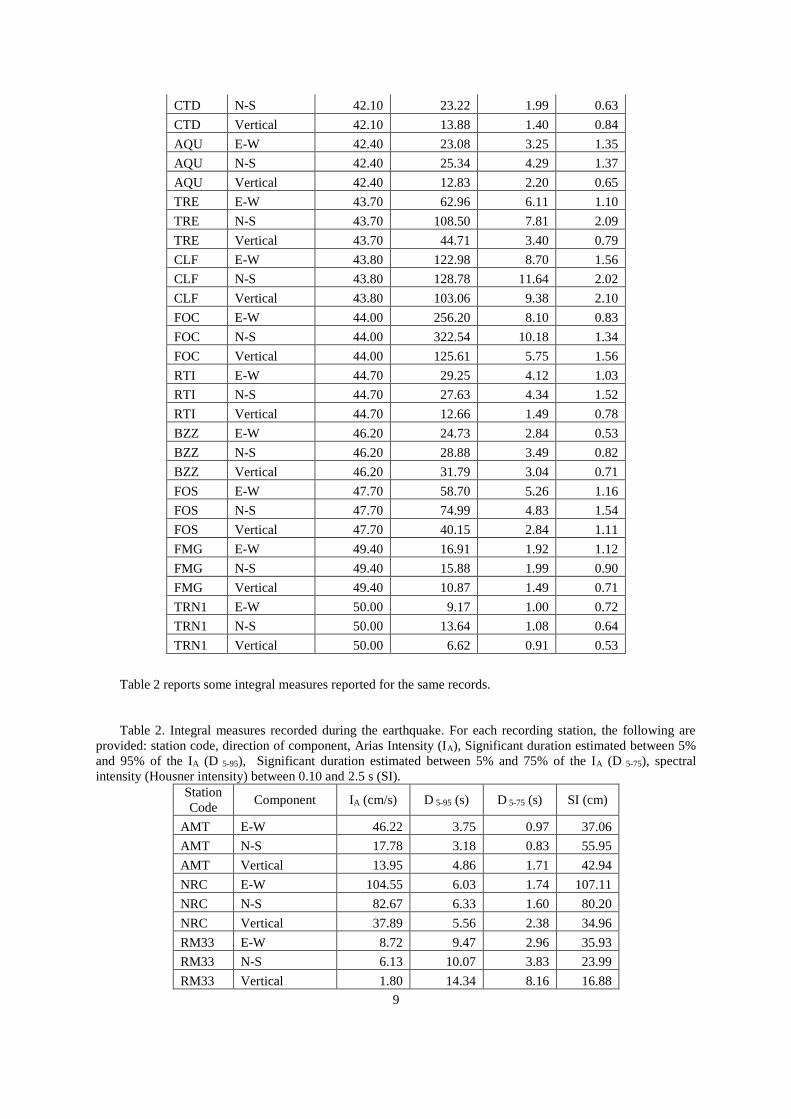
motion stations are reported in Figure 1. Figure 2 shows the MMI shakemap of the event that includes the
records published on 24/08/2016 and in the subsequent days as more data became available. The shakemap has
been adjourned accordingly as more data or information (finite fault) have become available and published on
the INGV Shakemap web site (Michelini et al., 2008). The shakemaps of Figure 2 provide a description of the
recorded strong ground motion according to different measurables of engineering interest.
The Amatrice seismic sequence struck an area where several large earthquakes occurred in the past.
According to the recent historical catalog CPTI15 (Rovida et al., 2016 http://emidius.mi.ingv.it/CPTI15-
DBMI15/, updated to 2015) the strongest earthquake occurred on 1639 (Amatrice, Io 9-10 MCS, Mw 6.2) and
destroyed the Amatrice village and its neighbourhood (Figure 3).
Figure 1: location of the epicentre (yellow star) and strong motion stations within 200 km from the
epicentre. The square indicate strong-motion stations and the colors correspond to the PGA values (gal).

4
a.
b.
5
c.
d.

6
e.
f.
Figure 2: Revised shakemap of the mainshock. a.) MMI intensity; b.) PGA; c.) PGV; d.) PSA 0.3 s period;
d.) PSA 1.0 s period; d.) PSA 3.0 s period.
(Downloaded on 8/27/2016 from http://shakemap.rm.ingv.it/shake/7073641/intensity.html)

7
Figure 3: macroseismic field of the 1639 Mw 6.2 Amatrice earthquake (from http://emidius.mi.ingv.it/CPTI15-
DBMI15/)
4. Strong Motion Data The Italian Accelerometric Network (RAN), managed by the Department of Civil Protection (DPC), and the
Italian seismic network, managed by the Istituto Nazionale di Geofisica e Vulcanologia (INGV) have made
available the records of about 200 accelerometric stations. Appendix 1 lists networks id, station id, geographic
coordinates of the station and soil type, where available. These data are also available at the Engineering Strong-
motion database (esm.mi.ingv.it).
The largest Peak Ground Acceleration (PGA) have been recorded at short epicentral distances (< 15 km) at
the stations Amatrice (AMT, 452.60 gal, uncorrected value, E-W component), Norcia (NRC, 376.96, N-S
component) and Arquata del Tronto (RQT, 447.87 gal, E-W component, N-S component not available). The
peak parameters of the available records are reported in the following table:
Table 1. Peak parameters recorded during the earthquake. For each recording station, the following is
provided: station code, direction of record, distance from the epicentre (Repi), peak ground acceleration (PGA), peak ground velocity (PGV), peak ground displacement (PGD).
Station
Code Component
Repi
(km) PGA (cm/s/s) PGV (cm/s) PGD (cm)
AMT E-W 8.90 424.98 21.52 1.54
AMT N-S 8.90 183.48 20.48 4.26
AMT Vertical 8.90 194.04 16.72 4.46
NRC E-W 13.70 352.65 29.67 5.71
NRC N-S 13.70 366.32 23.77 6.96
NRC Vertical 13.70 211.48 11.68 3.26
RM33 E-W 22.30 100.36 9.30 2.39
RM33 N-S 22.30 99.03 6.24 2.01
RM33 Vertical 22.30 35.18 4.99 1.76

8
SPD E-W 23.70 51.91 4.98 0.95
SPD N-S 23.70 99.85 7.63 1.78
SPD Vertical 23.70 53.69 6.29 1.90
LSS E-W 27.40 21.78 1.78 0.51
LSS N-S 27.40 18.15 1.99 0.64
LSS Vertical 27.40 14.49 1.61 0.66
PZI1 E-W 30.70 44.34 4.34 1.29
PZI1 N-S 30.70 45.15 4.71 1.25
PZI1 Vertical 30.70 25.44 3.13 1.12
TERO E-W 32.90 55.54 3.16 1.27
TERO N-S 32.90 83.55 4.31 1.52
TERO Vertical 32.90 35.03 2.84 0.98
ANT E-W 34.30 14.09 2.42 1.33
ANT N-S 34.30 23.08 3.82 1.46
ANT Vertical 34.30 8.96 2.05 0.88
TRL E-W 36.30 34.88 3.96 1.02
TRL N-S 36.30 38.43 3.74 1.24
TRL Vertical 36.30 17.83 2.05 0.91
AQF E-W 37.20 43.38 2.62 0.85
AQF N-S 37.20 37.25 2.40 0.92
AQF Vertical 37.20 32.66 2.51 0.79
ASP E-W 37.20 84.91 3.19 0.54
ASP N-S 37.20 81.77 2.75 0.54
ASP Vertical 37.20 37.82 1.95 0.57
AQV E-W 37.30 59.60 3.93 0.83
AQV N-S 37.30 45.27 4.40 0.90
AQV Vertical 37.30 22.75 2.69 0.84
AQA E-W 37.40 2.32 0.18 0.07
AQA N-S 37.40 2.39 0.19 0.06
AQA Vertical 37.40 0.84 0.16 0.05
SPM E-W 38.40 65.95 2.39 0.73
SPM N-S 38.40 63.55 3.04 1.46
SPM Vertical 38.40 20.57 1.39 0.61
MNF E-W 38.90 71.66 4.77 1.31
MNF N-S 38.90 43.46 2.90 1.43
MNF Vertical 38.90 59.66 4.65 1.97
GSA E-W 39.00 35.40 1.90 0.57
GSA N-S 39.00 36.42 2.56 0.94
GSA Vertical 39.00 18.16 1.93 0.77
SPO1 E-W 41.20 47.84 3.60 0.88
SPO1 N-S 41.20 44.81 4.43 1.54
SPO1 Vertical 41.20 31.95 2.21 0.57
AQK E-W 42.10 49.52 9.03 2.66
AQK N-S 42.10 57.03 9.80 2.76
AQK Vertical 42.10 33.00 4.17 0.85
CTD E-W 42.10 31.39 2.07 0.78
9
CTD N-S 42.10 23.22 1.99 0.63
CTD Vertical 42.10 13.88 1.40 0.84
AQU E-W 42.40 23.08 3.25 1.35
AQU N-S 42.40 25.34 4.29 1.37
AQU Vertical 42.40 12.83 2.20 0.65
TRE E-W 43.70 62.96 6.11 1.10
TRE N-S 43.70 108.50 7.81 2.09
TRE Vertical 43.70 44.71 3.40 0.79
CLF E-W 43.80 122.98 8.70 1.56
CLF N-S 43.80 128.78 11.64 2.02
CLF Vertical 43.80 103.06 9.38 2.10
FOC E-W 44.00 256.20 8.10 0.83
FOC N-S 44.00 322.54 10.18 1.34
FOC Vertical 44.00 125.61 5.75 1.56
RTI E-W 44.70 29.25 4.12 1.03
RTI N-S 44.70 27.63 4.34 1.52
RTI Vertical 44.70 12.66 1.49 0.78
BZZ E-W 46.20 24.73 2.84 0.53
BZZ N-S 46.20 28.88 3.49 0.82
BZZ Vertical 46.20 31.79 3.04 0.71
FOS E-W 47.70 58.70 5.26 1.16
FOS N-S 47.70 74.99 4.83 1.54
FOS Vertical 47.70 40.15 2.84 1.11
FMG E-W 49.40 16.91 1.92 1.12
FMG N-S 49.40 15.88 1.99 0.90
FMG Vertical 49.40 10.87 1.49 0.71
TRN1 E-W 50.00 9.17 1.00 0.72
TRN1 N-S 50.00 13.64 1.08 0.64
TRN1 Vertical 50.00 6.62 0.91 0.53
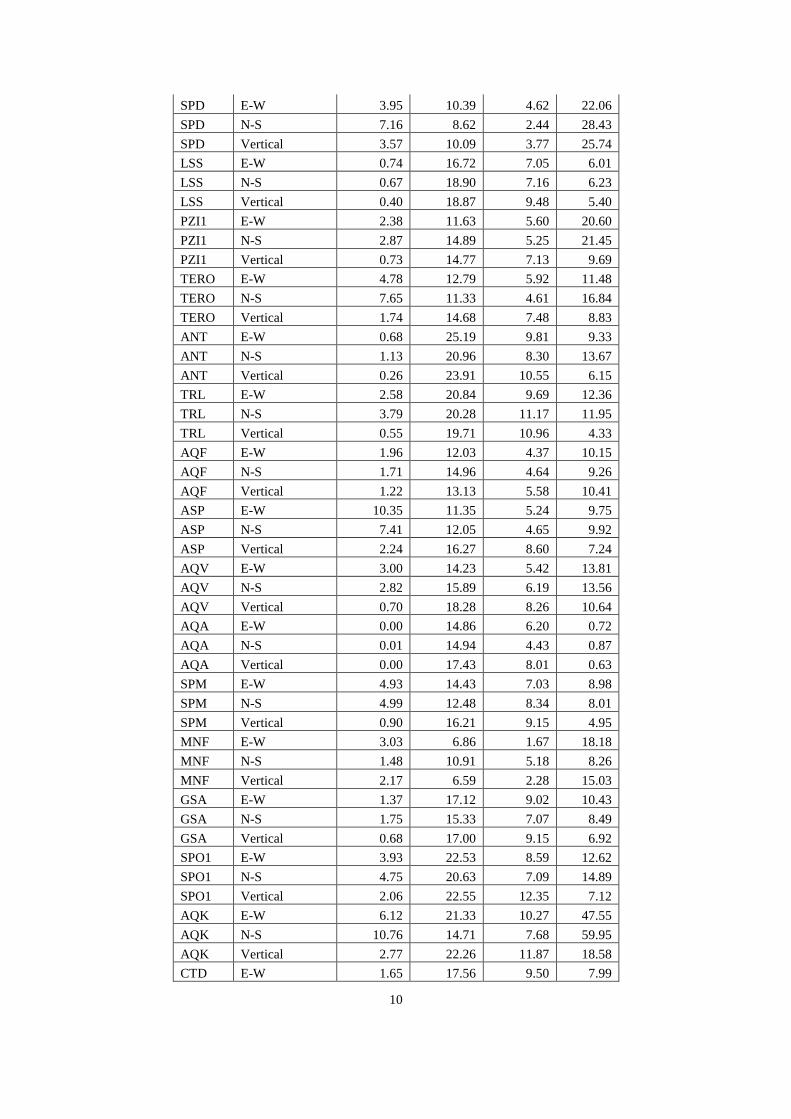
Table 2 reports some integral measures reported for the same records.
Table 2. Integral measures recorded during the earthquake. For each recording station, the following are
provided: station code, direction of component, Arias Intensity (IA), Significant duration estimated between 5%
and 95% of the IA (D 5-95), Significant duration estimated between 5% and 75% of the IA (D 5-75), spectral
intensity (Housner intensity) between 0.10 and 2.5 s (SI).
Station
Code Component IA (cm/s) D 5-95 (s) D 5-75 (s) SI (cm)
AMT E-W 46.22 3.75 0.97 37.06
AMT N-S 17.78 3.18 0.83 55.95
AMT Vertical 13.95 4.86 1.71 42.94
NRC E-W 104.55 6.03 1.74 107.11
NRC N-S 82.67 6.33 1.60 80.20
NRC Vertical 37.89 5.56 2.38 34.96
RM33 E-W 8.72 9.47 2.96 35.93
RM33 N-S 6.13 10.07 3.83 23.99
RM33 Vertical 1.80 14.34 8.16 16.88
10
SPD E-W 3.95 10.39 4.62 22.06
SPD N-S 7.16 8.62 2.44 28.43
SPD Vertical 3.57 10.09 3.77 25.74
LSS E-W 0.74 16.72 7.05 6.01
LSS N-S 0.67 18.90 7.16 6.23
LSS Vertical 0.40 18.87 9.48 5.40
PZI1 E-W 2.38 11.63 5.60 20.60
PZI1 N-S 2.87 14.89 5.25 21.45
PZI1 Vertical 0.73 14.77 7.13 9.69
TERO E-W 4.78 12.79 5.92 11.48
TERO N-S 7.65 11.33 4.61 16.84
TERO Vertical 1.74 14.68 7.48 8.83
ANT E-W 0.68 25.19 9.81 9.33
ANT N-S 1.13 20.96 8.30 13.67
ANT Vertical 0.26 23.91 10.55 6.15
TRL E-W 2.58 20.84 9.69 12.36
TRL N-S 3.79 20.28 11.17 11.95
TRL Vertical 0.55 19.71 10.96 4.33
AQF E-W 1.96 12.03 4.37 10.15
AQF N-S 1.71 14.96 4.64 9.26
AQF Vertical 1.22 13.13 5.58 10.41
ASP E-W 10.35 11.35 5.24 9.75
ASP N-S 7.41 12.05 4.65 9.92
ASP Vertical 2.24 16.27 8.60 7.24
AQV E-W 3.00 14.23 5.42 13.81
AQV N-S 2.82 15.89 6.19 13.56
AQV Vertical 0.70 18.28 8.26 10.64
AQA E-W 0.00 14.86 6.20 0.72
AQA N-S 0.01 14.94 4.43 0.87
AQA Vertical 0.00 17.43 8.01 0.63
SPM E-W 4.93 14.43 7.03 8.98
SPM N-S 4.99 12.48 8.34 8.01
SPM Vertical 0.90 16.21 9.15 4.95
MNF E-W 3.03 6.86 1.67 18.18
MNF N-S 1.48 10.91 5.18 8.26
MNF Vertical 2.17 6.59 2.28 15.03
GSA E-W 1.37 17.12 9.02 10.43
GSA N-S 1.75 15.33 7.07 8.49
GSA Vertical 0.68 17.00 9.15 6.92
SPO1 E-W 3.93 22.53 8.59 12.62
SPO1 N-S 4.75 20.63 7.09 14.89
SPO1 Vertical 2.06 22.55 12.35 7.12
AQK E-W 6.12 21.33 10.27 47.55
AQK N-S 10.76 14.71 7.68 59.95
AQK Vertical 2.77 22.26 11.87 18.58
CTD E-W 1.65 17.56 9.50 7.99

11
CTD N-S 1.00 22.18 10.82 5.73
CTD Vertical 0.31 18.95 11.10 4.93
AQU E-W 1.15 28.51 9.58 18.23
AQU N-S 1.27 24.79 8.77 16.72
AQU Vertical 0.51 17.98 10.09 9.59
TRE E-W 5.10 14.62 6.19 15.19
TRE N-S 10.62 14.52 3.36 26.17
TRE Vertical 2.13 15.16 8.15 10.08
CLF E-W 18.13 9.03 2.96 35.24
CLF N-S 14.11 10.80 2.65 36.16
CLF Vertical 13.98 5.31 2.89 24.35
FOC E-W 36.24 5.60 1.83 17.56
FOC N-S 38.48 4.22 1.85 19.62
FOC Vertical 10.41 8.57 5.78 15.55
RTI E-W 4.23 43.19 26.03 19.60
RTI N-S 3.75 49.41 24.11 20.11
RTI Vertical 0.59 33.12 15.34 4.99
BZZ E-W 1.02 15.98 7.08 10.31
BZZ N-S 1.22 14.32 5.78 14.24
BZZ Vertical 0.94 15.84 6.99 12.84
FOS E-W 4.64 9.02 2.80 16.58
FOS N-S 5.94 8.81 3.11 13.80
FOS Vertical 1.52 13.19 7.58 10.17
FMG E-W 0.41 19.65 8.36 6.92
FMG N-S 0.49 20.66 8.42 9.41
FMG Vertical 0.22 19.20 9.41 4.26
TRN1 E-W 0.21 31.49 11.52 2.69
TRN1 N-S 0.19 29.03 11.68 4.02
TRN1 Vertical 0.11 33.49 13.72 2.48

12
Figures 4 to 8 are the maps showing the spatial distribution of the peak ground values
Figure 4. Map of the Peak Ground Acceleration (maximum between horizontal components, in cm/s2). The star
indicates the epicenter of the mainshock
Figure 5. Map of the Peak Ground Velocity (maximum between horizontal components, cm/s). The star
indicates the epicenter of the mainshock

13
Figure 6. Map of the Peak Ground Displacement (maximum between horizontal components, cm). The star
indicates the epicenter of the mainshock
Figure 7. Map of the Arias Intensity (maximum between horizontal components, cm/s). The star indicates the
epicenter of the mainshock

14
Figure 8. Map of the significant duration (maximum between horizontal components, s). The star indicates the
epicenter of the mainshock
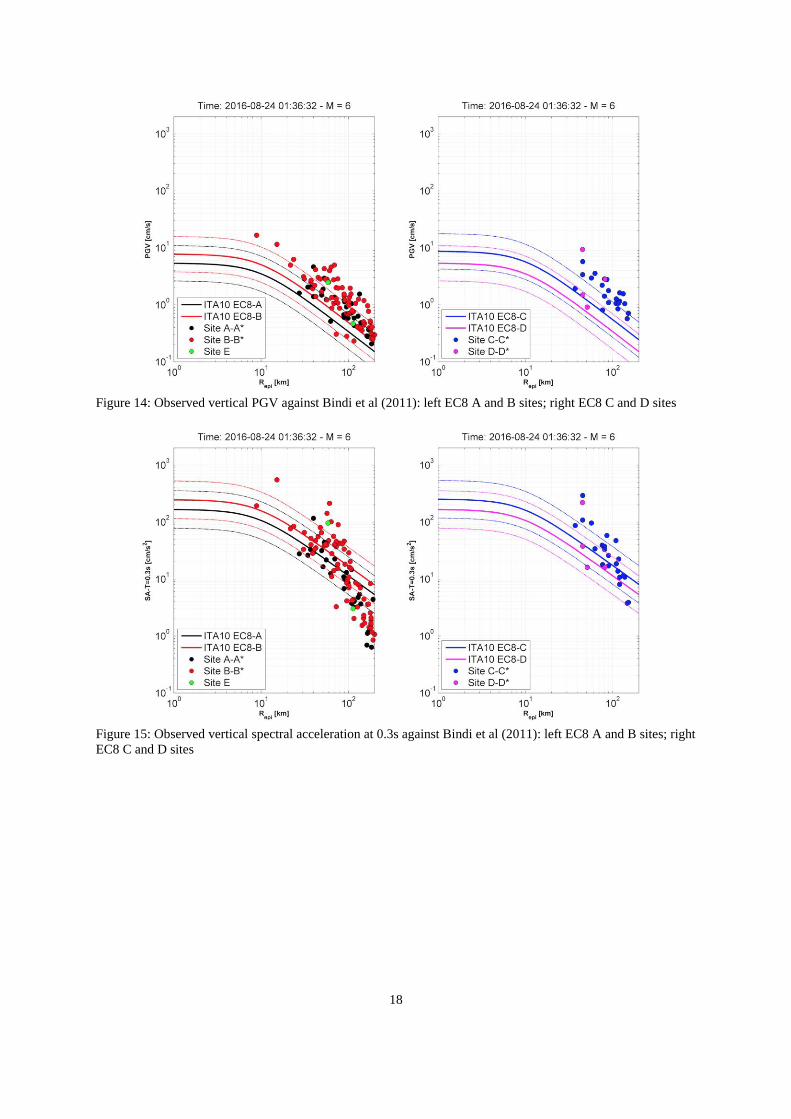
5. Data comparison with GMPE Some GM parameters (PGA, PGV and acceleration spectral ordinates at 0.3, 1 and 3 seconds, period used
to calculate shakemaps) are compared to the predictions by Bindi et al (2011). These results can be considered
as preliminary since:
● the distance is the epicentral distance, whilst Bindi et al. adopts the Joyner-Boore distance; the latter
could not be estimated because the fault geometry is still not available.
● the comparison at 3s is outside the range of validity of this GMPE, that can be used until 2s.
We calculated the prediction for: PGA, PGV, SA at 0.3s, 1s and 3s for the geometric mean of the horizontal
components and the vertical component at two different moment magnitudes, 6.0 and a 6.2. For the vertical
component, the SA at 3s was not implemented by Bindi et al (2011), therefore we evaluated the goodness of fit
with the prediction at 2s.
Figures 9-17 show the results for Mw 6.0, while Figure 18-25 show the results for Mw 6.2.

15
Figure 9: Observed horizontal PGA against Bindi et al (2011): left EC8 A and B sites; right EC8 C and D sites
Figure 10: Observed horizontal PGV against Bindi et al (2011): left EC8 A and B sites; right EC8 C and D sites

16
Figure 10: Observed horizontal SA (0.3s) against Bindi et al (2011): left EC8 A and B sites; right EC8 C and D
sites
Figure 11: Observed horizontal SA (1s) against Bindi et al (2011): left EC8 A and B sites; right EC8 C and D
sites

17
Figure 12: Observed horizontal SA (3s) against Bindi et al (2011): left EC8 A and B sites; right EC8 C and D
sites
Figure 13: Observed vertical PGA against Bindi et al (2011): left EC8 A and B sites; right EC8 C and D sites
18
Figure 14: Observed vertical PGV against Bindi et al (2011): left EC8 A and B sites; right EC8 C and D sites
Figure 15: Observed vertical spectral acceleration at 0.3s against Bindi et al (2011): left EC8 A and B sites; right
EC8 C and D sites
19
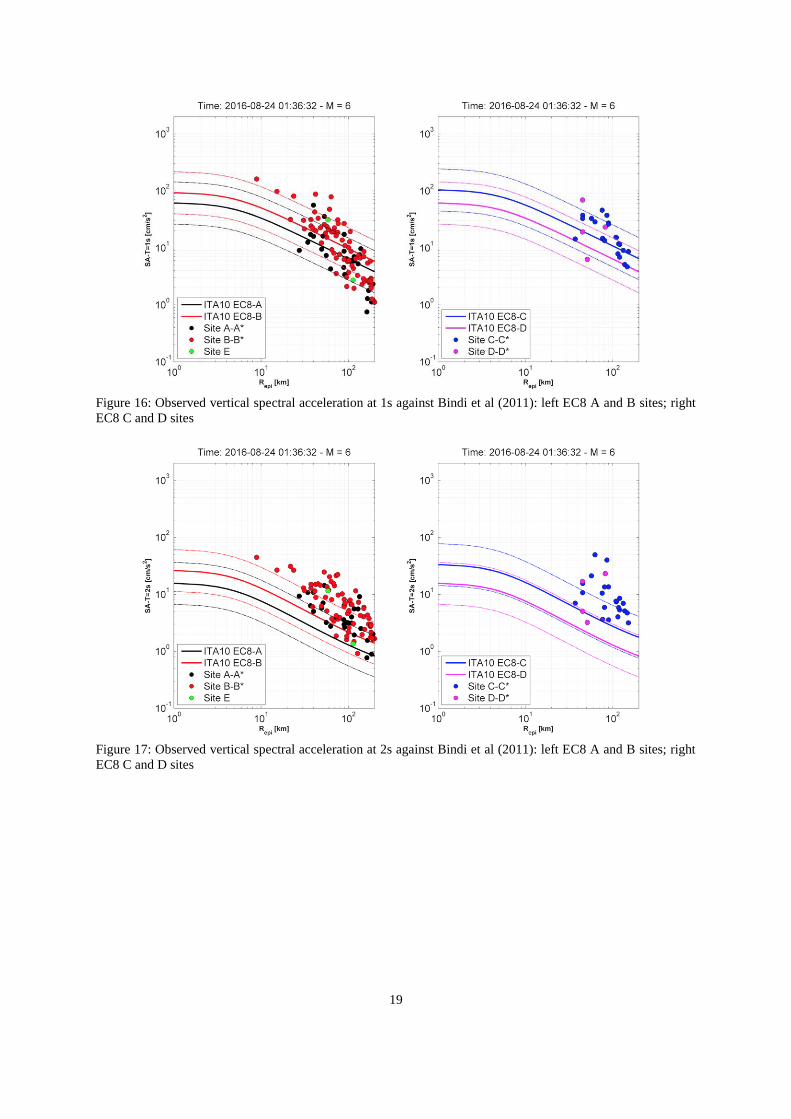
Figure 16: Observed vertical spectral acceleration at 1s against Bindi et al (2011): left EC8 A and B sites; right
EC8 C and D sites
Figure 17: Observed vertical spectral acceleration at 2s against Bindi et al (2011): left EC8 A and B sites; right
EC8 C and D sites

20
Figure 18: Observed horizontal PGA against Bindi et al (2011): left EC8 A and B sites; right EC8 C and D sites
Figure 19: Observed horizontal PGV against Bindi et al (2011): left EC8 A and B sites; right EC8 C and D sites
21
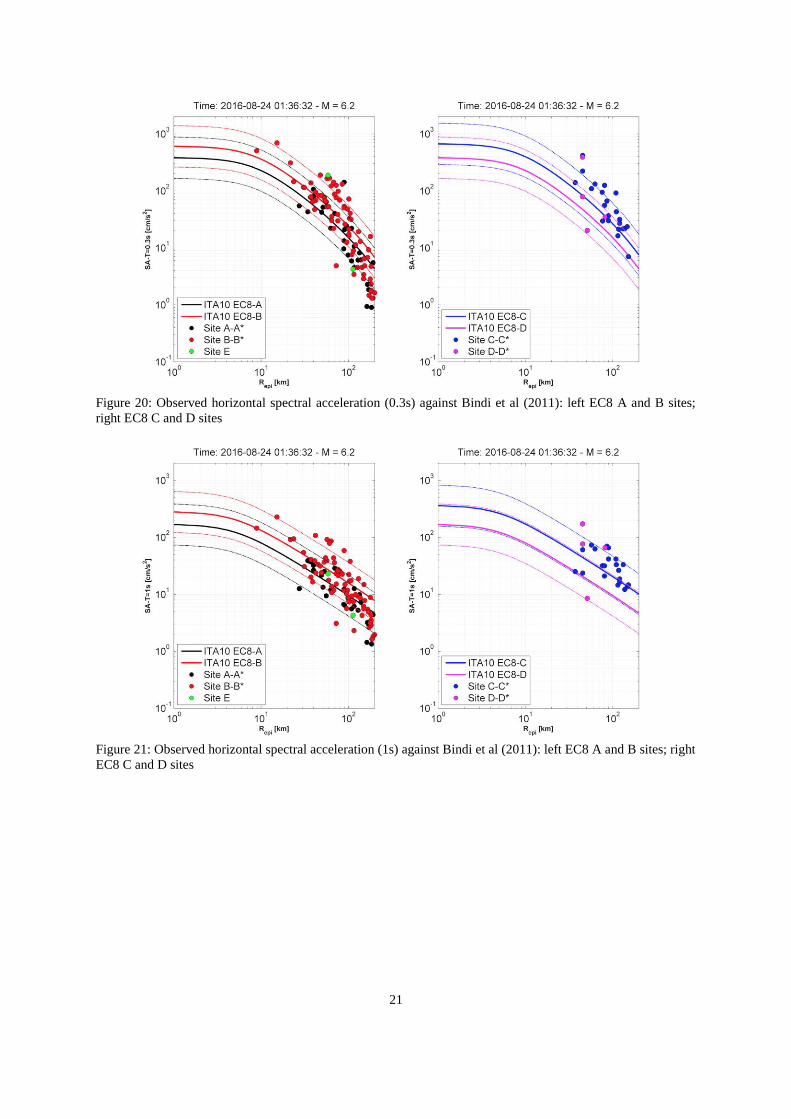
Figure 20: Observed horizontal spectral acceleration (0.3s) against Bindi et al (2011): left EC8 A and B sites;
right EC8 C and D sites
Figure 21: Observed horizontal spectral acceleration (1s) against Bindi et al (2011): left EC8 A and B sites; right
EC8 C and D sites

22
Figure 22: Observed horizontal spectral acceleration (3s) against Bindi et al (2011): left EC8 A and B sites; right
EC8 C and D sites
Figure 22: Observed vertical PGA against Bindi et al (2011): left EC8 A and B sites; right EC8 C and D sites

23
Figure 23: Observed vertical PGV against Bindi et al (2011): left EC8 A and B sites; right EC8 C and D sites
Figure 24: Observed vertical spectral acceleration (0.3s) against Bindi et al (2011): left EC8 A and B sites; right
EC8 C and D sites

24
Figure 25: Observed vertical spectral acceleration (1s) against Bindi et al (2011): left EC8 A and B sites; right
EC8 C and D sites
Figure 26: Observed vertical spectral acceleration (2s) against Bindi et al (2011): left EC8 A and B sites; right
EC8 C and D sites
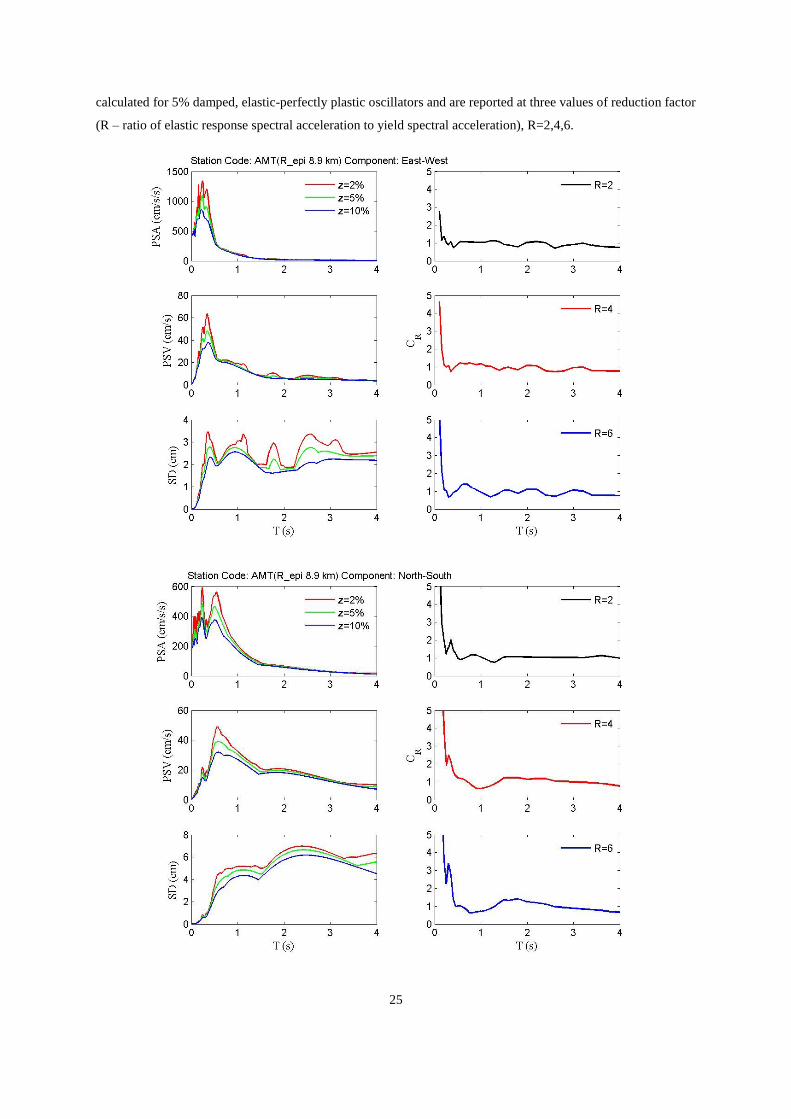
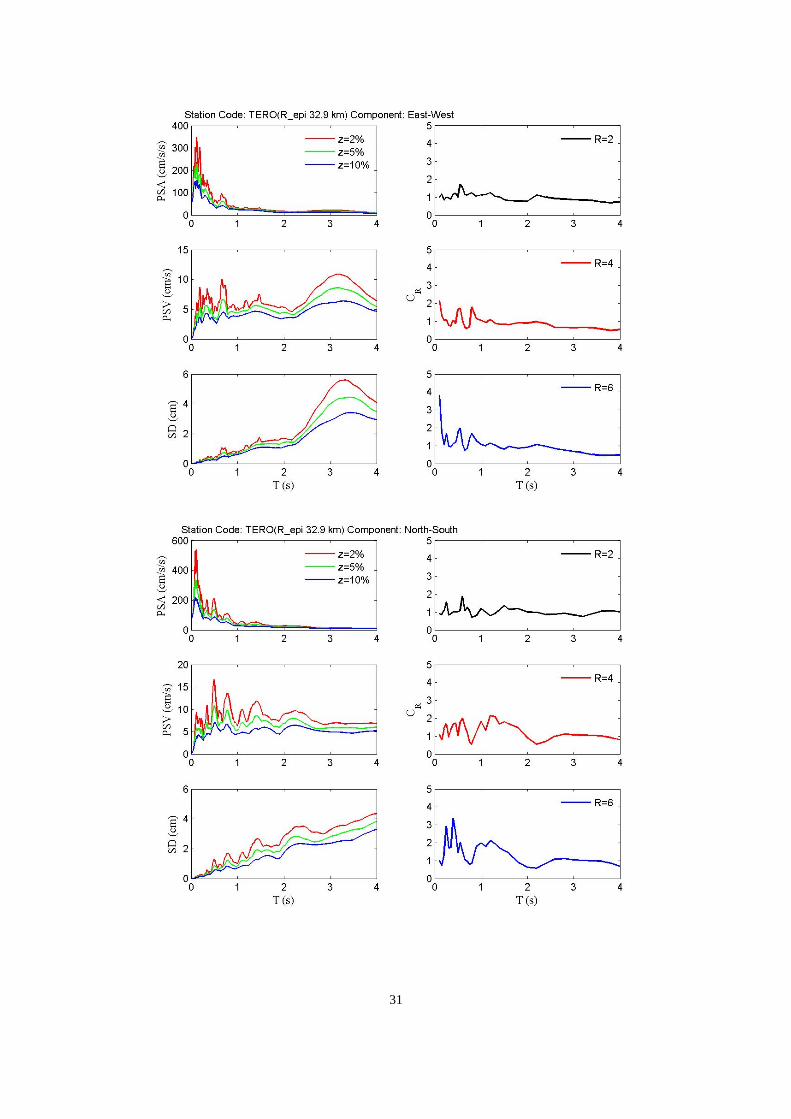
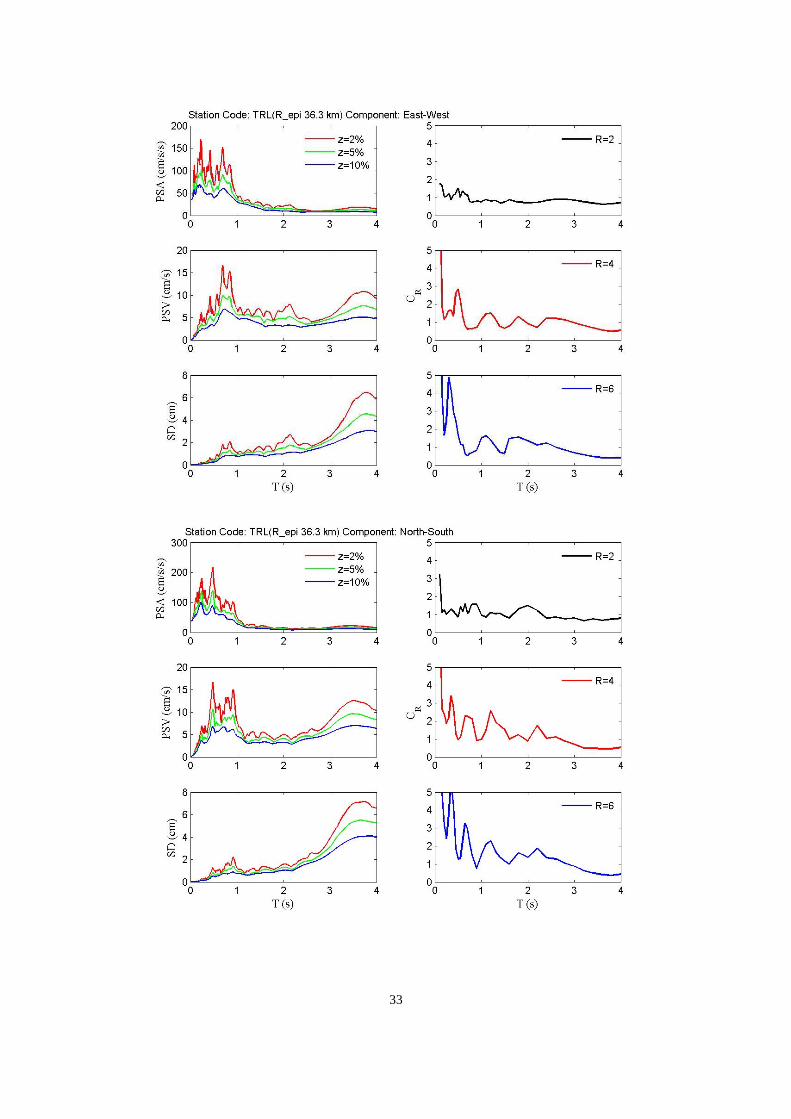
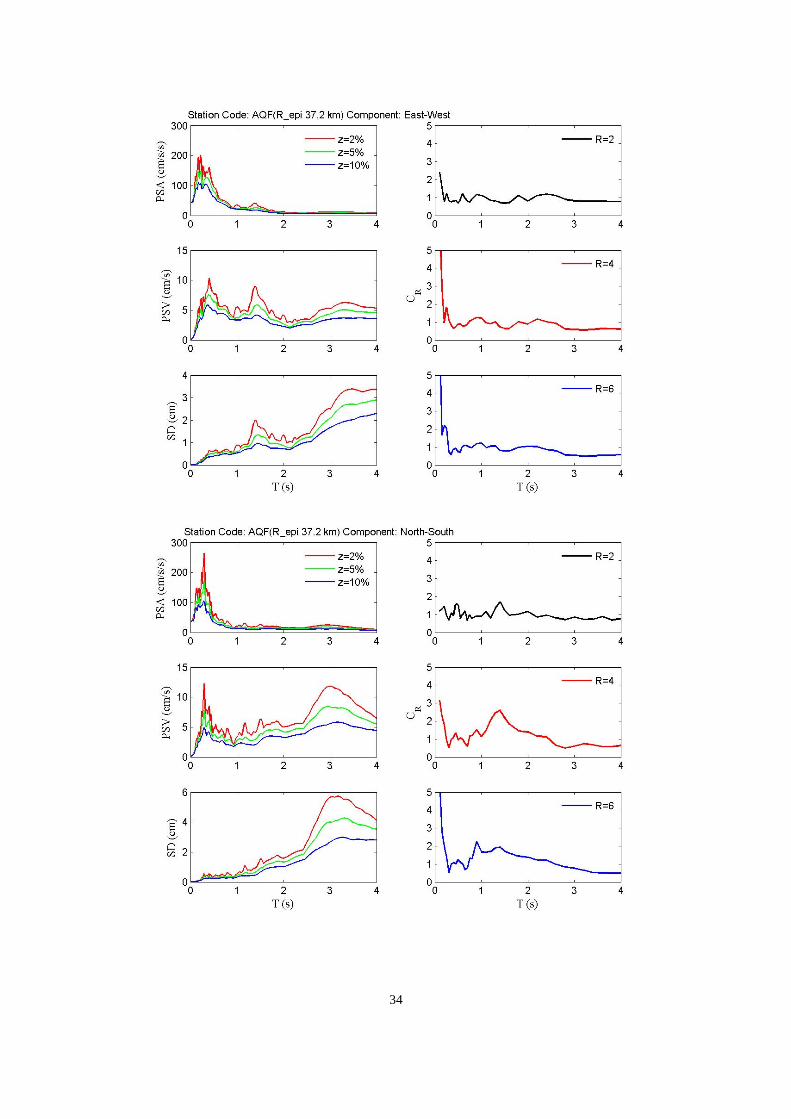
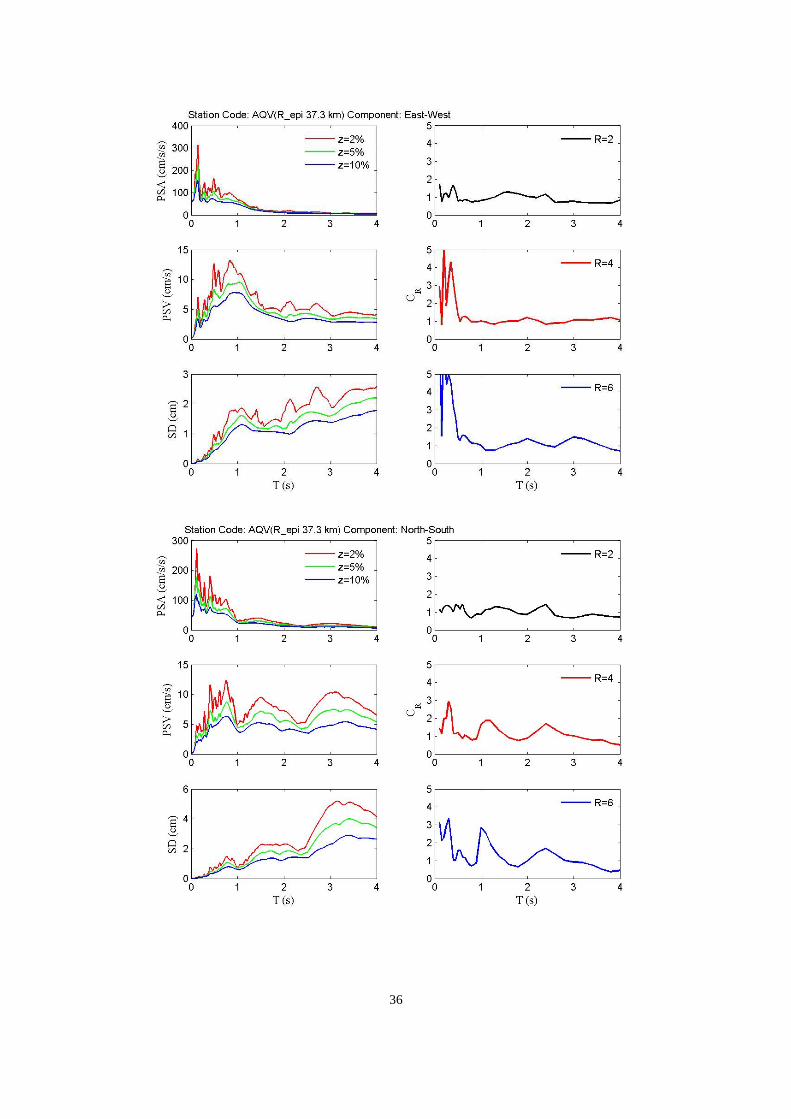
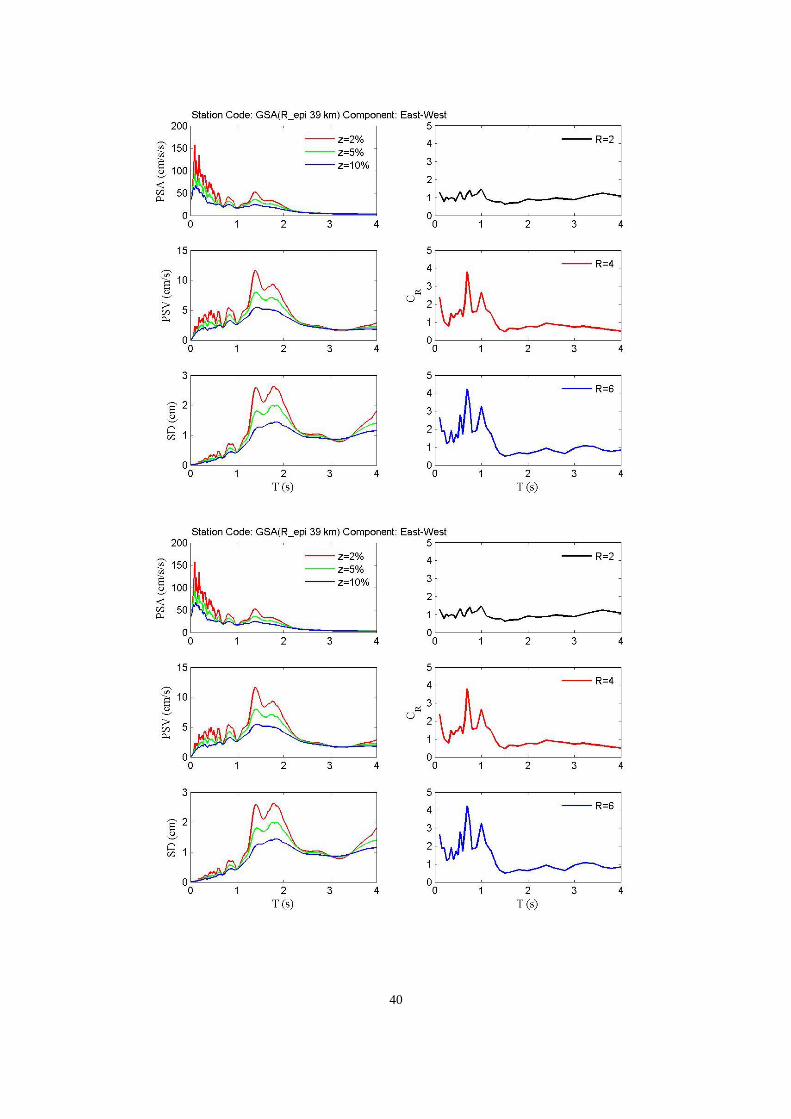
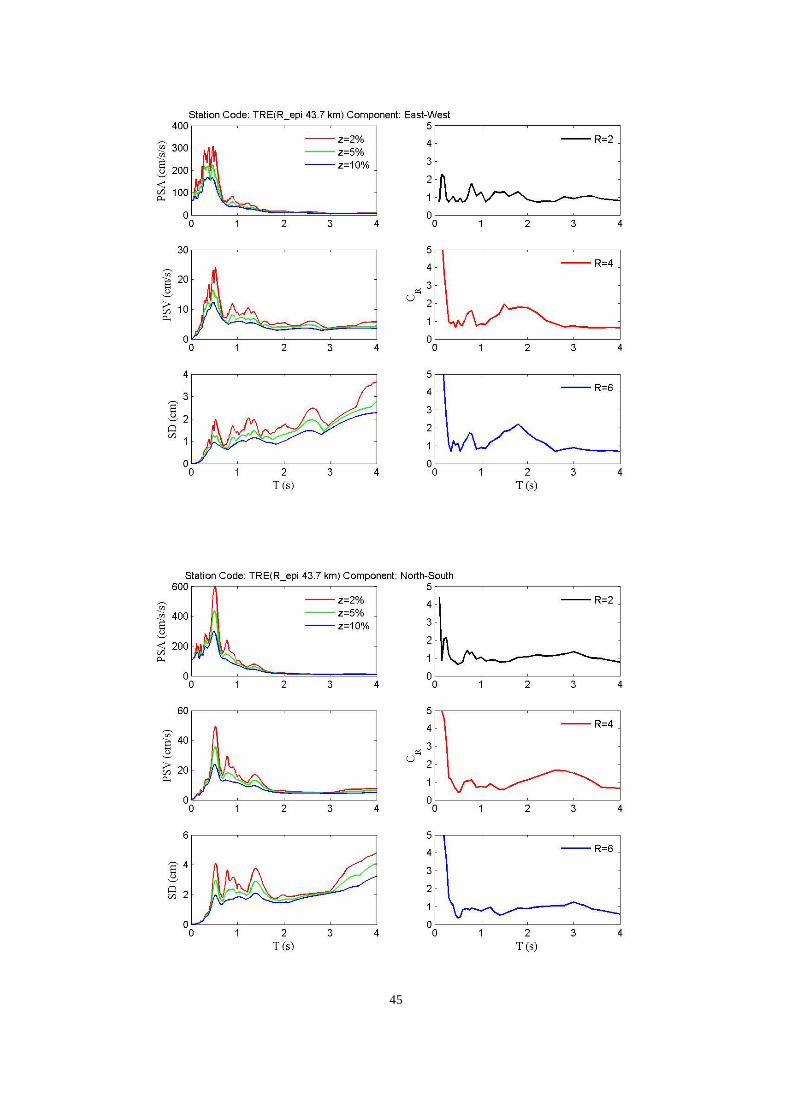
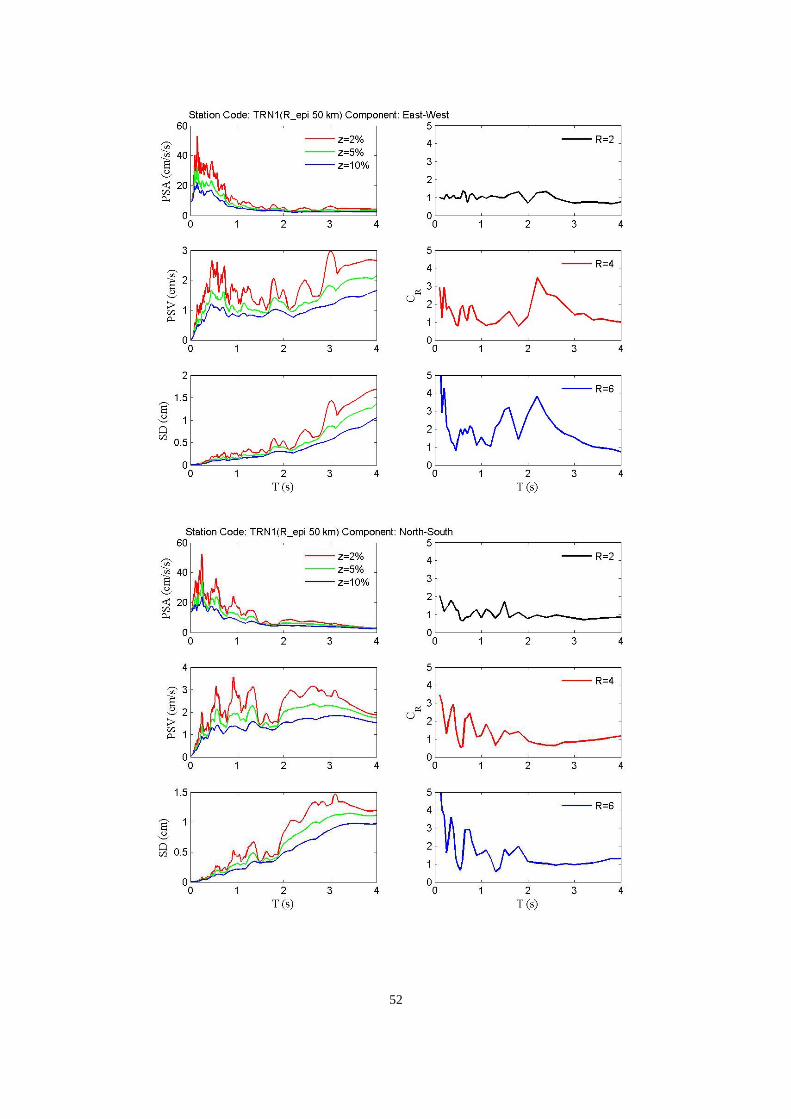
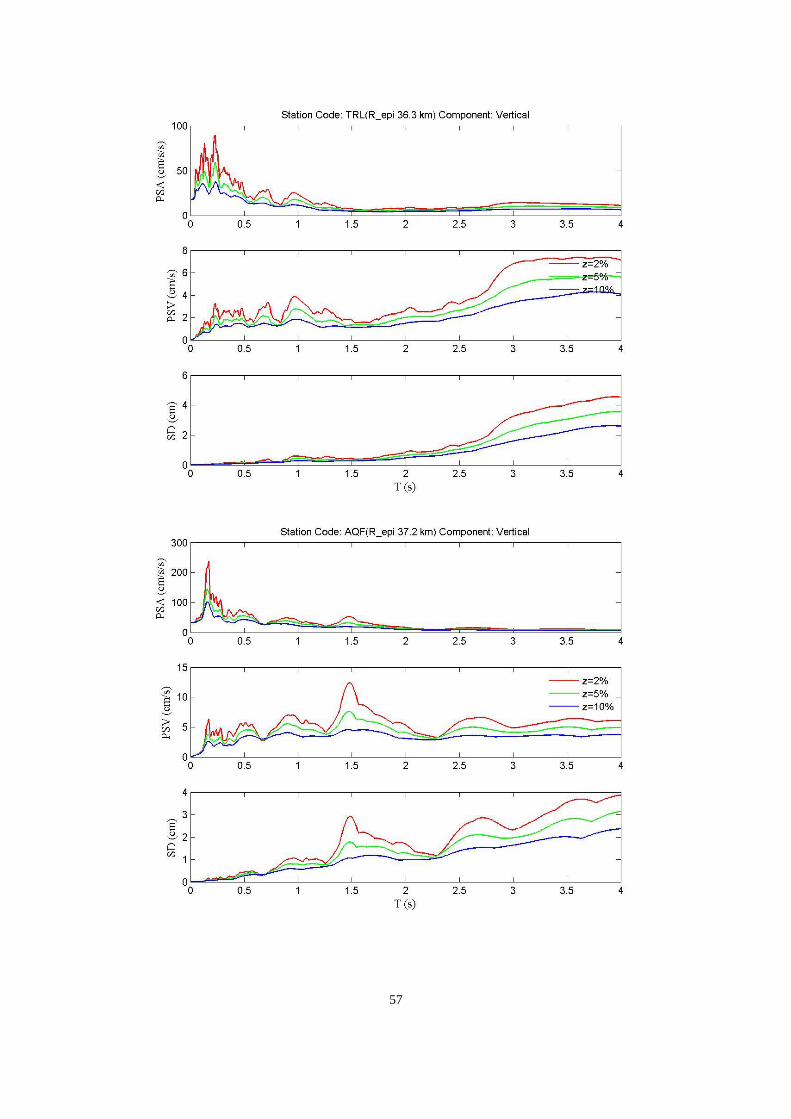
6. Elastic and Inelastic Response Spectra In this section, elastic and inelastic response spectra of the recorded ground motions are provided. With
regard to elastic response the pseudo-spectral acceleration (PSA), pseudo-spectral velocity (PSV) and spectral
displacement (SD) are reported for all the available records for three different values of damping ratio, (z), that
is 2%, 5% and 10%. Additionally, constant-strength inelastic displacement ratios (CR – ratio of inelastic to
elastic displacement response) are provided for the horizontal components of ground motion. These spectra were
25
calculated for 5% damped, elastic-perfectly plastic oscillators and are reported at three values of reduction factor
(R – ratio of elastic response spectral acceleration to yield spectral acceleration), R=2,4,6.

26

27

28

29

30
31

32
33
34

35
36

37

38

39
40

41

42

43

44
45

46

47

48

49

50

51
52

53

54

55

56
57

58

59

60

61

62

63

64

65

66

67
7. Comparison with the Italian seismic code The pseudo-acceleration response spectra associated to the horizontal ground motions recorded by the four
stations with lowest epicentral distance (AMT, NRC, RM33 and SPD) are compared with the elastic spectra
provided by the Italian seismic code (NTC2008) at the corresponding sites for soil class provided in Appedix 1
and four different return periods (TR): 50, 475, 975 and 2475 years. Note that comparison of individual
earthquake recordings with probabilistic hazard is a delicate issue and no direct conclusions can be drawn to
validate hazard (see Iervolino, 2013).
Referring to the geographical coordinates of the epicentre (42.70N; 13.24E), the hazard disaggregation
(Iervolino et al., 2011) was computed for the PGA and for the pseudo-spectral acceleration at 1s vibration
period, PSA(T=1s), for two TR (475 and 2475 years) by means of REXEL v 3.5 (Iervolino et al., 2010), as
shown in the following figures.
The disaggregations have a single modal value for both considered return periods. In the case of PGA and
TR=475 years, modal magnitude and distance are around 5.8 and 10 km, respectively. Increasing the return
period to 2475 years, magnitude modal value increases to about 6.8 while the corresponding value of distance
remains centred on 10 km. Similarly, for PSA(T=1s) and TR=475 years, modal magnitude and distance are about
6.3 and 10 km, respectively. For TR=2475 years, the magnitude of the mode increases to 6.8 while the distance
remains equal to about 10 km. It is worth noting that, for a given return period, disaggregation of PSA(T=1s)
shows a non-negligible contribution of higher distances with respect to the case of the disaggregation of PGA.
This is an expected result, see Iervolino et al. (2011), and is more evident for lower return periods.

68
Disaggregation of PGA: TR=475 years (sx) and 2475 years (dx)
Disaggregation of PSA(T=1s): TR=475 years (sx) and 2475 years (dx)
69
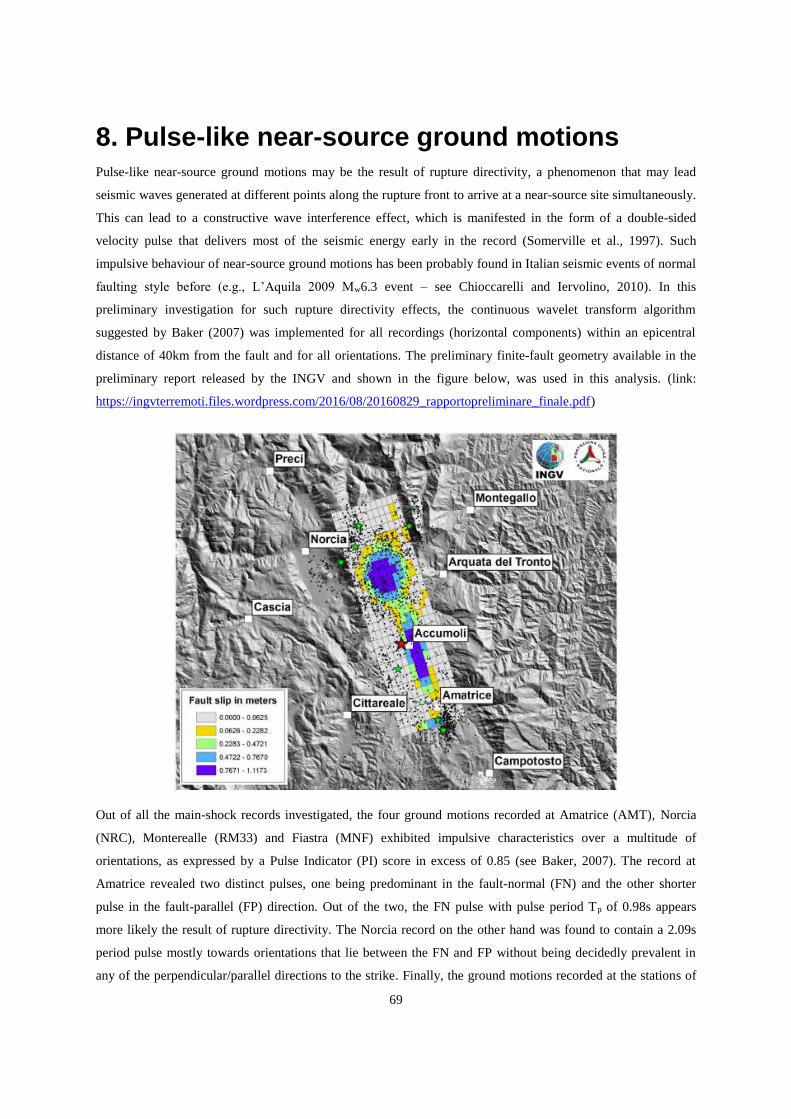
8. Pulse-like near-source ground motions Pulse-like near-source ground motions may be the result of rupture directivity, a phenomenon that may lead
seismic waves generated at different points along the rupture front to arrive at a near-source site simultaneously.
This can lead to a constructive wave interference effect, which is manifested in the form of a double-sided
velocity pulse that delivers most of the seismic energy early in the record (Somerville et al., 1997). Such
impulsive behaviour of near-source ground motions has been probably found in Italian seismic events of normal
faulting style before (e.g., L’Aquila 2009 Mw6.3 event – see Chioccarelli and Iervolino, 2010). In this
preliminary investigation for such rupture directivity effects, the continuous wavelet transform algorithm
suggested by Baker (2007) was implemented for all recordings (horizontal components) within an epicentral
distance of 40km from the fault and for all orientations. The preliminary finite-fault geometry available in the
preliminary report released by the INGV and shown in the figure below, was used in this analysis. (link:
https://ingvterremoti.files.wordpress.com/2016/08/20160829_rapportopreliminare_finale.pdf)
Out of all the main-shock records investigated, the four ground motions recorded at Amatrice (AMT), Norcia
(NRC), Monterealle (RM33) and Fiastra (MNF) exhibited impulsive characteristics over a multitude of
orientations, as expressed by a Pulse Indicator (PI) score in excess of 0.85 (see Baker, 2007). The record at
Amatrice revealed two distinct pulses, one being predominant in the fault-normal (FN) and the other shorter
pulse in the fault-parallel (FP) direction. Out of the two, the FN pulse with pulse period Tp of 0.98s appears
more likely the result of rupture directivity. The Norcia record on the other hand was found to contain a 2.09s
period pulse mostly towards orientations that lie between the FN and FP without being decidedly prevalent in
any of the perpendicular/parallel directions to the strike. Finally, the ground motions recorded at the stations of

70
Fiastra and Monterealle were found to contain pulses in the FN direction with Tp of 1.4s and 1.2s respectively,
also hinting at rupture directivity effects, despite the lower velocity amplitude due to the greater distance from
the fault and consequent attenuation.
In the following figures, a polar plot is presented for each station displaying the PI score per Azimuth as well as
the velocity time histories at the most relevant directions (original signal, extracted pulse, residual signal).

71

72

73

74

75
Data and resources Manually Processed and unprocessed strong-motion records Engineering strong-motion database: http://esm.mi.ingv.it
Automatically processed and raw strong-motion records Rapid response Strong Motion database http://www.orfeus-eu.org/opencms/rrsm/
Raw strong-motion records European Integrated Data Archive http://www.orfeus-eu.org/data/eida/
Italian Department of Civil Protection: http://ran.protezionecivile.it/
Shakemaps Italy ShakeMaps http://shakemap.rm.ingv.it/
Real time earthquake catalogue ISIDe - Italian Seismological Instrumental and Parametric Database http://iside.rm.ingv.it
Historical catalogue Catalogo Parametrico dei Terremoti Italiani http://emidius.mi.ingv.it/CPTI/
Macroseismic data Database macrosismico Italiano http://emidius.mi.ingv.it/CPTI15-DBMI15/
References
Baker J.W. (2007) Quantitative Classification of Near-Fault Ground Motions Using Wavelet Analysis. Bulletin
of the Seismological Society of America, 97(5):1486–1501.
Bindi, D., F. Pacor, L. Luzi, R. Puglia, M. Massa, G. Ameri, and R. Paolucci (2011). Ground motion prediction
equations derived from the Italian strong motion database, Bull. Earthq. Eng. 9, 1899–1920.
Chioccarelli E., Iervolino I. (2010). Near-Source Seismic Demand and Pulse-Like Records: a Discussion for
L'Aquila Earthquake. Earthquake Engineering and Structural Dynamics. 39(9):1039–1062.
Iervolino I. (2013). Probabilities and fallacies: why hazard maps cannot be validated by individual earthquakes.
Earthquake Spectra, 29(3): 1125–1136.
Iervolino I., Chioccarelli E., Convertito V. (2011). Engineering design earthquakes from multimodal hazard
disaggregation, Soil Dynamics and Earthquake Engineering, 31, 1212-1231.
Iervolino I., Galasso C., Cosenza E. (2010). REXEL: computer aided record selection for code based seismic
structural analysis, Bulletin of Earthquake Engineering, 8, 339-362.
Michelini, A., Faenza, L., Lauciani, V., & Malagnini, L. (2008). ShakeMap implementation in Italy.
Seismological Research Letters, 79(5), 689–698. http://doi.org/10.1785/gssrl.79.5.689
Paolucci, R., F. Pacor, R. Puglia, G. Ameri, C. Cauzzi, and M. Massa (2011). Record processing in ITACA, the
new Italian strong motion database, in Earthquake Data in Engineering Seismology, Geotech- nical, Geological
and Earthquake Engineering Series, S. Akkar, P. Gulkan, and T. Van Eck (Editors), Vol. 14(8), 99–113.
Somerville P.G., Smith N.F., Graves R.W., Abrahamson N.A. (1997) Modification of empirical strong ground
motion attenuation relations to include the amplitude and duration effects of rupture directivity. Seismological
Research Letters, 68:199–222.
76
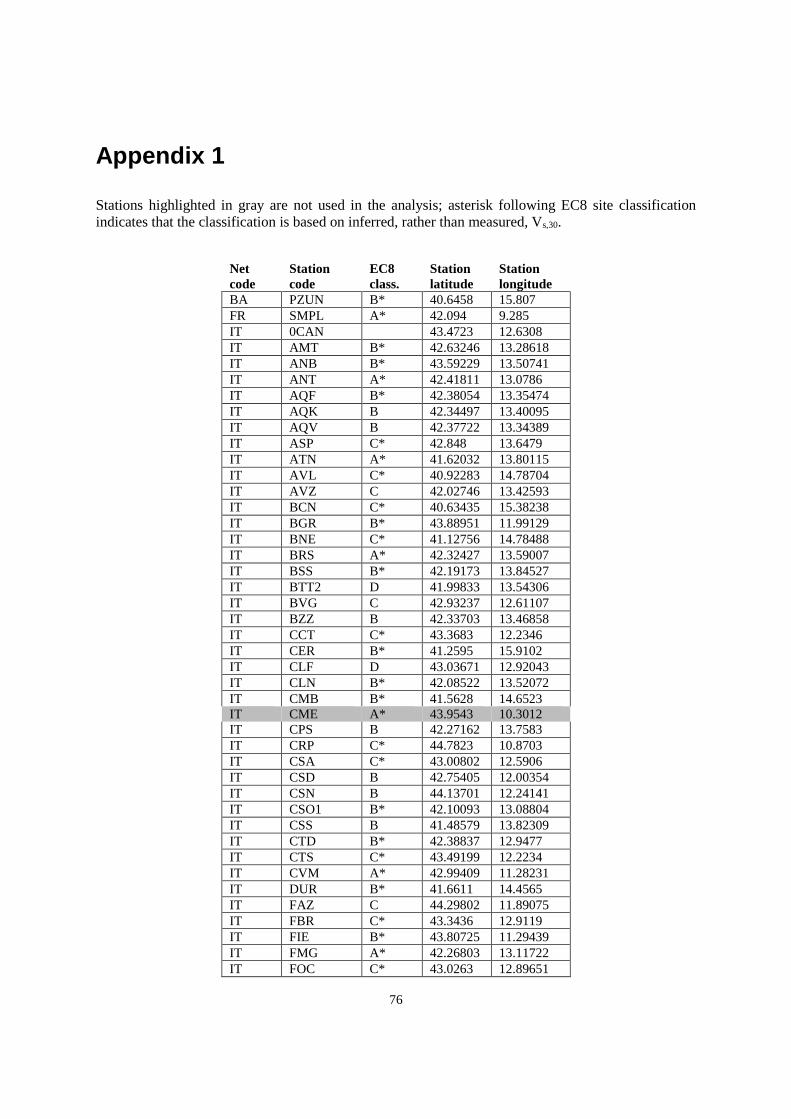
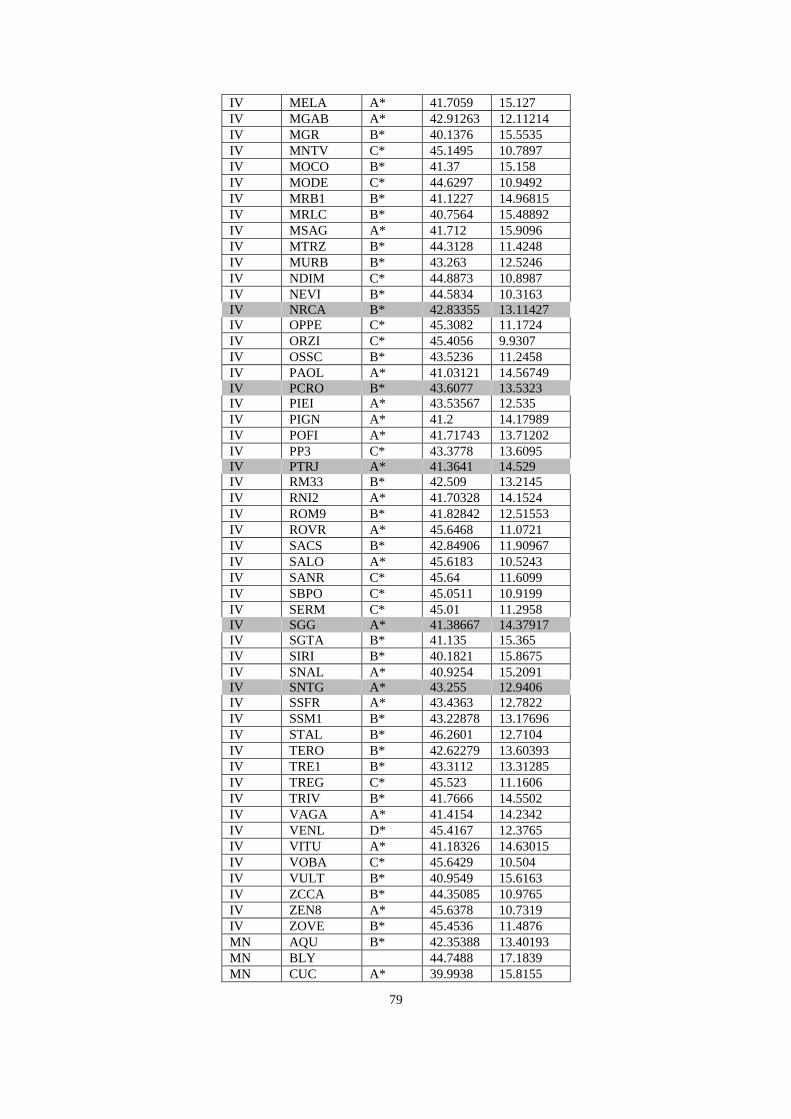
Appendix 1
Stations highlighted in gray are not used in the analysis; asterisk following EC8 site classification
indicates that the classification is based on inferred, rather than measured, Vs,30.
Net
code
Station
code
EC8
class.
Station
latitude
Station
longitude
BA PZUN B* 40.6458 15.807
FR SMPL A* 42.094 9.285
IT 0CAN 43.4723 12.6308
IT AMT B* 42.63246 13.28618
IT ANB B* 43.59229 13.50741
IT ANT A* 42.41811 13.0786
IT AQF B* 42.38054 13.35474
IT AQK B 42.34497 13.40095
IT AQV B 42.37722 13.34389
IT ASP C* 42.848 13.6479
IT ATN A* 41.62032 13.80115
IT AVL C* 40.92283 14.78704
IT AVZ C 42.02746 13.42593
IT BCN C* 40.63435 15.38238
IT BGR B* 43.88951 11.99129
IT BNE C* 41.12756 14.78488
IT BRS A* 42.32427 13.59007
IT BSS B* 42.19173 13.84527
IT BTT2 D 41.99833 13.54306
IT BVG C 42.93237 12.61107
IT BZZ B 42.33703 13.46858
IT CCT C* 43.3683 12.2346
IT CER B* 41.2595 15.9102
IT CLF D 43.03671 12.92043
IT CLN B* 42.08522 13.52072
IT CMB B* 41.5628 14.6523
IT CME A* 43.9543 10.3012
IT CPS B 42.27162 13.7583
IT CRP C* 44.7823 10.8703
IT CSA C* 43.00802 12.5906
IT CSD B 42.75405 12.00354
IT CSN B 44.13701 12.24141
IT CSO1 B* 42.10093 13.08804
IT CSS B 41.48579 13.82309
IT CTD B* 42.38837 12.9477
IT CTS C* 43.49199 12.2234
IT CVM A* 42.99409 11.28231
IT DUR B* 41.6611 14.4565
IT FAZ C 44.29802 11.89075
IT FBR C* 43.3436 12.9119
IT FIE B* 43.80725 11.29439
IT FMG A* 42.26803 13.11722
IT FOC C* 43.0263 12.89651

77
IT FOS B* 43.01459 12.83513
IT FRT 41.6926 13.255
IT FSS C* 43.69048 12.81007
IT GBB B* 43.35697 12.59725
IT GBP C 43.31381 12.58949
IT GNU A* 42.80382 12.57015
IT GRN A* 41.81346 13.31699
IT GSA B 42.42069 13.51936
IT LSS A 42.55824 12.96889
IT MCR C* 43.79989 12.44751
IT MCS B* 43.99437 12.10744
IT MLF B 40.9944 15.6527
IT MMP1 B* 42.24923 12.74832
IT MNF A* 43.05968 13.18447
IT MNG A* 41.70354 15.95803
IT MNT A* 43.1397 11.18279
IT MTL B 43.24944 13.00834
IT NAP C* 40.79926 14.17961
IT NCR E 43.11158 12.78467
IT NRC B 42.79254 13.09648
IT NRN A* 42.51556 12.51944
IT ORP B 41.27923 15.26506
IT PAN B* 43.00581 12.14362
IT PGG B* 42.32287 13.53945
IT PNC B* 42.84745 11.6936
IT PNN C 43.81816 12.26285
IT PSC A 41.81204 13.7892
IT PTI B* 43.06657 13.65708
IT PTL B* 43.42733 12.4486
IT PVF B* 44.3331 10.82523
IT PZI1 B* 42.4356 13.3262
IT RDG A* 41.9264 15.8792
IT RQT B* 42.81309 13.31103
IT RTI D 42.43028 12.8291
IT SAG A* 40.93156 15.18763
IT SBC A 41.91316 13.10552
IT SCF B* 42.26512 13.99849
IT SDM A* 42.28971 13.55765
IT SGMA B* 41.6845 14.9644
IT SGPA B 41.6876 14.9629
IT SGPA B 41.6876 14.9629
IT SGSC B* 41.6892 14.9581
IT SGSC B* 41.6892 14.9581
IT SIG C* 43.3308 12.7408
IT SNG C 43.68558 13.22616
IT SNI B* 42.632 12.5536
IT SNM B* 43.93433 12.44929
IT SNS1 C* 43.5735 12.1312
IT SOR 41.7203 13.6136
IT SPD B* 42.51514 13.37104
IT SPM A* 42.72324 12.75127
IT SPO1 42.7344 12.7363
IT SSC E 42.87473 11.87679
IT SSG B* 43.56986 12.14632
IT SSO 43.5715 12.154
IT STF B* 43.90811 11.79446

78
IT SUL A* 42.089 13.934
IT SULA C* 42.0734 13.9166
IT SULC C* 42.068 13.909
IT SULP B* 42.085 13.9274
IT TLN B* 43.2159 13.25838
IT TOD A* 42.73817 12.38728
IT TRE C* 42.8765 12.7358
IT TRL A* 42.46131 12.93231
IT TRN1 D* 42.5582 12.6461
IT TRV B* 41.78294 14.55071
IT TSC A* 42.42261 11.8696
IT TVL B* 41.89302 12.77322
IT UMB B* 43.25444 12.2556
IT VAL B* 43.1593 12.6017
IT VLL B* 41.67047 12.77267
IT VLN C* 43.14273 11.89472
IT VNF1 C* 41.4805 14.0501
IT VSE B* 42.12218 14.70719
IV ACER B* 40.7867 15.9427
IV APEC B* 43.55846 12.41991
IV APRC 41.75738 15.54308
IV ASOL A* 45.8003 11.9023
IV ATCC B* 43.18514 12.63994
IV ATFO B* 43.3666 12.5715
IV ATLO B* 43.3152 12.4073
IV ATPC B* 43.4807 12.457
IV ATTE A* 43.1979 12.3536
IV ATVO B* 43.38211 12.40663
IV BDI B* 44.0624 10.597
IV BIOG B* 41.1999 15.13263
IV BOB B* 44.7679 9.4478
IV BRIS B* 44.2245 11.7666
IV BSSO A* 41.5461 14.5938
IV CADA B* 43.1942 13.7614
IV CAFE A* 41.028 15.2366
IV CDCA C* 43.4584 12.2336
IV CERA A* 41.5978 14.0183
IV CIMA B* 43.3053 13.67009
IV CMPO C* 44.5808 11.8056
IV COR1 B* 43.6318 13.0003
IV CPGN B* 43.8011 12.3205
IV CRMI B* 43.7956 10.9795
IV CRND C* 45.8361 12.0131
IV CTL8 C* 45.2755 9.7621
IV FAEN C* 44.2895 11.877
IV FERS C 44.9035 11.5406
IV FIU1 B* 43.18856 12.9316
IV FOSV B* 43.29483 12.76117
IV FRE8 A* 46.015 12.3552
IV GAG1 B* 43.2381 13.0674
IV GATE B* 41.51315 14.9102
IV GUMA B* 43.0627 13.3352
IV IMOL C* 44.35955 11.74248
IV LEOD C* 45.4582 10.1234
IV MCEL A* 40.3249 15.8019
IV MDAR B* 43.1927 13.1427
79
IV MELA A* 41.7059 15.127
IV MGAB A* 42.91263 12.11214
IV MGR B* 40.1376 15.5535
IV MNTV C* 45.1495 10.7897
IV MOCO B* 41.37 15.158
IV MODE C* 44.6297 10.9492
IV MRB1 B* 41.1227 14.96815
IV MRLC B* 40.7564 15.48892
IV MSAG A* 41.712 15.9096
IV MTRZ B* 44.3128 11.4248
IV MURB B* 43.263 12.5246
IV NDIM C* 44.8873 10.8987
IV NEVI B* 44.5834 10.3163
IV NRCA B* 42.83355 13.11427
IV OPPE C* 45.3082 11.1724
IV ORZI C* 45.4056 9.9307
IV OSSC B* 43.5236 11.2458
IV PAOL A* 41.03121 14.56749
IV PCRO B* 43.6077 13.5323
IV PIEI A* 43.53567 12.535
IV PIGN A* 41.2 14.17989
IV POFI A* 41.71743 13.71202
IV PP3 C* 43.3778 13.6095
IV PTRJ A* 41.3641 14.529
IV RM33 B* 42.509 13.2145
IV RNI2 A* 41.70328 14.1524
IV ROM9 B* 41.82842 12.51553
IV ROVR A* 45.6468 11.0721
IV SACS B* 42.84906 11.90967
IV SALO A* 45.6183 10.5243
IV SANR C* 45.64 11.6099
IV SBPO C* 45.0511 10.9199
IV SERM C* 45.01 11.2958
IV SGG A* 41.38667 14.37917
IV SGTA B* 41.135 15.365
IV SIRI B* 40.1821 15.8675
IV SNAL A* 40.9254 15.2091
IV SNTG A* 43.255 12.9406
IV SSFR A* 43.4363 12.7822
IV SSM1 B* 43.22878 13.17696
IV STAL B* 46.2601 12.7104
IV TERO B* 42.62279 13.60393
IV TRE1 B* 43.3112 13.31285
IV TREG C* 45.523 11.1606
IV TRIV B* 41.7666 14.5502
IV VAGA A* 41.4154 14.2342
IV VENL D* 45.4167 12.3765
IV VITU A* 41.18326 14.63015
IV VOBA C* 45.6429 10.504
IV VULT B* 40.9549 15.6163
IV ZCCA B* 44.35085 10.9765
IV ZEN8 A* 45.6378 10.7319
IV ZOVE B* 45.4536 11.4876
MN AQU B* 42.35388 13.40193
MN BLY 44.7488 17.1839
MN CUC A* 39.9938 15.8155

80
MN VLC A* 44.1594 10.3864
OX ACOM 46.548 13.5137
OX AGOR 46.2329 12.0472
OX CGRP 45.8806 11.8047
OX CIMO 46.3116 12.4448
OX CLUD 46.4569 12.8814
OX MPRI 46.2408 12.9877
OX SABO B* 45.9875 13.6336
OX VARN 45.9922 12.1051
OX ZOU2 46.5584 12.9729
ST DOSS 45.8808 11.1884
ST VARA A* 45.826 10.8965
Related Documents