Preliminary studies of laser-induced breakdown spectrometry for the determination of Ba, Cd, Cr and Pb in toys ☆ Quienly Godoi a,b , Dario Santos Jr. c , Lidiane C. Nunes a,b , Flávio O. Leme b , Iolanda A. Rufini b , José A.M. Agnelli d , Lilian C. Trevizan b , Francisco J. Krug b, ⁎ a Departamento de Química, Universidade Federal de São Carlos, Rod. Washington Luís, km 235,13565-905, São Carlos-SP, Brazil b Centro de Energia Nuclear na Agricultura, Universidade de São Paulo, Av. Centenário 303,13416-000, Piracicaba-SP, Brazil c Universidade Federal de São Paulo—UNIFESP, Rua Prof. Artur Riedel 275, 09972-270, Diadema-SP, Brazil d Departamento de Engenharia de Materiais, Universidade Federal de São Carlos, Rod. Washington Luís, km 235,13565-905, São Carlos-SP, Brazil abstract article info Article history: Received 2 December 2008 Accepted 6 May 2009 Available online 13 May 2009 Keywords: LIBS Laser-induced breakdown spectrometry Toy Inorganic contaminant The performance of laser-induced breakdown spectrometry (LIBS) for the determination of Ba, Cd, Cr and Pb in toys has been evaluated by using a Nd:YAG laser operating at 1064 nm and an Echelle spectrometer with intensified charge-coupled device detector. Samples were purchased in different cities of São Paulo State market and analyzed directly without sample preparation. Laser-induced breakdown spectrometry experimental conditions (number of pulses, delay time, integration time gate and pulse energy) were optimized by using a Doehlert design. Laser-induced breakdown spectrometry signals correlated reasonably well with inductively coupled plasma optical emission spectrometry (ICP OES) concentrations after microwave-assisted acid digestion of selected samples. Thermal analysis was used for polymer identification and scanning electron microscopy to visualize differences in crater geometry of different polymers employed for toy fabrication. Results indicate that laser-induced breakdown spectrometry can be proposed as a rapid screening method for investigation of potentially toxic elements in toys. The unique application of laser-induced breakdown spectrometry for identification of contaminants in successive layers of ink and polymer is also demonstrated. © 2009 Elsevier B.V. All rights reserved. 1. Introduction Polymers and mixtures of polymers are used in the manufacture of a large quantity of materials. Polypropylene (PP), low density polyethylene (LDPE), high density polyethylene (HDPE) and poly- styrene (PS) can be used, for example, for toys fabrication. In general, additives are used in polymers for changing properties and pigments give color to the product. However, in many cases, the inorganic pigments may contain potentially toxic elements in their composition such as Ba, Cd, Cr, Pb, Sb, among others. A recent national report on activities of combating piracy shows that 24% of the Brazilian population has bought toys in the informal market [1]. According to the Brazilian Association of Toy Manufac- turers (ABRINQ) [2] many toys came to the country illegally and thus are commercialized in an irregular way. These products have no safety and quality guarantee and can present high levels of toxic contami- nants. The ingestion of parts of toys containing pigments can cause risk of intoxication in children. Quantification of toxic elements in polymeric materials can be done by atomic absorption spectrometry (AAS) [3–9], X-ray fluorescence [9–12], total reflection X-ray fluorescence [13,14], inductively coupled plasma optical emission spectrometry [9], neutron activation analysis [15] and ultrasonic slurry sampling electrothermal vaporization dynamic reaction cell inductively coupled plasma mass spectrometry [16]. A simpler alternative for polymer analysis is the direct solid analysis. Brouwer [17] describes a method to determine the presence of Pb and Cd in plastic toys, paints, and other solids using AAS without going through the time-consuming sample preparation steps. Basi- cally, the method involves transferring solid sample to a nichrome wire by placing a small sample on a wire loop or touching the heated wire to the sample and then heating the wire in the AAS flame. By choosing the appropriate radiation source and wavelength, the presence of different metals may be determined qualitatively. Laser-induced breakdown spectrometry (LIBS) has been consid- ered a very useful analytical tool for in situ chemical analysis, either in industrial process or in the field. LIBS is a technique based on emission of excited atoms, ions and molecules that employs a pulsed laser and a focusing lens to generate a microplasma that vaporizes a small amount of sample [18]. The main advantages pointed out for LIBS comprise minimal or no sample preparation with increasing sample throughput and reduction of tedious and time-consuming sample preparation procedures; versatile sampling for all media, including Spectrochimica Acta Part B 64 (2009) 573–581 ☆ This paper was presented at the 10th Rio Symposium on Atomic Spectrometry, held in Salvador-Bahia, Brazil, 7–12 September 2008, and is published in the special issue of Spectrochimica Acta Part B, dedicated to that conference. ⁎ Corresponding author. Fax: +55 19 34294610. E-mail address: [email protected] (F.J. Krug). 0584-8547/$ – see front matter © 2009 Elsevier B.V. All rights reserved. doi:10.1016/j.sab.2009.05.003 Contents lists available at ScienceDirect Spectrochimica Acta Part B journal homepage: www.elsevier.com/locate/sab

Welcome message from author
This document is posted to help you gain knowledge. Please leave a comment to let me know what you think about it! Share it to your friends and learn new things together.
Transcript
Spectrochimica Acta Part B 64 (2009) 573–581
Contents lists available at ScienceDirect
Spectrochimica Acta Part B
j ourna l homepage: www.e lsev ie r.com/ locate /sab
Preliminary studies of laser-induced breakdown spectrometry for the determinationof Ba, Cd, Cr and Pb in toys☆
Quienly Godoi a,b, Dario Santos Jr. c, Lidiane C. Nunes a,b, Flávio O. Leme b, Iolanda A. Rufini b,José A.M. Agnelli d, Lilian C. Trevizan b, Francisco J. Krug b,⁎a Departamento de Química, Universidade Federal de São Carlos, Rod. Washington Luís, km 235, 13565-905, São Carlos-SP, Brazilb Centro de Energia Nuclear na Agricultura, Universidade de São Paulo, Av. Centenário 303, 13416-000, Piracicaba-SP, Brazilc Universidade Federal de São Paulo—UNIFESP, Rua Prof. Artur Riedel 275, 09972-270, Diadema-SP, Brazild Departamento de Engenharia de Materiais, Universidade Federal de São Carlos, Rod. Washington Luís, km 235, 13565-905, São Carlos-SP, Brazil
☆ This paper was presented at the 10th Rio Symposiumin Salvador-Bahia, Brazil, 7–12 September 2008, and is pSpectrochimica Acta Part B, dedicated to that conferenc⁎ Corresponding author. Fax: +55 19 34294610.
E-mail address: [email protected] (F.J. Krug).
0584-8547/$ – see front matter © 2009 Elsevier B.V. Adoi:10.1016/j.sab.2009.05.003
a b s t r a c t
a r t i c l e i n f oArticle history:Received 2 December 2008Accepted 6 May 2009Available online 13 May 2009
Keywords:LIBSLaser-induced breakdown spectrometryToyInorganic contaminant
The performance of laser-induced breakdown spectrometry (LIBS) for the determination of Ba, Cd, Cr and Pb intoys has been evaluated by using a Nd:YAG laser operating at 1064 nm and an Echelle spectrometer withintensified charge-coupled device detector. Samples were purchased in different cities of São Paulo State marketand analyzed directly without sample preparation. Laser-induced breakdown spectrometry experimentalconditions (number of pulses, delay time, integration time gate and pulse energy) were optimized by using aDoehlert design. Laser-induced breakdown spectrometry signals correlated reasonably well with inductivelycoupled plasma optical emission spectrometry (ICP OES) concentrations aftermicrowave-assisted acid digestionof selected samples. Thermal analysis was used for polymer identification and scanning electron microscopy tovisualize differences in crater geometry of different polymers employed for toy fabrication. Results indicatethat laser-induced breakdown spectrometry can be proposed as a rapid screening method for investigationof potentially toxic elements in toys. The unique application of laser-induced breakdown spectrometry foridentification of contaminants in successive layers of ink and polymer is also demonstrated.
© 2009 Elsevier B.V. All rights reserved.
1. Introduction
Polymers andmixtures of polymers are used in the manufacture ofa large quantity of materials. Polypropylene (PP), low densitypolyethylene (LDPE), high density polyethylene (HDPE) and poly-styrene (PS) can be used, for example, for toys fabrication. In general,additives are used in polymers for changing properties and pigmentsgive color to the product. However, in many cases, the inorganicpigments may contain potentially toxic elements in their compositionsuch as Ba, Cd, Cr, Pb, Sb, among others.
A recent national report on activities of combating piracy showsthat 24% of the Brazilian population has bought toys in the informalmarket [1]. According to the Brazilian Association of Toy Manufac-turers (ABRINQ) [2] many toys came to the country illegally and thusare commercialized in an irregular way. These products have no safetyand quality guarantee and can present high levels of toxic contami-nants. The ingestion of parts of toys containing pigments can causerisk of intoxication in children.
on Atomic Spectrometry, heldublished in the special issue ofe.
ll rights reserved.
Quantification of toxic elements inpolymericmaterials can be done byatomic absorption spectrometry (AAS) [3–9], X-ray fluorescence [9–12],total reflection X-ray fluorescence [13,14], inductively coupled plasmaoptical emission spectrometry [9], neutron activation analysis [15] andultrasonic slurry sampling electrothermal vaporization dynamic reactioncell inductively coupled plasma mass spectrometry [16].
A simpler alternative for polymer analysis is the direct solidanalysis. Brouwer [17] describes a method to determine the presenceof Pb and Cd in plastic toys, paints, and other solids using AAS withoutgoing through the time-consuming sample preparation steps. Basi-cally, the method involves transferring solid sample to a nichromewire by placing a small sample on a wire loop or touching the heatedwire to the sample and then heating the wire in the AAS flame. Bychoosing the appropriate radiation source and wavelength, thepresence of different metals may be determined qualitatively.
Laser-induced breakdown spectrometry (LIBS) has been consid-ered a very useful analytical tool for in situ chemical analysis, either inindustrial process or in the field. LIBS is a technique based on emissionof excited atoms, ions andmolecules that employs a pulsed laser and afocusing lens to generate a microplasma that vaporizes a smallamount of sample [18]. The main advantages pointed out for LIBScomprise minimal or no sample preparation with increasing samplethroughput and reduction of tedious and time-consuming samplepreparation procedures; versatile sampling for all media, including
574 Q. Godoi et al. / Spectrochimica Acta Part B 64 (2009) 573–581
both conducting and non-conducting materials and direct analysis ofextremely hard materials that are difficult to get into solution [19].
However, there is a lack of information for LIBS analysis of toys,polymers and painted materials. Anglos et al. [20] presented theapplicability of LIBS for rapid, in situ and practically non-destructiveanalysis of pigments used in painted artworks for the identification ofAl, Ba, Ca, Cu, Cd, Co, Cr, Hg, Na, Pb, Zn and Ti. Sattmann et al. [21]explored the potential of LIBS using a compact Nd:YAG laser forpolymer identification using artificial neural networks. Authorspresented laser-induced plasma emission spectra of the visible andnear-UV spectral region of HDPE, LDPE, polyvinyl chloride (PVC),polyethylene terephthalate, and PP samples. The accuracy wasbetween 90% and 100% depending on polymer type. Anzano et al.[22,23] investigated the recycled plastic materials identification usinga compact Nd:YAG laser. Plasma emission spectra of polyethyleneterephthalate (PET), HDPE, PVC, LDPE, PP and PS were obtained. Therobustness of the technique was demonstrated by the 90–99% inidentification of almost all analyzed plastics. Fink et al. [24] reportedthe successful application of LIBS for online elemental characteriza-tion of recycled thermoplasts from consumer electronics. Theoptimum wavelength for plasma and best parameters of delay time,gate width and irradiance for Ti, Sb, Zn, Sn, Al, Cd, Cr and Pb wasdetermined. The authors also reported in another paper [25] thecombination of an Echelle spectrograph with suitable multivariatemethods that allow the use of the line-rich emission spectra withoutloss of selectivity and multielement capability. Limits of detectionwere in the mg kg−1 range, when normalization to a carbon emissionline as internal standard was used. Oujja et al. [26] reported thestructural characterization and identification of inks of contemporaryartistic prints. The results obtained with LIBS were more sensitive forthe detection of elements that are present in minor concentrations,when compared with scanning electron microscopy (SEM). Wang etal. [27] evaluated LIBS for determination of Ba, Cd, Cr and Pb in toys.The work presented a comparative study of the laser-induced plasmaemission for UV (266 nm) and NIR (1064 nm) excitation wavelengthsfor several kinds of plastics (ABS—acrylonitrile butadiene styrene),PMMA—poly (methyl methacrylate), HDPE, PET, PP, PS, PVC) and onetype of explosive (TNT). The experimental results showed that bothlaser wavelengths offer some advantage for situations where thesubstrate material is not known a priori.
Few analytical techniques provide the ability for surface analysis,discriminating the ink and the base composition of a painted materialin a non-destructive or almost non-destructive way. The combinationof LIBS and Raman microscopy was applied by Castillejo et al. [28] forthe identification of pigments on a polychrome in painted artworks ofthe Rococo period. The results were obtained with the fundamental(1064 nm) and the third harmonic (355 nm) of a Q-switched Nd:YAGlaser. This combination provided reliable and complete information onthe pigment composition of the successive layers of a polychrome.Burgio et al. [29,30] also combined LIBS and Ramanmicroscopy for theidentification of pigments in painted artworks. The authors found Hg,Mg, Pb, Ca, Fe, Al and Si in the pigments evaluated. Micro X-rayfluorescence (µXRF) and laser ablation inductively coupled plasmamass spectrometry (LA-ICP-MS) are alternative techniques for thisapplication. However, according to Naes et al. [31] µXRF has somedisadvantages, such as the increased analysis time (low throughput)and sample size requirements. Themain drawback of LA-ICP-MS is therisk of memory effects in the ablation chamber as well as in thetransport system, the plasma torch, components of the ICP-MSinterface and in the mass spectrometer, in case of very highconcentrations of the contaminants. On the other hand, portableXRF equipments are commercially available (Innov-X Systems, MA,USA) for non-destructive and rapid identification of several elementsin diverse sample surfaces. However, although very easy to handle, thesesystems did not provide information about the composition of severallayers of the sample, such as in a stratigraphic analysis.
Taking into consideration the risks associated to the presence ofpotentially toxic elements in toys and the feasibility of LIBS techniquefor direct analysis of polymeric materials, the aim of this work was toevaluate LIBS for the identification of Ba, Cd, Cr and Pb in plastic toys.In addition, the ability of LIBS for Pb surface analysis in a painted toywas also evaluated.
2. Experimental
2.1. LIBS instrumentation
Experiments were carried out with a Q-switched Nd:YAG laser(Brilliant, Quantel, France) operating at the fundamental wavelength(1064nm), generating5nspulses of365±3mJ, in a6mmdiameterbeamwith quality factor M2 smaller than 2, at 10 Hz repetition rate. The laserpulses were focused on the sample by a 20 cm focal length converginglens. Individual samples were placed in a manually controlled two-axestranslation stage that was moved in the plane orthogonal to the laserpropagation direction. To collect the plasma emission, a telescope,composed of fused silica lenses, was assembled. A model ESA 3000spectrometer (LLA Instruments GmbH, Germany) equipped with Echelleoptics and focal length of 25 cm with numerical aperture of 0.22, whichprovides a 24.5×24.5mm2
flat image plane,was employed. This system isa compromise that offers maximum resolution in the wavelength rangebetween 200 and 780 nm with resolving power ranging from 10,000 to20,000. The linear dispersion per pixel ranges from 5 pm at 200 nm to19 pm at 780 nm. The detector is an ICCD camera, comprised of a KodakKAF 1001 CCD array of 1024×1024 pixels full frame (24×24 µm2) and amicrochannel plate image intensifier of 25mmdiameter coupled to a UV-enhanced photocathode. The image signals are digitalized in dynamicrange of 16 bits and further processed by an industrial computer. The darkcurrent of the ICCD was automatically subtracted from the measuredspectral data. The number of laser pulses, delay time, integration timegate and laser pulse energywere optimized byDoehlert design. Brennetotet al. [32] proposed for the first time the use of Doehlert design for LIBSoptimization of operating conditions (laser energy, delay time, angle ofincidence on the sample and CO2 pressure) under Mars atmosphere.Experimental designs proved to be powerful tools for determining theinfluence of the parameters, including the effects of different orders.
2.2. Samples
Toy samples composed of different polymers were purchased ininformal market of São Paulo State in shops that generally offerproducts of uncontrolled procedence and low cost. Samples werecomprised by four cars, one truck and two easy assemble. Only the red(or yellow) part of these toys was evaluated. A red painted bus wasused for the evaluation of Pb distribution between the red ink and thepolymeric basis of the toy.
Pieces of toy samples were placed in a two-axes manual controlledtranslation stage that moved in the plane orthogonal to the laserdirection. Argon buffer gas flowing at 1.0 L min−1 was continuouslyfed by one entrance positioned below the sample holder to displacethe ambient atmosphere from the sample surface.
Ten LIBS accumulated spectra were collected in different samplingpositions in each sample and the average spectra was used as one testportion. For each toy, three test portions were analyzed. ESAWINsoftware and NIST Atomic Database [33] were used for peakidentification and a routine developed at MATLAB® software wasused for peak area and peak height calculation.
2.3. Optimization strategy
The experimental variables that can influence LIBS measurementsare laser related (i.e. wavelength, energy, pulse duration and shot-to-shot power fluctuation), focusing spot size, ambient conditions,
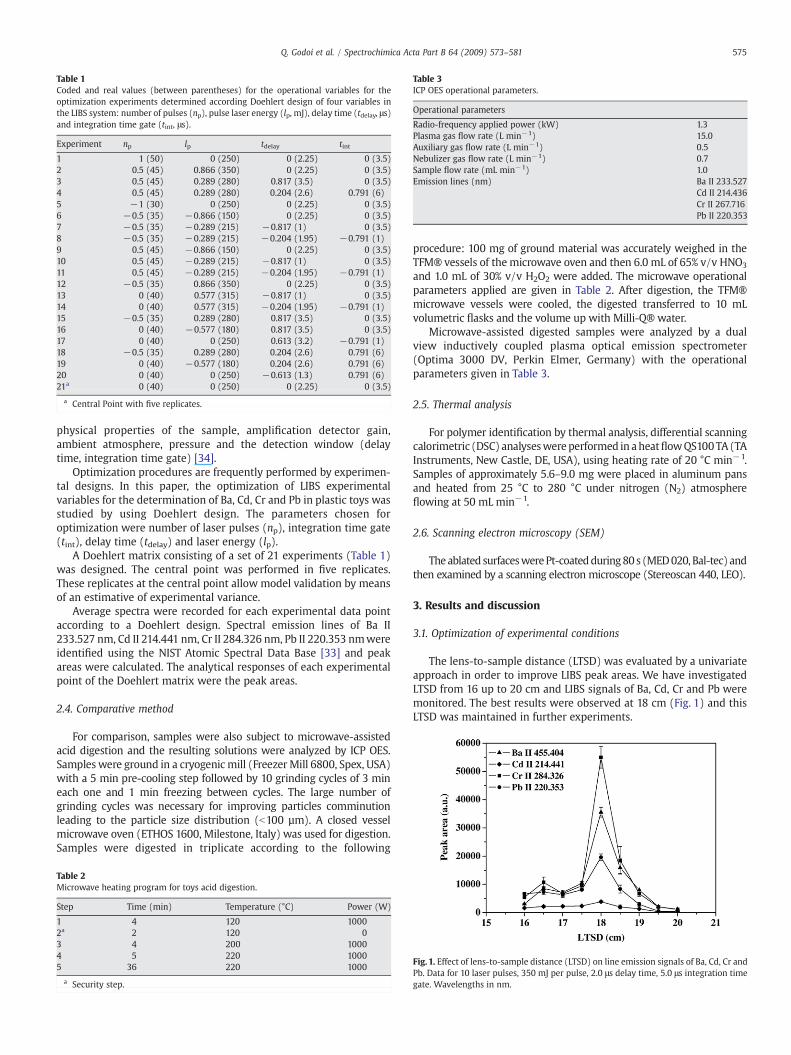
Table 3ICP OES operational parameters.
Operational parameters
Radio-frequency applied power (kW) 1.3Plasma gas flow rate (L min−1) 15.0Auxiliary gas flow rate (L min−1) 0.5Nebulizer gas flow rate (L min−1) 0.7Sample flow rate (mL min−1) 1.0Emission lines (nm) Ba II 233.527
Cd II 214.436Cr II 267.716Pb II 220.353
Table 1Coded and real values (between parentheses) for the operational variables for theoptimization experiments determined according Doehlert design of four variables inthe LIBS system: number of pulses (np), pulse laser energy (lp, mJ), delay time (tdelay, μs)and integration time gate (tint, μs).
Experiment np lp tdelay tint
1 1 (50) 0 (250) 0 (2.25) 0 (3.5)2 0.5 (45) 0.866 (350) 0 (2.25) 0 (3.5)3 0.5 (45) 0.289 (280) 0.817 (3.5) 0 (3.5)4 0.5 (45) 0.289 (280) 0.204 (2.6) 0.791 (6)5 −1 (30) 0 (250) 0 (2.25) 0 (3.5)6 −0.5 (35) −0.866 (150) 0 (2.25) 0 (3.5)7 −0.5 (35) −0.289 (215) −0.817 (1) 0 (3.5)8 −0.5 (35) −0.289 (215) −0.204 (1.95) −0.791 (1)9 0.5 (45) −0.866 (150) 0 (2.25) 0 (3.5)10 0.5 (45) −0.289 (215) −0.817 (1) 0 (3.5)11 0.5 (45) −0.289 (215) −0.204 (1.95) −0.791 (1)12 −0.5 (35) 0.866 (350) 0 (2.25) 0 (3.5)13 0 (40) 0.577 (315) −0.817 (1) 0 (3.5)14 0 (40) 0.577 (315) −0.204 (1.95) −0.791 (1)15 −0.5 (35) 0.289 (280) 0.817 (3.5) 0 (3.5)16 0 (40) −0.577 (180) 0.817 (3.5) 0 (3.5)17 0 (40) 0 (250) 0.613 (3.2) −0.791 (1)18 −0.5 (35) 0.289 (280) 0.204 (2.6) 0.791 (6)19 0 (40) −0.577 (180) 0.204 (2.6) 0.791 (6)20 0 (40) 0 (250) −0.613 (1.3) 0.791 (6)21a 0 (40) 0 (250) 0 (2.25) 0 (3.5)
a Central Point with five replicates.
575Q. Godoi et al. / Spectrochimica Acta Part B 64 (2009) 573–581
physical properties of the sample, amplification detector gain,ambient atmosphere, pressure and the detection window (delaytime, integration time gate) [34].
Optimization procedures are frequently performed by experimen-tal designs. In this paper, the optimization of LIBS experimentalvariables for the determination of Ba, Cd, Cr and Pb in plastic toys wasstudied by using Doehlert design. The parameters chosen foroptimization were number of laser pulses (np), integration time gate(tint), delay time (tdelay) and laser energy (lp).
A Doehlert matrix consisting of a set of 21 experiments (Table 1)was designed. The central point was performed in five replicates.These replicates at the central point allow model validation by meansof an estimative of experimental variance.
Average spectra were recorded for each experimental data pointaccording to a Doehlert design. Spectral emission lines of Ba II233.527 nm, Cd II 214.441 nm, Cr II 284.326 nm, Pb II 220.353 nmwereidentified using the NIST Atomic Spectral Data Base [33] and peakareas were calculated. The analytical responses of each experimentalpoint of the Doehlert matrix were the peak areas.
2.4. Comparative method
For comparison, samples were also subject to microwave-assistedacid digestion and the resulting solutions were analyzed by ICP OES.Samples were ground in a cryogenic mill (Freezer Mill 6800, Spex, USA)with a 5 min pre-cooling step followed by 10 grinding cycles of 3 mineach one and 1 min freezing between cycles. The large number ofgrinding cycles was necessary for improving particles comminutionleading to the particle size distribution (b100 µm). A closed vesselmicrowave oven (ETHOS 1600, Milestone, Italy) was used for digestion.Samples were digested in triplicate according to the following
Table 2Microwave heating program for toys acid digestion.
Step Time (min) Temperature (°C) Power (W)
1 4 120 10002a 2 120 03 4 200 10004 5 220 10005 36 220 1000
a Security step.
procedure: 100 mg of ground material was accurately weighed in theTFM® vessels of the microwave oven and then 6.0 mL of 65% v/v HNO3
and 1.0 mL of 30% v/v H2O2 were added. The microwave operationalparameters applied are given in Table 2. After digestion, the TFM®microwave vessels were cooled, the digested transferred to 10 mLvolumetric flasks and the volume up with Milli-Q® water.
Microwave-assisted digested samples were analyzed by a dualview inductively coupled plasma optical emission spectrometer(Optima 3000 DV, Perkin Elmer, Germany) with the operationalparameters given in Table 3.
2.5. Thermal analysis
For polymer identification by thermal analysis, differential scanningcalorimetric (DSC) analyseswereperformed in aheatflowQS100TA(TAInstruments, New Castle, DE, USA), using heating rate of 20 °C min−1.Samples of approximately 5.6–9.0 mg were placed in aluminum pansand heated from 25 °C to 280 °C under nitrogen (N2) atmosphereflowing at 50 mL min−1.
2.6. Scanning electron microscopy (SEM)
Theablated surfaceswerePt-coatedduring80 s (MED020, Bal-tec) andthen examined by a scanning electron microscope (Stereoscan 440, LEO).
3. Results and discussion
3.1. Optimization of experimental conditions
The lens-to-sample distance (LTSD) was evaluated by a univariateapproach in order to improve LIBS peak areas. We have investigatedLTSD from 16 up to 20 cm and LIBS signals of Ba, Cd, Cr and Pb weremonitored. The best results were observed at 18 cm (Fig. 1) and thisLTSD was maintained in further experiments.
Fig. 1. Effect of lens-to-sample distance (LTSD) on line emission signals of Ba, Cd, Cr andPb. Data for 10 laser pulses, 350 mJ per pulse, 2.0 μs delay time, 5.0 μs integration timegate. Wavelengths in nm.
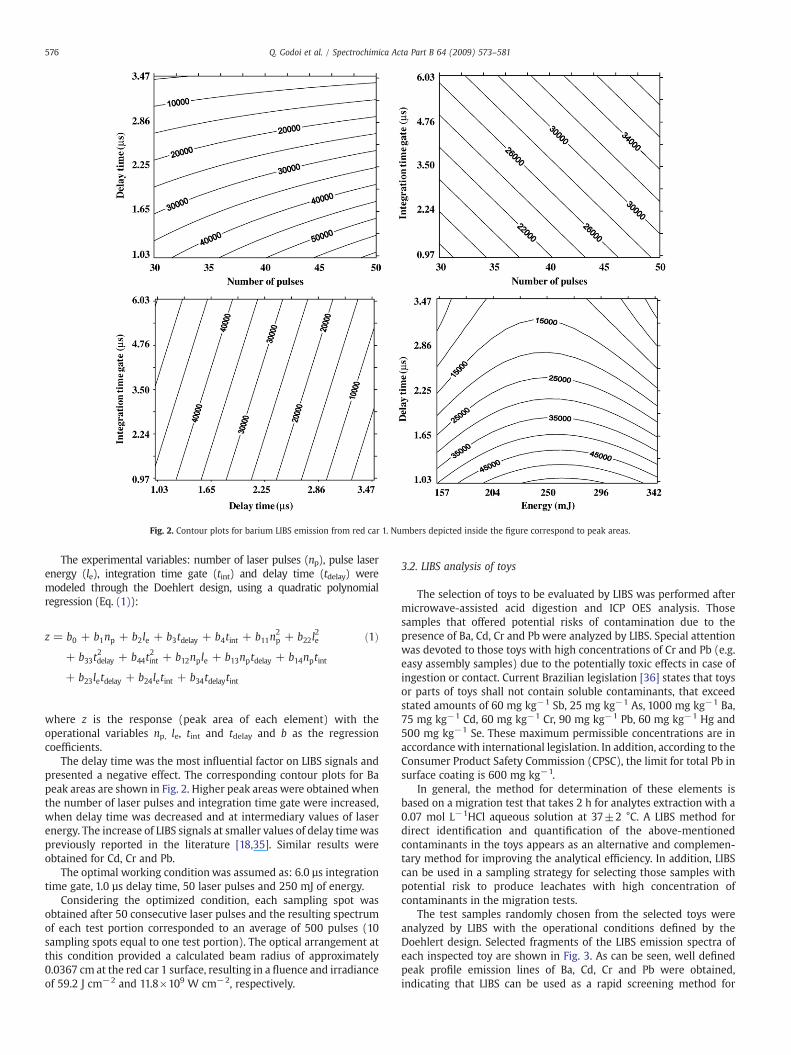
Fig. 2. Contour plots for barium LIBS emission from red car 1. Numbers depicted inside the figure correspond to peak areas.
576 Q. Godoi et al. / Spectrochimica Acta Part B 64 (2009) 573–581
The experimental variables: number of laser pulses (np), pulse laserenergy (le), integration time gate (tint) and delay time (tdelay) weremodeled through the Doehlert design, using a quadratic polynomialregression (Eq. (1)):
z = b0 + b1np + b2le + b3tdelay + b4tint + b11n2p + b22l
2e
+ b33t2delay + b44t
2int + b12nple + b13nptdelay + b14nptint
+ b23letdelay + b24letint + b34tdelaytint
ð1Þ
where z is the response (peak area of each element) with theoperational variables np, le, tint and tdelay and b as the regressioncoefficients.
The delay time was the most influential factor on LIBS signals andpresented a negative effect. The corresponding contour plots for Bapeak areas are shown in Fig. 2. Higher peak areas were obtained whenthe number of laser pulses and integration time gate were increased,when delay time was decreased and at intermediary values of laserenergy. The increase of LIBS signals at smaller values of delay timewaspreviously reported in the literature [18,35]. Similar results wereobtained for Cd, Cr and Pb.
The optimal working condition was assumed as: 6.0 µs integrationtime gate, 1.0 µs delay time, 50 laser pulses and 250 mJ of energy.
Considering the optimized condition, each sampling spot wasobtained after 50 consecutive laser pulses and the resulting spectrumof each test portion corresponded to an average of 500 pulses (10sampling spots equal to one test portion). The optical arrangement atthis condition provided a calculated beam radius of approximately0.0367 cm at the red car 1 surface, resulting in a fluence and irradianceof 59.2 J cm−2 and 11.8×10⁹ W cm−2, respectively.
3.2. LIBS analysis of toys
The selection of toys to be evaluated by LIBS was performed aftermicrowave-assisted acid digestion and ICP OES analysis. Thosesamples that offered potential risks of contamination due to thepresence of Ba, Cd, Cr and Pb were analyzed by LIBS. Special attentionwas devoted to those toys with high concentrations of Cr and Pb (e.g.easy assembly samples) due to the potentially toxic effects in case ofingestion or contact. Current Brazilian legislation [36] states that toysor parts of toys shall not contain soluble contaminants, that exceedstated amounts of 60 mg kg−1 Sb, 25 mg kg−1 As, 1000 mg kg−1 Ba,75 mg kg−1 Cd, 60 mg kg−1 Cr, 90 mg kg−1 Pb, 60 mg kg−1 Hg and500 mg kg−1 Se. These maximum permissible concentrations are inaccordance with international legislation. In addition, according to theConsumer Product Safety Commission (CPSC), the limit for total Pb insurface coating is 600 mg kg−1.
In general, the method for determination of these elements isbased on a migration test that takes 2 h for analytes extraction with a0.07 mol L−1HCl aqueous solution at 37±2 °C. A LIBS method fordirect identification and quantification of the above-mentionedcontaminants in the toys appears as an alternative and complemen-tary method for improving the analytical efficiency. In addition, LIBScan be used in a sampling strategy for selecting those samples withpotential risk to produce leachates with high concentration ofcontaminants in the migration tests.
The test samples randomly chosen from the selected toys wereanalyzed by LIBS with the operational conditions defined by theDoehlert design. Selected fragments of the LIBS emission spectra ofeach inspected toy are shown in Fig. 3. As can be seen, well definedpeak profile emission lines of Ba, Cd, Cr and Pb were obtained,indicating that LIBS can be used as a rapid screening method for
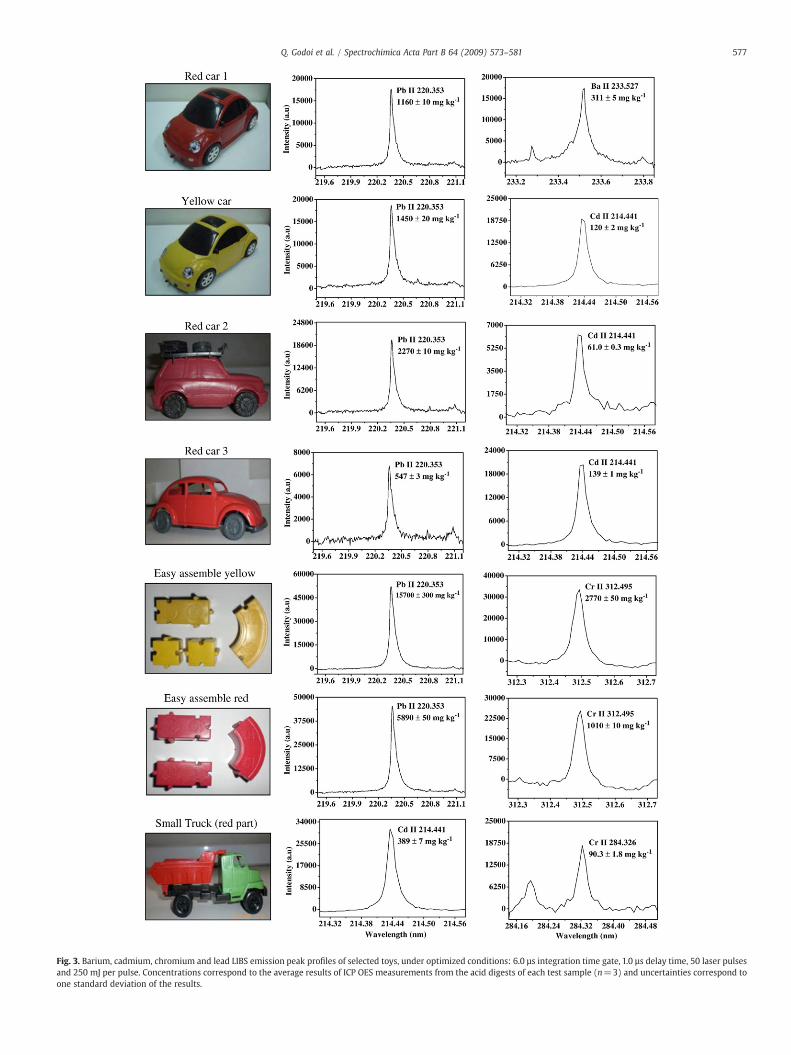
Fig. 3. Barium, cadmium, chromium and lead LIBS emission peak profiles of selected toys, under optimized conditions: 6.0 µs integration time gate, 1.0 µs delay time, 50 laser pulsesand 250 mJ per pulse. Concentrations correspond to the average results of ICP OES measurements from the acid digests of each test sample (n=3) and uncertainties correspond toone standard deviation of the results.
577Q. Godoi et al. / Spectrochimica Acta Part B 64 (2009) 573–581
578 Q. Godoi et al. / Spectrochimica Acta Part B 64 (2009) 573–581
investigation of inorganic contaminants in toys. The simplicity of LIBSarrangement basically comprised by a laser and a spectrometer, fastmeasurements and the analysis of solids without pre-treatmentmakes LIBS a useful technique for industrial quality control and apowerful tool for legal metrology systems aiming the control andsafety barriers of commercialized products.
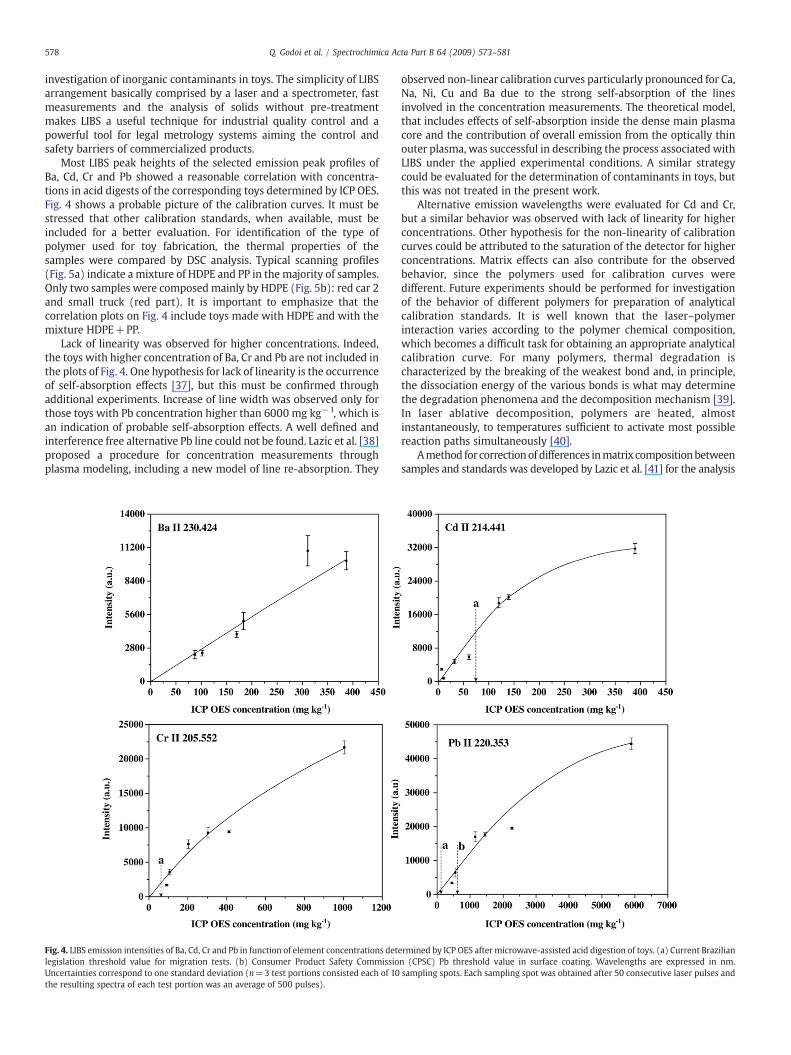
Most LIBS peak heights of the selected emission peak profiles ofBa, Cd, Cr and Pb showed a reasonable correlation with concentra-tions in acid digests of the corresponding toys determined by ICP OES.Fig. 4 shows a probable picture of the calibration curves. It must bestressed that other calibration standards, when available, must beincluded for a better evaluation. For identification of the type ofpolymer used for toy fabrication, the thermal properties of thesamples were compared by DSC analysis. Typical scanning profiles(Fig. 5a) indicate a mixture of HDPE and PP in the majority of samples.Only two samples were composed mainly by HDPE (Fig. 5b): red car 2and small truck (red part). It is important to emphasize that thecorrelation plots on Fig. 4 include toys made with HDPE and with themixture HDPE+PP.
Lack of linearity was observed for higher concentrations. Indeed,the toys with higher concentration of Ba, Cr and Pb are not included inthe plots of Fig. 4. One hypothesis for lack of linearity is the occurrenceof self-absorption effects [37], but this must be confirmed throughadditional experiments. Increase of line width was observed only forthose toys with Pb concentration higher than 6000 mg kg−1, which isan indication of probable self-absorption effects. A well defined andinterference free alternative Pb line could not be found. Lazic et al. [38]proposed a procedure for concentration measurements throughplasma modeling, including a new model of line re-absorption. They
Fig. 4. LIBS emission intensities of Ba, Cd, Cr and Pb in function of element concentrations detlegislation threshold value for migration tests. (b) Consumer Product Safety CommissioUncertainties correspond to one standard deviation (n=3 test portions consisted each of 10the resulting spectra of each test portion was an average of 500 pulses).
observed non-linear calibration curves particularly pronounced for Ca,Na, Ni, Cu and Ba due to the strong self-absorption of the linesinvolved in the concentration measurements. The theoretical model,that includes effects of self-absorption inside the dense main plasmacore and the contribution of overall emission from the optically thinouter plasma, was successful in describing the process associated withLIBS under the applied experimental conditions. A similar strategycould be evaluated for the determination of contaminants in toys, butthis was not treated in the present work.
Alternative emission wavelengths were evaluated for Cd and Cr,but a similar behavior was observed with lack of linearity for higherconcentrations. Other hypothesis for the non-linearity of calibrationcurves could be attributed to the saturation of the detector for higherconcentrations. Matrix effects can also contribute for the observedbehavior, since the polymers used for calibration curves weredifferent. Future experiments should be performed for investigationof the behavior of different polymers for preparation of analyticalcalibration standards. It is well known that the laser–polymerinteraction varies according to the polymer chemical composition,which becomes a difficult task for obtaining an appropriate analyticalcalibration curve. For many polymers, thermal degradation ischaracterized by the breaking of the weakest bond and, in principle,the dissociation energy of the various bonds is what may determinethe degradation phenomena and the decomposition mechanism [39].In laser ablative decomposition, polymers are heated, almostinstantaneously, to temperatures sufficient to activate most possiblereaction paths simultaneously [40].
Amethod for correctionof differences inmatrixcompositionbetweensamples and standards was developed by Lazic et al. [41] for the analysis
ermined by ICP OES after microwave-assisted acid digestion of toys. (a) Current Braziliann (CPSC) Pb threshold value in surface coating. Wavelengths are expressed in nm.sampling spots. Each sampling spot was obtained after 50 consecutive laser pulses and
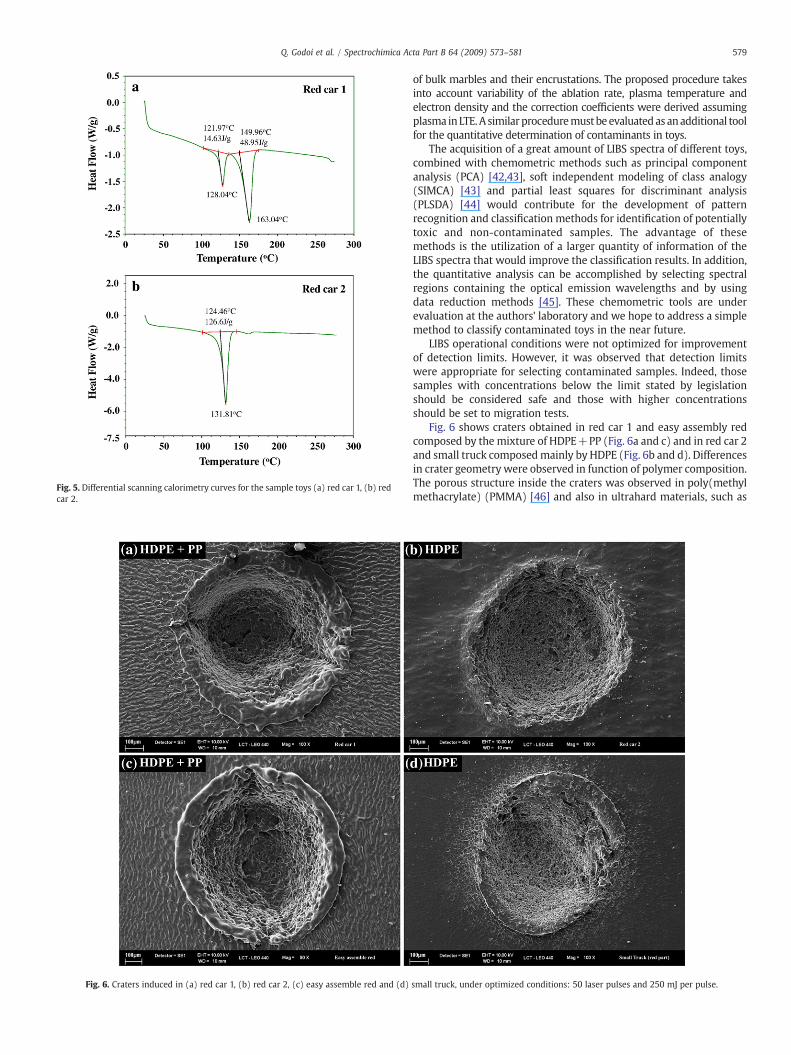
Fig. 5. Differential scanning calorimetry curves for the sample toys (a) red car 1, (b) redcar 2.
Fig. 6. Craters induced in (a) red car 1, (b) red car 2, (c) easy assemble red and (d)
579Q. Godoi et al. / Spectrochimica Acta Part B 64 (2009) 573–581
of bulk marbles and their encrustations. The proposed procedure takesinto account variability of the ablation rate, plasma temperature andelectron density and the correction coefficients were derived assumingplasma inLTE.A similar proceduremustbe evaluatedas anadditional toolfor the quantitative determination of contaminants in toys.
The acquisition of a great amount of LIBS spectra of different toys,combined with chemometric methods such as principal componentanalysis (PCA) [42,43], soft independent modeling of class analogy(SIMCA) [43] and partial least squares for discriminant analysis(PLSDA) [44] would contribute for the development of patternrecognition and classification methods for identification of potentiallytoxic and non-contaminated samples. The advantage of thesemethods is the utilization of a larger quantity of information of theLIBS spectra that would improve the classification results. In addition,the quantitative analysis can be accomplished by selecting spectralregions containing the optical emission wavelengths and by usingdata reduction methods [45]. These chemometric tools are underevaluation at the authors' laboratory and we hope to address a simplemethod to classify contaminated toys in the near future.
LIBS operational conditions were not optimized for improvementof detection limits. However, it was observed that detection limitswere appropriate for selecting contaminated samples. Indeed, thosesamples with concentrations below the limit stated by legislationshould be considered safe and those with higher concentrationsshould be set to migration tests.
Fig. 6 shows craters obtained in red car 1 and easy assembly redcomposed by the mixture of HDPE+PP (Fig. 6a and c) and in red car 2and small truck composedmainly by HDPE (Fig. 6b and d). Differencesin crater geometry were observed in function of polymer composition.The porous structure inside the craters was observed in poly(methylmethacrylate) (PMMA) [46] and also in ultrahard materials, such as
small truck, under optimized conditions: 50 laser pulses and 250 mJ per pulse.
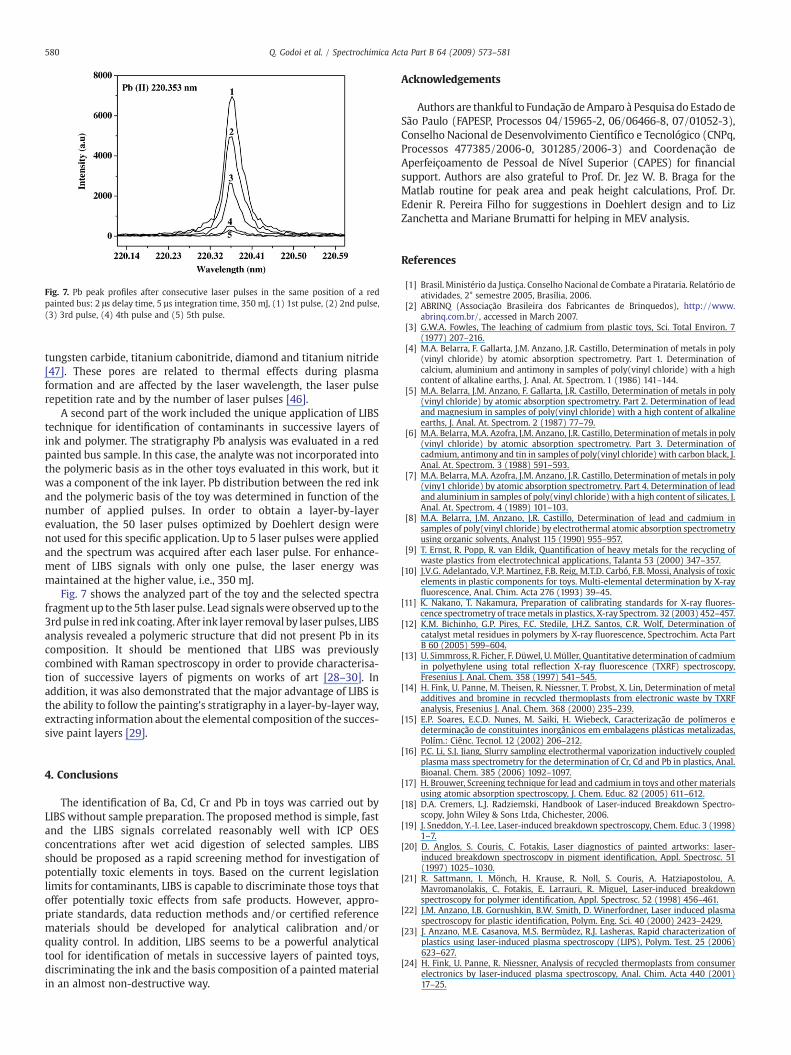
Fig. 7. Pb peak profiles after consecutive laser pulses in the same position of a redpainted bus: 2 μs delay time, 5 µs integration time, 350 mJ, (1) 1st pulse, (2) 2nd pulse,(3) 3rd pulse, (4) 4th pulse and (5) 5th pulse.
580 Q. Godoi et al. / Spectrochimica Acta Part B 64 (2009) 573–581
tungsten carbide, titanium cabonitride, diamond and titanium nitride[47]. These pores are related to thermal effects during plasmaformation and are affected by the laser wavelength, the laser pulserepetition rate and by the number of laser pulses [46].
A second part of the work included the unique application of LIBStechnique for identification of contaminants in successive layers ofink and polymer. The stratigraphy Pb analysis was evaluated in a redpainted bus sample. In this case, the analyte was not incorporated intothe polymeric basis as in the other toys evaluated in this work, but itwas a component of the ink layer. Pb distribution between the red inkand the polymeric basis of the toy was determined in function of thenumber of applied pulses. In order to obtain a layer-by-layerevaluation, the 50 laser pulses optimized by Doehlert design werenot used for this specific application. Up to 5 laser pulses were appliedand the spectrum was acquired after each laser pulse. For enhance-ment of LIBS signals with only one pulse, the laser energy wasmaintained at the higher value, i.e., 350 mJ.
Fig. 7 shows the analyzed part of the toy and the selected spectrafragment up to the 5th laser pulse. Lead signalswere observedup to the3rdpulse in red ink coating. After ink layer removal by laser pulses, LIBSanalysis revealed a polymeric structure that did not present Pb in itscomposition. It should be mentioned that LIBS was previouslycombined with Raman spectroscopy in order to provide characterisa-tion of successive layers of pigments on works of art [28–30]. Inaddition, it was also demonstrated that the major advantage of LIBS isthe ability to follow the painting's stratigraphy in a layer-by-layer way,extracting information about the elemental composition of the succes-sive paint layers [29].
4. Conclusions
The identification of Ba, Cd, Cr and Pb in toys was carried out byLIBS without sample preparation. The proposed method is simple, fastand the LIBS signals correlated reasonably well with ICP OESconcentrations after wet acid digestion of selected samples. LIBSshould be proposed as a rapid screening method for investigation ofpotentially toxic elements in toys. Based on the current legislationlimits for contaminants, LIBS is capable to discriminate those toys thatoffer potentially toxic effects from safe products. However, appro-priate standards, data reduction methods and/or certified referencematerials should be developed for analytical calibration and/orquality control. In addition, LIBS seems to be a powerful analyticaltool for identification of metals in successive layers of painted toys,discriminating the ink and the basis composition of a painted materialin an almost non-destructive way.
Acknowledgements
Authors are thankful to Fundação deAmparo à Pesquisa do EstadodeSão Paulo (FAPESP, Processos 04/15965-2, 06/06466-8, 07/01052-3),Conselho Nacional de Desenvolvimento Científico e Tecnológico (CNPq,Processos 477385/2006-0, 301285/2006-3) and Coordenação deAperfeiçoamento de Pessoal de Nível Superior (CAPES) for financialsupport. Authors are also grateful to Prof. Dr. Jez W. B. Braga for theMatlab routine for peak area and peak height calculations, Prof. Dr.Edenir R. Pereira Filho for suggestions in Doehlert design and to LizZanchetta and Mariane Brumatti for helping in MEV analysis.
References
[1] Brasil. Ministério da Justiça. Conselho Nacional de Combate a Pirataria. Relatório deatividades, 2° semestre 2005, Brasília, 2006.
[2] ABRINQ (Associação Brasileira dos Fabricantes de Brinquedos), http://www.abrinq.com.br/, accessed in March 2007.
[3] G.W.A. Fowles, The leaching of cadmium from plastic toys, Sci. Total Environ. 7(1977) 207–216.
[4] M.A. Belarra, F. Gallarta, J.M. Anzano, J.R. Castillo, Determination of metals in poly(vinyl chloride) by atomic absorption spectrometry. Part 1. Determination ofcalcium, aluminium and antimony in samples of poly(vinyl chloride) with a highcontent of alkaline earths, J. Anal. At. Spectrom. 1 (1986) 141–144.
[5] M.A. Belarra, J.M. Anzano, F. Gallarta, J.R. Castillo, Determination of metals in poly(vinyl chloride) by atomic absorption spectrometry. Part 2. Determination of leadand magnesium in samples of poly(vinyl chloride) with a high content of alkalineearths, J. Anal. At. Spectrom. 2 (1987) 77–79.
[6] M.A. Belarra, M.A. Azofra, J.M. Anzano, J.R. Castillo, Determination of metals in poly(vinyl chloride) by atomic absorption spectrometry. Part 3. Determination ofcadmium, antimony and tin in samples of poly(vinyl chloride) with carbon black, J.Anal. At. Spectrom. 3 (1988) 591–593.
[7] M.A. Belarra, M.A. Azofra, J.M. Anzano, J.R. Castillo, Determination of metals in poly(viny1 chloride) by atomic absorption spectrometry. Part 4. Determination of leadand aluminium in samples of poly(vinyl chloride) with a high content of silicates, J.Anal. At. Spectrom. 4 (1989) 101–103.
[8] M.A. Belarra, J.M. Anzano, J.R. Castillo, Determination of lead and cadmium insamples of poly(vinyl chloride) by electrothermal atomic absorption spectrometryusing organic solvents, Analyst 115 (1990) 955–957.
[9] T. Ernst, R. Popp, R. van Eldik, Quantification of heavy metals for the recycling ofwaste plastics from electrotechnical applications, Talanta 53 (2000) 347–357.
[10] J.V.G. Adelantado, V.P. Martinez, F.B. Reig, M.T.D. Carbó, F.B. Mossi, Analysis of toxicelements in plastic components for toys. Multi-elemental determination by X-rayfluorescence, Anal. Chim. Acta 276 (1993) 39–45.
[11] K. Nakano, T. Nakamura, Preparation of calibrating standards for X-ray fluores-cence spectrometry of tracemetals in plastics, X-ray Spectrom. 32 (2003) 452–457.
[12] K.M. Bichinho, G.P. Pires, F.C. Stedile, J.H.Z. Santos, C.R. Wolf, Determination ofcatalyst metal residues in polymers by X-ray fluorescence, Spectrochim. Acta PartB 60 (2005) 599–604.
[13] U. Simmross, R. Ficher, F. Düwel, U. Müller, Quantitative determination of cadmiumin polyethylene using total reflection X-ray fluorescence (TXRF) spectroscopy,Fresenius J. Anal. Chem. 358 (1997) 541–545.
[14] H. Fink, U. Panne, M. Theisen, R. Niessner, T. Probst, X. Lin, Determination of metaladditives and bromine in recycled thermoplasts from electronic waste by TXRFanalysis, Fresenius J. Anal. Chem. 368 (2000) 235–239.
[15] E.P. Soares, E.C.D. Nunes, M. Saiki, H. Wiebeck, Caracterização de polímeros edeterminação de constituintes inorgânicos em embalagens plásticas metalizadas,Polím.: Ciênc. Tecnol. 12 (2002) 206–212.
[16] P.C. Li, S.J. Jiang, Slurry sampling electrothermal vaporization inductively coupledplasma mass spectrometry for the determination of Cr, Cd and Pb in plastics, Anal.Bioanal. Chem. 385 (2006) 1092–1097.
[17] H. Brouwer, Screening technique for lead and cadmium in toys and other materialsusing atomic absorption spectroscopy, J. Chem. Educ. 82 (2005) 611–612.
[18] D.A. Cremers, L.J. Radziemski, Handbook of Laser-induced Breakdown Spectro-scopy, John Wiley & Sons Ltda, Chichester, 2006.
[19] J. Sneddon, Y.-I. Lee, Laser-induced breakdown spectroscopy, Chem. Educ. 3 (1998)1–7.
[20] D. Anglos, S. Couris, C. Fotakis, Laser diagnostics of painted artworks: laser-induced breakdown spectroscopy in pigment identification, Appl. Spectrosc. 51(1997) 1025–1030.
[21] R. Sattmann, I. Mönch, H. Krause, R. Noll, S. Couris, A. Hatziapostolou, A.Mavromanolakis, C. Fotakis, E. Larrauri, R. Miguel, Laser-induced breakdownspectroscopy for polymer identification, Appl. Spectrosc. 52 (1998) 456–461.
[22] J.M. Anzano, I.B. Gornushkin, B.W. Smith, D. Winerfordner, Laser induced plasmaspectroscopy for plastic identification, Polym. Eng. Sci. 40 (2000) 2423–2429.
[23] J. Anzano, M.E. Casanova, M.S. Bermùdez, R.J. Lasheras, Rapid characterization ofplastics using laser-induced plasma spectroscopy (LIPS), Polym. Test. 25 (2006)623–627.
[24] H. Fink, U. Panne, R. Niessner, Analysis of recycled thermoplasts from consumerelectronics by laser-induced plasma spectroscopy, Anal. Chim. Acta 440 (2001)17–25.
581Q. Godoi et al. / Spectrochimica Acta Part B 64 (2009) 573–581
[25] H. Fink, U. Panne, R. Niessner, Process analysis of recycled thermoplasts fromconsumer electronics by laser-induced plasma spectroscopy, Anal. Chim. Acta 74(2002) 4334–4342.
[26] M. Oujja, A. Vila, E. Rebollar, J.F. García, M. Castillejo, Identification of inks andstructural characterization of contemporary artistic prints by laser-inducedbreakdown spectroscopy, Spectrochim. Acta Part B 60 (2005) 1140–1148.
[27] Q. Wang, P. Jander, C. Fricke-Begemann, R. Noll, Comparison of 1064 nm and266 nm excitation of laser-induced plasmas for several types of plastics and oneexplosive, Spectrochim. Acta Part B 63 (2008) 1011–1015.
[28] M. Castillejo, M. Martín, D. Silva, T. Stratoudaki, D. Anglos, L. Burgio, R.J.H. Clark,Analysis of pigments in polychromes by use of laser induced breakdownspectroscopy and Raman microscopy, J. Mol. Struct. 550 (2000) 191–198.
[29] L. Burgio, R.J.H. Clark, T. Stratoudaki, M. Doulgeridis, D. Anglos, Pigmentidentification in painted artworks: a dual analytical approach employing laser-induced breakdown spectroscopy and Raman microscopy, Appl. Spectrosc. 54(2000) 463–469.
[30] L. Burgio, K. Melessanaki, M. Doulgeridis, R.J.H. Clark, D. Anglos, Pigmentidentification in paintings employing laser induced breakdown spectroscopyand Raman microscopy, Spectrochim. Acta Part B 56 (2001) 905–913.
[31] B.E. Naes, S. Umpierrez, S. Ryland, C. Barnett, J.R. Almirall, A comparison of laserablation inductively coupled plasma mass spectrometry, micro X-ray fluorescencespectroscopy, and laser induced breakdown spectroscopy for the discrimination ofautomotive glass, Spectrochim. Acta Part B 63 (2008) 1145–1150.
[32] R. Brennetot, J.L. Lacour, E. Vors, A. Rivoallan, D. Vailhen, S. Maurice, Mars analysisby laser-induced breakdown spectroscopy (MALIS): influence of Mars Atmo-sphere on plasma emission and study of factors influencing plasma emission withthe use of Doehlert Designs, Appl. Spectrosc. 57 (2003) 744–752.
[33] NIST (National Institute of Standards and Technology), http://physics.nist.gov/PhysRefData/ASD/lines_form.html, accessed in April, 2008.
[34] F. Yueh, J.P. Singh, H. Zhang, Laser-induced breakdown spectroscopy, elementalanalysis, in: R.A. Meyers (Ed.), Encyclopedia of Analytical Chemistry, Wiley, 2000.
[35] C. Aragón, F. Peñalba, J.A. Aguilera, Curves of growth of neutral atom and ion linesemitted by a laser induced plasma, Spectrochim. Acta Part B 60 (2005) 879–887.
[36] Associação Brasileira de Normas Técnicas, NBR NM 300-3: Segurança debrinquedos. Parte 3: Migração de certos elementosfirst ed., 2004, Rio de Janeiro.
[37] A.M. El Sherbini, Th.M. El Sherbini, H. Hegazy, G. Cristoforetti, S. Legnaioli, V.Palleschi, L. Pardini, A. Salvetti, E. Tognoni, Evaluation of self-absorptioncoefficients of aluminum emission lines in laser-induced breakdown spectroscopymeasurements, Spectrochim. Acta Part B 60 (2005) 1573–1579.
[38] V. Lazic, R. Barbini, F. Colao, R. Fantoni, A. Palucci, Self-absorption model inquantitative laser induced breakdown spectroscopy measurements on soils andsediments, Spectrochim. Acta Part B 56 (2001) 807–820.
[39] D.W. Van Krevelen, Properties of Polymers, third ed.Elsevier, New York, 1990.[40] G.B. Blanchet, Laser ablation and the unzipping of addition polymer, J. Appl. Phys.
80 (1996) 4082–4089.[41] V. Lazic, R. Fantoni, F. Colao, A. Santagata, A. Morone, V. Spizzichino, Quantitative
laser induced breakdown spectroscopy analysis of ancient marbles and correctionsfor the variability of plasma parameters and of ablation rate, J. Anal. At. Spectrom.19 (2004) 429–436.
[42] A. Erdem, A. Çilingiroglu, A. Giakoumaki, M. Castanys, E. Kartsonaki, C. Fotakis, D.Anglos, Characterization of Iron age pottery from eastern Turkey by laser-inducedbreakdown spectroscopy (LIBS), J. Archaeol. Sci. 35 (2008) 2486–2494.
[43] C.A. Munson, F.C. De Lucia Jr., T. Piehler, K.L. McNesby, A.W. Miziolek, Investigationof statistics strategies for improving the discriminating power of laser-inducedbreakdown spectroscopy for chemical and biological warfare agent simulants,Spectrochim. Acta Part B 60 (2005) 1217–1224.
[44] F.C. De Lucia Jr., J.L. Gottfried, C.A. Munson, A.W. Miziolek, Multivariate analysis ofstandoff laser-induced breakdown spectroscopy spectra for classification ofexplosive-containing residues, Appl. Opt. 47 (2008) G112–G121.
[45] F. Colao, R. Fantoni, V. Lazic, A. Morone, A. Santagata, A. Giardini, LIBS used as adiagnostic tool during the laser cleaning of ancient marble from Mediterraneanareas, Appl. Phys. A 79 (2004) 213–219.
[46] Z.Q. Liu, Y. Feng, X.-S. Yi, Coupling effects of the number of pulses, pulse repetitionrate and fluence during laser PMMA ablation, Appl. Surf. Sci. 165 (2000) 303–308.
[47] G. Dumitru, V. Romano, H.P. Weber, M. Sentis, W. Marine, Femtosecond ablation ofultrahard materials, Appl. Phys. Part A 74 (2002) 729–739.
Related Documents


![Risk Assessment of Villa Zebra materials · in toys and childcare articles). [4] A.O. Earls, I.P. Axford, J.H. Braybrook (2003). Gas chromatography–mass spectrometry determination](https://static.cupdf.com/doc/110x72/5e5a9241f9b90a75e74d414f/risk-assessment-of-villa-zebra-in-toys-and-childcare-articles-4-ao-earls.jpg)