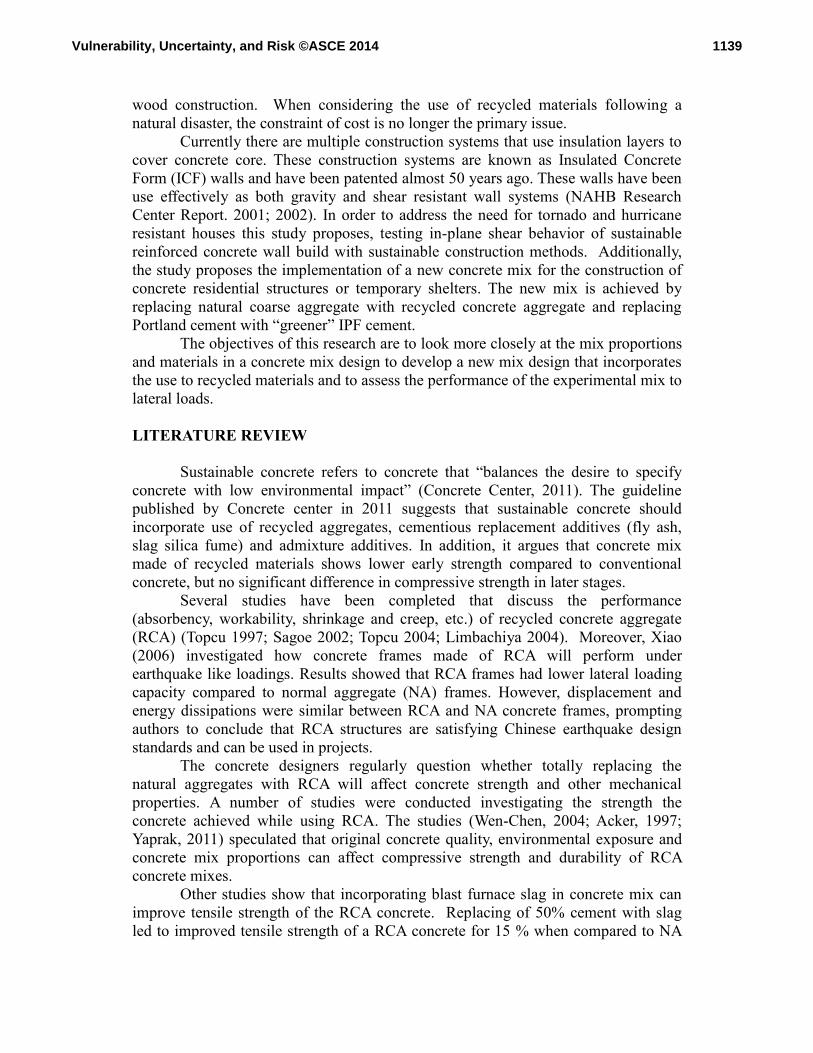
Preliminary Structural Performance Assessment of Recycled Materials for Disaster Reconstruction Matija Radovic 1 , Terri R. Norton, Ph.D., AM.ASCE 2 , and Meagan Kurmel 3 1 Doctoral Student, Department of Civil and Environmental Engineering, University of Delaware, Newark, DE, USA 2 Associate Professor, Durham School of Architectural Engineering and Construction, University of Nebraska-Lincoln, Omaha, NE, USA; PH (402) 554-2564; FAX (402) 554-3107; email: [email protected] 3 Bachelors Student, Architectural Engineering Program, University of Nebraska- Lincoln, Omaha, NE, USA ABSTRACT Recent natural disasters like the 2010 Haiti Earthquake, the 2011 Tohoku Earthquake and Tsunami and the 2011 Joplin Tornados have shown how destructive dynamic loads can be on the built environment. These events left an overwhelming amount of construction and demolition debris behind, requiring the need to find ways of effectively disposing or recycling/reusing. It is proposed that a sustainable approach would be to recycle and reuse the disaster debris for the construction of temporary shelters. Therefore, this study will assess the structural performance of structural wall panels composed of recycled materials. The work will include the evaluation of different concrete mix designs with varying aggregate replacement including: recycled concrete, steel shavings and crumb rubber. The research begins with the performance assessment of recycled concrete. Lateral load tests were performed on shear wall panels to measure the shear capacity of the experimental mix. In addition, the compressive strength and toughness was evaluated and compared. The preliminary results showed that although the experimental mix showed a significantly lower shear capacity, 123.2 kN (27.7 kips), compared to the shear capacity, 180.2 kN (40.5 kips), of the control mix, it was greater than shear demand, 93.9 kN (21.1kips). The experimental mix also displayed reduced compressive strength. INTRODUCTION Natural hazards, like earthquakes, tornadoes and hurricanes, can impose destructive lateral forces on a building structure. According to National Oceanic and Atmospheric Administration (NOAA), during 2011 a total of 1,691 tornadoes and 176 casualties were reported across the United States. Although concrete shear walls are the most efficient lateral load resisting system, they are rarely used in residential construction. This is mainly due to higher construction costs when compared to 1138 Vulnerability, Uncertainty, and Risk ©ASCE 2014

Welcome message from author
This document is posted to help you gain knowledge. Please leave a comment to let me know what you think about it! Share it to your friends and learn new things together.
Transcript
Preliminary Structural Performance Assessment of Recycled Materials for
Disaster Reconstruction
Matija Radovic1, Terri R. Norton, Ph.D., AM.ASCE
2, and Meagan Kurmel
3
1Doctoral Student, Department of Civil and Environmental Engineering, University
of Delaware, Newark, DE, USA 2Associate Professor, Durham School of Architectural Engineering and Construction,
University of Nebraska-Lincoln, Omaha, NE, USA; PH (402) 554-2564; FAX (402)
554-3107; email: [email protected] 3Bachelors Student, Architectural Engineering Program, University of Nebraska-
Lincoln, Omaha, NE, USA
ABSTRACT
Recent natural disasters like the 2010 Haiti Earthquake, the 2011 Tohoku
Earthquake and Tsunami and the 2011 Joplin Tornados have shown how destructive
dynamic loads can be on the built environment. These events left an overwhelming
amount of construction and demolition debris behind, requiring the need to find ways
of effectively disposing or recycling/reusing. It is proposed that a sustainable
approach would be to recycle and reuse the disaster debris for the construction of
temporary shelters. Therefore, this study will assess the structural performance of
structural wall panels composed of recycled materials. The work will include the
evaluation of different concrete mix designs with varying aggregate replacement
including: recycled concrete, steel shavings and crumb rubber. The research begins
with the performance assessment of recycled concrete. Lateral load tests were
performed on shear wall panels to measure the shear capacity of the experimental
mix. In addition, the compressive strength and toughness was evaluated and
compared. The preliminary results showed that although the experimental mix
showed a significantly lower shear capacity, 123.2 kN (27.7 kips), compared to the
shear capacity, 180.2 kN (40.5 kips), of the control mix, it was greater than shear
demand, 93.9 kN (21.1kips). The experimental mix also displayed reduced
compressive strength.
INTRODUCTION
Natural hazards, like earthquakes, tornadoes and hurricanes, can impose
destructive lateral forces on a building structure. According to National Oceanic and
Atmospheric Administration (NOAA), during 2011 a total of 1,691 tornadoes and 176
casualties were reported across the United States. Although concrete shear walls are
the most efficient lateral load resisting system, they are rarely used in residential
construction. This is mainly due to higher construction costs when compared to
1138Vulnerability, Uncertainty, and Risk ©ASCE 2014
wood construction. When considering the use of recycled materials following a
natural disaster, the constraint of cost is no longer the primary issue.
Currently there are multiple construction systems that use insulation layers to
cover concrete core. These construction systems are known as Insulated Concrete
Form (ICF) walls and have been patented almost 50 years ago. These walls have been
use effectively as both gravity and shear resistant wall systems (NAHB Research
Center Report. 2001; 2002). In order to address the need for tornado and hurricane
resistant houses this study proposes, testing in-plane shear behavior of sustainable
reinforced concrete wall build with sustainable construction methods. Additionally,
the study proposes the implementation of a new concrete mix for the construction of
concrete residential structures or temporary shelters. The new mix is achieved by
replacing natural coarse aggregate with recycled concrete aggregate and replacing
Portland cement with “greener” IPF cement.
The objectives of this research are to look more closely at the mix proportions
and materials in a concrete mix design to develop a new mix design that incorporates
the use to recycled materials and to assess the performance of the experimental mix to
lateral loads.
LITERATURE REVIEW
Sustainable concrete refers to concrete that “balances the desire to specify
concrete with low environmental impact” (Concrete Center, 2011). The guideline
published by Concrete center in 2011 suggests that sustainable concrete should
incorporate use of recycled aggregates, cementious replacement additives (fly ash,
slag silica fume) and admixture additives. In addition, it argues that concrete mix
made of recycled materials shows lower early strength compared to conventional
concrete, but no significant difference in compressive strength in later stages.
Several studies have been completed that discuss the performance
(absorbency, workability, shrinkage and creep, etc.) of recycled concrete aggregate
(RCA) (Topcu 1997; Sagoe 2002; Topcu 2004; Limbachiya 2004). Moreover, Xiao
(2006) investigated how concrete frames made of RCA will perform under
earthquake like loadings. Results showed that RCA frames had lower lateral loading
capacity compared to normal aggregate (NA) frames. However, displacement and
energy dissipations were similar between RCA and NA concrete frames, prompting
authors to conclude that RCA structures are satisfying Chinese earthquake design
standards and can be used in projects.
The concrete designers regularly question whether totally replacing the
natural aggregates with RCA will affect concrete strength and other mechanical
properties. A number of studies were conducted investigating the strength the
concrete achieved while using RCA. The studies (Wen-Chen, 2004; Acker, 1997;
Yaprak, 2011) speculated that original concrete quality, environmental exposure and
concrete mix proportions can affect compressive strength and durability of RCA
concrete mixes.
Other studies show that incorporating blast furnace slag in concrete mix can
improve tensile strength of the RCA concrete. Replacing of 50% cement with slag
led to improved tensile strength of a RCA concrete for 15 % when compared to NA
1139Vulnerability, Uncertainty, and Risk ©ASCE 2014
concrete (Berndt, 2008). Similarly, Olorunsogo (2002) found that RCA concrete with
35% of blast furnace slag- 65% Portland cement mix, had increased compressive and
tensile strengths when compared to regular NA concrete mix.
There are very few studies that have tested shear strength of cement mixes
with recycled aggregate. Sogo (2007) tested shear strength of recycled aggregate
beams with and without reinforcement. The study showed that when reinforcement is
not used the shear strength of the beams with recycled aggregate is 10-30% lower
compared to natural aggregates. When shear reinforcement is used no significant
difference is observed in shear strength of the specimens. However, there is a lack of
research on using recycled aggregates in shear walls or using self-consolidating
concrete in shear walls.
The first objective of this study is to compare in plane shear strengths of the
concrete shear walls that are made of two different concrete mixes. First concrete mix
is the mix that is commonly used in residential construction. This mix is control mix.
The second mix (experimental mix) is the mix that had coarse aggregate replaced
with recycled concrete aggregate, 20% of cement by mass replaced with fly ash, and
Portland cement replaced with IPF cement.
CONCRETE MIX DESIGN
The materials used in the concrete mixes were: Portland cement type I, IPF
cement, river sand, crushed limestone, recycled concrete aggregate, Nebraska fly ash
class C, super-plasticizers admixture (Glenium 3030).
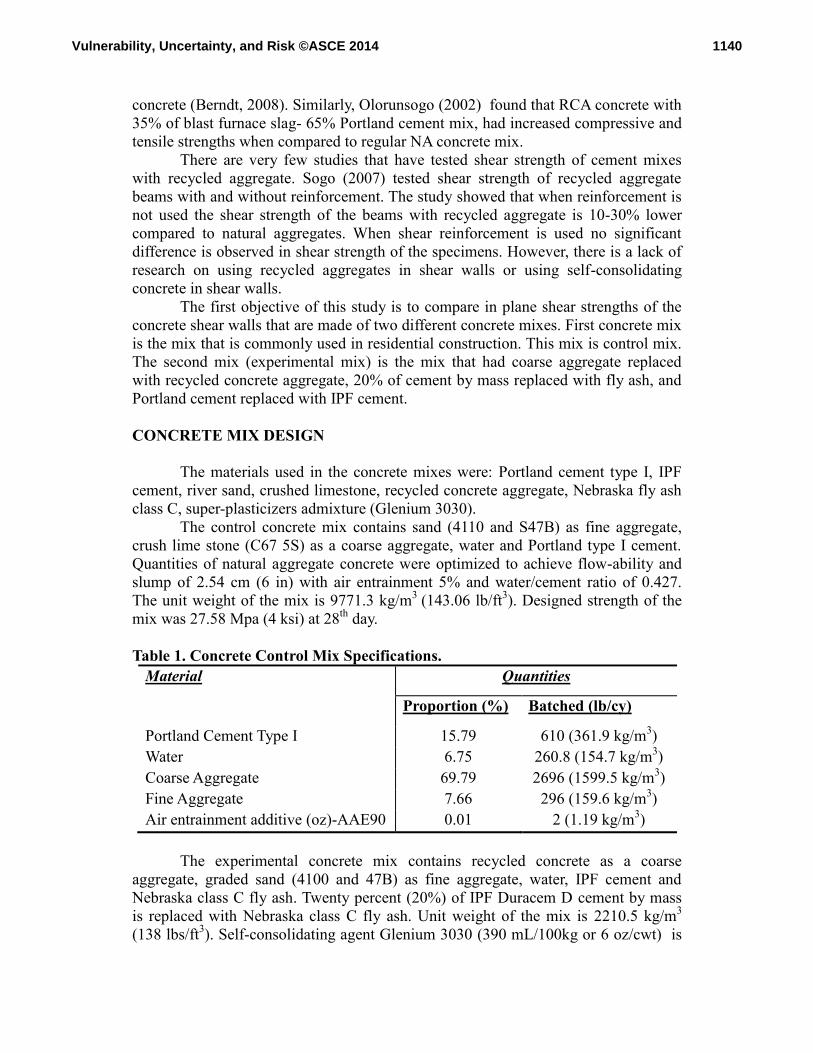
The control concrete mix contains sand (4110 and S47B) as fine aggregate,
crush lime stone (C67 5S) as a coarse aggregate, water and Portland type I cement.
Quantities of natural aggregate concrete were optimized to achieve flow-ability and
slump of 2.54 cm (6 in) with air entrainment 5% and water/cement ratio of 0.427.
The unit weight of the mix is 9771.3 kg/m3
(143.06 lb/ft3). Designed strength of the
mix was 27.58 Mpa (4 ksi) at 28th
day.
Table 1. Concrete Control Mix Specifications.
Material Quantities
Proportion (%) Batched (lb/cy)
Portland Cement Type I 15.79 610 (361.9 kg/m3)
Water 6.75 260.8 (154.7 kg/m3)
Coarse Aggregate 69.79 2696 (1599.5 kg/m3)
Fine Aggregate 7.66 296 (159.6 kg/m3)
Air entrainment additive (oz)-AAE90 0.01 2 (1.19 kg/m3)
The experimental concrete mix contains recycled concrete as a coarse
aggregate, graded sand (4100 and 47B) as fine aggregate, water, IPF cement and
Nebraska class C fly ash. Twenty percent (20%) of IPF Duracem D cement by mass
is replaced with Nebraska class C fly ash. Unit weight of the mix is 2210.5 kg/m3
(138 lbs/ft3). Self-consolidating agent Glenium 3030 (390 mL/100kg or 6 oz/cwt) is
1140Vulnerability, Uncertainty, and Risk ©ASCE 2014
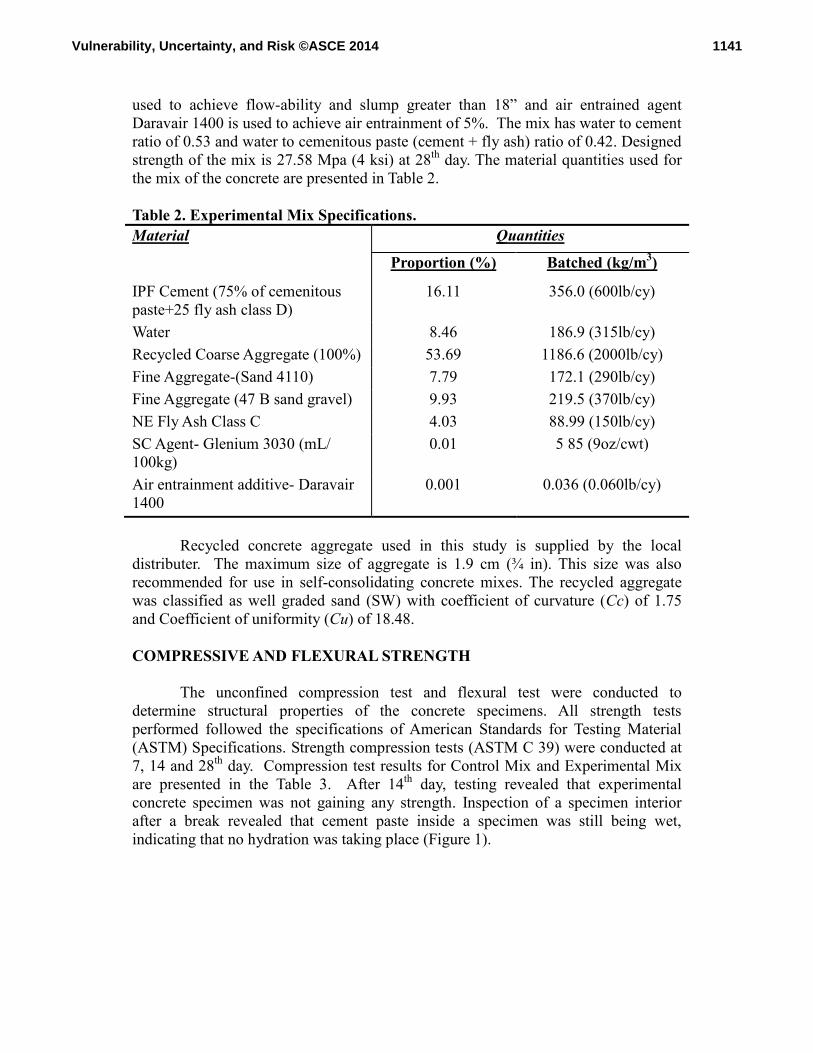
used to achieve flow-ability and slump greater than 18” and air entrained agent
Daravair 1400 is used to achieve air entrainment of 5%. The mix has water to cement
ratio of 0.53 and water to cemenitous paste (cement + fly ash) ratio of 0.42. Designed
strength of the mix is 27.58 Mpa (4 ksi) at 28th
day. The material quantities used for
the mix of the concrete are presented in Table 2.
Table 2. Experimental Mix Specifications.
Material Quantities
Proportion (%) Batched (kg/m3)
IPF Cement (75% of cemenitous
paste+25 fly ash class D)
16.11 356.0 (600lb/cy)
Water 8.46 186.9 (315lb/cy)
Recycled Coarse Aggregate (100%) 53.69 1186.6 (2000lb/cy)
Fine Aggregate-(Sand 4110) 7.79 172.1 (290lb/cy)
Fine Aggregate (47 B sand gravel) 9.93 219.5 (370lb/cy)
NE Fly Ash Class C 4.03 88.99 (150lb/cy)
SC Agent- Glenium 3030 (mL/
100kg)
0.01 5 85 (9oz/cwt)
Air entrainment additive- Daravair
1400
0.001 0.036 (0.060lb/cy)
Recycled concrete aggregate used in this study is supplied by the local
distributer. The maximum size of aggregate is 1.9 cm (¾ in). This size was also
recommended for use in self-consolidating concrete mixes. The recycled aggregate
was classified as well graded sand (SW) with coefficient of curvature (Cc) of 1.75
and Coefficient of uniformity (Cu) of 18.48.
COMPRESSIVE AND FLEXURAL STRENGTH
The unconfined compression test and flexural test were conducted to
determine structural properties of the concrete specimens. All strength tests
performed followed the specifications of American Standards for Testing Material
(ASTM) Specifications. Strength compression tests (ASTM C 39) were conducted at
7, 14 and 28th
day. Compression test results for Control Mix and Experimental Mix
are presented in the Table 3. After 14th
day, testing revealed that experimental
concrete specimen was not gaining any strength. Inspection of a specimen interior
after a break revealed that cement paste inside a specimen was still being wet,
indicating that no hydration was taking place (Figure 1).
1141Vulnerability, Uncertainty, and Risk ©ASCE 2014
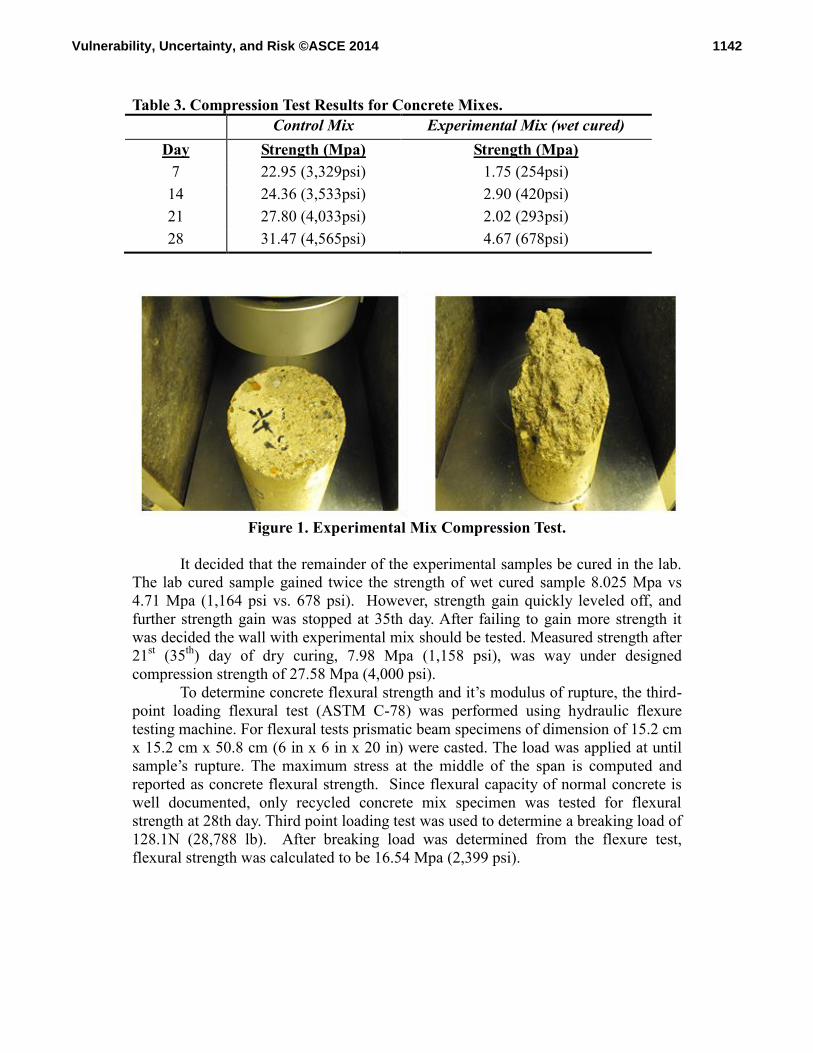
Table 3. Compression Test Results for Concrete Mixes.
Control Mix Experimental Mix (wet cured)
Day Strength (Mpa) Strength (Mpa)
7 22.95 (3,329psi) 1.75 (254psi)
14 24.36 (3,533psi) 2.90 (420psi)
21 27.80 (4,033psi) 2.02 (293psi)
28 31.47 (4,565psi) 4.67 (678psi)
Figure 1. Experimental Mix Compression Test.
It decided that the remainder of the experimental samples be cured in the lab.
The lab cured sample gained twice the strength of wet cured sample 8.025 Mpa vs
4.71 Mpa (1,164 psi vs. 678 psi). However, strength gain quickly leveled off, and
further strength gain was stopped at 35th day. After failing to gain more strength it
was decided the wall with experimental mix should be tested. Measured strength after
21st (35
th) day of dry curing, 7.98 Mpa (1,158 psi), was way under designed
compression strength of 27.58 Mpa (4,000 psi).
To determine concrete flexural strength and it’s modulus of rupture, the third-
point loading flexural test (ASTM C-78) was performed using hydraulic flexure
testing machine. For flexural tests prismatic beam specimens of dimension of 15.2 cm
x 15.2 cm x 50.8 cm (6 in x 6 in x 20 in) were casted. The load was applied at until
sample’s rupture. The maximum stress at the middle of the span is computed and
reported as concrete flexural strength. Since flexural capacity of normal concrete is
well documented, only recycled concrete mix specimen was tested for flexural
strength at 28th day. Third point loading test was used to determine a breaking load of
128.1N (28,788 lb). After breaking load was determined from the flexure test,
flexural strength was calculated to be 16.54 Mpa (2,399 psi).
1142Vulnerability, Uncertainty, and Risk ©ASCE 2014
SHEAR WALL DESIGN
Steel #4 (1.27 cm) bars size were meshed and used for longitudinal and
transversal reinforcement to provide strength and serviceability. Reinforcement steel
has modulus of elasticity of 199,948 Mpa (29,000 ksi) and yielding strength of
413.69 Mpa (60 ksi). The materials used in building of a formwork were: expanded
polystyrene panels, plywood panels with 1.9 cm (¾ in) of thickness, lumber boards of
dimensions 5.1 cm x 10.2 cm x 243.8 cm (2 in x 4 in x 8 ft), steel ties of diameter 1.3
cm (½ in) and 1.83 m (6 ft) length and plastic tubes of diameter 1.9 cm (¾ in) and
1.83 m (6 ft) length.
LATERAL LOAD TESTING
Based on the average square footage and average wall height, the study’s
structure profile used for calculation of the wind load is a wall 15.24 m x 14.63 m (50
ft x 48 ft) long and 2.44 m (8 ft) high with roof height of 4.572 m (15 ft) and slope of
15. The length of the profile represents the average side of the single family one-story
residential unit, while the profile’s height represents average residential wall height.
The roof height and roof slope are derived from the dimensions of the structure and
they follow the provisions of the International Residential Code for One and Two
Family Dwellings (IRC 2012, Section R301.3 Story height).
Since the study assumes future application of the concrete shear walls in the
tornado and hurricane prone areas, it was proposed that designed basic wind speed be
77 m/s (170 mph) which correspond to basic wind speed from the ASCE 07-10 map
for southern Florida. Total wind load acting on structure is calculated to be 12.39
kN/m (848.93 lb/ft). The lateral wind force was calculated to be 94.39 kN (21.22
kips).
The study proposed building concrete wall that is 2.4376 m (8 ft) 243.8 cm
(96 in) high, 4.27 m (14 ft) 243.8 cm (168 in) long and 15.2 cm (6 in) thick, with the
double door opening in the middle of the wall that is 2.08 m (6.83 ft) 208.3 cm (82
in) high, 1.828 m (6 ft) 182.9 cm (72 in) long. The wall was sandwiched between
5.08 cm (2”) thick insulation panels and placed over concrete footing that is 5.48 m
(18 ft) 548.6 cm (216 in) long, 0.557 m (1.83 ft) 55.9 cm (22 in) wide and 0.3048 m
(1ft) 30.5 cm (12in) high.
Shear wall testing has taken place in the University of Nebraska–Lincoln
Structural Lab at the Peter Kiewit Institute. Tests were conducted after concrete’s
curing period of 28 days. The shear walls were tested in vertical position.
Overturning restraint connections that were attached at the leading edge and at mid-
span of the footing are preventing overturning failure of the specimen. These hold-
down connections are anchoring footing to the structural lab strong floor. Shear wall
sliding was prevented by 30.5 cm x 30.5 cm 5.1 cm (12 in x 12 in x 2 in) steel plate
that was anchored to a strong floor while bearing on in-plane back edge of the shear
wall’s footing.
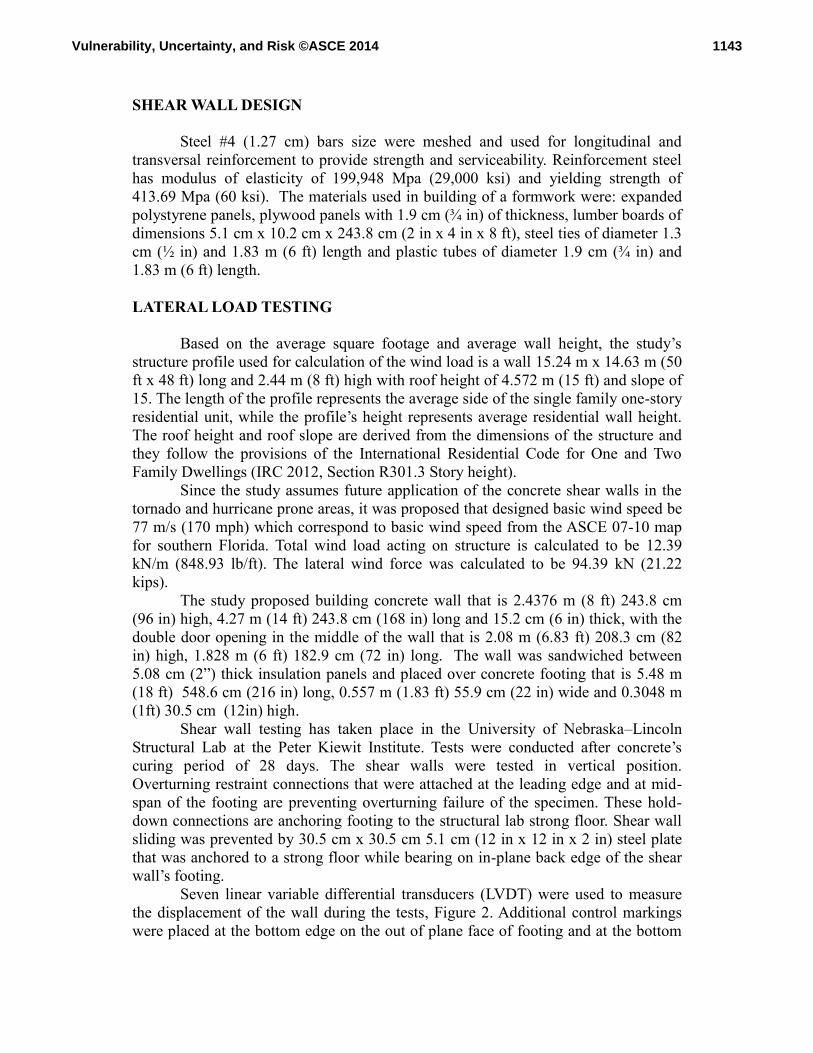
Seven linear variable differential transducers (LVDT) were used to measure
the displacement of the wall during the tests, Figure 2. Additional control markings
were placed at the bottom edge on the out of plane face of footing and at the bottom
1143Vulnerability, Uncertainty, and Risk ©ASCE 2014
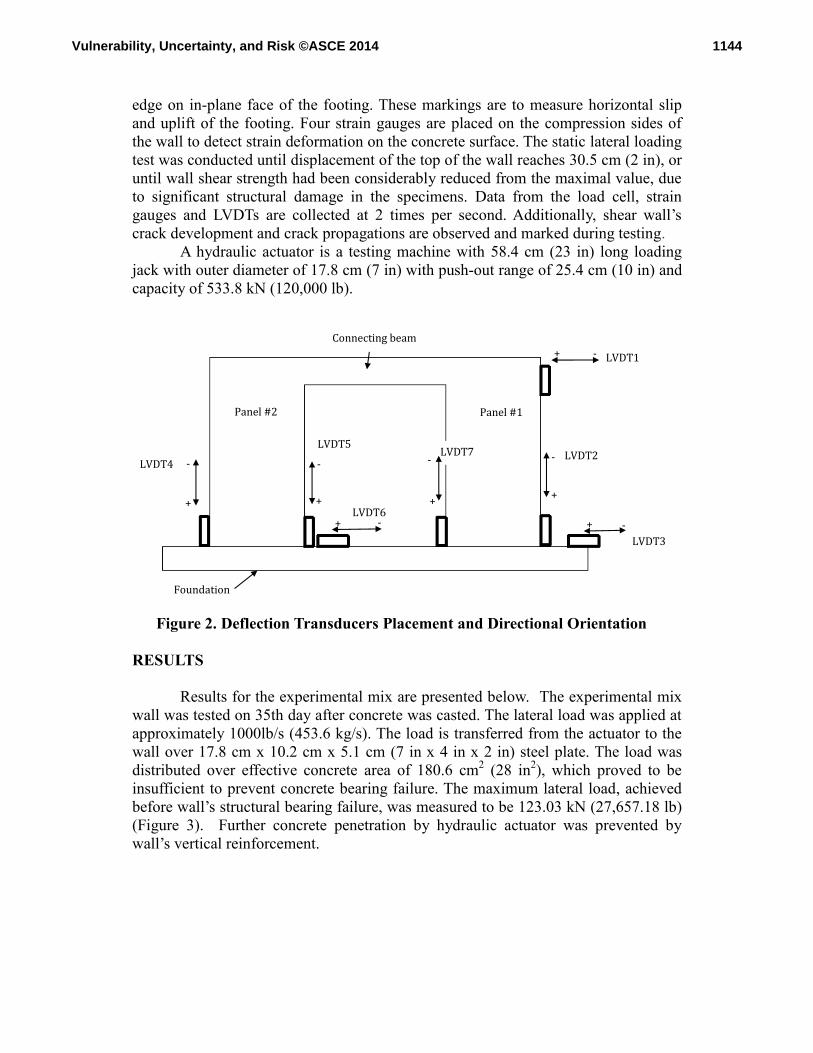
edge on in-plane face of the footing. These markings are to measure horizontal slip
and uplift of the footing. Four strain gauges are placed on the compression sides of
the wall to detect strain deformation on the concrete surface. The static lateral loading
test was conducted until displacement of the top of the wall reaches 30.5 cm (2 in), or
until wall shear strength had been considerably reduced from the maximal value, due
to significant structural damage in the specimens. Data from the load cell, strain
gauges and LVDTs are collected at 2 times per second. Additionally, shear wall’s
crack development and crack propagations are observed and marked during testing.
A hydraulic actuator is a testing machine with 58.4 cm (23 in) long loading
jack with outer diameter of 17.8 cm (7 in) with push-out range of 25.4 cm (10 in) and
capacity of 533.8 kN (120,000 lb).
LVDT1
LVDT2
LVDT3
LVDT4
LVDT5
LVDT6
LVDT7
+
- -
+
+
+
+
+
+ -
- -
-
-
Panel #2 Panel #1
Connecting beam
Foundation
Figure 2. Deflection Transducers Placement and Directional Orientation
RESULTS
Results for the experimental mix are presented below. The experimental mix
wall was tested on 35th day after concrete was casted. The lateral load was applied at
approximately 1000lb/s (453.6 kg/s). The load is transferred from the actuator to the
wall over 17.8 cm x 10.2 cm x 5.1 cm (7 in x 4 in x 2 in) steel plate. The load was
distributed over effective concrete area of 180.6 cm2 (28 in
2), which proved to be
insufficient to prevent concrete bearing failure. The maximum lateral load, achieved
before wall’s structural bearing failure, was measured to be 123.03 kN (27,657.18 lb)
(Figure 3). Further concrete penetration by hydraulic actuator was prevented by
wall’s vertical reinforcement.
1144Vulnerability, Uncertainty, and Risk ©ASCE 2014
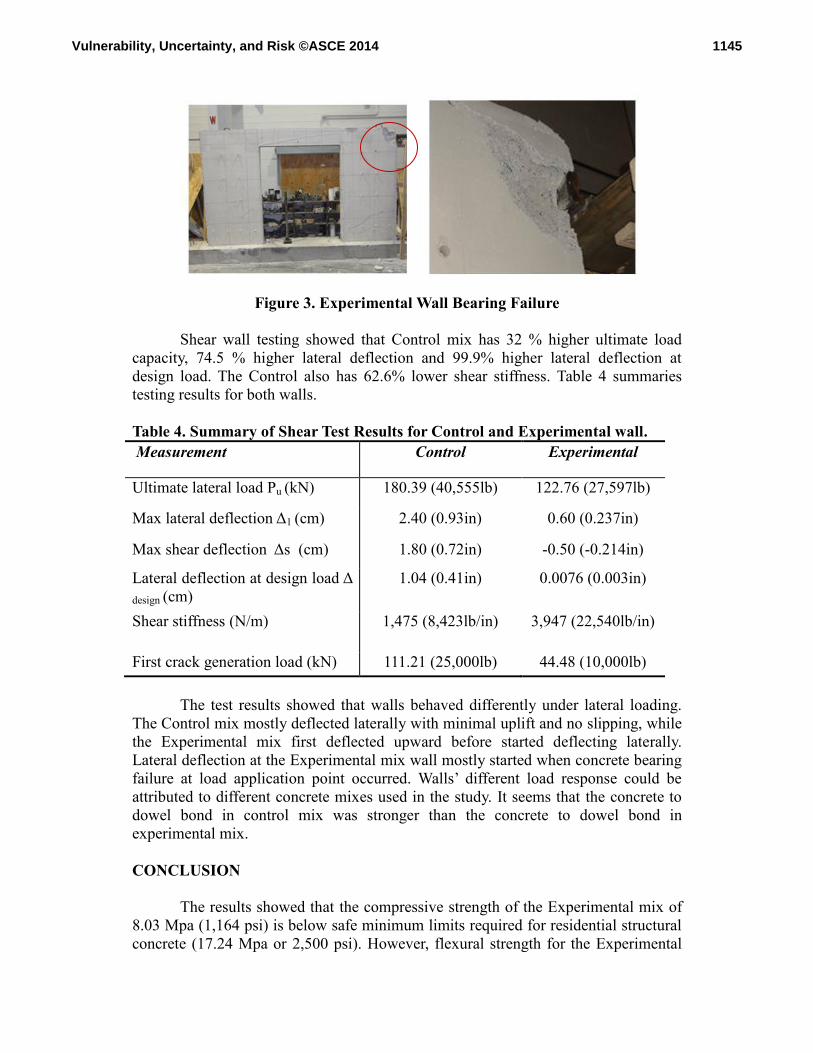
Figure 3. Experimental Wall Bearing Failure
Shear wall testing showed that Control mix has 32 % higher ultimate load
capacity, 74.5 % higher lateral deflection and 99.9% higher lateral deflection at
design load. The Control also has 62.6% lower shear stiffness. Table 4 summaries
testing results for both walls.
Table 4. Summary of Shear Test Results for Control and Experimental wall.
Measurement Control Experimental
Ultimate lateral load Pu (kN) 180.39 (40,555lb) 122.76 (27,597lb)
Max lateral deflection Δ1 (cm) 2.40 (0.93in) 0.60 (0.237in)
Max shear deflection Δs (cm) 1.80 (0.72in) -0.50 (-0.214in)
Lateral deflection at design load Δ
design (cm)
1.04 (0.41in) 0.0076 (0.003in)
Shear stiffness (N/m) 1,475 (8,423lb/in) 3,947 (22,540lb/in)
First crack generation load (kN) 111.21 (25,000lb) 44.48 (10,000lb)
The test results showed that walls behaved differently under lateral loading.
The Control mix mostly deflected laterally with minimal uplift and no slipping, while
the Experimental mix first deflected upward before started deflecting laterally.
Lateral deflection at the Experimental mix wall mostly started when concrete bearing
failure at load application point occurred. Walls’ different load response could be
attributed to different concrete mixes used in the study. It seems that the concrete to
dowel bond in control mix was stronger than the concrete to dowel bond in
experimental mix.
CONCLUSION
The results showed that the compressive strength of the Experimental mix of
8.03 Mpa (1,164 psi) is below safe minimum limits required for residential structural
concrete (17.24 Mpa or 2,500 psi). However, flexural strength for the Experimental
1145Vulnerability, Uncertainty, and Risk ©ASCE 2014
mix of 16.54 Mpa (2,399 psi) showed no signs of flexural strength retardation. The
cause and mechanism of compressive strength retardation remains unclear and
unknown.
The results showed that shear wall with Experimental mix showed
significantly lower shear capacity 123.2 kN (27.7 kips) compared to the shear
capacity 180.2 kN (40.5 kips) of the wall with Control mix. However the obtained
shear capacity for both walls was greater than the shear demand of 93.8 kN (21.1
kips).
REFERENCES
Acker, V. A. (1997).Recycling of concrete at a precast concrete plant. Sustainable
Construction Part, 321-332
ASTM. C39 Compressive strength of cylindrical concrete specimens.
ASTM. C192 Making and curing concrete test specimens in the laboratory.
ASTM. C617 Capping cylindrical concrete specimens.
ASTM E 564 - 2000 Standard Practice for Static Load Test for Shear Resistance of
Framed Walls for Buildings.
Berndt, M. L. (2009). Properties of sustainable concrete containing fly ash slag and
recycled concrete aggregate. Construction and Building Materials, 23, 2606–
2613.
Concrete Centre. (2011). Specifying sustainable concrete. Mineral Products
Association.
Limbachiya, M. C. (2004). Performance of recycled aggregate concrete. RILEM
International Symposium on Environment-Conscious Materials and Systems
for Sustainable Development.
NAHB Research Center. (2001). Costs and benefits of insulating concrete forms for
residential construction. . Report for the U.S. Department of Housing and
Urban Development Office of Policy Development and Research.
NAHB Research Center. (2002).In-plane shear resistance of insulating concrete form
walls. .Report for US Urban and Housing Development Agency
Sagoe, K., & Brown, T. (2002). Durability and performance characteristics of
recycled aggregate concrete. (No. 090). UK: CSIRO Publishing.
Sogo. (2007). Shear behavior of recycled concrete beams. Proceedings from
International RILEM Conference on the use of Recycled Materials in
Buildings and Structures, Vol .2 610-619.
Topçu, B., & Sengel, S. (2004). Properties of concretes produced with waste concrete
aggregate. Cem.Concr. Res., 38(4), 1307-1312.
TopçuBa. (1997). Physical and mechanical properties of concretes produced with
waste concrete. Cem.Concr. Res., 27(12), 817-823.
Wen-Chen Jau, e. a. (2004). Study of feasibility and mechanical properties for
producing high flowing concrete with recycled coarse aggregates.
Proceedings of the International Workshop on Sustainable Development &
Concrete Technology, 89-102.
1146Vulnerability, Uncertainty, and Risk ©ASCE 2014

Yang, C. (2009). Composition of demolition wastes from Chi-Chi earthquake-
damaged structures and the properties of their inert materials. Canadian
Geotechnical Journal, 46, 470-481.
Yaprak, H., Aruntas Yılmaz, H., Demir, I., Simsek, O., & Durmus, G. (2011). Effects
of the fine recycled concrete aggregates on the concrete properties.
International Journal of the Physical Sciences, 6(10), 2455–2461
1147Vulnerability, Uncertainty, and Risk ©ASCE 2014
Related Documents