PRELIMINARY REVIEWED CONDENSED CONSOLIDATED FINANCIAL STATEMENTS and cash dividend declaration for the year ended 30 September 2021

Welcome message from author
This document is posted to help you gain knowledge. Please leave a comment to let me know what you think about it! Share it to your friends and learn new things together.
Transcript

PRELIMINARY REVIEWED CONDENSED CONSOLIDATED FINANCIAL STATEMENTSand cash dividend declaration for the year ended 30 September 2021
Contents
Commentary 1
Condensed consolidated statement of profit or loss 8
Condensed consolidated statement of other comprehensive income 9
Condensed consolidated statement of financial position 10
Condensed consolidated statement of cash flows 12
Notes to the condensed consolidated statement of cash flows 14
Condensed consolidated statement of changes in equity 15
Notes 17
Condensed segmental analysis 40
Additional information 46
Administration 47
R E U N E RT L I M I T E D

1
PRELIMINARY REVIEWED CONDENSED CONSOLIDATED FINANCIAL STATEMENTS
Commentary
OVERVIEWStrong operating and financial performance Reunert’s 2021 attributable profit was a meaningful improvement compared with the prior year. The Group benefited from the restructuring and productivity improvement actions implemented in 2020, which created the base for this year’s performance. The Group’s companies generally managed the complex and volatile market environment extremely well to deliver solid operating performances, specifically in the Information Communication Technology (ICT) and Electrical Engineering segments, which resulted in an overall financial performance that demonstrates the resilience and responsiveness of our Group.
All the businesses in the ICT segment performed in line with, or slightly better than, the Group’s expectations. Interest income at Quince Capital (Pty) Ltd (Quince) decreased in line with the lower interest rate environment. Improved performances were achieved in all the other business units in the segment, which delivered a segment operating profit slightly ahead of the prior year.
The Electrical Engineering segment’s recovery was led by a strong performance from its circuit breaker business which included excellent export growth and improved market share in South Africa. This was augmented by the cable businesses which benefited from the prior year actions and much improved factory operational efficiency. Consequently, these businesses delivered a positive operating profit against an operating loss in the prior year.
The Applied Electronics segment had a challenging year as exports reduced because of a COVID-19 related inability to travel and secure new orders as well as long delays in the receipt of export permits from the appropriate authorities.
ChallengesDespite the positive financial performance, 2021 remained challenging and the Group had four key challenges to contend with. These challenges included: COVID-19 lockdowns both in South Africa and in the Group’s various export markets; the civil unrest in South Africa in July; the delay to secure export permits from the appropriate authorities; and the global electronic component shortage and general supply chain challenges.
These factors prevented the full recovery of our businesses and continue to adversely impact the Group, although we expect this impact to steadily diminish and for the Group’s performance to continue to improve in the year ahead.
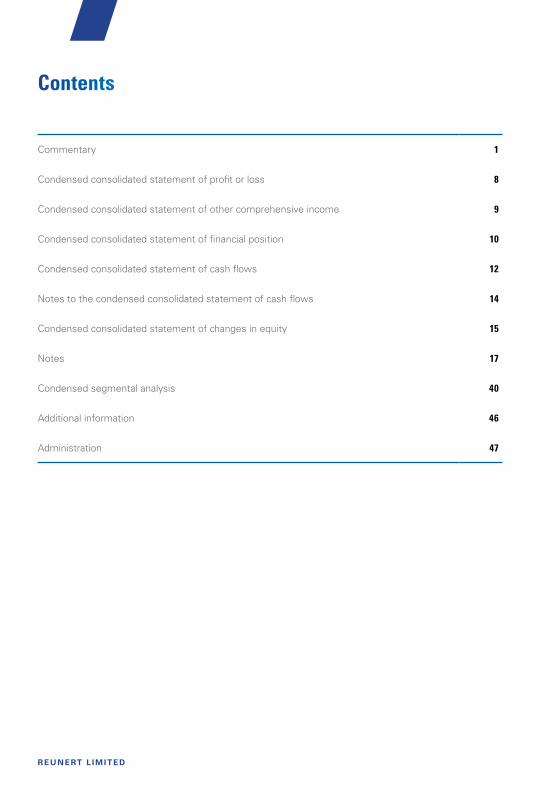
GROUP RESULTS Reunert’s 2021 financial result was bolstered by a strong recovery in the Electrical Engineering segment, a good performance in the ICT segment and negatively impacted by the four challenges described above which impeded a stronger performance by the Group and resulted in a poor Applied Electronics segment performance. The Group revenue increased by 19% to R9 575 million (2020: R8 046 million) while the Group’s operating profit grew by 405% to R1 050 million (2020: R208 million restated) resulting in headline earnings per share (HEPS) of 478 cents (2020: 115 cents) and earnings per share (EPS) of 483 cents (2020: 29 cents).
2
R E U N E RT L I M I T E D
Key earnings metrics
Measurementcriteria
Year ended 30 September
2021 20201 % change
Revenue Rm 9 575 8 046 19Segment operating profit2 Rm 986 868 14Operating profit Rm 1 050 208 405Profit for the year Rm 767 7 10 857Earnings per share cents 483 29 1 566Headline earnings per share cents 478 115 316Total cash dividend per share cents 277 257 81 The comparative year information has been restated to include in operating profit all items of income and expenditure
(excluding dividends received, interest income and expense and share of joint ventures’ and associates’ profit/(loss)).2 Per segmental analysis.
CASH RESOURCES AND CASH LIQUIDITY The Group continues to actively manage its cash generation despite:
> needing to increase the stock holding for critical components due to the international supply disruptions caused by COVID-19;
> the delay in certain sales in the Applied Electronics segment due to the slow approval of export permits; and
> the dramatic increase in commodity prices such as copper and aluminium, which impacted both the Rand value of stock holdings and the trade receivable balances, as increased prices were passed onto customers.
The Group ended the financial year with R291 million in net cash resources (2020: R323 million) which, together with the significant lines of unutilised credit available from the Group’s bankers, provides a solid financial base for the Group to pursue its strategy.
CAPITAL EXPENDITURE During the year under review, the Group continued to ensure the sustainability of its current operations and invested R42 million (2020: R32 million) in the replacement of property, plant and equipment and a further R196 million (2020: R138 million) to expand its operations. All expenditure was out of internal cash generation and represents 36,7% (2020: 17,4%) of free cash flow before replacement capital expenditure.
STRATEGY Renewable EnergyThe market dynamics that support our renewable energy businesses’ growth projections improved materially in 2021. Key drivers of market growth for both embedded generation and power generation liberalisation were realised. The tangible improvement in the liberalisation of the South African power generation market bodes well for the continued growth of the renewable energy market for many years to come.

3
PRELIMINARY REVIEWED CONDENSED CONSOLIDATED FINANCIAL STATEMENTS
Within these positive market developments, our renewable energy strategy aims to:
> be a leading supplier of Engineering, Procurement and Construction solar projects in embedded generation;
> build, own and operate a significant suite of renewable assets both in South Africa and other key African geographies;
> deliver high performance, ultra-reliable storage solutions across a broad range of applications; and > actively manage energy as South Africa moves to an increasing liberalised and distributed generation model.
Significant progress was made across all four of these strategic areas and renewable energy remains a key focus area for the Group. In particular, during its year under review, the Group established a Joint Venture “Lumika” with AP Moller Capital to pursue large scale renewable opportunities in chosen Africa geographies. 25% of Terra Firma the Group’s solar PV renewable business has been sold to Lumika. The Group’s residual interest of 65% will be sold to Lumika within the next 3 financial years via an agreed put and call mechanism. This will create a combined business with the ability to design, build, operate and finance significant solar projects both in South Africa and the broader African market.
Solutions and Systems IntegrationOur launch of the Solutions and System Integration cluster in the ICT segment progressed well in 2021. During the year +OneX completed two acquisitions in cloud hosting and digital media, which expanded its service offering alongside the existing managed services and unified communications capabilities. We expect to conclude further acquisitions in the year ahead as we bolster the offerings that enable +OneX to be a leading end-to-end business transformation partner.
Cable operations in AfricaReunert continued to reduce its exposure to cable assets in Africa with the sale of 26% of its shareholding in CAFCA, our Zimbabwean cable operation, before the end of the financial year. Post year-end a further 16% was sold reducing our shareholding to 28%, where it is expected to remain. The total consideration for these sales amounted to R56 million (of which R29 million relates to the post year-end sale).
Black Economic Empowerment (BEE)Reunert’s strategic BEE arrangement has reached the end of its contractual term. We thank Peotona for their appreciated contribution over the past 15 years. The restructuring of Reunert’s BEE credentials increases our emphasis on broad based economic value creation. This will be achieved by:
> increasing the ownership in Reunert by the Rebatona Educational Trust. The trust caters for the education needs of underprivileged black females; and
> the establishment of an Employee Share Option Plan (ESOP) for Reunert employees.
These two initiatives are expected to deliver value into the hands of underprivileged black females and our employees. The new structure is aligned to the best practices and principles of modern BEE standards. The benefits of this new structure, together with the direct black shareholdings in the Group’s various trading entities, upholds Reunert’s market leading empowerment credentials, which Reunert’s businesses need to participate in the South African market.
The proposed actions revitalising this structure will be presented to shareholders for their approval at the general meeting to be held immediately prior to the 2022 AGM.

4
R E U N E RT L I M I T E D
COVID-19Operations and employees COVID-19 continued to have a detrimental impact on the Group. Our companies ensured safe working environments for employees and that safety protocols were adhered to. Despite the strong health and safety protocols, infections continued during the year. Unfortunately, 16 employees succumbed to COVID-19. We take this moment to recognise these employees and reiterate our condolences to their families and fellow employees.
MarketsCOVID-19 affected the markets that our businesses service. In South Africa the tourism and hospitality markets continued to be affected by the lockdowns and the education sector continues to experience volatile demand as places of learning have yet to return to normal schedules.
Importantly, most of the key markets that support our businesses have recovered. Outside of tourism, hospitality and education, the Small and Medium Enterprise market that the Group services, has largely recovered and our Communications cluster is benefiting from strong last mile broadband connectivity demand.
The key international markets had their own lockdowns and, together with the ban on South Africans traveling internationally, our export activities in the Applied Electronics segment were impeded. Pleasingly, travel bans to several of our key markets have recently been lifted and an immediate improvement in orders has been achieved.
Supply chainCOVID-19 has severely impacted global supply chains. Electronic components and inbound and outbound logistics have been impacted through lack of availability, longer lead times, more complex routings and the resulting increased costs. Solutions have been implemented around the Group and, whilst we expect supply chain challenges for most of 2022, the situation is already much improved.
SEGMENTAL REVIEW Electrical Engineering SegmentThe segment recovered strongly from a challenging 2020 led by an excellent performance of the circuit breaker business in both local and export markets. The actions taken in 2020 to rationalise the cable companies’ cost base in line with the expected market volumes, and reduce our exposure to forex movements in Zambia, yielded the desired outcomes and in 2021 the companies improved their operational efficiencies. This led to a 47% increase in segment revenue to R5 551 million (2020: R3 767 million) with a corresponding increase in segment operating profit to R373 million (2020: R28 million restated).
ICT SegmentThe segment improved on the performance of the past year with all companies achieving solid operating performances. Nashua Office Automation leveraged its strong market position and customer relationships to significantly recover in its traditional print business as well as continue its strong growth in new complementary products and services. The Communications cluster continued to grow strongly as growth in broadband connectivity accelerated and the general economic activity improved. The Finance cluster performed well in a tight credit and collection environment. Our businesses have some exposure to markets that continue to be negatively impacted by COVID-19, which impeded a stronger segment performance. The good performance resulted in revenue remaining nominally flat at R2 490 million (2020: R2 524 million). Segment operating profit increased slightly to R608 million (2020: R604 million). The segment’s operating profit was impacted largely due to the lower interest yield in Quince because of the low interest rate environment.

5
PRELIMINARY REVIEWED CONDENSED CONSOLIDATED FINANCIAL STATEMENTS
Applied Electronics SegmentThe segment had a challenging year. Our export activity fell significantly and resulted in revenue reducing by 5% to R1 854 million (2020: R1 951 million) and segment operating profit decreased by 63% to R100 million (2020: R269 million restated).
The segment continued to be impacted by three of the four key challenges outlined above:
> COVID-19 lockdowns both in South Africa and in key export markets together with travel bans made servicing customers, completing orders and gaining new sales extremely difficult.
> The supply chain impact of both shortages in critical electronic components and lengthened supply chains due to the COVID-19 disruptions in logistics impacted production and inventory holdings
> The ongoing delays in receiving export permits from the appropriate authorities resulted in various sales not being executed in the 2021 financial year
Subsequent to the financial year end, the segment has been able to secure large new orders as travel restrictions lifted, which will lift the performance of the segment as it delivers into these orders in the second half of 2022.
DIRECTORATEThe chair of the Board, Mr TS Munday, and the lead independent director, Mr SD Jagoe, will both be retiring at the forthcoming AGM in February 2022.
As a consequence of these retirals, the following changes in the responsibilities of various Board members will take place with effect from the February 2022 AGM:
> Mr MJ Husain will chair the Board and the Nomination and Governance Committee; and > Mr JP Hulley will assume the role of lead independent director and continue to chair the Risk Committee.
Furthermore, the following additional changes in responsibilities due to the normal rotational practices by the Board will take place and be effective from 1 January 2022:
> Dr MT Matshoba-Ramuedzisi will chair the SET Committee; and > Ms T Abdool-Samad will chair the Remuneration Committee and continue to chair the Investment Committee.
The remaining Board members take this opportunity to thank Trevor Munday and Sean Jagoe for their invaluable advice, sage counsel and support over many years at both the Board and the various Board committees they have actively led and participated at during their tenure on the Board.
They will be sorely missed.
APPRECIATIONOur companies have faced great challenges over the past two years. We have weathered these well and the recovery of our businesses in 2021 is largely due to the commitment and resilience of our employees across the Group. We thank them for their efforts and look forward to their continued commitment. Our customers remain the lifeblood of our businesses and we thank them for their valued business and commit to continue to add value in the years ahead. We value the support of our suppliers and from other stakeholders that we have experienced throughout the past year.

6
R E U N E RT L I M I T E D
PROSPECTSReunert expects the South African macro-economic conditions to continue to steadily improve during 2022. Accordingly, the Electrical Engineering and ICT segments should experience moderately improved market demand on the back of accelerating renewable energy infrastructure investment and the improvement in the South African economy. The strength of the underlying businesses in these two segments position them well to continue to grow in such economic environments. Due to the recent relaxation in international travel restrictions, the Applied Electronics segment has secured new export orders and this should support an improved segment performance.
The Group’s first half is likely to face some pressure from:
> the impact of the union strike action in October on the Electrical Engineering segment; > the time taken to acquire the production requirements for new export orders in the Applied Electronics segment before revenue is earned.
These impacts are both temporary and unlikely to affect the expected full year performance of the Group.
While recognising that challenges and uncertainty due to COVID-19 and global supply chain constraints remain, our key growth markets of renewable energy, exports and our Solutions and Systems Integration clusters all continue to represent a strong underpin to our growth aspirations.

7
PRELIMINARY REVIEWED CONDENSED CONSOLIDATED FINANCIAL STATEMENTS
CASH DIVIDENDNotice is hereby given that a gross final cash dividend No 191. of 207,0 cents per ordinary share (September 2020: 192,0 cents per ordinary share) has been declared by the directors for the year ended 30 September 2021.
The dividend has been declared from retained earnings, bringing the total dividends declared for the year to 277,0 cents per ordinary share.
A dividend withholding tax of 20% will be applicable to all shareholders who are not exempt from, or who do not qualify for, a reduced rate of withholding tax.
Accordingly, for those shareholders subject to withholding tax, the net dividend amounts to 165,60000 cents per ordinary share (September 2020: 153,60000 cents per ordinary share).
The issued share capital at the declaration date is 184 969 196 ordinary shares.
In compliance with the requirements of Strate (Pty) Ltd and the Listings Requirements of the JSE Limited, the following dates are applicable:
Last date to trade (cum dividend) Tuesday, 18 January 2022First date of trading (ex dividend) Wednesday, 19 January 2022Record date Friday, 21 January 2022Payment date Monday, 24 January 2022
Shareholders may not dematerialise or rematerialise their shares between Wednesday, 19 January 2022 and Friday, 21 January 2022, both days inclusive.
On behalf of the Board of directors
Trevor Munday Alan Dickson Nick ThomsonChair Chief Executive Officer Chief Financial Officer
Sandton, 22 November 2021

8
R E U N E RT L I M I T E D
Rm Notes2021
Reviewed
2020ReviewedRestated1
%change
Revenue 2 9 575 8 046 19Operating expenses 3 (8 524) (7 252) 18Operating profit before impairment of financial assets: 1 051 794 32Impairment of financial assets (1) (586) (100)
Credit write-off 3, 6 (20) (298) (93)Expected credit losses 3, 6 19 (288) 107
Operating profit 3 1 050 208 405Interest and dividend income 4 28 41 (32)Interest expense 5 (70) (83) (16)Profit before tax 1 008 166 507Tax (265) (82) 223Profit after tax 743 84 785Share of joint ventures' and associates' profit/(loss) 24 (77) 131Profit for the year 767 7 10 857(Loss)/profit for the year attributable to:Non-controlling interests (10) (40) (75)Equity holders of Reunert 777 47 1 553Earnings per share (cents)Basic 10 483 29 1 566Diluted 10 481 29 1 5591 The consolidated statement of profit or loss has been
restated to include in operating profit all items of income and expenditure (excluding dividends received, interest income and expense and share of joint ventures’ and associates’ profit/(loss)). Refer to note 14.
Condensed consolidated statement of profit or lossfor the year ended 30 September 2021
9
PRELIMINARY REVIEWED CONDENSED CONSOLIDATED FINANCIAL STATEMENTS
Rm2021
Reviewed2020
Reviewed
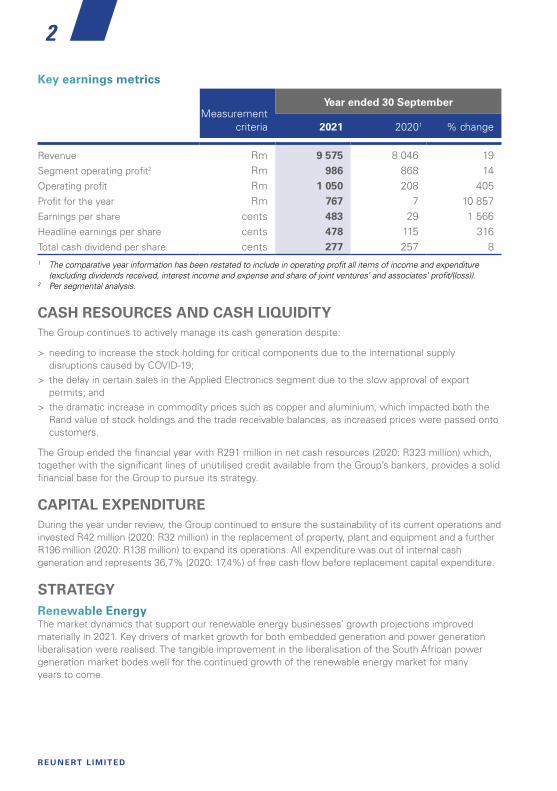
Profit for the year 767 7
Other comprehensive income, net of tax:Items that may be reclassified subsequently to profit or loss 2 (56)
Translation differences of foreign businesses 1 30 Translation loss on net investment in subsidiary¹ – (87)Fair value remeasurement gain of financial asset 1 1
Total comprehensive income 769 (49)
Total comprehensive income attributable to:Non-controlling interests (6) (62) – Share of loss for the year (10) (40) – Share of other comprehensive income 4 (22)Equity holders of Reunert 775 13 – Share of profit for the year 777 47 – Share of other comprehensive income (2) (34)
1 Translation loss arising on the loan component of the Group’s net investment in a foreign subsidiary. During the 2021 financial year, no translation gains/(losses) arose on the Group’s net investment in this foreign subsidiary because the underlying instrument (which gave rise to the translation gain or loss) was converted to equity at the end of the 2020 financial year.
Condensed consolidated statement of other comprehensive incomefor the year ended 30 September 2021

10
R E U N E RT L I M I T E D
Condensed consolidated statement of financial positionas at 30 September 2021
Rm Notes2021
Reviewed2020
Reviewed
Non-current assetsProperty, plant and equipment 858 795 Investment property 23 31 Right-of-use assets 146 186 Intangible assets 444 445 Goodwill 7 934 924 Other investments and loans 65 61 Investments in joint ventures and associates 99 74 Investment at fair value through profit or loss 8 76 –Derivative financial assets 9 41 –Lease receivables 410 557 Loan receivables 1 393 1 221 Deferred tax assets 145 172
4 634 4 466
Current assetsTax receivable 115 46 Inventory 1 743 1 483 Lease receivables 273 288 Loan receivables 400 507 Trade and other receivables 2 097 1 895 Derivative financial assets 7 12 Cash and cash equivalents 1 068 1 029
5 703 5 260
Total assets 10 337 9 726 Equity and liabilitiesCapital and reservesShare capital 389 389 Share-based payment reserves 219 217 Empowerment shares (276) (276)Treasury shares (447) (342)Equity transactions/put option with non-controlling interests (72) –Other reserves (163) (161)
Retained earnings 7 045 6 678 Equity attributable to equity holders of Reunert 6 695 6 505 Non-controlling interests 87 38
Total equity1 6 782 6 543 1 Refer to the statement of changes in equity for the composition of all components of equity.

11
PRELIMINARY REVIEWED CONDENSED CONSOLIDATED FINANCIAL STATEMENTS
Rm Notes2021
Reviewed2020
Reviewed
Non-current liabilitiesDeferred tax liabilities 158 89 Equity forward contract 48 59 Long-term loans 44 15 Lease liabilities 100 162 Derivative financial liabilities 9 92 –Contract liabilities – 23 Contingent consideration 12 10 –
452 348 Current liabilitiesPut option liability 13 25 –Equity forward contract 18 16 Current portion of long-term loans 39 1 Lease liabilities 85 56 Share-based payment liability – 6
Derivative financial liabilities 17 28 Provisions 81 123 Tax liabilities 21 50 Contract liabilities 264 255 Trade and other payables 1 776 1 594 Bank overdrafts and short-term facilities 777 706
3 103 2 835 Total equity and liabilities 10 337 9 726
12
R E U N E RT L I M I T E D
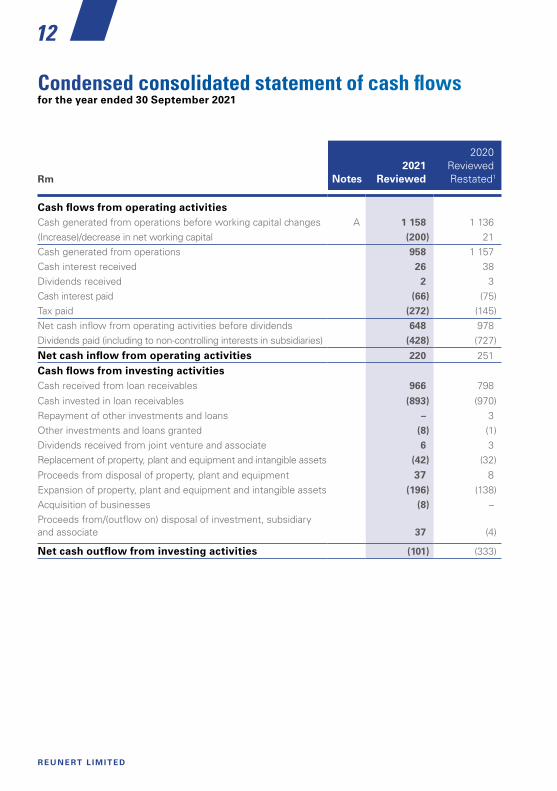
Condensed consolidated statement of cash flowsfor the year ended 30 September 2021
Rm Notes2021
Reviewed
2020ReviewedRestated1
Cash flows from operating activitiesCash generated from operations before working capital changes A 1 158 1 136 (Increase)/decrease in net working capital (200) 21 Cash generated from operations 958 1 157 Cash interest received 26 38 Dividends received 2 3 Cash interest paid (66) (75)Tax paid (272) (145)Net cash inflow from operating activities before dividends 648 978 Dividends paid (including to non-controlling interests in subsidiaries) (428) (727)
Net cash inflow from operating activities 220 251
Cash flows from investing activitiesCash received from loan receivables 966 798
Cash invested in loan receivables (893) (970)Repayment of other investments and loans – 3 Other investments and loans granted (8) (1)Dividends received from joint venture and associate 6 3 Replacement of property, plant and equipment and intangible assets (42) (32)
Proceeds from disposal of property, plant and equipment 37 8 Expansion of property, plant and equipment and intangible assets (196) (138)Acquisition of businesses (8) – Proceeds from/(outflow on) disposal of investment, subsidiary and associate 37 (4)
Net cash outflow from investing activities (101) (333)

13
PRELIMINARY REVIEWED CONDENSED CONSOLIDATED FINANCIAL STATEMENTS
Rm Notes2021
Reviewed
2020ReviewedRestated1
Cash flows from financing activitiesFunds provided by equity holders of Reunert – 1 Shares acquired for equity settled Conditional Share Plan (CSP) (11) (54)Proceeds from subscription for shares by non-controlling interests 68 – Investment in treasury shares (105) –Purchase of additional shares acquired from non-controlling interests (31) (1)Put option liability settled – (131)Long-term loans raised 47 2 Long-term loans settled (9) – Contingent consideration settled (7) (15)Equity forward contract liability settled (15) –Lease liabilities settled (73) (57)
Net cash outflow from financing activities (136) (255)
Net decrease in net cash and cash equivalents (17) (337)
Net cash and cash equivalents as at 1 October as reported in the Statement of Financial Position 323 616
Net cash and cash equivalents as at 30 September before translation adjustments 306 279
Foreign exchange translation adjustments on:Cash and cash equivalents (6) (1)Bank overdrafts and short-term facilities (9) 45 Net cash and cash equivalents as at 30 September as reported in the Statement of Financial Position 291 323
Made up of:Cash and cash equivalents 1 068 1 029 Bank overdrafts and short-term facilities (777) (706)Bank overdrafts (137) (122)Short-term facilities (640) (584)
1 The consolidated statement of cash flows has been restated to provide clearer presentation of the following:– Cash interest received and dividends received are now disclosed separately– Cash flows from loan receivables have been disaggregated into cash receipts and cash payments on a gross basis– Subtotals for investments to maintain/increase operating capacity have been removed– The foreign exchange translation adjustments have been included below net cash and cash equivalents in order to
reconcile the net cash and cash equivalents to the statement of financial position
The restatement did not result in a change in the 2020 reported numbers on the face of the consolidated statement of cash flows.
14
R E U N E RT L I M I T E D
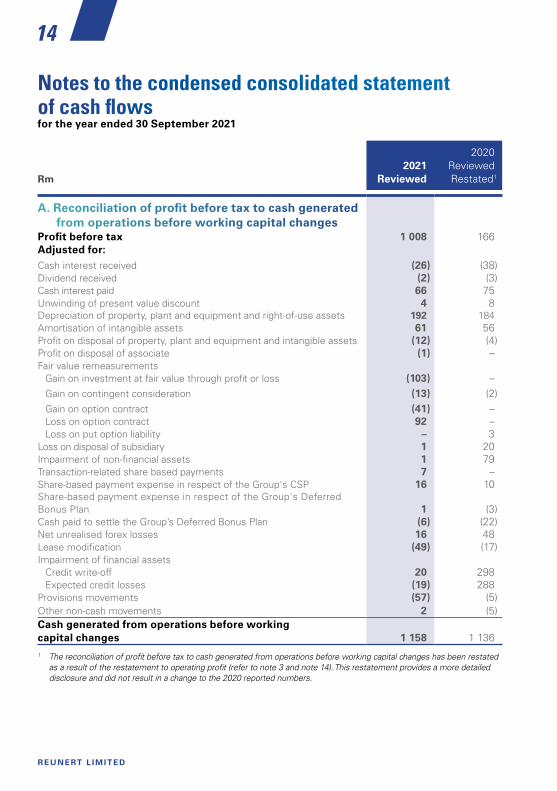
Notes to the condensed consolidated statement of cash flowsfor the year ended 30 September 2021
Rm2021
Reviewed
2020ReviewedRestated1
A. Reconciliation of profit before tax to cash generated from operations before working capital changes
Profit before tax 1 008 166 Adjusted for:Cash interest received (26) (38)Dividend received (2) (3)Cash interest paid 66 75 Unwinding of present value discount 4 8 Depreciation of property, plant and equipment and right-of-use assets 192 184 Amortisation of intangible assets 61 56 Profit on disposal of property, plant and equipment and intangible assets (12) (4)Profit on disposal of associate (1) –Fair value remeasurements
Gain on investment at fair value through profit or loss (103) –Gain on contingent consideration (13) (2)Gain on option contract (41) –Loss on option contract 92 –Loss on put option liability – 3
Loss on disposal of subsidiary 1 20 Impairment of non-financial assets 1 79 Transaction-related share based payments 7 –Share-based payment expense in respect of the Group's CSP 16 10 Share-based payment expense in respect of the Group's Deferred Bonus Plan 1 (3)Cash paid to settle the Group’s Deferred Bonus Plan (6) (22)Net unrealised forex losses 16 48 Lease modification (49) (17)Impairment of financial assets
Credit write-off 20 298Expected credit losses (19) 288
Provisions movements (57) (5)Other non-cash movements 2 (5)Cash generated from operations before working capital changes 1 158 1 136 1 The reconciliation of profit before tax to cash generated from operations before working capital changes has been restated
as a result of the restatement to operating profit (refer to note 3 and note 14). This restatement provides a more detailed disclosure and did not result in a change to the 2020 reported numbers.

15
PRELIMINARY REVIEWED CONDENSED CONSOLIDATED FINANCIAL STATEMENTS
Rm2021
Reviewed2020
Reviewed
Share capital 389 389 Balance at the beginning of the year 389 388 Issue of shares – 1
Share-based payment reserves 219 217 Balance at the beginning of the year 217 229 In respect of CSP 18 9 Shares acquired to settle CSP (11) (54)In respect of transaction-related share-based payments 7 –Transfer (to)/from retained earnings (12) 33
Equity transactions/put option with non-controlling shareholders (72) –Balance at the beginning of the year – (108)Additional shares acquired from non-controlling shareholders (33) 14 Subscription for shares by non-controlling shareholders (14) –Put option raised during the year (25) –Transfer from retained earnings – 94
Empowerment shares1 (276) (276)Treasury shares2 (447) (342)
Balance at the beginning of the year (342) (342)Shares bought back during the year (105) –
Equity forward contract3 (75) (75)Balance at the beginning of the year (75) –Raised during the year – (75)
Foreign currency translation reserve 13 16 Balance at the beginning of the year 16 (11)Other comprehensive income (3) 27
Translation loss on net investment in foreign subsidiary (109) (109)Balance at the beginning of the year (109) (47)Other comprehensive income – (62)
Fair value reserve 8 7 Balance at the beginning of the year 7 6 Other comprehensive income 1 1
Condensed consolidated statement of changes in equity for the year ended 30 September 2021
1 This is the cost of Reunert Limited shares held by Bargenel Investments (Pty) Ltd (Bargenel), a company sold by Reunert to its empowerment partners in 2007. Until the amount owed by the empowerment partners is repaid to Reunert, Bargenel will continue to be consolidated into the Group’s financial statements.
2 Ordinary Reunert shares bought back in the open market and held by a subsidiary: 7 032 824 shares (2020: 4 997 698 shares). During 2021: 2 035 126 shares were bought back at an average price of R51,33 per share. No shares were bought back during the 2020 financial year.
3 At the end of the 2020 financial year, the Group, on behalf of the CSP, entered into a forward contract to acquire 2 346 930 ordinary Reunert shares from an independent third party, for purposes of hedging the Group’s potential future obligation to deliver Reunert ordinary shares to CSP participants.

16
R E U N E RT L I M I T E D
Rm2021
Reviewed2020
Reviewed
Retained earnings 7 045 6 678 Balance at the beginning of the year 6 678 7 473 Profit for the year attributable to equity holders of Reunert 777 47 Cash dividends paid (422) (723)Tax deduction in respect of CSP – 8 Transfer from/(to) other reserves 12 (127)
Equity attributable to equity holders of Reunert 6 695 6 505 Non-controlling interests 87 38
Balance at the beginning of the year 38 119 Loss for the year (10) (40)From other comprehensive income 4 (22)Cash dividends paid (6) (4)Subscription for shares by non-controlling shareholders 62 –Disposal of subsidiary (4) –Additional shares acquired from non-controlling shareholders 3 (15)
Total equity at the end of the year 6 782 6 543
Condensed consolidated statement of changes in equity (continued) for the year ended 30 September 2021

17
PRELIMINARY REVIEWED CONDENSED CONSOLIDATED FINANCIAL STATEMENTS
Notes for the year ended 30 September 2021
1. BASIS OF PREPARATIONThese preliminary reviewed condensed consolidated financial statements (condensed financial statements) have been prepared in compliance with the:
> framework concepts and the recognition and measurement requirements of International Financial Reporting Standards (IFRS) in effect for the Group at 1 October 2020;
> South African Institute of Chartered Accountants (SAICA) Financial Reporting Guides, as issued by the Accounting Practices Committee;
> Financial Reporting pronouncements as issued by the Financial Reporting Standards Council; > Listings Requirements of the JSE Limited; and > the requirements of the Companies Act, No. 71 of 2008, of South Africa.
These condensed financial statements are in accordance with and contain the information required by IAS 34 Interim Financial Reporting, as well as the SAICA Financial Reporting Guides as issued by the Accounting Practices Committee and Financial Pronouncements as issued by the Financial Reporting Standards Council, and were compiled under the supervision of NA Thomson CA(SA) the Group's Chief Financial Officer.
The Group's accounting policies applied for the year ended 30 September 2021, were consistent with those applied in the prior year's audited consolidated annual financial statements. These accounting policies comply with IFRS.
The condensed financial statements for the year ended 30 September 2021 have been reviewed by Deloitte & Touche who have expressed an unmodified review conclusion.
The auditor’s review report on the condensed financial statements is available for inspection at the registered offices of the Company, together with the condensed financial statements.
Rm2021
Reviewed2020
Reviewed
2. REVENUERevenue from contracts with customers:Category of revenueProducts 7 632 6 014 Services 1 575 1 581
9 207 7 595 Timing of revenue recognition:Revenue recognised at a point in time 7 911 6 215 Revenue recognised over time 1 296 1 380 Total revenue from contracts with customers 9 207 7 595 Other revenue:Interest received on lease and loan receivables 340 412 Rental revenue 28 39 Total 9 575 8 046
Refer to the segmental analysis, for a disaggregation of the total revenue into the revenue contribution per segment.
18
R E U N E RT L I M I T E D
Rm2021
Reviewed
2020ReviewedRestated1
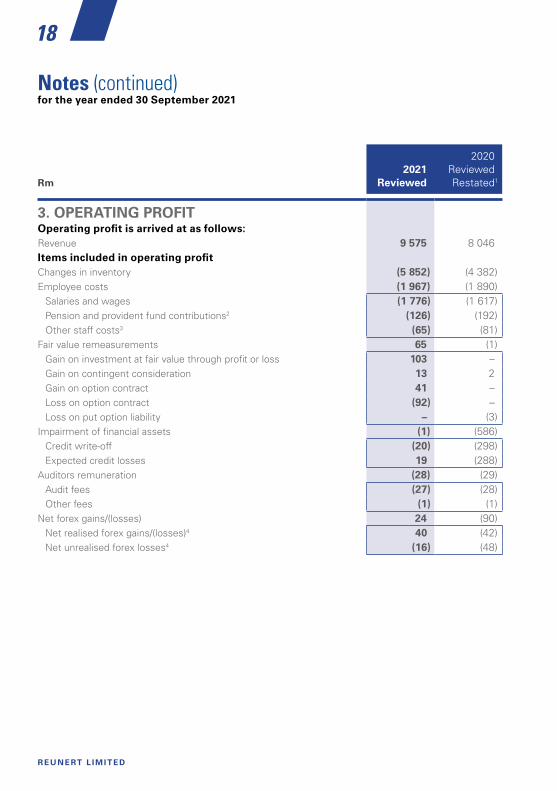
3. OPERATING PROFITOperating profit is arrived at as follows:Revenue 9 575 8 046 Items included in operating profitChanges in inventory (5 852) (4 382) Employee costs (1 967) (1 890)
Salaries and wages (1 776) (1 617) Pension and provident fund contributions2 (126) (192) Other staff costs3 (65) (81)
Fair value remeasurements 65 (1)Gain on investment at fair value through profit or loss 103 –Gain on contingent consideration 13 2Gain on option contract 41 –Loss on option contract (92) –Loss on put option liability – (3)
Impairment of financial assets (1) (586) Credit write-off (20) (298) Expected credit losses 19 (288)
Auditors remuneration (28) (29) Audit fees (27) (28) Other fees (1) (1)
Net forex gains/(losses) 24 (90) Net realised forex gains/(losses)4 40 (42) Net unrealised forex losses4 (16) (48)
Notes (continued) for the year ended 30 September 2021

19
PRELIMINARY REVIEWED CONDENSED CONSOLIDATED FINANCIAL STATEMENTS
Rm2021
Reviewed
2020ReviewedRestated1
3. OPERATING PROFIT (CONTINUED)Other income 47 17Lease modification 49 17Profit on disposal of property, plant and equipment and intangible assets 12 4Share-based payment expense5 (17) (7) Interest paid to finance Quince Capital (Pty) Ltd (Quince) rental book (24) (28) Operating lease charges (27) (30)Research and development (150) (172) Other operating expenses (395) (322)EBITDA6 1 311 547The following additional disclosable items have been included in arriving at operating profit:Depreciation and amortisation (253) (240) Impairment of non-financial assets Impairment of goodwill – (75) Impairment of property, plant and equipment (1) (4) Profit on disposal of associate 1 – Loss on disposal of subsidiary (1) (20) Transaction-related share-based payments7 (7) – Operating profit as per the statement of profit or loss 1 050 2081 The operating profit note has been restated to provide more detail.2 Payments to defined contribution retirement plans are charged as an expense as they fall due. 3 Includes staff training, staff welfare, skills development levy, commissions and incentives and other staff related costs.4 Transactions denominated in a foreign currency are recorded at the rates of exchange prevailing at the dates of the
transactions. At the end of each reporting period, monetary items denominated in foreign currencies are retranslated at the rates prevailing at that date. Exchange differences on monetary items are recognised in the statement of profit or loss in the period in which they arise. Derivative instruments are initially measured at fair value at the date the derivative contract is entered into and are subsequently remeasured to fair value at each reporting date. The resulting gains or losses are recognised in the statement of profit or loss.
5 Included in share-based payment expense is a charge of R1 million (2020: a release of R3 million) relating to the Deferred Bonus Plan. This is classified as a cash-settled, share-based payment with the equivalent amount included in liabilities.
6 Earnings before net interest, tax, depreciation and amortisation, impairment of goodwill and property, plant and equipment, profit on disposal of associate, loss on disposal of subsidiary and transaction-related share-based payments. EBITDA includes interest income received on leases and loans receivable in the ICT Segment.
7 Included in the transaction-related share-based payments is an empowerment charge in the ICT Segment of R6 million and in the AE Segment of R1 million.

20
R E U N E RT L I M I T E D
Rm2021
Reviewed2020
Reviewed
4. INTEREST AND DIVIDEND INCOMEDividend income 2 3 Interest earned on financial assets analysed by category of asset:Bank deposits 16 31 Other assets 10 7 Total interest income and dividends 28 41
5. INTEREST EXPENSELoans, bank overdrafts and short-term facilities (47) (53)Lease liabilities (19) (22)Unwinding of present value discount (4) (8)Interest expense as per the statement of profit or loss (70) (83)External interest expense in Quince (included in Group operating expenses as Quince is a finance business) (24) (28)Total interest expense using the effective interest rate method (94) (111)
6. IMPAIRMENT OF FINANCIAL ASSETSCredit write-off 20 298 Expected credit losses (ECL) (19) 288
1 586
Analysis of movement in the ECL30 September 2021
Rm
ECLas at
1 October 2020
(Released)/raised
during theyear
through thestatement ofprofit or loss
Utilisedduring
the year
Disposalof
subsidiaries
Foreign exchange
movement
ECLas at
30 September 2021
Lease and loan receivables 210 (29) (29) – – 152 Trade and other receivables 192 10 (39) (2) 6 167 Credit write-off for trade and other receivables 20 Total impairment of financial assets per the statement of profit or loss 1
Notes (continued) for the year ended 30 September 2021

21
PRELIMINARY REVIEWED CONDENSED CONSOLIDATED FINANCIAL STATEMENTS
6. IMPAIRMENT OF FINANCIAL ASSETS (CONTINUED)Analysis of movement in the ECL30 September 2020
Rm
ECLas at
1 October 2019
Raisedduring the
yearthrough the
statement ofprofit or loss
Utilisedduring
the year
Foreign exchange
movement
ECLas at
30 September 2020
Lease and loan receivables 41 219 (50) – 210 Trade and other receivables 150 69 (14) (13) 192 Credit write-off for lease and loan receivables1 298 Total impairment of financial assets per the statement of profit or loss 5861 The credit write-off in the 2020 financial year resulted from an external fraud perpetrated against Quince by a
non-connected independent third party dealer.
Lease and loan receivablesThe Group applies the IFRS 9 general approach to measuring the ECL required in respect of lease and loan receivables.
This is calculated by applying a historical loss ratio to the lease and loan receivables at each reporting date. The loss ratio for the lease and loan receivables is calculated according to the ageing/payment profile by applying historic write-offs to the payment profile of the population.
The historic loss ratio is then adjusted for forward-looking information to determine the required ECL at the reporting date.
Impact of COVID-19Historical levels of credit impairment (pre 2020) are now not considered representative of what is expected in terms of future defaults due to the COVID-19 pandemic. The ongoing impact of the national lockdowns and waves of infection on economic activity and consequentially the expected increase in business failures have made the estimation of future credit losses complex.
Subsequent to the easing of lockdown conditions after the second and third wave of COVID-19 infections during 2021; economic activity has improved and the Group has incorporated this improvement in their assessment of the management overlay incorporated into the ECL.

22
R E U N E RT L I M I T E D
6. IMPAIRMENT OF FINANCIAL ASSETS (CONTINUED)The Group has considered these factors above and also used the following key assumptions in estimating the ECL as at 30 September 2021:
2021 2020
Probability of default (PD) 5,6% 9,3%Loss given default (LGD) 63,0% 63,0%
Exposure at default (EAD)Exposure of receivables
at 30 September 2021Exposure of receivables
at 30 September 2020
In estimating the PD the following estimates and judgements were applied:
> The expected rate of credit defaults which has reduced to 5,6% during 2021 (11,5% at 31 March 2020, 9,3% at 30 September 2020 and 3,5% at 30 September 2019).
> Due to the uncertainty that COVID-19 brings to the impact on future economic activity, the estimates made require a high degree of judgement.
The LGD rate used was obtained from the quoted recovery rate of the World Bank for South African debt of 37%. This was corroborated against the Moody’s recovery rate for emerging markets. Due to the uncertainty of the impact of COVID-19 on South Africa and limited allocated credit information, this remains the best independent and credible information available, to estimate the expected LGD and this results in an LGD of 63%. In computing the management overlay, management assessed the industry classification of each rental customer and where the industry was, in the experience of management, still experiencing adverse consequences of the COVID-19 pandemic impacting on its credit capacity/risk (largely in the categories of hospitality, tourism and sections of education) applied a management overlay taking this risk into account.
The following is a categorisation of the different stages in accordance with IFRS 9:
Expected credit losses
Rm
Carryingamount
before ECL Stage 1 Stage 2 Stage 3
Net carrying amount
after ECL
30 September 2021 2 628 (41) (13) (98) 2 476Lease receivables 707 (9) (6) (9) 683Loan receivables 1 921 (32) (7) (89) 1 79330 September 2020 2 783 (68) (92) (50) 2 573 Lease receivables 918 (41) (18) (14) 845 Loan receivables 1 865 (27) (74) (36) 1 728
Notes (continued) for the year ended 30 September 2021
23
PRELIMINARY REVIEWED CONDENSED CONSOLIDATED FINANCIAL STATEMENTS
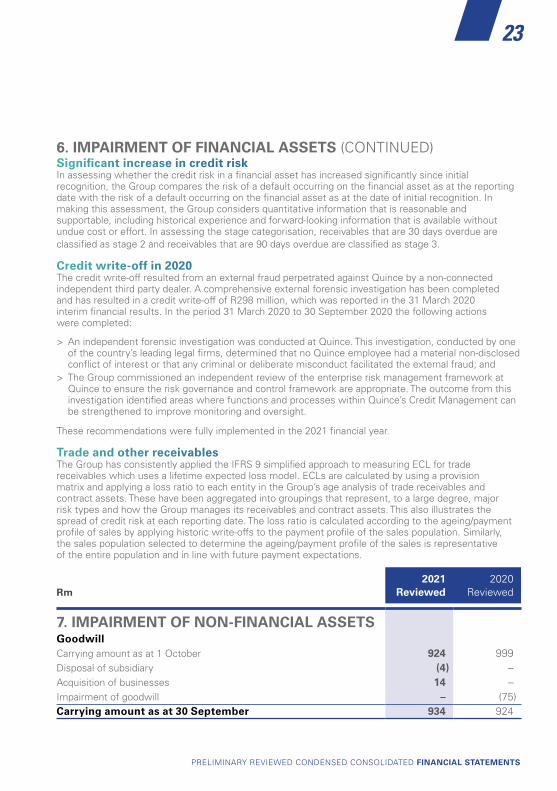
6. IMPAIRMENT OF FINANCIAL ASSETS (CONTINUED)Significant increase in credit riskIn assessing whether the credit risk in a financial asset has increased significantly since initial recognition, the Group compares the risk of a default occurring on the financial asset as at the reporting date with the risk of a default occurring on the financial asset as at the date of initial recognition. In making this assessment, the Group considers quantitative information that is reasonable and supportable, including historical experience and forward-looking information that is available without undue cost or effort. In assessing the stage categorisation, receivables that are 30 days overdue are classified as stage 2 and receivables that are 90 days overdue are classified as stage 3.
Credit write-off in 2020The credit write-off resulted from an external fraud perpetrated against Quince by a non-connected independent third party dealer. A comprehensive external forensic investigation has been completed and has resulted in a credit write-off of R298 million, which was reported in the 31 March 2020 interim financial results. In the period 31 March 2020 to 30 September 2020 the following actions were completed:
> An independent forensic investigation was conducted at Quince. This investigation, conducted by one of the country’s leading legal firms, determined that no Quince employee had a material non-disclosed conflict of interest or that any criminal or deliberate misconduct facilitated the external fraud; and
> The Group commissioned an independent review of the enterprise risk management framework at Quince to ensure the risk governance and control framework are appropriate. The outcome from this investigation identified areas where functions and processes within Quince’s Credit Management can be strengthened to improve monitoring and oversight.
These recommendations were fully implemented in the 2021 financial year.
Trade and other receivablesThe Group has consistently applied the IFRS 9 simplified approach to measuring ECL for trade receivables which uses a lifetime expected loss model. ECLs are calculated by using a provision matrix and applying a loss ratio to each entity in the Group’s age analysis of trade receivables and contract assets. These have been aggregated into groupings that represent, to a large degree, major risk types and how the Group manages its receivables and contract assets. This also illustrates the spread of credit risk at each reporting date. The loss ratio is calculated according to the ageing/payment profile of sales by applying historic write-offs to the payment profile of the sales population. Similarly, the sales population selected to determine the ageing/payment profile of the sales is representative of the entire population and in line with future payment expectations.
Rm2021
Reviewed2020
Reviewed
7. IMPAIRMENT OF NON-FINANCIAL ASSETSGoodwillCarrying amount as at 1 October 924 999 Disposal of subsidiary (4) –Acquisition of businesses 14 –Impairment of goodwill – (75)Carrying amount as at 30 September 934 924

24
R E U N E RT L I M I T E D
7. IMPAIRMENT OF NON-FINANCIAL ASSETS (CONTINUED)The following information summarises the individual assumptions used to test for impairment of goodwill at a cash generating unit (CGU) level, using the value-in-use method.1
30 September 2021
30 September 2020
30 September 2021
30 September 2020
Groupgoodwill
Measurement currency
Discount rate(pre-tax)2
%
Discount rate(pre-tax)2
%
Terminal growth rate3
%
Terminal growth rate3
%
30 September2021 Rm
30 September2020 Rm
Significant CGUsICTNashua Office Automation ZAR 16,9 20,3 4,0 4,0 199 203Quince Capital ZAR 14,3 11,4 4,0 4,0 124 124ECN ZAR 17,4 20,6 4,0 4,0 140 140SkyWire ZAR 16,1 18,9 4,0 4,0 170 170+OneX ZAR 20,6 – 4,0 – 14 –AEOmnigo ZAR 20,7 22,1 4,0 4,0 40 40Terra Firma Solutions ZAR 20,2 21,0 4,0 4,0 88 88Nanoteq ZAR 19,9 22,7 4,0 4,0 69 69Blue Nova Energy ZAR 21,1 22,6 4,0 4,0 53 53
897 887 Other4 ZAR 17,9 – 20,4 20,6 – 22,5 4,0 4,0 37 37 Net carrying amount 934 924 Gross goodwill carrying amount 1 076 1 066 Less: accumulated impairment loss (142) (142)
Notes (continued) for the year ended 30 September 2021
1 The base (year 1) for the value-in-use calculations are the management approved budgets for 2022. The 2022 budget contains revenue growth rates that indicate a gradual improvement towards pre-COVID-19 levels. Average growth rates used in years 2023 to 2026 (except for SkyWire Technologies, Blue Nova and +OneX) were higher than terminal growth rates due to the expected gradual improvement towards pre-COVID-19 levels of activity but are all lower than 10% growth. Growth rates for SkyWire Technologies (12%), Blue Nova (17%) and +OneX (18%) are higher than the average as these businesses operate in industries experiencing high growth and demand. Management have assessed the growth rates applied and consider them to be reasonable and appropriate based on management’s knowledge of the industries and the underlying businesses.
2 The discount rate used is calculated as the weighted average cost of the different components of capital, being debt and equity (WACC). This is consistent with international best practice and covers the different industries in which the Reunert group operates. The discount rate is then converted to the pre-tax discount rate as required by IAS 36 using an appropriate methodology.

25
PRELIMINARY REVIEWED CONDENSED CONSOLIDATED FINANCIAL STATEMENTS
7. IMPAIRMENT OF NON-FINANCIAL ASSETS (CONTINUED)The following information summarises the individual assumptions used to test for impairment of goodwill at a cash generating unit (CGU) level, using the value-in-use method.1
30 September 2021
30 September 2020
30 September 2021
30 September 2020
Groupgoodwill
Measurement currency
Discount rate(pre-tax)2
%
Discount rate(pre-tax)2
%
Terminal growth rate3
%
Terminal growth rate3
%
30 September2021 Rm
30 September2020 Rm
Significant CGUsICTNashua Office Automation ZAR 16,9 20,3 4,0 4,0 199 203Quince Capital ZAR 14,3 11,4 4,0 4,0 124 124ECN ZAR 17,4 20,6 4,0 4,0 140 140SkyWire ZAR 16,1 18,9 4,0 4,0 170 170+OneX ZAR 20,6 – 4,0 – 14 –AEOmnigo ZAR 20,7 22,1 4,0 4,0 40 40Terra Firma Solutions ZAR 20,2 21,0 4,0 4,0 88 88Nanoteq ZAR 19,9 22,7 4,0 4,0 69 69Blue Nova Energy ZAR 21,1 22,6 4,0 4,0 53 53
897 887 Other4 ZAR 17,9 – 20,4 20,6 – 22,5 4,0 4,0 37 37 Net carrying amount 934 924 Gross goodwill carrying amount 1 076 1 066 Less: accumulated impairment loss (142) (142)
3 The terminal growth rate is calculated using the forecast South African consumer price index (CPI) as a basis and thereafter adjusted for various risk factors. This is used to extrapolate the cash flow projections beyond the period covered of 5 years.
4 This consists of the aggregate of individual immaterial goodwill balances across all segments above.

26
R E U N E RT L I M I T E D
7. IMPAIRMENT OF NON-FINANCIAL ASSETS (CONTINUED)SensitivitiesUnder the economic conditions that have arisen during the COVID-19 pandemic, revenue growth is a key consideration. Accordingly, management has undertaken a sensitivity analysis of the consequence of a 5% reduction in forecast revenue on the cash flow forecasts without factoring in any management actions required from the drop in revenue.
The results of this sensitivity analysis were that additional impairments would be required for Nanoteq (R14 million), African Cables (R21 million) and Skywire (R69 million), if revenue forecasts are not met by 5% i.e. 95% achievement.
If the terminal growth rates were decreased by 1%, no impairment would be required.
If the discount rates were increased by 1%, an impairment of R1 million would be required in Nanoteq.
Impairment of property, plant and equipmentIn the current financial year an impairment of R1 million was raised on damaged property, plant and equipment.
2020In 2020, the impact of COVID-19 resulted in the Group impairing goodwill which arose on acquisition of two of its subsidiaries: African Cables (R61 million) and Dynateq International (Dynateq) (R14 million) and R4 million of property, plant and equipment in Polybox.
African CablesAfrican Cables delivered a subdued performance in the 2020 financial year, primarily due to the following:
> The low level of demand for power cable. > Weak level of investment by Government into infrastructure. > A seven-week labour disruption at African Cables during October and November 2019 which negatively impacted revenue and profitability.
> Loss of sales due to COVID-19 and the resulting hard lockdown.
Although the business has secured framework tenders at Eskom and various municipalities, the impact of the reprioritisation of Government's expenditure on infrastructure due to the impact of COVID-19 remains uncertain. Management’s view was that this business was likely to continue to experience pressure on volumes over the medium term and have therefore used forecasts taking this uncertainty into consideration. This resulted in the goodwill impairment of R61 million being required.
DynateqDynateq’s revenue is largely driven by securing contracts in the global defence sector. The business is dependent on the export market in various economies including the Middle East and Europe. Although a portion of the short-term order book is secured, management is of the view that this business is likely to experience pressure on volumes over the medium term and consequently impaired the goodwill of R14 million.
Investment in joint ventureIn the 2020 financial year, the outlook for CBI Electric Telecom Cables (Pty) Ltd (CBI Telecoms) remained uncertain, due to it having a limited order book, significant margin degradation due to competition and declining volumes which all contributed to weak cash flow forecasts over the short to medium term. These factors together with the substantial losses experienced over 3 consecutive financial years resulted in the management of CBI Telecoms impairing the carrying amount of its property, plant and equipment by R147m. The impact of the impairment of R42 million (after tax) is included in the equity-accounted earnings from joint ventures for the 2020 financial year.
Notes (continued) for the year ended 30 September 2021
27
PRELIMINARY REVIEWED CONDENSED CONSOLIDATED FINANCIAL STATEMENTS
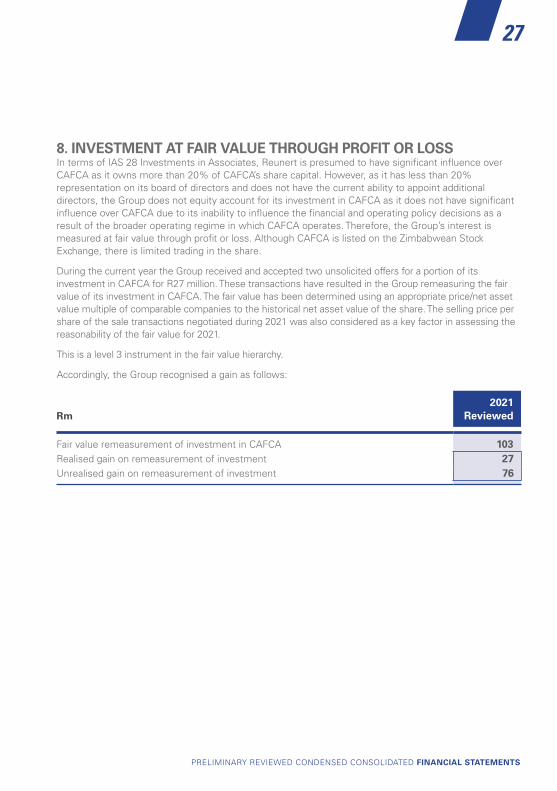
8. INVESTMENT AT FAIR VALUE THROUGH PROFIT OR LOSSIn terms of IAS 28 Investments in Associates, Reunert is presumed to have significant influence over CAFCA as it owns more than 20% of CAFCA’s share capital. However, as it has less than 20% representation on its board of directors and does not have the current ability to appoint additional directors, the Group does not equity account for its investment in CAFCA as it does not have significant influence over CAFCA due to its inability to influence the financial and operating policy decisions as a result of the broader operating regime in which CAFCA operates. Therefore, the Group’s interest is measured at fair value through profit or loss. Although CAFCA is listed on the Zimbabwean Stock Exchange, there is limited trading in the share.
During the current year the Group received and accepted two unsolicited offers for a portion of its investment in CAFCA for R27 million. These transactions have resulted in the Group remeasuring the fair value of its investment in CAFCA. The fair value has been determined using an appropriate price/net asset value multiple of comparable companies to the historical net asset value of the share. The selling price per share of the sale transactions negotiated during 2021 was also considered as a key factor in assessing the reasonability of the fair value for 2021.
This is a level 3 instrument in the fair value hierarchy.
Accordingly, the Group recognised a gain as follows:
Rm2021
Reviewed
Fair value remeasurement of investment in CAFCA 103 Realised gain on remeasurement of investment 27 Unrealised gain on remeasurement of investment 76

28
R E U N E RT L I M I T E D
Rm2021
Reviewed
9. NON-CURRENT DERIVATIVE FINANCIAL ASSETS AND LIABILITIESPut option derivative financial asset 41 Call option derivative financial liability 92 Fair value remeasurement loss on option contract 51
The Group has concluded an agreement with AP Moller Capital through AIF I Africa C&I Renewable Energy LLP (AIF I) to establish a joint venture, Lumika Renewables (Pty) Ltd (Lumika). The Group subscribed for a 50,1% interest in Lumika. Although the Group holds a 50.1% interest, due to the contractual arrangement with AP Moller Capital, the Group exercises joint control over the venture. The Group sold an effective 25% interest in Terra Firma Solutions (Pty) Ltd (TFS) (the Group’s Solar PV business) to Lumika and concluded a put and a call option for the sale of 65% being its residual interest in TFS. The call and put is exercisable after the third anniversary of the establishment of Lumika which date is 30 September 2023.
In terms of these arrangements, the Group has the right to put its remaining interest in TFS to Lumika in exchange for the strike price in US dollars and Lumika has the right to call the remaining interest in TFS from the Group at the same price. The put and call have been recognised as a non-current derivative asset and liability respectively at their fair values through profit or loss.
Valuation techniqueThe equity value of TFS was determined at the reporting date. The equity value, strike price in US dollars and other inputs (see below) were applied to a Black Scholes valuation model to determine the value of the put and call.
The following significant unobservable inputs were used in the determination of the value of the put and call and the resulting net fair value loss:
> Strike price in US dollars calculated at 30 September 2021 using a forward exchange rate of 16.58 – USD13,3 million.
> Average growth rate 16,0% > Post tax discount rate 15,5%
This is a level 3 instrument in the fair value hierarchy.
Notes (continued) for the year ended 30 September 2021

29
PRELIMINARY REVIEWED CONDENSED CONSOLIDATED FINANCIAL STATEMENTS
Rm2021
Reviewed2020
Reviewed
10. NUMBER OF SHARES USED TO CALCULATE EARNINGS PER SHARE1
Weighted average number of shares in issue, net of empowerment and treasury shares, for basic earnings and headline earnings per share (millions of shares) 1612 1612
Adjusted by the dilutive effect of unexercised share options granted (millions of shares) – 1 Weighted average number of shares for diluted basic and diluted headline earnings per share (millions of shares) 161 162 1 The earnings used to determine earnings per share and diluted earnings per share
is the profit for the period attributable to equity holders of Reunert of R777 million (2020: R47 million).
2 The Group has elected to treat the shares under the equity forward contract as issued shares for purposes of earnings per share.
11. HEADLINE EARNINGSProfit attributable to equity holders of Reunert 777 47 Headline earnings are determined by eliminating the effect of the following items from attributable earnings:Goodwill impairment – 75 Impairment of non-financial assets in a joint venture (after a tax credit of Rnil (2020: R14 million)) 1 42 Net loss on disposal of subsidiary and associate (after a tax charge of R1 million (2020: Rnil)) 1 20 Impairment of property, plant and equipment –1 4 Profit on disposal of property, plant and equipment and intangible assets (after a tax charge of R3 million and NCI portion of Rnil) (2020: after a tax charge of R1 million and NCI portion of R1 million)2 (11) (2)Headline earnings 768 186 Headline earnings per share (cents) 478 115 Diluted headline earnings per share (cents) 476 115 1 The impairment of property, plant and equipment after tax results in the amount being less than R0,5 million and
therefore has been rounded to Rnil for the headline earnings calculation.2 Includes R2 million profit on disposal of property, plant and equipment arising from an investment in joint venture.

30
R E U N E RT L I M I T E D
Rm2021
Reviewed2020
Reviewed
12. CONTINGENT CONSIDERATIONCarrying amount as at 1 October 24 41 Raised on acquisitions at fair value 18 – Raised on acquisition of NCI during the year1 6 –Fair value remeasurements (13)2 (2)Settlement (7) (15)Carrying amount as at 30 September 28 24 Less: current portion 18 24 Non-current portion 10 – 1 This relates to a contingent consideration that arose during the year on the acquisition of the non-controlling
interest in Kopano Solutions Company (Pty) Ltd.2 Includes a remeasurement gain of R11 million for Blue Nova arising from the related targets not being met.
These were classified as level 3 instruments in the fair value hierarchy.
13. PUT OPTION LIABILITYAs part of the TFS acquisition in 2017, the Group granted put options in favour of the non-controlling shareholders for 25% of the issued share capital. The majority of this put option was exercised in the 2020 financial year. The amount remaining is carried at fair value and amounts to R365 303 (2020: R307 428).
The measurement period for the TFS empowerment transaction concluded on 30 September 2021. The non-controlling shareholders have the right to claw back some or all of the shares issued to the TFS empowerment partner in the event of the empowerment partner not achieving certain pre-agreed targets by 30 September 2021. The claw back mechanism is based on an agreed formula with the empowerment partner. The non-controlling shareholders have a further right to put the shares clawed back from the empowerment partner to the Group. As a result, an additional put option liability arose on completion of the measurement period, in the current year, which is measured using the same methodology as the original put option for 25% granted to the non-controlling shareholders when the Group acquired its controlling interest in TFS.
Notes (continued) for the year ended 30 September 2021

31
PRELIMINARY REVIEWED CONDENSED CONSOLIDATED FINANCIAL STATEMENTS
13. PUT OPTION LIABILITY (CONTINUED)A reconciliation of the closing balance is as below:
Rm2021
Reviewed2020
Reviewed
Carrying amount as at 1 October – 120 Raised during the year 25 – Fair value remeasurements – 3 Unwinding of present value discount – 8 Settlement – (131)Carrying amount as at 30 September 25 –
The obligation is classified as a level 3 instrument in the fair value hierarchy.
Valuation techniqueThe fair value of the put option liability is determined using an agreed formula in the shareholders agreement. This formula applies a multiple to revenue and an adjusted profit after tax and incorporates the investment in build-own-operate plants.
Significant unobservable inputs include:
> The 2021 revenue and profit after tax (PAT) of TFS; and > The value of build-own-operate projects at 30 September 2021
14. RECONCILIATION OF RESTATED OPERATING PROFITThe operating profit on the consolidated statement of profit and loss has been restated in order to include all non-finance and tax related items of income and expenditure in the determination of operating profit in line with the emerging issues identified by the JSE in their proactive monitoring report of 9 November 2021. The 2020 financial year restatements have been subject to a review in 2021 by the external auditors. Accordingly the restated 2020 comparatives are now classified as reviewed and not audited.
Rm
Operating profit as reported in September 2020 307 Less:Impairment of non-financial assets Impairment of goodwill (75) Impairment of property, plant and equipment (4)Loss on disposal of subsidiary (20)Operating profit as now reported 208
32
R E U N E RT L I M I T E D
15. ACQUISITION OF BUSINESSES2021All business combinations are accounted for by applying the acquisition method. All acquisition-related costs are recognised as expenses in the period in which the costs are incurred and the services received.
If the initial accounting for the business combinations is incomplete at the end of the reporting period in which the combination occurs, the Group reports provisional amounts for the items for which the accounting is incomplete. These provisional amounts are then adjusted during the remaining measurement period, or additional assets and liabilities are recognised, to reflect any new information obtained about facts and circumstances that existed at the acquisition date, which if known at the time of making the initial recognition entries, would have impacted the amounts recognised at that time.
Non-controlling interests (NCI) in the net assets of consolidated subsidiaries are identified separately from the Group’s equity therein. NCI consists of the value of those interests at the date of the original business combination and the NCI’s share of changes in equity since the date of the combination. Losses applicable to the NCI in excess of the NCI’s share of changes in equity are allocated against the interests of the Group except to the extent that the NCI has a binding obligation and is able to make an additional investment to cover their share of losses beyond their contributed equity.
1. TripleH Cloud Services (Pty) Ltd (TripleH)With effect from 1 June 2021, the Group, through +OneX, acquired 100% of the business and related net assets of TripleH. TripleH is a company focused on virtual cloud based solutions. The existing work force is appropriately skilled and resourced to service the existing client base and new clients that will come from synergistic benefits within the ICT segment.
The acquisition of TripleH complements the ICT Segment’s expansion strategy and increases the geographical presence of +OneX. The acquisition also provides +OneX with additional service offerings such as multi-cloud management, infrastructure as a service, disaster recovery as a service and backup as a service. As +OneX is a cloud systems integrator, the TripleH Cloud Services business will be core to its cloud service offering.
Notes (continued) for the year ended 30 September 2021

33
PRELIMINARY REVIEWED CONDENSED CONSOLIDATED FINANCIAL STATEMENTS
15. ACQUISITION OF BUSINESSES (CONTINUED)2. Datacore Media (Pty) Ltd (DCM)With effect from 1 May 2021, the Group, through +OneX, acquired 100% of the business and related net assets of DCM. DCM is a company focused on the digital media planning industry space. The existing work force is appropriately skilled and resourced to service the existing client base and new clients that will come from synergistic benefits within the ICT Segment.
The acquisition of DCM complements the ICT Segment’s expansion strategy and increases the geographical presence of +OneX. The acquisition also provides +OneX with additional service offerings such as digital media and data consultancy business and will strengthen +OneX’s position as an end-to-end business transformation partner.
Rm2021
Reviewed
Cash paid 8 Contingent consideration 18 Working capital offset against the purchase price (3)Total purchase consideration 23 Represented by:Property, plant and equipment 4 Goodwill 14 Intangible assets 11 Deferred tax liabilities (3)Trade and other payables (3)Net assets acquired (fair value at acquisition date) 23 Revenue since acquisition 12 Profit after tax since acquisition 2 Revenue for 2021 as though the acquisition date had been 1 October 2020 32 Profit after tax for 2021 as though the acquisition date had been 1 October 2020 6

34
R E U N E RT L I M I T E D
16. DISPOSAL OF SUBSIDIARY AND ASSOCIATE2021Sale of Nashua Paarl and West Coast (Pty) Ltd (PWC)With effect from 1 August 2021 Nashua Holdings (Pty) Ltd sold the interest it held in the franchise known as PWC for R3 million.
Rm2021
Reviewed
Net assets disposed in PWC:Goodwill 4 Deferred tax assets 1 Lease receivables 72 Inventory 2 Trade and other receivables 11 Non-controlling interests (4)Long-term loans (1)Trade and other payables (9)Amounts owing to subsidiaries (74)Net carrying amount disposed of 2Consideration received 1
Cash received on sale 3Less: cash on hand 2
Loss on disposal of subsidiary (net of tax of Rnil) (1)Sale of Oxirostax (Pty) Ltd (Winelands)1
With effect from 1 August 2021 Nashua Holdings (Pty) Ltd sold its interest in the Winelands franchise it owned for R9 million consideration.Investment in associate 8Consideration received:
In cash 9Profit on disposal of associate (net of tax of Rnil) 11 The investment in Winelands was previously recognised as an investment in associate and equity accounted for in the
Group’s financial statements.
Notes (continued) for the year ended 30 September 2021
35
PRELIMINARY REVIEWED CONDENSED CONSOLIDATED FINANCIAL STATEMENTS
16. DISPOSAL OF SUBSIDIARY AND ASSOCIATE (CONTINUED)
Rm2020
Reviewed
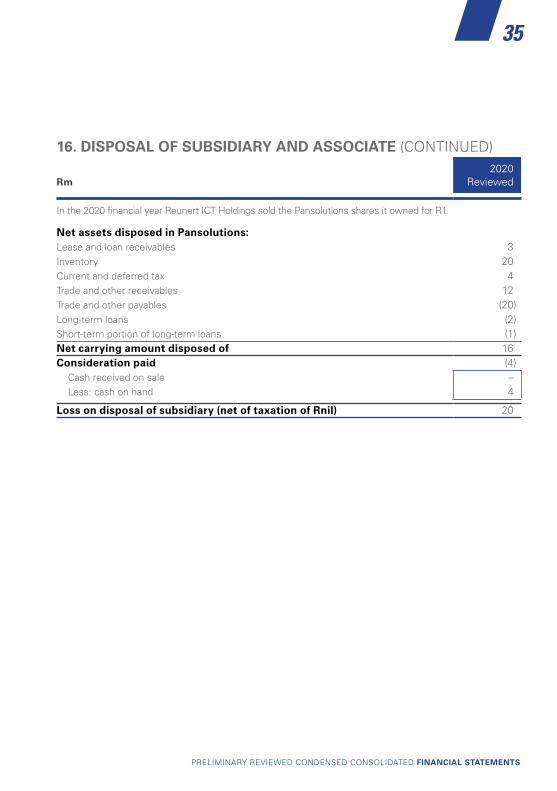
In the 2020 financial year Reunert ICT Holdings sold the Pansolutions shares it owned for R1.
Net assets disposed in Pansolutions:Lease and loan receivables 3 Inventory 20 Current and deferred tax 4 Trade and other receivables 12 Trade and other payables (20)Long-term loans (2)Short-term portion of long-term loans (1)Net carrying amount disposed of 16 Consideration paid (4)
Cash received on sale –Less: cash on hand 4
Loss on disposal of subsidiary (net of taxation of Rnil) 20

36
R E U N E RT L I M I T E D
17. EQUITY TRANSACTIONS WITH NON-CONTROLLING INTERESTS (NCIs)Changes in the Group’s interest in a subsidiary that do not result in a loss of control are accounted for as equity transactions. The carrying amounts of the Group’s interests and the NCIs are adjusted to reflect the changes in their relative interests in the subsidiary concerned. Any difference between the amount by which the non-controlling interests are adjusted and the fair value of the consideration paid or received is recognised directly in equity and attributed to all the owners of the Company.
Rm2021
Reviewed
Transactions to increase controlling interest in subsidiaries’ holdingsKopano Solutions Company (Pty) Ltd (Nashua Kopano)With effect from 1 April 2021, the Group acquired all of the non-controlling interest in Nashua Kopano, a Group-owned Nashua franchise in the ICT Segment.
Consideration paid 21
Main Street 1052 (Pty) Ltd (Nashua Central)With effect from 1 August 2021, the Group acquired all of the non-controlling interest in Nashua Central, a Group-owned Nashua franchise in the ICT Segment.
Consideration paid 10Transactions to decrease controlling interest in subsidiaries’ holdingsClassic Number Trading 80 (Pty) Ltd (Nashua Tshwane)With effect from 1 June 2021, the Group sold 30% of its interest in Nashua Tshwane, a Group-owned Nashua franchise in the ICT Segment.
Consideration received (3)Reunert Investment Company No 2 (Pty) Ltd (RIC #2)With effect from 1 July 2021 Reunert Limited through its subsidiary, Reunert Applied Electronics Holdings (Pty) Ltd (RAEH) has, concluded a shareholders agreement with AIF I to establish a joint venture, Lumika Renewables (Pty) Ltd (Lumika). As part of the establishment of Lumika, RAEH has agreed to sell an effective 27,8% interest to Lumika.
Through this 27,8% interest, Lumika will hold an effective 25% in TFS, which remains a subsidiary consolidated by Reunert.
Reunert has elected to eliminate the equity-accounted earnings associated with TFS in the consolidated financial statements.
Consideration received (38)+OneX+OneX was introduced into the Group on the 1st of August 2020 whereby Reunert Connect (Pty) Ltd was renamed to +OneX, Reunert ICT held 100% of the shares. With effect from 1 December 2020 the +OneX group was formed and Nashua Communications (Pty) Ltd which was 100% owned by Reunert ICT was then moved to be a part of this cluster and renamed to +OneX Communications (Pty) Ltd. On 1 December 2020, non-controlling interests were introduced by way of an issue of shares by +OneX Solutions to the founders.
Notes (continued) for the year ended 30 September 2021

37
PRELIMINARY REVIEWED CONDENSED CONSOLIDATED FINANCIAL STATEMENTS
Rm2021
Reviewed
On 30 September 2021, a further dilution of shareholding occurred resulting in a reduction in Reunert ICT shareholding in +OneX group. This reduction was due to new shares being issued to a strategic BEE group, which will now hold 20% of the +OneX group. Due to this dilution the shareholding for +OneX Group will change resulting in Reunert ICT, The Founders and the Black Founders now holding 56,9%, 14,4% and 8,7% respectively.Consideration received (27)Net consideration received (37)
Non-controlling interests (65)Transactions with non-controlling interests 47 Investment in joint venture (19)
Rm2020
Reviewed
Transactions to increase percentage holdingDuring the 2020 financial year the Group increased its holding in TFS from 62,49% to 89,94% at a cash cost of R132 million.
The increase was due to direct purchase of shares and by the exercise of put options held by the non-controlling shareholders of TFS.
Net consideration paid 132
Non-controlling interests 15 Transactions with non-controlling interests (14)Put option liability 131 Equity transactions/put option with non-controlling interests (94)Retained earnings 94
17. EQUITY TRANSACTIONS WITH NON-CONTROLLING INTERESTS (NCIs) (CONTINUED)

38
R E U N E RT L I M I T E D
18. LITIGATIONThere is no material litigation being undertaken against or by the Group, other than the ongoing process to seek to recover the losses incurred through the Quince fraud.
19. EVENTS AFTER REPORTING DATESubsequent to the reporting date the Group has:
> Disposed of a further 15,57% of the Group’s investment in CAFCA, the Group’s investment in a Zimbabwean power cable manufacturer for a consideration of R29 million.
> Commenced the process to restructure and extend its original B-BBEE structure (“Proposed B-BBEE Transaction”). The original B-BBEE structure, which was implemented in 2007 and extended for another 4 years in 2018, is centred around Bargenel Investments (Pty) Ltd (“Bargenel”), which holds 18,5 million ordinary Reunert Limited shares (or approximately 10% of the issued ordinary shares of Reunert). Rebatona Investment Holdings (Pty) Ltd (“Rebatona”) is the sole shareholder of Bargenel. Rebatona, in turn is owned by the Rebatona Educational Trust (70%) and the founders of Peotona Investment Holdings (Pty) Ltd, being Adv Thandi Orleyn, Cheryl Carolus, Wendy Lucas-Bull and the late Dolly Mokgatle through their family trusts (the “Peotona Parties”) (30%), respectively. The Group expects to provide shareholders with a detailed terms announcement and circular providing full details of the Proposed B-BBEE Transaction for their consideration in due course. Notwithstanding the long-term beneficial relationship between the Group and the Peotona Parties since the implementation of the original BEE transaction in 2007, the Peotona Parties have confirmed that they do not wish to participate in the Proposed B-BBEE Transaction. Therefore, as a separate transaction, with effect from 30 November 2021, Rebatona will repurchase all of the Rebatona Shares held by the Peotona Parties for a total consideration of R9.6 million.
> Entered into a sale of business agreement with Code Maven (Pty) Ltd (Code Maven) whereby +OneX acquired 100% of the business and related assets of Code Maven with effect from 1 October 2021. The acquisition adds significant application development capability to +OneX, with over 100 highly skilled developers. Code Maven will form the core of +OneX’s software talent and bespoke development business which enables +OneX to offer custom software development, product design, quality assurance and consultancy services.
Notes (continued) for the year ended 30 September 2021

39
PRELIMINARY REVIEWED CONDENSED CONSOLIDATED FINANCIAL STATEMENTS
20. GOING CONCERNThe directors have reviewed the Group’s financial position, existing credit facilities and available cash resources and are satisfied that the Group will continue as a going concern.
21. EXTERNAL AUDITOR’S REVIEW OPINIONDeloitte & Touche has issued an unmodified review report on the reviewed condensed consolidated financial statements for the year ended 30 September 2021. The review was concluded in accordance with ISRE 2410 – Review of Interim Financial Information performed by the independent auditor of the entity. A copy of their unmodified review report is available for inspection at Reunert’s registered office. The auditor’s review report does not necessarily report on all information contained in this announcement. Investors are, therefore, advised that in order to obtain a full understanding of the nature of the auditor’s engagement, they should obtain a copy of that report from Reunert’s registered office. Any reference to future performance included in this announcement has not been reviewed or reported on by the auditors.
40
R E U N E RT L I M I T E D
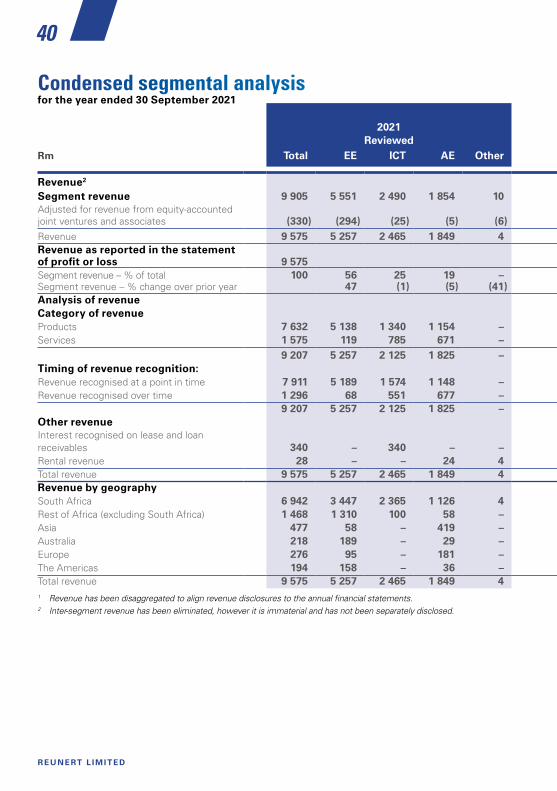
Condensed segmental analysisfor the year ended 30 September 2021
2021 Reviewed
2020Reviewed Restated1
% changein totalRm Total EE ICT AE Other Total EE ICT AE Other
Revenue2
Segment revenue 9 905 5 551 2 490 1 854 10 8 259 3 767 2 524 1 951 17 20 Adjusted for revenue from equity-accounted joint ventures and associates (330) (294) (25) (5) (6) (213) (179) (28) – (6)Revenue 9 575 5 257 2 465 1 849 4 8 046 3 588 2 496 1 951 11Revenue as reported in the statement of profit or loss 9 575 8 046 19 Segment revenue – % of total 100 56 25 19 – 100 46 30 24 –Segment revenue – % change over prior year 47 (1) (5) (41)Analysis of revenueCategory of revenueProducts 7 632 5 138 1 340 1 154 – 6 014 3 406 1 286 1 322 – Services 1 575 119 785 671 – 1 581 182 798 601 –
9 207 5 257 2 125 1 825 – 7 595 3 588 2 084 1 923 – Timing of revenue recognition:Revenue recognised at a point in time 7 911 5 189 1 574 1 148 – 6 215 3 468 1 508 1 239 – Revenue recognised over time 1 296 68 551 677 – 1 380 120 576 684 –
9 207 5 257 2 125 1 825 – 7 595 3 588 2 084 1 923 – Other revenueInterest recognised on lease and loan receivables 340 – 340 – – 412 – 412 – – Rental revenue 28 – – 24 4 39 – – 28 11 Total revenue 9 575 5 257 2 465 1 849 4 8 046 3 588 2 496 1 951 11 Revenue by geographySouth Africa 6 942 3 447 2 365 1 126 4 5 703 2 279 2 390 1 023 11 Rest of Africa (excluding South Africa) 1 468 1 310 100 58 – 1 178 911 106 161 – Asia 477 58 – 419 – 567 40 – 527 – Australia 218 189 – 29 – 190 164 – 26 – Europe 276 95 – 181 – 221 76 – 145 – The Americas 194 158 – 36 – 187 118 – 69 – Total revenue 9 575 5 257 2 465 1 849 4 8 046 3 588 2 496 1 951 11 1 Revenue has been disaggregated to align revenue disclosures to the annual financial statements.2 Inter-segment revenue has been eliminated, however it is immaterial and has not been separately disclosed.
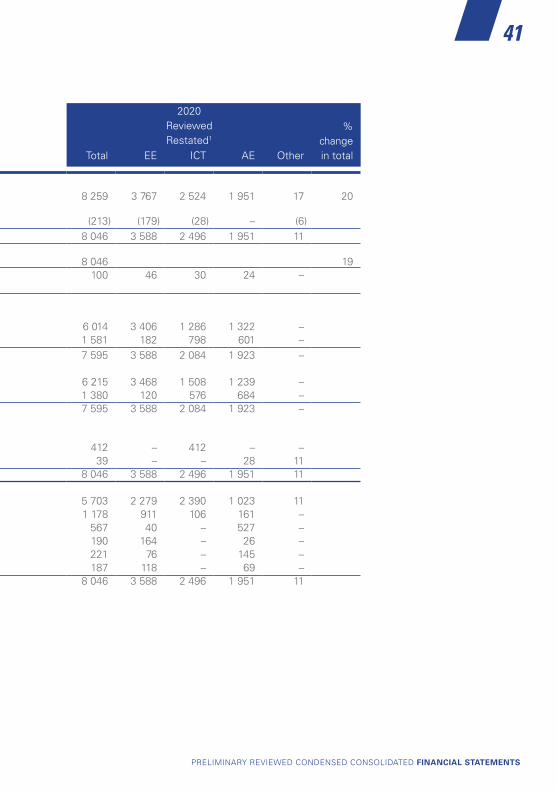
41
PRELIMINARY REVIEWED CONDENSED CONSOLIDATED FINANCIAL STATEMENTS
2021 Reviewed
2020Reviewed Restated1
% changein totalRm Total EE ICT AE Other Total EE ICT AE Other
Revenue2
Segment revenue 9 905 5 551 2 490 1 854 10 8 259 3 767 2 524 1 951 17 20 Adjusted for revenue from equity-accounted joint ventures and associates (330) (294) (25) (5) (6) (213) (179) (28) – (6)Revenue 9 575 5 257 2 465 1 849 4 8 046 3 588 2 496 1 951 11Revenue as reported in the statement of profit or loss 9 575 8 046 19 Segment revenue – % of total 100 56 25 19 – 100 46 30 24 –Segment revenue – % change over prior year 47 (1) (5) (41)Analysis of revenueCategory of revenueProducts 7 632 5 138 1 340 1 154 – 6 014 3 406 1 286 1 322 – Services 1 575 119 785 671 – 1 581 182 798 601 –
9 207 5 257 2 125 1 825 – 7 595 3 588 2 084 1 923 – Timing of revenue recognition:Revenue recognised at a point in time 7 911 5 189 1 574 1 148 – 6 215 3 468 1 508 1 239 – Revenue recognised over time 1 296 68 551 677 – 1 380 120 576 684 –
9 207 5 257 2 125 1 825 – 7 595 3 588 2 084 1 923 – Other revenueInterest recognised on lease and loan receivables 340 – 340 – – 412 – 412 – – Rental revenue 28 – – 24 4 39 – – 28 11 Total revenue 9 575 5 257 2 465 1 849 4 8 046 3 588 2 496 1 951 11 Revenue by geographySouth Africa 6 942 3 447 2 365 1 126 4 5 703 2 279 2 390 1 023 11 Rest of Africa (excluding South Africa) 1 468 1 310 100 58 – 1 178 911 106 161 – Asia 477 58 – 419 – 567 40 – 527 – Australia 218 189 – 29 – 190 164 – 26 – Europe 276 95 – 181 – 221 76 – 145 – The Americas 194 158 – 36 – 187 118 – 69 – Total revenue 9 575 5 257 2 465 1 849 4 8 046 3 588 2 496 1 951 11

42
R E U N E RT L I M I T E D
Condensed segmental analysis (continued)for the year ended 30 September 2021
2021 Reviewed
2020Reviewed Restated
% changein totalRm Note Total EE ICT AE Other Total EE ICT AE Other
Operating profitSegment operating profit/(loss)1 986 373 608 100 (95) 868 28 604 269 (33) 14 Adjusted for operating (profit)/loss from equity-accounted joint ventures and associates (4) 5 (2) (1) (6) 22 30 (3) – (5)Profit on disposal of property, plant and equipment and intangible assets 3 12 3 – 3 6 4 3 – 1 – Impairment of non-financial assets
Impairment of goodwill 3 – – – – – (75) (61) – (14) – Impairment of property, plant and equipment 3 (1) – – (1) – (4) (4) – – –
Fair value remeasurementsGain on option contract 3 41 – – 41 – – – – – – Loss on option contract 3 (92) – – (92) – – – – – – Gain on investment at fair value through profit or loss 3 103 103 – – – – – – – – Gain on contingent consideration 3 13 – – 13 – 2 – – 2 – Loss on put option liability 3 – – – – – (3) – – (3) –
Profit on disposal of associate 3 1 – 1 – – – – – – – Loss on disposal of subsidiary 3 (1) – (1) – – (20) – (20) – – Transaction-related share-based payments 3 (7) – (6) (1) – – – – – – Operating profit/(loss) before impairment of financial assets 1 051 484 600 62 (95) 794 (4) 581 255 (38)Impairment of financial assets
Credit write-off 3 (20) (8) (9) (3) – (298) – (298) – – Expected credit losses 3 19 (23) 29 13 – (288) (26) (243) (19) –
Operating profit/(loss) 1 050 453 620 72 (95) 208 (30) 40 236 (38)Operating profit as reported in the statement of profit or loss 1 050 208 405 Segment operating profit/(loss) – % of total 100 38 62 10 (10) 100 3 70 31 (4)Segment operating profit/(loss) – % change over prior year 1 232 1 (63) (188)
1 The net interest charged on Group funding provided to the Group’s in-house finance operation has been eliminated in line with IFRS 10 – Consolidated Financial Statements. The interest eliminated amounted to Rnil million (2020: R134 million). Should this operation be externally funded, this would result in a reduction of ICT’s operating profit by the quantum of the external interest paid.
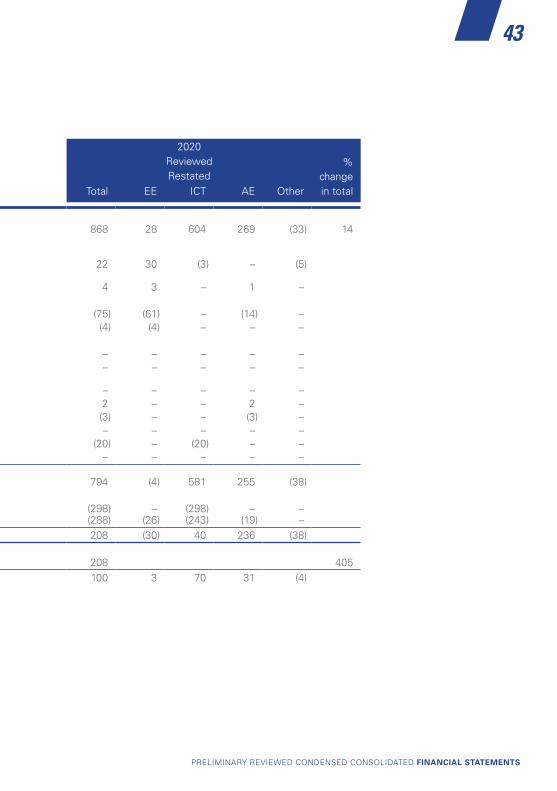
43
PRELIMINARY REVIEWED CONDENSED CONSOLIDATED FINANCIAL STATEMENTS
2021 Reviewed
2020Reviewed Restated
% changein totalRm Note Total EE ICT AE Other Total EE ICT AE Other
Operating profitSegment operating profit/(loss)1 986 373 608 100 (95) 868 28 604 269 (33) 14 Adjusted for operating (profit)/loss from equity-accounted joint ventures and associates (4) 5 (2) (1) (6) 22 30 (3) – (5)Profit on disposal of property, plant and equipment and intangible assets 3 12 3 – 3 6 4 3 – 1 – Impairment of non-financial assets
Impairment of goodwill 3 – – – – – (75) (61) – (14) – Impairment of property, plant and equipment 3 (1) – – (1) – (4) (4) – – –
Fair value remeasurementsGain on option contract 3 41 – – 41 – – – – – – Loss on option contract 3 (92) – – (92) – – – – – – Gain on investment at fair value through profit or loss 3 103 103 – – – – – – – – Gain on contingent consideration 3 13 – – 13 – 2 – – 2 – Loss on put option liability 3 – – – – – (3) – – (3) –
Profit on disposal of associate 3 1 – 1 – – – – – – – Loss on disposal of subsidiary 3 (1) – (1) – – (20) – (20) – – Transaction-related share-based payments 3 (7) – (6) (1) – – – – – – Operating profit/(loss) before impairment of financial assets 1 051 484 600 62 (95) 794 (4) 581 255 (38)Impairment of financial assets
Credit write-off 3 (20) (8) (9) (3) – (298) – (298) – – Expected credit losses 3 19 (23) 29 13 – (288) (26) (243) (19) –
Operating profit/(loss) 1 050 453 620 72 (95) 208 (30) 40 236 (38)Operating profit as reported in the statement of profit or loss 1 050 208 405 Segment operating profit/(loss) – % of total 100 38 62 10 (10) 100 3 70 31 (4)Segment operating profit/(loss) – % change over prior year 1 232 1 (63) (188)
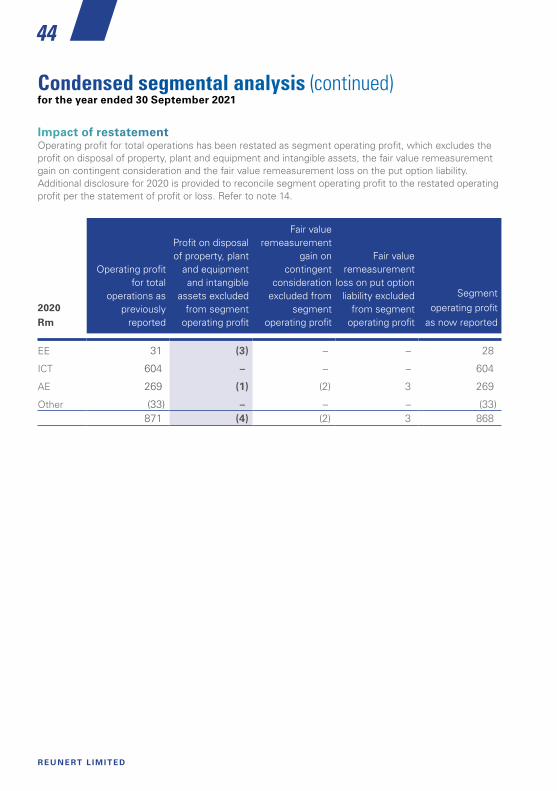
44
R E U N E RT L I M I T E D
2020Rm
Operating profit for total
operations as previously
reported
Profit on disposal of property, plant
and equipment and intangible
assets excluded from segment
operating profit
Fair value remeasurement
gain on contingent
consideration excluded from
segment operating profit
Fair value remeasurement
loss on put option liability excluded
from segment operating profit
Segment operating profit
as now reported
EE 31 (3) – – 28
ICT 604 – – – 604
AE 269 (1) (2) 3 269
Other (33) – – – (33)871 (4) (2) 3 868
Condensed segmental analysis (continued)for the year ended 30 September 2021
Impact of restatementOperating profit for total operations has been restated as segment operating profit, which excludes the profit on disposal of property, plant and equipment and intangible assets, the fair value remeasurement gain on contingent consideration and the fair value remeasurement loss on the put option liability. Additional disclosure for 2020 is provided to reconcile segment operating profit to the restated operating profit per the statement of profit or loss. Refer to note 14.

45
PRELIMINARY REVIEWED CONDENSED CONSOLIDATED FINANCIAL STATEMENTS
Rm2021
Reviewed%
of total2020
Reviewed%
of total
Total assets
EE 2 708 26 2 420 25
ICT 4 334 42 4 328 44
AE 2 755 27 2 500 26
Other 540 5 478 5
Total assets as reported in the statement of financial position1 10 337 100 9 726 100
Total liabilities
EE 1 246 35 1 007 32
ICT 834 23 1 037 32
AE 839 24 793 25
Other 636 18 346 11
Total liabilities as reported in the statement of financial position1 3 555 100 3 183 100
1 Intercompany receivables, payables and loans have been eliminated in line with the consolidation principles of IFRS.
Condensed segmental analysis (continued)for the year ended 30 September 2021
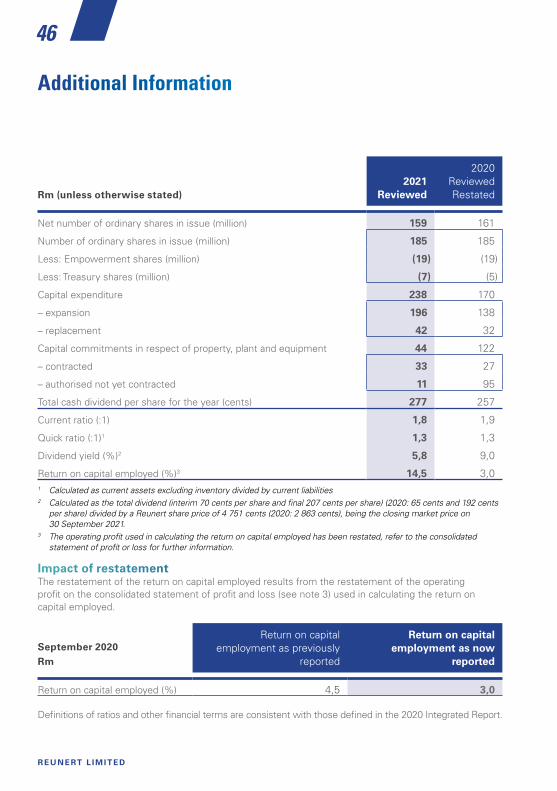
46
R E U N E RT L I M I T E D
Additional Information
Rm (unless otherwise stated)2021
Reviewed
2020ReviewedRestated
Net number of ordinary shares in issue (million) 159 161
Number of ordinary shares in issue (million) 185 185
Less: Empowerment shares (million) (19) (19)
Less: Treasury shares (million) (7) (5)
Capital expenditure 238 170
– expansion 196 138
– replacement 42 32
Capital commitments in respect of property, plant and equipment 44 122
– contracted 33 27
– authorised not yet contracted 11 95
Total cash dividend per share for the year (cents) 277 257
Current ratio (:1) 1,8 1,9
Quick ratio (:1)1 1,3 1,3
Dividend yield (%)2 5,8 9,0
Return on capital employed (%)3 14,5 3,0 1 Calculated as current assets excluding inventory divided by current liabilities2 Calculated as the total dividend (interim 70 cents per share and final 207 cents per share) (2020: 65 cents and 192 cents
per share) divided by a Reunert share price of 4 751 cents (2020: 2 863 cents), being the closing market price on 30 September 2021.
3 The operating profit used in calculating the return on capital employed has been restated, refer to the consolidated statement of profit or loss for further information.
Impact of restatementThe restatement of the return on capital employed results from the restatement of the operating profit on the consolidated statement of profit and loss (see note 3) used in calculating the return on capital employed.
September 2020Rm
Return on capital employment as previously
reported
Return on capital employment as now
reported
Return on capital employed (%) 4,5 3,0
Definitions of ratios and other financial terms are consistent with those defined in the 2020 Integrated Report.

47
REUNERT LIMITEDIncorporated in the Republic of South AfricaReg. No 1913/004355/06Ordinary share Code: RLO ISIN code: ZAE000057428("Reunert", "the Group" or "the Company")
Directors : T S Munday (Chair)*, T Abdool-Samad*, A B Darko*, A E Dickson (Chief Executive Officer), L P Fourie (Chair of the Audit Committee)*, J P Hulley*, S D Jagoe*, S Martin*, Dr MT Matshoba-Ramuedzisi*, MJ Husain* (appointed: 1 November 2020), M Moodley, Adv N D B Orleyn**, N A Thomson (Chief Financial Officer)* Independent non-executive** Non-executive
Nashua BuildingWoodmead North Office Park54 Maxwell DriveWoodmead, Sandton, 2191PO Box 784391Sandton, 2146Telephone +27 11 517 9000
Income tax reference number 9100/101/71/7P
Transfer secretariesComputershare Investor Services (Pty) LtdRosebank Towers15 Biermann AvenueRosebank, 2196P O Box 61051Marshalltown, 2107
SponsorOne Capital Sponsor Services (Pty) Ltd
Registered AuditorsDeloitte & Touche
Secretaries’ certificationIn terms of section 88(2)(e) of the Companies Act, 71 of 2008, I, Karen Louw, duly authorised on behalf of the Group Company Secretary, Reunert Management Services (Pty) Ltd (Registration number 1980/007949/07) certify that, to the best of my knowledge and belief, the Company has lodged with the Companies and Intellectual Property Commission for the financial year ended 30 September 2021 all such returns and notices as are required in terms of the aforesaid Companies Act and that all such returns and notices are true and correct.
Karen Louwfor Reunert Management Services (Pty) LtdGroup Company Secretary
Investor enquiriesKaren Smith e-mail [email protected] additional information log on to the Reunert website at www.reunert.com.
23 November 2021 (publication date)
Administration
GREYMATTERFINCH # 15291
Related Documents