PRELIMINARY REPORT ON FISCAL DESIGNS FOR THE DEVELOPMENT OF ALASKA NATURAL GAS BY DAVID WOOD NOVEMBER 2008 For State of Alaska Legislative Budget & Audit Committee David Wood & Associates www.dwasolutions.com Section 2.4 How are economic rents, returns and risks divided?

Welcome message from author
This document is posted to help you gain knowledge. Please leave a comment to let me know what you think about it! Share it to your friends and learn new things together.
Transcript
PRELIMINARY REPORT ON FISCAL DESIGNS FOR THE DEVELOPMENT OF ALASKA NATURAL GAS
BY
DAVID WOOD NOVEMBER 2008
For
State of Alaska Legislative Budget & Audit Committee
David Wood & Associates www.dwasolutions.com
Section 2.4
How are economic rents, returns and risks divided?

2.4 How are economic rents, returns and risks divided? The Concept of Economic Rent and its Relevance to Fiscal Design The term economic rent is defined by economists as the difference between the market value of a resource and the cost of producing that resource, allowing for a reasonable return on investment. The amount of economic rent available for oil or gas resources in a region will depend on the difference between the market value of the resources, both locally and in more distant but accessible markets, less the cost of exploring for, developing, producing, processing, storing, transporting and generally handling and distributing those resources. Market conditions and competition, both the number of interested participants and number of competing opportunities, and risk determine what should be considered a “reasonable” profit, and that will clearly vary over time. The components of economic rent for a generic upstream oil and gas industry are shown in Figure 2.4.1. Figure 2.4.1 Components of economic rent. The diagram is a schematic only and the sizes of boxes may not be proportional to actual dollars derived from an actual project. Once capital investment, operating and transportation costs have been accounted for, and a normal rate of return on investment has been received by the investing company, the actual amount of economic rent that is captured by governments depends on the rates of royalties, special petroleum taxes, local levies and corporate income tax imposed upon the revenue
Preliminary Report on Fiscal Designs for the Development of Alaska Natural Gas David Wood November 2008
120

generated or income derived from that revenue. Any economic rent that is not captured through such taxation measures accrues in the form of excess profits to the operating company. Some consider the “excess” profits not captured by government a subsidy from government to oil and gas operating companies. Hence governments, on behalf of their citizens, are obliged to maximize their capture of economic rent, particularly from publicly owned mineral resource industries. Fiscal design is how governments go about achieving this. The capture of economic rent and how it can be theoretically measured and assessed is illustrated in Figure 2.4.2. Figure 2.4.2 Components of government take of revenues and profits. Note the term “won and sold” in Figure 2.4.2 refers to petroleum extracted from a subsurface reservoir in accordance with the terms of a lease or license and available to sell (i.e. won) and specifically the quantity of that production actually sold through sales transactions (i.e. as distinct from that already produced but held in stock, inventory or undergoing processing or treatment but not yet sold). It is a term used in many mineral‐interest agreements to identify petroleum produced from reserves in a lease or license that is sold rather than: 1) still in the reservoir; 2) in inventory or stock; 3) undergoing processing; 4) derived from other leases or licences; or 5) consumed to fuel petroleum production and processing operations.
Preliminary Report on Fiscal Designs for the Development of Alaska Natural Gas David Wood November 2008
121

Oil & Gas Market Realities and Economic Rent Because economic rent is the difference between the value of a publicly owned resource and the cost of supply of that resource to consumers, including an allowance for a “reasonable” rate of return on investment, it focuses attention on what should be a “reasonable” rate of return. To make a human analogy: A professional sportsperson may be paid $XXX to appear when they may be willing to participate for only $X dollars above the costs of transport and subsistence incurred in reaching the venue. That sportsperson’s economic rent is $XXX minus $X. The problem is that the value of $X varies from person to person and venue to venue. In a global oil or gas market with “perfect competition and unlimited resources” (a world imagined by economists but, of course, far removed from the oil and gas markets of the real world), there should in theory be no economic rents, as more and more companies should enter a market and compete until commodity prices fall, taxation levels increase and all economic rent is eliminated. In such an imaginary market, reducing economic rent does not change investment or production decisions, so any residual economic rent (assuming it can be accurately identified as such) can be taxed without any adverse impact on the commodity market. The oil and gas industry has the complications of finite resources; unevenly distributed, fluctuating supply and demand in the markets; variable geopolitical and other risks; and competition from other industries for finite financial resources. These factors make the real world quite different from the imaginary world often contemplated in theory. In practice it is not usually economic rent that is the indicator used by governments or producers to formulate or assess fiscal design, because of the complication of specifying a “reasonable return on investment” for each project (or the whole industry) operating within their jurisdiction at a given time, and forecasting and adjusting that reasonable return in response to evolving market conditions and industry risks. However, the concept of economic rent is useful in identifying what is available for taxation from a resource project, recognising that producers need to achieve a certain level of returns adjusted for risk before they would be prepared to invest in such projects. Thus a reasonable return, after adjustment for risk, should be higher for more speculative projects (e.g. exploration and appraisal projects) than for those resources already discovered (e.g. development and production projects). The upstream oil and gas industry uses division of revenues and division of “profits” for specific project assessment, negotiation and formulation of fiscal designs in practice, rather than division of economic rent. It leaves considerations of economic rent to more general market economic analysis. “Profits” are usually determined as total project revenues less total costs. Total costs consist of capital expenditures (capex) plus operating expenditures (opex) plus, depending upon the point of sale of the product, some or all of transportation and processing costs to get the product to the market. Various terms are used to describe the divisible profit component which as defined equates to net project (pre‐tax) cash flow (i.e. cash flows to a company excluding all fiscal elements). Some use the term “income” to describe this, but that term is avoided here as it has specific meanings in accounting principles that distinguish it from
Preliminary Report on Fiscal Designs for the Development of Alaska Natural Gas David Wood November 2008
122

the cash‐flow concept of profit. Note the term “divisible profits” used here differs from “taxable profits” in that “taxable profit” has some (e.g. royalty) but not all fiscal take elements removed. Measurements of Government Take and Company Take The fractions or percentages of divisible profits accruing to government, on the one hand, and operating company and its joint‐venture partners (if any) on the other are usually referred to as “government take” and “company take.” Together they should sum to 100 percent. Care should be taken to ensure what the percentage “takes” are actually based upon. Governments often like to refer to takes of project revenue or Destination Value, as on that basis it makes the shares accruing to the government appear smaller than if it were to refer to divisible profit. It is the profit take that is most useful for fiscal design purposes, and this is illustrated in Figure 2.4.3. Government take (%) = 100 * [total project funds accruing to government/total project divisible profits] Company take (%) = 100 * [total post‐tax project funds accruing to company and its joint venture partners (if any)/total project divisible profits] Much industry discussion, comparison and presentation of fiscal systems is conducted in terms of government and company takes of divisible profits in percentage terms on an undiscounted basis. This is however only providing part of the required information toward understanding the true value of each take. Undiscounted percentage values fail to consider the timing (specifically time‐value) or risks associated with the cash‐flow components. Timing is crucial for most upstream oil and gas projects as most investments and risks taken are made early in the project cycle with the company taking a disproportionately large share of each. On the other hand most revenues come later and are spread often over many decades and are associated with a narrower range of risks and the government take is usually dominated by components derived from revenues. For such reasons it is instructive to consider takes not only in undiscounted percentage terms, but also in terms of discounted cash‐flow values (at a range of discount rates applicable to both companies and governments to adjust for the time‐value of money) and also adjusted for risk (i.e., risk factors applied separately of discount rates) and on an unrisked basis. Discounted cash flows are most commonly presented as net present values (NPV) either in absolute terms or in unit volume or energy terms (i.e., $ millions, $/barrel, $/mmbtu, $/boe). In high‐cost projects the ratio NPV divided by discounted capital investment (NPV/I) also provides insight to capital efficiency considerations. Hence, in fiscal design analysis it is important to consider takes in a range of percentage, absolute value and discounted and unit‐value terms. However, it is recognized that superficial analysts, the media and public opinion, all tend to focus almost exclusively on the undiscounted percentage take values, often without distinguishing whether the takes refer to revenue or profit takes. For this reason Figure 2.4.5
Preliminary Report on Fiscal Designs for the Development of Alaska Natural Gas David Wood November 2008
123

illustrates the wide range of undiscounted revenue and profit takes that exist in petroleum contracts around the world. Figure 2.4.3 Components and “takes” of revenues and profits on an undiscounted and discounted basis. Note that governments may participate to some degree in the risk and development capital components through investment credits (e.g. Alaska), but the major components of fiscal take for most governments come from divisible profits. The “increasing contribution to government take” label to the upper left‐hand arrow refers to government cash flow coming mainly from the upper box, whereas company cash flow is influenced much more significantly by all of the boxes. Hence companies achieve lower “takes” when the components are discounted at higher discount rates. The company or IOC take of profits is more complex than take of revenue or destination value because it may vary depending upon field size and the interaction of actual prices and costs with the fiscal elements. Whilst it is possible to generalize that some of the toughest fiscal takes (from the IOC’s perspective) are associated with production‐sharing agreements (PSAs) and are applied in countries which also hold the most prospective petroleum provinces (i.e. highest potential for large yet‐to‐find or develop reserves), this is by no means a universal rule. There is much overlap in the fiscal take in mineral‐interest and PSA fiscal systems in terms of the takes they yield, the prospectivity levels where they are applied and irrespective of whether the products are mainly oil or gas. Regressive taxation elements, poor cost recovery mechanisms and large government back‐ins to take equity shares in the IOC’s position are most
Preliminary Report on Fiscal Designs for the Development of Alaska Natural Gas David Wood November 2008
124

likely to be associated with fiscal systems that yield the lowest IOC take of profits for any specific IOC take of project revenue. Government Take of Revenues National & International Comparisons Many studies over the past decade have been published making comparisons of upstream fiscal systems by country or region based upon the single statistic “government take” in percentage terms (usually that refers to take of revenue, but in some cases that is not clear), expressed either as a single number or as a range based upon variable price and field sizes evaluated. These studies often fail to provide much analysis of the fiscal designs of the systems compared, implying that “government take” is all that is required to draw meaningful conclusions. This author is not a believer in this approach. Government take of revenues provides useful information and broadly classifies countries into those with harsh, average or lenient overall fiscal burdens, but on its own does not provide enough information to make a judgment that one country’s fiscal system is better or worse than another country’s from either a government’s view or an IOC’s view. Detailed discounted cash‐flow calculations accompanied by detailed profit‐take indicators derived from wide‐ranging sensitivity and scenario analysis is required to evaluate the benefits and shortcomings of fiscal terms before more meaningful comparisons can be made. However, take comparisons are widely used and referenced and are a useful first‐pass discriminator. They are therefore considered at this point before embarking on more detailed analysis. It is appreciated that any single‐point government take calculation depends upon price, cost, reserves and reservoir performance assumptions used by a particular study. The range of values presented in various studies to some extent reflects the various assumptions made by each study. One of the most recent compilations of government takes, which compares take values from several sources published over the past 15 years, is the United States Government Accountability Office (GAO) Report Ref: GAO‐07‐676R Oil and Gas Royalties May 2007. That study includes information from the GAO analysis of data presented to the Alaska State Legislature in 2006 and broadens that information to include additional sources from a wider range of countries. The information provided in the GAO study is reformatted and regrouped in the following tables to provide a compilation and comparison of government‐take studies conducted in recent years. Figure 2.4.4 compares the government takes of revenues in various North American regions and indicates that in most studies Alaska has a higher government take than other US and Canadian regions. Figure 2.4.5 compares the government takes of revenues for several other countries around the world, from the same 2006 presentations compiled by GAO in Figure 2.4.5. Figure 2.4.6 compares the government takes of revenues for countries offering some of the lowest government takes around the world (i.e. < 51%).
Preliminary Report on Fiscal Designs for the Development of Alaska Natural Gas David Wood November 2008
125
Figure 2.4.7 compares the government takes of revenues for countries offering modest government takes around the world (i.e. 51% to 68%). Figure 2.4.8 compares the government takes of revenues for countries offering average to harsh government takes around the world (i.e.69% to 83%). Figure 2.4.9 compares the government takes of revenues for countries offering the harshest government takes around the world (i.e. >83%). Data in all these figures comes from the GAO 2007 study referenced above compiled from a range of reports completed at various dates between 1994 and 2006. In several of the countries changes have been made to the fiscal systems since 2004, which are not included in this analysis. The tables should be viewed as a recent historical comparison to fiscal performance, not a definitive up‐to‐date analysis. Many of the countries referenced have changed some of their fiscal terms since the studies on which these charts are based were conducted. They do however provide useful insight for the following reasons: 1) there are operating contracts/licenses that are still producing under the referenced terms in most countries even where fiscal amendments have been introduced for newer licenses; 2) the GAO study is a relatively recent compilation, and it provides a useful guide to illustrate the range of government takes that exist around the world.
Preliminary Report on Fiscal Designs for the Development of Alaska Natural Gas David Wood November 2008
126
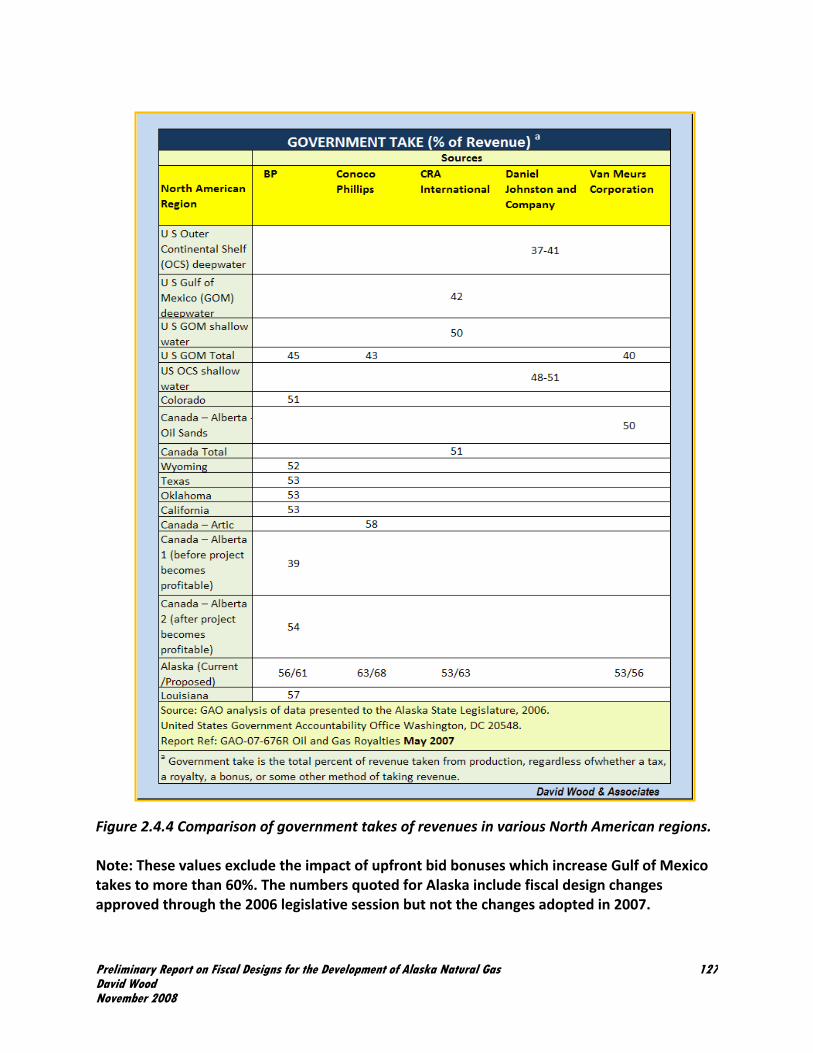
Figure 2.4.4 Comparison of government takes of revenues in various North American regions. Note: These values exclude the impact of upfront bid bonuses which increase Gulf of Mexico takes to more than 60%. The numbers quoted for Alaska include fiscal design changes approved through the 2006 legislative session but not the changes adopted in 2007.
Preliminary Report on Fiscal Designs for the Development of Alaska Natural Gas David Wood November 2008
127
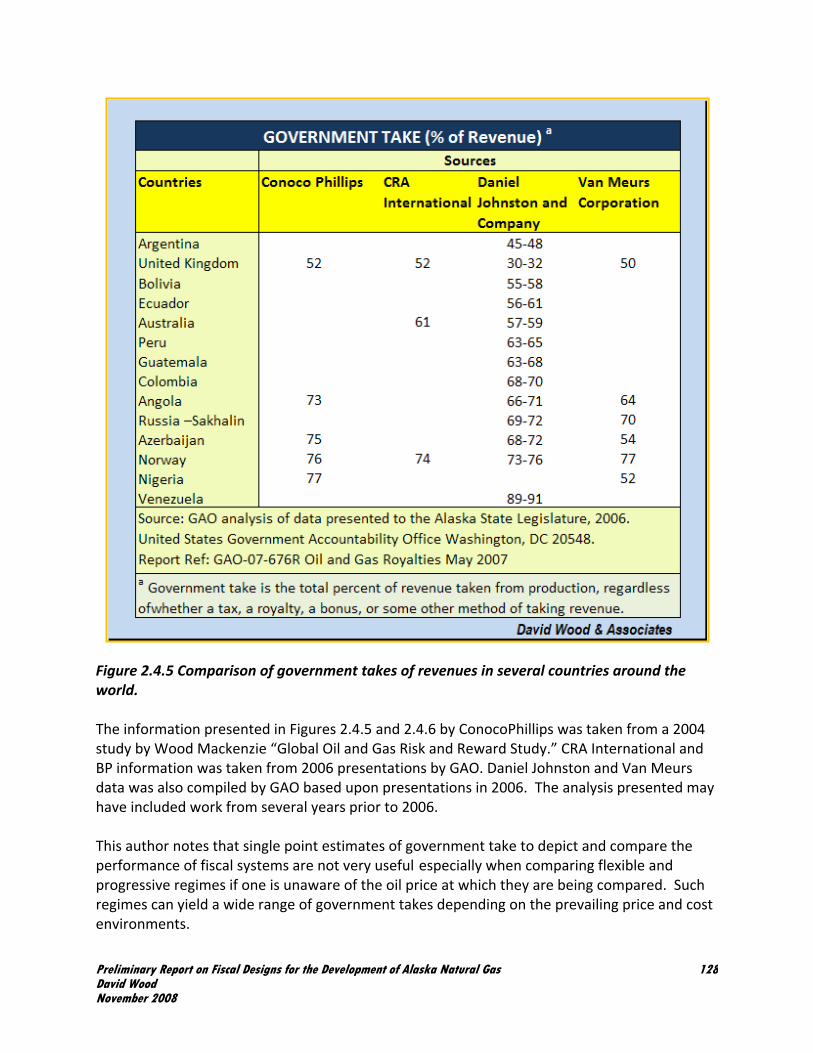
Figure 2.4.5 Comparison of government takes of revenues in several countries around the world. The information presented in Figures 2.4.5 and 2.4.6 by ConocoPhillips was taken from a 2004 study by Wood Mackenzie “Global Oil and Gas Risk and Reward Study.” CRA International and BP information was taken from 2006 presentations by GAO. Daniel Johnston and Van Meurs data was also compiled by GAO based upon presentations in 2006. The analysis presented may have included work from several years prior to 2006. This author notes that single point estimates of government take to depict and compare the performance of fiscal systems are not very useful especially when comparing flexible and progressive regimes if one is unaware of the oil price at which they are being compared. Such regimes can yield a wide range of government takes depending on the prevailing price and cost environments.
Preliminary Report on Fiscal Designs for the Development of Alaska Natural Gas David Wood November 2008
128
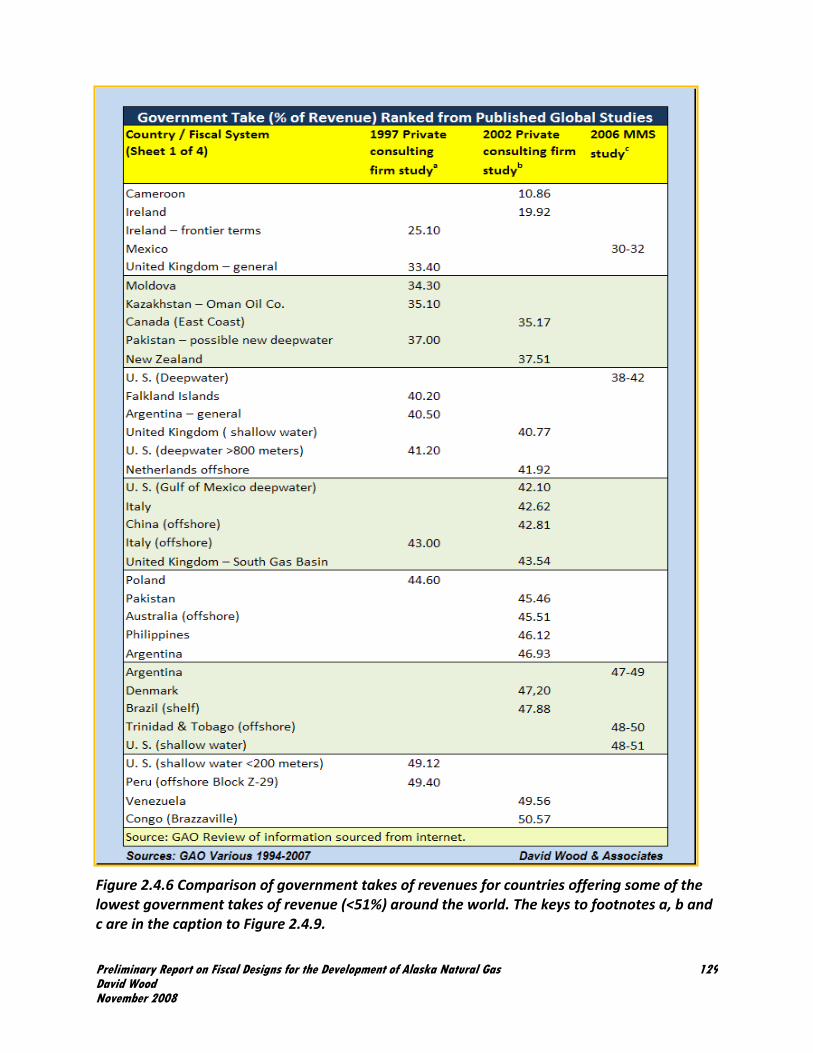
Figure 2.4.6 Comparison of government takes of revenues for countries offering some of the lowest government takes of revenue (<51%) around the world. The keys to footnotes a, b and c are in the caption to Figure 2.4.9.
Preliminary Report on Fiscal Designs for the Development of Alaska Natural Gas David Wood November 2008
129

Figure 2.4.7 Comparison of government takes of revenues for countries offering modest government takes of revenue (i.e. 51% to 68%) around the world. The keys to footnotes a, b and c are in the caption to Figure 2.4.9.
Preliminary Report on Fiscal Designs for the Development of Alaska Natural Gas David Wood November 2008
130

Figure 2.4.8 Comparison of government takes of revenues for countries offering average to harsh government takes of revenue (i.e. 68% to ~83%) around the world. The keys to footnotes a, b and c are in the caption to Figure 2.4.9.
Preliminary Report on Fiscal Designs for the Development of Alaska Natural Gas David Wood November 2008
131
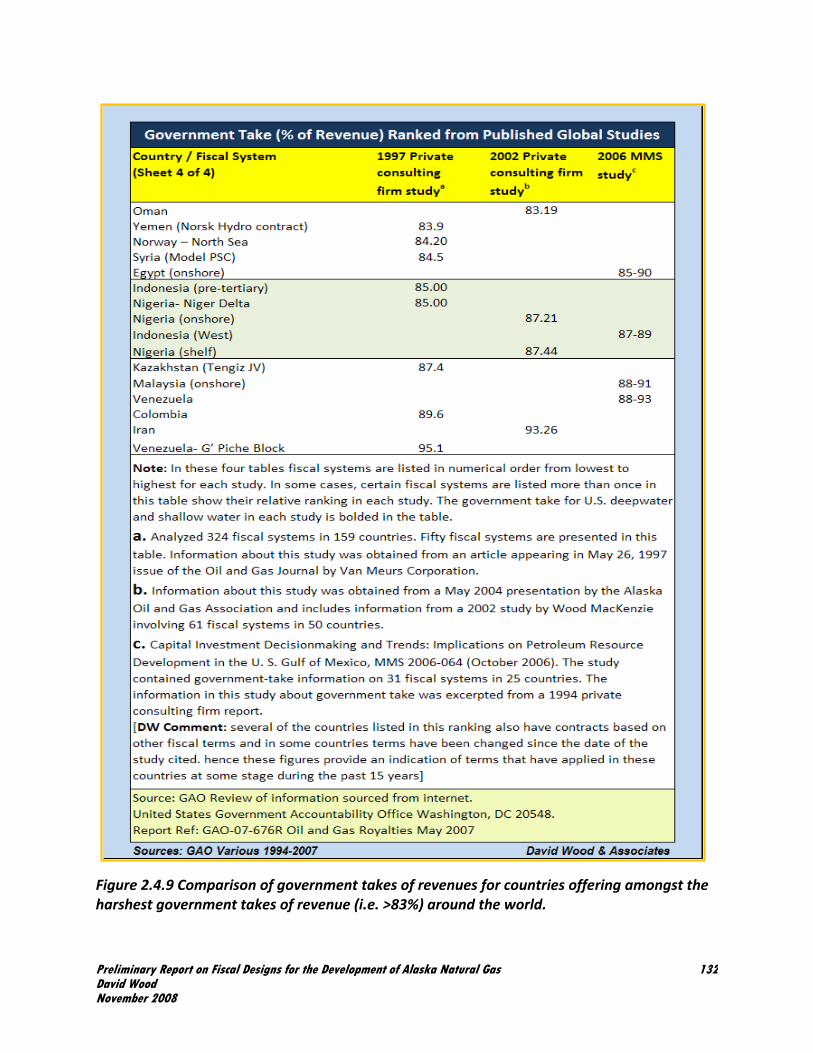
Figure 2.4.9 Comparison of government takes of revenues for countries offering amongst the harshest government takes of revenue (i.e. >83%) around the world.
Preliminary Report on Fiscal Designs for the Development of Alaska Natural Gas David Wood November 2008
132
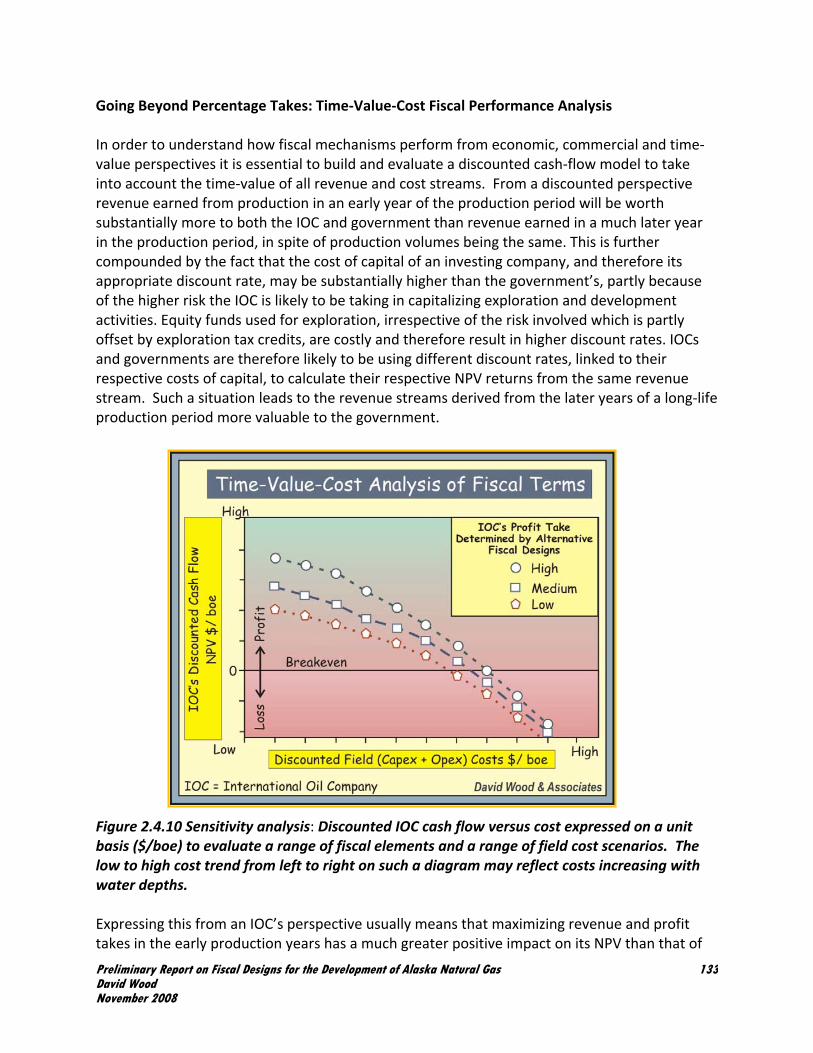
Going Beyond Percentage Takes: Time‐Value‐Cost Fiscal Performance Analysis In order to understand how fiscal mechanisms perform from economic, commercial and time‐value perspectives it is essential to build and evaluate a discounted cash‐flow model to take into account the time‐value of all revenue and cost streams. From a discounted perspective revenue earned from production in an early year of the production period will be worth substantially more to both the IOC and government than revenue earned in a much later year in the production period, in spite of production volumes being the same. This is further compounded by the fact that the cost of capital of an investing company, and therefore its appropriate discount rate, may be substantially higher than the government’s, partly because of the higher risk the IOC is likely to be taking in capitalizing exploration and development activities. Equity funds used for exploration, irrespective of the risk involved which is partly offset by exploration tax credits, are costly and therefore result in higher discount rates. IOCs and governments are therefore likely to be using different discount rates, linked to their respective costs of capital, to calculate their respective NPV returns from the same revenue stream. Such a situation leads to the revenue streams derived from the later years of a long‐life production period more valuable to the government. Figure 2.4.10 Sensitivity analysis: Discounted IOC cash flow versus cost expressed on a unit basis ($/boe) to evaluate a range of fiscal elements and a range of field cost scenarios. The low to high cost trend from left to right on such a diagram may reflect costs increasing with water depths. Expressing this from an IOC’s perspective usually means that maximizing revenue and profit takes in the early production years has a much greater positive impact on its NPV than that of
Preliminary Report on Fiscal Designs for the Development of Alaska Natural Gas David Wood November 2008
133
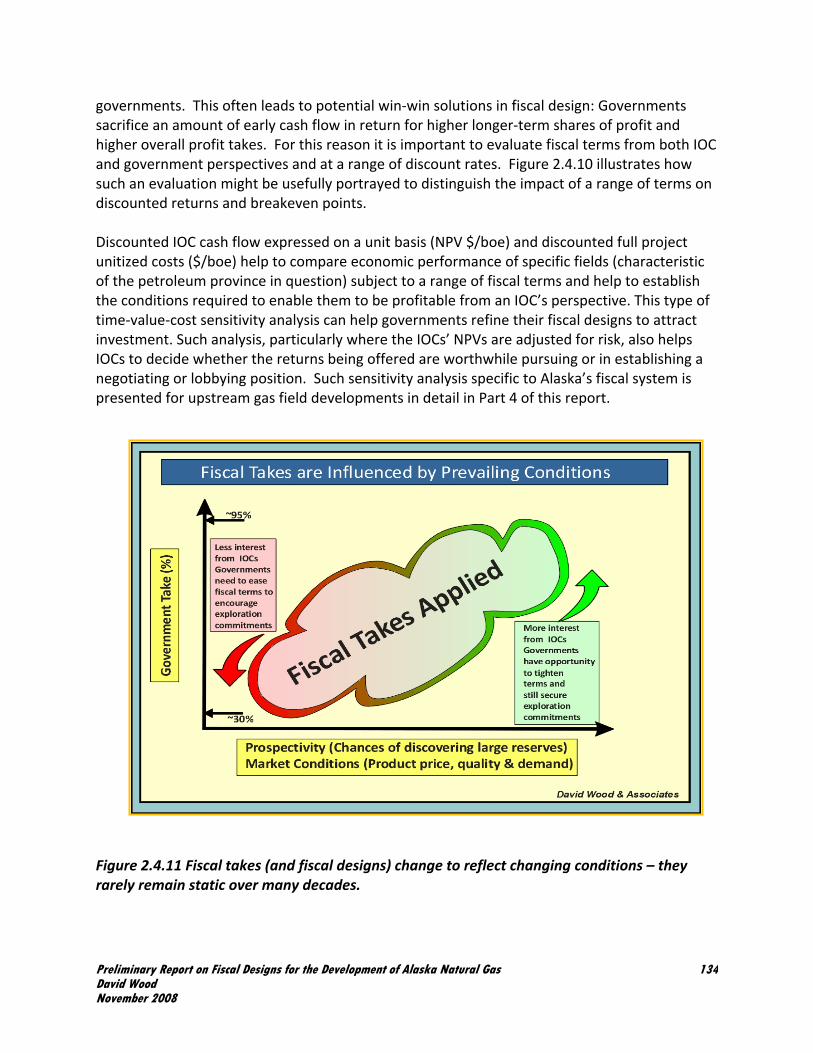
governments. This often leads to potential win‐win solutions in fiscal design: Governments sacrifice an amount of early cash flow in return for higher longer‐term shares of profit and higher overall profit takes. For this reason it is important to evaluate fiscal terms from both IOC and government perspectives and at a range of discount rates. Figure 2.4.10 illustrates how such an evaluation might be usefully portrayed to distinguish the impact of a range of terms on discounted returns and breakeven points. Discounted IOC cash flow expressed on a unit basis (NPV $/boe) and discounted full project unitized costs ($/boe) help to compare economic performance of specific fields (characteristic of the petroleum province in question) subject to a range of fiscal terms and help to establish the conditions required to enable them to be profitable from an IOC’s perspective. This type of time‐value‐cost sensitivity analysis can help governments refine their fiscal designs to attract investment. Such analysis, particularly where the IOCs’ NPVs are adjusted for risk, also helps IOCs to decide whether the returns being offered are worthwhile pursuing or in establishing a negotiating or lobbying position. Such sensitivity analysis specific to Alaska’s fiscal system is presented for upstream gas field developments in detail in Part 4 of this report. Figure 2.4.11 Fiscal takes (and fiscal designs) change to reflect changing conditions – they rarely remain static over many decades.
Preliminary Report on Fiscal Designs for the Development of Alaska Natural Gas David Wood November 2008
134
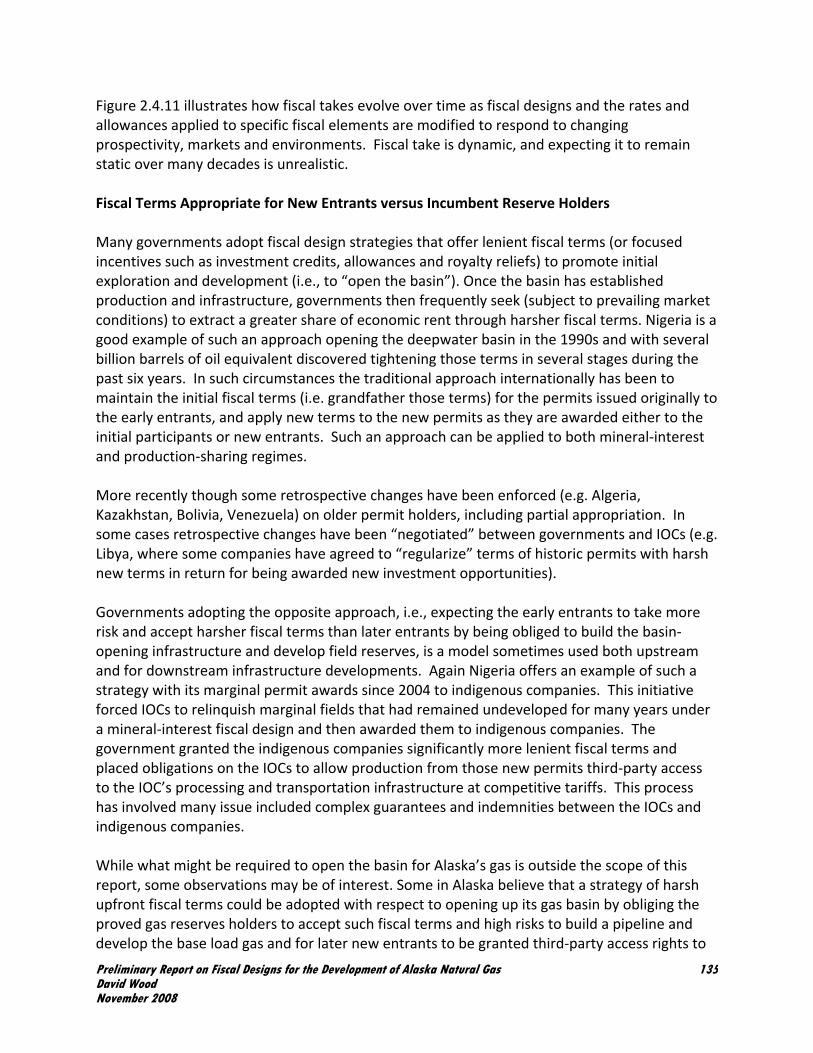
Figure 2.4.11 illustrates how fiscal takes evolve over time as fiscal designs and the rates and allowances applied to specific fiscal elements are modified to respond to changing prospectivity, markets and environments. Fiscal take is dynamic, and expecting it to remain static over many decades is unrealistic. Fiscal Terms Appropriate for New Entrants versus Incumbent Reserve Holders Many governments adopt fiscal design strategies that offer lenient fiscal terms (or focused incentives such as investment credits, allowances and royalty reliefs) to promote initial exploration and development (i.e., to “open the basin”). Once the basin has established production and infrastructure, governments then frequently seek (subject to prevailing market conditions) to extract a greater share of economic rent through harsher fiscal terms. Nigeria is a good example of such an approach opening the deepwater basin in the 1990s and with several billion barrels of oil equivalent discovered tightening those terms in several stages during the past six years. In such circumstances the traditional approach internationally has been to maintain the initial fiscal terms (i.e. grandfather those terms) for the permits issued originally to the early entrants, and apply new terms to the new permits as they are awarded either to the initial participants or new entrants. Such an approach can be applied to both mineral‐interest and production‐sharing regimes. More recently though some retrospective changes have been enforced (e.g. Algeria, Kazakhstan, Bolivia, Venezuela) on older permit holders, including partial appropriation. In some cases retrospective changes have been “negotiated” between governments and IOCs (e.g. Libya, where some companies have agreed to “regularize” terms of historic permits with harsh new terms in return for being awarded new investment opportunities). Governments adopting the opposite approach, i.e., expecting the early entrants to take more risk and accept harsher fiscal terms than later entrants by being obliged to build the basin‐opening infrastructure and develop field reserves, is a model sometimes used both upstream and for downstream infrastructure developments. Again Nigeria offers an example of such a strategy with its marginal permit awards since 2004 to indigenous companies. This initiative forced IOCs to relinquish marginal fields that had remained undeveloped for many years under a mineral‐interest fiscal design and then awarded them to indigenous companies. The government granted the indigenous companies significantly more lenient fiscal terms and placed obligations on the IOCs to allow production from those new permits third‐party access to the IOC’s processing and transportation infrastructure at competitive tariffs. This process has involved many issue included complex guarantees and indemnities between the IOCs and indigenous companies. While what might be required to open the basin for Alaska’s gas is outside the scope of this report, some observations may be of interest. Some in Alaska believe that a strategy of harsh upfront fiscal terms could be adopted with respect to opening up its gas basin by obliging the proved gas reserves holders to accept such fiscal terms and high risks to build a pipeline and develop the base load gas and for later new entrants to be granted third‐party access rights to
Preliminary Report on Fiscal Designs for the Development of Alaska Natural Gas David Wood November 2008
135

that infrastructure at preferential terms. Some suggest that existing gas reserve holders should be willing to underwrite and sponsor investment in construction of a gas pipeline to the Lower 48 to open the gas basin; and, if other producers or new entrants make future discoveries of gas and wish to transit it through the gas pipeline to market, the initial pipeline sponsors should provide third‐party access on favourable terms. This could mean that the initial sponsors become obliged to help pay for a portion of any infrastructure capacity expansion and the new third‐party producer would not billed for that incremental capital cost other than through a specified tariff. Because the gas reserves holders will be opening up huge revenue opportunities by monetizing tens of tcf of natural gas and generating huge long‐term profits for themselves and the state, it may be possible to persuade them to accept such an approach. There are international precedents for this. In Qatar, for example, major IOC’s have agreed to harsh fiscal terms for access to large proved gas reserves and agreed to build substantial infrastructure (tens of billions of dollars of capital investment) accepting that after some 25 years ownership of that infrastructure and any residual reserves will vest to the national company.
Preliminary Report on Fiscal Designs for the Development of Alaska Natural Gas David Wood November 2008
136
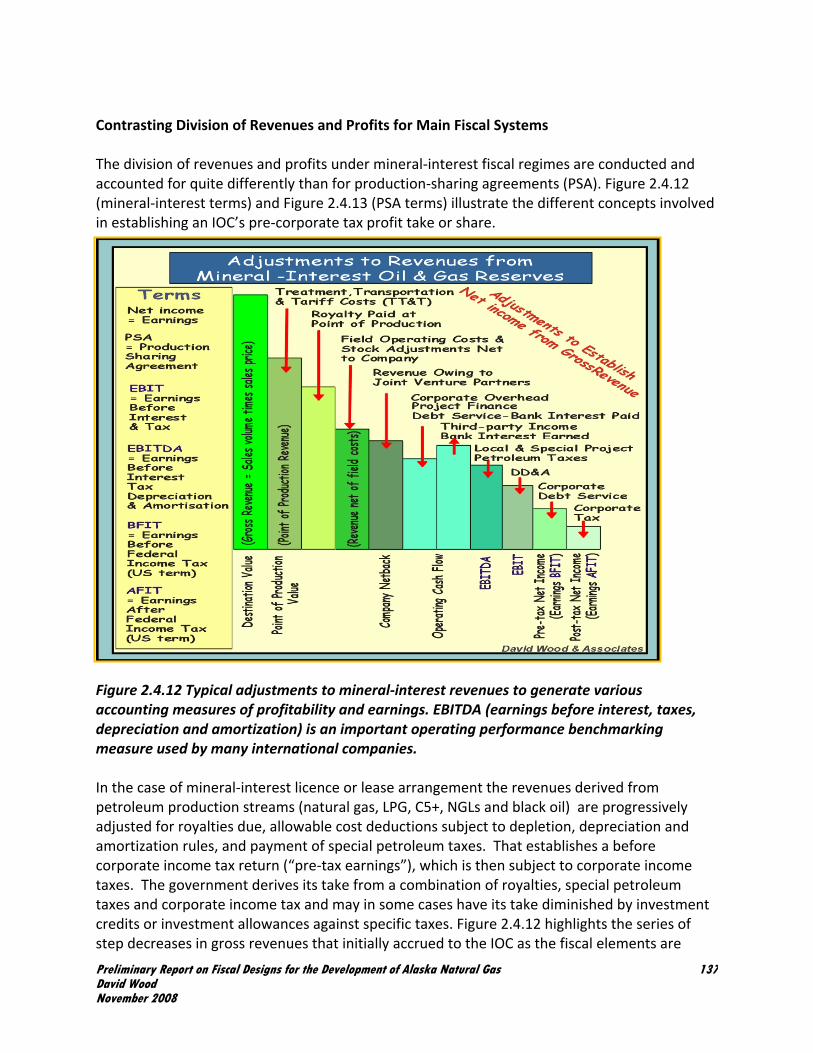
Contrasting Division of Revenues and Profits for Main Fiscal Systems The division of revenues and profits under mineral‐interest fiscal regimes are conducted and accounted for quite differently than for production‐sharing agreements (PSA). Figure 2.4.12 (mineral‐interest terms) and Figure 2.4.13 (PSA terms) illustrate the different concepts involved in establishing an IOC’s pre‐corporate tax profit take or share. Figure 2.4.12 Typical adjustments to mineral‐interest revenues to generate various accounting measures of profitability and earnings. EBITDA (earnings before interest, taxes, depreciation and amortization) is an important operating performance benchmarking measure used by many international companies. In the case of mineral‐interest licence or lease arrangement the revenues derived from petroleum production streams (natural gas, LPG, C5+, NGLs and black oil) are progressively adjusted for royalties due, allowable cost deductions subject to depletion, depreciation and amortization rules, and payment of special petroleum taxes. That establishes a before corporate income tax return (“pre‐tax earnings”), which is then subject to corporate income taxes. The government derives its take from a combination of royalties, special petroleum taxes and corporate income tax and may in some cases have its take diminished by investment credits or investment allowances against specific taxes. Figure 2.4.12 highlights the series of step decreases in gross revenues that initially accrued to the IOC as the fiscal elements are
Preliminary Report on Fiscal Designs for the Development of Alaska Natural Gas David Wood November 2008
137
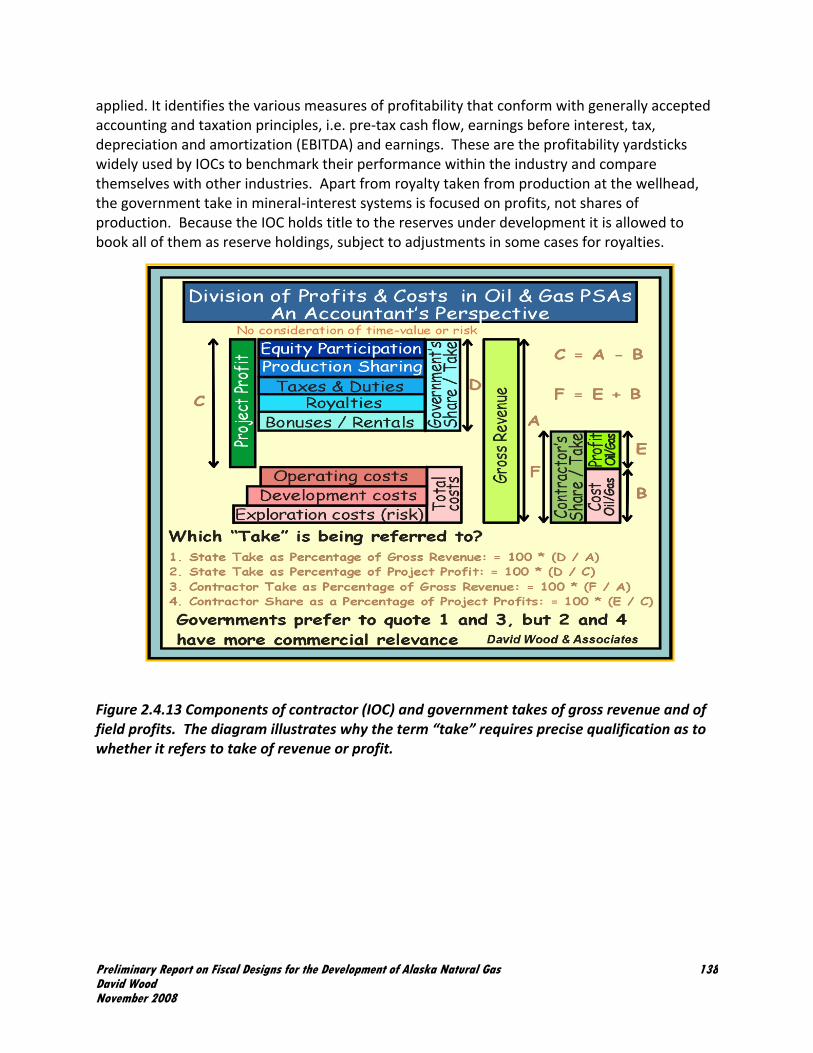
applied. It identifies the various measures of profitability that conform with generally accepted accounting and taxation principles, i.e. pre‐tax cash flow, earnings before interest, tax, depreciation and amortization (EBITDA) and earnings. These are the profitability yardsticks widely used by IOCs to benchmark their performance within the industry and compare themselves with other industries. Apart from royalty taken from production at the wellhead, the government take in mineral‐interest systems is focused on profits, not shares of production. Because the IOC holds title to the reserves under development it is allowed to book all of them as reserve holdings, subject to adjustments in some cases for royalties. Figure 2.4.13 Components of contractor (IOC) and government takes of gross revenue and of field profits. The diagram illustrates why the term “take” requires precise qualification as to whether it refers to take of revenue or profit.
Preliminary Report on Fiscal Designs for the Development of Alaska Natural Gas David Wood November 2008
138

Figure 2.4.14 Flow diagram of fiscal mechanism and take components in a PSA. The procedure under PSAs is quite different with the IOC’s revenue stream comprised in most cases of a cost‐recovery component (cost oil or cost gas) and a profit‐sharing component (profit oil or profit gas). Figure 2.4.13 illustrates the key financial and fiscal elements of PSAs from an accounting perspective. The fiscal mechanisms of PSAs determine which party gets which share
Preliminary Report on Fiscal Designs for the Development of Alaska Natural Gas David Wood November 2008
139

of production. The PSA is a contract usually between a joint venture of companies on the one hand, referred to as “the contractor,” and the government as the other party. The contractor usually involves a joint venture of IOCs, but frequently also involves a national oil company (NOC) with a carried interest through exploration and/or with a back‐in right to take an equity stake in the contractor’s contractual position (commonly ranging between 10% and a little more than 50%). Hence the term contractor is often not synonymous with IOC and their revenue and profit shares frequently need to be distinguished. Under a PSA the government may take its share of revenues not only from its share of production, but also from royalties, bonuses, taxes and often from an optional equity share in the contractor’s share, sometimes in the form of a back‐in once development risk has been removed and when it has revenue available to pay back its share of equity costs. The terms of the government back‐ins vary, but can have substantial impacts on both profit takes and long‐term project decision‐making and control. Models to analyse fiscal performance of PSAs therefore need to be constructed carefully to model both contractor take (including NOC’s equity share) and IOC take (excluding NOC’s equity share). It helps to illustrate the flow of funds to contractor, IOC and government for a PSA fiscal system, which varies from contract to contract with certain elements sometimes negotiable and others enshrined in a hydrocarbon law. Such a sheet is shown in Figure 2.4.14 and identifies how and in what sequence the actual rates for each fiscal element and contractor and IOC shares are extracted from the production revenue. It also highlights how both the cost‐recovery allocation and the cost‐depreciation rules work together to determine how quickly or slowly costs are recovered under a particular fiscal design. Although providing an accountant’s view of the fiscal design mechanism, it is essential for economic analytical and negotiation purposes to develop the logic of such a fund’s flow diagram into a quantified spreadsheet. Relevance of Production‐Sharing Contracts to Alaska A significant portion of the world’s natural gas production and reserves are held under production‐sharing agreements and all the major IOCs, including those holding major gas reserves in Alaska, are involved in producing gas from such agreements. Many nations competing with Alaska for investment from the same IOCs in gas field and infrastructure (pipelines and LNG) developments operate PSAs and mineral‐interest fiscal designs. Many of those nations, some with high political risk profiles and remote locations, have secured multibillion‐dollar investments in recent years from IOCs. Alaska has yet to do so and needs to reflect upon why IOCs continue to be so willing to invest internationally in areas offering both mineral‐interest and PSA designs for major gas infrastructure and reserves development projects. As is the case for most mineral‐interest fiscal designs, PSAs are structured to cater for both gas and oil (C5+) production. It is highly unlikely that the PSA fiscal design will be adopted in the U.S. or other OECD countries because that design is geared to promoting time‐limited capital investment without granting the producers title to reserves. Nevertheless there are many fiscal
Preliminary Report on Fiscal Designs for the Development of Alaska Natural Gas David Wood November 2008
140

instruments applied to PSAs that are also, or could be, applied to mineral‐interest contracts to enhance fiscal performance; and, therefore fiscal systems governed by PSA should not be disregarded as providing useful insight to how fiscal designs might be tailored to optimize government take and to what fiscal designs IOCs have been prepared to accept in other parts of the world. To ignore PSAs, or to disregard them as irrelevant to Alaska, even though they are unlikely to be adopted as a workable design, would be short‐sighted. Several of the fiscal designs considered in detail in Section 2.5 and Appendix 3 involve PSA designs, yet they provide useful insight into how large‐scale, long‐term investments and mutually beneficial relationships can be established between governments and IOCs. The reader is urged to look not only at the OECD countries reviewed in Section 2.5 (e.g. U.S., Canada, Norway, UK and Australia), but also at the fiscal designs of those developing countries, both PSAs and mineral‐interest designs. There is much that is relevant to Alaska in the fiscal designs of all of the countries reviewed, regardless of whether they are operating mineral‐interest or PSA fiscal designs. Risk Taking in Petroleum Projects and Their Impact on Perceived Value Figure 2.4.15 Spectrum of risks and uncertainties affecting oil and gas assets and projects [Wood et al., World Oil September, 2007]. Thus far allocation of costs, division of revenues and profits and interaction of the fiscal elements of a specific fiscal design has been considered as essentially an accounting exercise. In practice it is not only complicated by timing issues, which can be addressed, at least in part, by discounting adjustments, but also by risks which in almost all upstream petroleum projects are borne disproportionately by the IOCs, particularly in the exploration, appraisal and field development stages. The IOCs are consequently exposed to a wide spectrum of risks and uncertainties (Figure 2.4.15) which need to be considered and evaluated holistically in terms of
Preliminary Report on Fiscal Designs for the Development of Alaska Natural Gas David Wood November 2008
141

their potential impact on the value of the project to the IOC. Most IOCs use risk‐adjusted NPVs in their decision‐making process. Uncertainty also brings potential upside, so adjustments for uncertainty are not usually all negative. Simulation analysis of risk‐weighted scenarios help to establish a range of likely project outcomes and values and it is that range that is most often used to influence IOC decisions. On the other hand the range of risks to which governments are exposed, in terms of risking loss on funds invested, are more limited and mainly associated with market risks (volatile prices responding to demand and supply imbalances) that will influence its revenue stream and regional political and geopolitical instability. However, losses and delays to projects caused by accidents, poor contractor performance, and community disturbance also pose uncertainties to the magnitude and timing of government revenues. Those governments that take an equity share in field developments or infrastructure projects take more direct risk and financial exposure in specific projects. Also those governments providing investment credits are exposed to those investments failing to ultimately deliver revenues. So government takes are by no means risk‐free, but they are exposed to the consequences of uncertainty and financial exposure to a lesser degree than IOCs. Each IOC individually has to provide substantial amounts of risk capital in the exploration and appraisal phases of a project and expect a premium on their potential returns as a reward for taking such high levels of risk. Figure 2.4.16 Fiscal design in the upstream oil and gas industry is intimately associated with risk‐versus‐reward assessments and trade‐offs.
Preliminary Report on Fiscal Designs for the Development of Alaska Natural Gas David Wood November 2008
142

On the other hand not only are governments not taking such financial exposure, a number (but not all) of their risks are reduced by being diversified across a large number of projects and companies. For example, an accident or security incident may cause loss of production from one project facility for a period of time, but production from other projects means that the government may have a lower relative impact to its overall revenue from such an incident than the IOC suffering the incident. Of course, if the incident impacts strategic infrastructure on which all production is dependent (e.g. a single pipeline out of the basin) then the government (and collectively all other companies with production interests) may suffer a greater relative impact to its revenue stream than any individual company. Division of risk between IOCs and governments is therefore complex and will vary from country to country with unique uncertainties impacting specific petroleum provinces. What is clear, however, is that with respect to a number of uncertainties both IOC and governments suffer potential exposure to loss and gain. It is thus not possible to divide all risk exposure neatly between government and IOCs. Unlike financial values which accumulate on a near linear basis, risk is very non‐linear in its behaviour and impacts. Both IOCs and governments benefit from diversification across a number of projects and facilities to minimize the potential negative impacts of many risks. However, market (e.g. collapse in global natural gas demand or over‐supply of natural gas), political and community risks cannot all be substantially reduced through project and infrastructure diversification. Just as IOCs and governments need to use different discount factors to correct for time‐value discrepancies, they also need to apply different risk adjustment factors reflecting the differences in their risk exposures (Figure 2.4.16).
Preliminary Report on Fiscal Designs for the Development of Alaska Natural Gas David Wood November 2008
143
Related Documents