Preliminary Draft

Welcome message from author
This document is posted to help you gain knowledge. Please leave a comment to let me know what you think about it! Share it to your friends and learn new things together.
Transcript
Preliminary Draft

i
Draft Environmental and Social Impact Assessment (ESIA) 2020
REVISION LOG
Prepared for
PT. PLN UIP JBT I
Document: ESIA-UCPS-2020
Revision Number: Rev.4 Issue Date: 25 February 2021
REVISION LOG
Reviewed by Approved by
<insert initial/paraf here>
<insert initial/paraf here>
< Insert Name & Position here>
PLN Project Manager
< Insert Name & Position here>
PLN Senior Manager
REVISION LOG
Version No. Date Revised by: Revised Section
Draft 4 26 February 2021 World Bank Review Team Entire document
ii
Draft Environmental and Social Impact Assessment (ESIA) 2020
PREFACE
iii
Draft Environmental and Social Impact Assessment (ESIA) 2020
LIST OF CONTENTS
REVISION LOG .............................................................................................................................................i
PREFACE ....................................................................................................................................................... ii
LIST OF CONTENTS .................................................................................................................................. iii
LIST OF TABLES.......................................................................................................................................... xi
LIST OF FIGURES .....................................................................................................................................xiv
ABBREVIATIONS ................................................................................................................................... xvii
EXECUTIVE SUMMARY ............................................................................................................................. 1
1. INTRODUCTION ............................................................................................................................ 2
2. DESCRIPTION OF THE PROJECT LOCATION AND COMPONENTS ................................. 4
2. .1 Purpose of the project......................................................................................................................... 6 2.2 History of project preparation including Bank involvement since 2009 .......................................... 7 2.3 UCPS Progress to Date ........................................................................................................................ 8 2.4 Environmental and Social Studies and Activities between 2011 and 2020 ESIA............................. 9
3. BASELINE ENVIRONMENTAL AND SOCIAL CONTEXT.................................................... 11
3.1 Climate ................................................................................................................................................ 11 3.2 Topography ......................................................................................................................................... 11 3.3 Terrestrial Land Cover and Biodiversity .......................................................................................... 12 3.4 River Hydrology and Biodiversity .................................................................................................... 14 3.5 Settlement and Social Context .......................................................................................................... 18
4. KEY RISKS, IMPACTS AND MITIGATION MEASURES ...................................................... 21
4.1 Changes to the river flow and habitat .............................................................................................. 21 4.2 Key risks and impacts on terrestrial biodiversity and mitigation measures ................................. 24 4.3 Climate change risk from greenhouse gas emissions ....................................................................... 25 4.4 Risks and mitigation of construction occupational health and safety .......................................... 27 4.5 Land Acquisition and Resettlement Impacts ................................................................................... 28 4.6 Construction worker management / influx management / community health and safety risks
(including Gender-Based Violence) ................................................................................................ 29 4.7 Livelihood changes in forest dependent communities ..................................................................... 30 4.8 Impact on Income Associated with Construction Activities .......................................................... 30 4.9 Community dissatisfaction and grievance mechanism. .................................................................. 30 4.10 Cultural heritage............................................................................................................................... 31 4.11 Dam Safety ........................................................................................................................................ 31 4.12 Social Benefits .................................................................................................................................. 32 4.13 Environmental and Social Assessment Studies and Management Plans to be Prepared ............ 32
5. ENVIRONMENTAL AND SOCIAL MANAGEMENT PLAN OUTLINE .............................. 34
CHAPTER 1. INTRODUCTION ................................................................................................................ 36
1.1 Overview of Hydropower and ESIA Report ........................................................................................... 36 1.2 Electricity System in Java-Bali .............................................................................................................. 38 1.3 UCPS Hydropower Plant and Its Functions in the Java-Bali Network ................................................... 40 1.4 Main Features of Hydropower ............................................................................................................... 41
iv
Draft Environmental and Social Impact Assessment (ESIA) 2020
1.5 Main Features of ESIA .......................................................................................................................... 42 1.5.1 Resettlement ................................................................................................................................. 42 1.5.2 Impact of construction activities on society ............................................................................... 43
1.6 Impact on biodiversity ........................................................................................................................... 43 1.6.1 Impact on the downstream environment ................................................................................... 43 1.6.2 Reservoir Security and Management of Community Safety ..................................................... 44 1.6.3 Socio-Economic Benefits .............................................................................................................. 44
1.7 Relationship to Programs and Other Documents.................................................................................... 45 1.7.1 Previous EIA and SIA documentation ....................................................................................... 45 1.7.2 Environmental and Social Report ............................................................................................... 45 1.7.3 Technical Investigation Design and Report ............................................................................... 46 1.7.4 Related Programs ......................................................................................................................... 46
CHAPTER 2. LEGAL AND INSTITUTIONAL FRAMEWORK ............................................................ 48
2.1 West Java Province Spatial Plan ............................................................................................................ 48 2.2 Protection and Management of The Environment .................................................................................. 49 2.3 Other related laws and regulations......................................................................................................... 51
2.3.1 Electricity Laws and Regulations................................................................................................ 52 2.3.2 Land Acquisition Legislation and Process ................................................................................. 52 2.3.3 Legislation concerning Village Treasury Land .......................................................................... 52 2.3.4 Settlement Laws and Regulations ............................................................................................... 54 2.3.5 Construction Activities Legislation ............................................................................................ 54 2.3.7 Employment and OHS Laws and Regulations .......................................................................... 55 2.3.8 Quarry Mining Regulations ........................................................................................................ 62 2.3.9 Borrowing and Use of Forest Areas Permit Legislation ............................................................ 62 2.3.10 Legislation concerning Utilization of Water Resources .......................................................... 63 2.3.11 Legislation concerning Extra High Voltage Transmission Lines ............................................ 63 2.3.12 Fulfillment of Endangered Wildlife and Biological Resources Protection ............................. 64 2.3.13 Legislations for the Protection of Children, Women and People with Disabilities ............... 65 2.3.14 Gender and Gender Based Violence ......................................................................................... 65 2.3.15 Legislations Related to Corporate Social Responsibility ......................................................... 67
2.4 International Commitments ................................................................................................................... 68
CHAPTER 3. WORLD BANK ENVIRONMENTAL SOCIAL FRAMEWORK (ESF) .......................... 71
3.1 ESS-1 Assessment and Management of Enviromental and Social Risks and Impact ................................ 71 3.2 ESS-2 Labor and Working Conditions ................................................................................................... 71 3.3 ESS-3 Resource Efficiency and Pollution Prevention and Management .................................................. 71 3.4 ESS-4 Community Health and Safety .................................................................................................... 71 3.5 ESS-5 Land Acquisition, Restrictions on Land Use and Involuntary Resettlement ................................. 72 3.6 ESS-6 Biodiversity Conservation and Sustainable Management of Living Natural Resources ................. 72 3.7 ESS-7: Indigenous Peoples, Historically Underserved, Traditional Local Communities .......................... 72 3.7 ESS-8 Cultural Heritage........................................................................................................................ 73 3.8 ESS-10 Stakeholder Engagement and Information Disclosure ................................................................ 73
CHAPTER 4. DESCRIPTION OF UCPS HYDROPOWER PLANT ....................................................... 74
4.1 Introduction and Background ................................................................................................................ 74 4.2 Location, Accessibility and Layout ......................................................................................................... 75 4.3 Design, Size and Capacity ..................................................................................................................... 77
4.3.1 Main Features of Hydropower Plant .......................................................................................... 77 4.3.2 Upper and Lower Dams and Reservoirs .................................................................................... 80
4.3.2.1 Pre-construction work in rivers ........................................................................................... 81 4.3.2.2 Dam construction ............................................................................................................... 82 4.3.2.3 Pre-construction works of reservoir areas and in rivers ................................................. 82 4.3.2.4 Preparation of the buffer area ........................................................................................... 82
v
Draft Environmental and Social Impact Assessment (ESIA) 2020
4.3.3 Tunnels and Power Plants .......................................................................................................... 83 4.3.4 Terminator Yard, Switchyard and Administration Building Cables ....................................... 83
4.3.5 Transmission Network........................................................................................................................ 83 4.3.5.1 Design .................................................................................................................................... 86 4.3.5.2 Transmission Line Construction .......................................................................................... 86
4.3.6 Access roads and temporary roads ............................................................................................ 89 4.4 Infrastructure Construction, Programs and Manpower Management .................................................... 91
4.4.1 Quarry .......................................................................................................................................... 91 4.4.2 Materials and Waste Management ............................................................................................. 92
4.4.4.1 Source of Materials ............................................................................................................... 92 4.4.4.2 Waste ..................................................................................................................................... 92
4.4.3 Slope stabilization ........................................................................................................................ 93 4.4.4 Worker's barracks/ basecamp, offices and additional work locations .................................... 93
4.4.4.1 PLN Project Office ................................................................................................................ 93 4.4.4.2 Main Contractor's barracks/ basecamp .............................................................................. 93 4.4.4.3 Upper Dam ........................................................................................................................... 93 4.4.4.4 Lower Dam ........................................................................................................................... 93
4.4.5 Water, Sanitation and Solid Waste ............................................................................................. 93 4.4.6 Electricity Supply......................................................................................................................... 94 4.4.7 Mobilization and traffic ............................................................................................................... 94 4.4.8 Construction time ........................................................................................................................ 94 4.4.9 Labor............................................................................................................................................. 94
4.5 Required Land ....................................................................................................................................... 95 4.6 Dam Inundation Process ....................................................................................................................... 95 4.7 Operations of the UCPS Hydropower Plant ........................................................................................... 96
4.7.1 Water requirements during Operations ..................................................................................... 97 4.7.2 Reservoir Access and Management ............................................................................................ 98 4.7.3 Reservoir Sedimentation ............................................................................................................. 99 4.7.4 Flood Emergency Operational Procedure ................................................................................ 101
4.7.4.1 Warning Methods ............................................................................................................... 101 4.7.4.2 Location of warning facilities/ devices ............................................................................. 101 4.7.4.3 Community Consultation .................................................................................................. 102
4.7.6 Electric Power Transmission Line ............................................................................................ 102
CHAPTER 5. ALTERNATIVES ANALYSIS .......................................................................................... 103
5.1 Electricity Network System in Java-Bali without the UCPS Hydropower Plant ................................... 103 5.2 Alternative Dam / Reservoir Configurations ........................................................................................ 103
5.2.1 Hydraulics Design of Lower Dam Overflow Channels .......................................................... 104 5.2.2 Outlet Channel Capacity ........................................................................................................... 104 5.2.3 Diversion Channel Design ........................................................................................................ 104 5.2.4 Open Ground Works, Switchyard, Office Buildings and Outlet Channels ........................... 104 5.2.5 Penstocks .................................................................................................................................... 105
5.3 Quarry Alternatives ............................................................................................................................ 105 5.4 Alternative Transmission Network Lines ............................................................................................. 106
CHAPTER 6. ENVIRONMENTAL BASELINE INFORMATION ....................................................... 107
6.1 Introduction ........................................................................................................................................ 107 6.2 Climate ................................................................................................................................................ 107
6.2.1 Rainfall Characteristics .............................................................................................................. 108 6.2.2 Temperature Characteristics ..................................................................................................... 109 6.2.3 Wind Characteristics ................................................................................................................. 110 6.2.4 Climate Change ......................................................................................................................... 111
6.3 Topography .......................................................................................................................................... 116 6.3.1 Slopes........................................................................................................................................... 117
vi
Draft Environmental and Social Impact Assessment (ESIA) 2020
6.4 Geology ................................................................................................................................................ 118 6.5 Land Use and Land Cover ...................................................................................................................... 120
6.5.1 Land Use in the Cisokan Watershed ........................................................................................ 120 6.5.2 Transmission Line Land Use ..................................................................................................... 121 6.5.3 Land Use at the UCPS Project Site ............................................................................................ 122
Natural Degraded Forest ............................................................................................................... 123 Production forest ............................................................................................................................ 123 Mixed garden / Talun / Agroforestry ......................................................................................... 124 Scrub and Upland Vegetation ....................................................................................................... 125 Settlement ....................................................................................................................................... 125 Rice fields and fish ponds .............................................................................................................. 126 House gardens ................................................................................................................................ 126
6.5.4 Land Use Land Cover Change .................................................................................................. 127 6.6 Ambient Air Quality, Noise and Vibration .............................................................................................. 135
6.6.1 Ambient Air Quality .................................................................................................................. 137 6.6.2 Noise ........................................................................................................................................... 139 6.6.3 Vibration ..................................................................................................................................... 139
6.7 Hydrology ............................................................................................................................................ 142 6.7.1 Watershed Overview ................................................................................................................. 142 6.7.2 River Characteristics .................................................................................................................. 145 6.7.3 River Flow .................................................................................................................................. 147 6.7.4 Cisokan River at the Cisokan Weir ........................................................................................... 148 6.7.5 Cisokan River at the UCPS Lower Dam ................................................................................... 151 6.7.6 Flood Discharge ......................................................................................................................... 152
6.8 Downstream Users of The Lower Dam .................................................................................................... 153 6.9 Surface Water Quality ........................................................................................................................... 159 6.10 Erosion and Sedimentation ................................................................................................................... 169 6.11 Groundwater....................................................................................................................................... 170
6.11.1 Groundwater levels ................................................................................................................. 170 6.11.2 Groundwater Quality................................................................................................................. 171
6.12 Biodiversity......................................................................................................................................... 178 6.12.1 Regional Biodiversity Values .................................................................................................. 178 6.12.2 Floral Biodiversity.................................................................................................................... 179 6.12.3 Faunal Biodiversity .................................................................................................................. 180 6.12.4 Aquatic Biodiversity ................................................................................................................ 182
Macro invertebrates ....................................................................................................................... 182 Shrimp and Fish ............................................................................................................................. 184
6.12.5 Critical Habitat, Natural Habitat and Modified Habitat Assessment .................................. 185 6.12.5.1 Critical Habitat triggers .................................................................................................... 186 6.12.5.2 Critical habitat evaluation in the UCPS terrestrial system ............................................. 187
CHAPTER 7. SOCIO-ECONOMIC BASELINE INFORMATION ...................................................... 191
7.1 Introduction ........................................................................................................................................ 191 7.2 Location of Settlement and Housing ........................................................................................................ 193 7.3 Demography ......................................................................................................................................... 194 7.4 Community Structure ........................................................................................................................... 196
7.4.1. Community Structure and Services ......................................................................................... 196 7.4.2 Family and Community Structure ............................................................................................ 196 7.4.3 Religion and Culture ................................................................................................................. 197 7.4.4 Social Relation and Gathering................................................................................................... 198
7.5 Gender and Gender Based Violence ...................................................................................................... 200 7.5.1 Local Gender Relations and Socio-Economic Context ............................................................ 200 7.5.2 Local Gender Based Violence Context...................................................................................... 201
7.6 Community Infrastructure ..................................................................................................................... 202
vii
Draft Environmental and Social Impact Assessment (ESIA) 2020
7.6.1 Water .......................................................................................................................................... 202 7.6.2 Electricity.................................................................................................................................... 202 7.6.3 Road and Bridge ........................................................................................................................ 203 7.6.4 Sanitation and Waste ................................................................................................................. 204
7.7 Livelihood ............................................................................................................................................. 204 7.8 Employment Opportunity ................................................................................................................... 206 7.9 Income and Poverty Levels .................................................................................................................. 206 7.10 Land Ownership and Use .................................................................................................................. 208 7.11 Ecosystem Services .............................................................................................................................. 209
7.11.1 Types of Ecosystem Services ................................................................................................... 209 7.11.2 The Use of Natural Resources and Ecosystem Services ........................................................ 209
7.11.2.1 Provisioning Services ....................................................................................................... 210 7.11.2.2 Regulating Services........................................................................................................... 210 7.11.2.3 Cultural Services ............................................................................................................... 212 7.11.2.4 Supporting Services .......................................................................................................... 212
7.12 Health Service ..................................................................................................................................... 216 7.13 Public Opinion.................................................................................................................................... 216
7.13.1 Activity Engagement and Community Feedback.................................................................. 216 7.13.2 Mechanism and Types of Complaints .................................................................................... 217
7.14 Traffic and Road Safety ........................................................................................................................ 218 7.15 Natural Disaster Assessment ............................................................................................................... 219
7.15.1 Seismic ...................................................................................................................................... 219 7.15.2 Slope Stability .......................................................................................................................... 220 7.15.3 Landslide Characteristics and Management of Slope ........................................................... 220 7.15.4 Rock Porosity ........................................................................................................................... 221
7.16 Cultural Heritage ................................................................................................................................ 221
CHAPTER 8. PUBLIC CONSULTATION AND FEEDBACK .............................................................. 223
CHAPTER 9. METHODOLOGY FOR IMPACT ASSESSMENT......................................................... 233
9.1 Impact Assessment .......................................................................................................................... 233 9.2 Mitigation Measures ........................................................................................................................... 237
CHAPTER 10. ENVIRONMENTAL AND SOCIO-ECONOMIC IMPACT – CONSTRUCTION STAGE ........................................................................................................................................................ 239
10.1 Introduction ...................................................................................................................................... 239 10.2 Environmental Impact of the Construction Stage ............................................................................... 239
10.2.1 Erosion and Sedimentation ..................................................................................................... 239 10.2.1.1 Cisokan River and Cilenkong River ................................................................................ 243 10.2.1.2 Cirumamis River............................................................................................................... 245 10.2.1.3 Cijambu River .................................................................................................................. 246
10.2.2 Aquatic Habitat and Water Quality ....................................................................................... 247 10.2.2.1 Physical changes to river habitat ..................................................................................... 247 10.2.2.2 Sedimentation ................................................................................................................... 247 10.2.2.3 Pollutants .......................................................................................................................... 248 10.2.2.4 Domestic waste ................................................................................................................. 248 10.2.2.1 Water quality in Cisokan River and Cilenkong River .................................................... 248 10.2.2.2 Water quality in Cirumamis River .................................................................................. 250 10.2.2.3 Water quality in Cirendeu River...................................................................................... 250
10.2.3 Aquatic biota ............................................................................................................................ 252 10.2.4 Groundwater ............................................................................................................................ 253 10.2.5 Air Quality ............................................................................................................................... 253
10.2.5.1 Air quality around quarry................................................................................................ 254 10.2.5.2 Air quality around access Road ....................................................................................... 255
viii
Draft Environmental and Social Impact Assessment (ESIA) 2020
10.2.5.3 Air quality around main construction sites..................................................................... 257 10.2.6 Noise ......................................................................................................................................... 258
10.2.6.1 Noise impact from quarry ................................................................................................ 259 10.2.6.2 Noise impact from access Road ....................................................................................... 260 10.2.6.3 Noise impact from main construction site ...................................................................... 262 10.2.6.4 Noise impact from Transmission Line ............................................................................ 264
10.2.7 Vibration ................................................................................................................................... 265 10.2.7.1 Quarry ............................................................................................................................... 266 10.2.7.2 Access Road....................................................................................................................... 268 10.2.7.3 Main Construction ............................................................................................................ 269
10.2.8 Access to Water Sources in Gunungkarang Quarry .............................................................. 272 10.2.9 Terrestrial Biodiversity ............................................................................................................ 273
10.2.9.1 Extent of Critical Habitat impacted ................................................................................. 273 10.2.9.2 Determining no net loss and net gain against a counterfactual scenario ...................... 276 10.2.9.3 Applying the mitigation hierarchy .................................................................................. 277 10.2.9.4 Offsetting losses in a sustainable development context ................................................. 278 10.2.9.5 Population Decline and Threats to Protected Wildlife in UCPS .................................... 279 10.2.9.6 Transmission Line Impacts .............................................................................................. 280
10.3 Land Acquisition and Resettlement Impacts ....................................................................................... 283 10.3.1 Livelihood Changes ................................................................................................................. 285
10.3.1.1 Livelihood Changes Forestry Dependent Livelihood ................................................... 285 10.3.1.2 Livelihood Changes in Woman Land Owners............................................................... 287
10.3.2 Demographic Change .............................................................................................................. 288 10.3.3 Impact on Income Associated with Construction Activities ................................................. 289 10.3.4 Risk of Labour from Outside the Project Area .................................................................... 290 10.3.5 Impact on Cultural Heritage ................................................................................................ 291 10.3.6 Social Disturbance from Communities around the Project ................................................ 292 10.3.7 Danger of Traffic Accidents .................................................................................................. 294 10.3.8 Economic Employment and Business Opportunities ......................................................... 296 10.3.9 Community Lifestyle, Health and Culture .......................................................................... 297
10.4 Occupational Health and Safety (OHS) Impacts during Construction Stage ...................................... 298
CHAPTER 11. ENVIRONMENTAL AND SOCIO-ECONOMIC IMPACTS – IMPOUNDMENT STAGE ........................................................................................................................................................ 304
11.1 Overview ........................................................................................................................................... 304 11.2 Environmental Impact of the Inundation Phase .................................................................................. 304
11.2.1 Changes in River Flow ............................................................................................................ 304 11.2.2 Changes in River Habitat and Biodiversity ............................................................................ 307 11.2.3 Erosion and sedimentation in Upper and Lower dams ........................................................ 309 11.2.4 Reduced Vegetation and Loss of Habitat ............................................................................... 310 11.2.5 Habitat Fragmentataion /Habitat Barrier .............................................................................. 313 11.2.6 Population Decline and Threats to Protected Wildlife .......................................................... 314 11.2.7 Disturbance to the movement of birds on the Transmission Line ........................................ 315
11.3 Social Impact of the Inundation Stage ................................................................................................ 316 11.3.1 Downstream Users of the Cisokan River ............................................................................... 316 11.3.2 Community Connectivity (Bridge Access) ............................................................................. 318
CHAPTER 12. ENVIRONMENTAL AND SOCIO-ECONOMIC IMPACT - OPERATIONAL STAGE ........................................................................................................................................................ 321
12.1 Overview ........................................................................................................................................... 321 12.2 Environmental Impact Operational Stage .......................................................................................... 321
12.2.1 Erosion and Sedimentation ..................................................................................................... 321 12.2.2 Hydrology, River Flow Discharge, and Water Availability for UCPS Downstream Users 325 12.2.3 River Habitat ............................................................................................................................ 328
ix
Draft Environmental and Social Impact Assessment (ESIA) 2020
12.2.4 River Water Quality ................................................................................................................. 329 12.2.5 Land Use Changes ................................................................................................................... 333 12.2.6 Visual Impact on Transmission Line ...................................................................................... 338 12.2.7 Biodiversity .............................................................................................................................. 341
12.2.7.1 Deforestation and Forest Degradation through Agricultural Conversion.................... 341 12.2.7.2 Hunting and Capturing Wild Animals ........................................................................... 342 12.2.7.3 Increased Access and Development ................................................................................ 344 12.2.7.4 Risk Impact of Occurrence Electric Shock to the Wild Animals on the Transmission
Line ................................................................................................................................... 346 12.2.8 Revegetation of Buffer Areas .................................................................................................. 347 12.2.8 Conclusions on ESS6 Critical and Natural Habitat net loss ............................................... 349 12.2.9 Greenhouse Gas Emissions .................................................................................................. 350
12.3 Social Impact During Operational Stage ............................................................................................ 352 12.3.1 Developments along the access road by immigrants ............................................................ 352 12.3.2 Electric and magnetic fields (EMF) of the Transmission Line .............................................. 353 12.3.3 Water-borne Diseases .............................................................................................................. 354
12.4 Occupational Health and Safety ......................................................................................................... 355 12.5 Dam Safety........................................................................................................................................ 359 12.6 Cumulative Impact ............................................................................................................................ 359
CHAPTER 13. ENVIRONMENTAL AND SOCIAL MANAGEMENT PLAN ................................... 362
13.1 General.............................................................................................................................................. 362 13.2 Impact Mitigation Framework (Environmental and Social Management Plan) ................................... 362 13.3 Environmental and Social Management Mitigation Construction Stage ............................................ 362
13.3.1 River Habitat and Water Quality ............................................................................................ 362 13.3.2 Erosion and Sedimentation ..................................................................................................... 363 13.3.3 Air Quality ............................................................................................................................... 363 13.3.4 Noise ......................................................................................................................................... 363 13.3.5 Vibration................................................................................................................................... 364 13.3.6 Biodiversity impacts from dam and access road ................................................................... 364 13.3.7 Risk Mitigation of Transmission Infrastructure on biodiversity .......................................... 365
13.3.7.1 Mitigating animal electrocution....................................................................................... 366 13.3.7.2 Mitigation of bird collision ............................................................................................... 368 13.3.7.3 Mitigating habitat loss and fragmentation from transmission line ............................... 368
13.3.8 Access to water sources in Quarry Gunungkarang ............................................................... 368 13.3.9 Process and Impact of Resettlement ....................................................................................... 369 13.3.10 Livelihood Change................................................................................................................. 369 13.3.11 Risk of Labor from Outside the Project Area (Labor Influx) ............................................... 369 13.3.12 Cultural Heritage ................................................................................................................... 371 13.3.13 Social Disturbance from Communities around the Project ................................................. 371 13.3.14 Traffic Safety .......................................................................................................................... 371 13.3.15 Work at Height Accident....................................................................................................... 372
13.4 Environmental and Social Management Mitigation Inundation Stage ............................................... 372 13.4.1 Changes in River Habitat, and Biodiversity .......................................................................... 372 13.4.2 Erosion and Sedimentation in Upper Dam and Lower Dam ................................................ 373 13.4.3 Downstream Users of the Cisokan River ............................................................................... 373 13.4.4 Community Connectivity (Bridge Access) ............................................................................. 373
13.5 Environmental and Social Management Mitigation Operational Stage .............................................. 373 13.5.1 River Habitat ............................................................................................................................ 373 13.5.2 Revegetation in The Buffer Area............................................................................................. 374 13.5.3 Hydrology, River Flow Discharge, and Water Availability for UCPS Downstream Users 374 13.5.4 Erosion and Sedimentation ..................................................................................................... 374 13.5.5 River Water Quality ................................................................................................................. 375 13.5.6 Land Use Changes in Transmission Line 500 kV .................................................................. 375
x
Draft Environmental and Social Impact Assessment (ESIA) 2020
13.5.7 Impact of Transmission Line on Public Perception ............................................................... 375 13.5.8 Electric and Magnetic Fields (EMF) of the Transmission Line ............................................. 375 13.5.9 Biodiversity Mitigation ............................................................................................................ 376
CHAPTER 14. CONCLUSION ................................................................................................................. 379
14.1 Resettlement ...................................................................................................................................... 379 14.2 Socio-Economic Benefits and Development Impact on Society ............................................................ 379 14.3 Biodiversity Impacts .......................................................................................................................... 380 14.4 Environmental Impacts in Rivers Downstream of the Dam ................................................................ 380 14.5 Security and Reservoir Management.................................................................................................. 381
CLOSING ................................................................................................................................................... 382
REFERENCE ............................................................................................................................................... 383
APPENDICES ............................................................................................................................................ 393
xi
Draft Environmental and Social Impact Assessment (ESIA) 2020
LIST OF TABLES
Table 1 Composition of Power Plants by Type of Fuel in the Java-Bali Region (Gigawatt-Hour) ......................... 40
Table 2 Comparison of the Advantages of UCPS Pumped Storage Hydropower Plant as a Peaking Plant to Other
Hydropower Plants .......................................................................................................................................... 41
Table 3 Main Features of UCPS Hydropower Plant ........................................................................................... 78
Table 4 The number of power transmission 500 kV towers in each village ........................................................ 86
4.3.5.2.1 Excavation work and material transportation for the foundation ....................................................... 87
4.3.5.2.2 Repair work, scaffolding and stub setup ............................................................................................ 87
4.3.5.2.3 Foundations casting .......................................................................................................................... 87
4.3.5.2.4 Hoarding work .................................................................................................................................. 88
4.3.5.2.5 Tower Installation Work .................................................................................................................... 88
4.3.5.2.6 Stringing ........................................................................................................................................... 88
Table 5 Summary of Volume Estimates in Major Excavations and Construction Materials ................................. 92
Table 6 Water Balance During Wet Season (Dec – May) Inundation ................................................................. 95
Table 7 Summary of Quarry Location Alternatives .......................................................................................... 105
Table 8 Wind Speed and Direction of Monitoring Results in Study Area .......................................................... 111
Table 9 Geological Formation in the Project area ........................................................................................... 119
Table 10 Ambient air quality, noise and vibration ANDAL 2007 UCPS Hydropower Plant ................................ 136
Table 11 UCPS Hydrology and Design Study History ....................................................................................... 147
Table 12 Probability of Flood Discharge at Any of Return Period in Upper and Lower Dam ............................. 153
Table 13 Average Water Quality in Rivers Around UCPS. Orange colours indicate parameters that locally exceed
the government thresholds ........................................................................................................................... 160
Table 14 Pollution Level based on the Dominance Index of Aquatic Biota ....................................................... 166
Table 15 Groundwater Quality at Several Monitoring Locations Around the UCPS Project Area. Orange colours
indicate where the parameters exceed the threshold set by the government standard. ................................. 173
Table 16 Groundwater Quality at Multiple Monitoring Locations Around the UCPS Project Area (Continued) . 175
Table 17 Summary of Social Impact Analysis and Methodology ...................................................................... 191
Table 18 Population Distribution in UCPS Area ............................................................................................... 195
Table 19 Social Institution in Village around UCPS project .............................................................................. 199
Table 20 Number of Families with social welfare problems in Cianjur Regency ............................................... 207
Table 21 The list of villages based on their average household expenditure and savings ................................. 208
Table 22 Agriculture Production in Cisokan Watershed by Commodities ........................................................ 214
Table 23 Summary of several Public Consultation that has been held by PLN ................................................. 224
Table 24 Summary of questions, input and suggestions submitted by the community .................................... 232
Table 25 Impact Assessment Terminology ..................................................................................................... 233
Table 26 Likelihood Categories ...................................................................................................................... 235
Table 27 Determining the Severity of Impacts ................................................................................................ 235
Table 28 Determining the Significance of Impacts .......................................................................................... 236
Table 29 Definition of Impact Significance...................................................................................................... 236
Table 30 Mitigation Hierarchy ........................................................................................................................ 237
Table 31 Potential Impacts on Water Bodies Due to Sediment Disturbance during Construction .................... 239
Table 32 Potential Erosion at Major Construction Sites .................................................................................. 240
Table 33 Potential Erosion Rate at Major Construction Sites .......................................................................... 241
xii
Draft Environmental and Social Impact Assessment (ESIA) 2020
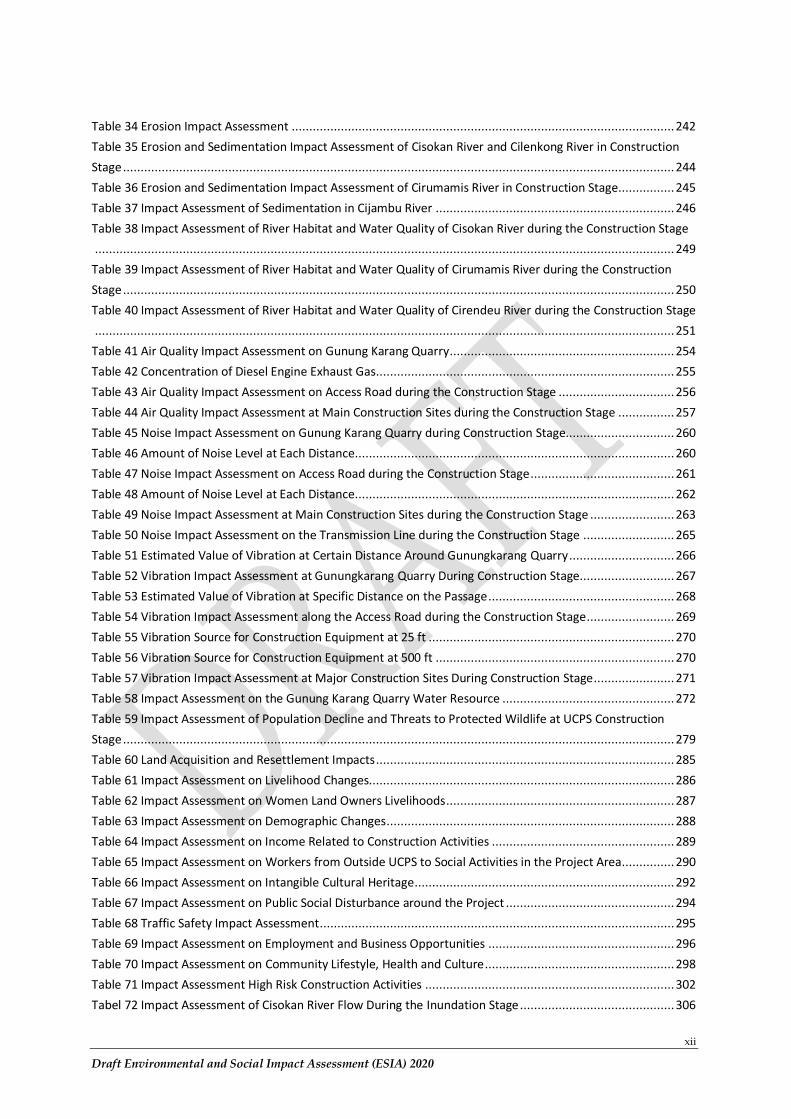
Table 34 Erosion Impact Assessment ............................................................................................................. 242
Table 35 Erosion and Sedimentation Impact Assessment of Cisokan River and Cilenkong River in Construction
Stage ............................................................................................................................................................. 244
Table 36 Erosion and Sedimentation Impact Assessment of Cirumamis River in Construction Stage ................ 245
Table 37 Impact Assessment of Sedimentation in Cijambu River .................................................................... 246
Table 38 Impact Assessment of River Habitat and Water Quality of Cisokan River during the Construction Stage
..................................................................................................................................................................... 249
Table 39 Impact Assessment of River Habitat and Water Quality of Cirumamis River during the Construction
Stage ............................................................................................................................................................. 250
Table 40 Impact Assessment of River Habitat and Water Quality of Cirendeu River during the Construction Stage
..................................................................................................................................................................... 251
Table 41 Air Quality Impact Assessment on Gunung Karang Quarry ................................................................ 254
Table 42 Concentration of Diesel Engine Exhaust Gas ..................................................................................... 255
Table 43 Air Quality Impact Assessment on Access Road during the Construction Stage ................................. 256
Table 44 Air Quality Impact Assessment at Main Construction Sites during the Construction Stage ................ 257
Table 45 Noise Impact Assessment on Gunung Karang Quarry during Construction Stage............................... 260
Table 46 Amount of Noise Level at Each Distance........................................................................................... 260
Table 47 Noise Impact Assessment on Access Road during the Construction Stage ......................................... 261
Table 48 Amount of Noise Level at Each Distance........................................................................................... 262
Table 49 Noise Impact Assessment at Main Construction Sites during the Construction Stage ........................ 263
Table 50 Noise Impact Assessment on the Transmission Line during the Construction Stage .......................... 265
Table 51 Estimated Value of Vibration at Certain Distance Around Gunungkarang Quarry .............................. 266
Table 52 Vibration Impact Assessment at Gunungkarang Quarry During Construction Stage ........................... 267
Table 53 Estimated Value of Vibration at Specific Distance on the Passage ..................................................... 268
Table 54 Vibration Impact Assessment along the Access Road during the Construction Stage ......................... 269
Table 55 Vibration Source for Construction Equipment at 25 ft ...................................................................... 270
Table 56 Vibration Source for Construction Equipment at 500 ft .................................................................... 270
Table 57 Vibration Impact Assessment at Major Construction Sites During Construction Stage ....................... 271
Table 58 Impact Assessment on the Gunung Karang Quarry Water Resource ................................................. 272
Table 59 Impact Assessment of Population Decline and Threats to Protected Wildlife at UCPS Construction
Stage ............................................................................................................................................................. 279
Table 60 Land Acquisition and Resettlement Impacts ..................................................................................... 285
Table 61 Impact Assessment on Livelihood Changes....................................................................................... 286
Table 62 Impact Assessment on Women Land Owners Livelihoods ................................................................. 287
Table 63 Impact Assessment on Demographic Changes .................................................................................. 288
Table 64 Impact Assessment on Income Related to Construction Activities .................................................... 289
Table 65 Impact Assessment on Workers from Outside UCPS to Social Activities in the Project Area............... 290
Table 66 Impact Assessment on Intangible Cultural Heritage .......................................................................... 292
Table 67 Impact Assessment on Public Social Disturbance around the Project ................................................ 294
Table 68 Traffic Safety Impact Assessment ..................................................................................................... 295
Table 69 Impact Assessment on Employment and Business Opportunities ..................................................... 296
Table 70 Impact Assessment on Community Lifestyle, Health and Culture ...................................................... 298
Table 71 Impact Assessment High Risk Construction Activities ....................................................................... 302
Tabel 72 Impact Assessment of Cisokan River Flow During the Inundation Stage ............................................ 306
xiii
Draft Environmental and Social Impact Assessment (ESIA) 2020
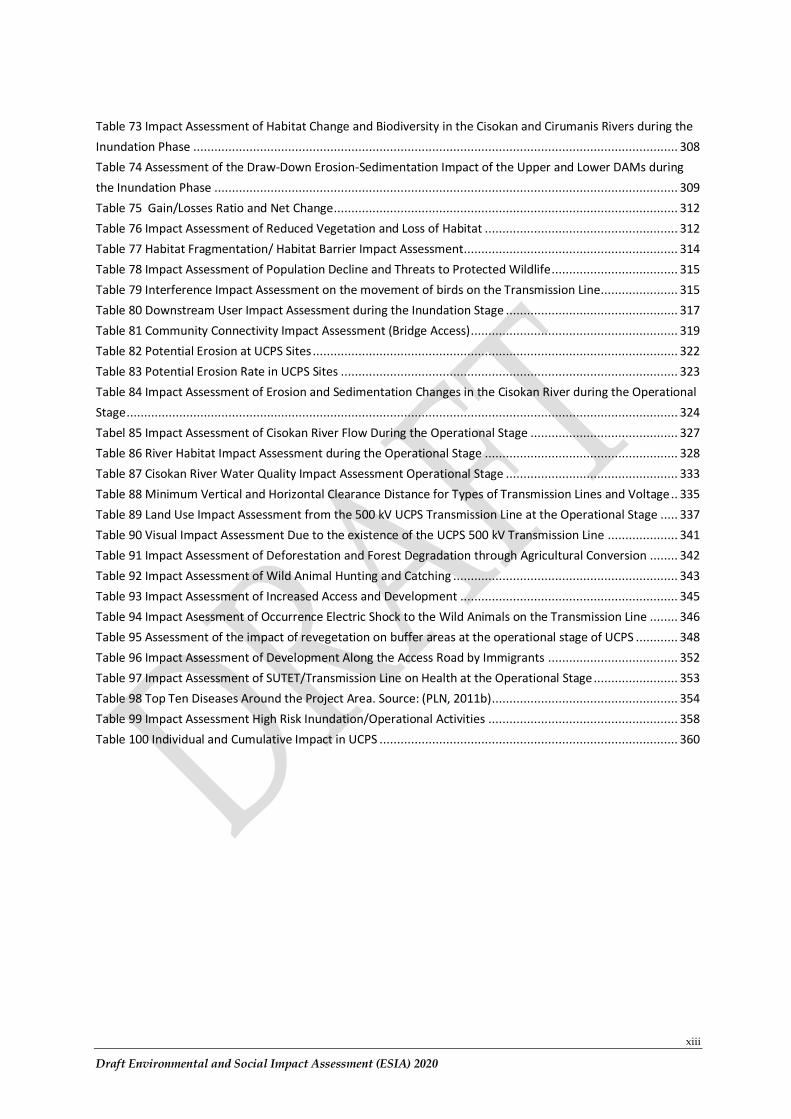
Table 73 Impact Assessment of Habitat Change and Biodiversity in the Cisokan and Cirumanis Rivers during the
Inundation Phase .......................................................................................................................................... 308
Table 74 Assessment of the Draw-Down Erosion-Sedimentation Impact of the Upper and Lower DAMs during
the Inundation Phase .................................................................................................................................... 309
Table 75 Gain/Losses Ratio and Net Change .................................................................................................. 312
Table 76 Impact Assessment of Reduced Vegetation and Loss of Habitat ....................................................... 312
Table 77 Habitat Fragmentation/ Habitat Barrier Impact Assessment ............................................................. 314
Table 78 Impact Assessment of Population Decline and Threats to Protected Wildlife .................................... 315
Table 79 Interference Impact Assessment on the movement of birds on the Transmission Line...................... 315
Table 80 Downstream User Impact Assessment during the Inundation Stage ................................................. 317
Table 81 Community Connectivity Impact Assessment (Bridge Access) ........................................................... 319
Table 82 Potential Erosion at UCPS Sites ........................................................................................................ 322
Table 83 Potential Erosion Rate in UCPS Sites ................................................................................................ 323
Table 84 Impact Assessment of Erosion and Sedimentation Changes in the Cisokan River during the Operational
Stage ............................................................................................................................................................. 324
Tabel 85 Impact Assessment of Cisokan River Flow During the Operational Stage .......................................... 327
Table 86 River Habitat Impact Assessment during the Operational Stage ....................................................... 328
Table 87 Cisokan River Water Quality Impact Assessment Operational Stage ................................................. 333
Table 88 Minimum Vertical and Horizontal Clearance Distance for Types of Transmission Lines and Voltage .. 335
Table 89 Land Use Impact Assessment from the 500 kV UCPS Transmission Line at the Operational Stage ..... 337
Table 90 Visual Impact Assessment Due to the existence of the UCPS 500 kV Transmission Line .................... 341
Table 91 Impact Assessment of Deforestation and Forest Degradation through Agricultural Conversion ........ 342
Table 92 Impact Assessment of Wild Animal Hunting and Catching ................................................................ 343
Table 93 Impact Assessment of Increased Access and Development .............................................................. 345
Table 94 Impact Asessment of Occurrence Electric Shock to the Wild Animals on the Transmission Line ........ 346
Table 95 Assessment of the impact of revegetation on buffer areas at the operational stage of UCPS ............ 348
Table 96 Impact Assessment of Development Along the Access Road by Immigrants ..................................... 352
Table 97 Impact Assessment of SUTET/Transmission Line on Health at the Operational Stage ........................ 353
Table 98 Top Ten Diseases Around the Project Area. Source: (PLN, 2011b) ..................................................... 354
Table 99 Impact Assessment High Risk Inundation/Operational Activities ...................................................... 358
Table 100 Individual and Cumulative Impact in UCPS ..................................................................................... 360
xiv
Draft Environmental and Social Impact Assessment (ESIA) 2020
LIST OF FIGURES
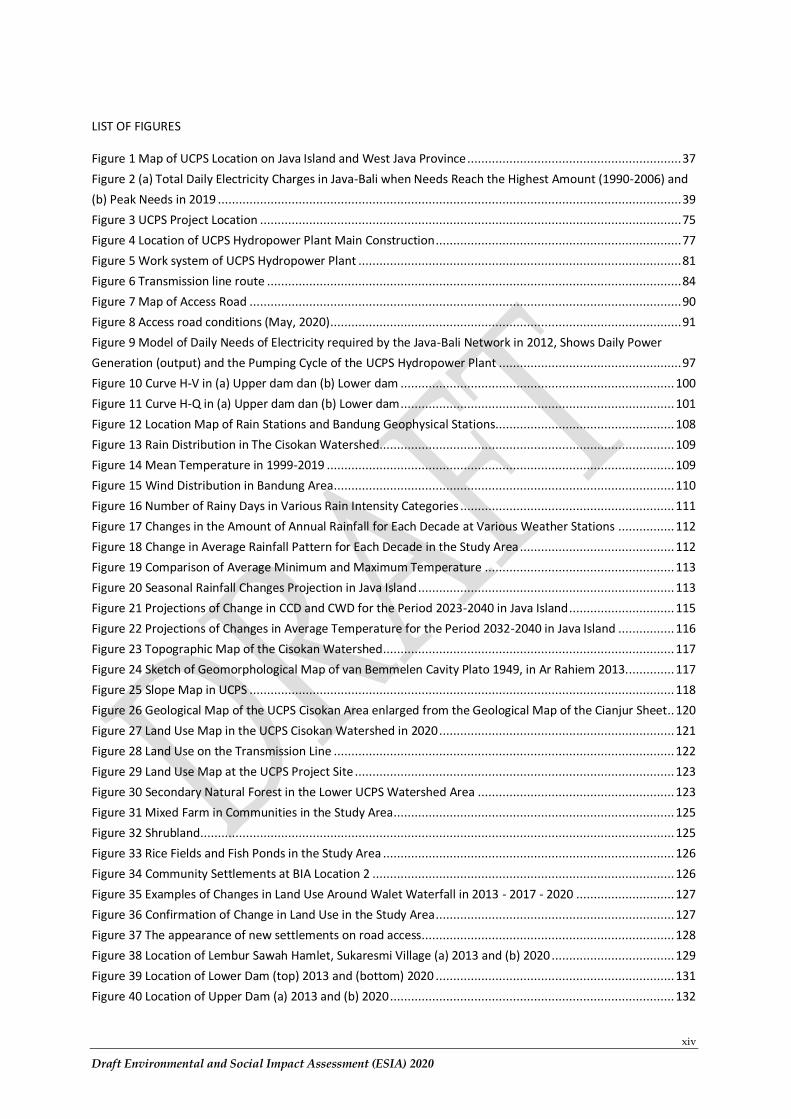
Figure 1 Map of UCPS Location on Java Island and West Java Province ............................................................. 37
Figure 2 (a) Total Daily Electricity Charges in Java-Bali when Needs Reach the Highest Amount (1990-2006) and
(b) Peak Needs in 2019 .................................................................................................................................... 39
Figure 3 UCPS Project Location ........................................................................................................................ 75
Figure 4 Location of UCPS Hydropower Plant Main Construction ...................................................................... 77
Figure 5 Work system of UCPS Hydropower Plant ............................................................................................ 81
Figure 6 Transmission line route ...................................................................................................................... 84
Figure 7 Map of Access Road ........................................................................................................................... 90
Figure 8 Access road conditions (May, 2020) .................................................................................................... 91
Figure 9 Model of Daily Needs of Electricity required by the Java-Bali Network in 2012, Shows Daily Power
Generation (output) and the Pumping Cycle of the UCPS Hydropower Plant .................................................... 97
Figure 10 Curve H-V in (a) Upper dam dan (b) Lower dam .............................................................................. 100
Figure 11 Curve H-Q in (a) Upper dam dan (b) Lower dam .............................................................................. 101
Figure 12 Location Map of Rain Stations and Bandung Geophysical Stations................................................... 108
Figure 13 Rain Distribution in The Cisokan Watershed.................................................................................... 109
Figure 14 Mean Temperature in 1999-2019 ................................................................................................... 109
Figure 15 Wind Distribution in Bandung Area ................................................................................................. 110
Figure 16 Number of Rainy Days in Various Rain Intensity Categories ............................................................. 111
Figure 17 Changes in the Amount of Annual Rainfall for Each Decade at Various Weather Stations ................ 112
Figure 18 Change in Average Rainfall Pattern for Each Decade in the Study Area ............................................ 112
Figure 19 Comparison of Average Minimum and Maximum Temperature ...................................................... 113
Figure 20 Seasonal Rainfall Changes Projection in Java Island ......................................................................... 113
Figure 21 Projections of Change in CCD and CWD for the Period 2023-2040 in Java Island .............................. 115
Figure 22 Projections of Changes in Average Temperature for the Period 2032-2040 in Java Island ................ 116
Figure 23 Topographic Map of the Cisokan Watershed ................................................................................... 117
Figure 24 Sketch of Geomorphological Map of van Bemmelen Cavity Plato 1949, in Ar Rahiem 2013.............. 117
Figure 25 Slope Map in UCPS ......................................................................................................................... 118
Figure 26 Geological Map of the UCPS Cisokan Area enlarged from the Geological Map of the Cianjur Sheet.. 120
Figure 27 Land Use Map in the UCPS Cisokan Watershed in 2020 ................................................................... 121
Figure 28 Land Use on the Transmission Line ................................................................................................. 122
Figure 29 Land Use Map at the UCPS Project Site ........................................................................................... 123
Figure 30 Secondary Natural Forest in the Lower UCPS Watershed Area ........................................................ 123
Figure 31 Mixed Farm in Communities in the Study Area ................................................................................ 125
Figure 32 Shrubland ....................................................................................................................................... 125
Figure 33 Rice Fields and Fish Ponds in the Study Area ................................................................................... 126
Figure 34 Community Settlements at BIA Location 2 ...................................................................................... 126
Figure 35 Examples of Changes in Land Use Around Walet Waterfall in 2013 - 2017 - 2020 ............................ 127
Figure 36 Confirmation of Change in Land Use in the Study Area .................................................................... 127
Figure 37 The appearance of new settlements on road access........................................................................ 128
Figure 38 Location of Lembur Sawah Hamlet, Sukaresmi Village (a) 2013 and (b) 2020 ................................... 129
Figure 39 Location of Lower Dam (top) 2013 and (bottom) 2020 .................................................................... 131
Figure 40 Location of Upper Dam (a) 2013 and (b) 2020 ................................................................................. 132
xv
Draft Environmental and Social Impact Assessment (ESIA) 2020
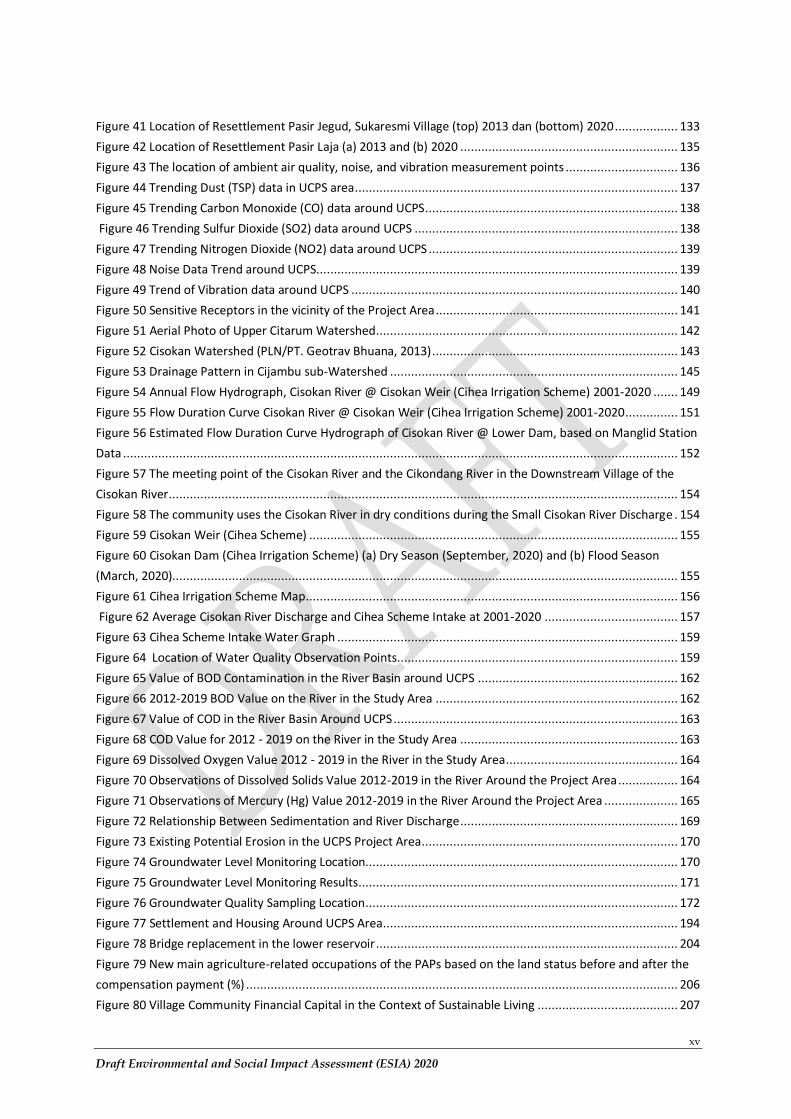
Figure 41 Location of Resettlement Pasir Jegud, Sukaresmi Village (top) 2013 dan (bottom) 2020 .................. 133
Figure 42 Location of Resettlement Pasir Laja (a) 2013 and (b) 2020 .............................................................. 135
Figure 43 The location of ambient air quality, noise, and vibration measurement points ................................ 136
Figure 44 Trending Dust (TSP) data in UCPS area ............................................................................................ 137
Figure 45 Trending Carbon Monoxide (CO) data around UCPS ........................................................................ 138
Figure 46 Trending Sulfur Dioxide (SO2) data around UCPS ........................................................................... 138
Figure 47 Trending Nitrogen Dioxide (NO2) data around UCPS ....................................................................... 139
Figure 48 Noise Data Trend around UCPS....................................................................................................... 139
Figure 49 Trend of Vibration data around UCPS ............................................................................................. 140
Figure 50 Sensitive Receptors in the vicinity of the Project Area ..................................................................... 141
Figure 51 Aerial Photo of Upper Citarum Watershed ...................................................................................... 142
Figure 52 Cisokan Watershed (PLN/PT. Geotrav Bhuana, 2013) ...................................................................... 143
Figure 53 Drainage Pattern in Cijambu sub-Watershed .................................................................................. 145
Figure 54 Annual Flow Hydrograph, Cisokan River @ Cisokan Weir (Cihea Irrigation Scheme) 2001-2020 ....... 149
Figure 55 Flow Duration Curve Cisokan River @ Cisokan Weir (Cihea Irrigation Scheme) 2001-2020 ............... 151
Figure 56 Estimated Flow Duration Curve Hydrograph of Cisokan River @ Lower Dam, based on Manglid Station
Data .............................................................................................................................................................. 152
Figure 57 The meeting point of the Cisokan River and the Cikondang River in the Downstream Village of the
Cisokan River ................................................................................................................................................. 154
Figure 58 The community uses the Cisokan River in dry conditions during the Small Cisokan River Discharge . 154
Figure 59 Cisokan Weir (Cihea Scheme) ......................................................................................................... 155
Figure 60 Cisokan Dam (Cihea Irrigation Scheme) (a) Dry Season (September, 2020) and (b) Flood Season
(March, 2020)................................................................................................................................................ 155
Figure 61 Cihea Irrigation Scheme Map .......................................................................................................... 156
Figure 62 Average Cisokan River Discharge and Cihea Scheme Intake at 2001-2020 ...................................... 157
Figure 63 Cihea Scheme Intake Water Graph ................................................................................................. 159
Figure 64 Location of Water Quality Observation Points................................................................................ 159
Figure 65 Value of BOD Contamination in the River Basin around UCPS ......................................................... 162
Figure 66 2012-2019 BOD Value on the River in the Study Area ..................................................................... 162
Figure 67 Value of COD in the River Basin Around UCPS ................................................................................. 163
Figure 68 COD Value for 2012 - 2019 on the River in the Study Area .............................................................. 163
Figure 69 Dissolved Oxygen Value 2012 - 2019 in the River in the Study Area ................................................. 164
Figure 70 Observations of Dissolved Solids Value 2012-2019 in the River Around the Project Area ................. 164
Figure 71 Observations of Mercury (Hg) Value 2012-2019 in the River Around the Project Area ..................... 165
Figure 72 Relationship Between Sedimentation and River Discharge .............................................................. 169
Figure 73 Existing Potential Erosion in the UCPS Project Area ......................................................................... 170
Figure 74 Groundwater Level Monitoring Location......................................................................................... 170
Figure 75 Groundwater Level Monitoring Results ........................................................................................... 171
Figure 76 Groundwater Quality Sampling Location ......................................................................................... 172
Figure 77 Settlement and Housing Around UCPS Area .................................................................................... 194
Figure 78 Bridge replacement in the lower reservoir ...................................................................................... 204
Figure 79 New main agriculture-related occupations of the PAPs based on the land status before and after the
compensation payment (%) ........................................................................................................................... 206
Figure 80 Village Community Financial Capital in the Context of Sustainable Living ........................................ 207
xvi
Draft Environmental and Social Impact Assessment (ESIA) 2020
Figure 81 Projection of Food Demand in Village at Cisokan Watershed ........................................................... 215
Figure 82 Food Balance in Cisokan Watershed ............................................................................................... 216
Figure 83 Environmental grievance post in Cangkuang hamlet (BIA 14) in 2016 .............................................. 218
Figure 84 Indonesian Seismic Hazard Map in 2017 ......................................................................................... 220
Figure 85 Erosion Rate Classification .............................................................................................................. 241
Figure 86 The distribution of the erosion rate based on the classification ....................................................... 242
Figure 87 Decreasing Concentration of Air Pollution Due to Exhaust Gas Emissions for Vehicles Transporting
Equipment and Materials along the Transport Road ....................................................................................... 256
Figure 88 Noise Modelling Based on ISO 9613-2 ............................................................................................ 259
Figure 89 Noise Dispersion Prediction in Quarry Gunungkarang .................................................................... 259
Figure 90 Noise Dispersion Prediction in Access Road.................................................................................... 261
Figure 91 Noise Dispersion Prediction in Main Construction .......................................................................... 263
Figure 92 Distribution of Vibration Levels in Quarry Gunungkarang ............................................................... 267
Figure 93 Mitigation hierarchy showing how different impacts relate to different mitigation measures .......... 278
Figure 94 Increased Draw-Down Erosion Rate ................................................................................................ 309
Figure 95 Potential Landslide Zone and Unstable Soil in the UCPS Reservoir ................................................... 322
Figure 96 The distribution of the erosion strip based on the classification of the UCPS Operational Stage in the
Cisokan watershed ........................................................................................................................................ 324
Figure 97 Graph of domestic waste in each village in the Cisokan catchment.................................................. 330
Figure 98 Projected village pollutant load in the Cisokan catchment area for BOD parameters for 2020-2025-
2035 .............................................................................................................................................................. 331
Figure 99 Pollution Load per Village for COD Parameters in 2020 - 2025 - 2035 .............................................. 332
Figure 100 Pollution Load per Village for TSS Parameters for 2020 - 2025 - 2035 ............................................ 332
Figure 101 Land Use on the UCPS Transmission Line ...................................................................................... 334
Figure 102 Land Use Change Graph in the 500 kV UCPS Transmission Line ..................................................... 336
Figure 103 Visualization of 500 kV Transmission Line ..................................................................................... 337
Figure 104 Visualization of UCPS Transmission Line Modeling Results ............................................................ 338
Figure 105 Location of Visual Impact Observation on UCPS Transmission Line Construction Plan; (a) Low (b)
Moderate (c) High ......................................................................................................................................... 340
Figure 106 Distribution of Visual Conditions Observation Around the Transmission Line................................. 340
Figure 107 Buffer Area and Vegetation Restoration Targets in Reservoir Management during the Operational
Stage ............................................................................................................................................................. 348
xvii
Draft Environmental and Social Impact Assessment (ESIA) 2020
ABBREVIATIONS
ACSR = Aluminium Conductor Steel Reinforced
ANDAL = Analisis Dampak Lingkungan Hidup/ Environmental Impact Analysis Report
AMDAL = Analisis Mengenai Dampak Lingkungan Hidup/ Environmental Impact Analysis
ANFO = Ammonium Nitrate Fuel Oil
AoI = Area of Interest
AWLR = Automatic Water Level Recorder
BIA = Biodiversity Important Area
BKSDA = Badan Konservasi Sumber Daya Alam/Nature Conservation Agency
BMP = Biodiversity Management Plan
BOD = Biological Oxygen Demand
BPD = Badan Permusyawaratan Desa/Village Representative Council
CITES = Convention on International Trade in Endangered Species
CO = Carbon Monoxide
COD = Chemical Oxygen Demand
CR = Critically Endangered IUCN Category
DAS = Daerah Aliran Sungai/Watershed
DI = Daerah Irigasi/Irrigation Area
DO = Dissolved Oxigen
DPT = Dinding Penahan Tanah/Retaining Wall/Rock
EIA = Environmental Impact Assessment
EMF = Electromotive Force
ESDM = Energi Sumber Daya Mineral (Minerba)/Indonesian Ministry of Energy and
Mineral Resources
ESIA = Environmental and Social Impact Assessment
ESF = Environmental and Social Framework
EN = Endangered IUCN Category
ESMP = Environmental and Social Management Plan
ESS = Environmental and Social Standards
ESCP = Environmental and Social Commitment Plan
FDC = Flow Duration Curve
FTIP = Fakultas Teknologi Industri Pertanian/Faculty of Agroindustrial
Technology
GBV = Gender Based Violence
GEV = Generalized Extreme Value
GPS = Global Positioning System
GSW = Galvanished Steel Wire
GTF = Grievance Task Force
GW = Giga Watt
Ha = Hectare
HC = Hydrocarbon
HSE = Health, Safety, and Environment
xviii
Draft Environmental and Social Impact Assessment (ESIA) 2020
HWL = High Water Level
Hz = Hertz
IMA = Independent Monitoring Agency
IUCN = International Union for Conservation of Nature
km = Kilometers
km2 = Kilometer square
kp. = Kampung/hamlet
kV = Kilo Volt
LARAP = Land Acquisition and Resettlement Action Plan
LKMD = Lembaga Ketahanan Masyarakat Desa/Village Community Resilience Council
LMP = Labor Management Procedures
LPM = Lembaga Pemberdayaan Masyarakat/Community Empowerment Council
LWL = Low Water Level
m = meters
m3 = Cubic meters
mm = milimeters
MCK = Mandi Cuci Kakus/bathing, washing as well as serving as a lavatory by
the community
MW = Mega Watt
NA = Not Available
NAB = Nilai Ambang Batas/Threshold Value
NO2 = Nitrogen Dioxide
OPGW = Optical Ground Wire
PAPs = Project Affected Persons
P2T = Panitia Pengadaan Tanah/ Land Acquisition Committee
P3A = Petani Pengguna Air/Water User Farmer
PAUD = Pendidikan Anak Usia Dini/Early childhood education
PCR = Physical Cultural Resources
Permen = Peraturan Menteri/ ministerial decree
PKK = Pembedayaan Kesejahteraan Keluarga/Family Empowerment Council
PLN = Pembangkit Listrik Negara/State Electricity Company
PPKH = Pinjam Pakai Kawasan Hutan/forest lease-to-use
RCC = Roller Compacted Concrete
RKL = Rencana Pengelolaan Lingkungan Hidup Environmental Management Plan
RPL = Rencana Pemantauan Lingkungan Hidup Environmental Monitoring Plan
RUPTL = Rencana Usaha Penyediaan Tenaga Listrik / Electricity Supply Business
Plan
Sec = Second
SAA = Social Acceptance Assessment
SCMP = Social Community Management Plan
SNI = Standar Nasional Indonesia/Indonesian National Standard
SO2 = Sulfur Dioxide
SOP = Standard Operating Procedure
xix
Draft Environmental and Social Impact Assessment (ESIA) 2020
SPPT = Surat Pemberitahuan Pajak Terutang/ Land and Building Tax
SUTET = Saluran Udara Tegangan Ekstra Tinggi/Extra High Voltage Transmission Line
TDS = Total Dissolve Solids
TMKH = Tukar Menukar Kawasan Hutan/Forest Estate Exchange
TSP = Total Suspended Particulate
TSS = Total Suspended Solid
UCPS = Upper Cisokan Pumped Storage
UKL = Upaya Pengelolaan Lingkungan Hidup/Environmental Management Effort
Unpad = Universitas Padjadjaran
UIP = Unit Induk Pembangunan (development business unit)
UPL = Upaya Pemantauan Lingkungan Hidup/ Environmental Monitoring Effort
USLE = Universal Soil Loss Equation
VU = Vulnerable IUCN Category
WTP = Warga Terdampak Proyek/People Affected Project


1
Draft Environmental and Social Impact Assessment (ESIA) 2020
EXECUTIVE SUMMARY
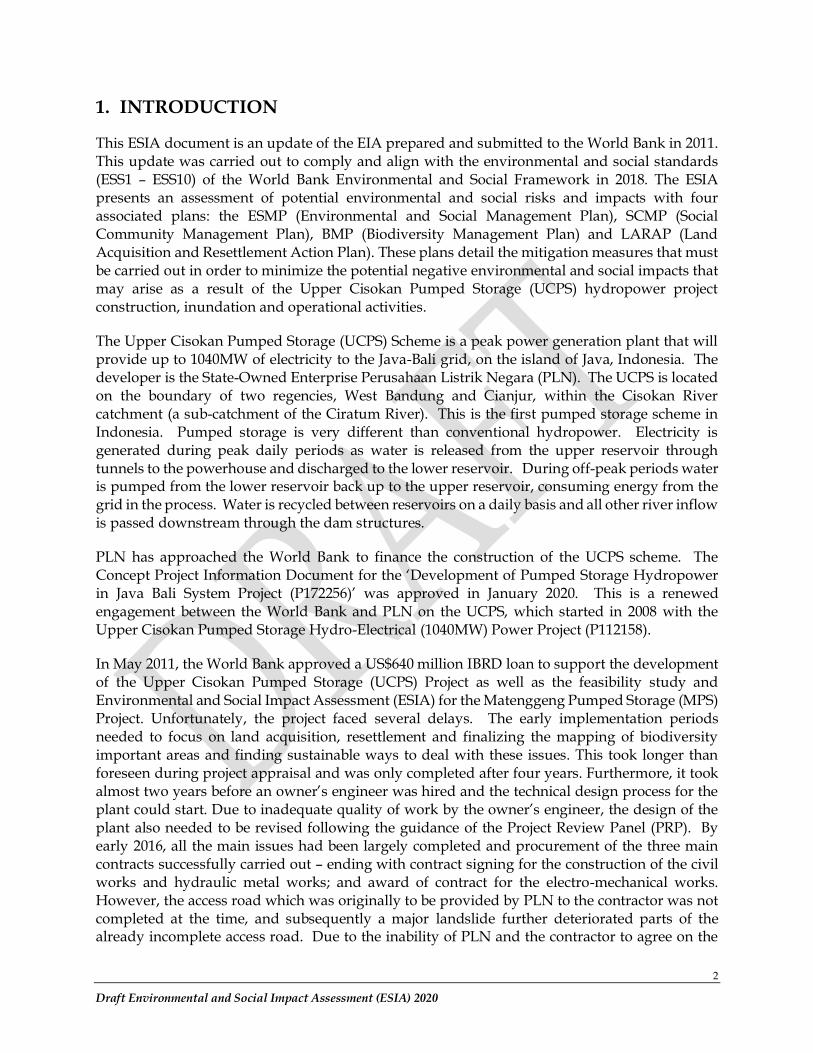
2
Draft Environmental and Social Impact Assessment (ESIA) 2020
1. INTRODUCTION
This ESIA document is an update of the EIA prepared and submitted to the World Bank in 2011. This update was carried out to comply and align with the environmental and social standards (ESS1 – ESS10) of the World Bank Environmental and Social Framework in 2018. The ESIA presents an assessment of potential environmental and social risks and impacts with four associated plans: the ESMP (Environmental and Social Management Plan), SCMP (Social Community Management Plan), BMP (Biodiversity Management Plan) and LARAP (Land Acquisition and Resettlement Action Plan). These plans detail the mitigation measures that must be carried out in order to minimize the potential negative environmental and social impacts that may arise as a result of the Upper Cisokan Pumped Storage (UCPS) hydropower project construction, inundation and operational activities.
The Upper Cisokan Pumped Storage (UCPS) Scheme is a peak power generation plant that will provide up to 1040MW of electricity to the Java-Bali grid, on the island of Java, Indonesia. The developer is the State-Owned Enterprise Perusahaan Listrik Negara (PLN). The UCPS is located on the boundary of two regencies, West Bandung and Cianjur, within the Cisokan River catchment (a sub-catchment of the Ciratum River). This is the first pumped storage scheme in Indonesia. Pumped storage is very different than conventional hydropower. Electricity is generated during peak daily periods as water is released from the upper reservoir through tunnels to the powerhouse and discharged to the lower reservoir. During off-peak periods water is pumped from the lower reservoir back up to the upper reservoir, consuming energy from the grid in the process. Water is recycled between reservoirs on a daily basis and all other river inflow is passed downstream through the dam structures.
PLN has approached the World Bank to finance the construction of the UCPS scheme. The Concept Project Information Document for the ‘Development of Pumped Storage Hydropower in Java Bali System Project (P172256)’ was approved in January 2020. This is a renewed engagement between the World Bank and PLN on the UCPS, which started in 2008 with the Upper Cisokan Pumped Storage Hydro-Electrical (1040MW) Power Project (P112158).
In May 2011, the World Bank approved a US$640 million IBRD loan to support the development of the Upper Cisokan Pumped Storage (UCPS) Project as well as the feasibility study and Environmental and Social Impact Assessment (ESIA) for the Matenggeng Pumped Storage (MPS) Project. Unfortunately, the project faced several delays. The early implementation periods needed to focus on land acquisition, resettlement and finalizing the mapping of biodiversity important areas and finding sustainable ways to deal with these issues. This took longer than foreseen during project appraisal and was only completed after four years. Furthermore, it took almost two years before an owner’s engineer was hired and the technical design process for the plant could start. Due to inadequate quality of work by the owner’s engineer, the design of the plant also needed to be revised following the guidance of the Project Review Panel (PRP). By early 2016, all the main issues had been largely completed and procurement of the three main contracts successfully carried out – ending with contract signing for the construction of the civil works and hydraulic metal works; and award of contract for the electro-mechanical works. However, the access road which was originally to be provided by PLN to the contractor was not completed at the time, and subsequently a major landslide further deteriorated parts of the already incomplete access road. Due to the inability of PLN and the contractor to agree on the
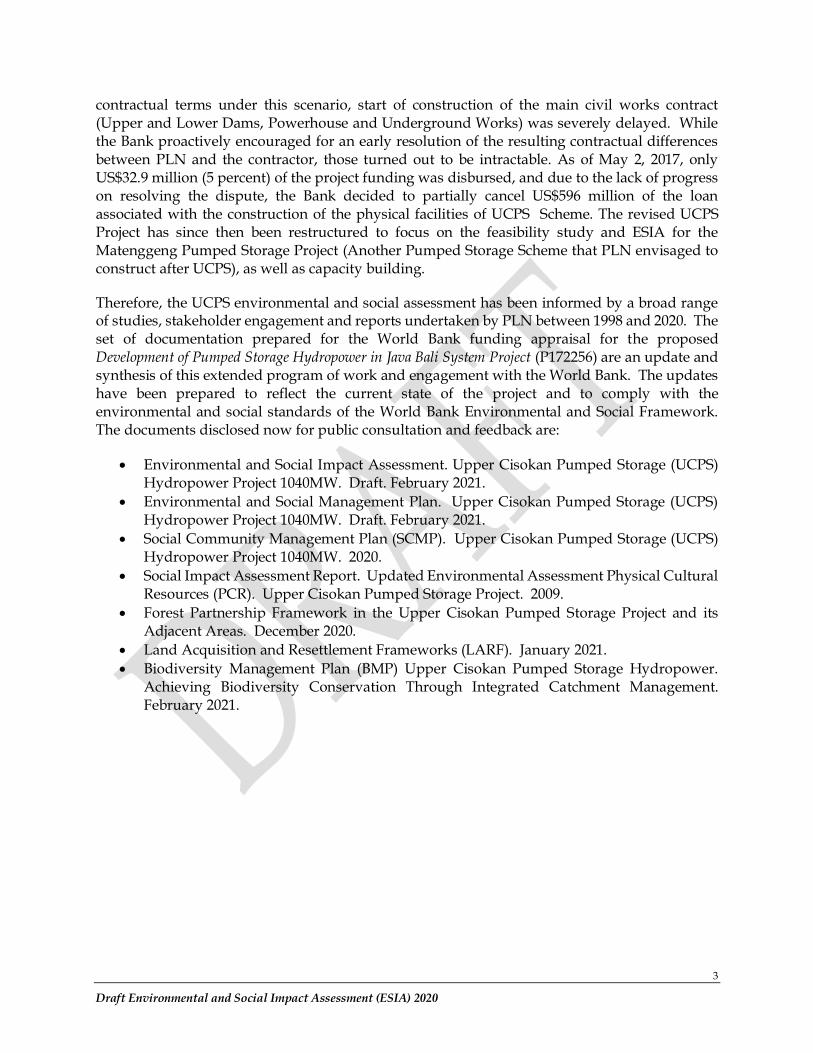
3
Draft Environmental and Social Impact Assessment (ESIA) 2020
contractual terms under this scenario, start of construction of the main civil works contract (Upper and Lower Dams, Powerhouse and Underground Works) was severely delayed. While the Bank proactively encouraged for an early resolution of the resulting contractual differences between PLN and the contractor, those turned out to be intractable. As of May 2, 2017, only US$32.9 million (5 percent) of the project funding was disbursed, and due to the lack of progress on resolving the dispute, the Bank decided to partially cancel US$596 million of the loan associated with the construction of the physical facilities of UCPS Scheme. The revised UCPS Project has since then been restructured to focus on the feasibility study and ESIA for the Matenggeng Pumped Storage Project (Another Pumped Storage Scheme that PLN envisaged to construct after UCPS), as well as capacity building.
Therefore, the UCPS environmental and social assessment has been informed by a broad range of studies, stakeholder engagement and reports undertaken by PLN between 1998 and 2020. The set of documentation prepared for the World Bank funding appraisal for the proposed Development of Pumped Storage Hydropower in Java Bali System Project (P172256) are an update and synthesis of this extended program of work and engagement with the World Bank. The updates have been prepared to reflect the current state of the project and to comply with the environmental and social standards of the World Bank Environmental and Social Framework. The documents disclosed now for public consultation and feedback are:
• Environmental and Social Impact Assessment. Upper Cisokan Pumped Storage (UCPS) Hydropower Project 1040MW. Draft. February 2021.
• Environmental and Social Management Plan. Upper Cisokan Pumped Storage (UCPS) Hydropower Project 1040MW. Draft. February 2021.
• Social Community Management Plan (SCMP). Upper Cisokan Pumped Storage (UCPS) Hydropower Project 1040MW. 2020.
• Social Impact Assessment Report. Updated Environmental Assessment Physical Cultural Resources (PCR). Upper Cisokan Pumped Storage Project. 2009.
• Forest Partnership Framework in the Upper Cisokan Pumped Storage Project and its Adjacent Areas. December 2020.
• Land Acquisition and Resettlement Frameworks (LARF). January 2021.
• Biodiversity Management Plan (BMP) Upper Cisokan Pumped Storage Hydropower. Achieving Biodiversity Conservation Through Integrated Catchment Management. February 2021.
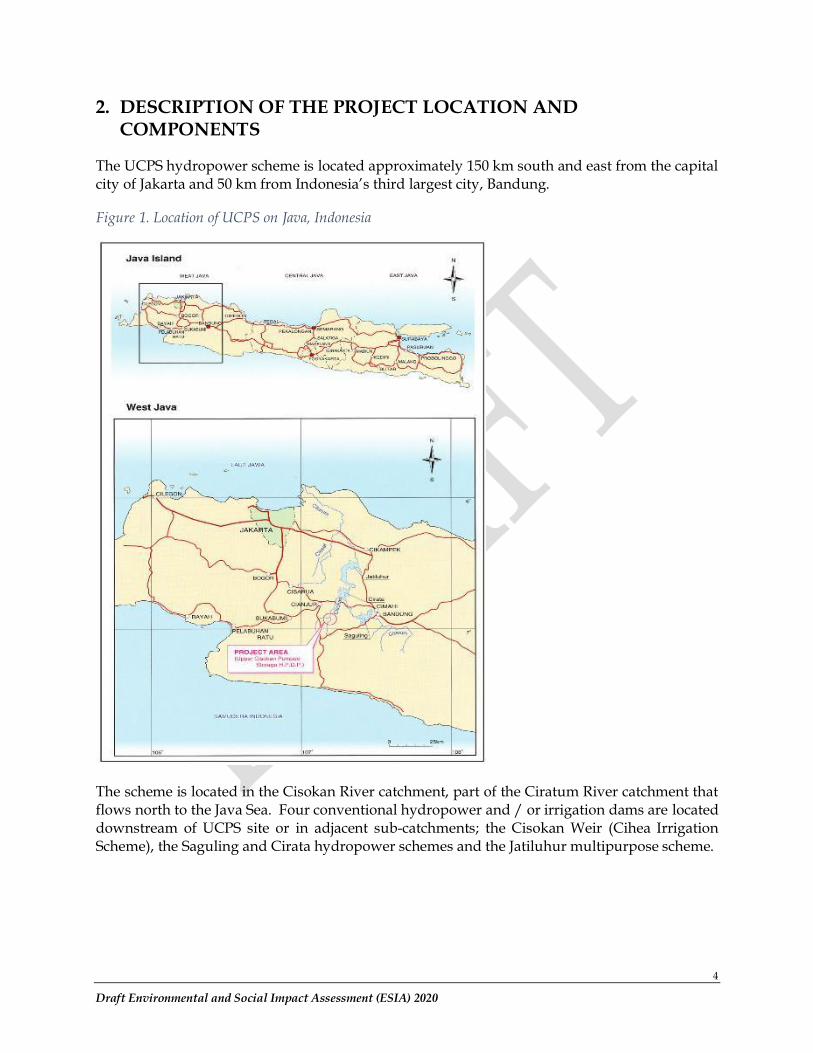
4
Draft Environmental and Social Impact Assessment (ESIA) 2020
2. DESCRIPTION OF THE PROJECT LOCATION AND COMPONENTS
The UCPS hydropower scheme is located approximately 150 km south and east from the capital city of Jakarta and 50 km from Indonesia’s third largest city, Bandung.
Figure 1. Location of UCPS on Java, Indonesia
The scheme is located in the Cisokan River catchment, part of the Ciratum River catchment that flows north to the Java Sea. Four conventional hydropower and / or irrigation dams are located downstream of UCPS site or in adjacent sub-catchments; the Cisokan Weir (Cihea Irrigation Scheme), the Saguling and Cirata hydropower schemes and the Jatiluhur multipurpose scheme.
5
Draft Environmental and Social Impact Assessment (ESIA) 2020
Figure 2. Location and Main Components of the UCPS Project
The UCPS comprises two dams and reservoirs (‘upper’ and ‘lower’); tunnels, underground powerhouse, access roads, switchyard, quarry, temporary construction facilities (accommodation, roads, workshops, laydown areas etc.) and two 500kV transmission lines.
Figure 3. Layout of the Pumped Storage Scheme
6
Draft Environmental and Social Impact Assessment (ESIA) 2020
The upper reservoir is located on the Cirumamis River, with a small catchment of 10 km2. The dam is located at 800m above sea level, with a 75.5 m high dam wall and a reservoir surface area of 80 ha when the water level is at maximum.
The lower dam is situated at about 460m asl on the Cisokan River (watershed area of 374 km2) and comprises a 98 m high dam wall with a reservoir surface area at highest water level of 260 ha. The power plant, with a capacity of 1,040 MW and a pump capacity of 1,100 MW, will be built underground. Two high voltage transmission lines (15.5 km and 15.9 km) will connect the UCPS hydropower plant with the Cibinong-Saguling network in the north. A new 27 km long access road has been constructed (completed in 2019) to provide access to the construction site, and the existing 7 km long road between the quarry and the new access road has been upgraded. The existing Gunung Karang Quarry will be used as a source of rock foundation and building materials.
The total land area required for the UCPS project is 752 ha, consisting of 343 ha of community land, 409 hectares of forest area, and 12 hectares of Village Treasury Land. The total percentage of land that has been acquired by February 2021 is 99.98%.
During construction many temporary facilities will be required, such as accommodation and facilities for workers, workshops, offices, laydown areas, concrete batching, and temporary roads. A 20 kV grid connection will be constructed prior to UCPS construction to provide electricity during the construction period.
2. .1 Purpose of the project
The objective of the UCPS scheme is to significantly increase the peaking capacity of the power generation system in Java-Bali grid in an environmentally and socially sustainable way and strengthen the institutional capacity of the project implementing entity Perusahaan Listrik Negara (PLN) in hydropower planning, development and operation.
UCPS will aim to support instantaneous balancing of electricity supply and demand, thereby maintaining power system stability, security and reliability. It will also provide the storage capacity the power system needs to enable integration of variable renewable energy such as solar and wind energy. In a pumped storage scheme, it is run as a pump station where electricity from the power system is consumed and water is pumped into an upper reservoir and stored. When energy is required by the grid, it is operated as a power generation plant where water is released through one (or more) turbines to a lower reservoir generating electricity to the grid. It can flexibly switch between the water pumping mode to a power generating mode within minutes, allowing it to quickly ramp up to full power production capacity to meet peak demand.1 Pumped water draws from grid electricity during off-peak time, when the price of electricity is low and the system has surplus power, while electricity from a pumped storage plant is produced during peak time when the price of electricity is high and the system needs power supply. In addition to arbitrage benefits, UCPS scheme will reduce the need to use electricity at high costs from inefficient thermal plants. As a proven technology, a large-scale pumped storage plant, such as
1 In comparison, a thermal (e.g., coal) plant with a steam turbine generator takes more than six hours to start its operation from cold start to full load, and its use as partial load is inefficient and highly polluting.
7
Draft Environmental and Social Impact Assessment (ESIA) 2020
UCPS with a 1 GW capacity, when is running at power generation mode, could displace equivalent amount of electricity from thermal plant(s) that would otherwise need to be added to the grid to meet the peak demand.
UCPS scheme will also provide a number of ancillary services to the grid. The flexibility and speed of hydropower turbine operations supports frequency control, allowing for reduction in system operating costs and improving system-wide efficiency. Its ability to switch between pumping and generator modes and ability to absorb valuable reactive power (MVARs) at crucial points on the power system (when used as a Synchronous Condenser (SynCon)) help voltage regulation and stabilization, providing network control services that reduce the overall cost of dispatch and improve system stability. UCPS will provide rapid system restart (or black-start) in the event of black-out of the power system and can also provide outage insurance to cover unplanned outage of other generators or provide contracted coverage for scheduled maintenance periods of other generators.
The ancillary services provided to the grid by UCPS scheme will be particularly valuable to integration of variable renewables at large scale because of its storage capacity. The dynamic response of pumped storage plants would contribute to providing a quick response to power demand variations on the Java-Bali power system and to follow the load more accurately. These features would provide better voltage regulation and ability to stabilize the grid system by the pump-turbine spinning or performing part-load operation. In addition, pumped storage is considered more cost-efficient than battery storage and has much smaller environmental footprint than large hydropower.
2.2 History of project preparation including Bank involvement since 2009
The UCPS project has been approved and implemented based on several relevant laws and regulations applicable in Indonesia, and specifically the Decree of the Governor of West Java Number 593 / Kep-596-Pemksm / 2018 dated June 8, 2018 concerning the Third Amendment to the Decree of the Governor of West Java Number 593 /Kep.1386/Pemum/2011 concerning Stipulation of Land Acquisition Location for the Construction of the Upper Cisokan Pumped Storage (UCPS) hydropower plant in West Bandung Regency and Cianjur Regency for the UCPS hydropower plant. The Indonesian ESIA (called ‘ANDAL’) was prepared in 2009 and PLN since received the environmental permit from the AMDAL committee.
Engagement of the World Bank with the UCPS started in 2008 under the Upper Cisokan Pumped Storage Hydro-Electrical (1040MW) Power Project (P112158). The development objective was to significantly increase the peaking capacity of the power generation system in Java-Bali in an environmentally and socially sustainable way and strengthen the institutional capacity of the project implementing entity (PLN) in hydro-power planning, development and operation. A Consolidated Environmental Impact Assessment and Environmental Management Plan were published in March 2011, based on the Indonesian ANDAL ESIA and additional field surveys and consultations conducted in 2008 and 2009. This document was prepared in accordance with the World Bank safeguards policies. In 2011, two Land Acquisition and Resettlement for Project Affected People (LARAP) reports (one for the hydropower scheme and one for the transmission line) were prepared at this time in accordance with World Bank safeguard policy OP4.12 Involuntary Resettlement and disclosed online. The project was approved for financing by the World Bank board in 2011. A World Bank Mid-Term Review mission was held in March 2016,
8
Draft Environmental and Social Impact Assessment (ESIA) 2020
five years after the project was approved. The review noted that Project implementation was significantly delayed with construction not yet started and only 5% of loan funds disbursed. This situation made it unlikely that the project's development objectives could be met by project close without significant remedial actions in areas such as procurement; project and contract management; environmental and social management; and coordination and monitoring. A partial cancellation for the Upper Cisokan component was signed by the World Bank Regional Vice President on May 2, 2017. The Project had a first restructuring approved on December 21, 2018 to a new focus reflected in the Bank’s continued role in supervision of resettlement activities in compliance with the Project’s LARAP and capacity building.
In 2019, more than two years after the partial cancellation of the loan, PLN has expressed interest in having Bank financing for the Project again. Concept Project Information Document and Environmental and Social Review Summary for ‘Development of Pumped Storage Hydropower in Java Bali System Project (P172256)’ were disclosed by the World Bank in 2020. The project environmental and social risk management instruments disclosed under P172256 are prepared for compliance with the standards in the World Bank Environmental and Social Framework.
2.3 UCPS Progress to Date
The Cisokan River was identified as a suitable area for pumped storage hydropower in 1985. A feasibility study was carried out in 1993-1995 and the first impact and environmental analysis in 1998.
Work on the detailed engineering design was undertaken from 1999 to 2002, followed by supplementary design engineering work in 2006 and 2007. From 2012 to 2013 the detailed design was updated and bid documents were subsequently prepared for the main construction works2. Bid document preparation, prequalification of bidders and the selection of the Contractor for the main works (upper dam, lower dam, tunnels, powerhouse, switchyard, buildings) was subsequently completed. From 2012 to 2017, PLN retained a panel of experts with expertise to review/advise in roller compacted concrete dam design, rock mechanics, engineering geology, instrumentation system design, and hydraulic structures, which reviewed, advised and signed off on key outputs. PLN also retained a panel of international and Indonesian social and environmental experts, who provided review and advisory on the implementation of the ESMP and LARAP.
The construction of UCPS hydropower plant began with the construction of a permanent access road to the main construction project site. Throughout 2012 to 2019, the land acquisition and resettlement process for the new access road and the construction process were carried out. At the same time, land acquisition, resettlement and upgrades to local roads were carried out. Land acquisition and resettlement also occurred for the dam, reservoir, power station infrastructure and transmission lines occurred from 2012 – 2019.
2 Lot 1a Upper and Lower Dams and Lot 1b Waterways, Powerhouse, Switchyard and Buildings.
9
Draft Environmental and Social Impact Assessment (ESIA) 2020
2.4 Environmental and Social Studies and Activities between 2011 and 2020 ESIA
A number of studies have contributed to environmental and social assessment and the mitigation of environmental and social impacts. PLN has had an ongoing program of recruiting external consultants and university teams to collect data, undertake studies and to monitor impacts. Consultation and engagement have been regularly carried out with the community and key stakeholders since the 1990’s. 1998 ANDAL Report UCPS Cisokan (PT.PLN, 1998). 2001 ANDAL Report UCPS Cisokan Additional (PLN/Newjec Inc., 2001). 2007 ANDAL Report UCPS Cisokan (PLN/Newjec Inc., 2007b).
ANDAL Report Transmission Line UCPS Cisokan (PLN/Newjec Inc., 2007a). 2009 Combined EIA Support Study, Biodiversity Survey (Rahmat, 2009). 2009 Physical Cultural Resources Survey. 2011 Consolidated Environmental Impact Assessment P112518. 2011 Environmental and Social Management Plan for P112518. 2011 Access Road Environmental and Social Management Plan for P112518. 2011 Land Acquisition and Resettlement Action Plans for P112518 (UCPS and
transmission line). 2012 Contractor’s Environmental and Social Management Plan for Access Road. 2013 Watershed Management Study Report (Watershed Management) to support
Upstream Cisokan Upper Cisokan Pumped Storage (PT. Geotrav Bhuana Survey). 2014 Biodiversity Management Plan, Universitas Padjadjaran (updated in 2015). 2014 Technical analysis report and scenario development for Integrated Catchment
Management in the Upper Cisokan area, West Java, Indonesia. 2014 Forest Cover survey (satellite imagery). 2015 Integrated Catchment Management Plan Upper Cisokan River Basin, West Java,
Indonesia. 2016 Draft Forest Partnership Framework. 2017 Key Terrestrial Species Monitoring, Universitas Padjadjaran. 2019 Hydrology review report Updating Detailed Design and Preparing Construction
Drawing of Upper Cisokan Pumped Storage Power Plant Project (PLN Enjiniring, Nippon Koei Co.Ltd., NEWJEC Inc., PT. Indokoei International, PT. Wiratman).
2009- 2019 PLN's environmental assessment report through a competent external consultant to obtain data series from 2009 to 2019, for the environmental permit monitoring.
2019 Draft Contractor’s Environmental and Social Management Plan for Upper Dam, Lower Dam, Tunnels, Powerhouse, Switchyard and Buildings.
2020 Environmental and Social Baseline Report. Upper Cisokan Pumped Storage Hydropower.
2020 Review and Update Biodiversity Management Plan (BMP) Study Upper Cisokan Pumped Storage Hydropower 1040MW. October 2020.
2021 Final Report. Review of Land Acquisition and Resettlement Action Plan (LARAP) Implementation. Upper Cisokan Pumped Storage Hydropower. January 2021.
PLN has undertaken environmental monitoring twice a year since 2012 as part of their commitment to their environmental permit and ‘RKL/RPL’. This includes sampling water quality, groundwater quality, noise, air quality and carrying out biodiversity and social surveys.
10
Draft Environmental and Social Impact Assessment (ESIA) 2020
A watershed study was conducted in 2014 to understand the watershed risks with erosion, sediment and changing land uses. An initial Biodiversity Management Plan was prepared in February 2014 adopting the concept of integrated catchment management to meet multiple ecological and community objectives. It was revised over the course of 2015 and a Memorandum of Understanding was signed between PLN and the State-Owned Enterprise for Forestry, Perhutani, to meet the objectives of the plan. A draft Forest Partnership Framework was prepared in parallel, in recognition that protecting forest areas required engagement with the community and protection of livelihoods. Biodiversity surveys continued between 2015 and 2018, especially focusing on species that were not well understood after the initial surveys (e.g., Slow Loris). In 2019, a review of the implementation of the Biodiversity Management Plan was conducted, including additional biodiversity surveys and collection of environmental indicator data for inclusion in the current ESIA.
During the period of 2011 to 2020, consultation with the communities has been ongoing, with many detailed consultations and negotiations with the resettled households and communities and people in the wider project area who will be affected by road use or construction related activities.
Approximately 310.14 ha of community and private land has been acquired for the UCPS hydropower plant development. Affected assets include houses, settlements, cemeteries, mosques, productive land, subsistence agriculture, fishponds and other small businesses. 1,549 households have been compensated for their land and other assets. There are 765 households that must be relocated from the impacted area. Approximately 409 ha of state forest land has been acquired, restricting the use of that land by locals who relied on it for agriculture, timber and non-timber forest products. The resettlement process or other social impact or compensation issues were managed through the LARAP. Implementation of the LARAPs has been reviewed by independent consultants and presented in standalone document of LARAP Implementation Status Review (2021).
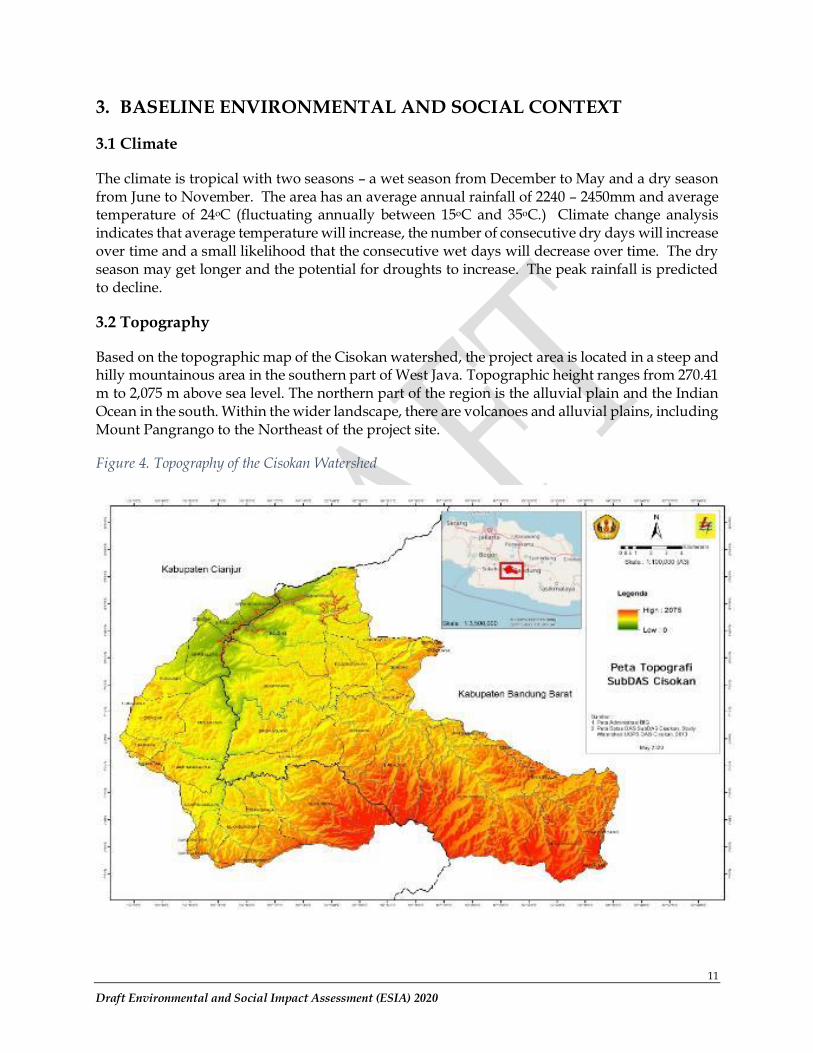
11
Draft Environmental and Social Impact Assessment (ESIA) 2020
3. BASELINE ENVIRONMENTAL AND SOCIAL CONTEXT
3.1 Climate
The climate is tropical with two seasons – a wet season from December to May and a dry season from June to November. The area has an average annual rainfall of 2240 – 2450mm and average temperature of 24oC (fluctuating annually between 15oC and 35oC.) Climate change analysis indicates that average temperature will increase, the number of consecutive dry days will increase over time and a small likelihood that the consecutive wet days will decrease over time. The dry season may get longer and the potential for droughts to increase. The peak rainfall is predicted to decline.
3.2 Topography
Based on the topographic map of the Cisokan watershed, the project area is located in a steep and hilly mountainous area in the southern part of West Java. Topographic height ranges from 270.41 m to 2,075 m above sea level. The northern part of the region is the alluvial plain and the Indian Ocean in the south. Within the wider landscape, there are volcanoes and alluvial plains, including Mount Pangrango to the Northeast of the project site.
Figure 4. Topography of the Cisokan Watershed
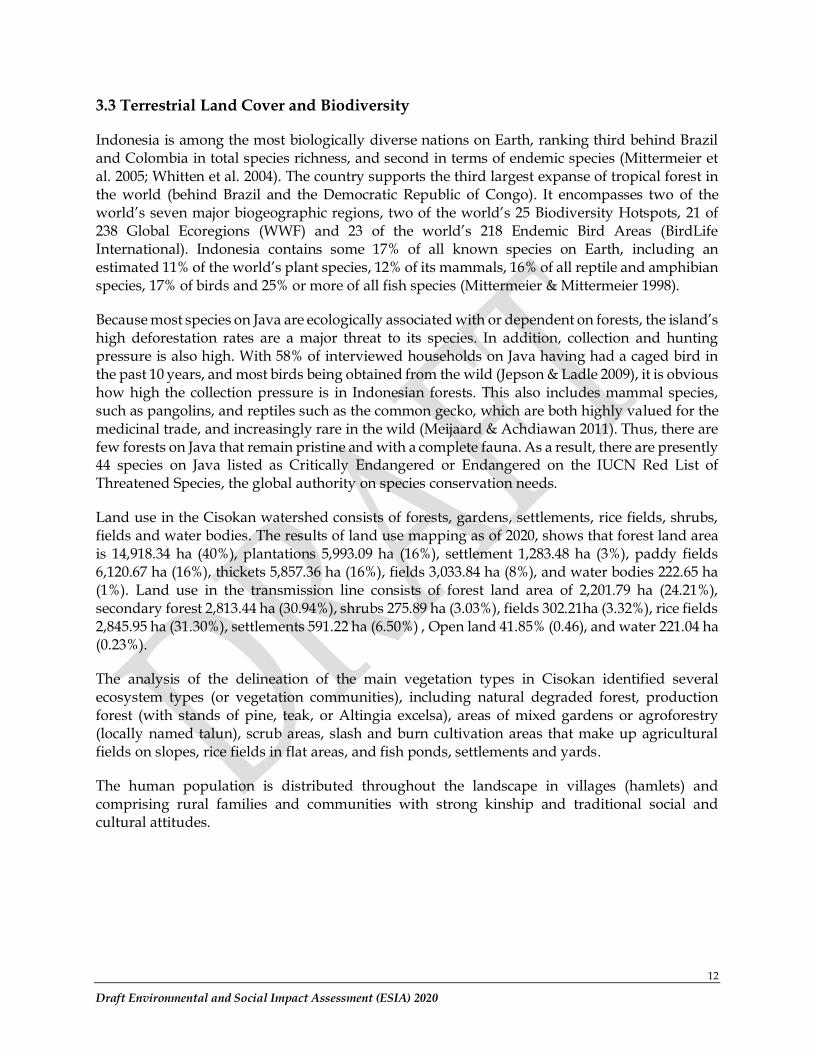
12
Draft Environmental and Social Impact Assessment (ESIA) 2020
3.3 Terrestrial Land Cover and Biodiversity
Indonesia is among the most biologically diverse nations on Earth, ranking third behind Brazil and Colombia in total species richness, and second in terms of endemic species (Mittermeier et al. 2005; Whitten et al. 2004). The country supports the third largest expanse of tropical forest in the world (behind Brazil and the Democratic Republic of Congo). It encompasses two of the world’s seven major biogeographic regions, two of the world’s 25 Biodiversity Hotspots, 21 of 238 Global Ecoregions (WWF) and 23 of the world’s 218 Endemic Bird Areas (BirdLife International). Indonesia contains some 17% of all known species on Earth, including an estimated 11% of the world’s plant species, 12% of its mammals, 16% of all reptile and amphibian species, 17% of birds and 25% or more of all fish species (Mittermeier & Mittermeier 1998).
Because most species on Java are ecologically associated with or dependent on forests, the island’s high deforestation rates are a major threat to its species. In addition, collection and hunting pressure is also high. With 58% of interviewed households on Java having had a caged bird in the past 10 years, and most birds being obtained from the wild (Jepson & Ladle 2009), it is obvious how high the collection pressure is in Indonesian forests. This also includes mammal species, such as pangolins, and reptiles such as the common gecko, which are both highly valued for the medicinal trade, and increasingly rare in the wild (Meijaard & Achdiawan 2011). Thus, there are few forests on Java that remain pristine and with a complete fauna. As a result, there are presently 44 species on Java listed as Critically Endangered or Endangered on the IUCN Red List of Threatened Species, the global authority on species conservation needs.
Land use in the Cisokan watershed consists of forests, gardens, settlements, rice fields, shrubs, fields and water bodies. The results of land use mapping as of 2020, shows that forest land area is 14,918.34 ha (40%), plantations 5,993.09 ha (16%), settlement 1,283.48 ha (3%), paddy fields 6,120.67 ha (16%), thickets 5,857.36 ha (16%), fields 3,033.84 ha (8%), and water bodies 222.65 ha (1%). Land use in the transmission line consists of forest land area of 2,201.79 ha (24.21%), secondary forest 2,813.44 ha (30.94%), shrubs 275.89 ha (3.03%), fields 302.21ha (3.32%), rice fields 2,845.95 ha (31.30%), settlements 591.22 ha (6.50%) , Open land 41.85% (0.46), and water 221.04 ha (0.23%).
The analysis of the delineation of the main vegetation types in Cisokan identified several ecosystem types (or vegetation communities), including natural degraded forest, production forest (with stands of pine, teak, or Altingia excelsa), areas of mixed gardens or agroforestry (locally named talun), scrub areas, slash and burn cultivation areas that make up agricultural fields on slopes, rice fields in flat areas, and fish ponds, settlements and yards.
The human population is distributed throughout the landscape in villages (hamlets) and comprising rural families and communities with strong kinship and traditional social and cultural attitudes.
13
Draft Environmental and Social Impact Assessment (ESIA) 2020
Figure 5 Land Cover in the UCPS project area (2020)
Natural degraded or secondary forest is a combination of native and non-native shrub and tree species that have grown back after land clearing, see Figure 31. Throughout the area, this vegetation can be found in fragments, usually in more steep areas where agriculture or forest cannot grow. This area includes inaccessible cliffs and riverbanks in hillside gaps and is found along the Cirumamis River between the upper and lower reservoir areas.
The state production forest in the area around the project is managed by the state forestry company on Java (Perhutani) and is dominated by pine and mahogany trees, with the ground cover in the form of grass. The production forest in the area around the project is a habitat for many natural fauna. Local people take advantage of pine trees for their sap.
Mixed garden is a land use type found between agricultural fields and plantations and forests. This type of land use serves to support food needs and provide additional income for local communities. Types of commodities grown include food crops, coffee, bananas, avocados, coconuts, bamboo and sugar palm.
The UCPS scheme qualifies as a Modified Habitat because of the significant and long-term anthropogenic interventions. The project area is contiguous with a larger landscape of >15,000 ha, with similarly disturbed vegetation types.
The presence of several Endangered and Critically Endangered species indicates Critical Habitat - Slow Loris, Surili/ Grizzled Leaf Monkey, Javan Leopard, Silvery Gibbon and Javan Hawk
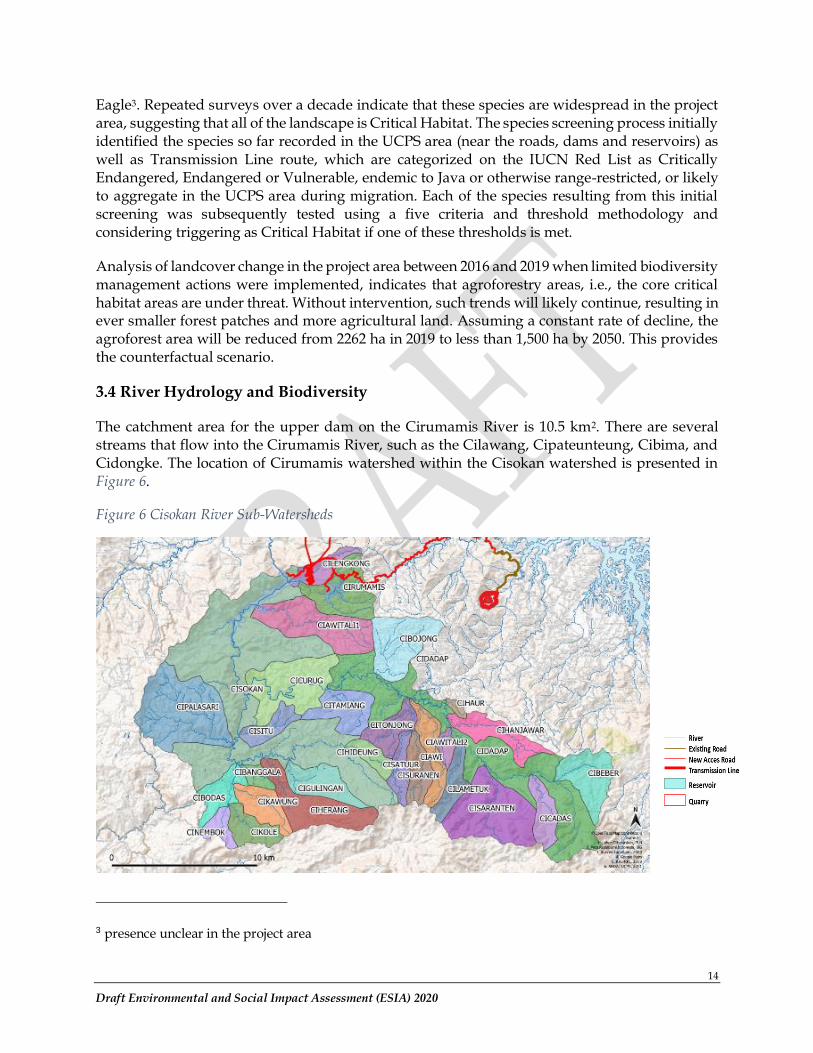
14
Draft Environmental and Social Impact Assessment (ESIA) 2020
Eagle3. Repeated surveys over a decade indicate that these species are widespread in the project area, suggesting that all of the landscape is Critical Habitat. The species screening process initially identified the species so far recorded in the UCPS area (near the roads, dams and reservoirs) as well as Transmission Line route, which are categorized on the IUCN Red List as Critically Endangered, Endangered or Vulnerable, endemic to Java or otherwise range-restricted, or likely to aggregate in the UCPS area during migration. Each of the species resulting from this initial screening was subsequently tested using a five criteria and threshold methodology and considering triggering as Critical Habitat if one of these thresholds is met.
Analysis of landcover change in the project area between 2016 and 2019 when limited biodiversity management actions were implemented, indicates that agroforestry areas, i.e., the core critical habitat areas are under threat. Without intervention, such trends will likely continue, resulting in ever smaller forest patches and more agricultural land. Assuming a constant rate of decline, the agroforest area will be reduced from 2262 ha in 2019 to less than 1,500 ha by 2050. This provides the counterfactual scenario.
3.4 River Hydrology and Biodiversity
The catchment area for the upper dam on the Cirumamis River is 10.5 km2. There are several streams that flow into the Cirumamis River, such as the Cilawang, Cipateunteung, Cibima, and Cidongke. The location of Cirumamis watershed within the Cisokan watershed is presented in Figure 6.
Figure 6 Cisokan River Sub-Watersheds
3 presence unclear in the project area

15
Draft Environmental and Social Impact Assessment (ESIA) 2020
Cisokan River flow has been synthesized from the downstream Maglid station. The flow data presented below shows a distinct wet/dry season pattern of flow. The flow duration curve indicates that the river responds quickly to rainfall events and has long periods of low flow.
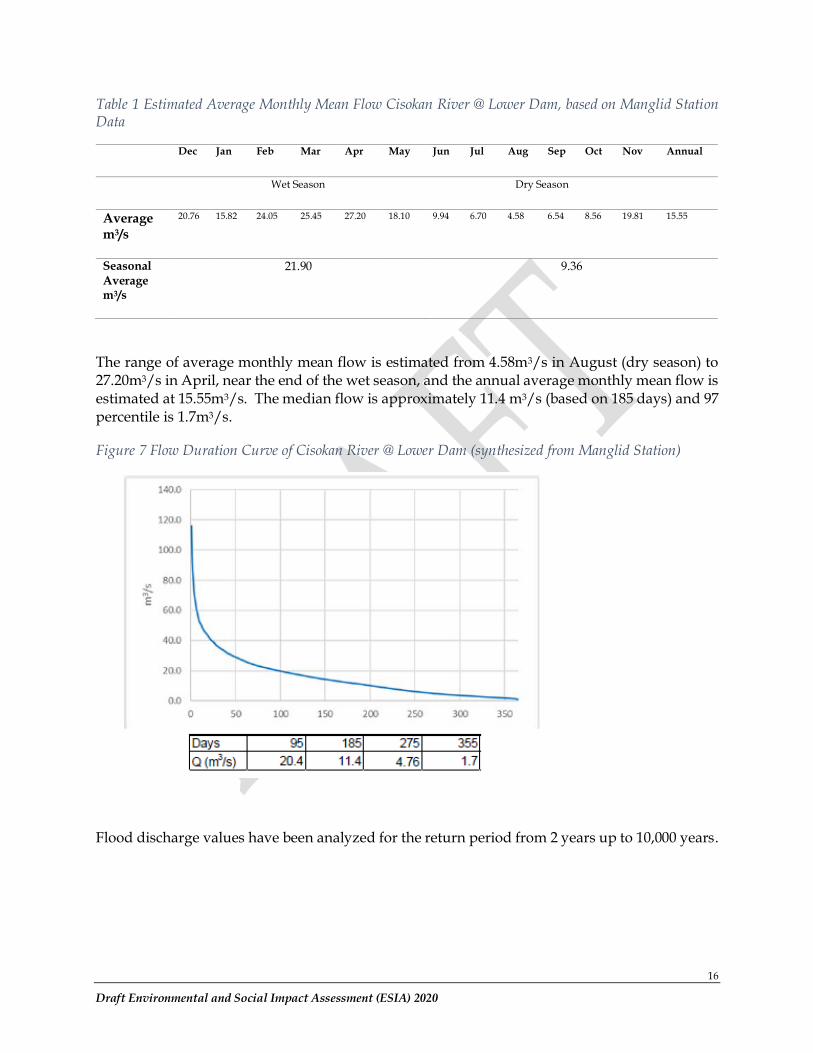
16
Draft Environmental and Social Impact Assessment (ESIA) 2020
Table 1 Estimated Average Monthly Mean Flow Cisokan River @ Lower Dam, based on Manglid Station Data
Dec Jan Feb Mar Apr May Jun Jul Aug Sep Oct Nov Annual
Wet Season Dry Season
Average m3/s
20.76 15.82 24.05 25.45 27.20 18.10 9.94 6.70 4.58 6.54 8.56 19.81 15.55
Seasonal Average m3/s
21.90 9.36
The range of average monthly mean flow is estimated from 4.58m3/s in August (dry season) to 27.20m3/s in April, near the end of the wet season, and the annual average monthly mean flow is estimated at 15.55m3/s. The median flow is approximately 11.4 m3/s (based on 185 days) and 97 percentile is 1.7m3/s.
Figure 7 Flow Duration Curve of Cisokan River @ Lower Dam (synthesized from Manglid Station)
Flood discharge values have been analyzed for the return period from 2 years up to 10,000 years.
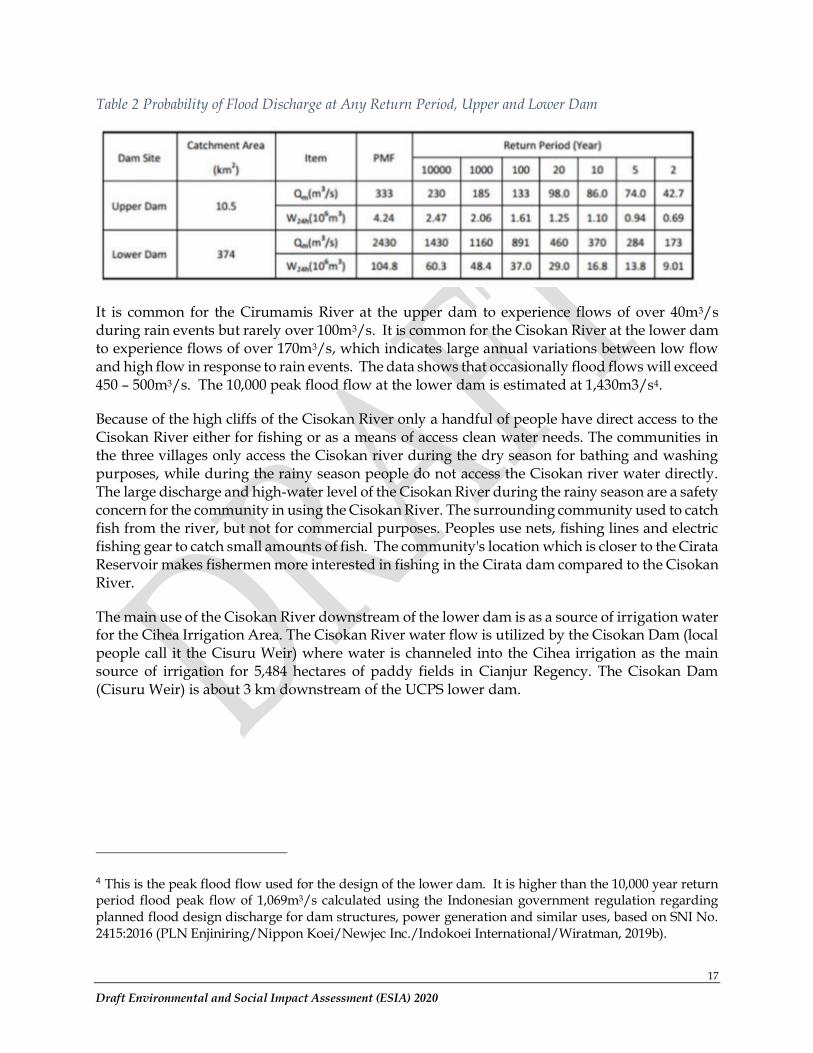
17
Draft Environmental and Social Impact Assessment (ESIA) 2020
Table 2 Probability of Flood Discharge at Any Return Period, Upper and Lower Dam
It is common for the Cirumamis River at the upper dam to experience flows of over 40m3/s during rain events but rarely over 100m3/s. It is common for the Cisokan River at the lower dam to experience flows of over 170m3/s, which indicates large annual variations between low flow and high flow in response to rain events. The data shows that occasionally flood flows will exceed 450 – 500m3/s. The 10,000 peak flood flow at the lower dam is estimated at 1,430m3/s4.
Because of the high cliffs of the Cisokan River only a handful of people have direct access to the Cisokan River either for fishing or as a means of access clean water needs. The communities in the three villages only access the Cisokan river during the dry season for bathing and washing purposes, while during the rainy season people do not access the Cisokan river water directly. The large discharge and high-water level of the Cisokan River during the rainy season are a safety concern for the community in using the Cisokan River. The surrounding community used to catch fish from the river, but not for commercial purposes. Peoples use nets, fishing lines and electric fishing gear to catch small amounts of fish. The community's location which is closer to the Cirata Reservoir makes fishermen more interested in fishing in the Cirata dam compared to the Cisokan River.
The main use of the Cisokan River downstream of the lower dam is as a source of irrigation water for the Cihea Irrigation Area. The Cisokan River water flow is utilized by the Cisokan Dam (local people call it the Cisuru Weir) where water is channeled into the Cihea irrigation as the main source of irrigation for 5,484 hectares of paddy fields in Cianjur Regency. The Cisokan Dam (Cisuru Weir) is about 3 km downstream of the UCPS lower dam.
4 This is the peak flood flow used for the design of the lower dam. It is higher than the 10,000 year return period flood peak flow of 1,069m3/s calculated using the Indonesian government regulation regarding planned flood design discharge for dam structures, power generation and similar uses, based on SNI No. 2415:2016 (PLN Enjiniring/Nippon Koei/Newjec Inc./Indokoei International/Wiratman, 2019b).
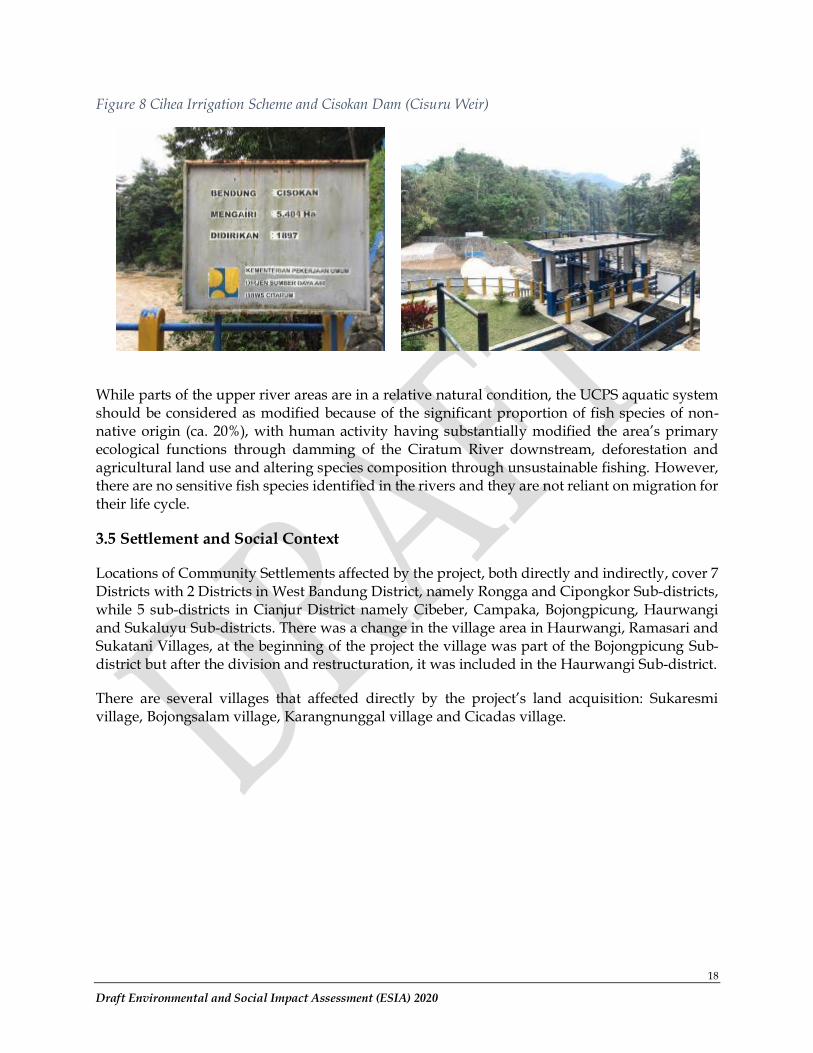
18
Draft Environmental and Social Impact Assessment (ESIA) 2020
Figure 8 Cihea Irrigation Scheme and Cisokan Dam (Cisuru Weir)
While parts of the upper river areas are in a relative natural condition, the UCPS aquatic system should be considered as modified because of the significant proportion of fish species of non-native origin (ca. 20%), with human activity having substantially modified the area’s primary ecological functions through damming of the Ciratum River downstream, deforestation and agricultural land use and altering species composition through unsustainable fishing. However, there are no sensitive fish species identified in the rivers and they are not reliant on migration for their life cycle.
3.5 Settlement and Social Context
Locations of Community Settlements affected by the project, both directly and indirectly, cover 7 Districts with 2 Districts in West Bandung District, namely Rongga and Cipongkor Sub-districts, while 5 sub-districts in Cianjur District namely Cibeber, Campaka, Bojongpicung, Haurwangi and Sukaluyu Sub-districts. There was a change in the village area in Haurwangi, Ramasari and Sukatani Villages, at the beginning of the project the village was part of the Bojongpicung Sub-district but after the division and restructuration, it was included in the Haurwangi Sub-district.
There are several villages that affected directly by the project’s land acquisition: Sukaresmi village, Bojongsalam village, Karangnunggal village and Cicadas village.
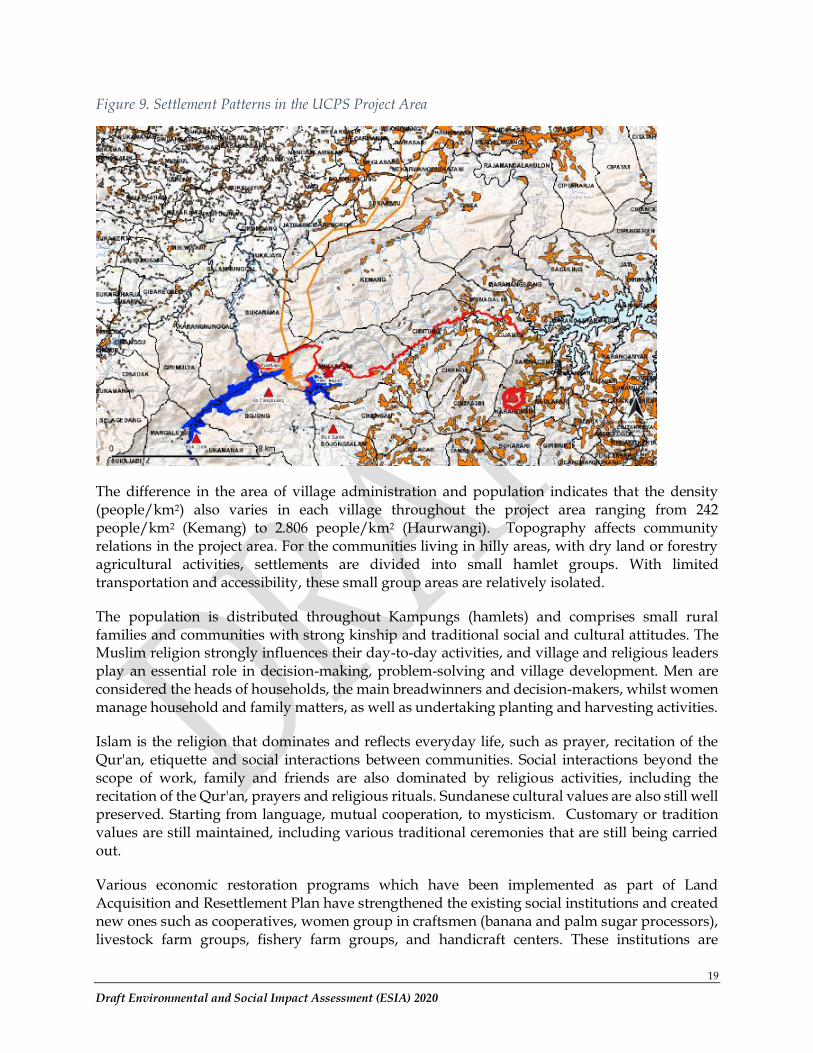
19
Draft Environmental and Social Impact Assessment (ESIA) 2020
Figure 9. Settlement Patterns in the UCPS Project Area
The difference in the area of village administration and population indicates that the density (people/km2) also varies in each village throughout the project area ranging from 242 people/km2 (Kemang) to 2.806 people/km2 (Haurwangi). Topography affects community relations in the project area. For the communities living in hilly areas, with dry land or forestry agricultural activities, settlements are divided into small hamlet groups. With limited transportation and accessibility, these small group areas are relatively isolated.
The population is distributed throughout Kampungs (hamlets) and comprises small rural families and communities with strong kinship and traditional social and cultural attitudes. The Muslim religion strongly influences their day-to-day activities, and village and religious leaders play an essential role in decision-making, problem-solving and village development. Men are considered the heads of households, the main breadwinners and decision-makers, whilst women manage household and family matters, as well as undertaking planting and harvesting activities.
Islam is the religion that dominates and reflects everyday life, such as prayer, recitation of the Qur'an, etiquette and social interactions between communities. Social interactions beyond the scope of work, family and friends are also dominated by religious activities, including the recitation of the Qur'an, prayers and religious rituals. Sundanese cultural values are also still well preserved. Starting from language, mutual cooperation, to mysticism. Customary or tradition values are still maintained, including various traditional ceremonies that are still being carried out.
Various economic restoration programs which have been implemented as part of Land Acquisition and Resettlement Plan have strengthened the existing social institutions and created new ones such as cooperatives, women group in craftsmen (banana and palm sugar processors), livestock farm groups, fishery farm groups, and handicraft centers. These institutions are
20
Draft Environmental and Social Impact Assessment (ESIA) 2020
considered very essential. Other new social institutions are the Forest Farmers Group and the Forest Village Community Organisation that were developed within the social forestry program.
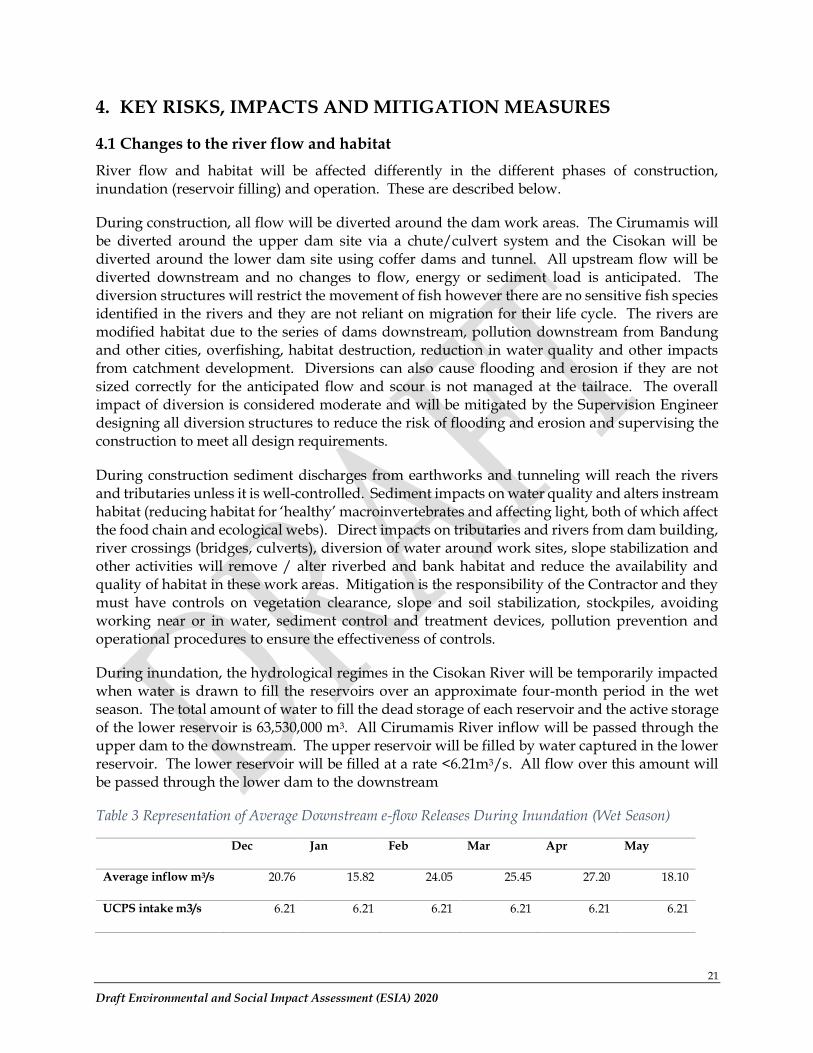
21
Draft Environmental and Social Impact Assessment (ESIA) 2020
4. KEY RISKS, IMPACTS AND MITIGATION MEASURES
4.1 Changes to the river flow and habitat
River flow and habitat will be affected differently in the different phases of construction, inundation (reservoir filling) and operation. These are described below.
During construction, all flow will be diverted around the dam work areas. The Cirumamis will be diverted around the upper dam site via a chute/culvert system and the Cisokan will be diverted around the lower dam site using coffer dams and tunnel. All upstream flow will be diverted downstream and no changes to flow, energy or sediment load is anticipated. The diversion structures will restrict the movement of fish however there are no sensitive fish species identified in the rivers and they are not reliant on migration for their life cycle. The rivers are modified habitat due to the series of dams downstream, pollution downstream from Bandung and other cities, overfishing, habitat destruction, reduction in water quality and other impacts from catchment development. Diversions can also cause flooding and erosion if they are not sized correctly for the anticipated flow and scour is not managed at the tailrace. The overall impact of diversion is considered moderate and will be mitigated by the Supervision Engineer designing all diversion structures to reduce the risk of flooding and erosion and supervising the construction to meet all design requirements.
During construction sediment discharges from earthworks and tunneling will reach the rivers and tributaries unless it is well-controlled. Sediment impacts on water quality and alters instream habitat (reducing habitat for ‘healthy’ macroinvertebrates and affecting light, both of which affect the food chain and ecological webs). Direct impacts on tributaries and rivers from dam building, river crossings (bridges, culverts), diversion of water around work sites, slope stabilization and other activities will remove / alter riverbed and bank habitat and reduce the availability and quality of habitat in these work areas. Mitigation is the responsibility of the Contractor and they must have controls on vegetation clearance, slope and soil stabilization, stockpiles, avoiding working near or in water, sediment control and treatment devices, pollution prevention and operational procedures to ensure the effectiveness of controls.
During inundation, the hydrological regimes in the Cisokan River will be temporarily impacted when water is drawn to fill the reservoirs over an approximate four-month period in the wet season. The total amount of water to fill the dead storage of each reservoir and the active storage of the lower reservoir is 63,530,000 m3. All Cirumamis River inflow will be passed through the upper dam to the downstream. The upper reservoir will be filled by water captured in the lower reservoir. The lower reservoir will be filled at a rate <6.21m3/s. All flow over this amount will be passed through the lower dam to the downstream
Table 3 Representation of Average Downstream e-flow Releases During Inundation (Wet Season)
Dec Jan Feb Mar Apr May
Average inflow m3/s 20.76 15.82 24.05 25.45 27.20 18.10
UCPS intake m3/s 6.21 6.21 6.21 6.21 6.21 6.21
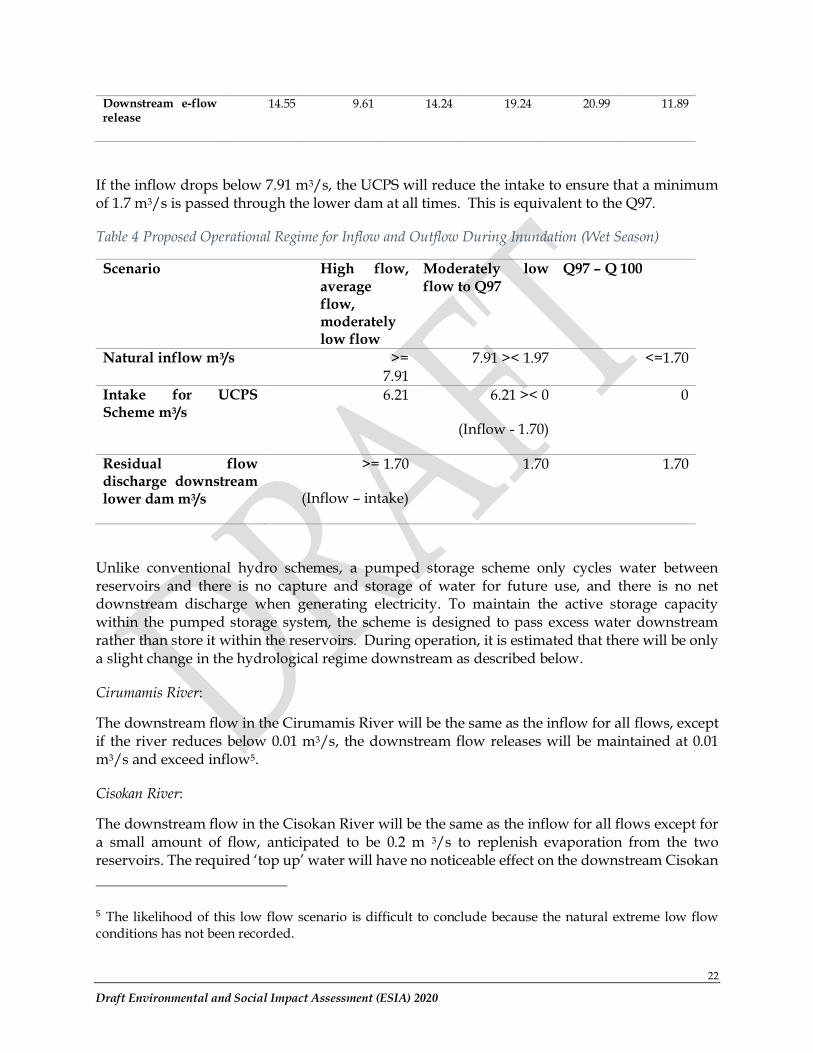
22
Draft Environmental and Social Impact Assessment (ESIA) 2020
Downstream e-flow release
14.55 9.61 14.24 19.24 20.99 11.89
If the inflow drops below 7.91 m3/s, the UCPS will reduce the intake to ensure that a minimum of 1.7 m3/s is passed through the lower dam at all times. This is equivalent to the Q97.
Table 4 Proposed Operational Regime for Inflow and Outflow During Inundation (Wet Season)
Scenario High flow, average flow, moderately low flow
Moderately low flow to Q97
Q97 – Q 100
Natural inflow m3/s >= 7.91
7.91 >< 1.97 <=1.70
Intake for UCPS Scheme m3/s
6.21 6.21 >< 0
(Inflow - 1.70)
0
Residual flow discharge downstream lower dam m3/s
>= 1.70
(Inflow – intake)
1.70 1.70
Unlike conventional hydro schemes, a pumped storage scheme only cycles water between reservoirs and there is no capture and storage of water for future use, and there is no net downstream discharge when generating electricity. To maintain the active storage capacity within the pumped storage system, the scheme is designed to pass excess water downstream rather than store it within the reservoirs. During operation, it is estimated that there will be only a slight change in the hydrological regime downstream as described below.
Cirumamis River:
The downstream flow in the Cirumamis River will be the same as the inflow for all flows, except if the river reduces below 0.01 m3/s, the downstream flow releases will be maintained at 0.01 m3/s and exceed inflow5.
Cisokan River:
The downstream flow in the Cisokan River will be the same as the inflow for all flows except for a small amount of flow, anticipated to be 0.2 m 3/s to replenish evaporation from the two reservoirs. The required ‘top up’ water will have no noticeable effect on the downstream Cisokan
5 The likelihood of this low flow scenario is difficult to conclude because the natural extreme low flow conditions has not been recorded.
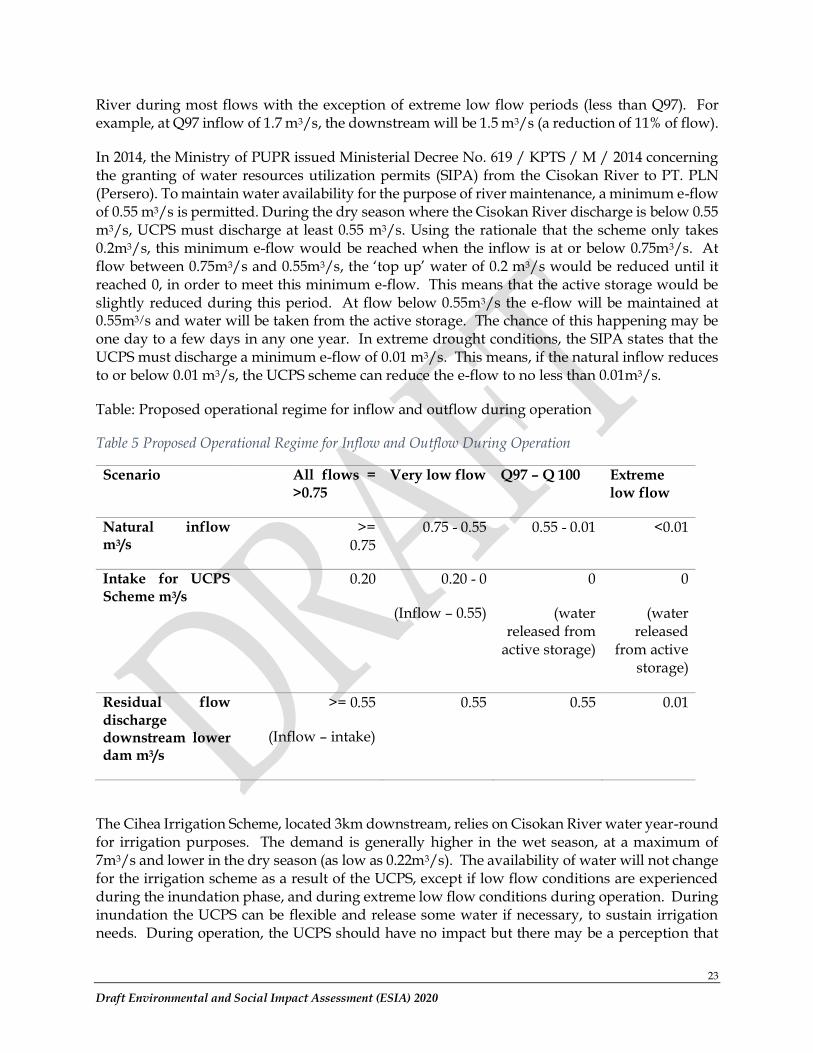
23
Draft Environmental and Social Impact Assessment (ESIA) 2020
River during most flows with the exception of extreme low flow periods (less than Q97). For example, at Q97 inflow of 1.7 m3/s, the downstream will be 1.5 m3/s (a reduction of 11% of flow).
In 2014, the Ministry of PUPR issued Ministerial Decree No. 619 / KPTS / M / 2014 concerning the granting of water resources utilization permits (SIPA) from the Cisokan River to PT. PLN (Persero). To maintain water availability for the purpose of river maintenance, a minimum e-flow of 0.55 m3/s is permitted. During the dry season where the Cisokan River discharge is below 0.55 m3/s, UCPS must discharge at least 0.55 m3/s. Using the rationale that the scheme only takes 0.2m3/s, this minimum e-flow would be reached when the inflow is at or below 0.75m3/s. At flow between 0.75m3/s and 0.55m3/s, the ‘top up’ water of 0.2 m3/s would be reduced until it reached 0, in order to meet this minimum e-flow. This means that the active storage would be slightly reduced during this period. At flow below 0.55m3/s the e-flow will be maintained at 0.55m3/s and water will be taken from the active storage. The chance of this happening may be one day to a few days in any one year. In extreme drought conditions, the SIPA states that the UCPS must discharge a minimum e-flow of 0.01 m3/s. This means, if the natural inflow reduces to or below 0.01 m3/s, the UCPS scheme can reduce the e-flow to no less than 0.01m3/s.
Table: Proposed operational regime for inflow and outflow during operation
Table 5 Proposed Operational Regime for Inflow and Outflow During Operation
Scenario All flows = >0.75
Very low flow Q97 – Q 100 Extreme low flow
Natural inflow m3/s
>= 0.75
0.75 - 0.55 0.55 - 0.01 <0.01
Intake for UCPS Scheme m3/s
0.20 0.20 - 0
(Inflow – 0.55)
0
(water released from
active storage)
0
(water released
from active storage)
Residual flow discharge downstream lower dam m3/s
>= 0.55
(Inflow – intake)
0.55 0.55 0.01
The Cihea Irrigation Scheme, located 3km downstream, relies on Cisokan River water year-round for irrigation purposes. The demand is generally higher in the wet season, at a maximum of 7m3/s and lower in the dry season (as low as 0.22m3/s). The availability of water will not change for the irrigation scheme as a result of the UCPS, except if low flow conditions are experienced during the inundation phase, and during extreme low flow conditions during operation. During inundation the UCPS can be flexible and release some water if necessary, to sustain irrigation needs. During operation, the UCPS should have no impact but there may be a perception that
24
Draft Environmental and Social Impact Assessment (ESIA) 2020
the scheme is responsible for droughts or floods. To mitigate this PLN should develop operational criteria with the Irrigation Scheme committee.
The conclusion is that there will be a low impact on water flow in the Cirumamis and Cisokan Rivers, and at extreme low flow conditions the UCPS can release water downstream to maintain a higher than natural flow during these times.
Changes in erosion patterns and deposition may occur downstream of the Cisokan River during operations, due to reduced sediment loads. Sediment will be deposited in the upper and lower dam and only suspended sediment will be transported downstream through the spillway and outlet. This will have impacts on the rate, location and scale of erosion and sedimentation in the river bed, since river flow will be maintained, there will be increased energy in the system which is likely to cause erosion in areas that do not currently experience it. This needs to be studied further to determine the nature and scale of impact.
4.2 Key risks and impacts on terrestrial biodiversity and mitigation measures
The impact analysis concludes that in the UCPS project area, 400 ha of Critical Habitat will be directly impacted and 2,288 ha indirectly, while along the transmission line, 100 ha will be directly impacted and 341 ha indirectly. This results in total impact estimates on Critical Habitat of 500 ha of directly impacted areas and 2,629 ha of indirectly impacted areas. Taking into consideration the counterfactual trends, the area impacted is smaller, i.e., 1,867 ha.
The Biodiversity Management Plan (BMP) has been updated and supersedes the previous BMP publicly disclosed in 2011 as a sub-plan to the ESMP, as well as the BMP prepared but not published in 2015. The BMP provides practical guidance for reducing threats to biodiversity where practical, to manage identified risks, to engage with communities and stakeholders, and to pro-actively support the development of knowledge in biodiversity conservation using the ESS 6 mitigation hierarchy. Through this BMP, the aim is to engage with biodiversity professionals, government, the community, non-government organizations (NGOs), researchers and appropriate individuals to achieve a high standard of biodiversity and conservation management.
The Biodiversity Management Plan (BMP) is prepared to manage the direct and indirect impacts of the Cisokan hydropower project on the condition of biodiversity and for the maintenance of project-affected areas. It is is implemented through an Integrated Catchment Management (ICM) approach that simultaneously addresses biodiversity, environmental and social aspects of landscape management. It provides a sound rationale for a range of actions that focus on (a)Construction-related impact mitigation and management; (b) Reforestation and forest management; (c) Wildlife management; (d) Stakeholder participation; and (e) Community engagement. Within the project area of influence the BMP goals are: (i) To achieve net gain of Critical Habitat and Natural Habitat; (ii) To protect and enhance the remnant forest communities (both the habitat and wildlife) to create a self-sustaining ecosystem; (iii) To protect and increase the populations of critically endangered and endangered species so that they are self-sustaining; (iv) To take into account the ongoing threats to biodiversity conservation from the community and rural development in the selection and implementation of conservation strategies; and (v) To create a common understanding amongst stakeholders and the community about the biodiversity values and threats.
25
Draft Environmental and Social Impact Assessment (ESIA) 2020
Implementation of the ICM will through a Forest Partnership Framework aims to restore a connected (agro-)forest landscape across 3,800 ha of land around the UCPS reservoirs and project facilities. The most practical way to establish the ICM program will be to pursue a collaborative forest management option between PLN, local communities and Perhutani. This strategy would build on existing land use patterns and land ownership, facilitating a relatively easy entry point to get the principal ideas of ICM established and tested.
Fifteen (15) Biodiversity Important Areas (BIA) have been identified in the immediate project area, with a total area of about 425 ha. The BIAs are presently forested islands in a non-forest landscape. They provide insufficient ecological resources to sustain viable populations of threatened species. The 3,800 ha of restoration aims to provide a net positive gain in biodiversity
values, offsetting the 500 ha of direct impacts on critical habitat and the 2,629 ha of indirect impacts on critical habitat, or 1,867 ha under the counterfactual scenario. It simultaneously aims to restore the terrestrial biodiversity component by significantly increasing ecological connectivity among forest areas, benefiting species that trigger the Critical Habitat criteria, such as Slow Loris and Grizzled Leaf Monkey, and the aquatic habitat by improving ecological conditions alongside tributaries flowing into the reservoirs. Finally, the restoration and offsetting strategies aim to fulfil socio-economic objectives through the development of financially viable social forestry and agroforestry programs. These aim to restore original agroforestry-based land uses in the UCPS area that provide communities with improved income and reduce ecologically damaging land practices, such as open field agricultural cultivation on steep slopes.
4.3 Climate change risk from greenhouse gas emissions
A climate change risk assessment has been conducted and will be further updated prior to appraisal.
Calculation of the contribution of UCPS to greenhouse gas emissions / emissions reductions is difficult due to the complex role it will play in grid stability. As a scheme it will be a net energy consumer (pumping will require more energy than the scheme will generate). However, with pumped storage in the Java-Bali grid it will allow the more efficient use of renewable and fossil fuel generation and enable more renewable energy generation onto the grid.
The predictions on generation mix on the grid in the next 30 years is difficult to model. However, the preliminary analysis of the Long Term Least Cost Development Plan confirms that the UCPS project is part of the least cost solution with an optimal commissioning date in 2028. The storage capacity of UCPS also allow a significant increase of solar penetration in the system (40 GW) and a decrease of coal generation starting from 2028.
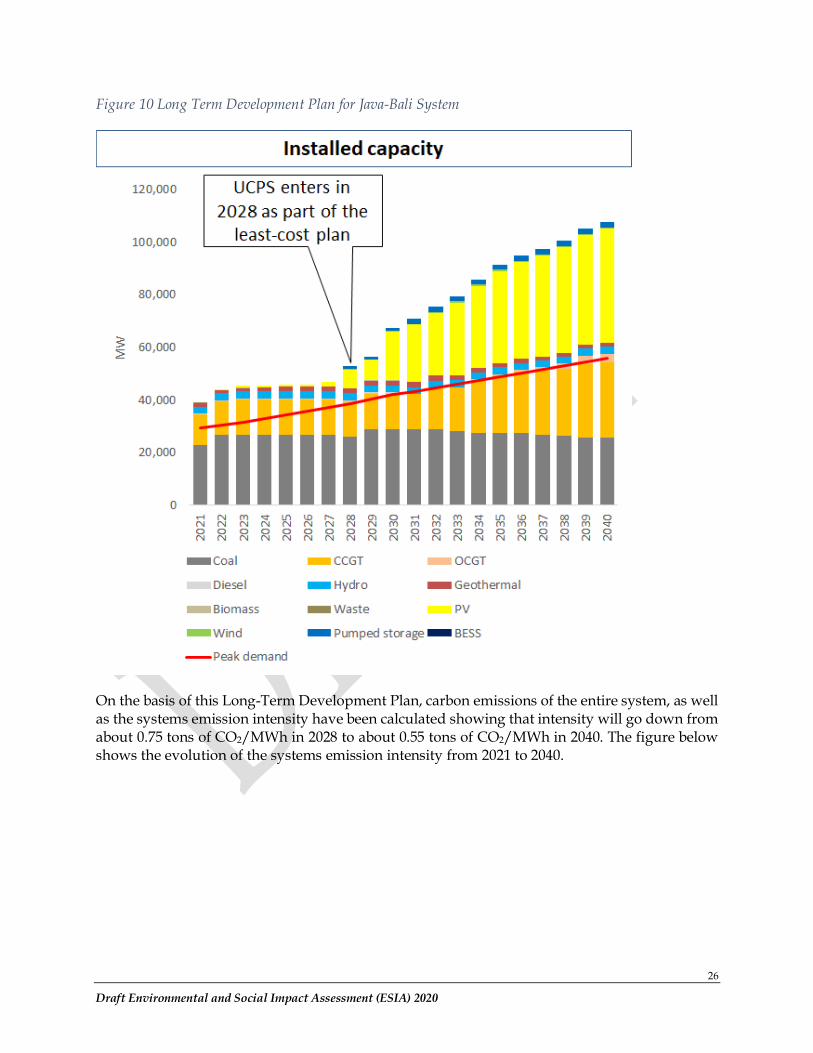
26
Draft Environmental and Social Impact Assessment (ESIA) 2020
Figure 10 Long Term Development Plan for Java-Bali System
On the basis of this Long-Term Development Plan, carbon emissions of the entire system, as well as the systems emission intensity have been calculated showing that intensity will go down from about 0.75 tons of CO2/MWh in 2028 to about 0.55 tons of CO2/MWh in 2040. The figure below shows the evolution of the systems emission intensity from 2021 to 2040.
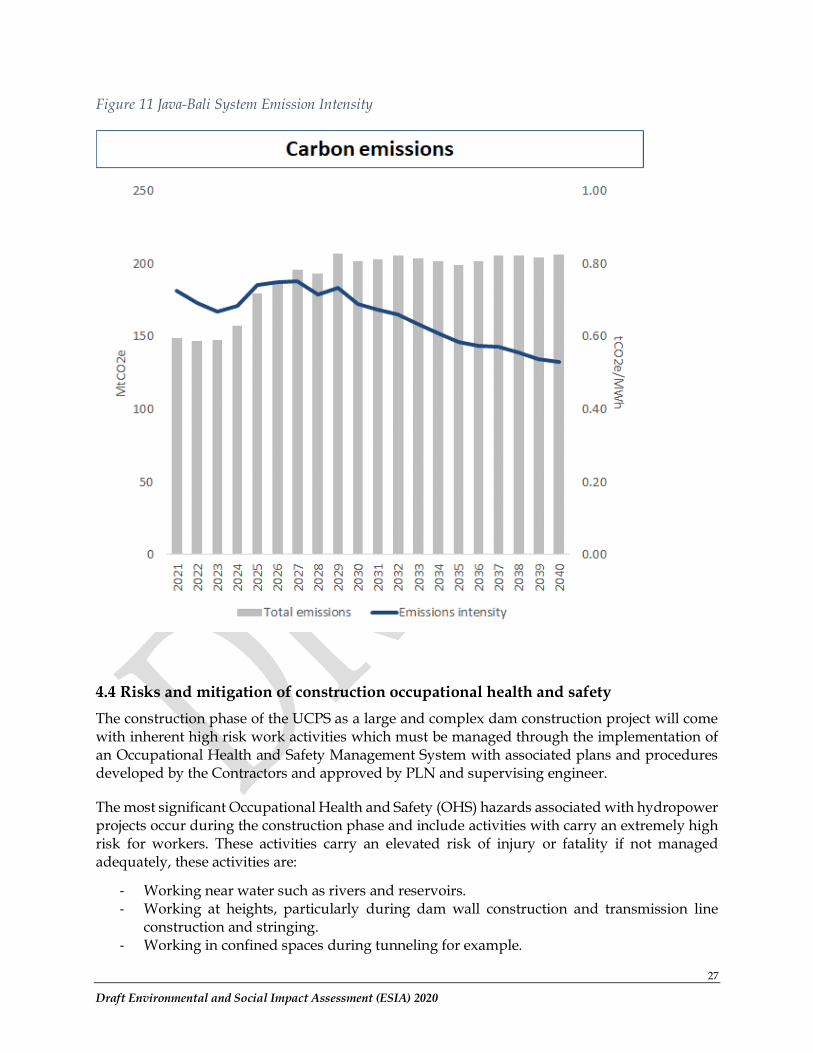
27
Draft Environmental and Social Impact Assessment (ESIA) 2020
Figure 11 Java-Bali System Emission Intensity
4.4 Risks and mitigation of construction occupational health and safety
The construction phase of the UCPS as a large and complex dam construction project will come with inherent high risk work activities which must be managed through the implementation of an Occupational Health and Safety Management System with associated plans and procedures developed by the Contractors and approved by PLN and supervising engineer.
The most significant Occupational Health and Safety (OHS) hazards associated with hydropower projects occur during the construction phase and include activities with carry an extremely high risk for workers. These activities carry an elevated risk of injury or fatality if not managed adequately, these activities are:
- Working near water such as rivers and reservoirs. - Working at heights, particularly during dam wall construction and transmission line
construction and stringing. - Working in confined spaces during tunneling for example.
28
Draft Environmental and Social Impact Assessment (ESIA) 2020
- Working underground. - Working with heavy machinery, particularly on steep and unstable slopes, tunneling, on
public roads, in quarry. - Working with explosives. - Working on slopes and unstable ground. - Working with low voltage and high voltage electricity. - Using vehicles on public and project roads. - Extended or elevated exposure to dust, noise, the sun, heat and wet weather. - Working at night / shift work / fatigue / heat stress. - Working with hazardous materials such as fuels, cement, and fly ash.Exposure to
illnesses, communicable diseases, COVID-19 and others. - Exposure to mental or physical harassment, SEA/SH, and injury from interpersonal
conflicts. - Exposure to floods, earthquakes, landslides and other natural disasters.
A number of factors will influence the construction project’s success in managing these high severity risks, firstly supervision by the project owner (PLN) and its Supervision Engineer, secondly the experience and safety compliance and culture of the Contractor and its management of sub-contractors, and thirdly the level of training and skillset of the workforce.
Project workers are likely to be exposed to the above identified risks over the estimated 5 years of construction. Workers with low experience of working on large scale construction project are expected to be more vulnerable as their skillsets, experience and understanding of health and safety will probably be limited compared to the skilled workers who will have worked on similar projects and have sufficient training.
Furthermore, the project site location has limited high quality healthcare facilities which is not conducive for providing a good response to moderate to serious accidents. Community health centers in the area are not adequate to deal with emergency first-aid response or more serious accidents and the closest well-equipped hospitals are located in Bandung which is over 2 hours away by road.
Each Contractor for each package will be expected to conduct a risk identification and risk register using the Hazard Identification, Risk Analysis, and Risk Control (HIRARC) method. The Hierarchy of Controls pyramid will form the foundation by which safety risks and hazards are managed and controlled. The most effective measure is elimination/substitution, followed by engineering controls, administrative and work practice controls and finally PPE as the least effective at the bottom.
4.5 Land Acquisition and Resettlement Impacts
The review of LARAP implementation by independent consultants confirmed that delivery of compensation payments for lost assets has been largely completed under the LARAP. Nevertheless, there are outstanding compensation payments to be delivered related to remaining lands, cut-off/ isolated land, waqf lands and village treasury lands. All the outstanding issues will be followed up and delivered during project implementation. Key findings from the review include:
29
Draft Environmental and Social Impact Assessment (ESIA) 2020
✓ Access road with total of 55.1 ha have been fully acquired and 562 landowners have been fully compensated. A total of 251.85 ha owned by 891 landowners of upper and lower reservoir have been compensated. There is a need for approximately 3.4 ha of additional land owned by 37 Households which will be confirmed and process in the next phase of the project. 59 landowners of Total of 2.70 Ha for transmission line have been compensated. Only one owner (of 0.05 ha) has not received compensation as the owner lives in another province.
✓ None of PAPs along the transmission lines right of way (ROW) have received compensation. The 2011 LARAP has identified the number of PAPs and the amount of affected land along the transmission lines. PLN will compensate them for the ROW use restriction in accordance with Ministry of Energy and Mineral Resources Decree no 27/2018. This outstanding task will be followed up during project implementation.
✓ Approximately 2.12 Ha of unviable land have been identified in Bandung Barat Regency. Identification of similar land in Cianjur Regency has not commenced. None of the unviable land has been compensated.
✓ PLN will need to follow up on replacement/ compensation for affected village treasury land and waqf land.
✓ There are 765 Household that must be relocated from the impacted area. Total of 199 household in the access road were relocated within a same village while 566 households of PAPs in reservoir area must be relocated to other villages. 54 HH have not relocated due to various reasons. Reportedly, 12 households will move as soon as PLN build a mosque in their resettlement area. The rest of the households expressed other reasons including running out of compensation money and therefore being unable to afford buying a new house in another area, waiting for PLN to build religious/worship facilities in the new resettlement area, and other personal constraints.
✓ Although all PAPs opted for self-relocation meaning that the PAPs manage their own relocation process after receiving cash compensation, PLN supported construction of public facilities in several resettlement locations as requested by the PAPs and advised by the government. PLN is committed to provide such supports in the other resettlement areas which will be further discussed and agreed with the local government.
✓ In collaboration with local government, PLN has implemented economic assistance and livelihood restoration programs in collaboration with local government and other government entities. establishment of cooperatives and various capacity building programs which benefited the PAPs. Several programs designed to empower women groups which showed positive impacts in terms of increasing the role of rural women in income generating and business management.
4.6 Construction worker management / influx management / community health and safety risks (including Gender-Based Violence)
For a period of at least five years, there will be hundreds of workers employed by the Contractors at any one time. Most are expected to come from elsewhere in Indonesia or overseas and will require accommodation in the Project area. During the peak construction period there will be an influx of up to 2.700 workers and estimated 4,500 – 6,000 of followers to the project area. Risks related to construction generally include noise, traffic hazards, dust health problems, and social conflict, and occupational health and safety. Management procedures of workers' barracks/basecamp, construction methods, traffic management and regulation, and community consultation have been prepared to minimize impacts associated with construction activities. A
30
Draft Environmental and Social Impact Assessment (ESIA) 2020
Grievance Redress Mechanism has been established to ensure that complaints are appropriately managed.
Separation from families especially among construction workers who are away from home for construction jobs may encourage undesired behaviors, such as exploitative sexual relations, and illicit sexual relations with minors from the local community. The influx of people may bring communicable diseases to the project area, including sexually transmitted diseases (STDs). Baseline assessment related to Gender Based Violence (GBV) confirmed the vulnerability of women and children to GBV attributed by several factors including low level of education, social norms, and high rate of child marriage. The project has developed a GBV action plan to mitigate these potential risks.
4.7 Livelihood changes in forest dependent communities
The dam will be constructed in forestry land managed by Perhutani, which will cause loss on the forestry land and consequently to the people who use the forest resource. The utilization of forest land for huma-ladang was carried out by approximately 1658 households in 38 hamlets. The dam construction and the establishment of the restoration area under Biodiversity Management Plan (BMP) will impact the community whose livelihood depends on the forest managed by Perhutani. The latest assessment confirmed that establishment of the Restoration Area has not impacted or at least very insignificant to the livelihood of the local people. In contrary, some activities conducted by a portion of the local people like land clearing for agriculture and or game hunting, have affected the integrity of the Restoration Area. However, future implementation of the BMP with stricter monitoring and evaluation activities may result in more significant social impacts compared to the previous period. The Project has developed a Forest Partnership Framework to mitigate potential adverse risks and impacts to the forest dependent community. The forest partnership action plan will be developed and implemented during project implementation.
4.8 Impact on Income Associated with Construction Activities
During construction the access road, community around the project area got benefits from working at construction site and opening small businesses such as food and services for the workers. Based on the LARAP midterm report in 2016, 52.33% of the respondents experienced an increase in income from economic activities surround the construction area. Project construction is expected to provide more economic opportunities for the community around the project area which will positively contributed to overall income of the community.
4.9 Community dissatisfaction and grievance mechanism.
Managing community expectations and resolving community concerns are critical for the successful implementation of the project. The latest assessment recorded that the affected communities raised several concerns regarding the project include land acquisition-related issues, expectation for labor recruitment, concerns related to health such as disturbance resulted from noise and vibration. Failure to resolve community complaints may result in project delay. PLN has developed a Stakeholder Engagement Plan (SEP) which outlines a systematic approach to promote inclusive infrastructure development by ensuring the meaningful participation of stakeholders throughout the project cycle, from planning, construction to operation. The grievance redress mechanism has been updated with clear procedure and institutional arrangement for implementation.
31
Draft Environmental and Social Impact Assessment (ESIA) 2020
4.10 Cultural heritage
A comprehensive cultural heritage survey was conducted in 2009 and validated in the ESIA review in 2020. The survey was carried out in consultation with the community. None of the sites are registered with local and national authorities or have legal protection. Locations that have particular importance, because they have religious or other significance, are considered sacred graves, by the surrounding community and pilgrims, namely Batu Bedil and Maqom Mbah Tubuy (famous ustadz graves). Some buildings and graves have already been moved as part of the resettlement process. However, there are also many private graves and religious structures within the project area, but not in the project footprint, which require respect and protection during reservoir construction and preparation. Access must be maintained for pilgrims to the sacred graves.
4.11 Dam Safety
The safety of workers and the downstream communities is a critical part of the design process, construction and operational procedures. The detailed design, bid documents, prequalification of bidders and the selection of the contractor have been supervised by Project Review Panel made up of dam and geotechnical experts, during the period of 2012 to 2017. At the time, the retention and use of the panel was compliant with the World Bank safeguards policy OP.37 Safety of Dams. The panel signed off on the updated design including the instrumentation system, bid documents including quality control and assurance requirements and the prequalification of the Contractor for Lot1a Upper and Lower Dams and Lot 1b Waterways, Powerhouse, Switchyard and Buildings. PLN propose to engage a new panel for the updated UCPS project and they will be employed in a similar manner to assist in the supervision of construction, reservoir filling and commissioning and the start of operations and will be involved in the review of dam safety documents.
Dam structures and outlets have been designed to the International Commission on Large Dams (ICOLD) seismic standards. Dam structures and spillways have been designed to the 1/10,000-year flood return interval, as per the ICOLD standards, and the Indonesian government regulation regarding planned flood design discharge for dam structures, power generation and similar uses, based on SNI No. 2415:2016. Bottom outlets are designed to release water in a controlled manner quickly in cases where the dam structures are at risk of failure.
PLN has prepared a packaged dam safety plan including: i) Construction Supervision and Quality Assurance Plan, ii) Instrumentation Plan, iii) Preliminary Operation & Maintenance Plan, and iv) Broad Framework for Emergency Preparedness Plan.
Communities will be prohibited from approaching and using the reservoirs to protect their safety from the sudden and large daily fluctuations of water levels. The riparian areas will be replanted with native and exotic vegetation to provide slope stabilization and habitat for wild animals as part of the biodiversity enhancements under the Biodiversity Management Plan and will not be used for resettlement, forestry or for agricultural purposes. The water levels of the upper reservoir when operating fluctuate daily as high as 19 m and the lower reservoir fluctuates as high as 4.5 m. With these fluctuations, the reservoir is not safe for use by the community, or for commercial businesses such as aquaculture. People are prohibited from entering the reservoir
32
Draft Environmental and Social Impact Assessment (ESIA) 2020
and greenbelt areas to protect their safety from drowning. Warning alarms will be issued prior to generation or pumping, to warn of changes in reservoir water levels.
4.12 Social Benefits
The project’s advantages include cheaper peak-load electricity provision and efficiency in the Java-Bali network, construction of new roads and bridges that allow access to remote hamlets and villages and provide benefits to the local economy during the Construction stage (allocation work and provision of services). The project will also stimulate economic activities during operational time and will help redirect economic activities of the Project Affected Persons (PAPs), which were originally dominated by agriculture, towards higher-earning services and trade. This is envisaged to have a positive impact, on the one hand by strengthening the rural base sector (agriculture, animal husbandry, fisheries and forestry), and, on the other hand, to grow services and trade.
Besides the land compensation to the communities during land acquisition, local economic benefits during the construction stage such as availability of jobs and service activities are expected to improve the communities’ lives around the UCPS project area. In the construction of the UCPS hydropower plant, the impact of the loss of assets, jobs, livelihoods causing economic hardship should be minimally occurred.
4.13 Environmental and Social Assessment Studies and Management Plans to be Prepared
PLN continues to assess and study environmental and social impacts and develop further mitigation and management plans as follows:
• PLN will refine and finalize the calculation of greenhouse gas emissions as per ESS3 as part of the economic analysis to be completed prior to World Bank appraisal.
• Measuring the nature and scale of impacts from reduced sediment load in the Cisokan River and appropriate mitigation measures. This requires surveys of riverbed and bank and modelling of the likely changes in bedload, erosion potential and the identification of ‘hotspots’ or risk areas for erosion and deposition of sediment. Terms of reference will be prepared and technical consultants will be engaged to complete the study and prepare an impact assessment on habitat, land and river uses and develop mitigation measures for the Operational Environmental and Social Management Plan. The work is to be completed at least one year prior to reservoir filling.
• Further studies on the baseline avifauna and terrestrial biodiversity in the transmission line area of influence and any further mitigation measures regarding the location and design of transmission infrastructure to avoid animal injuries and mortalities. A terms of reference will be prepared for specialist consultants to undertake field surveys, model mortality and injury and update the biodiversity impact assessment and prepare the Transmission Line Environmental and Social Management Plan with biodiversity impact mitigation measures (and offsets, if required) as per ESS6. Work to be completed prior to the completion of the bid documents.
• An occupational health and safety management framework will be prepared prior to World Bank appraisal to comply with ESS2 regarding the risks and appropriate risk management for construction and operational phase workplace hazards.
33
Draft Environmental and Social Impact Assessment (ESIA) 2020
• A risk assessment on the significant occupational and community health and safety hazards of each of the construction packages will be prepared by PLN with the support of the Supervision Engineer, and specific instructions on the approaches to risk identification and management will be prepared for the bid documents and contracts for future contracts and amended where necessary into the existing contracts. Risk assessments to be completed prior to the completion of the relevant bid documents for future contracts and prior to the Project effective date for existing contracts.
• A TOR will be prepared for consultants to undertake a risk assessment on the significant occupational and community health and safety hazards during operation of the hydropower scheme, transmission line and reservoirs. The consultants will prepare the health and safety management sections of the Operations and Maintenance manuals and provide training, at least one year prior to reservoir filling.
• Best practice measures for preparing the reservoir for impoundment, based on potential habitat and water quality impacts are to be developed. A terms of reference will be prepared for a consultant to review the existing land cover, hazards and risks in the reservoir and to assess the potential biodiversity and water quality impacts from impoundment and daily fluctuation of water within the reservoir and provide recommendations on environmentally and socially acceptable methods for preparing the reservoir to avoid and minimize impacts during operation. The terms of reference will include the preparation of the Reservoir Preparation Plan. Completed at least six months prior to reservoir filling.
• Update the Framework Emergency Preparedness Plan prior to appraisal to reflect the requirements of ESS4.
• Operation and Maintenance Plan and the Emergency Preparedness Plan for dam safety, as per ESS4, will be prepared by PLN and submitted to the Bank and the dam Panel of Experts not less than 6 and 12 months prior to the initiation of reservoir filling.
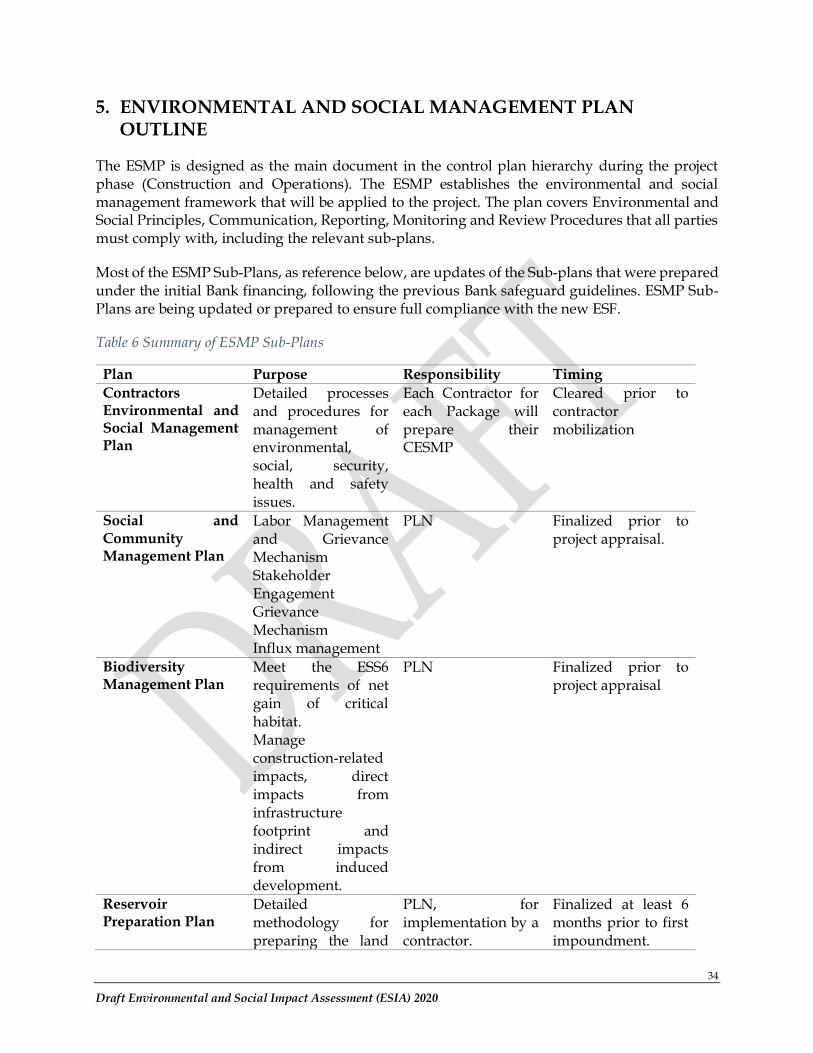
34
Draft Environmental and Social Impact Assessment (ESIA) 2020
5. ENVIRONMENTAL AND SOCIAL MANAGEMENT PLAN OUTLINE
The ESMP is designed as the main document in the control plan hierarchy during the project phase (Construction and Operations). The ESMP establishes the environmental and social management framework that will be applied to the project. The plan covers Environmental and Social Principles, Communication, Reporting, Monitoring and Review Procedures that all parties must comply with, including the relevant sub-plans.
Most of the ESMP Sub-Plans, as reference below, are updates of the Sub-plans that were prepared under the initial Bank financing, following the previous Bank safeguard guidelines. ESMP Sub-Plans are being updated or prepared to ensure full compliance with the new ESF.
Table 6 Summary of ESMP Sub-Plans
Plan Purpose Responsibility Timing
Contractors Environmental and Social Management Plan
Detailed processes and procedures for management of environmental, social, security, health and safety issues.
Each Contractor for each Package will prepare their CESMP
Cleared prior to contractor mobilization
Social and Community Management Plan
Labor Management and Grievance Mechanism Stakeholder Engagement Grievance Mechanism Influx management
PLN Finalized prior to project appraisal.
Biodiversity Management Plan
Meet the ESS6 requirements of net gain of critical habitat. Manage construction-related impacts, direct impacts from infrastructure footprint and indirect impacts from induced development.
PLN Finalized prior to project appraisal
Reservoir Preparation Plan
Detailed methodology for preparing the land
PLN, for implementation by a contractor.
Finalized at least 6 months prior to first impoundment.
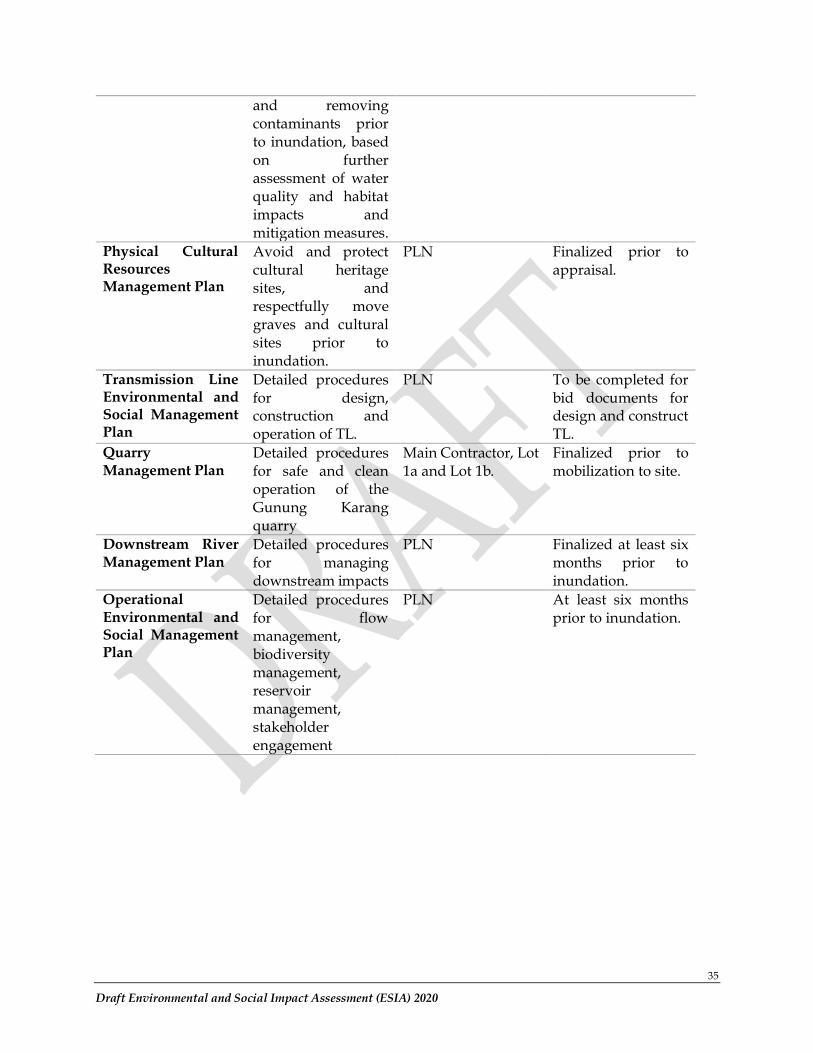
35
Draft Environmental and Social Impact Assessment (ESIA) 2020
and removing contaminants prior to inundation, based on further assessment of water quality and habitat impacts and mitigation measures.
Physical Cultural Resources Management Plan
Avoid and protect cultural heritage sites, and respectfully move graves and cultural sites prior to inundation.
PLN Finalized prior to appraisal.
Transmission Line Environmental and Social Management Plan
Detailed procedures for design, construction and operation of TL.
PLN To be completed for bid documents for design and construct TL.
Quarry Management Plan
Detailed procedures for safe and clean operation of the Gunung Karang quarry
Main Contractor, Lot 1a and Lot 1b.
Finalized prior to mobilization to site.
Downstream River Management Plan
Detailed procedures for managing downstream impacts
PLN Finalized at least six months prior to inundation.
Operational Environmental and Social Management Plan
Detailed procedures for flow management, biodiversity management, reservoir management, stakeholder engagement
PLN At least six months prior to inundation.
36
Draft Environmental and Social Impact Assessment (ESIA) 2020
CHAPTER 1. INTRODUCTION
1.1 Overview of Hydropower and ESIA Report
The provision of electricity in Java-Bali is needed in connection with the increasing demand for electricity in Java-Bali. The State Electricity Company/Perusahaan Listrik Negara (PLN) is mandated to provide electricity according to demand, so that the provision of electricity and efforts to improve PLN's confidence in Java-Bali are needed. For this reason, PT PLN (Persero) plans to build 1,040 MW Upper Cisokan Pumped Storage (UCPS) hydropower plant in the Cisokan River watershed, West Java Province. The UCPS hydropower plant will have two reservoirs (upper reservoir and lower reservoir), each with an active volume of 10,000,000 m3. The water stored in the upper reservoir will be released through the turbine from the upper reservoir to generate electrical energy during the daily peak electricity load. Water collected in the lower reservoir will be pumped back to the upper reservoir as long as the daily demand for electricity is low using the electricity supply from the base load power plant. The UCPS hydropower plant will be more flexible in terms of electricity supply to the Java Bali grid system at peak periods and to stabilize the grid, compared to Fossil Fuel Power Plants/Pembangkit Listrik Tenaga Uap (PLTU). Reservoirs, power station infrastructure, roads and transmission lines will occupy space or land of approximately 745.74 ha of paddy fields, fields, natural and modified forests and plantation forests.
This ESIA document is an update of the EIA consolidated document disclosed by PLN and the World Bank in 2011. This document update was carried out due to changes in the World Bank's environmental and social impact assessment guidelines from the World Bank safeguard guidelines to the ESF (Environmental and Social Framework) in 2018 and to ensure the ESIA was based on a contemporary analysis of the baseline and the impacts of the project to date. Based on that, PLN in cooperation with UNPAD took the initiative to update it through this ESIA document. The ESIA is a document that contains an assessment of potential environmental and social risks and impacts along with mitigation that must be carried out in minimizing the potential impacts that arise as a result of the UCPS hydropower project design, construction and operation. The ESMP document contains environmental and social management measures to be implemented carried out during the preconstruction, construction and operational phases of the UCPS Hydroelectric Power Plant. This document will be used as a reference in the preparation of the Contractors-ESMP documents containing environmental and social management efforts during construction in accordance with the detailed construction plan carried out by the contractors. The ESMP contains specific sub-plans to manage significant impacts, such as: a Cultural Heritage Management Plan, Social and Community Management Plan (SCMP)which contains the worker influx, labor management and stakeholder engagement activities and the Biodiversity Management Plan which contains mesaures to meet the ‘net gain’ habitat objectives of the World Bank Standard for biodiversity conservation.
In general, the UCPS hydropower plant is located on the Java Island, to be precise in the West Bandung Regency-Cianjur Regency, West Java Province, approximately 150 km from the capital city of Jakarta and 50 km from Bandung City (Figure 1).
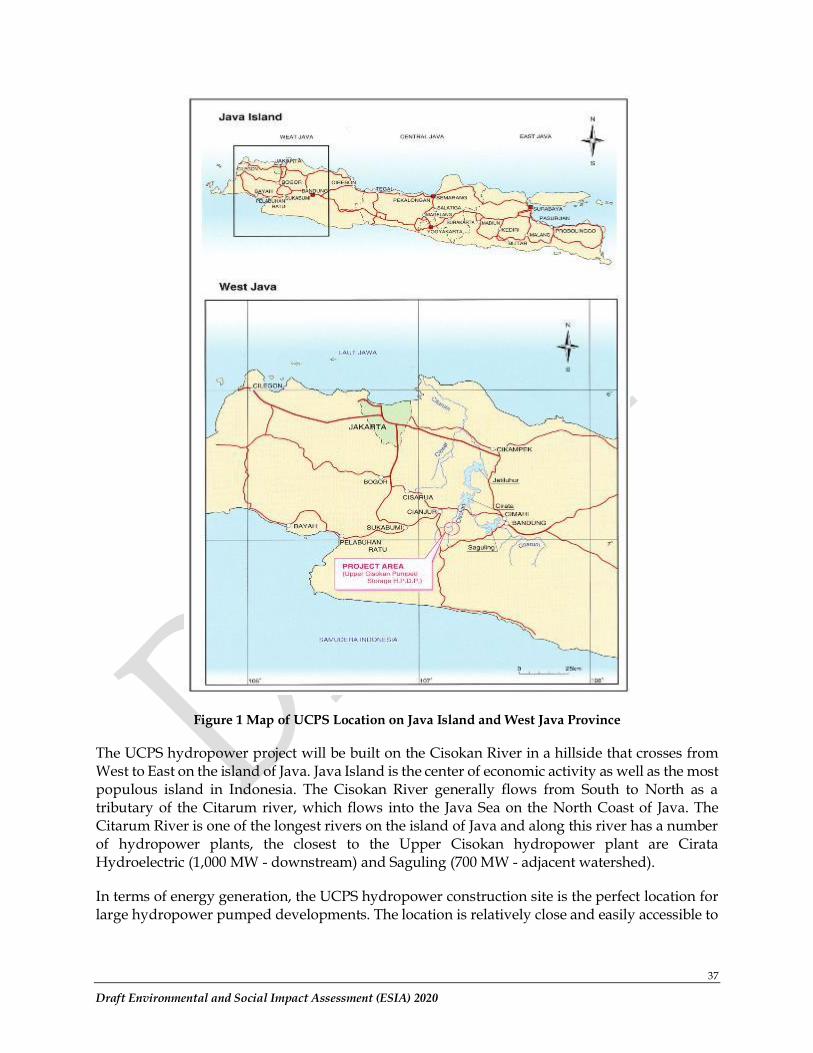
37
Draft Environmental and Social Impact Assessment (ESIA) 2020
Figure 1 Map of UCPS Location on Java Island and West Java Province
The UCPS hydropower project will be built on the Cisokan River in a hillside that crosses from West to East on the island of Java. Java Island is the center of economic activity as well as the most populous island in Indonesia. The Cisokan River generally flows from South to North as a tributary of the Citarum river, which flows into the Java Sea on the North Coast of Java. The Citarum River is one of the longest rivers on the island of Java and along this river has a number of hydropower plants, the closest to the Upper Cisokan hydropower plant are Cirata Hydroelectric (1,000 MW - downstream) and Saguling (700 MW - adjacent watershed).
In terms of energy generation, the UCPS hydropower construction site is the perfect location for large hydropower pumped developments. The location is relatively close and easily accessible to
38
Draft Environmental and Social Impact Assessment (ESIA) 2020
the Java-Bali electricity grid and major and important cities on the island of Java - Jakarta and Bandung, which are the centers of industry and population in West Java.
1.2 Electricity System in Java-Bali
In terms of geography, Indonesia, both in terms of population distribution and economic activity, divides the electricity grid into three distinct parts: 1. Connected Java-Bali main grid in 2019 - approximately 30,368 MW installed capacity (PLN,
2020); 2. More than 20 isolated small power grids with a power generating capacity of 12 MW to 1,500
MW in large islands outside Java and Bali; and 3. Several hundred small power plants, mostly supplying electrical energy to consumers in rural
areas in the Java-Bali area and islands outside Java-Bali.
The electricity system in Java-Bali is a large and modern system. PLN has the task of providing electrical energy in Indonesia. PLN is vertically incorporated with the largest company, generation, transmission and distribution of electricity available in Indonesia. Acting as the only legitimate buyer at the sales level, PLN buys electricity from a growing number of independent power providers or power generation companies.
Indonesia's electricity demand has grown rapidly over the past three decades, in line with economic growth. With the return of economic growth since the Asian Financial Crisis in early 2000, electricity demand shows higher growth than the economy. The demand for electricity has grown, with an average growth of 4.99% per year (2000-2019), during the same period the capacity of power plants built with an average growth rate of 3.81% per year (PLN, 2020).
As consumption increases, the difference between low load and peak load also increases, with a difference of approximately 1,450 MW in 1990 and 4,043 MW in 1996, 2019 the peak load is at 28,087 MW with a daily low load of 22,000 MW so that the load difference ranges ±6000 MW. This difference is anticipated by the plan to increase electrical energy by approximately 8,000 MW. One of the efforts to increase electrical energy is the construction of the UCPS Hydropower Plant. Graph of daily load for 1990-2006 and peak load in 2019 is presented in Figure 2 (a) and (b).
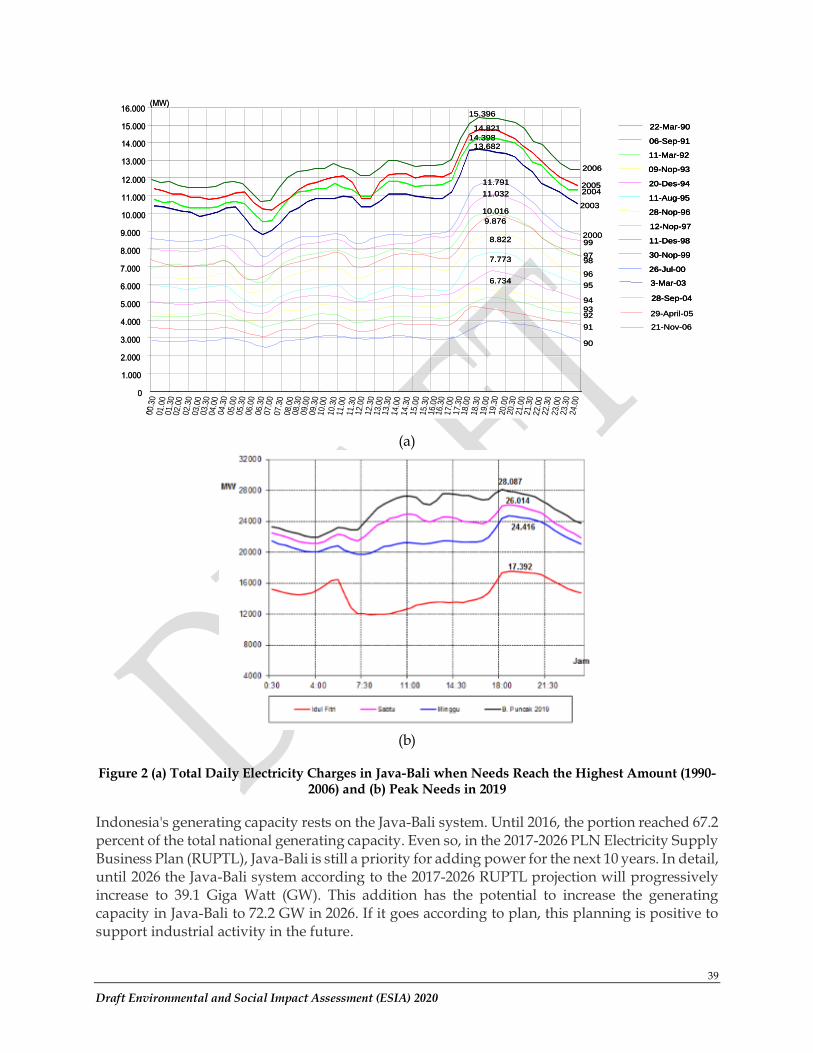
39
Draft Environmental and Social Impact Assessment (ESIA) 2020
(a)
(b)
Figure 2 (a) Total Daily Electricity Charges in Java-Bali when Needs Reach the Highest Amount (1990-2006) and (b) Peak Needs in 2019
Indonesia's generating capacity rests on the Java-Bali system. Until 2016, the portion reached 67.2 percent of the total national generating capacity. Even so, in the 2017-2026 PLN Electricity Supply Business Plan (RUPTL), Java-Bali is still a priority for adding power for the next 10 years. In detail, until 2026 the Java-Bali system according to the 2017-2026 RUPTL projection will progressively increase to 39.1 Giga Watt (GW). This addition has the potential to increase the generating capacity in Java-Bali to 72.2 GW in 2026. If it goes according to plan, this planning is positive to support industrial activity in the future.
6.734
0
1.000
4.000
2.000
3.000
5.000
6.000
90
91
94
9392
95
9.000
7.000
8.000
10.000
11.000
12.000
7.773
8.822
9.876
10.016
11.032
11.791
2000
9798
96
99
15.000
14.000
13.000
22-Mar-90
11-Des-98
20-Des-94
06-Sep-91
30-Nop-99
11-Aug-95
26-Jul-00
11-Mar-92
28-Nop-96
09-Nop-93
12-Nop-97
29-April-05
28-Sep-04
3-Mar-03
2003
20042005
14.821
14.39813.682
00.3
001.0
001.3
002.0
002.3
003.0
003.3
004.0
004.3
005.0
005.3
006.0
006.3
007.0
007.3
008.0
008.3
009.0
009.3
010.0
010.3
011.0
011.3
012.0
012.3
013.0
013.3
014.0
014.3
015.0
015.3
016.0
016.3
017.0
017.3
018.0
018.3
019.0
019.3
020.0
020.3
021.0
021.3
022.0
022.3
023.0
023.3
024.0
0
21-Nov-06
2006
15.396
(MW)16.000
6.734
0
1.000
4.000
2.000
3.000
5.000
6.000
90
91
94
9392
95
9.000
7.000
8.000
10.000
11.000
12.000
7.773
8.822
9.876
10.016
11.032
11.791
2000
9798
96
99
15.000
14.000
13.000
22-Mar-9022-Mar-90
11-Des-9811-Des-98
20-Des-9420-Des-94
06-Sep-9106-Sep-91
30-Nop-9930-Nop-99
11-Aug-9511-Aug-95
26-Jul-0026-Jul-00
11-Mar-9211-Mar-92
28-Nop-9628-Nop-96
09-Nop-9309-Nop-93
12-Nop-9712-Nop-97
29-April-05
28-Sep-0428-Sep-04
3-Mar-033-Mar-03
2003
20042005
14.821
14.39813.682
00.3
001.0
001.3
002.0
002.3
003.0
003.3
004.0
004.3
005.0
005.3
006.0
006.3
007.0
007.3
008.0
008.3
009.0
009.3
010.0
010.3
011.0
011.3
012.0
012.3
013.0
013.3
014.0
014.3
015.0
015.3
016.0
016.3
017.0
017.3
018.0
018.3
019.0
019.3
020.0
020.3
021.0
021.3
022.0
022.3
023.0
023.3
024.0
0
21-Nov-06
2006
15.396
(MW)16.000
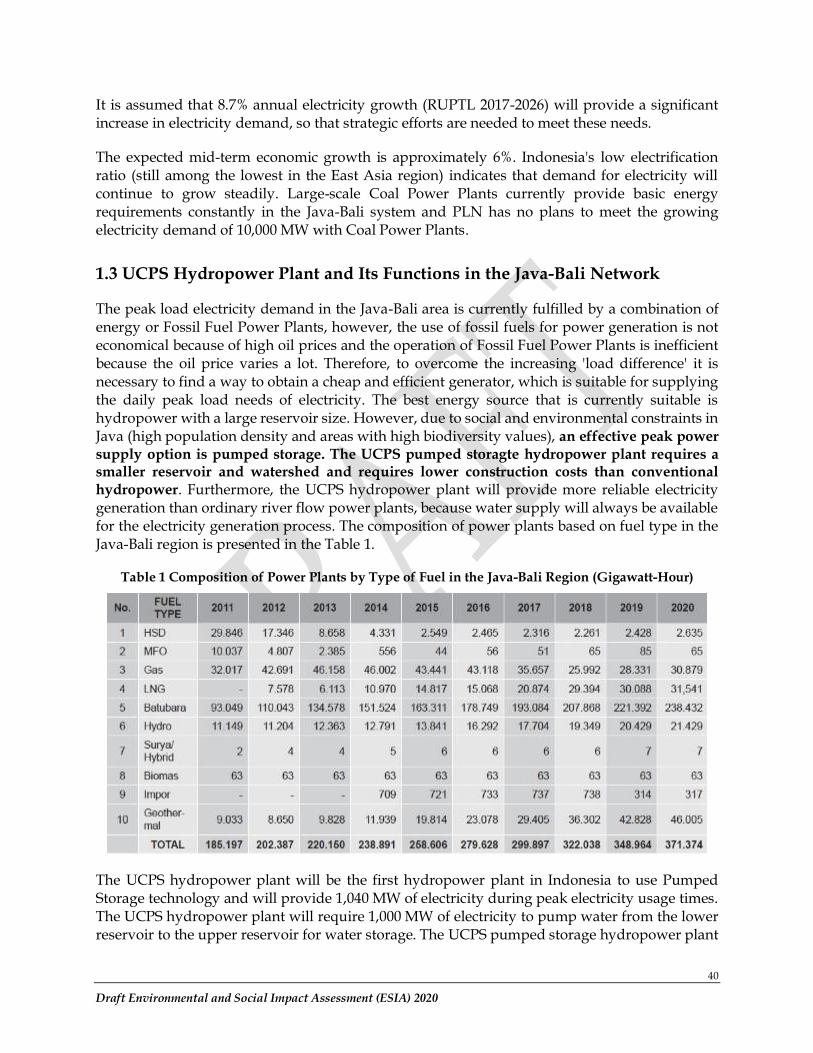
40
Draft Environmental and Social Impact Assessment (ESIA) 2020
It is assumed that 8.7% annual electricity growth (RUPTL 2017-2026) will provide a significant increase in electricity demand, so that strategic efforts are needed to meet these needs.
The expected mid-term economic growth is approximately 6%. Indonesia's low electrification ratio (still among the lowest in the East Asia region) indicates that demand for electricity will continue to grow steadily. Large-scale Coal Power Plants currently provide basic energy requirements constantly in the Java-Bali system and PLN has no plans to meet the growing electricity demand of 10,000 MW with Coal Power Plants.
1.3 UCPS Hydropower Plant and Its Functions in the Java-Bali Network
The peak load electricity demand in the Java-Bali area is currently fulfilled by a combination of energy or Fossil Fuel Power Plants, however, the use of fossil fuels for power generation is not economical because of high oil prices and the operation of Fossil Fuel Power Plants is inefficient because the oil price varies a lot. Therefore, to overcome the increasing 'load difference' it is necessary to find a way to obtain a cheap and efficient generator, which is suitable for supplying the daily peak load needs of electricity. The best energy source that is currently suitable is hydropower with a large reservoir size. However, due to social and environmental constraints in Java (high population density and areas with high biodiversity values), an effective peak power supply option is pumped storage. The UCPS pumped storagte hydropower plant requires a smaller reservoir and watershed and requires lower construction costs than conventional hydropower. Furthermore, the UCPS hydropower plant will provide more reliable electricity generation than ordinary river flow power plants, because water supply will always be available for the electricity generation process. The composition of power plants based on fuel type in the Java-Bali region is presented in the Table 1.
Table 1 Composition of Power Plants by Type of Fuel in the Java-Bali Region (Gigawatt-Hour)
The UCPS hydropower plant will be the first hydropower plant in Indonesia to use Pumped Storage technology and will provide 1,040 MW of electricity during peak electricity usage times. The UCPS hydropower plant will require 1,000 MW of electricity to pump water from the lower reservoir to the upper reservoir for water storage. The UCPS pumped storage hydropower plant
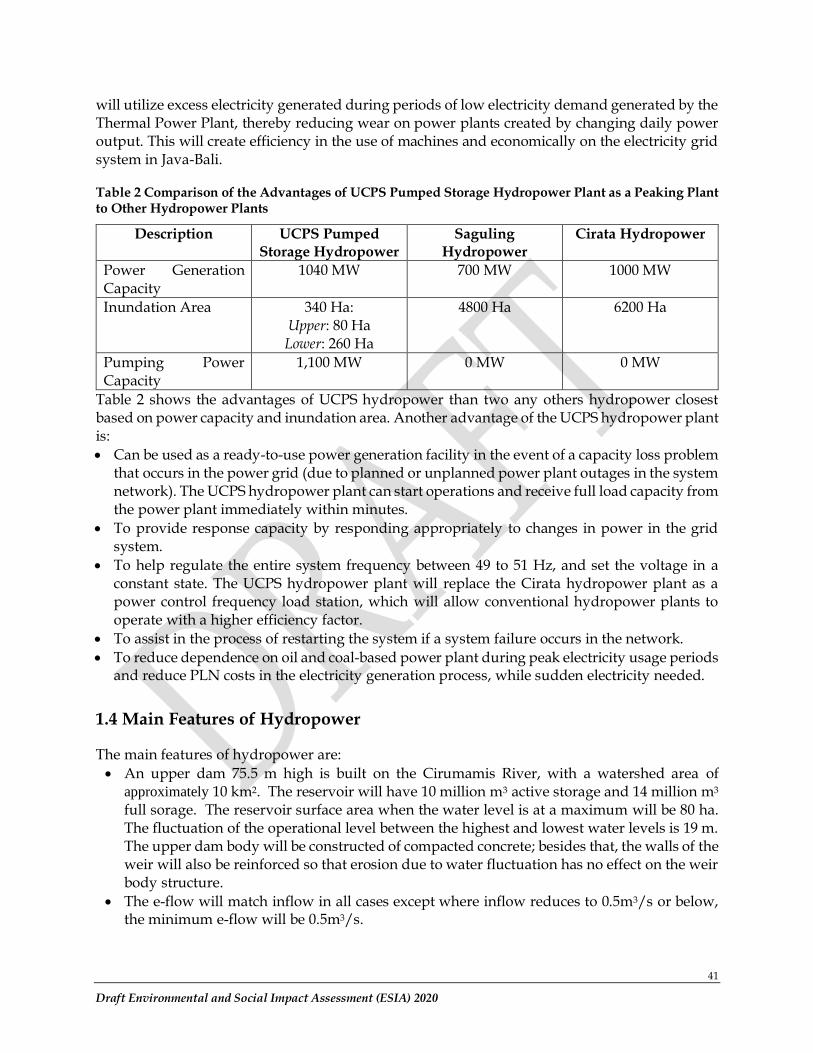
41
Draft Environmental and Social Impact Assessment (ESIA) 2020
will utilize excess electricity generated during periods of low electricity demand generated by the Thermal Power Plant, thereby reducing wear on power plants created by changing daily power output. This will create efficiency in the use of machines and economically on the electricity grid system in Java-Bali.
Table 2 Comparison of the Advantages of UCPS Pumped Storage Hydropower Plant as a Peaking Plant to Other Hydropower Plants
Description UCPS Pumped Storage Hydropower
Saguling Hydropower
Cirata Hydropower
Power Generation Capacity
1040 MW 700 MW 1000 MW
Inundation Area 340 Ha: Upper: 80 Ha Lower: 260 Ha
4800 Ha 6200 Ha
Pumping Power Capacity
1,100 MW 0 MW 0 MW
Table 2 shows the advantages of UCPS hydropower than two any others hydropower closest based on power capacity and inundation area. Another advantage of the UCPS hydropower plant is:
• Can be used as a ready-to-use power generation facility in the event of a capacity loss problem that occurs in the power grid (due to planned or unplanned power plant outages in the system network). The UCPS hydropower plant can start operations and receive full load capacity from the power plant immediately within minutes.
• To provide response capacity by responding appropriately to changes in power in the grid system.
• To help regulate the entire system frequency between 49 to 51 Hz, and set the voltage in a constant state. The UCPS hydropower plant will replace the Cirata hydropower plant as a power control frequency load station, which will allow conventional hydropower plants to operate with a higher efficiency factor.
• To assist in the process of restarting the system if a system failure occurs in the network.
• To reduce dependence on oil and coal-based power plant during peak electricity usage periods and reduce PLN costs in the electricity generation process, while sudden electricity needed.
1.4 Main Features of Hydropower
The main features of hydropower are:
• An upper dam 75.5 m high is built on the Cirumamis River, with a watershed area of approximately 10 km2. The reservoir will have 10 million m3 active storage and 14 million m3 full sorage. The reservoir surface area when the water level is at a maximum will be 80 ha. The fluctuation of the operational level between the highest and lowest water levels is 19 m. The upper dam body will be constructed of compacted concrete; besides that, the walls of the weir will also be reinforced so that erosion due to water fluctuation has no effect on the weir body structure.
• The e-flow will match inflow in all cases except where inflow reduces to 0.5m3/s or below, the minimum e-flow will be 0.5m3/s.
42
Draft Environmental and Social Impact Assessment (ESIA) 2020
• A 98.0 m high lower dam will be built on the Cisokan River, with a watershed area of approximately 374 km2. The reservoir will have active storage of 10 million m3 and full storage of 63 million m3. The reservoir surface area at highest water level will be 260 ha. The difference in water level during operation between the highest and lowest water levels is 4.5 m. The dam body will be constructed from compacted concrete.
• The e-flow will match inflow in all cases except where inflow reduces to 0.5m3/s + estimated losses or below. At this time the minimum e-flow will be 0.5m3/s. This may reduce the active storage and generation capacity of UCPS during these low flow periods.
• A power plant with a capacity of 1,040 MW and a pump capacity of 1,100 MW, placed in an underground power station. Tunnels will connect the power station to the reservoir. A switchyard and administrative office will complement the hydropower station.
• Two transmission networks connect the UCPS hydropower plant with the Cibinong-Saguling network in the north (15.5 km and 15.9 km).
• The UCPS hydropower plant will generate electricity during peak electricity demand, using base load electricity to pump water from the lower reservoir to the upper reservoir, then release the water to generate electricity
• After initial inundation, most of the water in the watershed will be passed through middle outlets and spillways, with only surface water being retained in the reservoir to compensate for evaporation losses.
• A new 27 km long road has been constructed to provide access to the construction sites, and the existing 7 km long road between the Gunung Karang Quarry and the new access road has repaired.
• The existing Gunung Karang Quarry will be used as a rock foundation and dam building materials.
• A short 20 kV grid will be constructed prior to construction to help provide electricity during construction.
Major construction activities are expected to take 50 months and are planned to be operational between 2024 & 2025.
1.5 Main Features of ESIA
The ESIA report is an update document of previous EIA with addition and changes in accordance with the World Bank ESF and contemporary assessment of the baseline.
The main environmental and social risks and impacts associated with the hydropower project are identified and briefly described below.
1.5.1 Resettlement
Approximately 310.14 hectares of community and private land has been acquired for the UCPS hydropower plant development. This includes, houses, settlements, cemeteries, mosques, productive land, subsistence agriculture, fish ponds and other small businesses. 1,549 households have been affected by (or will be affected by) the project (PLN, 2019).
In addition to community and private land an additional 409 hectares of Government-owned forest land has been acquired, restricting the use of that land by communities who rely on it for agriculture, timber and non-timber forest products (PLN Update, 2019).
43
Draft Environmental and Social Impact Assessment (ESIA) 2020
1.5.2 Impact of construction activities on society
The construction period is estimated to last for at least five years. The UCPS construction will require hundreds of workers employed by the Contractors at any one time. Most are expected to come from elsewhere in Indonesia or overseas and will require accomodation in the Project area. During the peak construction there will be an influx of up to 2,700 workers and estimated 4,500-6,000 followers to the project area. Social risks related to construction may include noise, traffic hazards, dust, restriction of access to land, infrastructure and resources, gender-based violence and health problems and disturbances from migrant workers and camp followers interacting with the local community.
1.6 Impact on biodiversity
Cisokan hydropower development activities, including construction, inundation and operational phases, will lead to direct, indirect impacts and cumulative impacts related to disturbances in Critical Habitats, Natural Habitats and Modified Habitats according to ESS6. The classification of these areas is based on the findings of the presence of protected animals and land use including the UCPS project site and transmission line.
The Cisokan watershed has experienced declining forests for many decades and remaining threatened wildlife depends on a few forest patches. PT PLN has prepared a biodiversity management plan, the Biodiversity Management Plan (BMP), to manage the direct and indirect impacts of the Cisokan hydropower project on the condition of biodiversity and for the maintenance of project-affected areas. The Biodiversity Management Plan aims to protect and improve the remaining forest communities (both in terms of habitat and wildlife) so as to form an ecologically improved ecosystem with more forest habitat, more ecological connectivity and healthier litoral zones protected by new forests. The aim is to increase the populations of threatened species, resulting in a net gain in critical habitat. The required reforestation of large parts of the watershed takes into account the ongoing threats to biodiversity conservation originating from the community and village development in the selection and implementation of conservation strategies, but also recognizes that a common understanding among stakeholders and local communities about the value of biodiversity and threats accompanying it is needed. If reforestation efforts do not benefit communities it is highly unlikely that communities will support reforestation. The proposed Forest Partnership Framework seeks to simulatenuosuly address the environmental and social objectives of the reforestation program.
1.6.1 Impact on the downstream environment
During construction, sediment discharge will affect water quality and poor flow patterns, erosion, sediment control systems, and control of work carried out on riverbank wetlands and other discharge management. This is carried out by depositing the flow from the tunnel or location potentially erosion to two or three levels of settling ponds: sedimentation control of construction is carried out through control in the construction area itself, such as sediment that occurs during tunnel excavation, causing sediment when the run-off water plant batching process carries concrete particles (cement, sand and fly ash), during the process of material crushing and addition, run-off water carries dust particles, grains of sand and soil, when draining water for temporary construction (road construction, building construction, switch yards, control building,
44
Draft Environmental and Social Impact Assessment (ESIA) 2020
etc.) is carried out by constructing temporary embankments and so on.Diversions will restrict the movement of fish up and down stream.
During inundation, the hydrological regimes in the Cisokan and Cirumamis Rivers will be temporarily impacted when water is drawn to fill the reservoir over a 3-4 months period. At least 0.5 m3/s will be discharged from both dams to maintain some river flow (Surat Izin Penggunaan Sumber Daya Air, 2014). To avoid a big impact due to the filling of the reservoir, filling the reservoir will be carried out during the rainy season.
During operational activities, it is estimated that there will be only a slight change in the hydrological regime downstream of the two dams, because the pumped storage scheme will recycle water between the reservoirs. The operation of the reservoir is designed to discharge water at the same rate as the inflow into the reservoir, except for small volumes to replace evaporation. During the low flow period, a minimum e-flow discharge of 0.5 m3/s will be discharged (Surat Izin Penggunaan Sumber Daya Air, 2014) from each dam. This may lead to a reduction in the water storage (and generation capacity) at the Cisokan Hydroelectric Power Plant until higher inflows are received.
Changes in erosion patterns and disposition may occur downstream of the Cisokan River during operations, due to reduced sediment loads. Sediment will be deposited in the upper and lower dam and only suspended sediment will be flown downstream through the spillway and middle outlet in lower dam.
1.6.2 Reservoir Security and Management of Community Safety
Communities will be prohibited from approaching and using the reservoirs to protect their safety from the sudden and large daily fluctuations of water levels.
1.6.3 Socio-Economic Benefits
The socio-economic advantages include cheaper peak-load electricity provision and efficiency in the Java-Bali network, construction of new roads and bridges that allow access to remote hamlets and villages, and provide benefits to the local economy during the Construction stage (allocation work and provision of services) as well as the development of economic activities during operational time, such as economic activities of the PAPs who were originally dominated by agriculture towards service and trade. Obviously, this is a positive impact, on the one hand to strengthen the rural base sector (agriculture, animal husbandry, fisheries and forestry), on the other hand to grow services and trade. It is recognized that the environmental objectives of the Forest Partnership Framework that include significant reforestation efforts will require a change in livelihoods from ones focused on short-term income generation from annual crops to ones more focused on longer-term benefits from agroforestry.
45
Draft Environmental and Social Impact Assessment (ESIA) 2020
1.7 Relationship to Programs and Other Documents
1.7.1 Previous EIA and SIA documentation
A series of environmental, social and design studies have been carried out since the first investigations were carried out in the early 1990s. This ESIA report is an update document of previous EIA with addition and changes in accordance with actual conditions and information needed. The content of the ESIA combines relevant information from several previous EIA (Environmental Impact Assessment) (EIA 1991 and EIA 2001) and SIA (Social Impact Assessment) (SIA 2015) and any other technical documents reports:
• PT. PLN. 1998. Environmental Impact Analysis of UCPS HEPP West Java. Final Report.
• PT. PLN. 2001. Additional Environmental Investigation for the Detailed Design of UCPS Hydropower Plant Project.
• PLN/Newjec Inc. 2001. UCPS Hydropower Plant Project Additional Environmental Investigation. Social Acceptability Assessment.
• PLN/Newjec Inc. 2007. Environmental Impact Analysis. UCP Bandung Regency and Cianjur Regency West Java Province.
• PLN/Newjec Inc. 2007. Environmental Impact Analysis. 500kV Transmission Line Development for UCPS Hydropower Plant Bandung Regency and Cianjur Regency West Java Province.
• PLN/Newjec Inc. 2007. Social Acceptance Assessment. UCPS Bandung Regency and Cianjur Regency West Java Province.
• PLN/Newjec Inc. 2007. Supplement of Environmental Management Plan (RKL) and Environmental Monitoring Plan (RPL). 500kV Transmission Line Development for UCPS Hydropower Plant Bandung Regency and Cianjur Regency West Java Province.
• PLN. 2007. Environmental Impact Analysis (AMDAL) - UCPS Hydropower Plant
• PLN. 2011. Revision on ANDAL UCPS Hydropower Plant with a capacity of 4x260 MW West Java Province (Access Road, Quarry, Utilization of Fly Ash)
• PLN/PT.Gamma Epsilon Consultant. 2013. Independent Monitoring Agency-IMA UCPS
• PLN/Interdev Consultant. 2019. Social and Stakeholder Mapping Program for the UCPS 4x260 MW Hydropower Plant Project in West Bandung Regency and Cianjur Regency
1.7.2 Environmental and Social Report
The separate reports that have been used in the preparation of this ESIA report are:
• Neneng. 2009. Social Impact Assessment Final Report. UCPS Additional Environmental Studies 2009.
• Rahmat, A. 2009. UCPSS Biodiversity Survey. UCPS Hydrpower Plant Additional Environmental Studies 2009.
• PLN. 2012-2019. RKL-RPL UCPS Hydropower Plant
• PLN. 2012-2019. RKL-RPL 500 kV Extra High Voltage Power Line (SUTET) UCPS Hydropower Plant
• PLN/PT GEOTRAV BHUANA SURVEY, 2013. Study of local management of river (watershed management) to support cisokan upstream UCPS Hydropower Plant, 2013.
• PLN. 2014. Biodiversity Management Plan (BMP) UCPS Hydropower Plant
46
Draft Environmental and Social Impact Assessment (ESIA) 2020
• PT. LAPI ITB. 2015. Laporan Bulanan Ke-3 Pekerjaan Satuan Unit Pengaduan/GTF (Grievance Task Force) PLTA Upper Cisokan Pumped Storage. PT. PLN (Persero) UIP VI
• Fakultas Teknologi Industri Pertanian-UNPAD. 2016. Laporan Akhir Middle Term Report Upper Cisokan Pumped Storage Hydro-Electrical Power, PT. PLN (Persero) UIP, Jawa Bagian Tengah I.
• Fakultas Teknologi Industri Pertanian-UNPAD, 2017. Laporan Akhir Independent Monitoring Agency (IMA) Upper Cisokan Pumped Storage Hydro-Electrical Power, PT. PLN (Persero) UIP, Jawa Bagian Tengah I.
• Interdev, 2019. Laporan Akhir Program Sosial dan Stakeholder Mapping Proyek PLTA UCPS 4x260 MW di Wilayah Kabupaten Bandung Barat, PT. PLN (Persero) UIP, Jawa Bagian Tengah I.
• Interdev, 2019. Laporan Akhir Program Sosial dan Stakeholder Mapping Proyek PLTA UCPS 4x260 MW di Wilayah Kabupaten Cianjur, PT. PLN (Persero) UIP, Jawa Bagian Tengah I.
1.7.3 Technical Investigation Design and Report
A number of design and technical reports have been carried out to determine the feasibility and detailed design of the UCPS hydropower plant. The main technical documents that have been used to provide information in the ESIA document are:
• PLN/Newjec Inc. 1995. Feasibility Report for the UCPS Hydropower Plant Project Development Project in the Republik of Indonesia. Final Report (Summary).
• PLN/Newjec Inc. 2002. Detailed Design Report. Volumes 1 – 13.
• PLN/Newjec Inc. 2007. Supplementary Study of UCPS Hydropower Plant Project. Volumes 1-6.
• Sinotech Engineering/Hydrochina Corp. 2013. dam Safety Plan UCPS Hydropower Plant Project.
• PLN Enjiniring/Nippon Koei/Newjec Inc./Indokoei International/Wiratman, 2019. dam Design Review Report
• PLN Enjiniring/Nippon Koei/Newjec Inc./Indokoei International/Wiratman, 2019. Engineering Services for Updating Detailed Design and Preparing Construction Drawing of UCPS Hydropower Plant Project
• PLN Enjiniring/Nippon Koei/Newjec Inc./Indokoei International/Wiratman, 2019. Hydrology Review Report
• PLN Enjiniring/Nippon Koei/Newjec Inc./Indokoei International/Wiratman, 2019. Seismology Review Report
• PLN Enjiniring/Nippon Koei/Newjec Inc./Indokoei International/Wiratman, 2019. Open Earthwork Design Review Report
• PLN Enjiniring/Nippon Koei/Newjec Inc./Indokoei International/Wiratman, 2019. Underground Structure Design Review Report
• PLN Enjiniring/Nippon Koei/Newjec Inc./Indokoei International/Wiratman, 2019. GBR Review Report for Upper and Lower dam
1.7.4 Related Programs
This ESIA document contains programs and activities that PT. PLN has carried out previously as an effort to prevent and manage negative impacts through the resettlement process, both in project areas and communities in areas where resettlement will be carried out, environmental

47
Draft Environmental and Social Impact Assessment (ESIA) 2020
impact monitoring through RKL-RPL and implementation Biodiversity Management Plan (BMP). Since 2012, PLN has conducted monitoring through RKL-RPL twice a year around the project area.
48
Draft Environmental and Social Impact Assessment (ESIA) 2020
CHAPTER 2. LEGAL AND INSTITUTIONAL FRAMEWORK
This project is located in two administrative areas in West Java Province, namely West Bandung Regency and Cianjur Regency according to the Decree of the Governor of West Java Number 593 / Kep-596-Pemksm / 2018 dated June 8, 2018 concerning the Third Amendment to the Decree of the Governor of West Java Number 593 /Kep.1386/Pemum/2011 concerning Stipulation of Land Acquisition Location for the Construction of the Upper Cisokan Pumped Storage (UCPS) hydropower plant in West Bandung Regency and Cianjur Regency for the UCPS hydropower plant.
This project has been approved and implemented based on several relevant laws and regulations applicable in Indonesia. The key to the laws and regulations here is: - Regional Regulation No.22 of 2010 concerning the Regional Spatial Plan of West Java Province
in 2009-2029 - Law of the Republic of Indonesia No. 32 of 2009 concerning Environmental Protection and
Management.
Other related laws and regulations include guidelines and standards for land use, water quality, protection of endangered species, and environmental management, social aspects in relation to energy and electricity projects whose full list is listed in Annex B.
2.1 West Java Province Spatial Plan
According to Indonesian law, activities that are required to make an AMDAL must see whether the activities to be carried out are in accordance with the spatial layout, if not suitable then these activities must be rejected for the AMDAL process.
The Cisokan hydropower project activities are mandatory for AMDAL. The project locations are in West Java Province, namely West Bandung Regency and Cianjur Regency. For this reason, the AMDAL activity must be adjusted to the Spatial Plan for the Province of West Java, West Bandung Regency and Cianjur Regency.
Under the West Java Provincial Spatial Plan 2009-2029, the regional development regulations for West Java Province are divided into five development zones (Development Area Plans) and one special zone. The UCPS hydropower plant is located in the Sukabumi Development Zone and its surrounding. Apart from other development problems, the direction of the development zone for Sukabumi and its surroundings is to carry out strategic infrastructure development, and to build industries that do not cause pollution and do not require water abstraction apart from development opportunities in other economic fields.
The West Java infrastructure development plan is set out in Annex 4 of the spatial plan concept and includes plans for transportation infrastructure, water and irrigation, energy and electricity, and housing/ housing infrastructure. The development plan for energy and electricity infrastructure is:
• Construction of electrical installations and distribution networks to increase and evenly distribute electricity supply to all regions of West Java.
49
Draft Environmental and Social Impact Assessment (ESIA) 2020
• Recyclable energy development includes development: o geothermal, o micro-hydro, o solar and wind power, and o bio fuels.
• Development of non-recyclable energy such as fossil fuels, gas and coal for electricity supply.
The construction of UCPS hydropower plant in West Bandung Regency and Cianjur Regency is in accordance with the Regional Spatial Plan of West Java Province 2009-2029 (Regional Regulation (Perda) of West Java Province No.22 of 2010).
The basis for remembering the West Java Provincial Regulation No. 22/2010 includes Law No.5 of 1960 concerning Basic Agrarian Basic Regulations, Law of the Republic of Indonesia No. 5 of 1990 concerning Protection of Biological Natural Resources and Their Ecosystems, Law Republic of Indonesia No.41 of 1999 concerning Forestry, and Law of the Republic of Indonesia No. 7 of 2004 concerning Water Resources. Law of the Republic of Indonesia No.7 of 2004 concerning Water Resources is currently no longer valid and has been replaced by Law of the Republic of Indonesia No.17 of 2019 concerning Water Resources. One of the requirements for submitting AMDAL is the suitability of the activity with the regional spatial plan.
The development of UCPS hydropower plant in detail has been included in the West Bandung Regency Spatial Plan as regulated by the West Bandung Regency Regional Regulation (Perda) No.2 of 2012 concerning the West Bandung Regency Spatial Plan for 2009 - 2029 and is also included in the Regency Spatial Plan Cianjur as regulated in the Regional Regulation (Perda) of Cianjur Regency No. 17 of 2012 concerning the 2011-2031 Cianjur Regency Spatial Plan. Thus, the construction of Upper Cisokan Pumped Storage in detail is in accordance with the West Bandung Regency Spatial Plan and the Cianjur Regency Spatial Plan.
2.2 Protection and Management of The Environment
The Environmental Impact Analysis (AMDAL) process is mandatory for every business and/ or activity that has a significant impact on the environment. This is stated in the Law of the Republic of Indonesia No.32 of 2009 concerning Environmental Protection and Management, namely in Article 22 Paragraph (1). Law of the Republic of Indonesia No.32 of 2009 concerning Protection and Management of the Environment revokes Law No.23 of 1997 concerning Environmental Management. The implementation of AMDAL was originally regulated in Government Regulation PP 27 of 1999 concerning Environmental Impact Analysis. Government Regulation No.27 of 1999 was revoked and declared invalid with the promulgation of Government Regulation No.27 of 2012 concerning Environmental Permits on February 23, 2012.
According to Article 1 Number 11 of Law No.32 of 2009, an analysis of environmental impacts, hereinafter referred to as Amdal, is a study of the significant impacts of a planned business and/ or activity on the environment required for the decision-making process regarding business operation and/ or activities.
Minister of Environment Regulation No.5 of 2012 is no longer valid with the enactment of Minister of Environment Regulation No.38 of 2019. Regulation of the Minister of Environment
50
Draft Environmental and Social Impact Assessment (ESIA) 2020
No.38 of 2019 has come into effect since 2019. Minister of Environment Regulation No.5 of 2012 is no longer valid with the enactment of Minister of Environment Regulation No.38 of 2019. Minister of Environment Regulation No.38 of 2019 has come into effect since 2019. Meanwhile, the last revision of AMDAL for Cisokan Hydroelectric Power Plant was carried out in 2011. because of that the provisions applied in the construction of the Cisokan Hydroelectric Power Plant at that time were the Minister of Environment Regulation No.5 of 2012.
Based on the Regulation of the State Minister for the Environment of the Republic of Indonesia No. 05/2012 concerning Types of Business Plans and/ or Activities that Require an Environmental Impact Analysis in the hydropower sector as listed in Appendix I, namely (i) dams with a height of more than or equal to 15 meters , (ii) an area that is submerged in water is more than or equal to 200 hectares, and (iii) an energy capacity of more than 50 MW requires AMDAL because it has the potential to have an impact on physico-chemical aspects, especially on air quality (odor and noise) and water quality, flora and fauna aspects, social, economic and cultural aspects, especially in land acquisition.
The UCPS hydropower plant uses a Pumped Storage system with two dams, namely the Lower Dam and Upper Dam. Lower Dam, which dams the Cisokan River, while the upper dams the Cirumanis River. Lower Dam is approximately 98 m high with an inundation area of 260 Ha while Upper Dam is approximately 75 m high with an inundation area of 8O Ha. The total area of inundation (immersion) for the two dams is 340 Ha. The energy capacity produced is 1,040 MW.
With the criteria for the UCPS hydropower plant, these activities are included in the AMDAL mandatory criteria.
Based on Article 5 Paragraph (1) Government Regulation No.27 of 2012 concerning Environmental Permits that the AMDAL preparation as referred to in Article 4 Paragraph (1) is written into the AMDAL document which consists of: Terms of Reference, Andal and RKL-RPL.
Andal (Environmental Impact Analysis) is a careful and in-depth study of the significant impacts of a plan and/ or activity. (Article 1 Number 7 Government Regulation No.27 of 2012). RKL (Environmental Management Plan) is an effort to deal with the impact on the environment as a result of a planned business and/ or activity (Article 1 Number 8 of Government Regulation No.27 of 2012). RPL (Environmental Monitoring Plan) is an effort to monitor environmental components affected by the impact of a business plan and/ or activity.
Based on Article 2 of Government Regulation No.27 of 2012, every business and/ or activity that is required to have an Amdal or UKL-UPL is required to have an Environmental Permit. Environmental permits are obtained through phases of activities including Amdal and UKL-UPL preparation, Amdal assessment and UKL-UPL inspection and application and issuance of environmental permits.
According to Article 47 Paragraph (1) Government Regulation No.27 of 2012 that a. environmental permit issued by the Minister for environmental feasibility decisions or UKL-UPL Recommendations issued by the Minister. b. governor, for environmental feasibility decisions or UKL-UPL Recommendations issued by the governor; and c. regents/ mayors, for Decisions on Environmental Feasibility or UKL-UPL Recommendations issued by the regents/ mayors.
51
Draft Environmental and Social Impact Assessment (ESIA) 2020
PT. PLN (Persero) Central Java Development Main Unit 1 has obtained an environmental permit for hydropower activities at the UCPS hydropower plant activity location with a capacity of 4 x 260 MW in West Bandung Regency and Cianjur Regency based on the Decree of the Investment and Integrated Services Office One Gate Government of West Java Province No. 660/18/11.1.02.0/DPMPTSP/2018 dated 25 May 2018.
This environmental permit comes out with due regard: 1. Letter of the Governor of West Java No.660.1/1241-BPLHD dated 12 April 2007 regarding the
ANDAL, RKL/RPL Study Assessment for the Development of the Upper Cisokan Hydro
Power Plant (Pumped Storage) in Bandung Barat and Cianjur Regency
2. Letter of the Governor of West Java No.660/1985-BPLHD dated 21 April 2011 regarding the
Revised Study Assessment for ANDAL, RKL/RPL Upper Cisokan Pumped Storage with a
capacity of 4x260 MW (Intermediate Road Development Activity Plans, construction of access
roads, quarry mining and Fly Ash Utilization Coal) in West Bandung Regency and Cianjur
Regency;
3. Application letter for PT PLN (Persero) Central Java Development Main Unit I
No.0110/KLH.01.02/IUPJBTI/2018 dated 24 April 2018 regarding Upper Cisokan Pumped
Storage Hydropower Plant with 4x 260 MW Capacity in West Bandung and Cianjur
Regencies;
4. Head of the Office of Investment and One Stop Services of the Regional Government of West
Java Province No. 503/2635/ESDA dated May 15, 2018 regarding Technical Considerations;
5. Letter of the Head of the West Java Provincial Government Environmental Service No.660.1/2588/Bid-1/2018 dated May 17, 2018.
Based on Article 49 of Government Regulation no. 27 of 2012 that environmental permits that have been issued by the Minister, governors, or regents/ mayors must be announced through mass media and/ or multimedia which is carried out within 5 working days of issuance.
The Environmental Permit for the UCPS hydropower plant development was announced on 6 June 2019 as stipulated.
The Job Creation Act has been enacted. The Job Creation Law simplifies environmental
licensing to business licensing. Terms and obligations in environmental agreement remains part of the load terms and obligations in Business Licensing issued to business actors. During Permit Business is not revoked, then activities can still run, however if there is a violation for example not carrying out its obligations stipulated in the Amdal document or UKL-UPL then that will affected is Permissionmainly namely Business Licensing.
2.3 Other related laws and regulations
In addition to the spatial plan for the West Java Province and the Law on Environmental Protection and Management, there are other relevant laws and regulations.
52
Draft Environmental and Social Impact Assessment (ESIA) 2020
2.3.1 Electricity Laws and Regulations
The construction of the UCPS hydropower plant is one of the constructions involving the supply and utilization of electricity as well as electricity support businesses. Based on Article 1 paragraph 4 of the Law of the Republic of Indonesia No. 30 of 2009 concerning Electricity, it explains that electricity generation is the activity of producing electricity, while in Article 1 paragraph 5 of the Law of the Republic of Indonesia No. 30 of 2009 concerning Electricity it explains that power transmission electricity is the distribution of electricity from generation to the distribution system or to consumers, or the distribution of electricity between systems.
Based on these regulations, it is hoped that the development of the UCPS hydropower plant is in accordance with the provisions stipulated in the Law of the Republic of Indonesia No. 30/2009 concerning Electricity. The construction of the UCPS hydropower plant can guarantee the availability of electricity in sufficient quantities, good quality, and at a reasonable price in order to improve the people's welfare and prosperity. In addition, the requirements for development permits and operating permits from UCPS hydropower plant must comply with the provisions contained in Law of the Republic of Indonesia No.30 of 2009 concerning Electricity.
Several articles in the Electricity Law are amended and abolished by the Job Creation Act, one of which is article 30 of the Electricity Law so that in essence it reads that there is compensation for owners of land, buildings and plants on it that are used either directly or indirectly for power plant construction and transmission activities. For this reason, in the construction of Cisokan Hidropowerplant, PLN needs to pay attention to this.
2.3.2 Land Acquisition Legislation and Process
The construction of a power plant and transmission is included in the category of development for the public interest as regulated in Article 10 letters c and f of Law No.2 of 2012. In the construction of the UCPS hydropower plant, it consists of construction activities of two dams, generators, transmissions, substations, grids and distribution of electric power. This activity requires land. Land requirements for project activities include land for road access, construction of 2 dams, power house, transmission, replacement land, land for resettlement, and land for immersion. The land acquisition process refers to Presidential Regulation No.71 of 2012 as amended by Presidential Regulation No. 40 of 2014 for a second amendment to be made to Presidential Regulation No.99 of 2014.
The Law on Land Acquisition for Development in the Public Interest was amended by the Job Creation Law. For this reason, PLN must adjust the incomplete land acquisition mechanisms and processes such as residual land and village treasury lands in the Rongga and Cipongkor Districts with the new regulations in the Job Creation Law. The payment for the remaining land and village treasury land has not been completed by PLN.
2.3.3 Legislation concerning Village Treasury Land
The construction of UCPS hydropower plant partly uses village treasury lands in two sub-districts, namely Cipongkor District and Rongga District. West Bandung Regency. Village treasury lands are regulated in Law Number 6 of 2014 concerning Villages. Village treasury land is one of the village assets. Article 76 paragraph (1) of the Village Law states that village assets
53
Draft Environmental and Social Impact Assessment (ESIA) 2020
can be in the form of village treasury lands, ulayat lands, village markets, animal markets, boat moorings, village buildings, fish auctions, agricultural product auctions, village-owned forests, village-owned springs, public baths and other assets belonging to the village. villages that are managed independently for the benefit of the village concerned, therefore, even though the Village Treasury Land is only proven by Letter C/not yet certified, it has a higher compensation value when compared to private land controlled by individuals due to the element of public interest which is considered as a variable in determine the amount of compensation for Village Treasury Land as the object of land release.
The development of the UCPS hydropower plant, will affect the rural area, so in this case, PLN must pay attention to the development of villages or rural area development carried out in collaboration with the city/district government or local village government.
As explained in Article 83 paragraph 3 that the Development of Rural Areas includes: a. the use and utilization of the Village area in the framework of determining the development
area in accordance with the Regency/City spatial layout; b. services carried out to improve the welfare of rural communities; c. infrastructure development, increasing rural economy, and developing appropriate
technology; and d. Village community empowerment to increase access to services and economic activities.
Article 84 paragraph (1) states that the Development of Rural Areas by the Government, Provincial Government, Regency/ City Government, and/ or third parties related to the utilization of Village Assets and Village spatial planning must involve the Village Government.
In its implementation, the release and payment of compensation for village treasury land for Cisokan Hydroelectric Power Plant which refers to Permendagri Number 1 of 2016. Article 33 Paragraph (2) letter b Permendagri Number 1 of 2016 states that if the replacement land is not yet available, then the replacement land is first previously it could be given in the form of money. Then it is continued in Article 33 Paragraph (2) letter c that the replacement in the form of money as referred to in letter b must be used to purchase replacement land of an equivalent value. This can be interpreted that technically, compensation for village treasury land can be made using money which in the end still has to buy replacement land that is equal to the compensation value agreed upon and benefits the village. The next arrangement is regarding the location of replacement land. Article 33 Paragraph (2) letter d Permendagri Number 1 of 2016 states that the replacement land is prioritized to be located in the local village. Then it is continued by Article 33 Paragraph (2) letter e which states that if the location of the replacement land is not available in the local Village as referred to in letter d, the replacement land can be located in one District and / or Village in another District which is directly adjacent. Arrangements regarding compensation can be given in the form of money in advance and regarding the location of replacement land, of course, makes it easier for those who need land as the party who is obliged to find replacement land to immediately get replacement land.
If with Law 2 of 2012, the provisions for releasing village treasury lands are carried out with reference to Article 34 of the Minister of Home Affairs Regulation No.1 of 2016, which states that the implementation stages of releasing village treasury lands and releasing village treasury lands must be carried out with the permission of the Regent and Provincial Governor for the location of village treasury lands. The permission from the Governor is the basis for the Officials Making
54
Draft Environmental and Social Impact Assessment (ESIA) 2020
the Land Acquisition Commitment to be able to provide compensation to the Village for land acquisition in the form of village treasury land.
Regarding the compensation that must be made by PLN as a work provider in the construction of PLTA Cisokan, there are changes in the Job Creation Law. The changes are as follows: Article 46 related to compensation for village treasury land, there is an additional change in the form of compensation, according to Article 46 paragraph (4) it explains that compensation for the object of village treasury land acquisition as referred to in paragraph (1) letter c can be given in a deep form. Article 36 which includes: a. Money b. Residential land c. Resettlement d. Share ownership, and e. Another form agreed upon by both parties
The value of losses incurred in Article 34 paragraph (2) of the Job Creation Law that compensation is carried out based on the results of the assessment which will be submitted to the Land Institution along with the minutes of the announcement of the location for the construction of PLTA Cisokan. The compensation value determined by the peniai is final and binding.
2.3.4 Settlement Laws and Regulations
Residents affected by the inundation of Upper dam and Lower dam have made new settlements. For the resettlement of PT. PLN, the Central Java Development Main Unit, refers to Law Number 1 of 2011 concerning Housing and Settlement Areas, as described in Article 86 paragraph 1 of Law Number 1 of 2011 concerning Housing and Settlement Areas that requires maintenance and repairs intended to maintain the proper and sustainable function of housing and settlement areas for the benefit of improving the quality of life of individuals.
2.3.5 Construction Activities Legislation
Construction activities in the Upper Cisokan project, both main and supporting construction, must comply with the provisions in the Construction Services Law No.2 of 2017 which replaces Law 18 of 1999 concerning Construction Services, along with its implementing regulations.
According to Article 59 Paragraph (1) of Law No.2 of 2017, in the implementation of construction services, service users and service providers are required to meet security, safety, health and sustainability standards. Then in Article 85 Paragraph (1) of Law No.2 of 2017 that the public can participate in the supervision of the implementation of construction services by accessing information and information related to construction activities that have an impact on the interests of the community and making complaints, lawsuits and efforts to get compensation or compensation for impacts caused by construction service activities.
Currently, PT Brantas Abipraya has completed the construction of the 27 KM access road which will be continued by PT Pembangunan Perumahan (PP) Persero. All impacts due to construction work have been completed and will continue to be completed by PT PLN (Persero) Central Java Development Main Unit 1 as long as there are still complaints from the public.
55
Draft Environmental and Social Impact Assessment (ESIA) 2020
PLN must pay attention with amendments to the Construction Services Law by Job Creation Law to the dam construction and transmission activities that will be carried out soon.The elimination of several articles in the Construction Services Law which obligate the opening of a foreign construction service representative office, prioritizing the use of domestic construction materials and technology, technology transfer processes, to the requirement to have high technology that is up to date, efficient and environmentally sound, forming operational cooperation with agencies a national construction service business with large qualifications that has a business license in every construction service business activity in Indonesia; employs more Indonesian workers than foreign workers.
2.3.7 Employment and OHS Laws and Regulations
Labor Regulations related to Occupational Health and Safety 1. Law Number 13 of 2003 concerning Manpower
One of the important discussions in Law Number 13 of 2003 concerning Manpower related to Cisokan Hydropower workers is the protection of occupational safety and health which are rights that must be accepted by workers and fulfilled by companies, in this case, PLN. Furthermore, the mandatory provisions for PLN in providing protection for workers in the construction of Cisokan Hydropower are regulated in Articles 86 and 87 of Law Number 13 of 2003 concerning Manpower Article 86 explains that: (1) Every worker/ laborer has the right to receive protection:
a. Occupational Health and Safety; b. Morals; and c. Treatment in accordance with human dignity and religious values.
(2) To protect the safety of workers/ laborers in order to achieve optimal work productivity, efforts are made to Occupational Health and Safety.
(3) The protection as meant in paragraph (1) and paragraph (2) shall be implemented in accordance with the prevailing laws and regulations.
Article 87 explains that: (1) Every company is obliged to implement an Occupational Health and Safety management
system that is integrated with the company management system. (2) Provisions regarding the implementation of the Occupational Health and Safety
management system as referred to in paragraph (1) shall be regulated by a Government Regulation.
The protection of occupational health and safety, especially in the construction of the Cisokan Hydropower, is important to be implemented, with the aim that the realization of the Cisokan hydropower is optimal and in accordance with the provisions of the laws and regulations regulated in Indonesia. In line with this, the International Labor Organization (ILO) also explains that the productivity achieved in carrying out work is a numerical comparison between the amount produced and the amount of each source used during production, which is fulfilled and balanced. The implementation of occupational health and safety in the construction of the Cisokan is intended to reduce the risk of accidents and diseases due to work, control of dangerous places in the workplace, treatment and rehabilitation during the construction of Cisokan Hydropower.
56
Draft Environmental and Social Impact Assessment (ESIA) 2020
All workers in the construction activities of the UCPS hydropower plant project have their normative rights following Law No.13 of 2003 concerning Manpower. Some of which have been amended by the Job Creation Act. Changes to the Manpower Law are: 1. The loss of the maximum time limit provisions in the Fixed Time Work Agreement (PKWT). 2. Permit to use foreign workers is replaced only with a plan to use foreign workers approved
by the central government and there are exceptions such as for startups, research, etc. 3. Overtime per day is added from a maximum of 3 hours to 4 hours, a maximum of 18 hours a
week. 4. Rest weekly for one day for 6 working days in one week. The provision of weekly rest for 5
working days is not regulated. 5. The elimination of the phrase "the need for a decent life" as a reference for calculating the
minimum wage, which has an impact on the broader shift in the concept of wage protection. 6. Removal of restrictions on the types of work that can be outsourced. 7. The paradigm shift of termination of employment is easier because it opens the possibility of
layoffs only through notification from employers to workers without prior negotiation. 8. Less government interference in industrial relations by restoring work relations to an
agreement between employers and workers, such as the matter of non-permanent contracts time limit and the right to long rest that can be agreed upon in the work agreement.
2. Law Number 1 of 1970 concerning Occupational Safety
As has been explained in the protection of occupational health and safety based on Law Number 13 of 2003 concerning Manpower, a more specific arrangement or lex specialis that regulates worker safety in the construction of Cisokan Hydropower has been regulated in Law Number 1 of 1970 concerning Work Safety.
The things that must be done by PLN as a company involved in the construction of the Cisokan Hydropower must be in accordance with those stipulated in Article 14 of Law No.1 of 1997 concerning Work Safety, namely: a. In writing, placing in the workplace he leads, all the required work safety requirements,
both against the rules in the work safety legislation and all the implementing regulations that apply to the workplace concerned, in places that are easily seen and legible and according to the instructions of the supervisory officer or occupational health expert;
b. Installing in the workplace he leads, all required work safety pictures and all other guidance materials, in places that are easily seen and legible according to the instructions of supervisory employees or occupational safety expert.
c. Providing free of charge, all personal protective equipment required for workers under their leadership and providing for every other person who enters the workplace, accompanied by instructions required according to the instructions of the supervisory employee or occupational safety expert.
These things must be fulfilled by PLN as a company that leads the development of Cisokan Hydropower as part of fulfilling workers' rights, especially in terms of protecting workers' health and safety.
3. Law Number 36 of 2009 concerning Health
57
Draft Environmental and Social Impact Assessment (ESIA) 2020
This Law participates in regulating occupational health as referred to in the previous Law. Occupational health is regulated in the sixth part concerning Occupational Health, further in Article 23 which explains that: (1) Occupational health shall be implemented to achieve optimal work productivity. (2) Occupational health includes occupational health services, prevention of occupational
diseases and occupational health. (3) Every workplace is obliged to provide occupational health. (4) Provisions regarding occupational health as referred to in Paragraph (2) and Paragraph (3)
are stipulated by a Government Regulation.
Based on this explanation, it means that PLN as a work provider is obliged to guarantee the work health of workers who are involved in the construction of the Cisokan hydropower.
4. Government Regulation Number 88 of 2019 concerning Occupational Health
Government Regulation Number 88 of 2019 concerning Occupational Health is the implementing regulation of Law Number 36 of 2009 concerning Health. Based on the two regulations, it is explained that Occupational Health is an effort aimed at protecting everyone who is in the workplace so that they can live healthily and free from health problems and bad effects resulting from work. Whereas the definition of a workplace is any room or field, closed or open, mobile or permanent, where the worker works, or where workers often enter for business purposes and where there is a source of danger in accordance with the provisions of laws and regulations.
This means that in the implementation of occupational health for the workforce, the construction of Cisokan Hydropower is mandatory because Article 3 of the PP on Occupational Health explains that "Occupational Health Providers as referred to in Article 2 are addressed to everyone who is under the workplace". This is also reflected in the explanation related to occupational health which has always been an integral part of the guarantee of occupational health and safety as regulated in the Manpower Act, the Occupational Safety Law and the Health Law. In addition, policies related to occupational health insurance for workers are in line with the principles in the National Health System in Indonesia.
The following is an explanation of what health insurance protection that PLN can provide as the main company in the construction of Cisokan Hydropower to workers who are bound in it, based on Article 2 of Government Regulation Number 88 of 2019 concerning Occupational Health:
Article 2 (1) The central government, regional governments and the community are responsible for
implementing occupational health in an integrated, comprehensive and sustainable manner.
(2) The Occupational Health Administration as referred to in paragraph (1) includes efforts: a. disease prevention; b. health improvement; c. disease management; and d. health restoration.
58
Draft Environmental and Social Impact Assessment (ESIA) 2020
(3) Efforts as referred to in paragraph (2) shall be implemented in accordance with occupational health standards.
(4) The occupational health standard as referred to in paragraph (3) shall be implemented with due observance of the National Health System and the national occupational health and safety policy in accordance with the provisions of laws and regulations.
In Government Regulation Number 88 of 2019 concerning Occupational Health, it is also regulated in relation to the standards that must be carried out by occupational health providers as regulated in Articles 4,5, 6 and 7 which consist of standards for efforts to prevent occupational diseases, efforts to improve health in workplace, efforts to deal with disease for workers, as well as efforts to restore health to workers.
Furthermore, PLN as an occupational health provider based on the PP Health at work is obliged to provide supporting facilities in order to guarantee the health of workers who are tied to the construction of Cisokan Hydropower, including: a. Human resources consisting of health workers and non-health workers as supervisors; b. Health service facilities such as the nearest health center as a form of cooperation; c. Occupational Health Equipment such as personal protective equipment in accordance with
risk factors or occupational safety and health hazards in the Cisokan hydropower plant; and d. Recording and reporting related to the implementation of occupational safety and health
insurance carried out by employers, managers and managers of work places, and/ or health service facilities.
Furthermore, the recording and reporting are submitted in stages to the Central Government and Regional Governments as surveillance of the implementation of occupational health in the construction of the Cisokan Hydropower plant.
5. Law Number 40 of 2004 regarding Social Security
This Social Security Law is the basis for the guarantee of the rights that should be received by workers. Social securities as regulated in Article 18 of Law Number 40 of 2004 cover: a. health insurance; b. accident insurance; c. pension plan; d. pension guarantee; and e. life insurance.
Based on this explanation, insurance matters relating to occupational health and safety include health insurance, work accident insurance and death insurance. Based on this Law, PLN as a work provider is obliged to guarantee the health of the workforce organized nationally based on the principles of social insurance and the principle of equity.
The health insurance that is held can be carried out by PLN as a work provider with the aim of ensuring that participants get the benefits of health care and protection in meeting basic health needs, given the condition of Indonesia which is currently in a state of the Covid-19 pandemic, this health insurance needs to be further improved along with the there are many parties in the construction of the Cisokan hydropower plant. In this case, PLN does not only provide health insurance to workers, but all family members of the participants are entitled to receive health insurance benefits. PLN must also provide occupational health insurance which
59
Draft Environmental and Social Impact Assessment (ESIA) 2020
remains valid for a maximum of 6 (six) months if during the construction of the Cisokan Hydropower there are workers who experience termination of employment.
The health insurance provided by PLN as a work provider will be in the form of individual services in the form of health services that include promotive, preventive, curative and rehabilitative services, including drugs and consumable medical materials that are needed. Furthermore, it will be given to government-owned or private health facilities that collaborate with the Social Security Administering Body. Except in an emergency situation, services can be provided at health facilities that do not cooperate with the Social Security Administering Bodies.
While the explanation for the provision of work accident insurance by PLN, then PLN as a work provider must follow the work accident insurance arrangements as described in Article 29 that work accident insurance is held nationally based on the principle of social insurance, with the aim of ensuring that participants receive health service benefits and monetary compensation. cash if a worker has a work accident or suffers from occupational disease.
As a construction work that has a high hazard, the guarantee of work accidents is the second thing that must be provided as a guarantee of occupational safety and health for workers in the construction of the Cisokan Hydropower. Meanwhile, PLN must provide benefits in the form of health services in accordance with their medical needs and receive benefits in the form of cash in the event of a permanent total disability or death to the worker who has a work accident. Work accident security benefits in the form of cash are given at the same time to the heirs of workers who die or workers with disabilities according to the level of disability. Further provisions regarding the amount of cash benefits, heir rights, compensation and medical services.
However, in this case, there are actually several different arrangements as described in this Social Security Law where participants who receive social security in the form of health insurance and work accidents are workers who have paid regular contributions as well as if there are additional family members as regulated in Article 30 of the Social Security Law. Meanwhile, this is different from what is regulated in the Occupational Health Law which explains that health insurance is not paid for by the worker himself but has been guaranteed by the government.
However, even though there are differences in the arrangements for occupational safety and health insurance. The workforce for the construction of Cisokan Hydropower must still be fulfilled and guaranteed by the work provider, namely PLN and further policies are regulated by PLN.
6. Law Number 24 of 2011 concerning Social Security Administering Bodies In the context of implementing occupational health and safety insurance, Law Number 24 of 2011 concerning Social Security Administering Bodies has the function of administering health insurance programs. As explained in Article 14 of the BPJS Law that "Everyone, including foreigners who have worked for at least 6 (six) months in Indonesia, must be a participant of the Social Security program.”.
60
Draft Environmental and Social Impact Assessment (ESIA) 2020
This means that companies related to the workforce are required to gradually register workers who are participants of social security recipients, including in the construction of the Cisokan Hydropower, in which PLN is obliged to provide occupational safety and health guarantees to the workforce of the construction of Cisokan Hydropower as it should be regulated in Article 14 of the BPJS Law. Furthermore, it is explained in Article 15 of the BPJS Law, that:
Article 15 (1) An Employer is obliged to gradually register himself and his Workers as Participants with
the BPJS in accordance with the Social Security program being participated in. (2) Employers, in registering as referred to in paragraph (1), are required to provide complete
and correct data on themselves and their Workers and their family members to BPJS. (3) The stages referred to in paragraph (1) shall be regulated by a Presidential Regulation.
As for the company's implementation of the construction of Cisokan hydropower in the context of implementing occupational health and safety guarantees for its workers, it can be done by following the health insurance and work accident insurance and death insurance programs as described in Article 6 paragraph (1) of the BPJS Law.
7. Government Regulation Number 50 of 2012 concerning Implementation of the Occupational
Health and Safety Management System Government Regulation Number 50 of 2012 describes the Occupational Health and Safety Management System which is part of the overall company management system in the context of controlling risks related to work activities in order to create a safe, efficient and productive workplace. In this case, PLN as a work provider company certainly must have company management as regulated in Government Regulation Number 50 of 2012, especially related to the construction of the Cisokan Hydropower.
Furthermore, in the running of occupational safety and health guarantees that have been carried out by PLN during the construction of the Cisokan Hydropower, an Occupational Health and Safety Management System Audit will be carried out as part of a systematic and independent inspection of the fulfillment of predetermined criteria to measure the results of activities that have been planned and implemented in the application of the Occupational Health and Safety Management System in the employer company.
Based on the Elucidation of Article 5 paragraph 2 the requirements that must be fulfilled as a work provider company are obliged to carry out the Occupational Health and Safety Management System as follows: Article 5 paragraph (2) The obligations referred to in paragraph (1) apply to companies: a. employing workers / laborers at least 100 (one hundred) people; or b. has a high level of potential danger.
Furthermore, the description of work with a high level of potential danger is as follows "high level of potential hazard" is a company that has a potential hazard that can cause accidents that harm human life, disruption of production processes and pollution of the work environment”.
Based on the requirements as described in Article 5 paragraph 2 PP Number 50 of 2012, the construction work of the Cisokan Hydropower is one that is included in the work that must
61
Draft Environmental and Social Impact Assessment (ESIA) 2020
be accompanied by an occupational safety and health management system, which is based on data provided by PLN that the number of workers The total involved in the construction of the Cisokan Hydropower includes 2700 workers, which means that in this case one of the requirements for the implementation of Occupational Health and Safety Management System in this development can be fulfilled.
In addition, based on the understanding of the high level of potential danger described in the explanation of article 5 letter b of Government Regulation Number 50 of 2012, the construction work of Cisokan Hydropower is one of the jobs with high potential hazards because the risk of work accidents does not only cover human loss but also resulting in disruption of the production process and pollution of the work environment.
Therefore, this Occupational Safety and Health Management System must be fulfilled by PLN as a work provider and is carried out in order to prevent and reduce occupational accidents and occupational diseases by involving elements of management, workers/ laborers, and/ or trade/ labor unions. Article 6 paragraph (1), it is explained that what PLN can do as a work provider is as follows: Article 6 paragraph (1) a. the stipulation of OHS policies; b. OHS planning; c. the implementation of the OHS plan; d. monitoring and evaluation of OHS performance; and e. Performance improvements and enhancements of Occupational Health and Safety
Management System
The explanation is as follows: a. The Stipulation of OHS Policies
The OHS policy stipulation carried out by PLN is carried out as referred to in Article 6 paragraph (1) letter a carried out by the entrepreneur by compiling the policy must at least: a) conduct an initial review of the OHS condition which includes:
1. identification of potential hazards, risk assessment and control; 2. a comparison of the implementation of OHS with companies and other sectors that
are better; 3. review of the cause and effect of a dangerous event; 4. compensation and interference as well as the results of previous assessments relating
to safety; and 5. assessment of the efficiency and effectiveness of the resources provided. b. pay
attention to continuous improvement of OHS management performance; and c. pay attention to input from workers/ labor and/ or trade/ labor unions.
The OHS policy made by the company contains at least a number of related issues 1. vision; 2. company objectives; 3. commitment and determination to implement the policy; and 4. framework and work program covering general and/ or operational company activities.
62
Draft Environmental and Social Impact Assessment (ESIA) 2020
PLN as a work provider must disseminate the stipulated OHS policy to all workers/ laborers, people other than workers/ laborers who are in the company, and other related parties.
b. OHS planning
The OHS plan is prepared and stipulated by the entrepreneur with reference to the OHS policy that has been determined, while in preparing the OHS plan as referred to in paragraph (2) the entrepreneur must consider: a) the results of the initial review; b) identification of potential hazards, risk assessment and control; c) laws and regulations and other requirements; and d) resources owned.
PLN as a work provider in compiling an OSH plan must involve an OSH Expert, an OHS Advisory Committee, workers / labor representatives, and other parties involved in the company.
The OHS plan contains at least: a. goals and objectives; b. priority scale; c. hazard control efforts; d. determination of resources;
2.3.8 Quarry Mining Regulations
The rocks for the construction of the UCPS hydropower plant dam using granite taken from Gunung Karang belong to PT Indonesia Power's SHGB. Quarry mining is included in the category of rock mining commodity as regulated in Article 2 Paragraph (2) letter d of Government Regulation No. 23/2010 concerning the Implementation of Mineral and Coal Mining Business Activities. This government regulation is a mandatory rule from Law No.4 of 2009 concerning Minerals and Coal (Minerba). Law No.4 of 2009 has been amended, namely by Law No.3 of 2020 concerning Amendments to Law No.4 of 2009.
In mining and quarry transportation activities, PLN and contractors must pay attention to the provisions of the Minerba Law which part of the article has been amended by the Job Creation Law.
PT. PLN (Persero) has a Cooperation Agreement with PT Indonesia Power Saguling Power Generation and Operation & Maintenance Unit Regarding Land Use and Quarry Gunung Karang which is located in Karangsari Village, Cipongkor District, West Bandung Regency for the Purposes of Construction of PT PLN's UCPS hydropower plant Central Java Development Main Unit I.
2.3.9 Borrowing and Use of Forest Areas Permit Legislation
The construction of the UCPS hydropower plant is in a forest area. For this reason, PLN is required to have a land use permit based on the Minister of Forestry Regulation Number: P.16/Menhut-II/2014 concerning Guidelines for Borrowing and Using Forest Areas. Based on
63
Draft Environmental and Social Impact Assessment (ESIA) 2020
the Decree of the Head of the Investment Coordinating Board No.63/I/IPPKH /PMDN/ 016 concerning Borrowing and Use of Forest Areas for the construction of the UCPS hydropower plant in Limited Production Forest Areas and Permanent Production Forests on behalf of PT PLN (Persero) in the Regency West Bandung and Cianjur Regency, West Java Province, covering an area of approximately 409 hectares.
For forest land status, the current status of forest lease-to-use (PPKH) with a land area of 155.89 hectares (ha) can be used because it has obtained principle permits and dispensation permits, which are currently in the process of fulfilling the requirements for issuing borrow-to-use permits. Meanwhile, the Land Borrowing and Use of Forest Area (PPKH) compensation area of 161.5623 Ha of 311.78 Ha (51.82 percent) has been released and the handover of land for compensation phase I covering an area of 152.27 Ha is currently in the process of application. issuance of technical considerations for land compensation candidate phase II from the West Java Provincial Forestry Service (Dishut Prov Jabar). Then for the status of forest area swap (TMKH) with a land area of 229.36 ha has obtained a principle permit and is currently in the process of applying for a dispensation permit.
2.3.10 Legislation concerning Utilization of Water Resources
The construction of the UCPS hydropower plant is a development of electricity procurement from water resources. According to the general explanation contained in the Law of the Republic of Indonesia No.17 of 2019 concerning Water Resources, it is explained that one of the uses of water resources can be made for businesses that use water as a medium or the main element in their operations such as hydroelectric power.
The construction of the UCPS hydropower plant, which uses water resources as the main medium, has an impact on the destructive power of surrounding water which can harm life as described in Article 1 number 16 Law of the Republic of Indonesia No.17 of 2019 concerning Water Resources. The destructive force of water that can occur as a result of the construction of the Cisokan Pumped Storage Hydroelectric Power Plant, one of which is related to the quality of water in the environment around Cisokan due to changes in the nature and chemical, biological and physical properties of water. So that in order to minimize the destructive power of water, PLN is obliged to follow the regulations related to overcoming the destructive power of water which refers to Article 35 of Law Number 17 of 2019 concerning Water Resources.
Regarding the water resources management plan which includes conservation, utilization and control of the destructive force of water intended for the construction of the UCPS hydropower plant, PLN is obliged to follow the regulations contained in Law of the Republic of Indonesia No.17 of 2019 concerning Water Resources.
2.3.11 Legislation concerning Extra High Voltage Transmission Lines
To distribute the electricity generated by the UCPS hydropower plant, a connection to the Java-Bali transmission network is required. The connection to be built is a 500kV Extra High Voltage Transmission Line. The network will comprise of two transmission lines build to the north of UCPS which will be connected to the Cibinong-Saguling transmission line. The length of the transmission lines will be 15.5 km and 15.9 km respectively, with as many as 82 towers with a minimum tower height of 30.5 m.
64
Draft Environmental and Social Impact Assessment (ESIA) 2020
During the construction of the transmission lines, PT PLN (Persero) the Central Java Development Main Unit 1 must follow the Minister of Energy and Mineral Resources RI Regulation No.2 of 2019 concerning Amendments to the Minister of Energy and Mineral Resources Regulation No. High Voltage Transmission of Delivery for the Distribution of Electric Power.
2.3.12 Fulfillment of Endangered Wildlife and Biological Resources Protection
The following list of Indonesian environmental regulations specifically pertains to flora and fauna. A full list of environmental regulations is presented in the ESMP.
• Indonesian Act Number 5, 1990 about Conservation of Natural Resources and Ecosystems.
• Indonesian Act Number 32, 2009 about Protection and Environmental Management.
• Indonesian Act Number 27, 1999 about Environmental Impact Assessment.
• Indonesian Act Number 13, 1999 about Animal Poaching
• Indonesian Act Number 7, 1999 about Preservation of Fauna and Flora.
• Indonesian Act Number 8, 1999 about Utilization of Plants and Wildlife.
• Presidential Regulation Number 23, 1990 About Environmental Impact Management Agency
• President Regulation Number 4, 1993 about National Flora and Fauna.
• West Java Provincial Regulation 2/2006 about management of protected areas
The Indonesian Act no. 5 of 1990 is of most direct relevance to biodiversity conservation in the UCPS area, as far as this concerns legally protected species. Article 21 of the Act states that:
I. Each person is forbidden to
a) take, cut, possess, damage, destroy, take care of, carry out and trade protected flora or its
part alive or dead
b) export protected flora or its part alive or dead from any places in Indonesia into other
places either inside or outside the country
2. Each person is forbidden to
a) catch, wound, kill, store, possess, carry out and trade protected fauna alive
b) store, possess, care of, and trade dead protected fauna
c) export protected fauna from any places in Indonesia into other places either inside or
outside the country
d) trade, store or possess skin, body or other part of protected fauna or things made from
part of fauna and export to any part of Indonesia to other places inside or outside the
country
e) take, damage, destroy, trade, store or possess eggs and/or nests of protected fauna
Act Number 7 of 1999 clarifies which species are protected, with the fauna and flora sections above indicating which species are concerned in Cisokan.
65
Draft Environmental and Social Impact Assessment (ESIA) 2020
2.3.13 Legislations for the Protection of Children, Women and People with Disabilities
Construction of the UCPS hydropower plant needs to pay attention to rights for the community, especially women, children and people with disabilities. Towards the fulfillment of protection arrangements for women, children and people with disabilities, PLN is obliged to pay attention to and comply with existing laws and regulations as a form of prevention of impacts that occur on women, children and people with disabilities, both at the central and regional levels, such as:
a. Law Number 23 of 2003 concerning Child Protection; b. Law Number 35 of 2014 concerning Amendments to Law Number 23 of 2002 concerning
Child Protection; c. Law Number 8 of 2016 concerning Persons with Disabilities; d. Government Regulation Number 65 of 2015 concerning Guidelines for Diversion
Implementation and Handling of Children Not Aged 12 Years Old; e. Regent Regulation Number 84 of 2018 concerning Amendments to Perbup No. 2 of 2018
concerning the Establishment of the UPTD in the Cianjur Regency Government Its existence is based on the work area in the nearest sub-district;
f. Cianjur Regency Regional Regulation Number 6 of 2015 concerning Implementation of Child Protection;
g. Cianjur Regency Regional Regulation No. 3 of 2010 concerning the Eradication of Trafficking in Persons;
h. Cianjur Regency Regional Regulation Number 1 of 2020 concerning the Prevention and Handling of Deviant Sexual Behaviors;
i. Cianjur Regent Regulation Number 84 of 2019 concerning Duties, Functions and Work Procedures of Regional Technical Implementing Units in the Field of Population Control, Women Empowerment and Child Protection at the Office of Population Control, Family Planning, Women's Empowerment and Child Protection in Cianjur Regency.
2.3.14 Gender and Gender Based Violence
The WB’s World Bank Group’s Gender Strategy (FY16-23), and companion EEX (Energy and Extractives) Gender Note as guidance frameworks emphasize focuses on four objectives: (a) improving human endowments; (b) removing constraints for more and better jobs; (c) removing barriers to women’s ownership and control over assets; and (d) enhancing women’s voice and agency and engaging men and boys. The WB Gender Strategy aligns well with Indonesia’s commitment to gender equality and women’s empowerment. More details of the GoI’s gender milestones can be found in Table X:
• International: Indonesia has ratified the UN Convention on the Elimination of All Forms of Discrimination against Women (CEDAW) (1979) and committed to the Beijing Declaration and Platform for Action (1995), both of which provide guidance on eliminating obstacles for women to fully participate in social, economic and political life. Indonesia has issued a Presidential Decree (no 57/2017) as the legal basis for the implementation of the Sustainable Development Goals (SDGs), which includes a specific goal on gender equality and women’s empowerment (SDG number 5). Indonesia’s global commitments to UN Women include a focus on increasing the participation and representation of women in decision-making processes, reducing maternal mortality by
66
Draft Environmental and Social Impact Assessment (ESIA) 2020
expanding access to reproductive health services, and eliminating all forms of violence against women. In 2015, Indonesia committed to the G20 Development Commitments, which included a pledge to reduce the gender gap in labor force participation by 25 percent by 2025.
• National Level: Indonesia has adopted a policy and institutional framework that promotes women’s rights. The Indonesian Constitution gives equal rights to men and women and several national laws and regulations support this. Indonesia was one of the first countries in the region to establish a separate Ministry for the Role of Women. The Government has also passed several laws and regulations to protect women and children from violence,6 increase the number of women in politics,7 and promote gender mainstreaming in planning and budgeting,8 which is central to the Government’s gender equality efforts. More recently, the Indonesian Government committed to improving gender equality in RPJMN 2020-2024, which includes targets on access to education, employment, health, violence, and representation in politics. However, the implementation of these laws and targets are often hindered by several factors, such as limited institutional capacity, no clear mandate, and the lack of a clear implementation strategy. The Government of Indonesia does not currently have any overarching strategy on gender equality, although targets related to gender are included in the Medium-Term Development Plan 2020-2025.
• Local government level: relevant laws include West Java Provincial Regulation Number 5 of 2006 concerning Child Protection; West Java Provincial Regulation Number 3 of 2008 concerning the Prevention and Management of Victims of Trafficking in Persons; as well as Governor Regulation Number 3 of 2014 concerning the implementation of the minimum service standard (SPM) in integrated services for victims of trafficking in persons and violence against women and children. Meanwhile, for government policies at the district/ city level, namely Cianjur Regency and KBB, as the local government for the location of the UPCS Hydropower construction, no policy specifically addresses violence mitigation against women and children. However, policies that support efforts to prevent acts of violence against women and children or GBVs are already in place, including Cianjur Regency Regulation No. 3 of 2010 concerning Combating Trafficking in Persons; Cianjur Regency Regional Regulation No. 6 of 2015 concerning Implementation of Child Protection; Cianjur Regency Regulation No. 84 of 2019 concerning the Duties, Functions and Work Procedures of Regional Technical Implementation Units for Population Control, Women Empowerment and Child Protection in the Office of Population Control, Family Planning, Women's Empowerment and Child Protection in Cianjur Regency. Meanwhile, the new KBB has West Bandung Regent Regulation No. 1
6 These include the Law on Domestic Violence in 2004, the Victim Protection Law in 2006, the Law on Anti-Trafficking in 2007, and the Law on the Protection of Women and Anti Gender- Based Violence in 2009. 7 The Law No.10/2008 regarding General Election stipulates that there must be at least 30 percent female representation in Parliament. 8 The Gender Mainstreaming in National Development Policy (under Presidential Decree No. 9/2000) guides the inclusion of gender into the planning cycle. In 2008, the Ministry of Home Affairs issued Regulation No. 15/2008 on Guidelines for implementation mainstreaming gender at local government levels.
67
Draft Environmental and Social Impact Assessment (ESIA) 2020
of 2016 concerning the Integrated Service Center for the Empowerment of Women and Children (P2TP2A) of West Bandung Regency.
Table: Key Gender Milestones by GOI
Year Government Key Gender Milestones
2000 Gender mainstreaming President Abdurrahman Wahid issued Presidential Instruction No. 9 of 2000 on Gender Mainstreaming in National Development (“Inpres No. 9/2000”) that instruct all government agencies, at national, sub-national and local levels, to mainstreaming gender in all policies and programs throughout its planning, implementation, monitoring and evaluation.
2008 Guidelines for gender mainstreaming The Minister of Home Affairs Regulation No. 15 of 2008 (which later changed to The Minister of Home Affairs Regulation No. 67 of 2011) concerning Gender Mainstreaming in the Region, provides guidelines for the sub-national and local governments with regards to integrating gender in their policy strategy as well as development program. This regulation shows commitment of the national government to mainstreaming gender into local levels. At the same time, it provides opportunity for optimum participation of all stakeholders in the development programs. This regulation also mandates all local governments to develop an Action Plan on Gender Mainstreaming in Local or Regional (Rencana Aksi Daerah Pengarusutamaan Gender).
2008 Gender safeguards The Minister Women Empowerment and Child Protection Regulation No. 2 of 2008 concerning Guideline of the Implementation of Women’s Protection, encourages the integration of gender safeguard in all activities of government agencies, NGOs/CSOs and universities, including planning, implementation, monitoring and evaluation, reporting, budgeting, mentoring and supervision. The strategy of implementation of gender safeguard is through Gender Focal Point or Pengarusutamaan Gender (“PUG”).
2009 Disaggregated data The Minister Women Empowerment and Child Protection Regulation No. 6 of 2009 concerning Disaggregated Data by Gender and Age that should be collected, analyzed and used as part of the strategy to integrate gender in planning, budgeting, implementation, monitoring and evaluation of policy and development program.
2012 Gender responsive planning and budgeting Four ministers signed a Circular Letter about National Strategy to Accelerate Gender Mainstreaming through Gender Responsive Planning and Budgeting. The four ministers included National Development Planning Agency (“Bappenas”), Ministry of Finance (“MoF”), Ministry of Home Affairs (“MoHA”) and MoWECP. This national strategy encouraged national, sub-national and local governments to implement Gender Responsive Planning and Budgeting (“GRPB”). The GRPB also needs to align with the national development plan to support good governance practice and sustainable development such as MDGs which is now being replaced by SDGs.
2.3.15 Legislations Related to Corporate Social Responsibility
The existence of the Cisokan hydropower project has implications for the surrounding environment. The surrounding environment expects social and environmental responsibility
68
Draft Environmental and Social Impact Assessment (ESIA) 2020
from the project implementer, namely PT PLN (Persero) Central Java Development Main Unit 1. Law No.40 of 2007 concerning Limited Liability Companies in Article 74 regulates the obligation to carry out corporate social and environmental responsibility for a limited liability company whose business activities are managing natural resources and companies whose business activities are related to natural resources. This obligation is the company's commitment to participate in sustainable economic development in order to improve the quality of life and the environment that is beneficial, both for the company itself, the local community, and society in general.
2.4 International Commitments
International provisions relating to Labor and Working Conditions are as follows: 1. ILO fundamental conventions which have been ratified by the Government of Indonesia as
follow: a) Freedom of Association and Protection of the Rights to organise Convention, 1948
(No.87) b) Right to Organize and Collective Bargaining Convention, 1949 (No.98) c) Forced Labour Convention, 1930 (No.29) d) Abolition of Forced Labour Convention, 1957 (No.105) e) Minimum Age Convention, 1973 (No.138) f) Worst Forms of Child Labour Convention, 1999 (No.182) g) Equal Remuneration Convention, 1952 (No.100) h) Discrimination (Employment and Occupation) Convention, 1958 (No.111)
2. The Convention on The Elimination of All Forms of Discrimination Against Women was ratified through Law Number 7 of 1984 concerning Ratification of the Convention on the Elimination of All Forms of Discrimination Against Women
3. Article 7 International Covenant on Economic Social and Cultural Rights, explains that States Parties to this Covenant recognize the right of everyone to enjoy just and favorable working conditions, and in particular guarantee: a) the pay that gives all workers, at the minimum:
(i). fair wages and remuneration that corresponds to work that is equal without discrimination of any kind, especially for women who must be guaranteed working conditions that are not lower than those enjoyed by men with the same wages for the same work;
(ii). a decent life for themselves and their families, in accordance with the provisions of this Covenant;
b) safe and healthy working conditions; c) equal opportunities for everyone to be promoted to a higher level, without being based
on any considerations other than seniority and ability; d) rest, holidays and reasonable restrictions on working hours, and periodic holidays with
pay or other benefits on public holidays.
United Nation Framework Convention on Climate Change which has been ratified through Law Number 6 of 1994 concerning Ratification of the United Nations Framework Convention on Climate Change and the Kyoto Protocol to The United. Nations Frameworks Convention on Climate Change which Indonesia has ratified through Law Number 17 of 2004 concerning Ratification of the Kyoto Protocol to The United Nations Framework Convention on Climate

69
Draft Environmental and Social Impact Assessment (ESIA) 2020
Change (Kyoto Protocol to the United Nations Framework Convention on Climate Change).
In 2015, held in Paris, the 21st Session of The Conference of the Parties to the United Nations Framework Convention on Climate Change/ COP 21 UNFCCC (Session of the 21st Conference of the Parties to the United Nations Framework Convention on Climate Change) was held . This conference successfully adopted the Paris Agreement to the United Nations Framework Convention on Climate Change. This Paris Agreement contains provisions regarding a nationally determined contribution (Nationally Determined Contribution / NDC) which is expected to be implemented in 2020.
Indonesia itself, through the President of the Republic of Indonesia, Joko Widodo, stated that the Paris Agreement must reflect balance, justice and be in accordance with national priorities and capabilities so that it needs to be binding, long-term, ambitious but not hinder the development of developing countries like Indonesia. For this reason, Indonesia is committed to reducing emissions by 29% under any effort or business as usual (BAU) by 2030 and can be increased to 41% with international cooperation.
Based on this statement, Indonesia has drafted a Draft Law on Ratification of the Paris Agreement to The United Nation Framework Convention on Climate Change (Paris Agreement on the United Nations Framework Convention on Climate Change).
International provisions related to Community Health and Safety are as follows: a. Protocol of 2002 to the Occupational Safety and Health Convention, 1981 b. Labor Standards Number 155, Occupational Safety and Health Convention, 1981 ratified
through Presidential Regulation Number 34 of 2014 concerning Ratification of Convention Concerning The Promotional Framework for Occupational Safety and Health/Convention 187, 2006 (Convention Concerning the Framework for the Improvement of Occupational Safety and Health/ Convention 187 , 2006)
c. Article 12 of the International Covenant on Economic Social and Cultural Rights was ratified through Law Number 11 of 2005 concerning Ratification of the International Covenant on Economic Social and Cultural Rights which explains that: 1. The States Parties to the present Covenant recognize the right of everyone to the
enjoyment of the highest attainable standard of physical and mental health 2. The steps which the States Parties to the present Covenant will take to achieve the full
realization of this right shall include those necessary to bring about: (a) provisions for the reduction of the stillbirth and mortality rates of children and the
healthy development of children; (b) improvement of all aspects of environmental and industrial health; (c) prevention, treatment and control of all infectious, endemic and other occupational
diseases; (d) the creation of conditions which will warrant all medical care and attention in the event of a
person's illness; Land acquisition for inundation, access roads, and transmission sites needs to pay attention to international provisions related to Land Acquisition, Restriction on Land Use and Involuntary Resettlement, one of which is Article 11 paragraph 1, the International Covenant on Economic Social and Cultural Rights is ratified by law. Number 11 of 2005 concerning Ratification of the International Covenant on Economic Social and Cultural Rights (International Covenant on

70
Draft Environmental and Social Impact Assessment (ESIA) 2020
Economic, Social and Cultural Rights) which explains that: States Parties to this Covenant recognize the right of everyone to an adequate standard of living for him and his family, including food, clothing and housing, and for the continuous improvement of living conditions. States Parties will take appropriate steps to ensure the realization of this right, recognizing the importance of international cooperation based on voluntary agreements. Indonesia has ratified the International Provisions related to the Convention on Biological Diversity with Law Number 5 of 1994 concerning the Ratification of the United Nations Convention on Biological Diversity and the ratification of the Biosafety Convention with Law Number 21 of 2004 concerning Ratification of the Cartagena Protocol on Biosafety to The Convention on Biological Diversity (Biological Security of the Convention on Biodiversity)
Indonesia is also signatory to the United Nations Declaration on the Rights of Indigenous Peoples (UNDRIP). International Covenant on Economic Social and Cultural Rights was ratified through Law Number 11 of 2005 concerning Ratification of the International Covenant on Economic Social and Cultural Rights (International Covenant on Economic, Social and Cultural Rights)
International provisions related to Cultural Heritage are as follows: Article 15 of the International Covenant on Economic Social and Cultural Rights was ratified through Law Number 11 of 2005 concerning Ratification of the International Covenant on Economic Social and Cultural Rights which explains that: 1. The States Parties to the present Covenant recognize the right of everyone:
a. to participate in cultural life; b. to enjoy the benefits of scientific progress and its application; c. to benefit from the protection of moral and material interests arising from the scientific, literary or artistic works which he has created.
2. The steps which States Parties to the present Covenant shall take to achieve the full realization of this right shall also include the steps necessary to preserve, develop and disseminate science and culture..
3. The States Parties to the present Covenant undertake to respect the freedom absolutely necessary for scientific research and creative activity.
4. The States Parties to the present Covenant recognize the benefits to be derived from the promotion and development of international relations and cooperation in the field of science and culture.
71
Draft Environmental and Social Impact Assessment (ESIA) 2020
CHAPTER 3. WORLD BANK ENVIRONMENTAL SOCIAL FRAMEWORK (ESF)
3.1 ESS-1 Assessment and Management of Enviromental and Social Risks and Impact
Enviromental and Social Standards 1, explains the responsibilities related to the assessment, management, monitoring of environmental and social risks and impacts associated with each project supported by the World Bank through Investment Project Financing (IPF), this is done with the aim of achieving consistent environmental and social results with Environmental and Social Standards (ESS).
3.2 ESS-2 Labor and Working Conditions
Environmental and Social Standards 2, explaining related to standardization in supporting good relations between workers and management, for example related to the running of Occupational Health and Safety (OHS), the absence of discrimination and equal opportunities in project provision, protection or restrictions on elderly workers such as female workers, disabilities, children (working age that must comply with ESS standards), migrant workers, contract workers, a labor greievance mechanism and other issues related to wages and working conditions. The Social and Community Management Plan, the ESMP and the C-ESMP contain the control measures for labor and working condition risks. The project has developed a Labor Management Procedure (LMP) as part of the Social and Community Management Plan which , sets out the Project’s approach to meeting national requirements as well as the World Bank’s Environmental and Social Framework, particularly ESS 2 on Labor and Working Conditions and ESS 4 on Community Health and Safety.
3.3 ESS-3 Resource Efficiency and Pollution Prevention and Management
Environmental and Social Standards 3, describes the requirements for dealing with efficiency in resources as well as prevention and management of pollution throughout the project. This relates to water resource use during operation, construction materials use, construction erosion and sediment control, construction hazardous substances and waste management, construction emissions to air and net greenhouse gas emissions from the project (construction and operation).
3.4 ESS-4 Community Health and Safety
Environmental and Social Standards 4 describes the standardization of health, safety and security for the people affected by the project and the responsibilities of the project owners in order to avoid or minimize the risks or impacts that occur during the project, especially for communities with special or vulnerable conditions. The project has developed several plans to mitigate issues related to community health and safety. This includes the SCMP which includes protection from worker-related risks (GBV, diseases) and GBV Action Plan. COVID-19 protocols are required in accordance with ESS4. PLN has prepared a Construction Supervision and Quality Assurance Plan, and Instrument Plan, a preliminary Oeprational and Maintenance Plan and a Broad
72
Draft Environmental and Social Impact Assessment (ESIA) 2020
Framework for Emergency Preparedness. These will be further developed during project implementation. PLN will prepare a Reservoir Filling Plan prior to inundation. The Contractor is required to prepare and implement a Health, Safety, and Security Management Plan to manage occupational and community health and safety under their responsibility.
3.5 ESS-5 Land Acquisition, Restrictions on Land Use and Involuntary Resettlement
Environmental and Social Standards 5 describes the standards that must be carried out in relation to land acquisition, restrictions on land use and resettlement. If there are appropriate steps in carrying out land acquisition, it can reduce the negative impact on the displaced community or the party receiving the affected community. The LARAP has been implemented since 2011 and implementation completion review has been undertaken to assess the LARAP performance, identify outstanding tasks/ deliverables. A land acquisition and resettlement framework in line with ESS5 and national regulations has been prepared for future land acquisition.
3.6 ESS-6 Biodiversity Conservation and Sustainable Management of Living Natural Resources
Environmental and Social Standards 6 describes the standardization of the protection and preservation of biodiversity and the sustainable management of living natural resources. Protecting and conserving biodiversity and managing living natural resources are fundamental to sustainable development and recognizes the importance of maintaining the ecological functions that are at the core of habitats, including forests, and the biodiversity they support. The Biodiversity Management Plan provides a detailed programme of activities to achieve net gain of biodiversity values, as per the requirements of ESS6.
Environmental and Social Standards 6 also describes the management of primary production and the sustainable harvesting of living natural resources, and recognizes the need to consider the livelihoods of project affected parties, including indigenous people. The Forest Partnership Framework allows for the use of forest resources while protecting the biodiversity values.
3.7 ESS-7: Indigenous Peoples, Historically Underserved, Traditional Local Communities
ESS7 ensures that the development process fosters full respect for the human rights, dignity, aspirations, identity, culture, and natural resource-based livelihoods of Indigenous Peoples, Historically Underserved Traditional Local Communities. ESS7 is also meant to avoid adverse impacts of projects on Indigenous Peoples, Historically Underserved Traditional Local Communities, or when avoidance is not possible, to minimize, mitigate and/or compensate for such impacts. This ESS applies to a distinct social and cultural group identified in accordance with paragraphs 8 and 9 of the ESS.
ESS7 was not triggered for the project. There are no indigenous people living in the project area as defined by the policy, based on the detailed census conducted. Most of the people in the project area are Sudanese, the dominant ethnic group in West Java, and speak the national language. The
73
Draft Environmental and Social Impact Assessment (ESIA) 2020
investigations carried out as part of the Environmental Assessment did not identify cultural, social or political institutions that are separate from those of the dominant society and culture.
3.7 ESS-8 Cultural Heritage
Environmental and Social Standards 8 describes the standardization or steps that must be taken in order to protect cultural heritage that may be affected during the project. The UCPS project has a Cultural Hertiage Management Plan, presented in the ESMP, that identifies tangible and intangible cultural heritage to be protected, protocols for removing cultural heritage items cannot be protected and chance find procedures for sites / artifacts / remains that are found during construction.
3.8 ESS-10 Stakeholder Engagement and Information Disclosure
Environmental and Social Standards 10 explains the recognition of the importance of open and transparent engagement between stakeholders and PLN as project stakeholders. Information disclosure is an essential element of good international practice. Effective stakeholder engagement can enhance the environmental and social sustainability of a project, increase project acceptance, and make a significant contribution to successful project design and implementation.
In the UCPS hydropower plant project, the stakeholders are the central and local governments, affected communities and companies, both project owners and project implementers. The involvement of stakeholders with PLN as the stakeholders of the project has been running openly and transparently for over 10 years. Following this, PLN has followed ESS10 to date and will continue to do so under the Social and Community Management Plan, which has equivalence to the Stakeholder Engagement Plan required by ESS10.
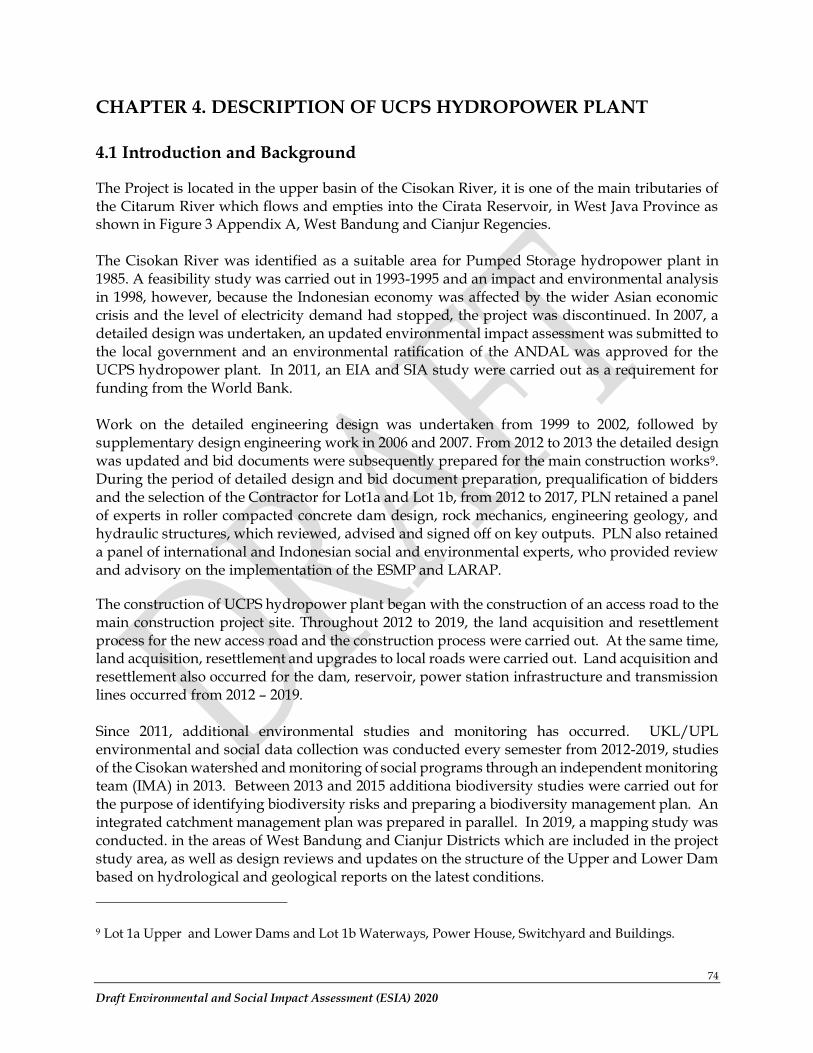
74
Draft Environmental and Social Impact Assessment (ESIA) 2020
CHAPTER 4. DESCRIPTION OF UCPS HYDROPOWER PLANT
4.1 Introduction and Background
The Project is located in the upper basin of the Cisokan River, it is one of the main tributaries of the Citarum River which flows and empties into the Cirata Reservoir, in West Java Province as shown in Figure 3 Appendix A, West Bandung and Cianjur Regencies. The Cisokan River was identified as a suitable area for Pumped Storage hydropower plant in 1985. A feasibility study was carried out in 1993-1995 and an impact and environmental analysis in 1998, however, because the Indonesian economy was affected by the wider Asian economic crisis and the level of electricity demand had stopped, the project was discontinued. In 2007, a detailed design was undertaken, an updated environmental impact assessment was submitted to the local government and an environmental ratification of the ANDAL was approved for the UCPS hydropower plant. In 2011, an EIA and SIA study were carried out as a requirement for funding from the World Bank. Work on the detailed engineering design was undertaken from 1999 to 2002, followed by supplementary design engineering work in 2006 and 2007. From 2012 to 2013 the detailed design was updated and bid documents were subsequently prepared for the main construction works9. During the period of detailed design and bid document preparation, prequalification of bidders and the selection of the Contractor for Lot1a and Lot 1b, from 2012 to 2017, PLN retained a panel of experts in roller compacted concrete dam design, rock mechanics, engineering geology, and hydraulic structures, which reviewed, advised and signed off on key outputs. PLN also retained a panel of international and Indonesian social and environmental experts, who provided review and advisory on the implementation of the ESMP and LARAP.
The construction of UCPS hydropower plant began with the construction of an access road to the main construction project site. Throughout 2012 to 2019, the land acquisition and resettlement process for the new access road and the construction process were carried out. At the same time, land acquisition, resettlement and upgrades to local roads were carried out. Land acquisition and resettlement also occurred for the dam, reservoir, power station infrastructure and transmission lines occurred from 2012 – 2019. Since 2011, additional environmental studies and monitoring has occurred. UKL/UPL environmental and social data collection was conducted every semester from 2012-2019, studies of the Cisokan watershed and monitoring of social programs through an independent monitoring team (IMA) in 2013. Between 2013 and 2015 additiona biodiversity studies were carried out for the purpose of identifying biodiversity risks and preparing a biodiversity management plan. An integrated catchment management plan was prepared in parallel. In 2019, a mapping study was conducted. in the areas of West Bandung and Cianjur Districts which are included in the project study area, as well as design reviews and updates on the structure of the Upper and Lower Dam based on hydrological and geological reports on the latest conditions.
9 Lot 1a Upper and Lower Dams and Lot 1b Waterways, Power House, Switchyard and Buildings.
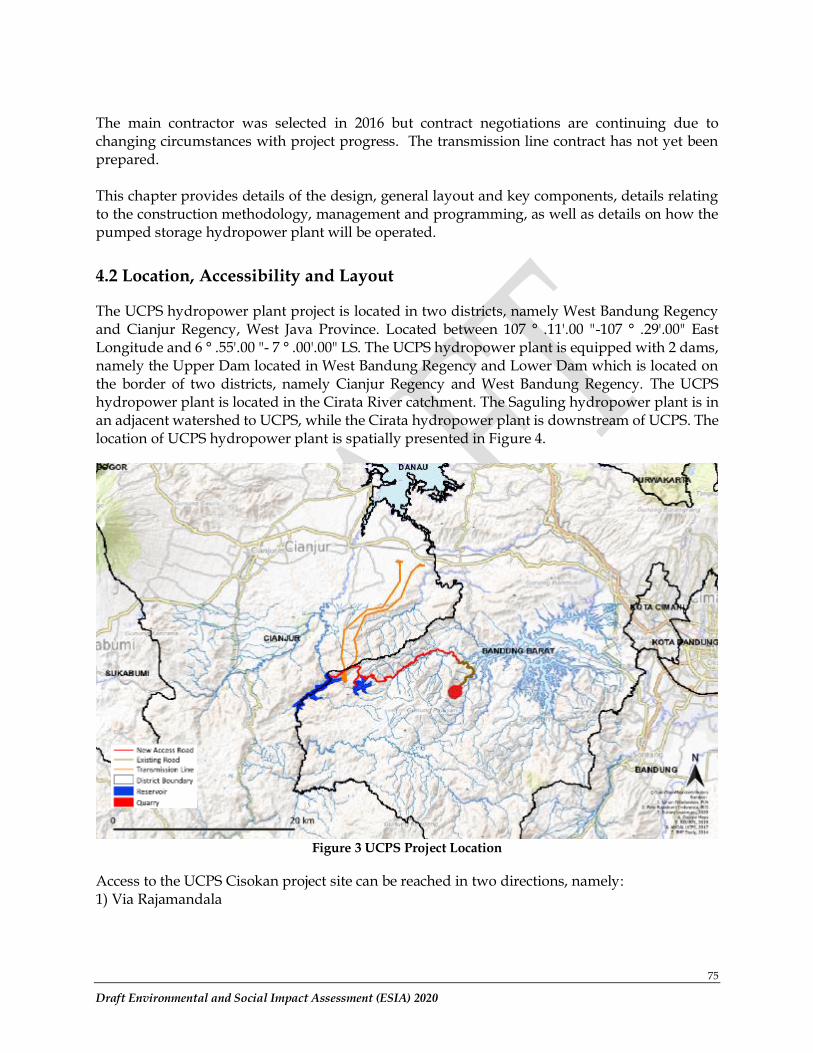
75
Draft Environmental and Social Impact Assessment (ESIA) 2020
The main contractor was selected in 2016 but contract negotiations are continuing due to changing circumstances with project progress. The transmission line contract has not yet been prepared. This chapter provides details of the design, general layout and key components, details relating to the construction methodology, management and programming, as well as details on how the pumped storage hydropower plant will be operated.
4.2 Location, Accessibility and Layout
The UCPS hydropower plant project is located in two districts, namely West Bandung Regency and Cianjur Regency, West Java Province. Located between 107 ° .11'.00 "-107 ° .29'.00" East Longitude and 6 ° .55'.00 "- 7 ° .00'.00" LS. The UCPS hydropower plant is equipped with 2 dams, namely the Upper Dam located in West Bandung Regency and Lower Dam which is located on the border of two districts, namely Cianjur Regency and West Bandung Regency. The UCPS hydropower plant is located in the Cirata River catchment. The Saguling hydropower plant is in an adjacent watershed to UCPS, while the Cirata hydropower plant is downstream of UCPS. The location of UCPS hydropower plant is spatially presented in Figure 4.
Figure 3 UCPS Project Location
Access to the UCPS Cisokan project site can be reached in two directions, namely: 1) Via Rajamandala
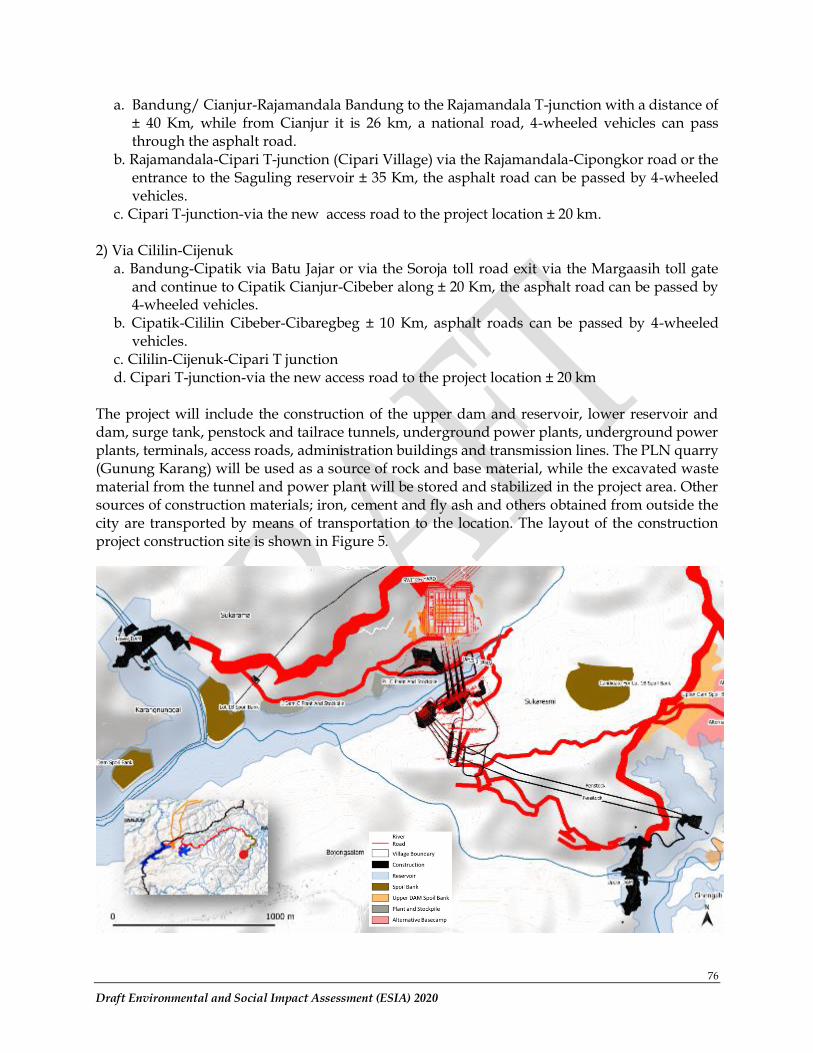
76
Draft Environmental and Social Impact Assessment (ESIA) 2020
a. Bandung/ Cianjur-Rajamandala Bandung to the Rajamandala T-junction with a distance of ± 40 Km, while from Cianjur it is 26 km, a national road, 4-wheeled vehicles can pass through the asphalt road.
b. Rajamandala-Cipari T-junction (Cipari Village) via the Rajamandala-Cipongkor road or the entrance to the Saguling reservoir ± 35 Km, the asphalt road can be passed by 4-wheeled vehicles.
c. Cipari T-junction-via the new access road to the project location ± 20 km. 2) Via Cililin-Cijenuk
a. Bandung-Cipatik via Batu Jajar or via the Soroja toll road exit via the Margaasih toll gate and continue to Cipatik Cianjur-Cibeber along ± 20 Km, the asphalt road can be passed by 4-wheeled vehicles.
b. Cipatik-Cililin Cibeber-Cibaregbeg ± 10 Km, asphalt roads can be passed by 4-wheeled vehicles.
c. Cililin-Cijenuk-Cipari T junction d. Cipari T-junction-via the new access road to the project location ± 20 km
The project will include the construction of the upper dam and reservoir, lower reservoir and dam, surge tank, penstock and tailrace tunnels, underground power plants, underground power plants, terminals, access roads, administration buildings and transmission lines. The PLN quarry (Gunung Karang) will be used as a source of rock and base material, while the excavated waste material from the tunnel and power plant will be stored and stabilized in the project area. Other sources of construction materials; iron, cement and fly ash and others obtained from outside the city are transported by means of transportation to the location. The layout of the construction project construction site is shown in Figure 5.
77
Draft Environmental and Social Impact Assessment (ESIA) 2020
Figure 4 Location of UCPS Hydropower Plant Main Construction
During construction, the project will cover a temporary working area, penstock storage and manufacturing area, concrete processing plant, asphalt processing plant, barracks/basecamp and office buildings. Infrastructure such as electricity, fuel, drinking water and sanitation will be provided.
4.3 Design, Size and Capacity
4.3.1 Main Features of Hydropower Plant
The main feature to be built in the Upper Cisokan Hydro Power Plant project is a 75.5 m high dam built on the Cirumamis River, with a watershed of 10.5 km2 and a reservoir surface area when the maximum water level is 80 ha. The operational fluctuation between the highest and lowest water levels is 19 m. Gravity concrete upper dam body will be constructed from Roller Compacted (RRC) type concrete.
A 98.0 m high lower dam will be built on the Cisokan River, with a watershed of 374.0 km2 and a reservoir surface area if the highest water level is 260 ha. The difference in water level during operation between the highest and lowest water levels is 4.5 m. The gravity of the concrete on the lower dam body will be constructed with the Roller Compacted Concrete (RRC) type.
The power plant with a capacity of 1,040 MW (260 MW x 4 units) and a total pump capacity of 1,100 MW, is placed in an underground power plant. Tunnels will connect the power plant to the reservoir. A substation and administrative office will complement the hydropower plant. The generation duration is 6.5 hours/ day and the pump duration at maximum input is 8.5 hours/day.
Two x 16 km 500 kV transmission lines will connect the UCPS hydropower plant to the Cibinong-Saguling network and to the Tasik-Depok network. Some of the main power plant structures to be built are the head race, surge tank, underground power plant, penstock, tailrace tunnel and switchyard, as well as road access and administrative buildings as important supporting structures for the power plant. An andesite hill on Mount Karang within 30 km owned by PLN will be used as a source of rock, where the chunks of rock will be crushed into gravel and sand as the basic material for making concrete. Meanwhile, waste material excavated from tunnels and power plants will be placed in the disposal area and stabilized in the project area.
During construction, the project will develop a temporary work area, a penstock manufacturing and storage area, a batching plant (concrete processing area), a barracks/ basecamp, and an office building. Infrastructure such as electricity and camp construction, fuel, drinking water and sanitation will be provided.
The main features of the UCPS hydropower plant scheme are listed in Table 3 and the general layout plan of the scheme is shown in Figure 4. The temporary work process during the construction period, including the dumpsite, workers' barracks/basecamp and concrete processing plant location is presented in Figure 5 Appendix. A.
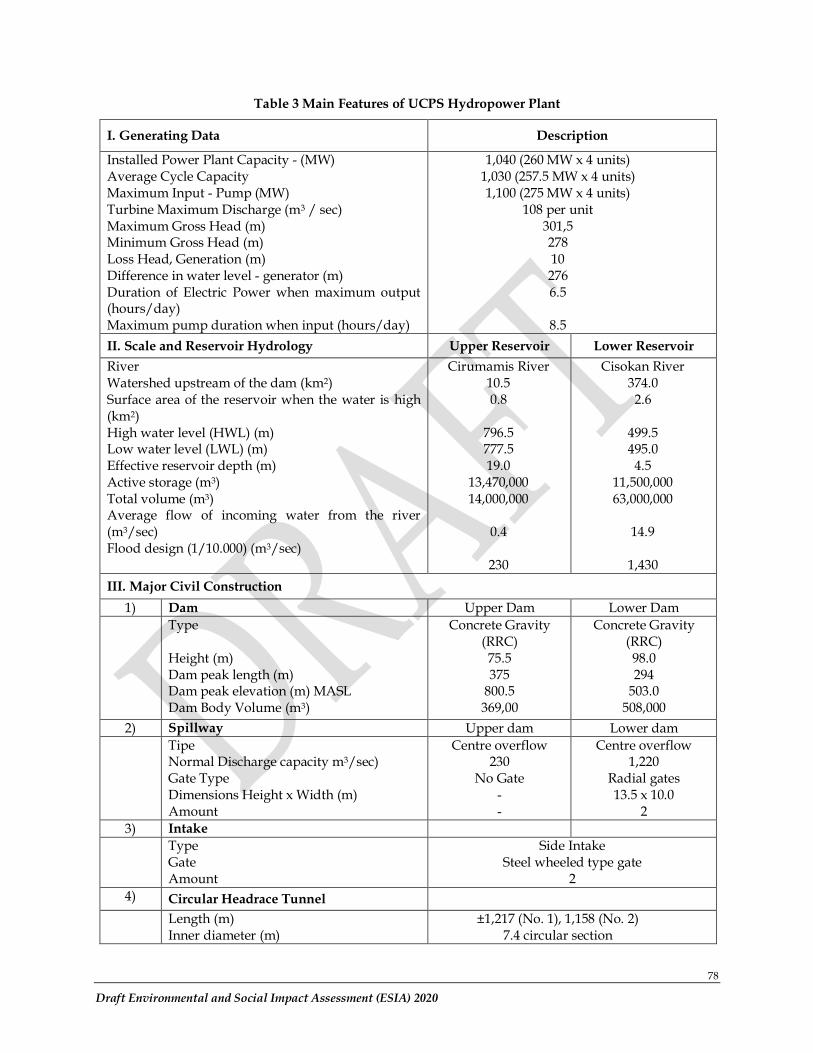
78
Draft Environmental and Social Impact Assessment (ESIA) 2020
Table 3 Main Features of UCPS Hydropower Plant
I. Generating Data Description
Installed Power Plant Capacity - (MW) Average Cycle Capacity Maximum Input - Pump (MW) Turbine Maximum Discharge (m3 / sec) Maximum Gross Head (m) Minimum Gross Head (m) Loss Head, Generation (m) Difference in water level - generator (m) Duration of Electric Power when maximum output (hours/day) Maximum pump duration when input (hours/day)
1,040 (260 MW x 4 units) 1,030 (257.5 MW x 4 units) 1,100 (275 MW x 4 units)
108 per unit 301,5 278 10 276 6.5
8.5
II. Scale and Reservoir Hydrology Upper Reservoir Lower Reservoir
River Watershed upstream of the dam (km2) Surface area of the reservoir when the water is high (km2) High water level (HWL) (m) Low water level (LWL) (m) Effective reservoir depth (m) Active storage (m3) Total volume (m3) Average flow of incoming water from the river (m3/sec) Flood design (1/10.000) (m3/sec)
Cirumamis River 10.5 0.8
796.5 777.5 19.0
13,470,000 14,000,000
0.4
230
Cisokan River 374.0 2.6
499.5 495.0 4.5
11,500,000 63,000,000
14.9
1,430
III. Major Civil Construction
1) Dam Upper Dam Lower Dam Type Height (m) Dam peak length (m) Dam peak elevation (m) MASL Dam Body Volume (m3)
Concrete Gravity (RRC) 75.5 375
800.5 369,00
Concrete Gravity (RRC) 98.0 294
503.0 508,000
2) Spillway Upper dam Lower dam Tipe Normal Discharge capacity m3/sec) Gate Type Dimensions Height x Width (m) Amount
Centre overflow 230
No Gate - -
Centre overflow 1,220
Radial gates 13.5 x 10.0
2
3) Intake Type Gate Amount
Side Intake Steel wheeled type gate
2
4) Circular Headrace Tunnel
Length (m) Inner diameter (m)
±1,217 (No. 1), 1,158 (No. 2) 7.4 circular section
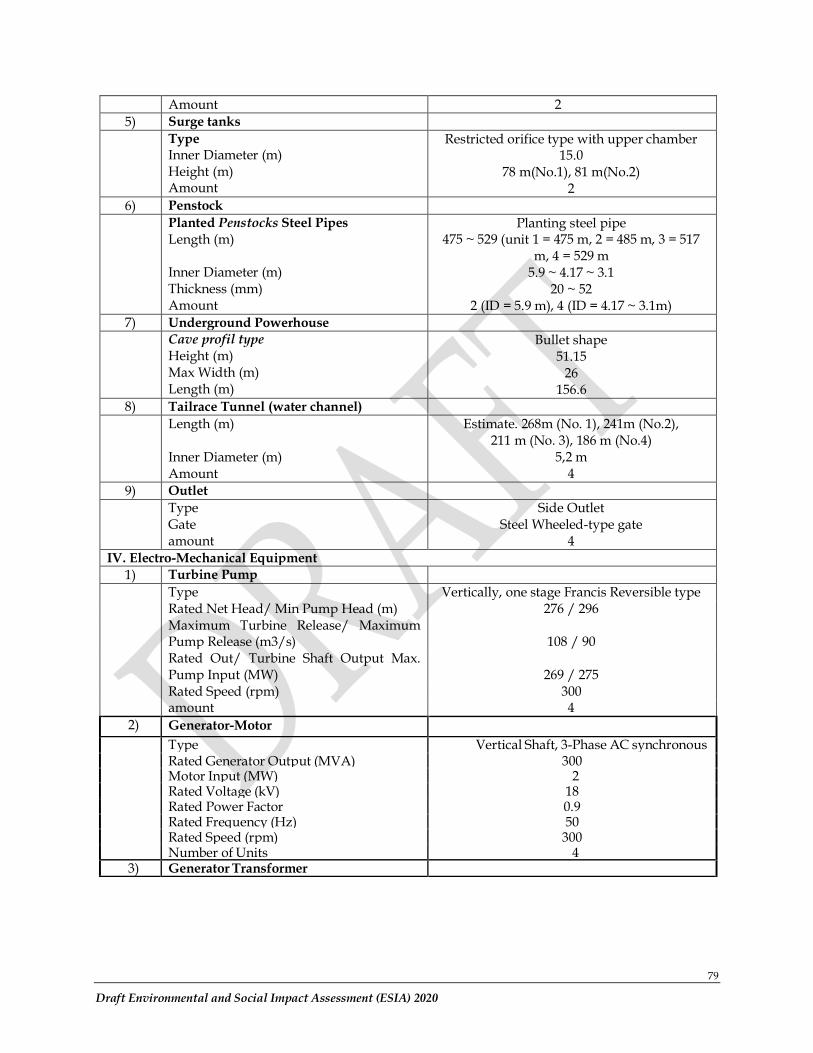
79
Draft Environmental and Social Impact Assessment (ESIA) 2020
Amount 2
5) Surge tanks Type Inner Diameter (m) Height (m) Amount
Restricted orifice type with upper chamber 15.0
78 m(No.1), 81 m(No.2) 2
6) Penstock Planted Penstocks Steel Pipes Length (m) Inner Diameter (m) Thickness (mm) Amount
Planting steel pipe 475 ~ 529 (unit 1 = 475 m, 2 = 485 m, 3 = 517
m, 4 = 529 m 5.9 ~ 4.17 ~ 3.1
20 ~ 52 2 (ID = 5.9 m), 4 (ID = 4.17 ~ 3.1m)
7) Underground Powerhouse Cave profil type Height (m) Max Width (m) Length (m)
Bullet shape 51.15
26 156.6
8) Tailrace Tunnel (water channel) Length (m) Inner Diameter (m) Amount
Estimate. 268m (No. 1), 241m (No.2), 211 m (No. 3), 186 m (No.4)
5,2 m 4
9) Outlet Type Gate amount
Side Outlet Steel Wheeled-type gate
4
IV. Electro-Mechanical Equipment
1) Turbine Pump Type Vertically, one stage Francis Reversible type
Rated Net Head/ Min Pump Head (m) 276 / 296 Maximum Turbine Release/ Maximum
Pump Release (m3/s)
108 / 90 Rated Out/ Turbine Shaft Output Max.
Pump Input (MW)
269 / 275 Rated Speed (rpm) 300 amount 4
2) Generator-Motor
Type Vertical Shaft, 3-Phase AC synchronous Rated Generator Output (MVA) 300 Motor Input (MW) 2
75
Rated Voltage (kV) 18 Rated Power Factor 0.9
lagging
Rated Frequency (Hz) 50 Rated Speed (rpm) 300 Number of Units 4
3) Generator Transformer
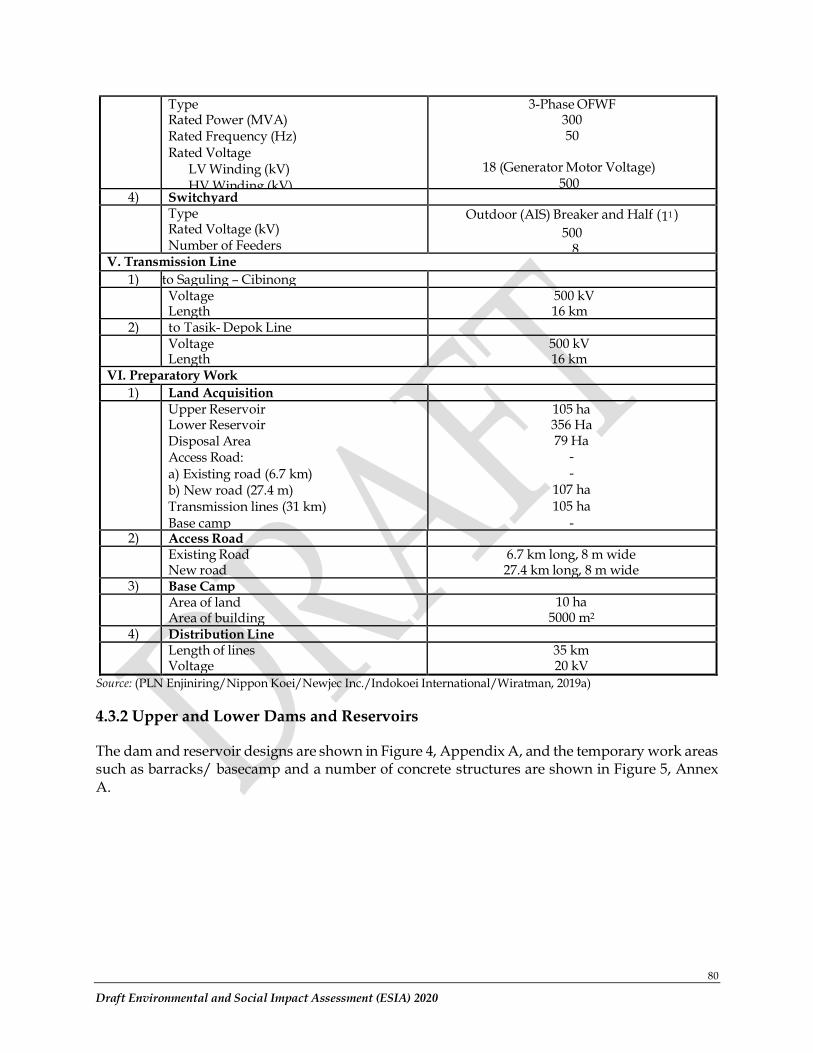
80
Draft Environmental and Social Impact Assessment (ESIA) 2020
Type Rated Power (MVA) Rated Frequency (Hz) Rated Voltage
LV Winding (kV) HV Winding (kV)
3-Phase OFWF 300 50
18 (Generator Motor Voltage)
500 4) Switchyard Type
Rated Voltage (kV) Number of Feeders
Outdoor (AIS) Breaker and Half (11 )
500 8
V. Transmission Line
1) to Saguling – Cibinong Voltage
Length 500 kV 16 km
2) to Tasik- Depok Line Voltage
Length 500 kV 16 km
VI. Preparatory Work
1) Land Acquisition
Upper Reservoir Lower Reservoir Disposal Area Access Road: a) Existing road (6.7 km) b) New road (27.4 m) Transmission lines (31 km) Base camp Resettlement Area
105 ha 356 Ha 79 Ha
- -
107 ha 105 ha
- 40 ha 2) Access Road
Existing Road New road
6.7 km long, 8 m wide 27.4 km long, 8 m wide
3) Base Camp Area of land
Area of building 10 ha
5000 m2
4) Distribution Line Length of lines
Voltage 35 km 20 kV
Source: (PLN Enjiniring/Nippon Koei/Newjec Inc./Indokoei International/Wiratman, 2019a)
4.3.2 Upper and Lower Dams and Reservoirs
The dam and reservoir designs are shown in Figure 4, Appendix A, and the temporary work areas such as barracks/ basecamp and a number of concrete structures are shown in Figure 5, Annex A.
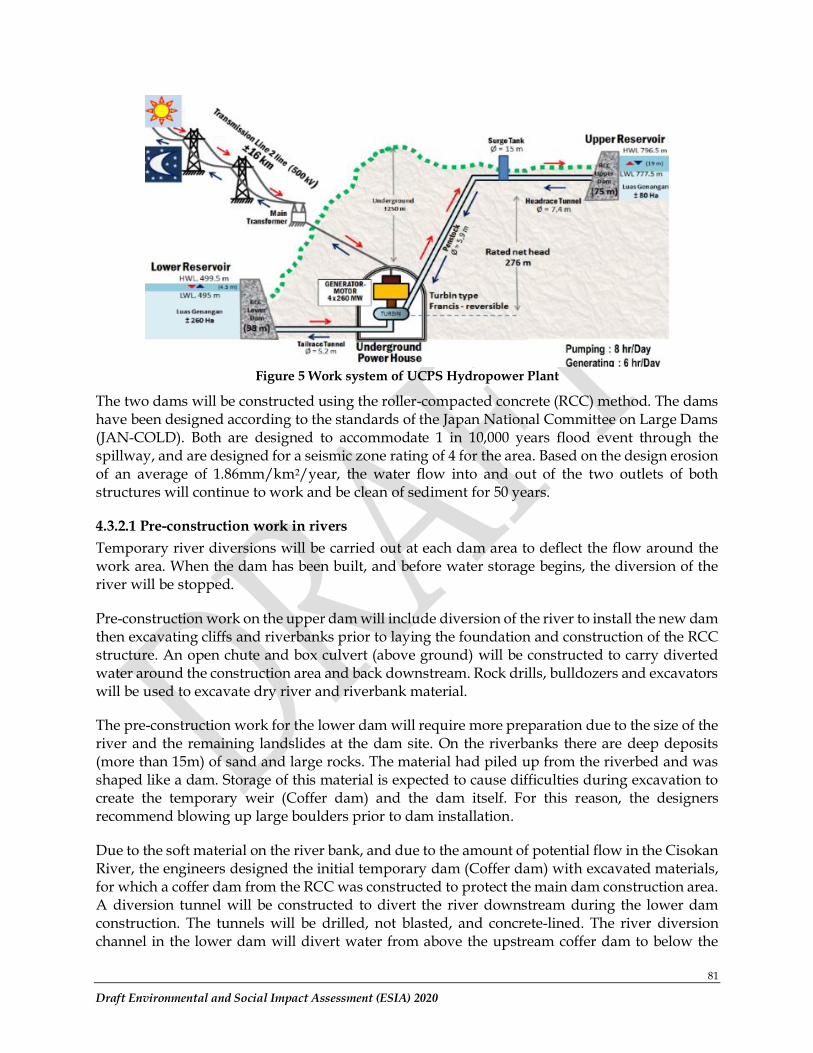
81
Draft Environmental and Social Impact Assessment (ESIA) 2020
Figure 5 Work system of UCPS Hydropower Plant
The two dams will be constructed using the roller-compacted concrete (RCC) method. The dams have been designed according to the standards of the Japan National Committee on Large Dams (JAN-COLD). Both are designed to accommodate 1 in 10,000 years flood event through the spillway, and are designed for a seismic zone rating of 4 for the area. Based on the design erosion of an average of 1.86mm/km2/year, the water flow into and out of the two outlets of both structures will continue to work and be clean of sediment for 50 years.
4.3.2.1 Pre-construction work in rivers
Temporary river diversions will be carried out at each dam area to deflect the flow around the work area. When the dam has been built, and before water storage begins, the diversion of the river will be stopped.
Pre-construction work on the upper dam will include diversion of the river to install the new dam then excavating cliffs and riverbanks prior to laying the foundation and construction of the RCC structure. An open chute and box culvert (above ground) will be constructed to carry diverted water around the construction area and back downstream. Rock drills, bulldozers and excavators will be used to excavate dry river and riverbank material.
The pre-construction work for the lower dam will require more preparation due to the size of the river and the remaining landslides at the dam site. On the riverbanks there are deep deposits (more than 15m) of sand and large rocks. The material had piled up from the riverbed and was shaped like a dam. Storage of this material is expected to cause difficulties during excavation to create the temporary weir (Coffer dam) and the dam itself. For this reason, the designers recommend blowing up large boulders prior to dam installation.
Due to the soft material on the river bank, and due to the amount of potential flow in the Cisokan River, the engineers designed the initial temporary dam (Coffer dam) with excavated materials, for which a coffer dam from the RCC was constructed to protect the main dam construction area. A diversion tunnel will be constructed to divert the river downstream during the lower dam construction. The tunnels will be drilled, not blasted, and concrete-lined. The river diversion channel in the lower dam will divert water from above the upstream coffer dam to below the
82
Draft Environmental and Social Impact Assessment (ESIA) 2020
lower dam construction area (PLN Enjiniring/Nippon Koei/Newjec Inc./Indokoei International/Wiratman, 2019a).
4.3.2.2 Dam construction
Dam construction will be carried out 24 hours a day, 7 days a week during the placement of the RCC. In the RCC process, the concrete must be continuously shed and compacted to minimize cooling at the joints. Transport of the RCC mixture to the dam from the concrete plant will be carried out by large trucks. Placement of RCC concrete can still be done during rain with an intensity of <5 mm/day.
Concrete manufacturing activity with a capacity of 120 m3/day with a storage warehouse that can accommodate a load of 1,600 tons is provided to meet operational needs for 24 hours. The building will have a storage capacity of approximately 300 tons of cement and fly ash on a working day, so that the warehouse has five days of storage time. Meanwhile, the power plant will be powered by a diesel generator.
Concrete production of 60m3/day is planned to meet the usual concrete mix that will be used for other activities, with a cement storage building with a capacity of 500 tons will be required. A concrete mixer truck with a capacity of 6 m3 will carry the mortar to the site. The location for making concrete can be seen in Figure 5, Appendix A.
4.3.2.3 Pre-construction works of reservoir areas and in rivers
Before being flooded, the reservoir area must be stabilized, cleared of vegetation and also cleared of potential sources of pollution.
First of all, cleaning the plants is done by cutting down trees and other plants using a saw machine. Small plants, agricultural products, shrubs, etc. will be cleaned using heavy equipment. The community still has access to this plant; remaining material will be buried and stabilized outside the flooded area.
Sources that cause water pollution (MCK channels, fuel storage, workshops, and fish ponds) will be repaired and graves will be relocated.
Cliff stabilization is required in the two upper dam areas prior to inundation. This is described in Section 4.4.3 below.
4.3.2.4 Preparation of the buffer area
Each reservoir has a green buffer or management area along the perimeter, approximately 5 m above the highest water level, that has been acquired by PLN and forms part of the project footprint. This section will be revegetated to achieve three objectives: the establishment of boundaries for the community to access to the reservoir area, habitat restoration and control of habitat, especially the upper reservoir or the upper weir which has a water level fluctuation of ± 19 meters.
The restored vegetation is native species which can provide habitat for native fauna, and stabilize the soil to prevent erosion. Revegetation activities will start from the construction stage (to allow as long as possible for vegetation establishment) and continue this program until the operational stage. A restoration plan will be implemented as part of the Biodiversity Management Plan (additional plan of the Environmental Management Plan project).
83
Draft Environmental and Social Impact Assessment (ESIA) 2020
UCPS upper and lower water catchment areas are managed through the UCPS integrated biodiversity management plan. The management of the UCPS area considers the physical, vegetative and other components of biodiversity so that the biodiversity conditions in the UCPS area are sustainable.
4.3.3 Tunnels and Power Plants
During the power generation process, water will be channeled from the upper reservoir through the inlet, headrace tunnel and penstock pipe to the turbine in the underground powerhouse. From the power plant, water will be channeled through a tunnel to an outlet in the lower reservoir. These are collectively referred to ‘waterways’ along with surge tank in the tunnel.
The power plant and transformer will be located underground, along with control rooms, offices, warehouses, guard posts and parking lots. Access to the power plant will be via a tunnel road. Two other tunnels are required for ventilation and wiring.
The waterway, underground power station tunnels, holes for the transformer and access tunnels will be excavated using a combination of blasting, drilling and excavation. Work will start from the bottom up. The excavated material will be taken from the portal for disposal by the river bank as shown in Figure 5, Appendix A. To stabilize the rock, injection of cement mortar (grouting), rock bolt will be used. After the stabilization process, shotcrete or concreting will be applied to strengthen the tunnels and holes formed. The penstock pipe will be made of steel.
The concrete plant, with a capacity of 60 m3/day, will be located as shown in Figure 5, (Appendix A) to supply concrete for the waterway and power plant construction.
4.3.4 Terminator Yard, Switchyard and Administration Building Cables
The terminator yard cable is approximately 4,080 m long at the entrance to the tunnel cable. The switchyard length is 71,225 m. The above-ground administration building will consist of the main administration building, switchyard control, dam control, workshop and garage, guard house, prayer room, temporary project post and housing. See Figure 4 (appendix A) for construction sites and buildings.
Vegetation clearance and earthworks is required in order to provide a level area for these facilities. Materials from excavation and from other work parts (such as tunneling and power stations) will likely be used here as fill.
4.3.5 Transmission Network
Two 500 kV transmission lines will connect the Upper Cisokan Power Plant with the Java-Bali Network on the Saguling-Cibinong network in the North (15.5 km and 15.9 km). The total length of the new transmission is 31.4 km, and the 'free space' corridor is 34 m long. The towers and corridors will require an area of approximately 100.38 ha consisting of agricultural and plantation land. The connection locations on the grid have been selected with detailed modeling of the Java-Bali network, to maximize the efficiency of the Upper Cisokan Pump Hydropower
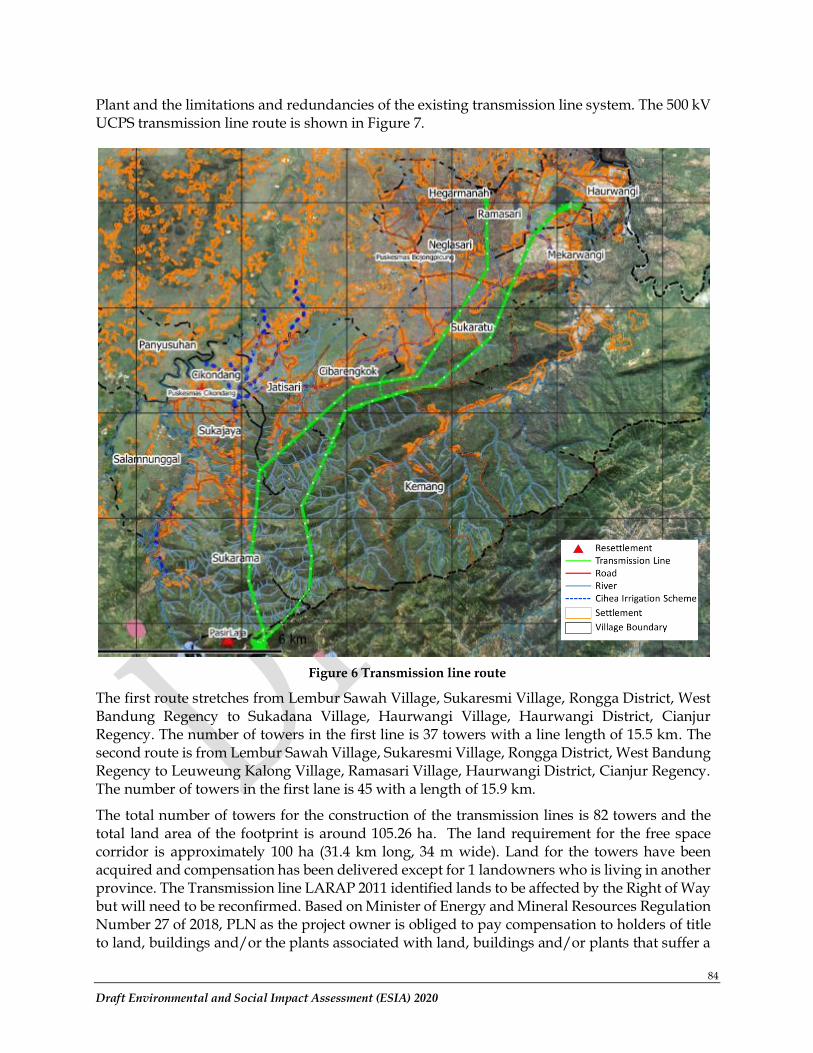
84
Draft Environmental and Social Impact Assessment (ESIA) 2020
Plant and the limitations and redundancies of the existing transmission line system. The 500 kV UCPS transmission line route is shown in Figure 7.
Figure 6 Transmission line route
The first route stretches from Lembur Sawah Village, Sukaresmi Village, Rongga District, West Bandung Regency to Sukadana Village, Haurwangi Village, Haurwangi District, Cianjur Regency. The number of towers in the first line is 37 towers with a line length of 15.5 km. The second route is from Lembur Sawah Village, Sukaresmi Village, Rongga District, West Bandung Regency to Leuweung Kalong Village, Ramasari Village, Haurwangi District, Cianjur Regency. The number of towers in the first lane is 45 with a length of 15.9 km.
The total number of towers for the construction of the transmission lines is 82 towers and the total land area of the footprint is around 105.26 ha. The land requirement for the free space corridor is approximately 100 ha (31.4 km long, 34 m wide). Land for the towers have been acquired and compensation has been delivered except for 1 landowners who is living in another province. The Transmission line LARAP 2011 identified lands to be affected by the Right of Way but will need to be reconfirmed. Based on Minister of Energy and Mineral Resources Regulation Number 27 of 2018, PLN as the project owner is obliged to pay compensation to holders of title to land, buildings and/or the plants associated with land, buildings and/or plants that suffer a
85
Draft Environmental and Social Impact Assessment (ESIA) 2020
reduction of economic value due to being crossed by an electric power transmission network, whether in activities of construction of a new electric power transmission network, activities of replacement or addition of new towers/poles, or expansion of the area/width of the right of way and minimum horizontal and vertical axis safe distance corridors of existing networks. The formula for calculation of the compensation is stipulated in this regulation. Compensation must also be paid for damage to buildings and plants that occurs during the construction of an electric power transmission network. Details of the location and number of towers on the transmission line are presented in the Table 4.
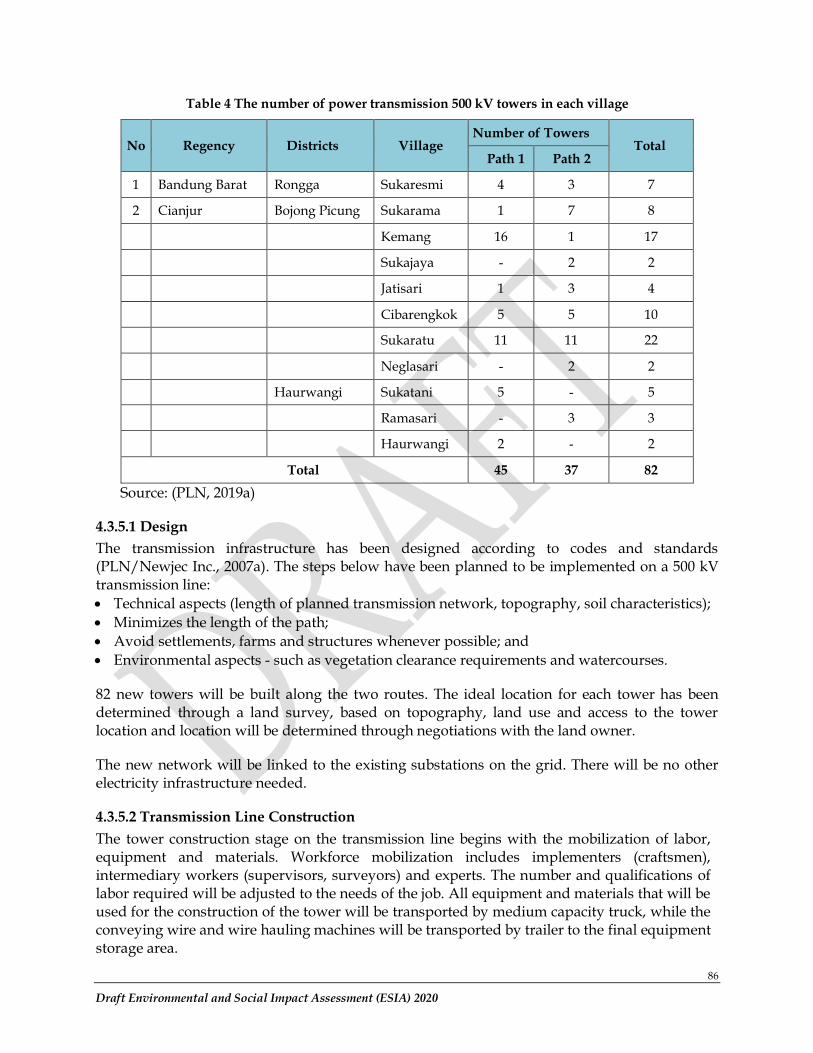
86
Draft Environmental and Social Impact Assessment (ESIA) 2020
Table 4 The number of power transmission 500 kV towers in each village
No Regency Districts Village Number of Towers
Total Path 1 Path 2
1 Bandung Barat Rongga Sukaresmi 4 3 7
2 Cianjur Bojong Picung Sukarama 1 7 8
Kemang 16 1 17
Sukajaya - 2 2
Jatisari 1 3 4
Cibarengkok 5 5 10
Sukaratu 11 11 22
Neglasari - 2 2
Haurwangi Sukatani 5 - 5
Ramasari - 3 3
Haurwangi 2 - 2
Total 45 37 82
Source: (PLN, 2019a)
4.3.5.1 Design
The transmission infrastructure has been designed according to codes and standards (PLN/Newjec Inc., 2007a). The steps below have been planned to be implemented on a 500 kV transmission line:
• Technical aspects (length of planned transmission network, topography, soil characteristics);
• Minimizes the length of the path;
• Avoid settlements, farms and structures whenever possible; and
• Environmental aspects - such as vegetation clearance requirements and watercourses.
82 new towers will be built along the two routes. The ideal location for each tower has been determined through a land survey, based on topography, land use and access to the tower location and location will be determined through negotiations with the land owner.
The new network will be linked to the existing substations on the grid. There will be no other electricity infrastructure needed.
4.3.5.2 Transmission Line Construction
The tower construction stage on the transmission line begins with the mobilization of labor, equipment and materials. Workforce mobilization includes implementers (craftsmen), intermediary workers (supervisors, surveyors) and experts. The number and qualifications of labor required will be adjusted to the needs of the job. All equipment and materials that will be used for the construction of the tower will be transported by medium capacity truck, while the conveying wire and wire hauling machines will be transported by trailer to the final equipment storage area.
87
Draft Environmental and Social Impact Assessment (ESIA) 2020
Construction materials such as sand, cement, coral, concrete and other materials for tower construction will be transported by labor to the tower site. This was done because planning the tower location was relatively difficult. In addition, to avoid too many temporary road accesses. The time needed to mobilize tools and materials in the construction of 1 tower point is 1 day.
The stages of activities in tower enforcement work are as follows:
4.3.5.2.1 Excavation work and material transportation for the foundation
The land area required for the tower footprint varies depending on the type and height of the tower, but in this case a uniformity is taken, namely 25 x 25 m2. The type of foundation used is the beam type (bearing & chimney). Each tower has four (4) legs where each foot is planted on the foundation separately. The excavation dimensions will be adjusted to the dimensions of the tower foot foundation. The dimensions of the foundation are determined by the results of soil investigations and the type of tower used. The average excavation dimension is 2.65 x 2.65 m2 at a depth of ± 2 meters, thus the excavation volume will be around ± 56 m3 per tower. Part of the excavated soil is used for piling up the tower legs and the rest is usually used to fill the area around the tower so that the lower surface of the tower is higher than the surrounding area. For transmission tower foundation in certain locations, if the soil bearing capacity is low, pier foundation will be made by bore drill.
Prior to excavation work, the installation of bowboards for the four tower legs must be carried out using theodolite. This is so that the tower is actually on the right center line, so that the excavation axis must be in the right position, and the depth must be met.
Separately, but in a short time, the transportation of materials such as sand and gravel must be carried out immediately so that after the excavation is complete, further work can be carried out immediately. The excavation and material transportation work each took 1 day for each tower.
4.3.5.2.2 Repair work, scaffolding and stub setup
Iron work is a fabrication for each type of tower foundation, while scaffolding work is a form-work. A stub is a piece of the lower leg of the tower that is planted in the foundation, but left a few centimeters for the purpose of installing the tower.
After all excavation work is completed, and the measurements including the depth are completed, the next step is to make a working floor for each excavation, followed by ironing and installing the formwork for the plinth, and installing the stub, then ironing and installing the scaffolding in the chimney. The excavated land is spread out for landfill work and the rest will be dumped to where it is needed or leveled there. The time required for cleaning, scaffolding and stub adjustment is 2 days for 1 tower point.
4.3.5.2.3 Foundations casting
The foundation is a very important job and determines the quality of the concrete, in this case reinforced concrete, so that the foundation can handle both tensile and compressive loads. This work takes 1 day for each tower point.
Preparatory work such as the availability of equipment: concrete mixers (mobile), vibrators, water pumps, gutters for casting, hoes, shovels and other aids for slump testing, cubes for sample testing and others, are very important. To check stub position, theodolite must be
88
Draft Environmental and Social Impact Assessment (ESIA) 2020
available during casting. All materials must be available in sufficient quantities, because the casting of one part of the work must be carried out continuously until the completion of that part of the work. When this preparatory work is finished casting, the first thing to do is casting the bearings. When casting the pad, the stub position must be maintained according to the tower type, both the level, diagonal slope and the ½ diagonal distance of the flashlight tower are controlled using theodolite and lot for the slope.
Casting is carried out continuously until the casting of the chimney is complete and the foundation of the four legs of the tower is complete. The slump test is carried out every 1 time mixing and 3 samples of test cubes are taken on the pad and chimney for each leg.
4.3.5.2.4 Hoarding work
After the concrete is aged for about 3 days (concrete mixture with additives), the scaffold, template/ span coupler can be opened. Then a final check is carried out on the slope, side to side distance, diagonal distance, stub height, and the physical condition of the casting. If all of them have met the specified size, heaping of the tower legs can be done and at the same time grounding can be installed. The time required for backfilling work for each tower point is 1 day.
4.3.5.2.5 Tower Installation Work
Before this work is carried out, the tower foundation must be at least 1 week old (concrete mixture with additives) and the landfill work must be completed. Transport of tower materials must also be completed, including the nuts and bolts.
Mobilization of personnel and equipment such as chain blocks, pulleys, gscafolding, straps, hand/ machine winch pullers, saws, files, galvanized paint and others must have been partially implemented. Tower materials placed in tower locations must be protected from direct/ indirect contact with the ground, avoiding possible galvanic damage and other preventive work. The tower material used is high strength, hot dipped angle steel.
Tower installation is carried out in stages, namely segment by segment and foot by foot. First is the leg (leg), then the body/ extension of the body, the standard body part, the body part for the cross arm (lower, middle, upper and ground cables). The tower was built for 20 days for each point of the tower.
After the tower is standing, check the tightness of the bolts, the number of drads that come out of the nut, the position of the bracing, the completeness of the bolts that are installed, the alignment of the tower and so on, then before the installation of the work is completed, the measurement of the resistance of the tower legs is measured. resistance) must have worked.
Grounding in the form of galvanized wire is planted around the tower with a distance of ± 1 m from the chimney and 2 feet high diagonally connected to the hole in the stub. If this ground resistance exceeds 10 Ohm, then an additional second grounding ring must be installed until the result is ≤ 10 Ohm.
4.3.5.2.6 Stringing
After the tower has been installed, then the insulator is attached. After all towers have been installed with insulators, then the nylon rope is drawn through the ground that functions to pull the conductor pulling cable. Furthermore, the pulling cable will be used to pull the the conductor with the help of cable pulling machines. Pulling the conductor (stringing) is the
89
Draft Environmental and Social Impact Assessment (ESIA) 2020
withdrawal/installation of the conductor and grounding cable which includes sagging, clamping, jumper & counter weight installation, vibration damper installation, spacer damper installation and so on. The number of circuits planned is a double circuit with a vertical arrangement and installed on a double circuit tower.
The conductors to be used are Gannet type Aluminum Conductor Steel Reinforced (ACSR), while the ground wire uses GSW (Galvanished Steel Wire) and OPGW (Optical Ground Wire).
The composition of the perspanphase conductors is Quadruple bundle conductor (4 perphase conductors equipped with a spacer damper), while the stringing equipment consists of the engine winch puller, tensioner, roll block, anti twist pilot wire, steel wire / wire rope, yoke, hydraulic cutter, compression. point machine, chain block, hand crane, nylon rope, mobile crane, practical speaking apparatus and so on.
4.3.6 Access roads and temporary roads
A 27km new access road has been built from the Cipari Intersection to the project site, and improvements to the existing 7 km of road from Mount Karang Quarry to Cipari Intersection, as access for heavy vehicles to and from the project area, hauling quarry materials, mobilization of construction materials, and the movement workers and site visitors.
The road from Mount Karang to the upper and lower dam sites is shown in Figure 5. The existing road from Mount Karang to Cipari Intersection in Cipari Village has been widened and repaired along the road, with new asphalt and traffic safety features. The remaining roads, from Cipari Village to the upper and lower dam sites, are entirely new roads.
On the existing road settlements and buildings arelocated a few meters from the existing road. Along the track there are three schools and a separate volleyball court that belongs to one of the schools. The road is used by pedestrians, bikers, motorists and small trucks.
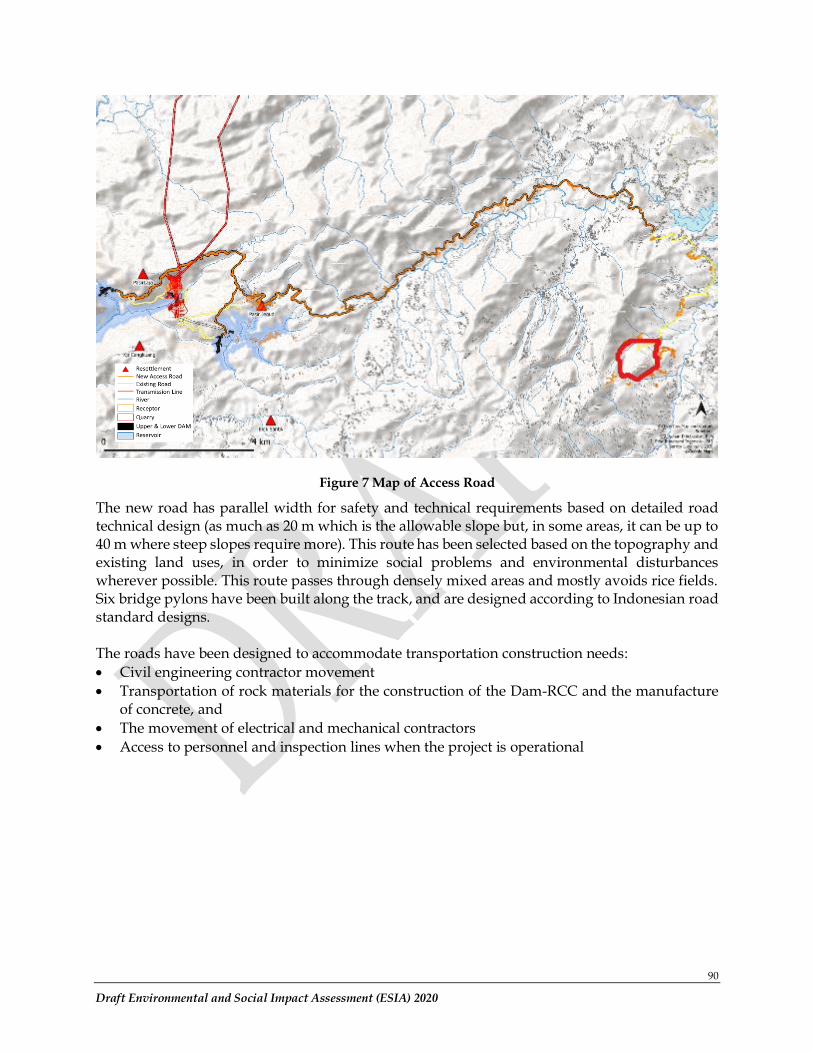
90
Draft Environmental and Social Impact Assessment (ESIA) 2020
Figure 7 Map of Access Road
The new road has parallel width for safety and technical requirements based on detailed road technical design (as much as 20 m which is the allowable slope but, in some areas, it can be up to 40 m where steep slopes require more). This route has been selected based on the topography and existing land uses, in order to minimize social problems and environmental disturbances wherever possible. This route passes through densely mixed areas and mostly avoids rice fields. Six bridge pylons have been built along the track, and are designed according to Indonesian road standard designs. The roads have been designed to accommodate transportation construction needs:
• Civil engineering contractor movement
• Transportation of rock materials for the construction of the Dam-RCC and the manufacture of concrete, and
• The movement of electrical and mechanical contractors
• Access to personnel and inspection lines when the project is operational
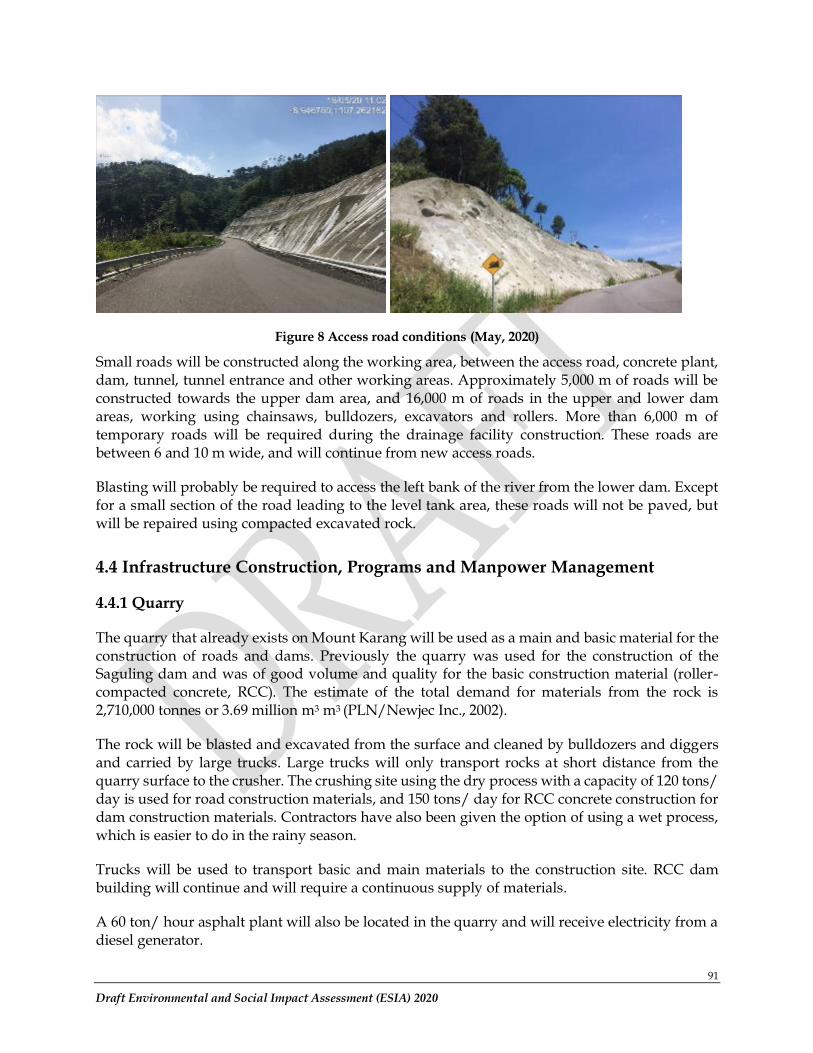
91
Draft Environmental and Social Impact Assessment (ESIA) 2020
Figure 8 Access road conditions (May, 2020)
Small roads will be constructed along the working area, between the access road, concrete plant, dam, tunnel, tunnel entrance and other working areas. Approximately 5,000 m of roads will be constructed towards the upper dam area, and 16,000 m of roads in the upper and lower dam areas, working using chainsaws, bulldozers, excavators and rollers. More than 6,000 m of temporary roads will be required during the drainage facility construction. These roads are between 6 and 10 m wide, and will continue from new access roads.
Blasting will probably be required to access the left bank of the river from the lower dam. Except for a small section of the road leading to the level tank area, these roads will not be paved, but will be repaired using compacted excavated rock.
4.4 Infrastructure Construction, Programs and Manpower Management
4.4.1 Quarry
The quarry that already exists on Mount Karang will be used as a main and basic material for the construction of roads and dams. Previously the quarry was used for the construction of the Saguling dam and was of good volume and quality for the basic construction material (roller-compacted concrete, RCC). The estimate of the total demand for materials from the rock is 2,710,000 tonnes or 3.69 million m3 m3 (PLN/Newjec Inc., 2002).
The rock will be blasted and excavated from the surface and cleaned by bulldozers and diggers and carried by large trucks. Large trucks will only transport rocks at short distance from the quarry surface to the crusher. The crushing site using the dry process with a capacity of 120 tons/ day is used for road construction materials, and 150 tons/ day for RCC concrete construction for dam construction materials. Contractors have also been given the option of using a wet process, which is easier to do in the rainy season.
Trucks will be used to transport basic and main materials to the construction site. RCC dam building will continue and will require a continuous supply of materials.
A 60 ton/ hour asphalt plant will also be located in the quarry and will receive electricity from a diesel generator.
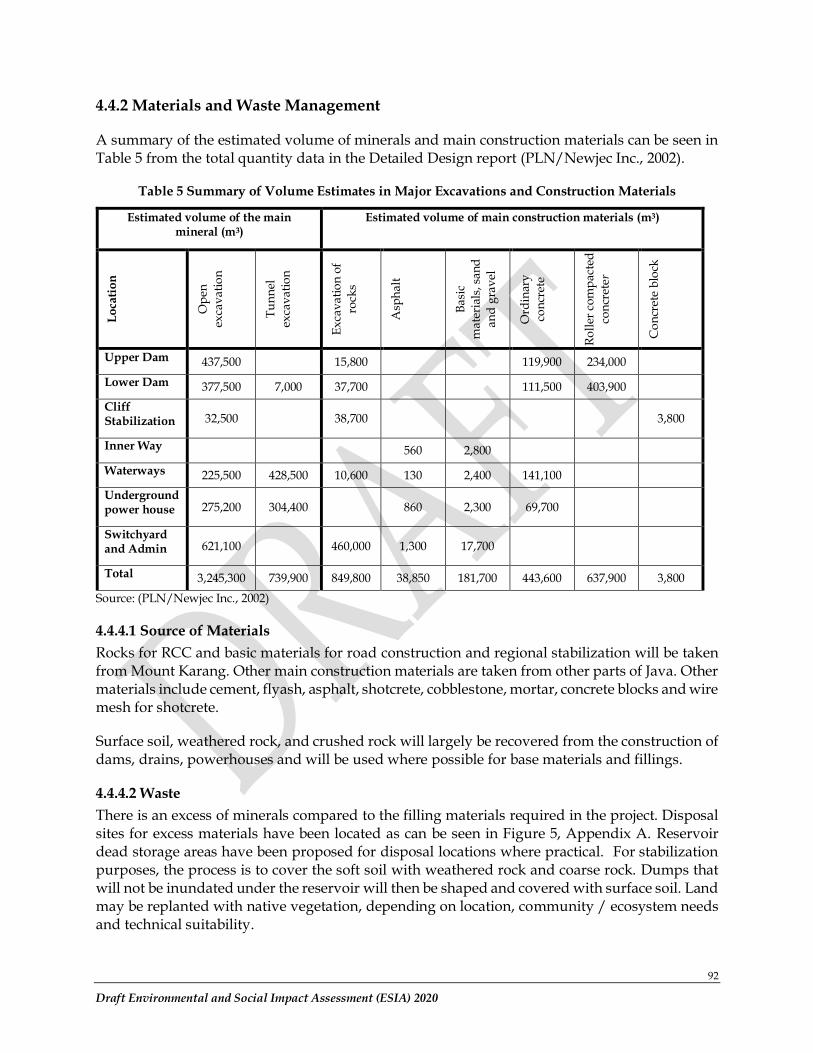
92
Draft Environmental and Social Impact Assessment (ESIA) 2020
4.4.2 Materials and Waste Management
A summary of the estimated volume of minerals and main construction materials can be seen in Table 5 from the total quantity data in the Detailed Design report (PLN/Newjec Inc., 2002).
Table 5 Summary of Volume Estimates in Major Excavations and Construction Materials
Estimated volume of the main mineral (m3)
Estimated volume of main construction materials (m3)
Lo
cati
on
Op
en
exca
vat
ion
Tu
nn
el
exca
vat
ion
Ex
cav
atio
n o
f
rock
s
Asp
hal
t
Bas
ic
mat
eria
ls, s
and
and
gra
vel
Ord
inar
y
con
cret
e
Ro
ller
co
mp
acte
d
con
cret
er
Co
ncr
ete
blo
ck
Upper Dam 437,500 15,800 119,900 234,000
Lower Dam 377,500 7,000 37,700 111,500 403,900
Cliff Stabilization 32,500 38,700 3,800
Inner Way 560 2,800
Waterways 225,500 428,500 10,600 130 2,400 141,100
Underground power house 275,200 304,400 860 2,300 69,700
Switchyard and Admin 621,100 460,000 1,300 17,700
Total 3,245,300 739,900 849,800 38,850 181,700 443,600 637,900 3,800
Source: (PLN/Newjec Inc., 2002)
4.4.4.1 Source of Materials
Rocks for RCC and basic materials for road construction and regional stabilization will be taken from Mount Karang. Other main construction materials are taken from other parts of Java. Other materials include cement, flyash, asphalt, shotcrete, cobblestone, mortar, concrete blocks and wire mesh for shotcrete.
Surface soil, weathered rock, and crushed rock will largely be recovered from the construction of dams, drains, powerhouses and will be used where possible for base materials and fillings.
4.4.4.2 Waste
There is an excess of minerals compared to the filling materials required in the project. Disposal sites for excess materials have been located as can be seen in Figure 5, Appendix A. Reservoir dead storage areas have been proposed for disposal locations where practical. For stabilization purposes, the process is to cover the soft soil with weathered rock and coarse rock. Dumps that will not be inundated under the reservoir will then be shaped and covered with surface soil. Land may be replanted with native vegetation, depending on location, community / ecosystem needs and technical suitability.
93
Draft Environmental and Social Impact Assessment (ESIA) 2020
4.4.3 Slope stabilization
Cliff stabilization is required in the two upper dam areas before inundation. The locations are A and C, as shown in Figure 7, Appendix A. The standard method is to cover the bottom of the landslide area with gabion and concrete. The gabions will be filled with tunnel-excavated materials. Protection devices will usually be located in the lower and upper water boundary zones. This is useful for protecting areas that will landslides from drastic changes in water level. Slope stabilization is carried out on slopes that have a large potential for landslides in the upper weir.
4.4.4 Worker's barracks/ basecamp, offices and additional work locations
The location of workers' barracks/ basecamp, offices, and additional work areas can be seen in Figure 5, Appendix A.
4.4.4.1 PLN Project Office
The PLN project office has been built in Ciangkrong Hamlet, Sarinagen Village, Cipongkor District, West Bandung Regency. The building will include offices, accommodation, a clinic, a dormitory hall, a mosque and entertainment facilities.
4.4.4.2 Main Contractor's barracks/ basecamp
The barracks used in the new road access construction project were reused as the contractor's base barracks. The area is 150 m x 200 m and includes offices, special staff areas, storage warehouses, dormitory halls, explosives warehouses and services for workers.
4.4.4.3 Upper Dam
Upper Dam Barak/ basecamp B will be constructed close to the upper dam area. Its main facilities are offices, service vehicle workshops, laboratories, construction workshops, workers canteens, explosives warehouses, storage sheds, special technicians' areas and a dormitory hall. The barracks/ basecamp will have a diesel generator to provide electricity.
4.4.4.4 Lower Dam
At the lower dam there will be two workers' barracks/ basecamp, barracks/ basecamp A (Lot 1) and Barak/ basecamp A (Lot 2), a barracks/ basecamp for the contractor’s office and workshop (Barracks/ basecamp B Bendungan Bawah), and a barracks/ basecamp for workers and technicians (Barracks/ basecamp C Dam Bawah). The facilities are the same as those in the Upper Dam.
4.4.5 Water, Sanitation and Solid Waste
Drinkable water will be channeled to basecamp and office areas. Water from the side river will be pumped into storage tanks, then treated and channeled to various buildings. Water from the river will also be taken for the manufacture of concrete at the plant.
At the site, a solid waste processor will be built. The waste will be disposed of to the local waste disposal site. A disposal system will be built in each barracks/ basecamp, to treat wastewater before it is discharged into the septic tank.
94
Draft Environmental and Social Impact Assessment (ESIA) 2020
4.4.6 Electricity Supply
Electricity will be supplied to the main construction areas, quarry and barracks/ basecamp via the 20 kV power grid from the Cianjur or Saguling power stations, and in the main locations will be supported by standby diesel generators. This power pole will be constructed as part of the project, and the 30 km line can be seen in Figure 8, Appendix A. The path will follow roads where possible but some trees may need to be cleared to erect the poles. The concrete poles are 9-15 m high, and the maximum distance between poles will be 60 m. Masts may also be installed on site and used for communication cables and lighting.
The crushing and asphalt installation in the mining area will be operated by diesel generators. Other standby generators will be provided around the construction area. For underground power generation facilities, eight sets of 500 kVA diesel generators will be used during the construction and project period. The electricity at the basecamp will be generated from the existing generator or PLN network.
4.4.7 Mobilization and traffic
Heavy equipment will be transported through the Tanjung Priok port in Jakarta. Engineers have marked the selected path for the transportation of heavy equipment, mechanical equipment, materials and other heavy equipment with contractors from Tanjung Priok to the project area which will reduce the number of winding or steep roads and gain smooth road access (PLN/Newjec Inc., 2002). This route was used for the Saguling and Cirata hydropower projects during the construction period with a total distance of approximately 250 km.
All transportation, including materials from Quarry will use the transfer road from the Cipari Interchange. The most frequent flow of vehicles originates from the quarry to the dam site, during the construction of the RCC dam; estimated at 16 transport flows per hour for 12 hours a day.
4.4.8 Construction time
The estimated construction completion time will be carried out for 3.5 years for the main works. The construction process has begun with a 1.5 year process of building an access road and the land acquisition process.
4.4.9 Labor
The total number of workers required during the construction period is estimated at 2,700 peoples including skilled and non-skilled workers. The policy is to recruit local residents according to their respective fields of expertise. Approximately 60% of workers are estimated to be unskilled laborers. Accommodation, food and basic necessities will be provided at the workers base camp for the workers.
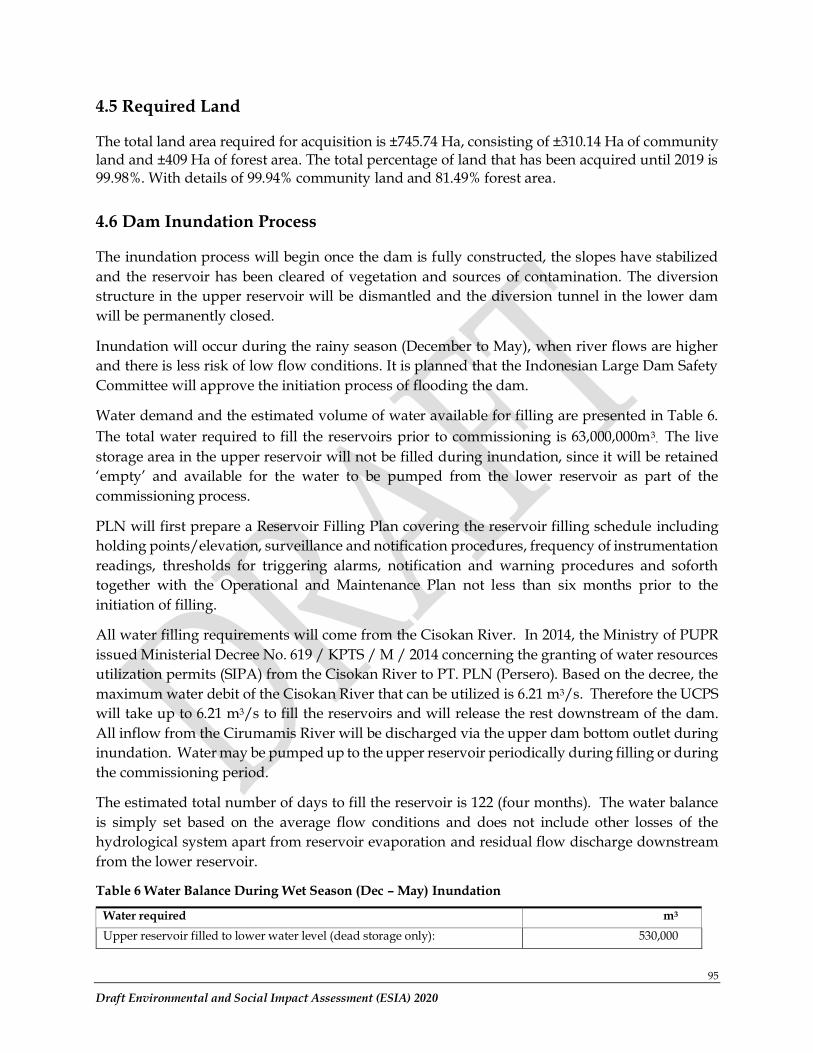
95
Draft Environmental and Social Impact Assessment (ESIA) 2020
4.5 Required Land
The total land area required for acquisition is ±745.74 Ha, consisting of ±310.14 Ha of community land and ±409 Ha of forest area. The total percentage of land that has been acquired until 2019 is 99.98%. With details of 99.94% community land and 81.49% forest area.
4.6 Dam Inundation Process
The inundation process will begin once the dam is fully constructed, the slopes have stabilized
and the reservoir has been cleared of vegetation and sources of contamination. The diversion
structure in the upper reservoir will be dismantled and the diversion tunnel in the lower dam
will be permanently closed.
Inundation will occur during the rainy season (December to May), when river flows are higher
and there is less risk of low flow conditions. It is planned that the Indonesian Large Dam Safety
Committee will approve the initiation process of flooding the dam.
Water demand and the estimated volume of water available for filling are presented in Table 6.
The total water required to fill the reservoirs prior to commissioning is 63,000,000m3. The live
storage area in the upper reservoir will not be filled during inundation, since it will be retained
‘empty’ and available for the water to be pumped from the lower reservoir as part of the
commissioning process.
PLN will first prepare a Reservoir Filling Plan covering the reservoir filling schedule including
holding points/elevation, surveillance and notification procedures, frequency of instrumentation
readings, thresholds for triggering alarms, notification and warning procedures and soforth
together with the Operational and Maintenance Plan not less than six months prior to the
initiation of filling.
All water filling requirements will come from the Cisokan River. In 2014, the Ministry of PUPR
issued Ministerial Decree No. 619 / KPTS / M / 2014 concerning the granting of water resources
utilization permits (SIPA) from the Cisokan River to PT. PLN (Persero). Based on the decree, the
maximum water debit of the Cisokan River that can be utilized is 6.21 m3/s. Therefore the UCPS
will take up to 6.21 m3/s to fill the reservoirs and will release the rest downstream of the dam.
All inflow from the Cirumamis River will be discharged via the upper dam bottom outlet during
inundation. Water may be pumped up to the upper reservoir periodically during filling or during
the commissioning period.
The estimated total number of days to fill the reservoir is 122 (four months). The water balance
is simply set based on the average flow conditions and does not include other losses of the
hydrological system apart from reservoir evaporation and residual flow discharge downstream
from the lower reservoir.
Table 6 Water Balance During Wet Season (Dec – May) Inundation
Water required m3
Upper reservoir filled to lower water level (dead storage only): 530,000
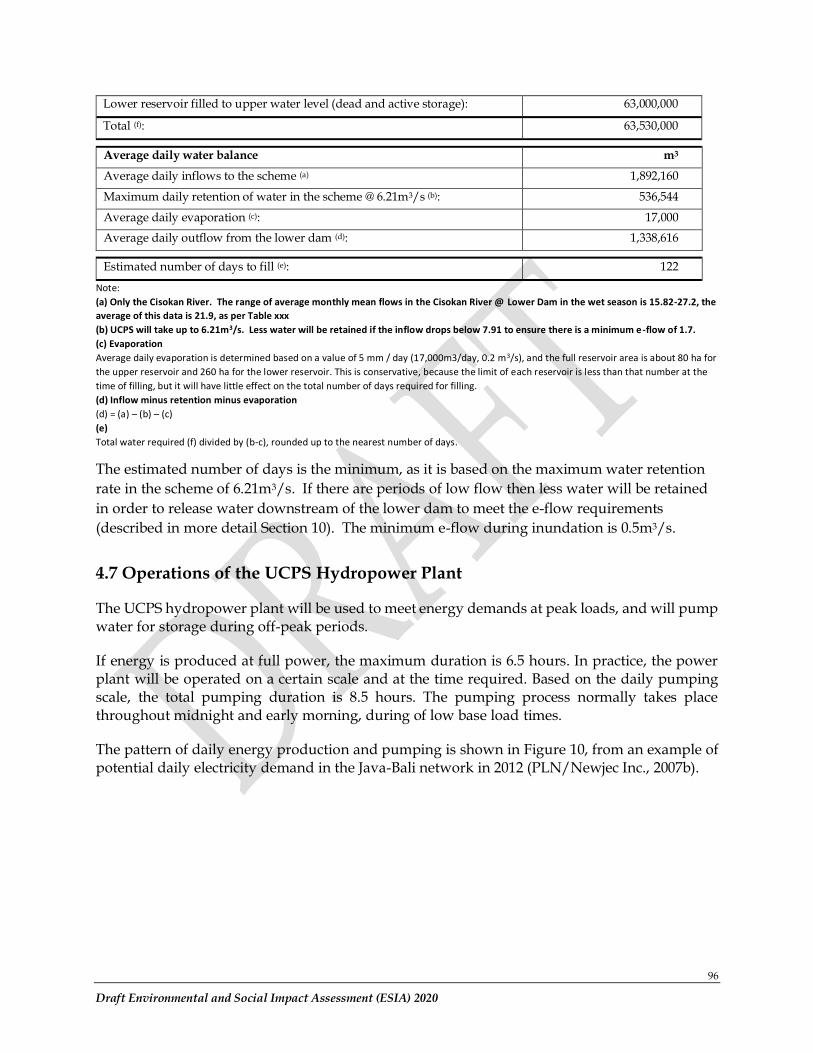
96
Draft Environmental and Social Impact Assessment (ESIA) 2020
Lower reservoir filled to upper water level (dead and active storage): 63,000,000
Total (f): 63,530,000
Average daily water balance m3
Average daily inflows to the scheme (a) 1,892,160
Maximum daily retention of water in the scheme @ 6.21m3/s (b): 536,544
Average daily evaporation (c): 17,000
Average daily outflow from the lower dam (d): 1,338,616
Estimated number of days to fill (e): 122
Note:
(a) Only the Cisokan River. The range of average monthly mean flows in the Cisokan River @ Lower Dam in the wet season is 15.82-27.2, the
average of this data is 21.9, as per Table xxx
(b) UCPS will take up to 6.21m3/s. Less water will be retained if the inflow drops below 7.91 to ensure there is a minimum e-flow of 1.7.
(c) Evaporation
Average daily evaporation is determined based on a value of 5 mm / day (17,000m3/day, 0.2 m3/s), and the full reservoir area is about 80 ha for
the upper reservoir and 260 ha for the lower reservoir. This is conservative, because the limit of each reservoir is less than that number at the
time of filling, but it will have little effect on the total number of days required for filling.
(d) Inflow minus retention minus evaporation
(d) = (a) – (b) – (c)
(e)
Total water required (f) divided by (b-c), rounded up to the nearest number of days.
The estimated number of days is the minimum, as it is based on the maximum water retention
rate in the scheme of 6.21m3/s. If there are periods of low flow then less water will be retained
in order to release water downstream of the lower dam to meet the e-flow requirements
(described in more detail Section 10). The minimum e-flow during inundation is 0.5m3/s.
4.7 Operations of the UCPS Hydropower Plant
The UCPS hydropower plant will be used to meet energy demands at peak loads, and will pump water for storage during off-peak periods.
If energy is produced at full power, the maximum duration is 6.5 hours. In practice, the power plant will be operated on a certain scale and at the time required. Based on the daily pumping scale, the total pumping duration is 8.5 hours. The pumping process normally takes place throughout midnight and early morning, during of low base load times.
The pattern of daily energy production and pumping is shown in Figure 10, from an example of potential daily electricity demand in the Java-Bali network in 2012 (PLN/Newjec Inc., 2007b).
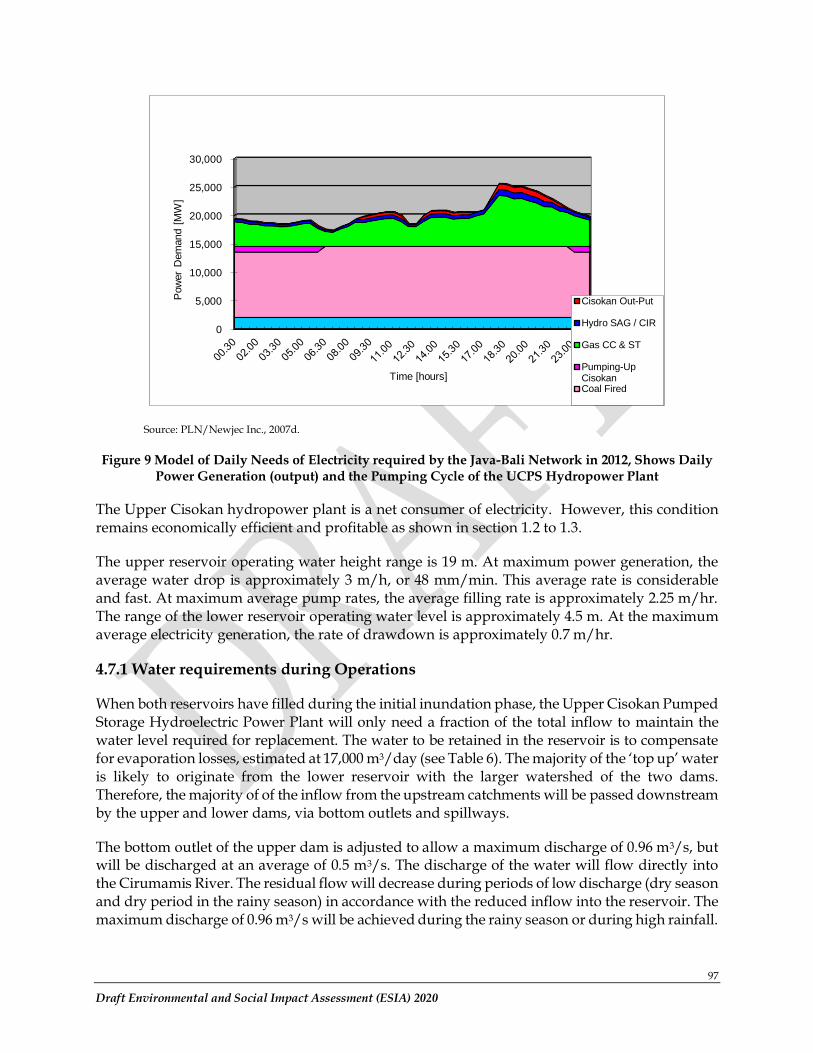
97
Draft Environmental and Social Impact Assessment (ESIA) 2020
Source: PLN/Newjec Inc., 2007d.
Figure 9 Model of Daily Needs of Electricity required by the Java-Bali Network in 2012, Shows Daily Power Generation (output) and the Pumping Cycle of the UCPS Hydropower Plant
The Upper Cisokan hydropower plant is a net consumer of electricity. However, this condition remains economically efficient and profitable as shown in section 1.2 to 1.3.
The upper reservoir operating water height range is 19 m. At maximum power generation, the average water drop is approximately 3 m/h, or 48 mm/min. This average rate is considerable and fast. At maximum average pump rates, the average filling rate is approximately 2.25 m/hr. The range of the lower reservoir operating water level is approximately 4.5 m. At the maximum average electricity generation, the rate of drawdown is approximately 0.7 m/hr.
4.7.1 Water requirements during Operations
When both reservoirs have filled during the initial inundation phase, the Upper Cisokan Pumped Storage Hydroelectric Power Plant will only need a fraction of the total inflow to maintain the water level required for replacement. The water to be retained in the reservoir is to compensate for evaporation losses, estimated at 17,000 m3/day (see Table 6). The majority of the ‘top up’ water is likely to originate from the lower reservoir with the larger watershed of the two dams. Therefore, the majority of of the inflow from the upstream catchments will be passed downstream by the upper and lower dams, via bottom outlets and spillways.
The bottom outlet of the upper dam is adjusted to allow a maximum discharge of 0.96 m3/s, but will be discharged at an average of 0.5 m3/s. The discharge of the water will flow directly into the Cirumamis River. The residual flow will decrease during periods of low discharge (dry season and dry period in the rainy season) in accordance with the reduced inflow into the reservoir. The maximum discharge of 0.96 m3/s will be achieved during the rainy season or during high rainfall.
0
5,000
10,000
15,000
20,000
25,000
30,000
Pow
er
Dem
and [
MW
]
Time [hours]
Cisokan Out-Put
Hydro SAG / CIR
Gas CC & ST
Pumping-UpCisokanCoal Fired
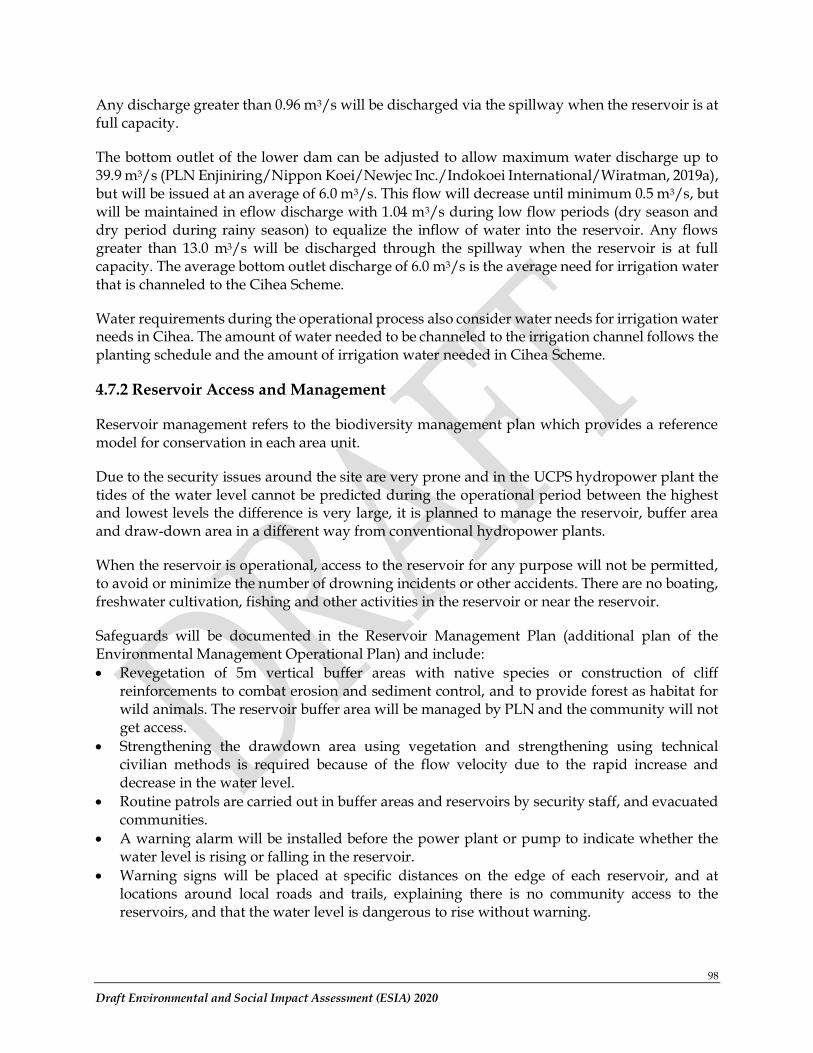
98
Draft Environmental and Social Impact Assessment (ESIA) 2020
Any discharge greater than 0.96 m3/s will be discharged via the spillway when the reservoir is at full capacity.
The bottom outlet of the lower dam can be adjusted to allow maximum water discharge up to 39.9 m3/s (PLN Enjiniring/Nippon Koei/Newjec Inc./Indokoei International/Wiratman, 2019a), but will be issued at an average of 6.0 m3/s. This flow will decrease until minimum 0.5 m3/s, but will be maintained in eflow discharge with 1.04 m3/s during low flow periods (dry season and dry period during rainy season) to equalize the inflow of water into the reservoir. Any flows greater than 13.0 m3/s will be discharged through the spillway when the reservoir is at full capacity. The average bottom outlet discharge of 6.0 m3/s is the average need for irrigation water that is channeled to the Cihea Scheme.
Water requirements during the operational process also consider water needs for irrigation water needs in Cihea. The amount of water needed to be channeled to the irrigation channel follows the planting schedule and the amount of irrigation water needed in Cihea Scheme.
4.7.2 Reservoir Access and Management
Reservoir management refers to the biodiversity management plan which provides a reference model for conservation in each area unit.
Due to the security issues around the site are very prone and in the UCPS hydropower plant the tides of the water level cannot be predicted during the operational period between the highest and lowest levels the difference is very large, it is planned to manage the reservoir, buffer area and draw-down area in a different way from conventional hydropower plants.
When the reservoir is operational, access to the reservoir for any purpose will not be permitted, to avoid or minimize the number of drowning incidents or other accidents. There are no boating, freshwater cultivation, fishing and other activities in the reservoir or near the reservoir.
Safeguards will be documented in the Reservoir Management Plan (additional plan of the Environmental Management Operational Plan) and include:
• Revegetation of 5m vertical buffer areas with native species or construction of cliff reinforcements to combat erosion and sediment control, and to provide forest as habitat for wild animals. The reservoir buffer area will be managed by PLN and the community will not get access.
• Strengthening the drawdown area using vegetation and strengthening using technical civilian methods is required because of the flow velocity due to the rapid increase and decrease in the water level.
• Routine patrols are carried out in buffer areas and reservoirs by security staff, and evacuated communities.
• A warning alarm will be installed before the power plant or pump to indicate whether the water level is rising or falling in the reservoir.
• Warning signs will be placed at specific distances on the edge of each reservoir, and at locations around local roads and trails, explaining there is no community access to the reservoirs, and that the water level is dangerous to rise without warning.
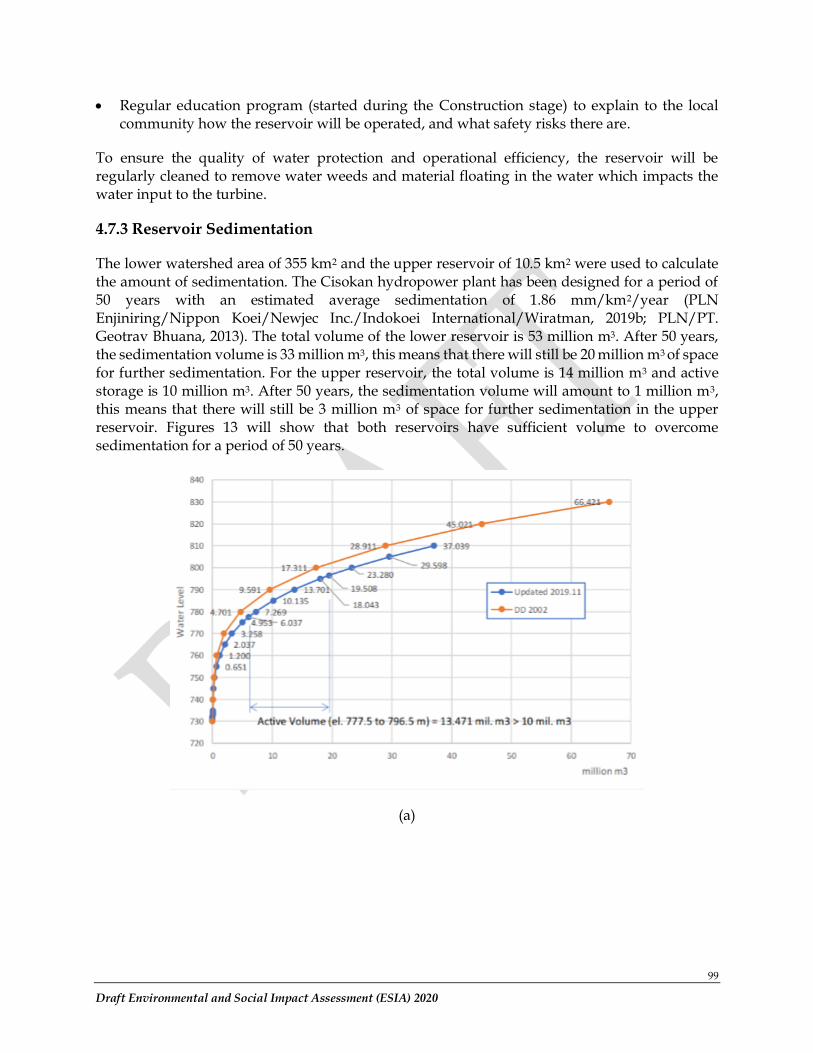
99
Draft Environmental and Social Impact Assessment (ESIA) 2020
• Regular education program (started during the Construction stage) to explain to the local community how the reservoir will be operated, and what safety risks there are.
To ensure the quality of water protection and operational efficiency, the reservoir will be regularly cleaned to remove water weeds and material floating in the water which impacts the water input to the turbine.
4.7.3 Reservoir Sedimentation
The lower watershed area of 355 km2 and the upper reservoir of 10.5 km2 were used to calculate the amount of sedimentation. The Cisokan hydropower plant has been designed for a period of 50 years with an estimated average sedimentation of 1.86 mm/km2/year (PLN Enjiniring/Nippon Koei/Newjec Inc./Indokoei International/Wiratman, 2019b; PLN/PT. Geotrav Bhuana, 2013). The total volume of the lower reservoir is 53 million m3. After 50 years, the sedimentation volume is 33 million m3, this means that there will still be 20 million m3 of space for further sedimentation. For the upper reservoir, the total volume is 14 million m3 and active storage is 10 million m3. After 50 years, the sedimentation volume will amount to 1 million m3, this means that there will still be 3 million m3 of space for further sedimentation in the upper reservoir. Figures 13 will show that both reservoirs have sufficient volume to overcome sedimentation for a period of 50 years.
(a)
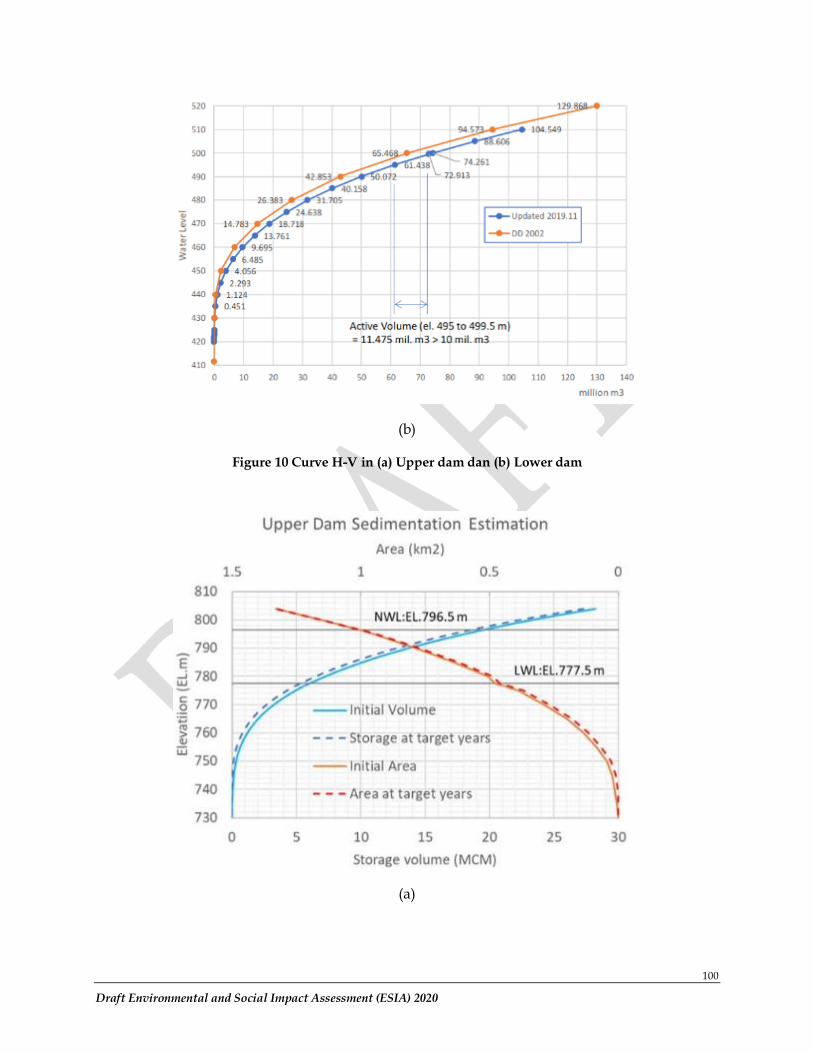
100
Draft Environmental and Social Impact Assessment (ESIA) 2020
(b)
Figure 10 Curve H-V in (a) Upper dam dan (b) Lower dam
(a)
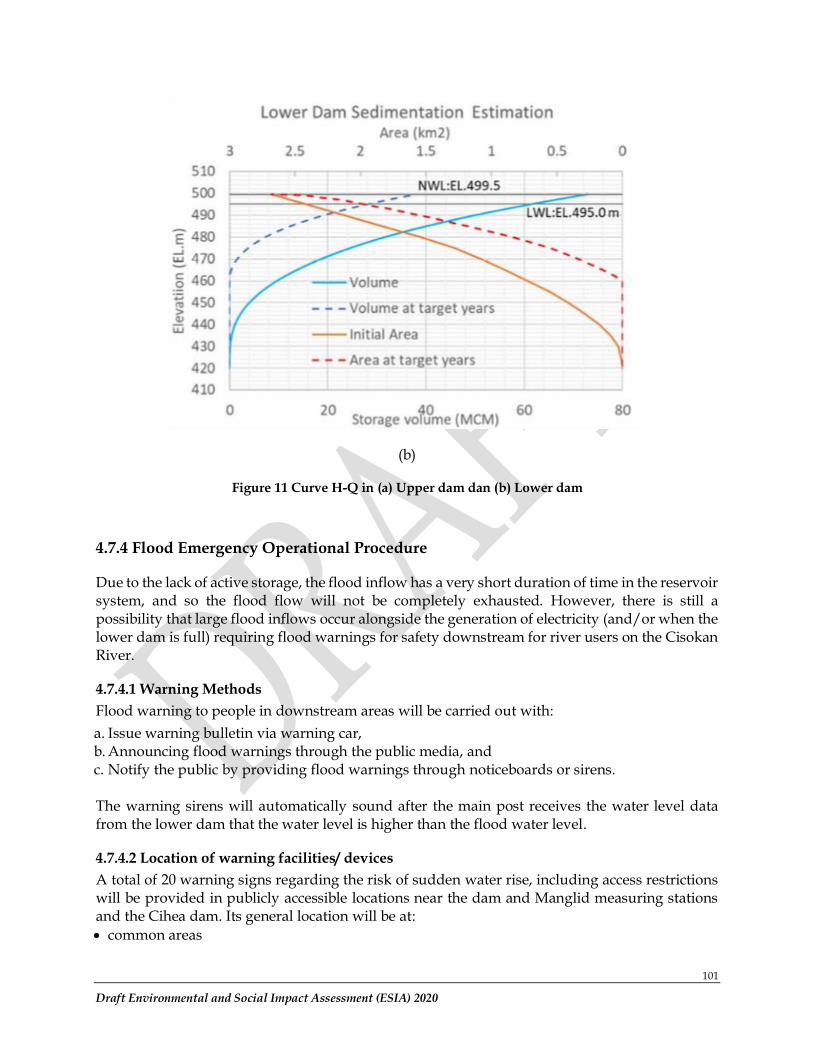
101
Draft Environmental and Social Impact Assessment (ESIA) 2020
(b)
Figure 11 Curve H-Q in (a) Upper dam dan (b) Lower dam
4.7.4 Flood Emergency Operational Procedure
Due to the lack of active storage, the flood inflow has a very short duration of time in the reservoir system, and so the flood flow will not be completely exhausted. However, there is still a possibility that large flood inflows occur alongside the generation of electricity (and/or when the lower dam is full) requiring flood warnings for safety downstream for river users on the Cisokan River.
4.7.4.1 Warning Methods
Flood warning to people in downstream areas will be carried out with:
a. Issue warning bulletin via warning car, b. Announcing flood warnings through the public media, and c. Notify the public by providing flood warnings through noticeboards or sirens.
The warning sirens will automatically sound after the main post receives the water level data from the lower dam that the water level is higher than the flood water level.
4.7.4.2 Location of warning facilities/ devices
A total of 20 warning signs regarding the risk of sudden water rise, including access restrictions will be provided in publicly accessible locations near the dam and Manglid measuring stations and the Cihea dam. Its general location will be at:
• common areas
102
Draft Environmental and Social Impact Assessment (ESIA) 2020
• infrastructure areas (dams, inflow, outflow, etc.)
• other areas, which are passed by the community or are near villages.
Flood control will be carried out automatically and manually, and data will be transferred via a radio network connected to the communication system at the power plant.
4.7.4.3 Community Consultation
Prior to the inundation period, and regularly throughout the lifetime of the project, all downstream river users and the community will receive socialization regarding the flood warning system and on how to save themselves.
4.7.6 Electric Power Transmission Line
Once operational, electricity will be supplied via transmission from the UCPS power station to the 500 kV transmission network. There will be flexibility in terms of transmission of electricity, depending on system requirements. Due to its flexibility in connectivity, Upper Cisokan will become the main power plant in the Java-Bali network.
During pumping, the UCPS hydropower plant will receive electricity from the same transmission system.
Maintenance and inspection will be carried out periodically on the integrity of the tower structure, and the condition of cables and other equipment. In the forested part of the transmission line route, vegetation clearance will be carried out along the 34 m wide transmission line corridor. The soil stability around the tower will also be monitored regularly.
The 20 kV network (used for construction activities) will be created to provide standby electricity supply to power plants, as well as to distribute electricity locally within the UCPS hydropower plant area.
103
Draft Environmental and Social Impact Assessment (ESIA) 2020
CHAPTER 5. ALTERNATIVES ANALYSIS
The Upper Cisokan Pumped Storage (UCPS) hydropower plant has been reviewed several times from an environmental, social, technical and economic perspective. This section will discuss alternatives related to:
• The Java-Bali Electricity Network without the UCPS hydropower plant
• Dam/ reservoir design
• Access road location
• Sources for basic materials for dam construction
• Streamline transmission network
5.1 Electricity Network System in Java-Bali without the UCPS Hydropower Plant
If the Upper Cisokan Pumped Storage (UCPS) hydropower plant does not generate electricity at peak load, the following scenarios have been mentioned in the additional design study (PLN/Newjec Inc., 2007b):
• The petroleum power plant will be used to carry the peak load. Very large costs will be incurred by PLN for power generation at this time.
• At minimum load, the coal power plant will slightly reduce its electric power in response to existing electricity needs. This results in a reduction in output efficiency.
• Cirata hydropower plant will continue to operate as a controlled power plant in accordance with the required load, mostly operated with an efficiency of 65% compared to 100%.
The ability to meet electricity needs during peak loads requires a reliable supply of electricity that responds quickly to fluctuations in electricity demand. This can be met by hydropower plants, because hydropower plants can store energy, hydropower can respond quickly to power fluctuations (unlike coal power plants) and is more economical than oil, diesel or gas. Design Detail Study (PLN/Newjec Inc., 2002) has ruled out conventional hydropower as an alternative due to the difficulty of finding an area large enough for a reservoir in the Java-Bali region, without adding to the adverse social and environmental impacts. The UCPS hydropower plant uses a smaller amount of land and generates more electricity.
5.2 Alternative Dam / Reservoir Configurations
An alternative location for the upper dam was considered in the 1995 feasibility study, which described the location of a smaller reservoir (PLN, Newjec Inc., 1995). The aim is to minimize the number of households and agricultural land that will be submerged. Initially, the upstream dam was constructed at the confluence of the Cipateungteung and Citapos Rivers, and excavated up to 15 million cubic meters of hillside within the dam site. The result is a deeper and steeper reservoir. This alternative was deemed unfeasible because of the very high costs, the risk of steep slopes, and the additional work required to excavate and stabilize large volumes of rock.
An alternative pattern is planned for the lower reservoir to reduce sedimentation. The second dam alternative is in the lower reservoir, and operates a permanent diversion tunnel that can
104
Draft Environmental and Social Impact Assessment (ESIA) 2020
carry sediment loads from the upstream area of the watershed directly to the downstream of the dam. An additional benefit is that the reservoir area is reduced by 50 ha, and the reservoir height is reduced by 9 m. This alternative is more expensive, and therefore not technically recommended.
In 2019, the topographic measurements in the project area were updated according to the latest conditions. Several new design alternative recommendations resulted from the 2019 UCPS design reviews and updates as follows:
5.2.1 Hydraulics Design of Lower Dam Overflow Channels
The design in the previous study did not include the energy dissipator in the lower dam design. Only in 2015, a hydraulic model test was carried out so that a waterfall pond in the lower weir was needed as an energy dissipator.
Energy dissipator is one of the designs required as a dam safety standard, especially for the downstream area of the dam. However, the addition of waterfall pond construction will result in increased costs and land acquisition, therefore as an alternative, the non-gated spillway + stepped spilway chute + stilling basin has been designed as an energy dissipator to replace the waterfall pond (PLN Enjiniring/Nippon Koei/Newjec Inc./Indokoei International/Wiratman, 2019d).
5.2.2 Outlet Channel Capacity
The lower drain design in the previous study, did not meet the safety requirements for an emergency drawdown mechanism. An emergency drawdown mechanism is carried out in case of emergency conditions such as deformation of the weir body, uncontrolled large leakage, reservoir displacement due to landslides, etc.
For this reason, alternative changes have been made to the design of the outlet channel in the drain valve and the elevation of the inlet at the upper and lower dams. (PLN Enjiniring/Nippon Koei/Newjec Inc./Indokoei International/Wiratman, 2019d).
5.2.3 Diversion Channel Design
The design of the diversion channel at the upper dam was carried out by a design update, from previously using shotcrete to concrete lining which affects the flow of water in free flow conditions (PLN Enjiniring/Nippon Koei/Newjec Inc./Indokoei International/Wiratman, 2019d). The diversion channel at the lower dam was also extended in order to pass through the dam coffer downstream of the dam (PLN Enjiniring/Nippon Koei/Newjec Inc./Indokoei International/Wiratman, 2019d).
5.2.4 Open Ground Works, Switchyard, Office Buildings and Outlet Channels
Recent topographical measurements indicate the possibility of significant design changes in some open earthworks especially in switchyard design, office buildings and disposal.
Various switchyard design alternatives are made in accordance with the condition of the completed access road, because it is located under the slope traversed by the access road. Design
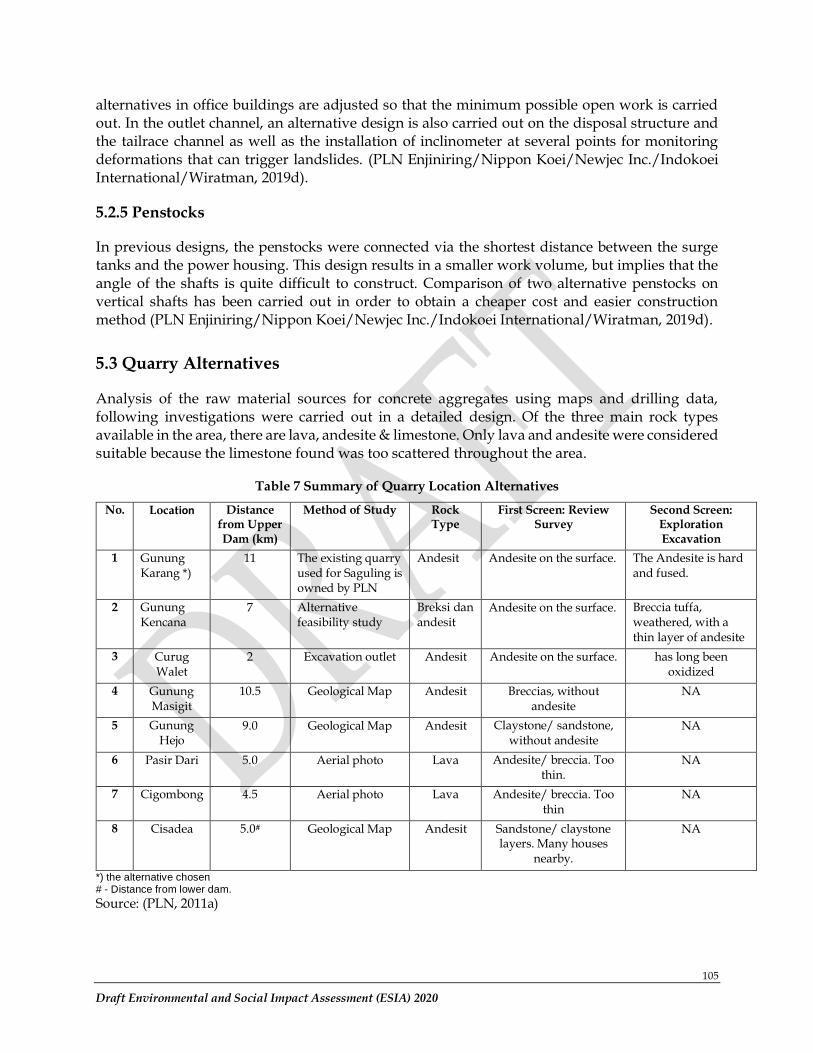
105
Draft Environmental and Social Impact Assessment (ESIA) 2020
alternatives in office buildings are adjusted so that the minimum possible open work is carried out. In the outlet channel, an alternative design is also carried out on the disposal structure and the tailrace channel as well as the installation of inclinometer at several points for monitoring deformations that can trigger landslides. (PLN Enjiniring/Nippon Koei/Newjec Inc./Indokoei International/Wiratman, 2019d).
5.2.5 Penstocks
In previous designs, the penstocks were connected via the shortest distance between the surge tanks and the power housing. This design results in a smaller work volume, but implies that the angle of the shafts is quite difficult to construct. Comparison of two alternative penstocks on vertical shafts has been carried out in order to obtain a cheaper cost and easier construction method (PLN Enjiniring/Nippon Koei/Newjec Inc./Indokoei International/Wiratman, 2019d).
5.3 Quarry Alternatives
Analysis of the raw material sources for concrete aggregates using maps and drilling data, following investigations were carried out in a detailed design. Of the three main rock types available in the area, there are lava, andesite & limestone. Only lava and andesite were considered suitable because the limestone found was too scattered throughout the area.
Table 7 Summary of Quarry Location Alternatives
No. Location Distance from Upper Dam (km)
Method of Study Rock Type
First Screen: Review Survey
Second Screen: Exploration Excavation
1 Gunung Karang *)
11 The existing quarry used for Saguling is owned by PLN
Andesit Andesite on the surface. The Andesite is hard and fused.
2 Gunung Kencana
7 Alternative feasibility study
Breksi dan andesit
Andesite on the surface. Breccia tuffa, weathered, with a thin layer of andesite
3 Curug Walet
2 Excavation outlet Andesit Andesite on the surface. has long been oxidized
4 Gunung Masigit
10.5 Geological Map Andesit Breccias, without andesite
NA
5 Gunung Hejo
9.0 Geological Map Andesit Claystone/ sandstone, without andesite
NA
6 Pasir Dari 5.0 Aerial photo Lava Andesite/ breccia. Too thin.
NA
7 Cigombong 4.5 Aerial photo Lava Andesite/ breccia. Too thin
NA
8 Cisadea 5.0# Geological Map Andesit Sandstone/ claystone layers. Many houses
nearby.
NA
*) the alternative chosen # - Distance from lower dam.
Source: (PLN, 2011a)
106
Draft Environmental and Social Impact Assessment (ESIA) 2020
5.4 Alternative Transmission Network Lines
Four alternative routes have been analyzed in the design study (PLN/Newjec Inc., 2007b). The aim is to find out how the construction of a 10,000 MW coal-fired power plant will change the distribution needs of the Java-Bali power grid. The four options are:
1. Initial design of the Detailed Design Report (PLN/Newjec Inc., 2002) – four single circuits connecting Cisokan to Saguling-Cibinong and Depok-Tasikmalaya.
2. Alternative 1 - Two connection lines to the Cibinong - Saguling electricity network to the North.
3. Alternative 2 - One line connection to the Cibinong - Saguling electricity network to the North. 4. Alternative 3 - Two radial connection lines to the power grid only in Saguling.
Alternative 1 is considered to be the best stable supply relationship on the power grid for the Java-Bali region. This decision is based on a review of the problems and costs required in the number of existing power lines, repair of the substation, maintenance and a review of the reliability of supply and the risk of a complete blackout if the electricity network or substation is removed from the system for maintenance or an emergency.
At the end of 2007, the Additional EIA (PLN/Newjec Inc., 2007a) stated the final configuration, namely two separate power lines to the North connecting the Cibinong-Saguling power grid.
107
Draft Environmental and Social Impact Assessment (ESIA) 2020
CHAPTER 6. ENVIRONMENTAL BASELINE INFORMATION
6.1 Introduction
This chapter provides an overview of initial environmental baseline data "before hydropower construction" and discusses sensitive environmental factors, which may be needed by, or influence, the construction or operation of hydropower plants. There are several main data sources used in the baseline environment data: 1998 ANDAL Report UCPS Cisokan (PT.PLN, 1998). 2001 ANDAL Report UCPS Cisokan Additional (PLN/Newjec Inc., 2001). 2007 ANDAL Report UCPS Cisokan (PLN/Newjec Inc., 2007b).
ANDAL Report Transmission Line UCPS Cisokan (PLN/Newjec Inc., 2007a). 2009 Combined EIA Support Study, Biodiversity Survey (Rahmat, 2009). 2011 Environmental Impact Assessment. 2013 Watershed Management Study Report (Watershed Management) to support
Upstream Cisokan Upper Cisokan Pumped Storage (PT. Geotrav Bhuana Survey). 2014 Biodiversity Management Plan, Universitas Padjadjaran. 2017 Key Species Monitoring, Universitas Padjadjaran. 2019 Hydrology review report Updating Detailed Design and Preparing Construction
Drawing of Upper Cisokan Pumped Storage Power Plant Project (PLN Enjiniring, Nippon Koei Co.Ltd., NEWJEC Inc., PT. Indokoei International, PT. Wiratman).
2009- 2019 PLN's environmental assessment report through a competent external consultant to obtain data series from 2009 to 2019.
6.2 ClimateThe climate classification of the study area is based on rainfall data, according to Koppen classification system, in the Af climate or tropical rain climate, this climate is characterized by high rainfall in the rainy season with a relatively long rainy season. The Schmidth - Ferguson climate classification shows that the study location is in a type A climate, this is the same as the classification according to Koppen (Arifah, 2016).
Environmental climatic characteristics are compiled to describe the environmental climatic conditions of the project using environmental parameters, namely parameters of rainfall, temperature and wind speed. Rainfall data is obtained from 7 rain stations around the study site, namely Cikundul, Cibalagung, Cisokan, Cimeta, Cirata, Jangari, Cipicung stations, while temperature data is obtained from Bandung geophysical station data, this is because temperature data are not recorded at stations around the study location. Rain station locations are shown on the map on the Figure 13 below.
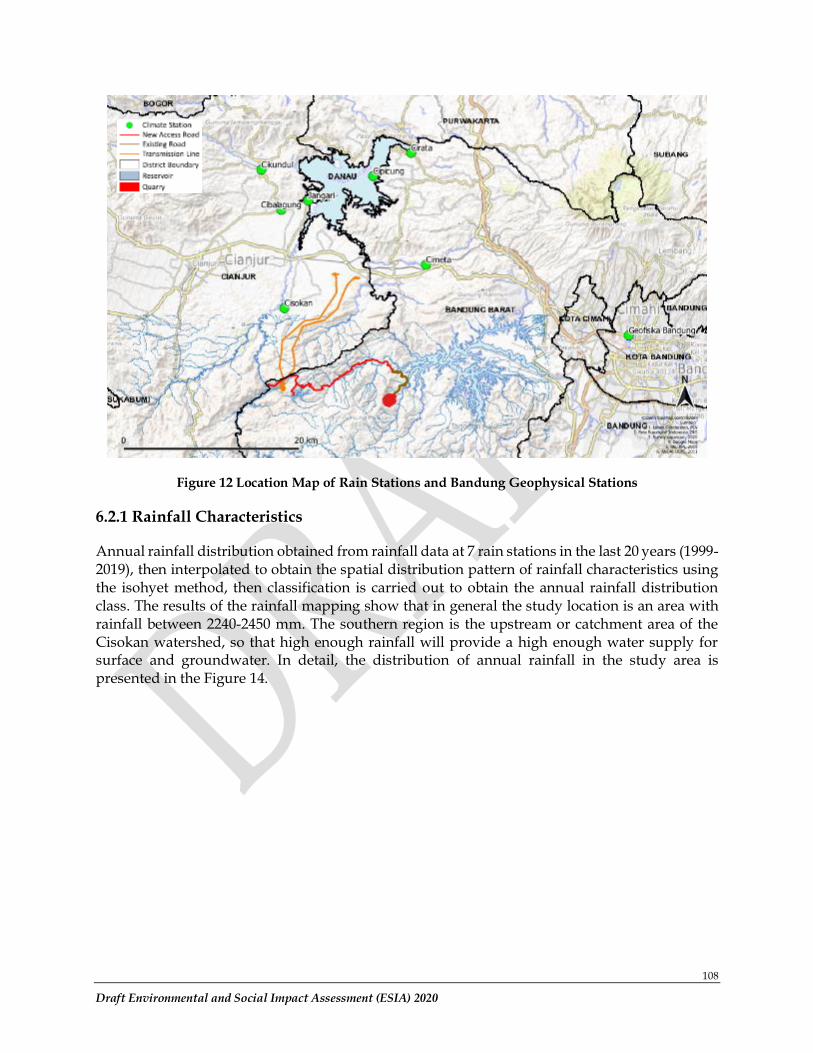
108
Draft Environmental and Social Impact Assessment (ESIA) 2020
Figure 12 Location Map of Rain Stations and Bandung Geophysical Stations
6.2.1 Rainfall Characteristics
Annual rainfall distribution obtained from rainfall data at 7 rain stations in the last 20 years (1999-2019), then interpolated to obtain the spatial distribution pattern of rainfall characteristics using the isohyet method, then classification is carried out to obtain the annual rainfall distribution class. The results of the rainfall mapping show that in general the study location is an area with rainfall between 2240-2450 mm. The southern region is the upstream or catchment area of the Cisokan watershed, so that high enough rainfall will provide a high enough water supply for surface and groundwater. In detail, the distribution of annual rainfall in the study area is presented in the Figure 14.
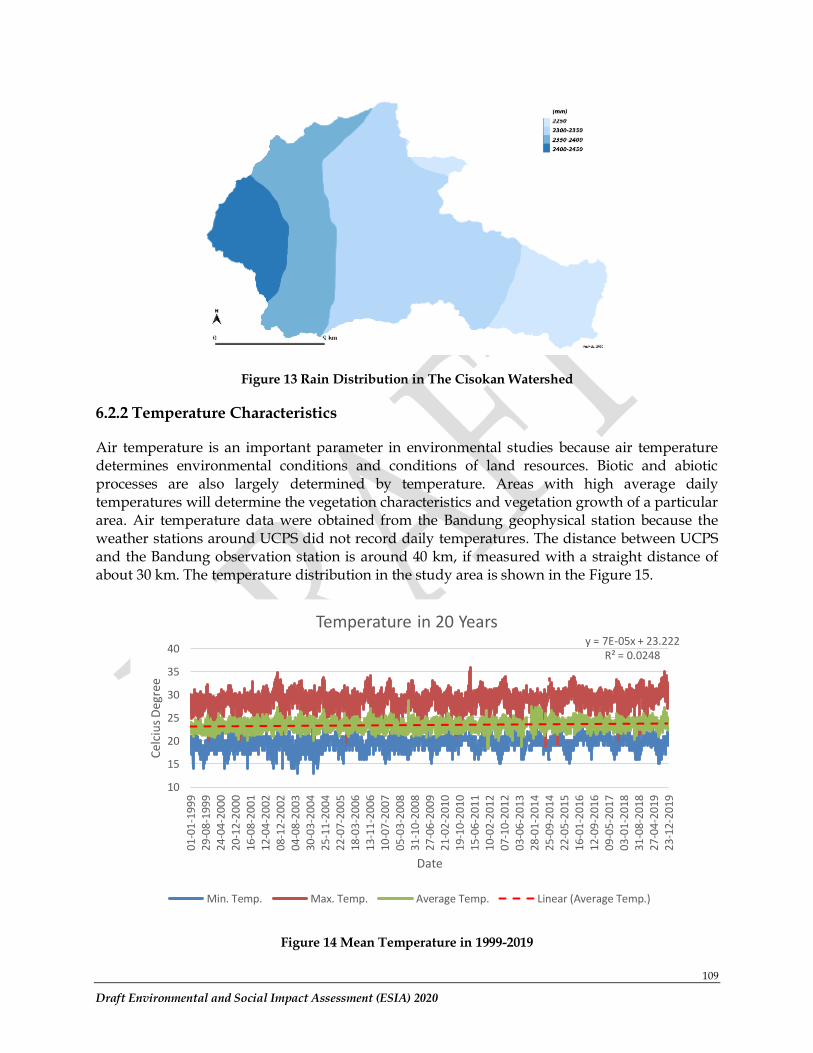
109
Draft Environmental and Social Impact Assessment (ESIA) 2020
Figure 13 Rain Distribution in The Cisokan Watershed
6.2.2 Temperature Characteristics
Air temperature is an important parameter in environmental studies because air temperature determines environmental conditions and conditions of land resources. Biotic and abiotic processes are also largely determined by temperature. Areas with high average daily temperatures will determine the vegetation characteristics and vegetation growth of a particular area. Air temperature data were obtained from the Bandung geophysical station because the weather stations around UCPS did not record daily temperatures. The distance between UCPS and the Bandung observation station is around 40 km, if measured with a straight distance of about 30 km. The temperature distribution in the study area is shown in the Figure 15.
Figure 14 Mean Temperature in 1999-2019
y = 7E-05x + 23.222R² = 0.0248
10
15
20
25
30
35
40
01-0
1-19
9929
-08-
1999
24-0
4-20
0020
-12-
2000
16-0
8-20
0112
-04-
2002
08-1
2-20
0204
-08-
2003
30-0
3-20
0425
-11-
2004
22-0
7-20
0518
-03-
2006
13-1
1-20
0610
-07-
2007
05-0
3-20
0831
-10-
2008
27-0
6-20
0921
-02-
2010
19-1
0-20
1015
-06-
2011
10-0
2-20
1207
-10-
2012
03-0
6-20
1328
-01-
2014
25-0
9-20
1422
-05-
2015
16-0
1-20
1612
-09-
2016
09-0
5-20
1703
-01-
2018
31-0
8-20
1827
-04-
2019
23-1
2-20
19
Cel
ciu
s D
egre
e
Date
Temperature in 20 Years
Min. Temp. Max. Temp. Average Temp. Linear (Average Temp.)
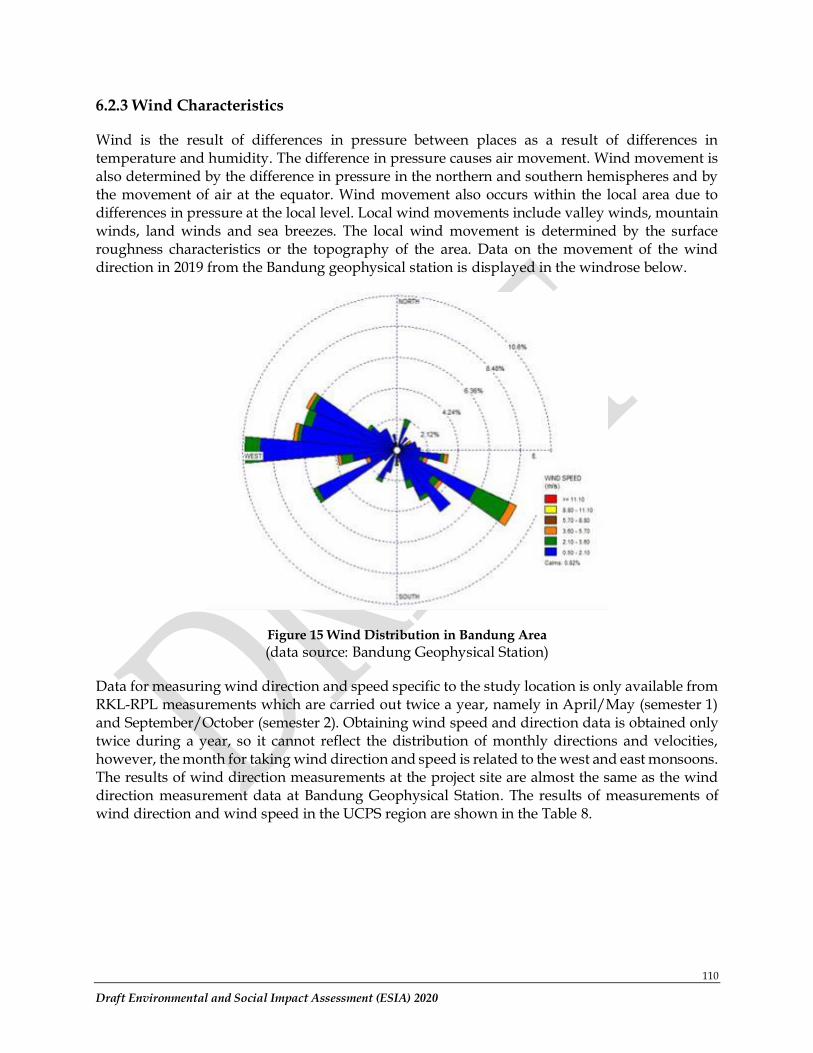
110
Draft Environmental and Social Impact Assessment (ESIA) 2020
6.2.3 Wind Characteristics
Wind is the result of differences in pressure between places as a result of differences in temperature and humidity. The difference in pressure causes air movement. Wind movement is also determined by the difference in pressure in the northern and southern hemispheres and by the movement of air at the equator. Wind movement also occurs within the local area due to differences in pressure at the local level. Local wind movements include valley winds, mountain winds, land winds and sea breezes. The local wind movement is determined by the surface roughness characteristics or the topography of the area. Data on the movement of the wind direction in 2019 from the Bandung geophysical station is displayed in the windrose below.
Figure 15 Wind Distribution in Bandung Area
(data source: Bandung Geophysical Station)
Data for measuring wind direction and speed specific to the study location is only available from RKL-RPL measurements which are carried out twice a year, namely in April/May (semester 1) and September/October (semester 2). Obtaining wind speed and direction data is obtained only twice during a year, so it cannot reflect the distribution of monthly directions and velocities, however, the month for taking wind direction and speed is related to the west and east monsoons. The results of wind direction measurements at the project site are almost the same as the wind direction measurement data at Bandung Geophysical Station. The results of measurements of wind direction and wind speed in the UCPS region are shown in the Table 8.
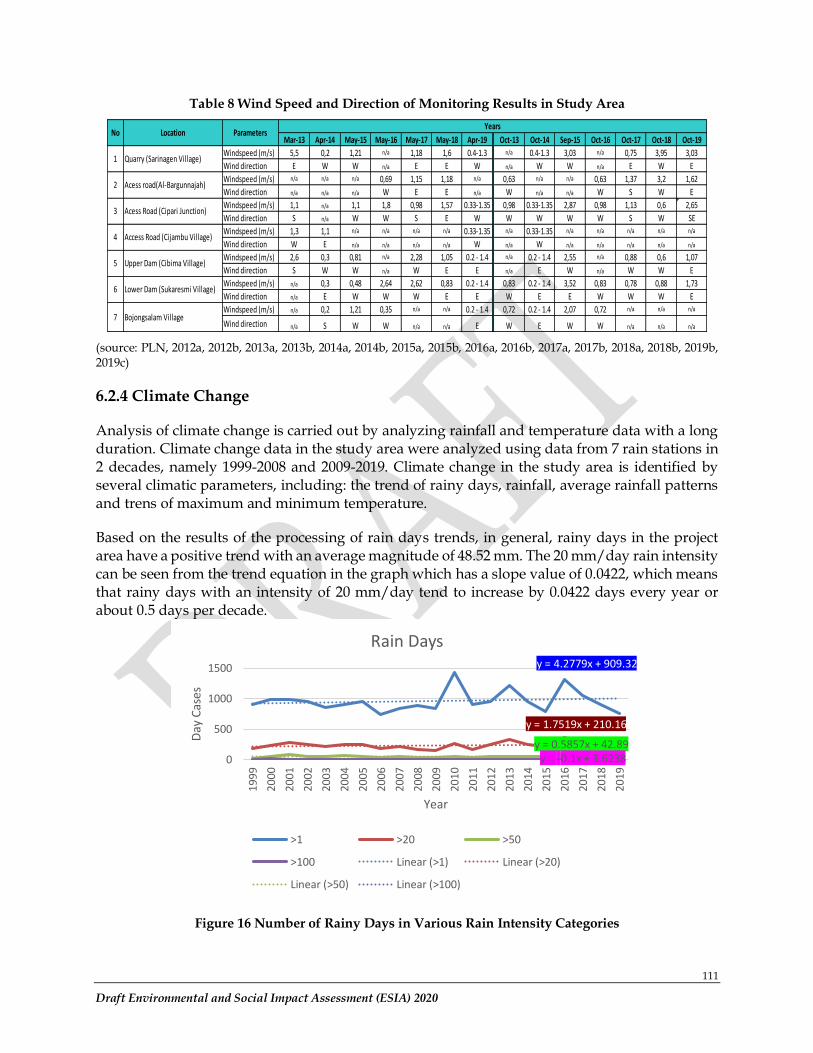
111
Draft Environmental and Social Impact Assessment (ESIA) 2020
Table 8 Wind Speed and Direction of Monitoring Results in Study Area
(source: PLN, 2012a, 2012b, 2013a, 2013b, 2014a, 2014b, 2015a, 2015b, 2016a, 2016b, 2017a, 2017b, 2018a, 2018b, 2019b, 2019c)
6.2.4 Climate Change
Analysis of climate change is carried out by analyzing rainfall and temperature data with a long duration. Climate change data in the study area were analyzed using data from 7 rain stations in 2 decades, namely 1999-2008 and 2009-2019. Climate change in the study area is identified by several climatic parameters, including: the trend of rainy days, rainfall, average rainfall patterns and trens of maximum and minimum temperature.
Based on the results of the processing of rain days trends, in general, rainy days in the project area have a positive trend with an average magnitude of 48.52 mm. The 20 mm/day rain intensity can be seen from the trend equation in the graph which has a slope value of 0.0422, which means that rainy days with an intensity of 20 mm/day tend to increase by 0.0422 days every year or about 0.5 days per decade.
Figure 16 Number of Rainy Days in Various Rain Intensity Categories
Mar-13 Apr-14 May-15 May-16 May-17 May-18 Apr-19 Oct-13 Oct-14 Sep-15 Oct-16 Oct-17 Oct-18 Oct-19
Windspeed (m/s) 5,5 0,2 1,21 n/a 1,18 1,6 0.4-1.3 n/a 0.4-1.3 3,03 n/a 0,75 3,95 3,03
Wind direction E W W n/a E E W n/a W W n/a E W E
Windspeed (m/s) n/a n/a n/a 0,69 1,15 1,18 n/a 0,63 n/a n/a 0,63 1,37 3,2 1,62
Wind direction n/a n/a n/a W E E n/a W n/a n/a W S W E
Windspeed (m/s) 1,1 n/a 1,1 1,8 0,98 1,57 0.33-1.35 0,98 0.33-1.35 2,87 0,98 1,13 0,6 2,65
Wind direction S n/a W W S E W W W W W S W SE
Windspeed (m/s) 1,3 1,1 n/a n/a n/a n/a 0.33-1.35 n/a 0.33-1.35 n/a n/a n/a n/a n/a
Wind direction W E n/a n/a n/a n/a W n/a W n/a n/a n/a n/a n/a
Windspeed (m/s) 2,6 0,3 0,81 n/a 2,28 1,05 0.2 - 1.4 n/a 0.2 - 1.4 2,55 n/a 0,88 0,6 1,07
Wind direction S W W n/a W E E n/a E W n/a W W E
Windspeed (m/s) n/a 0,3 0,48 2,64 2,62 0,83 0.2 - 1.4 0,83 0.2 - 1.4 3,52 0,83 0,78 0,88 1,73
Wind direction n/a E W W W E E W E E W W W E
Windspeed (m/s) n/a 0,2 1,21 0,35 n/a n/a 0.2 - 1.4 0,72 0.2 - 1.4 2,07 0,72 n/a n/a n/a
Wind direction n/a S W W n/a n/a E W E W W n/a n/a n/a
5 Upper Dam (Cibima Village)
6 Lower Dam (Sukaresmi Village)
7 Bojongsalam Village
2 Acess road(Al-Bargunnajah)
3 Acess Road (Cipari Junction)
4 Access Road (Cijambu Village)
No Location ParametersYears
1 Quarry (Sarinagen Village)
y = 4.2779x + 909.32
y = 1.7519x + 210.16
y = 0.5857x + 42.89y = -0.1x + 3.62380
500
1000
1500
19
99
20
00
20
01
2002
20
03
20
04
20
05
20
06
20
07
2008
20
09
20
10
20
11
20
12
20
13
2014
20
15
20
16
20
17
20
18
20
19
Day
Cas
es
Year
Rain Days
>1 >20 >50
>100 Linear (>1) Linear (>20)
Linear (>50) Linear (>100)
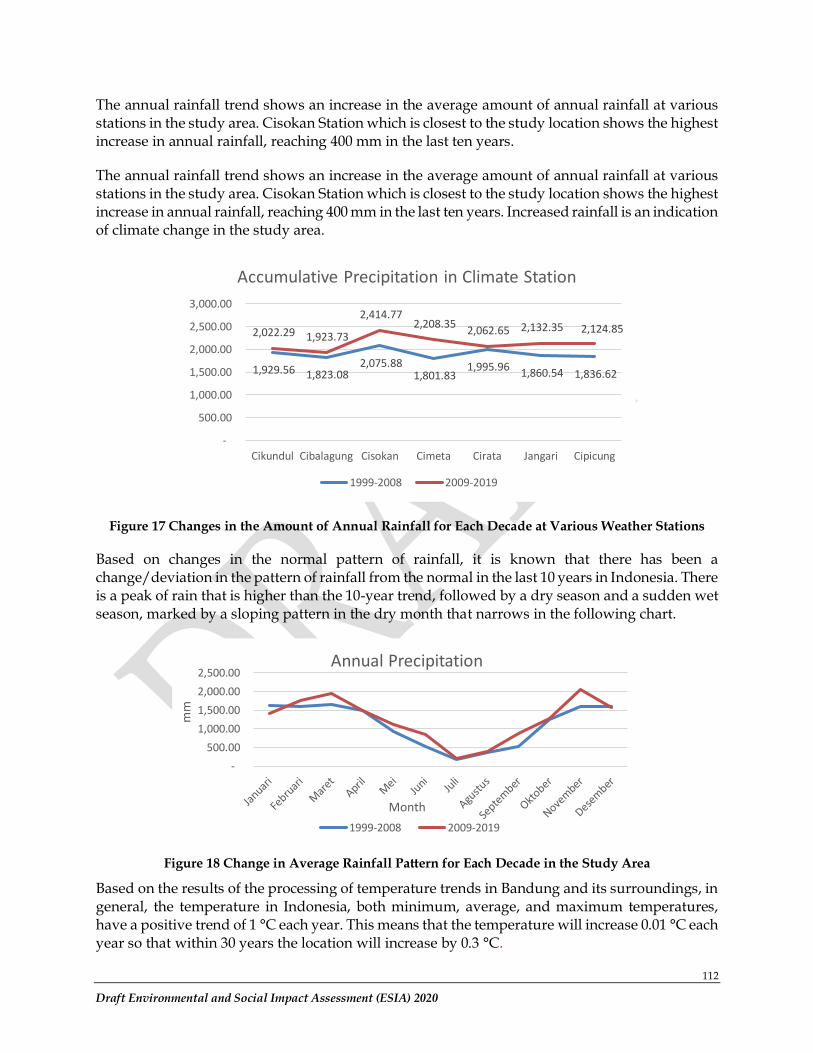
112
Draft Environmental and Social Impact Assessment (ESIA) 2020
The annual rainfall trend shows an increase in the average amount of annual rainfall at various stations in the study area. Cisokan Station which is closest to the study location shows the highest increase in annual rainfall, reaching 400 mm in the last ten years.
The annual rainfall trend shows an increase in the average amount of annual rainfall at various stations in the study area. Cisokan Station which is closest to the study location shows the highest increase in annual rainfall, reaching 400 mm in the last ten years. Increased rainfall is an indication of climate change in the study area.
Figure 17 Changes in the Amount of Annual Rainfall for Each Decade at Various Weather Stations
Based on changes in the normal pattern of rainfall, it is known that there has been a change/deviation in the pattern of rainfall from the normal in the last 10 years in Indonesia. There is a peak of rain that is higher than the 10-year trend, followed by a dry season and a sudden wet season, marked by a sloping pattern in the dry month that narrows in the following chart.
Figure 18 Change in Average Rainfall Pattern for Each Decade in the Study Area
Based on the results of the processing of temperature trends in Bandung and its surroundings, in general, the temperature in Indonesia, both minimum, average, and maximum temperatures, have a positive trend of 1 °C each year. This means that the temperature will increase 0.01 °C each year so that within 30 years the location will increase by 0.3 °C.
1,929.56 1,823.08 2,075.88
1,801.83 1,995.96
1,860.54 1,836.62
2,022.29 1,923.73
2,414.77 2,208.35
2,062.65 2,132.35 2,124.85
-
500.00
1,000.00
1,500.00
2,000.00
2,500.00
3,000.00
Cikundul Cibalagung Cisokan Cimeta Cirata Jangari Cipicung
Accumulative Precipitation in Climate Station
1999-2008 2009-2019
-
500.00
1,000.00
1,500.00
2,000.00
2,500.00
mm
Month
Annual Precipitation
1999-2008 2009-2019
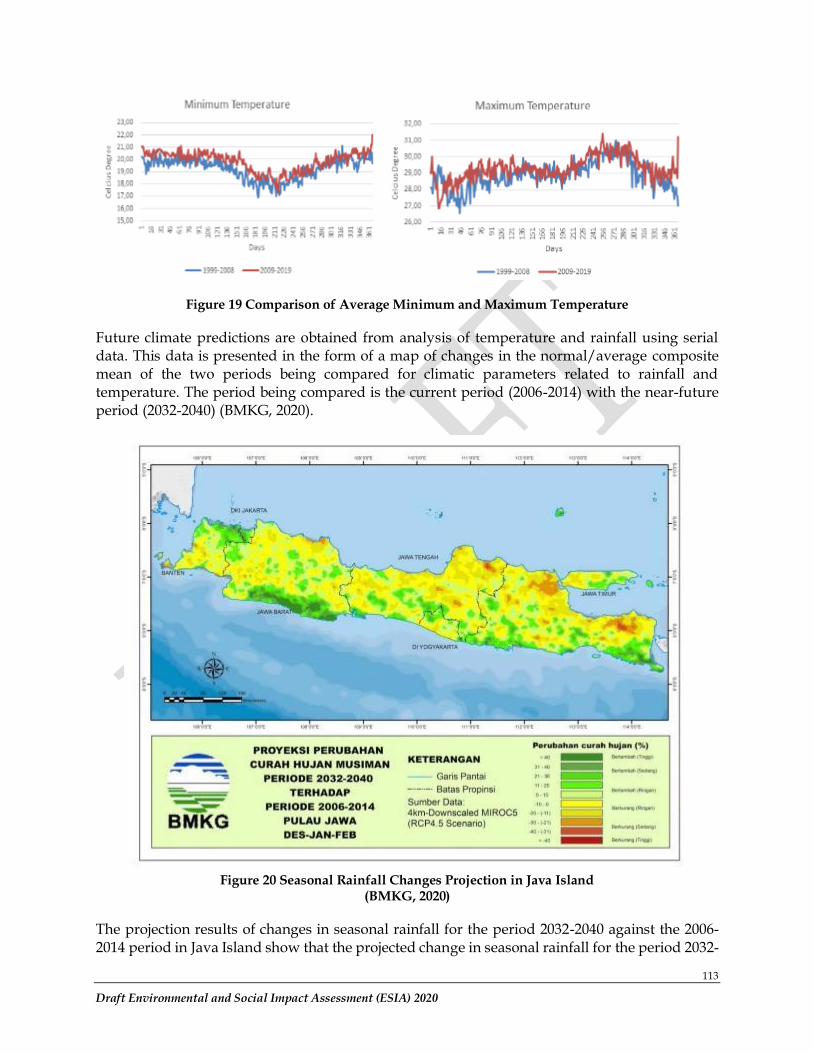
113
Draft Environmental and Social Impact Assessment (ESIA) 2020
Figure 19 Comparison of Average Minimum and Maximum Temperature
Future climate predictions are obtained from analysis of temperature and rainfall using serial data. This data is presented in the form of a map of changes in the normal/average composite mean of the two periods being compared for climatic parameters related to rainfall and temperature. The period being compared is the current period (2006-2014) with the near-future period (2032-2040) (BMKG, 2020).
Figure 20 Seasonal Rainfall Changes Projection in Java Island
(BMKG, 2020)
The projection results of changes in seasonal rainfall for the period 2032-2040 against the 2006-2014 period in Java Island show that the projected change in seasonal rainfall for the period 2032-
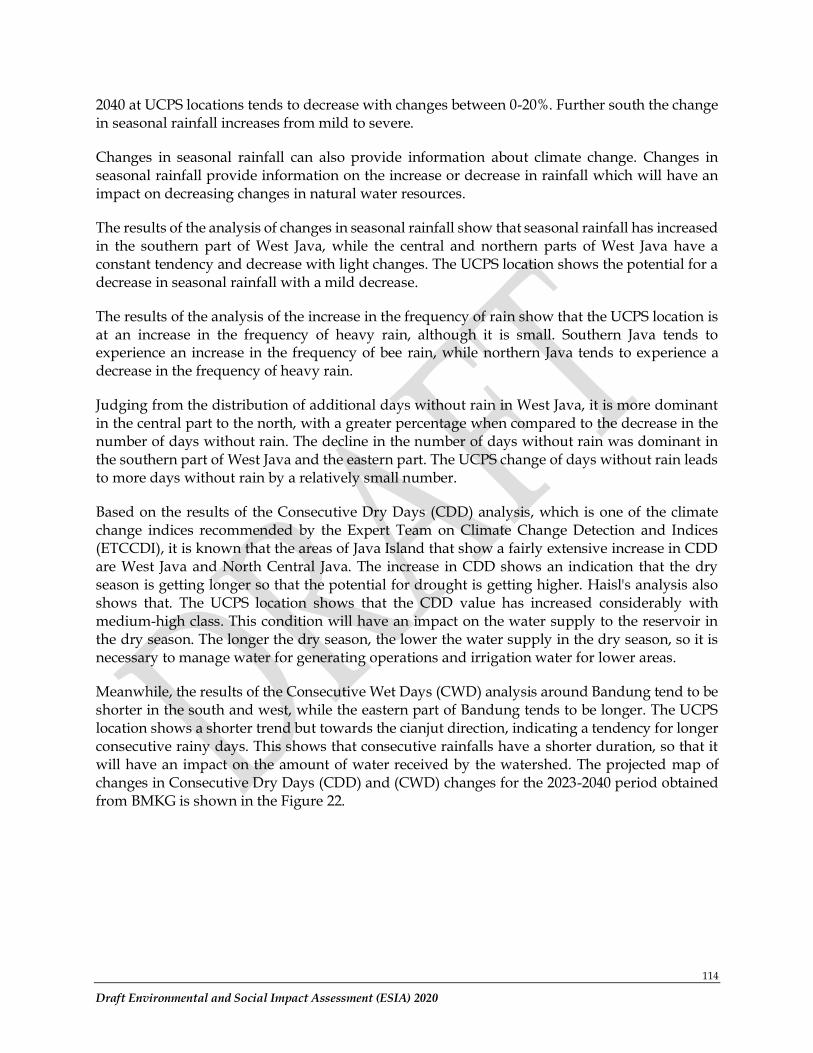
114
Draft Environmental and Social Impact Assessment (ESIA) 2020
2040 at UCPS locations tends to decrease with changes between 0-20%. Further south the change in seasonal rainfall increases from mild to severe.
Changes in seasonal rainfall can also provide information about climate change. Changes in seasonal rainfall provide information on the increase or decrease in rainfall which will have an impact on decreasing changes in natural water resources.
The results of the analysis of changes in seasonal rainfall show that seasonal rainfall has increased in the southern part of West Java, while the central and northern parts of West Java have a constant tendency and decrease with light changes. The UCPS location shows the potential for a decrease in seasonal rainfall with a mild decrease.
The results of the analysis of the increase in the frequency of rain show that the UCPS location is at an increase in the frequency of heavy rain, although it is small. Southern Java tends to experience an increase in the frequency of bee rain, while northern Java tends to experience a decrease in the frequency of heavy rain.
Judging from the distribution of additional days without rain in West Java, it is more dominant in the central part to the north, with a greater percentage when compared to the decrease in the number of days without rain. The decline in the number of days without rain was dominant in the southern part of West Java and the eastern part. The UCPS change of days without rain leads to more days without rain by a relatively small number.
Based on the results of the Consecutive Dry Days (CDD) analysis, which is one of the climate change indices recommended by the Expert Team on Climate Change Detection and Indices (ETCCDI), it is known that the areas of Java Island that show a fairly extensive increase in CDD are West Java and North Central Java. The increase in CDD shows an indication that the dry season is getting longer so that the potential for drought is getting higher. Haisl's analysis also shows that. The UCPS location shows that the CDD value has increased considerably with medium-high class. This condition will have an impact on the water supply to the reservoir in the dry season. The longer the dry season, the lower the water supply in the dry season, so it is necessary to manage water for generating operations and irrigation water for lower areas.
Meanwhile, the results of the Consecutive Wet Days (CWD) analysis around Bandung tend to be shorter in the south and west, while the eastern part of Bandung tends to be longer. The UCPS location shows a shorter trend but towards the cianjut direction, indicating a tendency for longer consecutive rainy days. This shows that consecutive rainfalls have a shorter duration, so that it will have an impact on the amount of water received by the watershed. The projected map of changes in Consecutive Dry Days (CDD) and (CWD) changes for the 2023-2040 period obtained from BMKG is shown in the Figure 22.
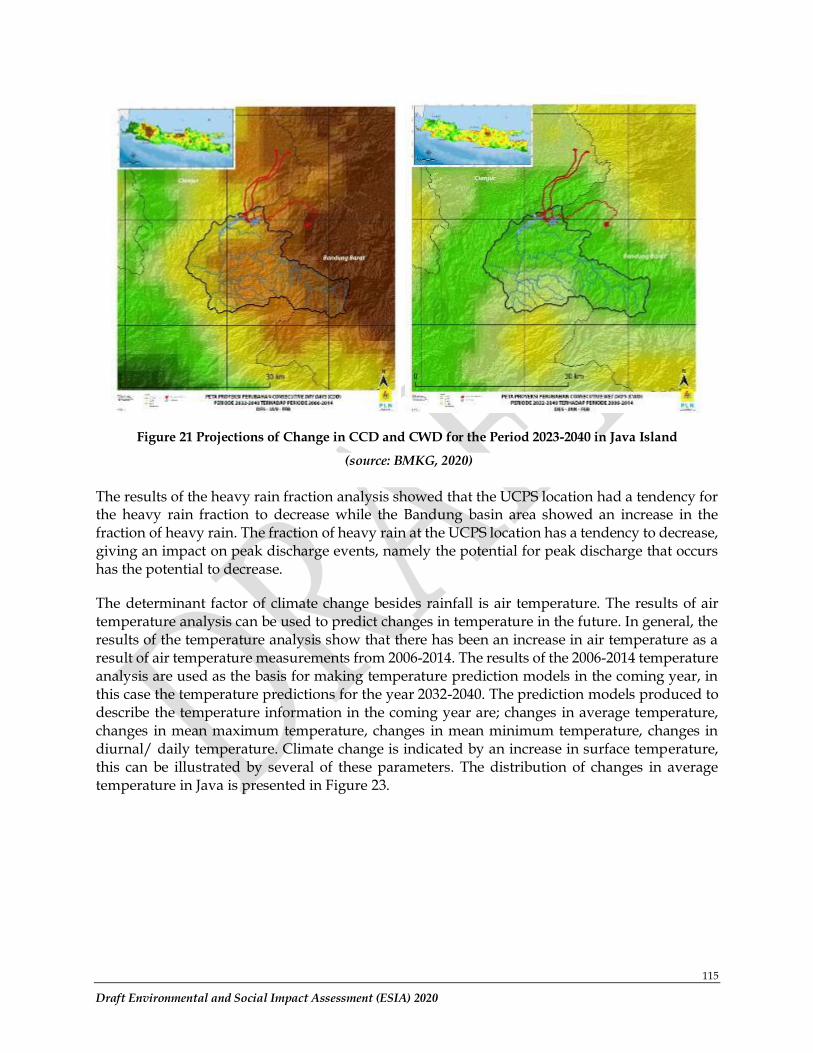
115
Draft Environmental and Social Impact Assessment (ESIA) 2020
Figure 21 Projections of Change in CCD and CWD for the Period 2023-2040 in Java Island
(source: BMKG, 2020)
The results of the heavy rain fraction analysis showed that the UCPS location had a tendency for the heavy rain fraction to decrease while the Bandung basin area showed an increase in the fraction of heavy rain. The fraction of heavy rain at the UCPS location has a tendency to decrease, giving an impact on peak discharge events, namely the potential for peak discharge that occurs has the potential to decrease.
The determinant factor of climate change besides rainfall is air temperature. The results of air temperature analysis can be used to predict changes in temperature in the future. In general, the results of the temperature analysis show that there has been an increase in air temperature as a result of air temperature measurements from 2006-2014. The results of the 2006-2014 temperature analysis are used as the basis for making temperature prediction models in the coming year, in this case the temperature predictions for the year 2032-2040. The prediction models produced to describe the temperature information in the coming year are; changes in average temperature, changes in mean maximum temperature, changes in mean minimum temperature, changes in diurnal/ daily temperature. Climate change is indicated by an increase in surface temperature, this can be illustrated by several of these parameters. The distribution of changes in average temperature in Java is presented in Figure 23.
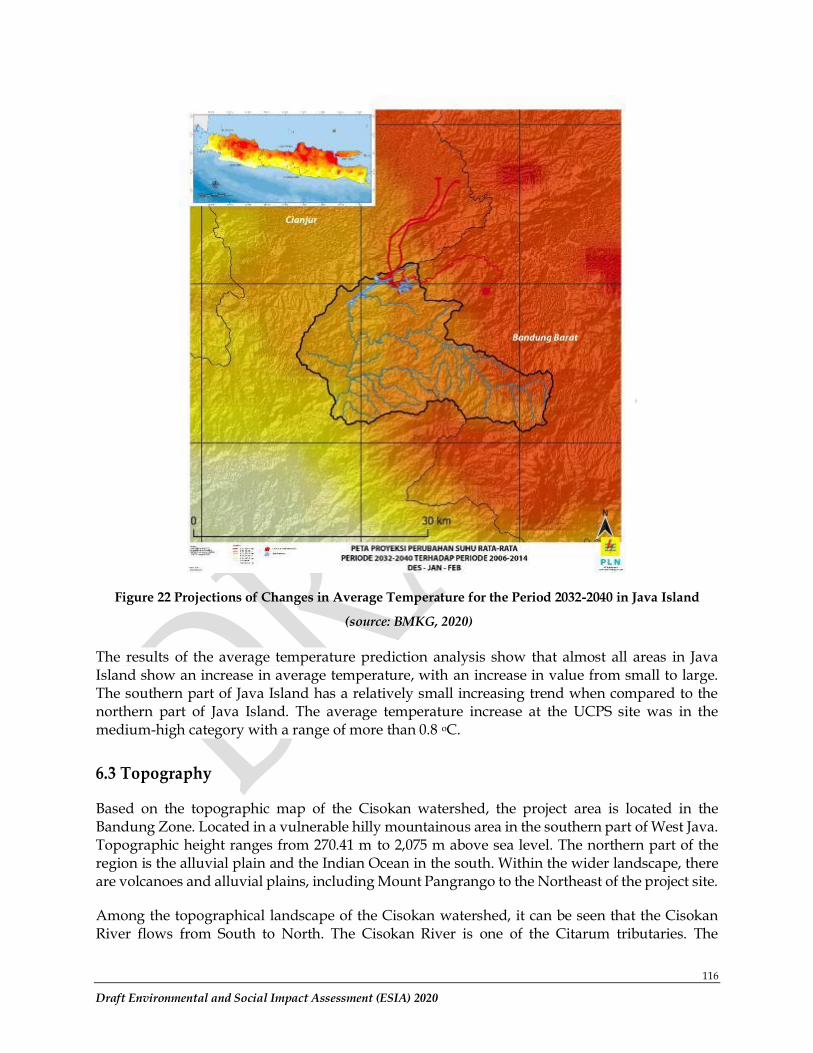
116
Draft Environmental and Social Impact Assessment (ESIA) 2020
Figure 22 Projections of Changes in Average Temperature for the Period 2032-2040 in Java Island
(source: BMKG, 2020)
The results of the average temperature prediction analysis show that almost all areas in Java Island show an increase in average temperature, with an increase in value from small to large. The southern part of Java Island has a relatively small increasing trend when compared to the northern part of Java Island. The average temperature increase at the UCPS site was in the medium-high category with a range of more than 0.8 oC.
6.3 Topography
Based on the topographic map of the Cisokan watershed, the project area is located in the Bandung Zone. Located in a vulnerable hilly mountainous area in the southern part of West Java. Topographic height ranges from 270.41 m to 2,075 m above sea level. The northern part of the region is the alluvial plain and the Indian Ocean in the south. Within the wider landscape, there are volcanoes and alluvial plains, including Mount Pangrango to the Northeast of the project site.
Among the topographical landscape of the Cisokan watershed, it can be seen that the Cisokan River flows from South to North. The Cisokan River is one of the Citarum tributaries. The
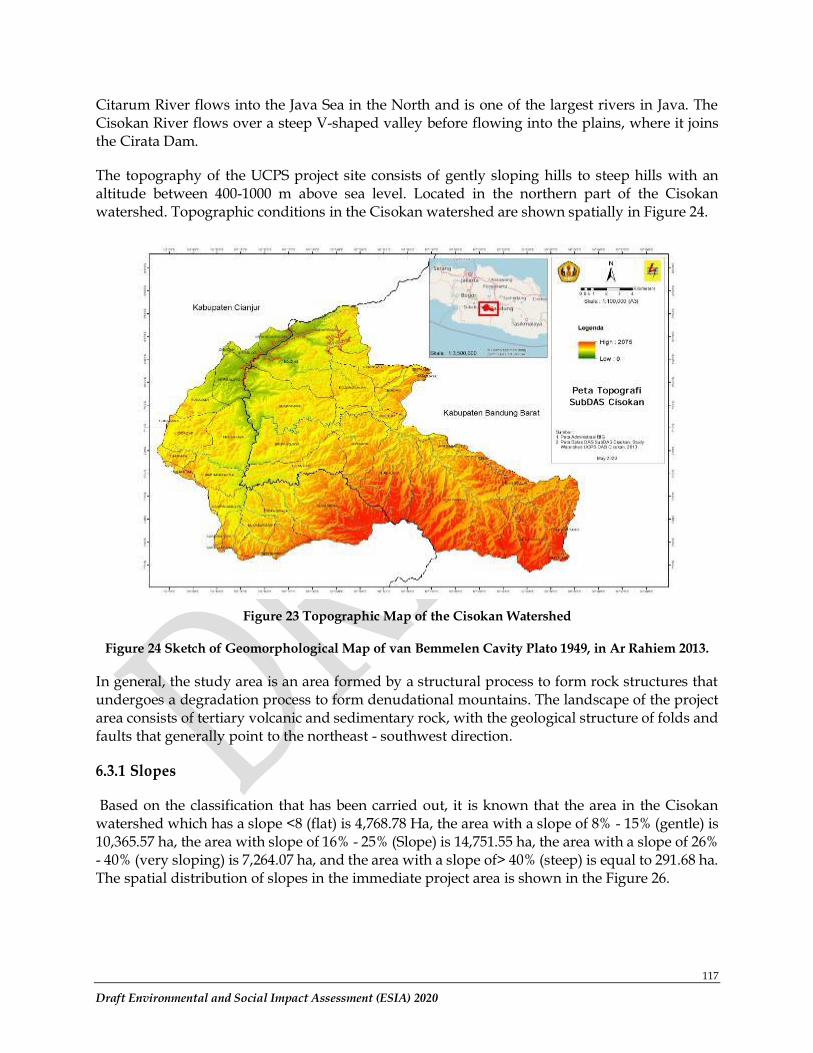
117
Draft Environmental and Social Impact Assessment (ESIA) 2020
Citarum River flows into the Java Sea in the North and is one of the largest rivers in Java. The Cisokan River flows over a steep V-shaped valley before flowing into the plains, where it joins the Cirata Dam.
The topography of the UCPS project site consists of gently sloping hills to steep hills with an altitude between 400-1000 m above sea level. Located in the northern part of the Cisokan watershed. Topographic conditions in the Cisokan watershed are shown spatially in Figure 24.
Figure 23 Topographic Map of the Cisokan Watershed
Figure 24 Sketch of Geomorphological Map of van Bemmelen Cavity Plato 1949, in Ar Rahiem 2013.
In general, the study area is an area formed by a structural process to form rock structures that undergoes a degradation process to form denudational mountains. The landscape of the project area consists of tertiary volcanic and sedimentary rock, with the geological structure of folds and faults that generally point to the northeast - southwest direction.
6.3.1 Slopes
Based on the classification that has been carried out, it is known that the area in the Cisokan watershed which has a slope <8 (flat) is 4,768.78 Ha, the area with a slope of 8% - 15% (gentle) is 10,365.57 ha, the area with slope of 16% - 25% (Slope) is 14,751.55 ha, the area with a slope of 26% - 40% (very sloping) is 7,264.07 ha, and the area with a slope of> 40% (steep) is equal to 291.68 ha. The spatial distribution of slopes in the immediate project area is shown in the Figure 26.
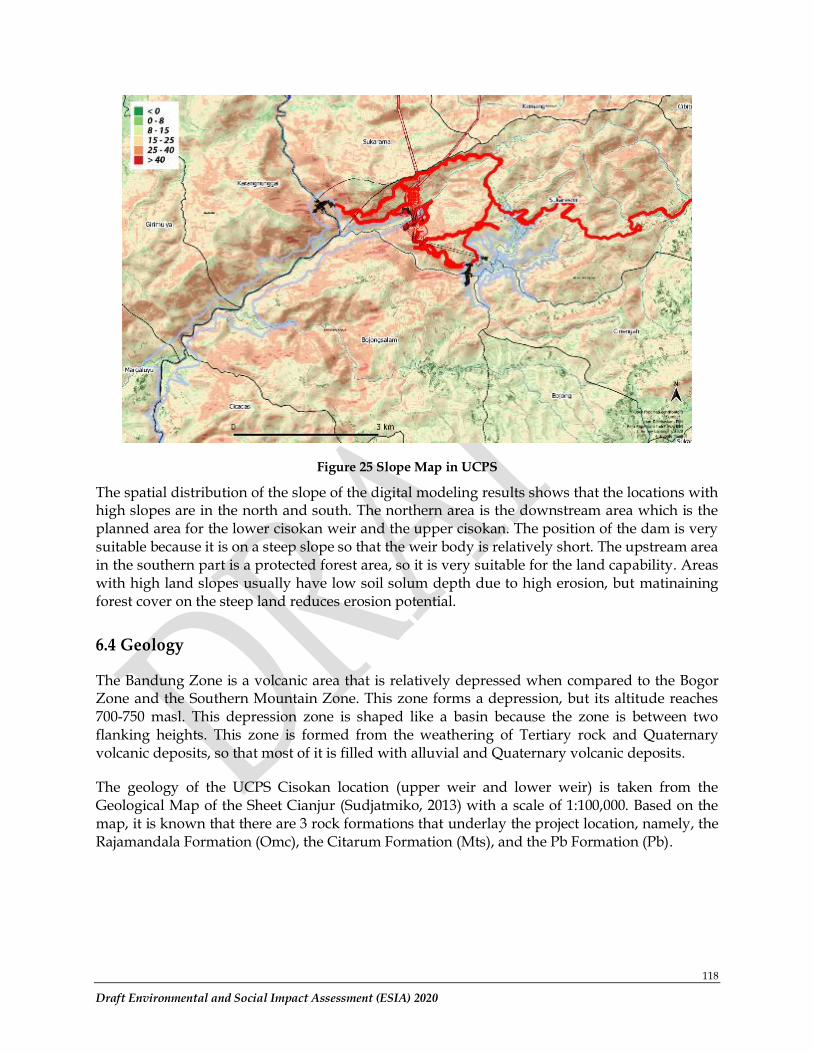
118
Draft Environmental and Social Impact Assessment (ESIA) 2020
Figure 25 Slope Map in UCPS
The spatial distribution of the slope of the digital modeling results shows that the locations with high slopes are in the north and south. The northern area is the downstream area which is the planned area for the lower cisokan weir and the upper cisokan. The position of the dam is very suitable because it is on a steep slope so that the weir body is relatively short. The upstream area in the southern part is a protected forest area, so it is very suitable for the land capability. Areas with high land slopes usually have low soil solum depth due to high erosion, but matinaining forest cover on the steep land reduces erosion potential.
6.4 Geology
The Bandung Zone is a volcanic area that is relatively depressed when compared to the Bogor Zone and the Southern Mountain Zone. This zone forms a depression, but its altitude reaches 700-750 masl. This depression zone is shaped like a basin because the zone is between two flanking heights. This zone is formed from the weathering of Tertiary rock and Quaternary volcanic deposits, so that most of it is filled with alluvial and Quaternary volcanic deposits.
The geology of the UCPS Cisokan location (upper weir and lower weir) is taken from the Geological Map of the Sheet Cianjur (Sudjatmiko, 2013) with a scale of 1:100,000. Based on the map, it is known that there are 3 rock formations that underlay the project location, namely, the Rajamandala Formation (Omc), the Citarum Formation (Mts), and the Pb Formation (Pb).
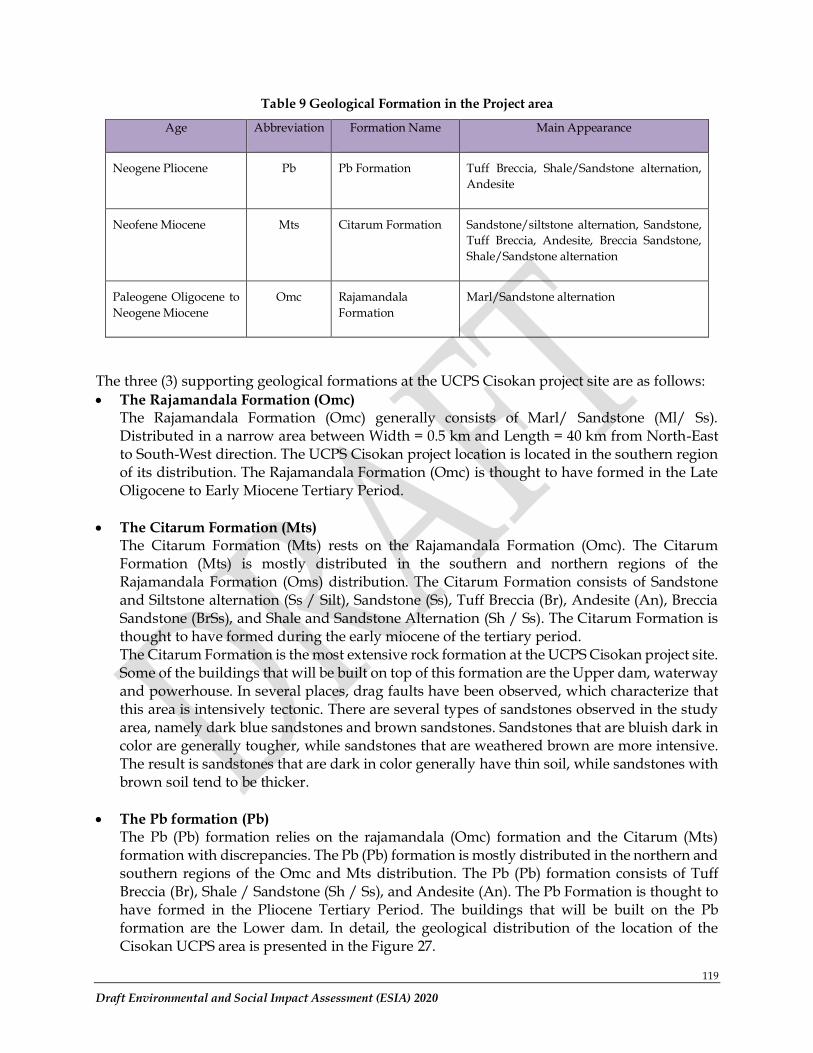
119
Draft Environmental and Social Impact Assessment (ESIA) 2020
Table 9 Geological Formation in the Project area
Age Abbreviation Formation Name Main Appearance
Neogene Pliocene Pb Pb Formation Tuff Breccia, Shale/Sandstone alternation,
Andesite
Neofene Miocene Mts Citarum Formation Sandstone/siltstone alternation, Sandstone,
Tuff Breccia, Andesite, Breccia Sandstone,
Shale/Sandstone alternation
Paleogene Oligocene to
Neogene Miocene
Omc Rajamandala
Formation
Marl/Sandstone alternation
The three (3) supporting geological formations at the UCPS Cisokan project site are as follows:
• The Rajamandala Formation (Omc) The Rajamandala Formation (Omc) generally consists of Marl/ Sandstone (Ml/ Ss). Distributed in a narrow area between Width = 0.5 km and Length = 40 km from North-East to South-West direction. The UCPS Cisokan project location is located in the southern region of its distribution. The Rajamandala Formation (Omc) is thought to have formed in the Late Oligocene to Early Miocene Tertiary Period.
• The Citarum Formation (Mts) The Citarum Formation (Mts) rests on the Rajamandala Formation (Omc). The Citarum Formation (Mts) is mostly distributed in the southern and northern regions of the Rajamandala Formation (Oms) distribution. The Citarum Formation consists of Sandstone and Siltstone alternation (Ss / Silt), Sandstone (Ss), Tuff Breccia (Br), Andesite (An), Breccia Sandstone (BrSs), and Shale and Sandstone Alternation (Sh / Ss). The Citarum Formation is thought to have formed during the early miocene of the tertiary period. The Citarum Formation is the most extensive rock formation at the UCPS Cisokan project site. Some of the buildings that will be built on top of this formation are the Upper dam, waterway and powerhouse. In several places, drag faults have been observed, which characterize that this area is intensively tectonic. There are several types of sandstones observed in the study area, namely dark blue sandstones and brown sandstones. Sandstones that are bluish dark in color are generally tougher, while sandstones that are weathered brown are more intensive. The result is sandstones that are dark in color generally have thin soil, while sandstones with brown soil tend to be thicker.
• The Pb formation (Pb) The Pb (Pb) formation relies on the rajamandala (Omc) formation and the Citarum (Mts) formation with discrepancies. The Pb (Pb) formation is mostly distributed in the northern and southern regions of the Omc and Mts distribution. The Pb (Pb) formation consists of Tuff Breccia (Br), Shale / Sandstone (Sh / Ss), and Andesite (An). The Pb Formation is thought to have formed in the Pliocene Tertiary Period. The buildings that will be built on the Pb formation are the Lower dam. In detail, the geological distribution of the location of the Cisokan UCPS area is presented in the Figure 27.
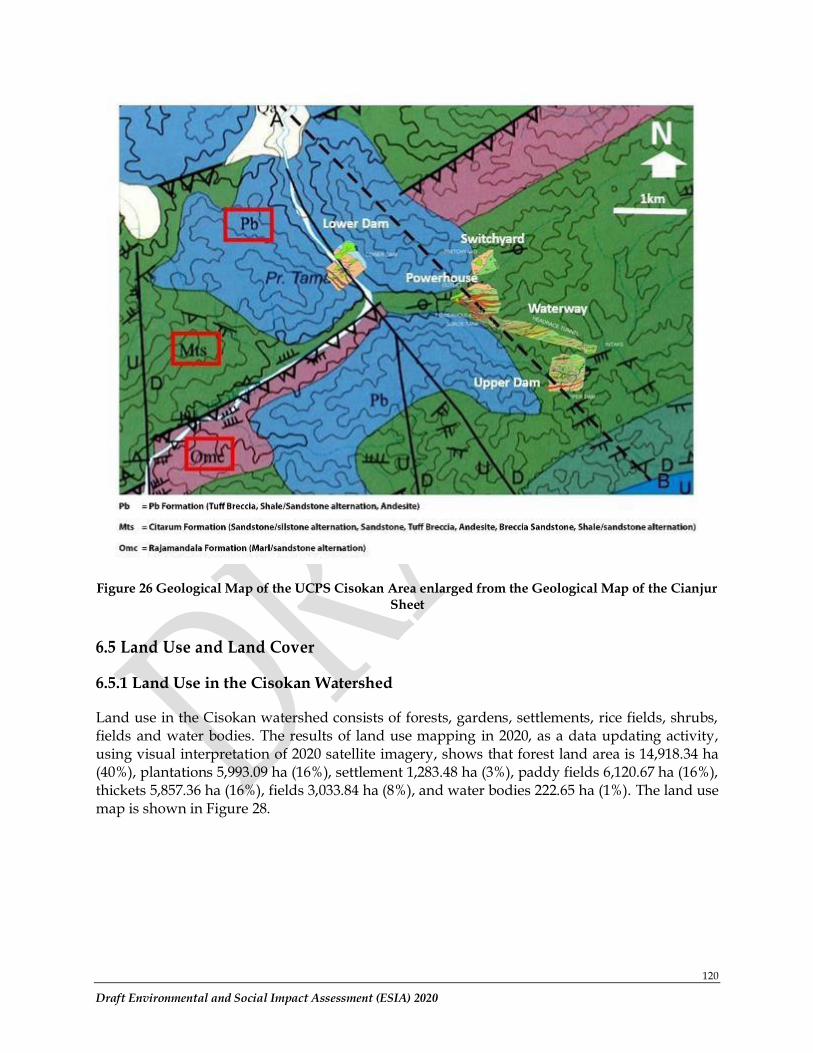
120
Draft Environmental and Social Impact Assessment (ESIA) 2020
Figure 26 Geological Map of the UCPS Cisokan Area enlarged from the Geological Map of the Cianjur Sheet
6.5 Land Use and Land Cover
6.5.1 Land Use in the Cisokan Watershed
Land use in the Cisokan watershed consists of forests, gardens, settlements, rice fields, shrubs, fields and water bodies. The results of land use mapping in 2020, as a data updating activity, using visual interpretation of 2020 satellite imagery, shows that forest land area is 14,918.34 ha (40%), plantations 5,993.09 ha (16%), settlement 1,283.48 ha (3%), paddy fields 6,120.67 ha (16%), thickets 5,857.36 ha (16%), fields 3,033.84 ha (8%), and water bodies 222.65 ha (1%). The land use map is shown in Figure 28.
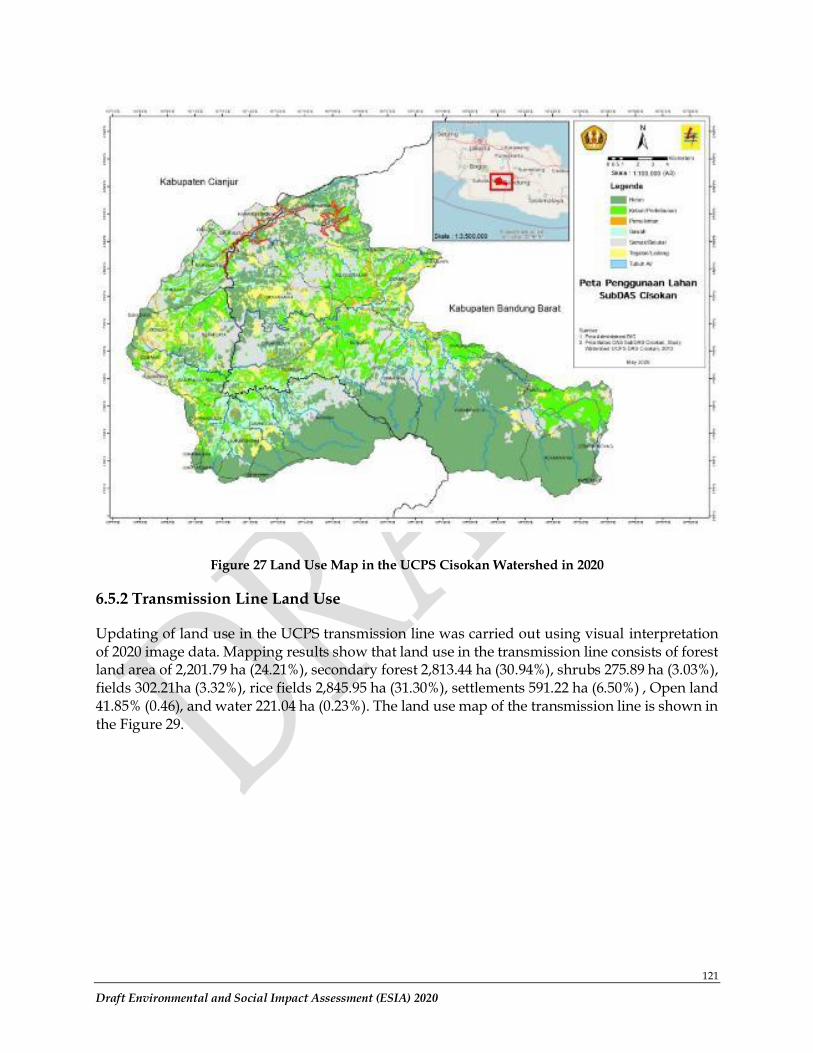
121
Draft Environmental and Social Impact Assessment (ESIA) 2020
Figure 27 Land Use Map in the UCPS Cisokan Watershed in 2020
6.5.2 Transmission Line Land Use
Updating of land use in the UCPS transmission line was carried out using visual interpretation of 2020 image data. Mapping results show that land use in the transmission line consists of forest land area of 2,201.79 ha (24.21%), secondary forest 2,813.44 ha (30.94%), shrubs 275.89 ha (3.03%), fields 302.21ha (3.32%), rice fields 2,845.95 ha (31.30%), settlements 591.22 ha (6.50%) , Open land 41.85% (0.46), and water 221.04 ha (0.23%). The land use map of the transmission line is shown in the Figure 29.
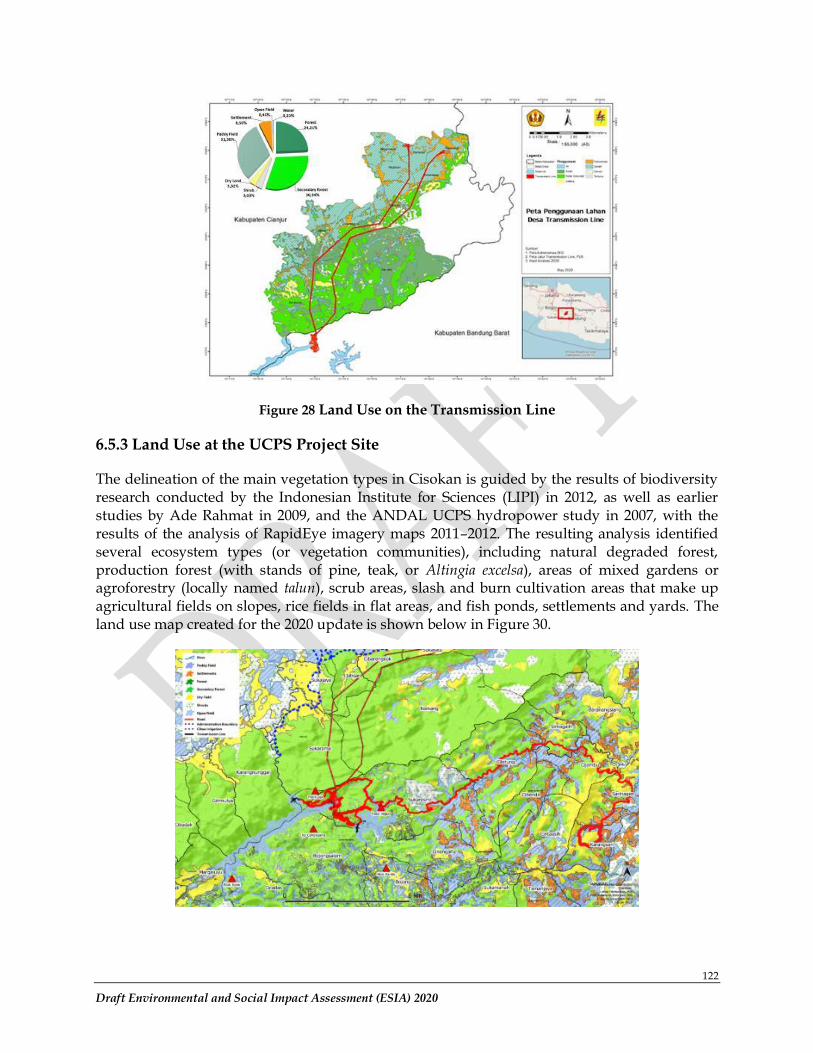
122
Draft Environmental and Social Impact Assessment (ESIA) 2020
Figure 28 Land Use on the Transmission Line
6.5.3 Land Use at the UCPS Project Site
The delineation of the main vegetation types in Cisokan is guided by the results of biodiversity research conducted by the Indonesian Institute for Sciences (LIPI) in 2012, as well as earlier studies by Ade Rahmat in 2009, and the ANDAL UCPS hydropower study in 2007, with the results of the analysis of RapidEye imagery maps 2011–2012. The resulting analysis identified several ecosystem types (or vegetation communities), including natural degraded forest, production forest (with stands of pine, teak, or Altingia excelsa), areas of mixed gardens or agroforestry (locally named talun), scrub areas, slash and burn cultivation areas that make up agricultural fields on slopes, rice fields in flat areas, and fish ponds, settlements and yards. The land use map created for the 2020 update is shown below in Figure 30.
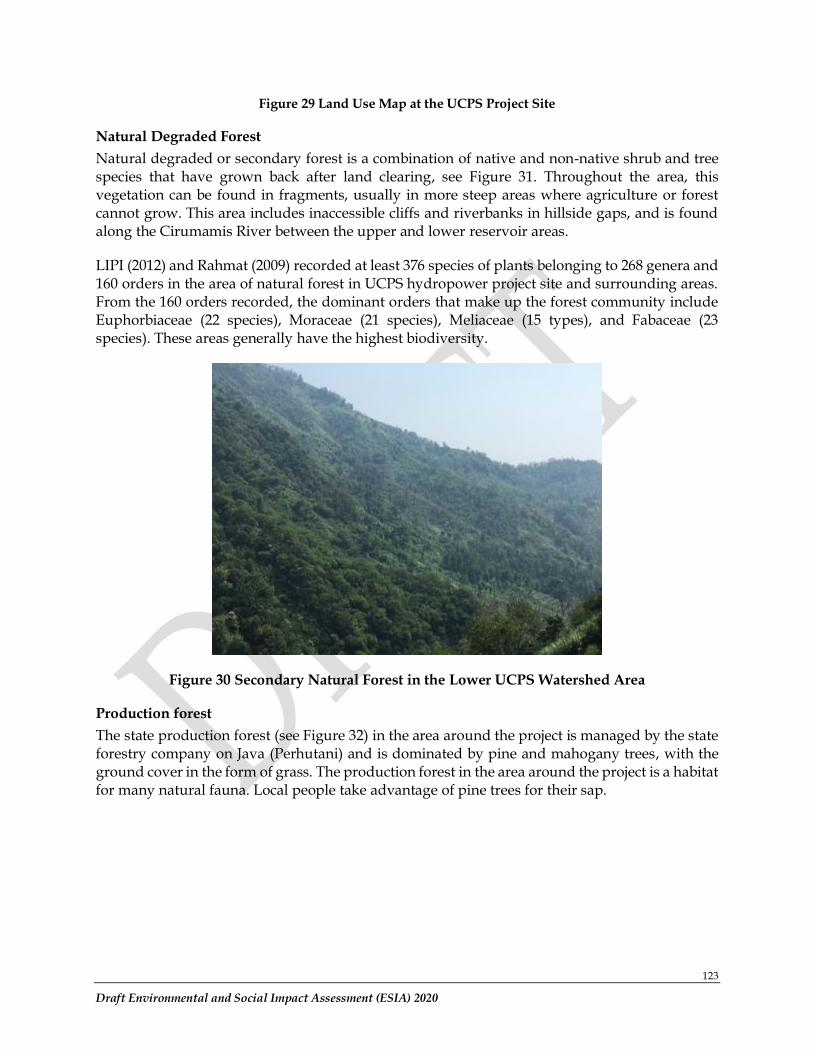
123
Draft Environmental and Social Impact Assessment (ESIA) 2020
Figure 29 Land Use Map at the UCPS Project Site
Natural Degraded Forest
Natural degraded or secondary forest is a combination of native and non-native shrub and tree species that have grown back after land clearing, see Figure 31. Throughout the area, this vegetation can be found in fragments, usually in more steep areas where agriculture or forest cannot grow. This area includes inaccessible cliffs and riverbanks in hillside gaps, and is found along the Cirumamis River between the upper and lower reservoir areas.
LIPI (2012) and Rahmat (2009) recorded at least 376 species of plants belonging to 268 genera and 160 orders in the area of natural forest in UCPS hydropower project site and surrounding areas. From the 160 orders recorded, the dominant orders that make up the forest community include Euphorbiaceae (22 species), Moraceae (21 species), Meliaceae (15 types), and Fabaceae (23 species). These areas generally have the highest biodiversity.
Figure 30 Secondary Natural Forest in the Lower UCPS Watershed Area
Production forest
The state production forest (see Figure 32) in the area around the project is managed by the state forestry company on Java (Perhutani) and is dominated by pine and mahogany trees, with the ground cover in the form of grass. The production forest in the area around the project is a habitat for many natural fauna. Local people take advantage of pine trees for their sap.
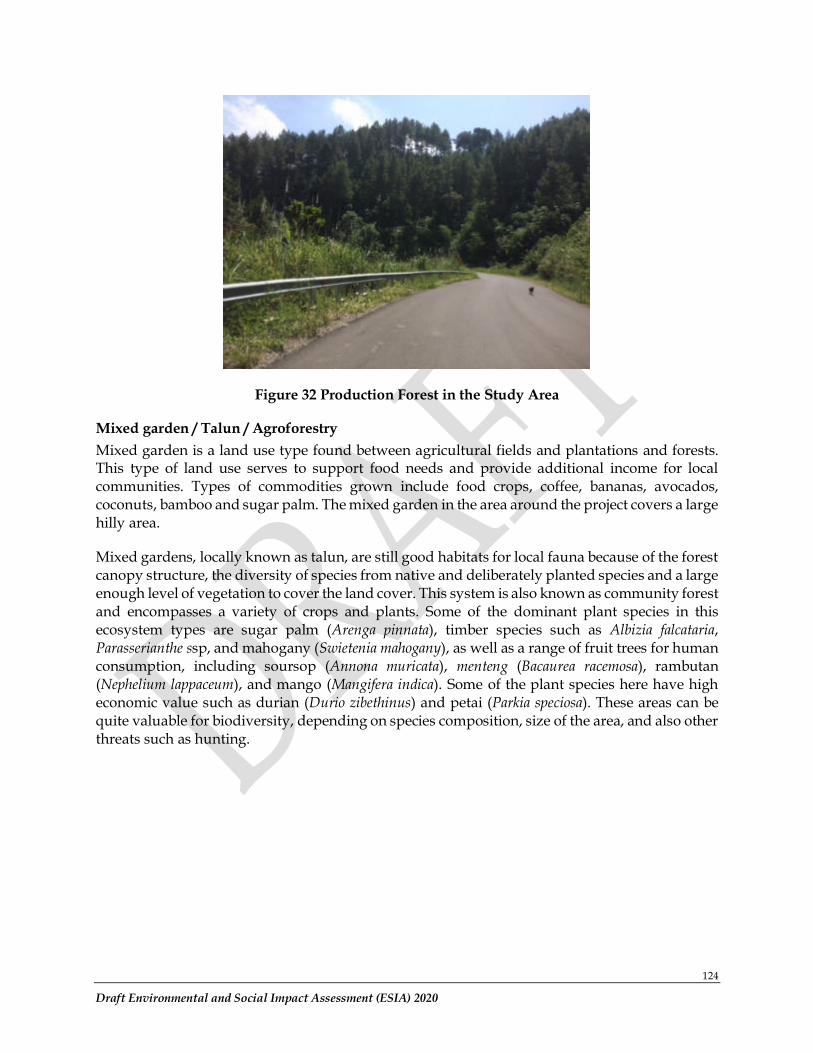
124
Draft Environmental and Social Impact Assessment (ESIA) 2020
Figure 32 Production Forest in the Study Area
Mixed garden / Talun / Agroforestry
Mixed garden is a land use type found between agricultural fields and plantations and forests. This type of land use serves to support food needs and provide additional income for local communities. Types of commodities grown include food crops, coffee, bananas, avocados, coconuts, bamboo and sugar palm. The mixed garden in the area around the project covers a large hilly area.
Mixed gardens, locally known as talun, are still good habitats for local fauna because of the forest canopy structure, the diversity of species from native and deliberately planted species and a large enough level of vegetation to cover the land cover. This system is also known as community forest and encompasses a variety of crops and plants. Some of the dominant plant species in this ecosystem types are sugar palm (Arenga pinnata), timber species such as Albizia falcataria, Parasserianthe ssp, and mahogany (Swietenia mahogany), as well as a range of fruit trees for human consumption, including soursop (Annona muricata), menteng (Bacaurea racemosa), rambutan (Nephelium lappaceum), and mango (Mangifera indica). Some of the plant species here have high economic value such as durian (Durio zibethinus) and petai (Parkia speciosa). These areas can be quite valuable for biodiversity, depending on species composition, size of the area, and also other threats such as hunting.
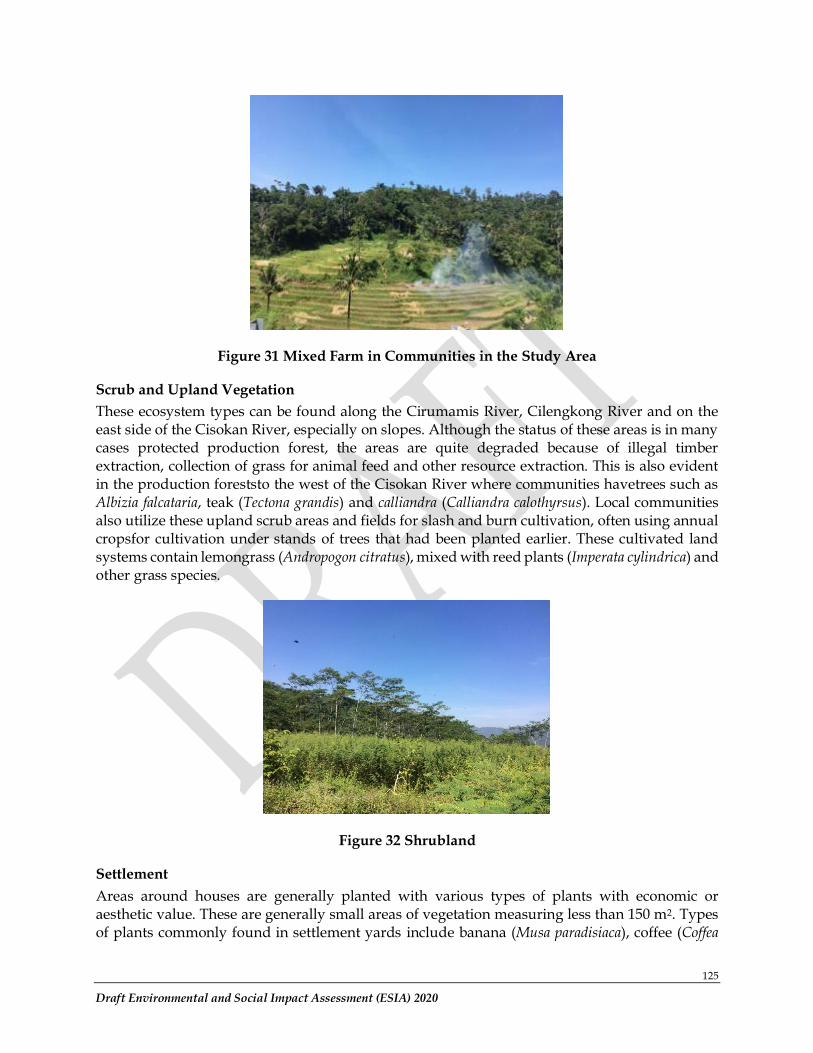
125
Draft Environmental and Social Impact Assessment (ESIA) 2020
Figure 31 Mixed Farm in Communities in the Study Area
Scrub and Upland Vegetation
These ecosystem types can be found along the Cirumamis River, Cilengkong River and on the east side of the Cisokan River, especially on slopes. Although the status of these areas is in many cases protected production forest, the areas are quite degraded because of illegal timber extraction, collection of grass for animal feed and other resource extraction. This is also evident in the production foreststo the west of the Cisokan River where communities havetrees such as Albizia falcataria, teak (Tectona grandis) and calliandra (Calliandra calothyrsus). Local communities also utilize these upland scrub areas and fields for slash and burn cultivation, often using annual cropsfor cultivation under stands of trees that had been planted earlier. These cultivated land systems contain lemongrass (Andropogon citratus), mixed with reed plants (Imperata cylindrica) and other grass species.
Figure 32 Shrubland
Settlement
Areas around houses are generally planted with various types of plants with economic or aesthetic value. These are generally small areas of vegetation measuring less than 150 m2. Types of plants commonly found in settlement yards include banana (Musa paradisiaca), coffee (Coffea
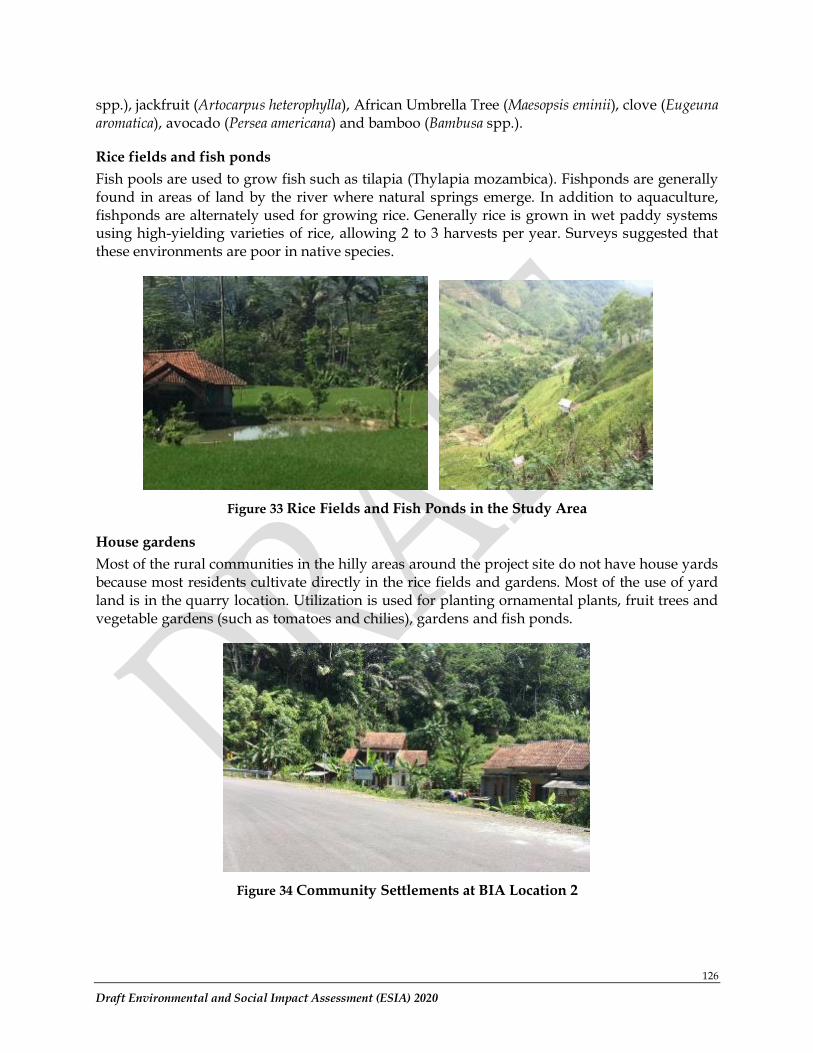
126
Draft Environmental and Social Impact Assessment (ESIA) 2020
spp.), jackfruit (Artocarpus heterophylla), African Umbrella Tree (Maesopsis eminii), clove (Eugeuna aromatica), avocado (Persea americana) and bamboo (Bambusa spp.).
Rice fields and fish ponds
Fish pools are used to grow fish such as tilapia (Thylapia mozambica). Fishponds are generally found in areas of land by the river where natural springs emerge. In addition to aquaculture, fishponds are alternately used for growing rice. Generally rice is grown in wet paddy systems using high-yielding varieties of rice, allowing 2 to 3 harvests per year. Surveys suggested that these environments are poor in native species.
Figure 33 Rice Fields and Fish Ponds in the Study Area
House gardens
Most of the rural communities in the hilly areas around the project site do not have house yards because most residents cultivate directly in the rice fields and gardens. Most of the use of yard land is in the quarry location. Utilization is used for planting ornamental plants, fruit trees and vegetable gardens (such as tomatoes and chilies), gardens and fish ponds.
Figure 34 Community Settlements at BIA Location 2
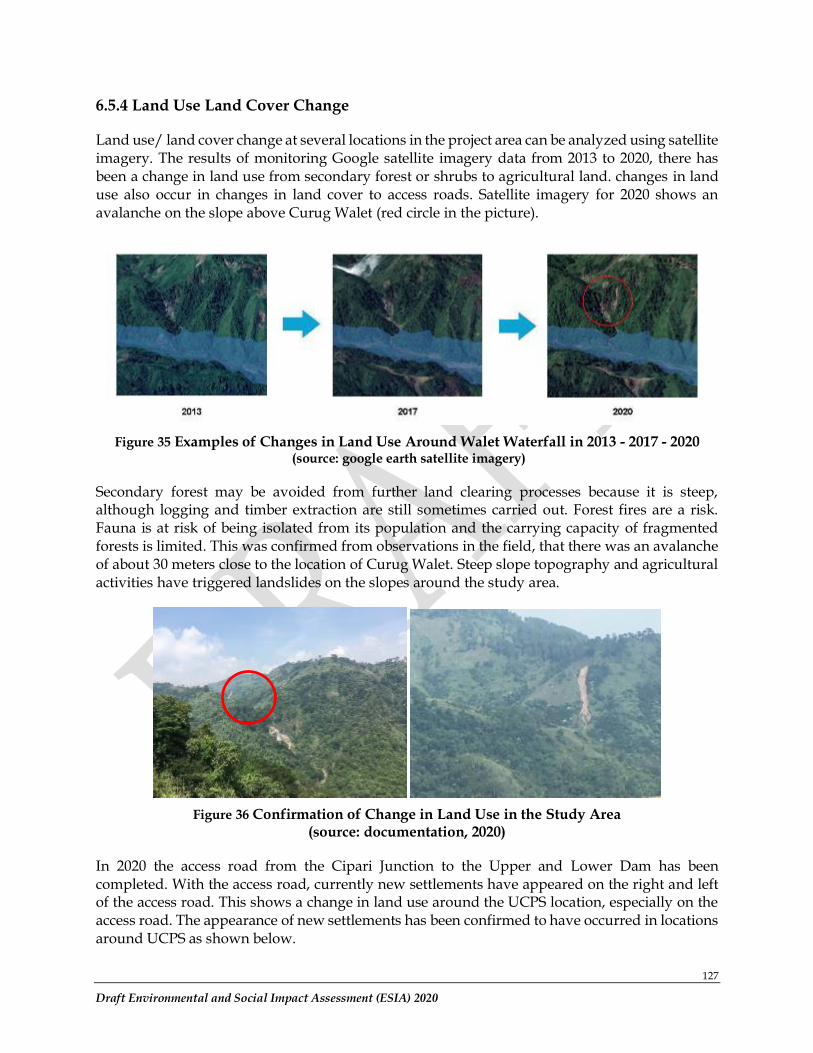
127
Draft Environmental and Social Impact Assessment (ESIA) 2020
6.5.4 Land Use Land Cover Change
Land use/ land cover change at several locations in the project area can be analyzed using satellite imagery. The results of monitoring Google satellite imagery data from 2013 to 2020, there has been a change in land use from secondary forest or shrubs to agricultural land. changes in land use also occur in changes in land cover to access roads. Satellite imagery for 2020 shows an avalanche on the slope above Curug Walet (red circle in the picture).
Figure 35 Examples of Changes in Land Use Around Walet Waterfall in 2013 - 2017 - 2020 (source: google earth satellite imagery)
Secondary forest may be avoided from further land clearing processes because it is steep, although logging and timber extraction are still sometimes carried out. Forest fires are a risk. Fauna is at risk of being isolated from its population and the carrying capacity of fragmented forests is limited. This was confirmed from observations in the field, that there was an avalanche of about 30 meters close to the location of Curug Walet. Steep slope topography and agricultural activities have triggered landslides on the slopes around the study area.
Figure 36 Confirmation of Change in Land Use in the Study Area (source: documentation, 2020)
In 2020 the access road from the Cipari Junction to the Upper and Lower Dam has been completed. With the access road, currently new settlements have appeared on the right and left of the access road. This shows a change in land use around the UCPS location, especially on the access road. The appearance of new settlements has been confirmed to have occurred in locations around UCPS as shown below.
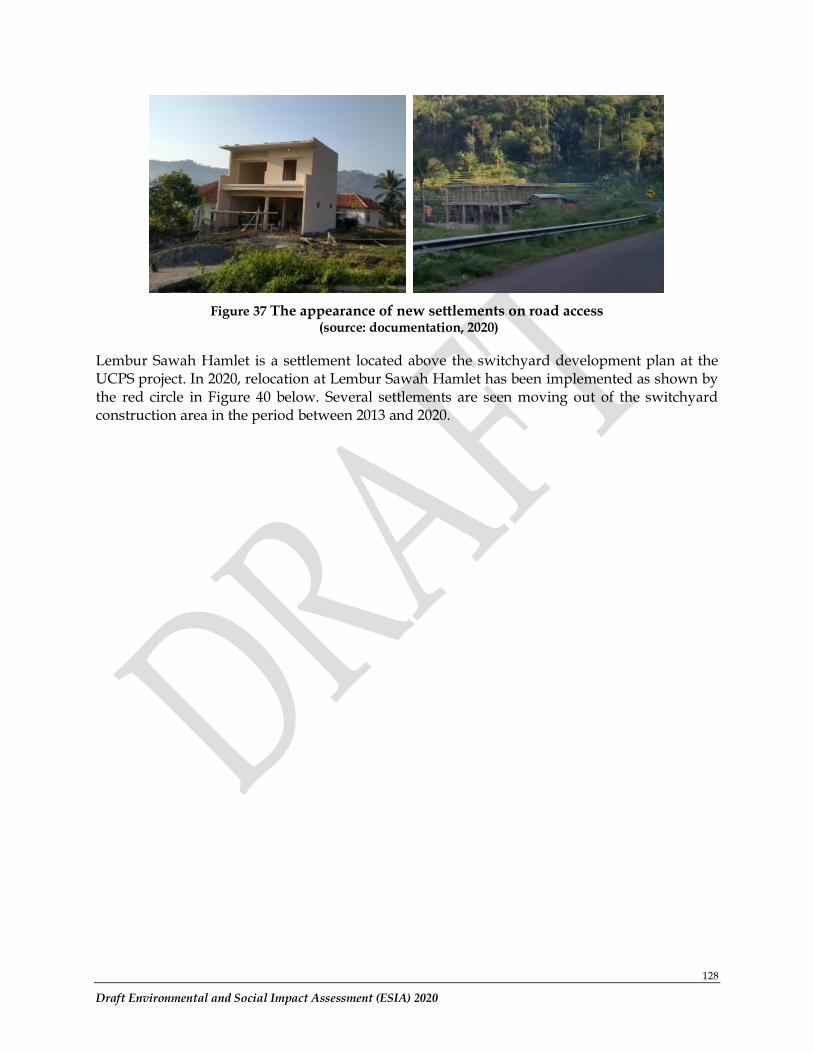
128
Draft Environmental and Social Impact Assessment (ESIA) 2020
Figure 37 The appearance of new settlements on road access (source: documentation, 2020)
Lembur Sawah Hamlet is a settlement located above the switchyard development plan at the UCPS project. In 2020, relocation at Lembur Sawah Hamlet has been implemented as shown by the red circle in Figure 40 below. Several settlements are seen moving out of the switchyard construction area in the period between 2013 and 2020.
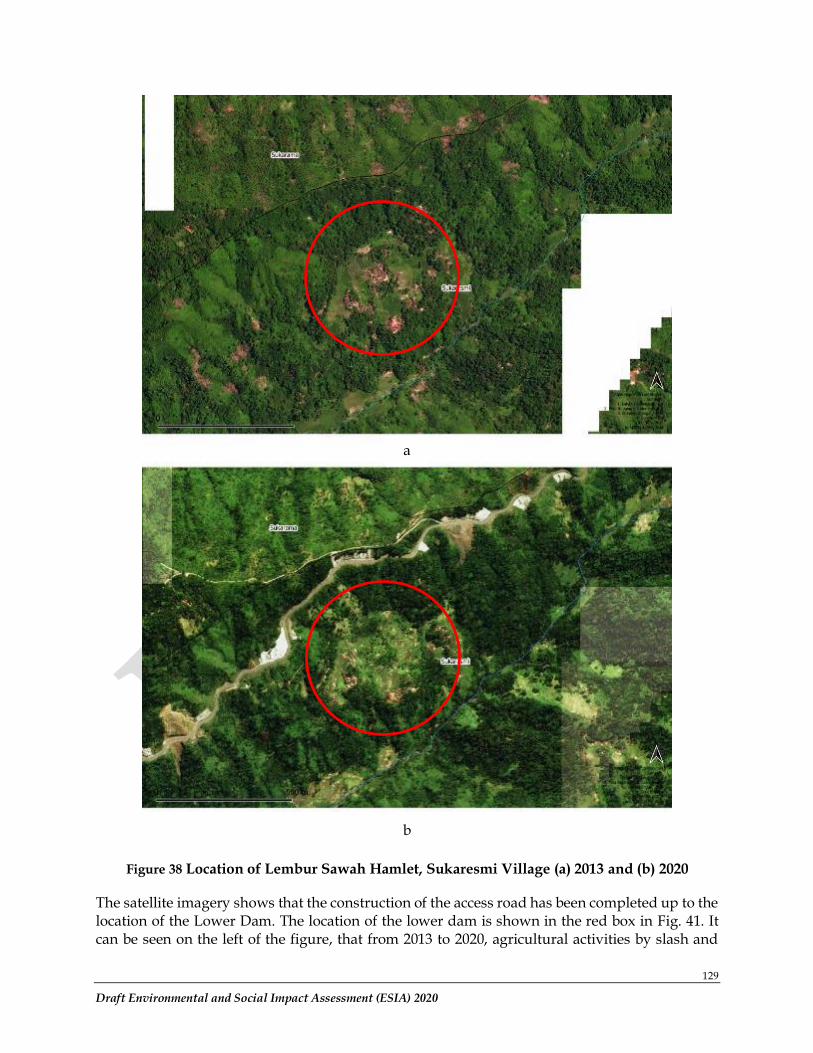
129
Draft Environmental and Social Impact Assessment (ESIA) 2020
Figure 38 Location of Lembur Sawah Hamlet, Sukaresmi Village (a) 2013 and (b) 2020
The satellite imagery shows that the construction of the access road has been completed up to the location of the Lower Dam. The location of the lower dam is shown in the red box in Fig. 41. It can be seen on the left of the figure, that from 2013 to 2020, agricultural activities by slash and
a
b
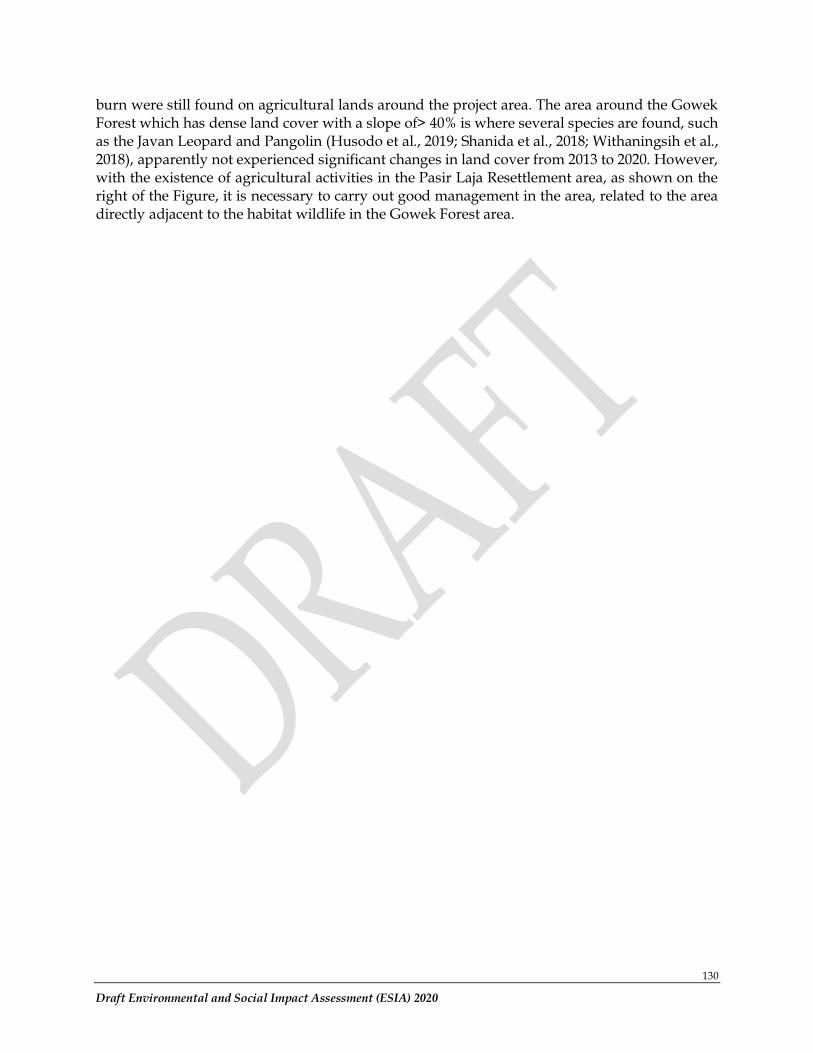
130
Draft Environmental and Social Impact Assessment (ESIA) 2020
burn were still found on agricultural lands around the project area. The area around the Gowek Forest which has dense land cover with a slope of> 40% is where several species are found, such as the Javan Leopard and Pangolin (Husodo et al., 2019; Shanida et al., 2018; Withaningsih et al., 2018), apparently not experienced significant changes in land cover from 2013 to 2020. However, with the existence of agricultural activities in the Pasir Laja Resettlement area, as shown on the right of the Figure, it is necessary to carry out good management in the area, related to the area directly adjacent to the habitat wildlife in the Gowek Forest area.
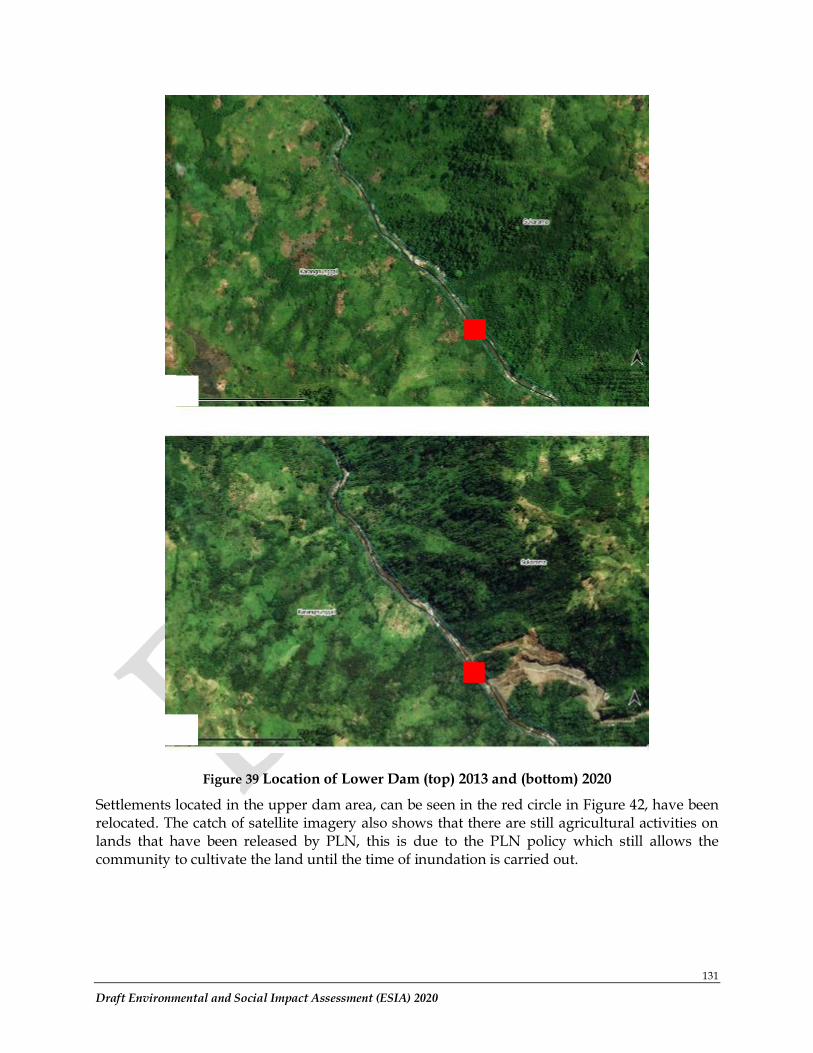
131
Draft Environmental and Social Impact Assessment (ESIA) 2020
Figure 39 Location of Lower Dam (top) 2013 and (bottom) 2020
Settlements located in the upper dam area, can be seen in the red circle in Figure 42, have been relocated. The catch of satellite imagery also shows that there are still agricultural activities on lands that have been released by PLN, this is due to the PLN policy which still allows the community to cultivate the land until the time of inundation is carried out.
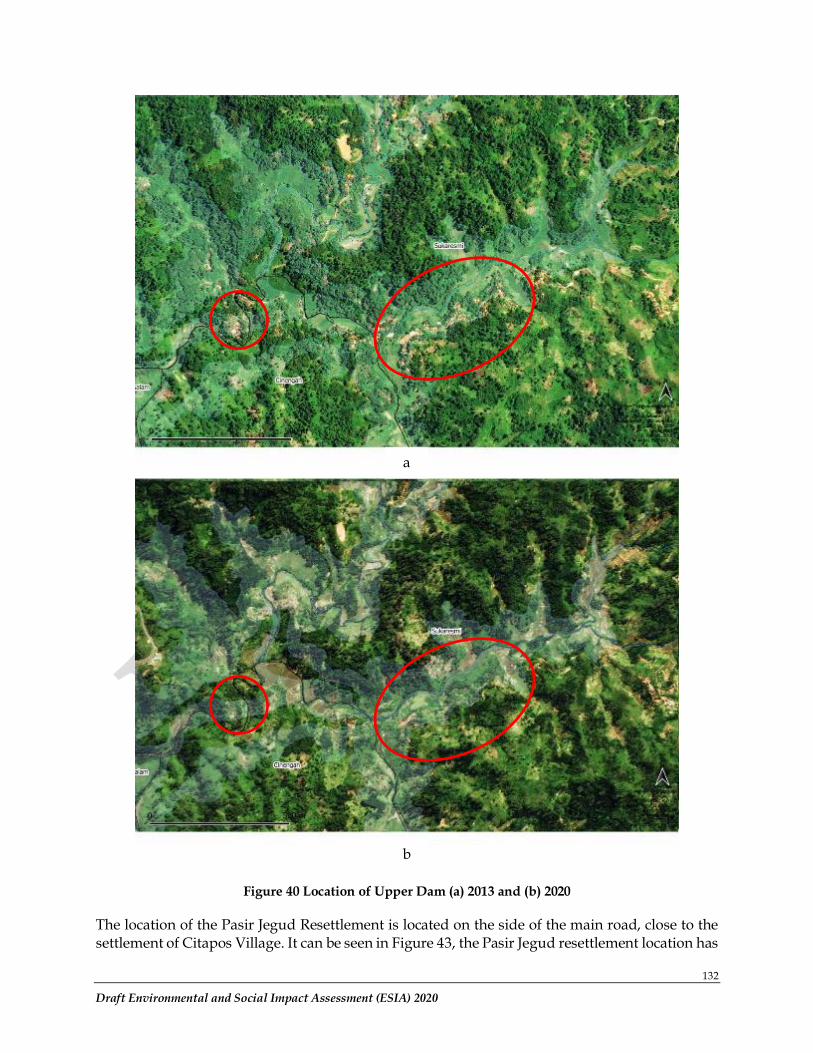
132
Draft Environmental and Social Impact Assessment (ESIA) 2020
Figure 40 Location of Upper Dam (a) 2013 and (b) 2020
The location of the Pasir Jegud Resettlement is located on the side of the main road, close to the settlement of Citapos Village. It can be seen in Figure 43, the Pasir Jegud resettlement location has
a
b
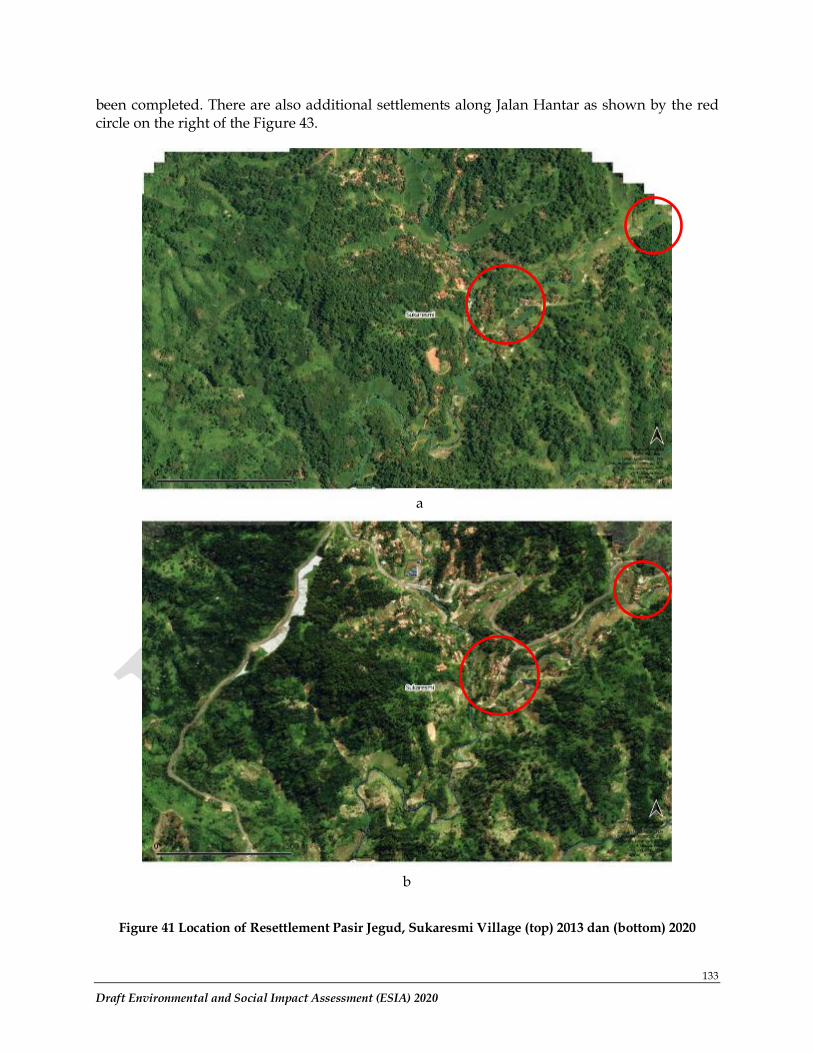
133
Draft Environmental and Social Impact Assessment (ESIA) 2020
been completed. There are also additional settlements along Jalan Hantar as shown by the red circle on the right of the Figure 43.
Figure 41 Location of Resettlement Pasir Jegud, Sukaresmi Village (top) 2013 dan (bottom) 2020
a
b
134
Draft Environmental and Social Impact Assessment (ESIA) 2020
The location of the Pasir Laja resettlement can be seen in the captured satellite imagery that has been completed. Kampung Pasir Laja is equipped with an access road from acces road which is on the ridge on the border of Cianjur Regency and West Bandung Regency. The location of the Pasir Laja Resettlement in 2013 was a limited agricultural land area with two houses. However, some of these land areas belong to several communities in Lembur Sawah Village. Relocation due to the UCPS project, made the community occupy the Pasir Laja area as a place to live. Satellite imagery captured in 2020 shows agricultural activities in the Pasir Laja area leading to the Gowek Forest area.
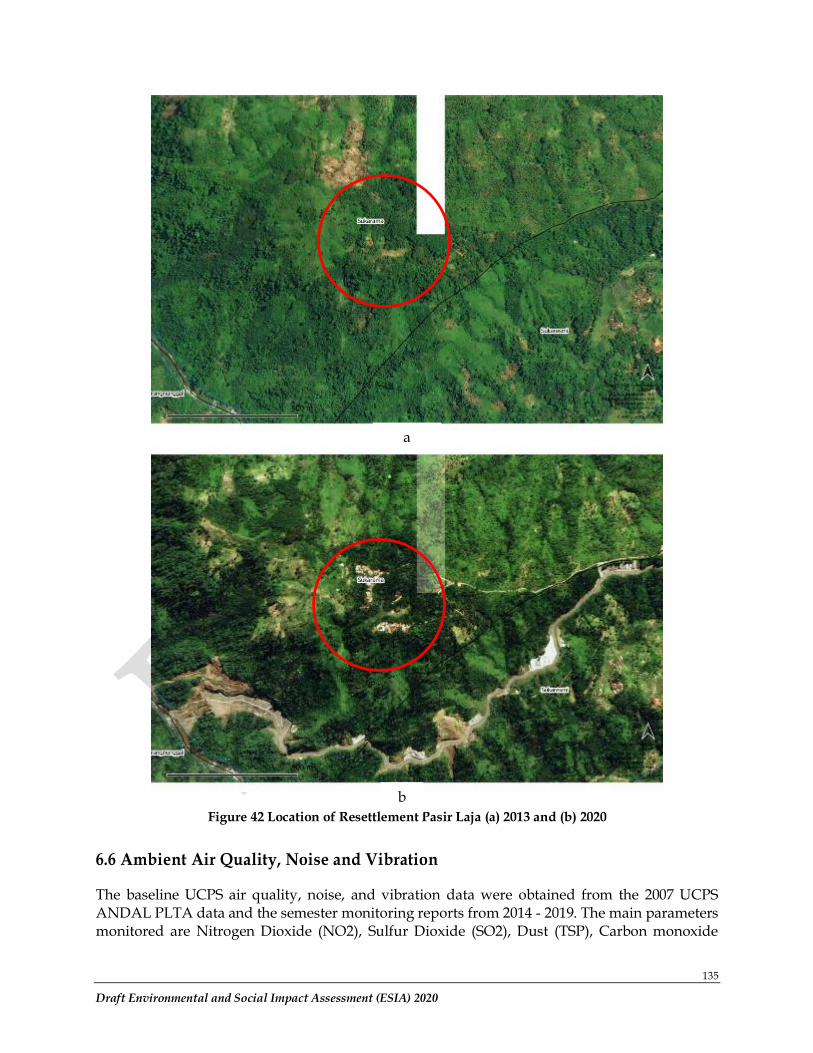
135
Draft Environmental and Social Impact Assessment (ESIA) 2020
Figure 42 Location of Resettlement Pasir Laja (a) 2013 and (b) 2020
6.6 Ambient Air Quality, Noise and Vibration
The baseline UCPS air quality, noise, and vibration data were obtained from the 2007 UCPS ANDAL PLTA data and the semester monitoring reports from 2014 - 2019. The main parameters monitored are Nitrogen Dioxide (NO2), Sulfur Dioxide (SO2), Dust (TSP), Carbon monoxide
a
b
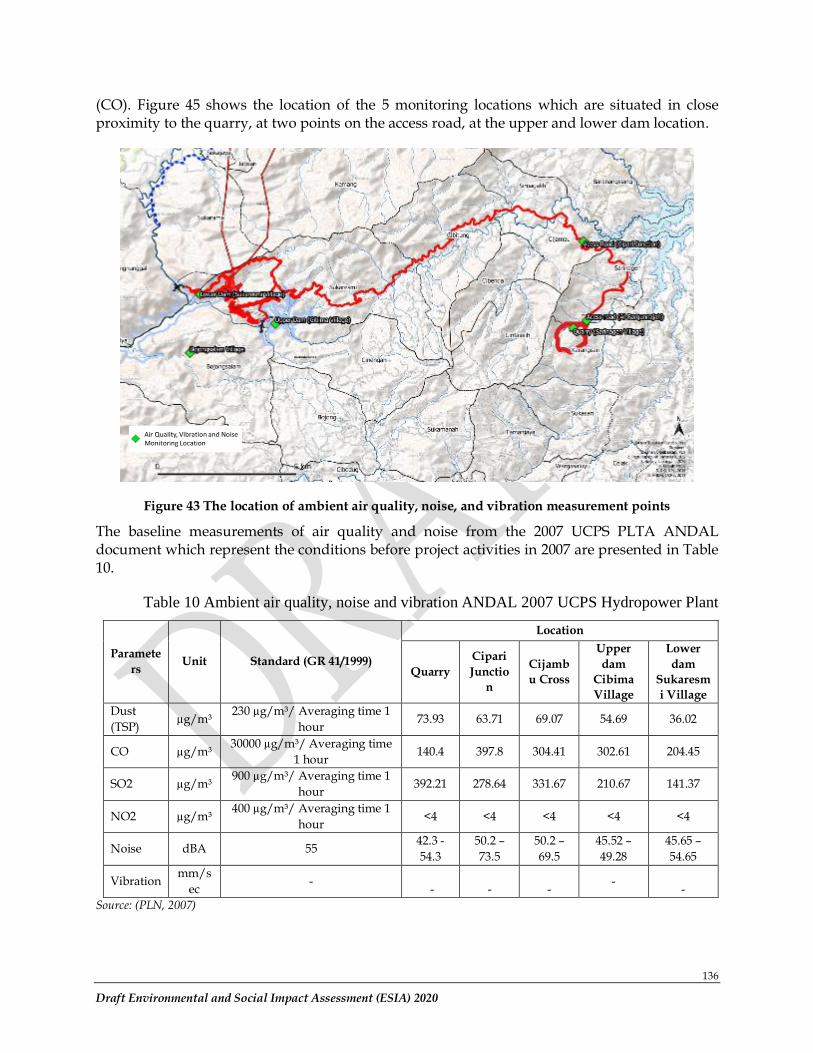
136
Draft Environmental and Social Impact Assessment (ESIA) 2020
(CO). Figure 45 shows the location of the 5 monitoring locations which are situated in close proximity to the quarry, at two points on the access road, at the upper and lower dam location.
Figure 43 The location of ambient air quality, noise, and vibration measurement points
The baseline measurements of air quality and noise from the 2007 UCPS PLTA ANDAL document which represent the conditions before project activities in 2007 are presented in Table 10.
Table 10 Ambient air quality, noise and vibration ANDAL 2007 UCPS Hydropower Plant
Paramete
rs Unit Standard (GR 41/1999)
Location
Quarry
Cipari
Junctio
n
Cijamb
u Cross
Upper
dam
Cibima
Village
Lower
dam
Sukaresm
i Village
Dust
(TSP) µg/m³
230 µg/m³/ Averaging time 1
hour 73.93 63.71 69.07 54.69 36.02
CO µg/m³ 30000 µg/m³/ Averaging time
1 hour 140.4 397.8 304.41 302.61 204.45
SO2 µg/m³ 900 µg/m³/ Averaging time 1
hour 392.21 278.64 331.67 210.67 141.37
NO2 µg/m³ 400 µg/m³/ Averaging time 1
hour <4 <4 <4 <4 <4
Noise dBA 55 42.3 -
54.3
50.2 –
73.5
50.2 –
69.5
45.52 –
49.28
45.65 –
54.65
Vibration mm/s
ec -
- - - -
-
Source: (PLN, 2007)
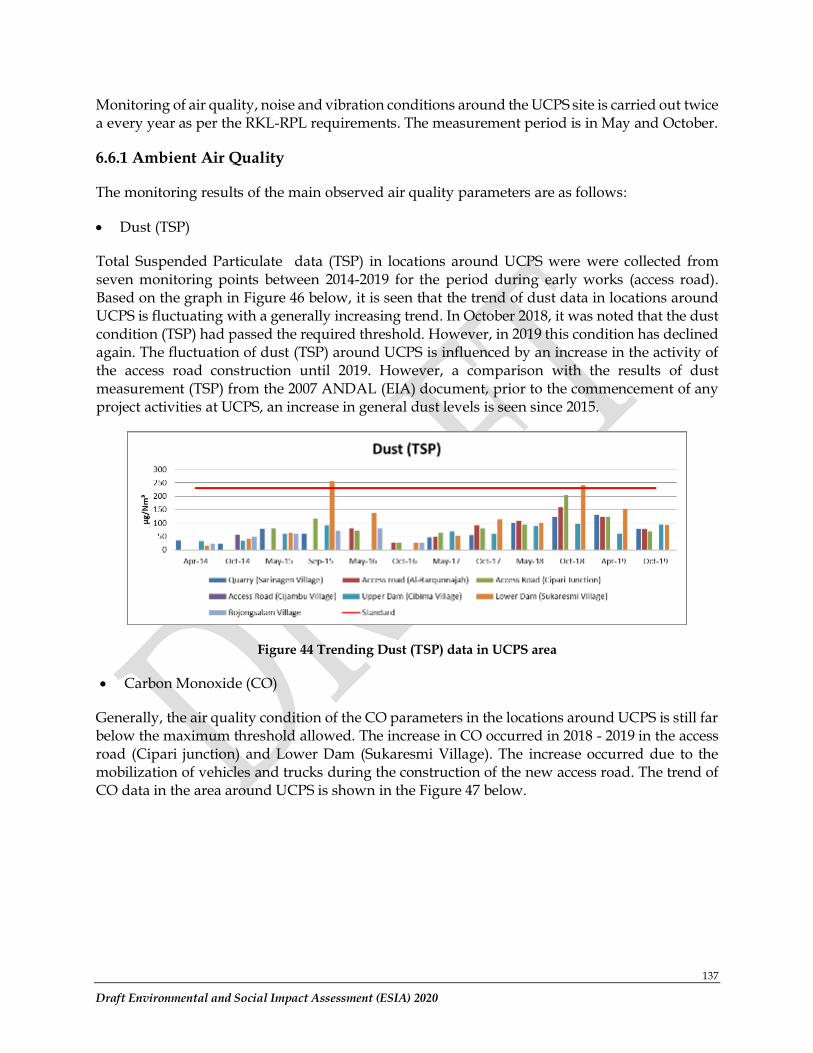
137
Draft Environmental and Social Impact Assessment (ESIA) 2020
Monitoring of air quality, noise and vibration conditions around the UCPS site is carried out twice a every year as per the RKL-RPL requirements. The measurement period is in May and October.
6.6.1 Ambient Air Quality
The monitoring results of the main observed air quality parameters are as follows:
• Dust (TSP)
Total Suspended Particulate data (TSP) in locations around UCPS were were collected from seven monitoring points between 2014-2019 for the period during early works (access road). Based on the graph in Figure 46 below, it is seen that the trend of dust data in locations around UCPS is fluctuating with a generally increasing trend. In October 2018, it was noted that the dust condition (TSP) had passed the required threshold. However, in 2019 this condition has declined again. The fluctuation of dust (TSP) around UCPS is influenced by an increase in the activity of the access road construction until 2019. However, a comparison with the results of dust measurement (TSP) from the 2007 ANDAL (EIA) document, prior to the commencement of any project activities at UCPS, an increase in general dust levels is seen since 2015.
Figure 44 Trending Dust (TSP) data in UCPS area
• Carbon Monoxide (CO)
Generally, the air quality condition of the CO parameters in the locations around UCPS is still far below the maximum threshold allowed. The increase in CO occurred in 2018 - 2019 in the access road (Cipari junction) and Lower Dam (Sukaresmi Village). The increase occurred due to the mobilization of vehicles and trucks during the construction of the new access road. The trend of CO data in the area around UCPS is shown in the Figure 47 below.
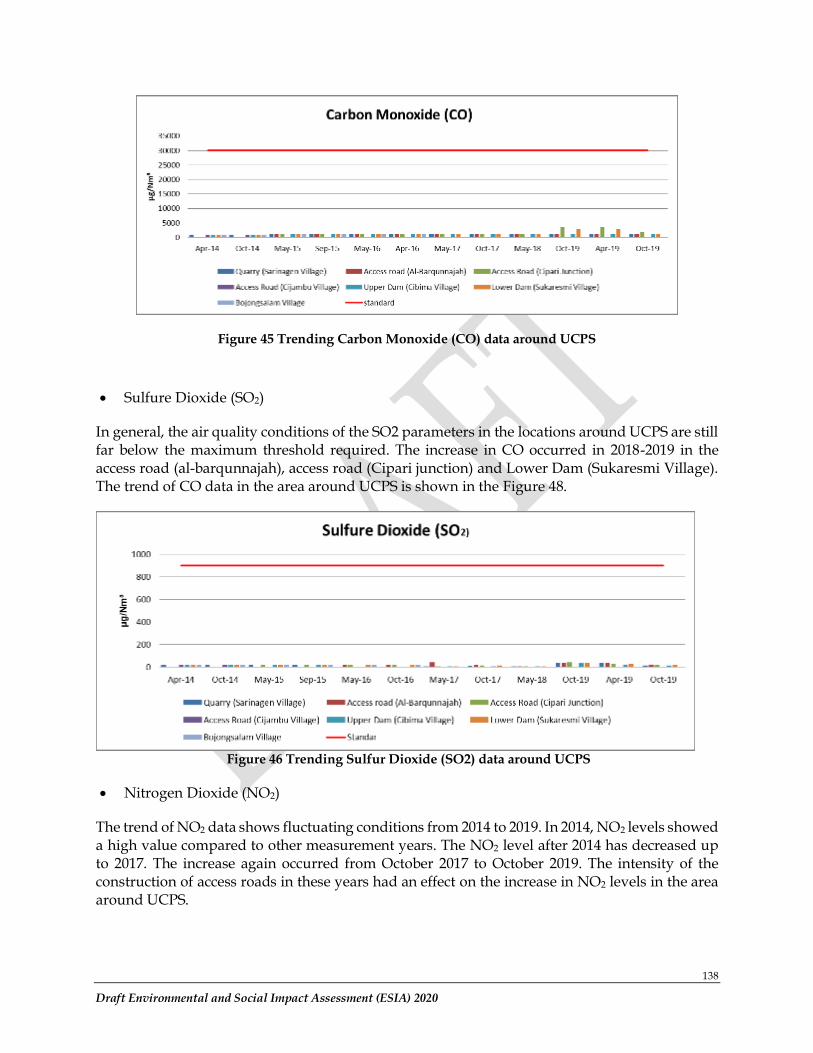
138
Draft Environmental and Social Impact Assessment (ESIA) 2020
Figure 45 Trending Carbon Monoxide (CO) data around UCPS
• Sulfure Dioxide (SO2)
In general, the air quality conditions of the SO2 parameters in the locations around UCPS are still far below the maximum threshold required. The increase in CO occurred in 2018-2019 in the access road (al-barqunnajah), access road (Cipari junction) and Lower Dam (Sukaresmi Village). The trend of CO data in the area around UCPS is shown in the Figure 48.
Figure 46 Trending Sulfur Dioxide (SO2) data around UCPS
• Nitrogen Dioxide (NO2)
The trend of NO2 data shows fluctuating conditions from 2014 to 2019. In 2014, NO2 levels showed a high value compared to other measurement years. The NO2 level after 2014 has decreased up to 2017. The increase again occurred from October 2017 to October 2019. The intensity of the construction of access roads in these years had an effect on the increase in NO2 levels in the area around UCPS.
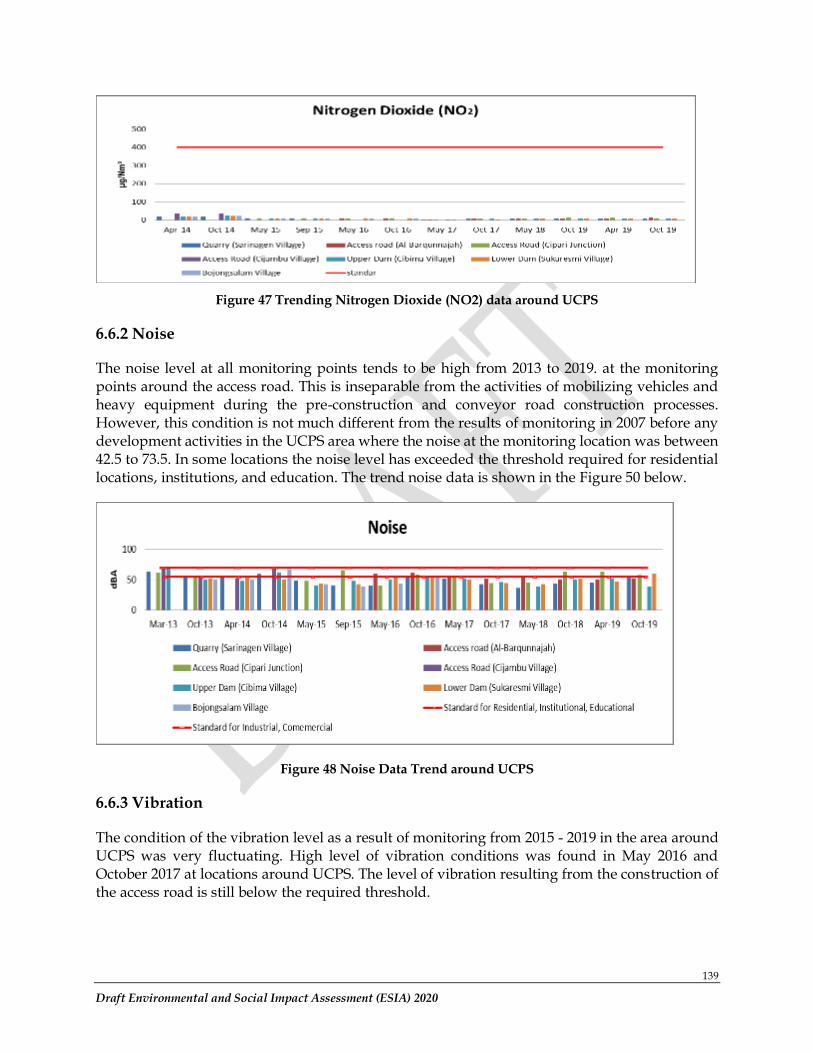
139
Draft Environmental and Social Impact Assessment (ESIA) 2020
Figure 47 Trending Nitrogen Dioxide (NO2) data around UCPS
6.6.2 Noise
The noise level at all monitoring points tends to be high from 2013 to 2019. at the monitoring points around the access road. This is inseparable from the activities of mobilizing vehicles and heavy equipment during the pre-construction and conveyor road construction processes. However, this condition is not much different from the results of monitoring in 2007 before any development activities in the UCPS area where the noise at the monitoring location was between 42.5 to 73.5. In some locations the noise level has exceeded the threshold required for residential locations, institutions, and education. The trend noise data is shown in the Figure 50 below.
Figure 48 Noise Data Trend around UCPS
6.6.3 Vibration
The condition of the vibration level as a result of monitoring from 2015 - 2019 in the area around UCPS was very fluctuating. High level of vibration conditions was found in May 2016 and October 2017 at locations around UCPS. The level of vibration resulting from the construction of the access road is still below the required threshold.
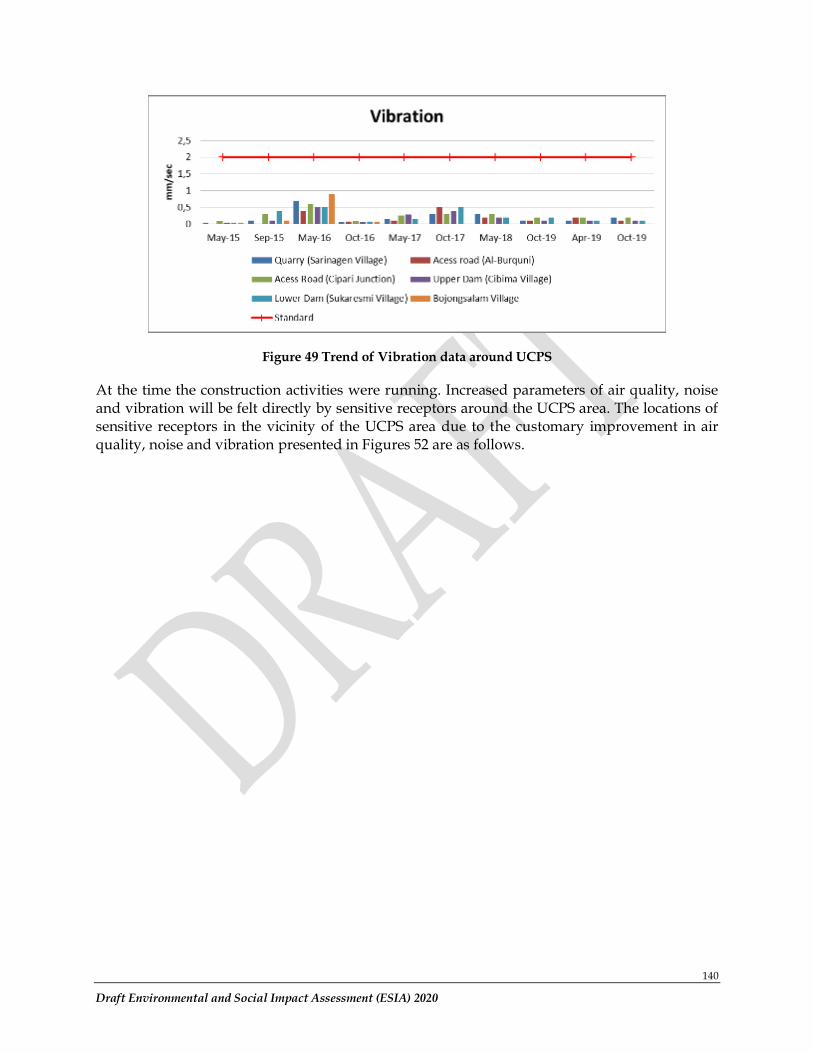
140
Draft Environmental and Social Impact Assessment (ESIA) 2020
Figure 49 Trend of Vibration data around UCPS
At the time the construction activities were running. Increased parameters of air quality, noise and vibration will be felt directly by sensitive receptors around the UCPS area. The locations of sensitive receptors in the vicinity of the UCPS area due to the customary improvement in air quality, noise and vibration presented in Figures 52 are as follows.
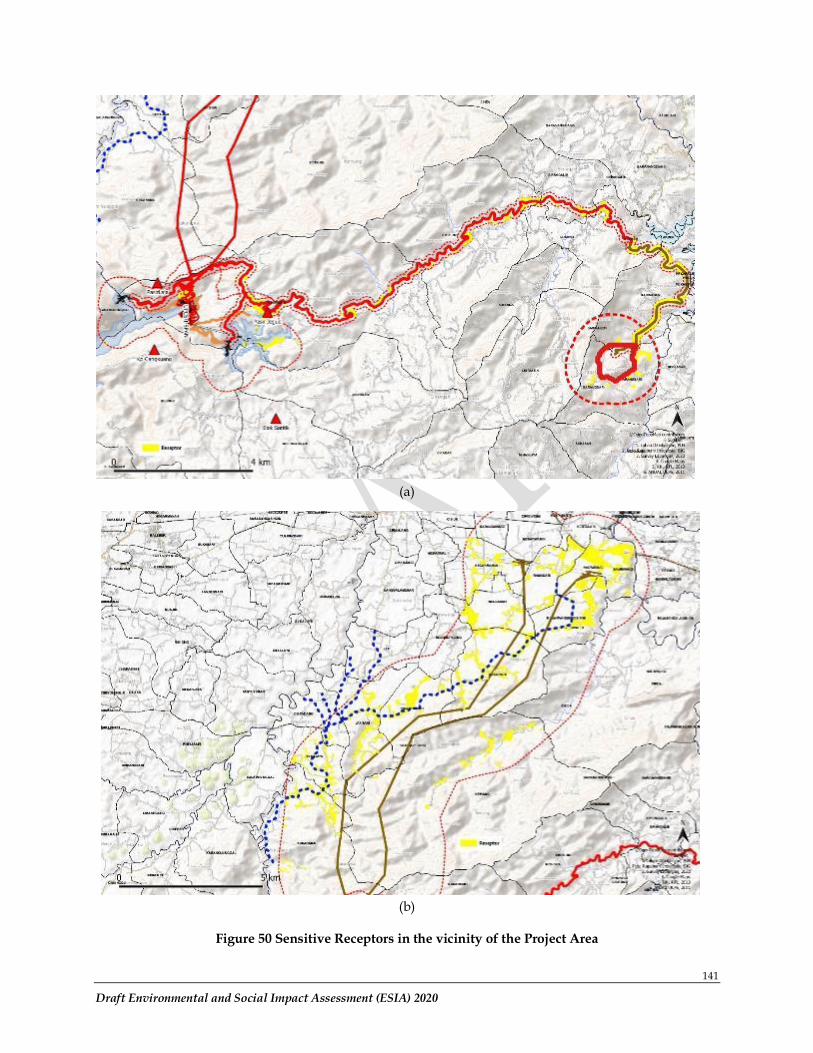
141
Draft Environmental and Social Impact Assessment (ESIA) 2020
(a)
(b)
Figure 50 Sensitive Receptors in the vicinity of the Project Area
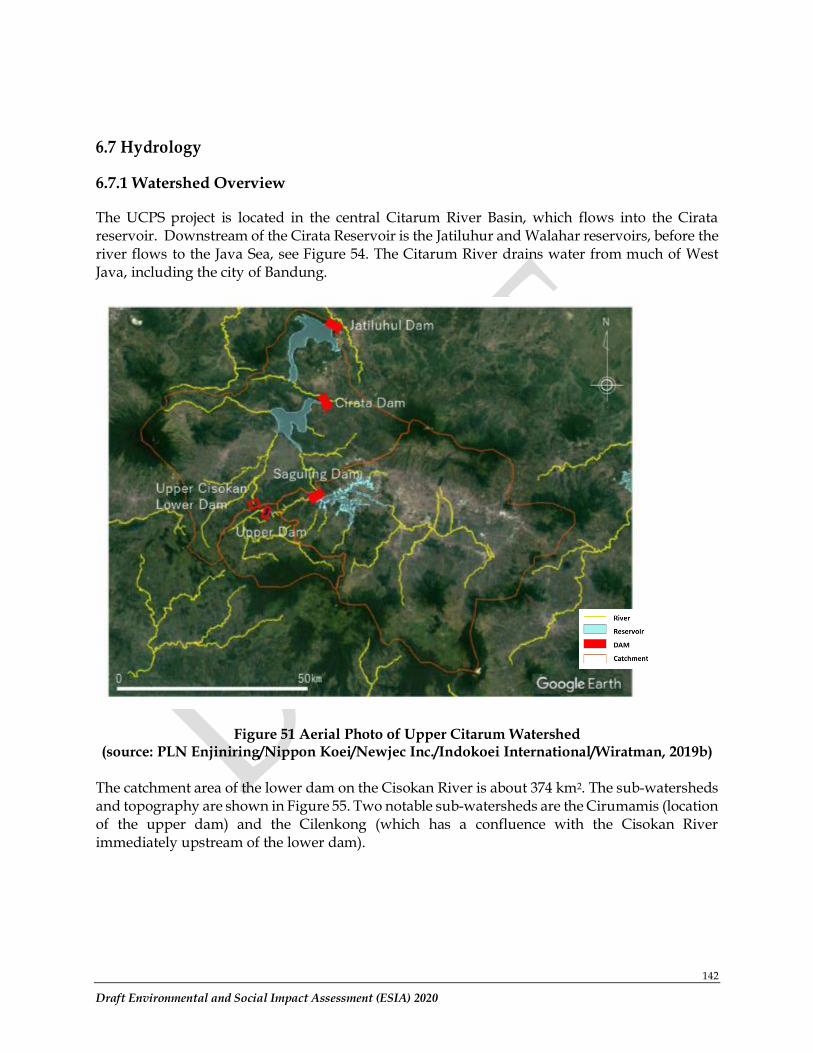
142
Draft Environmental and Social Impact Assessment (ESIA) 2020
6.7 Hydrology
6.7.1 Watershed Overview
The UCPS project is located in the central Citarum River Basin, which flows into the Cirata reservoir. Downstream of the Cirata Reservoir is the Jatiluhur and Walahar reservoirs, before the river flows to the Java Sea, see Figure 54. The Citarum River drains water from much of West Java, including the city of Bandung.
Figure 51 Aerial Photo of Upper Citarum Watershed (source: PLN Enjiniring/Nippon Koei/Newjec Inc./Indokoei International/Wiratman, 2019b)
The catchment area of the lower dam on the Cisokan River is about 374 km2. The sub-watersheds and topography are shown in Figure 55. Two notable sub-watersheds are the Cirumamis (location of the upper dam) and the Cilenkong (which has a confluence with the Cisokan River immediately upstream of the lower dam).
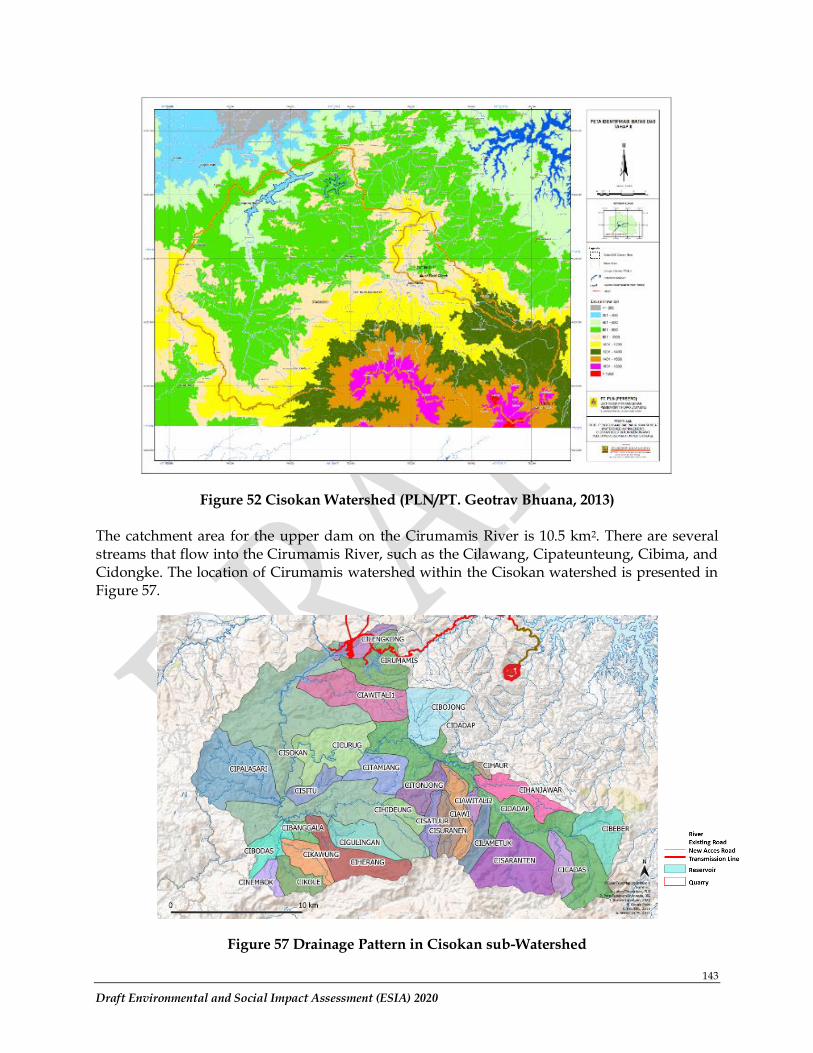
143
Draft Environmental and Social Impact Assessment (ESIA) 2020
Figure 52 Cisokan Watershed (PLN/PT. Geotrav Bhuana, 2013)
The catchment area for the upper dam on the Cirumamis River is 10.5 km2. There are several streams that flow into the Cirumamis River, such as the Cilawang, Cipateunteung, Cibima, and Cidongke. The location of Cirumamis watershed within the Cisokan watershed is presented in Figure 57.
Figure 57 Drainage Pattern in Cisokan sub-Watershed
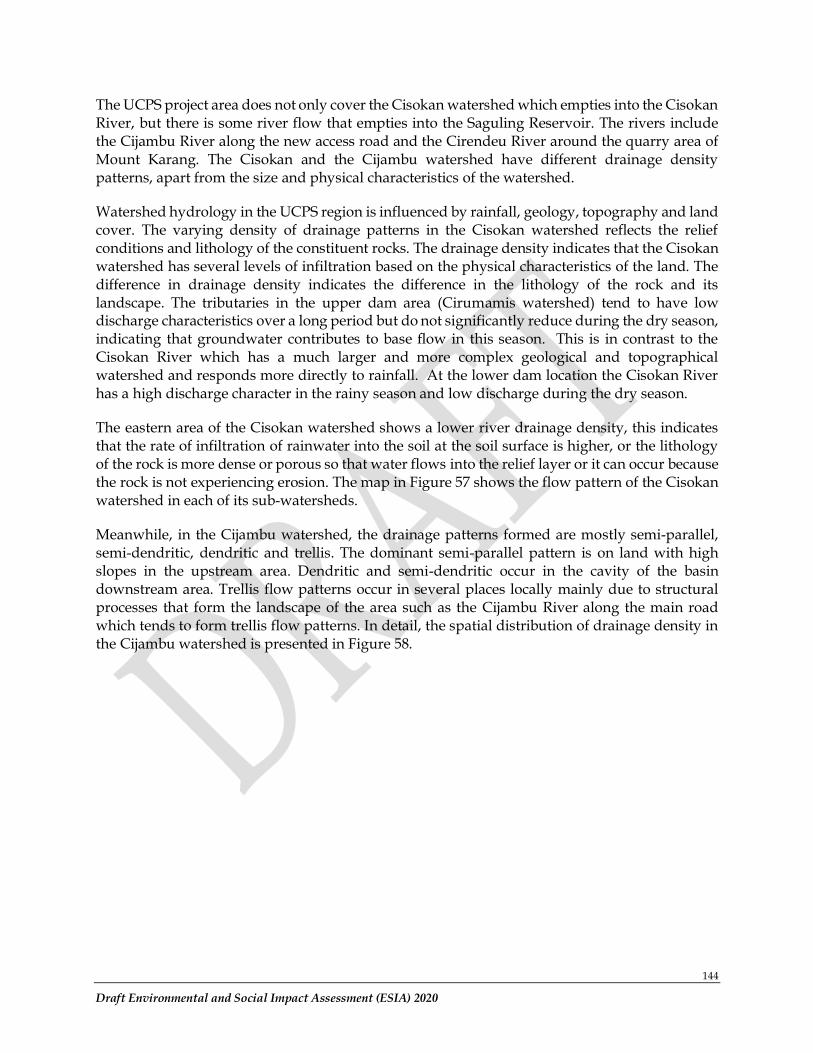
144
Draft Environmental and Social Impact Assessment (ESIA) 2020
The UCPS project area does not only cover the Cisokan watershed which empties into the Cisokan River, but there is some river flow that empties into the Saguling Reservoir. The rivers include the Cijambu River along the new access road and the Cirendeu River around the quarry area of Mount Karang. The Cisokan and the Cijambu watershed have different drainage density patterns, apart from the size and physical characteristics of the watershed.
Watershed hydrology in the UCPS region is influenced by rainfall, geology, topography and land cover. The varying density of drainage patterns in the Cisokan watershed reflects the relief conditions and lithology of the constituent rocks. The drainage density indicates that the Cisokan watershed has several levels of infiltration based on the physical characteristics of the land. The difference in drainage density indicates the difference in the lithology of the rock and its landscape. The tributaries in the upper dam area (Cirumamis watershed) tend to have low discharge characteristics over a long period but do not significantly reduce during the dry season, indicating that groundwater contributes to base flow in this season. This is in contrast to the Cisokan River which has a much larger and more complex geological and topographical watershed and responds more directly to rainfall. At the lower dam location the Cisokan River has a high discharge character in the rainy season and low discharge during the dry season.
The eastern area of the Cisokan watershed shows a lower river drainage density, this indicates that the rate of infiltration of rainwater into the soil at the soil surface is higher, or the lithology of the rock is more dense or porous so that water flows into the relief layer or it can occur because the rock is not experiencing erosion. The map in Figure 57 shows the flow pattern of the Cisokan watershed in each of its sub-watersheds.
Meanwhile, in the Cijambu watershed, the drainage patterns formed are mostly semi-parallel, semi-dendritic, dendritic and trellis. The dominant semi-parallel pattern is on land with high slopes in the upstream area. Dendritic and semi-dendritic occur in the cavity of the basin downstream area. Trellis flow patterns occur in several places locally mainly due to structural processes that form the landscape of the area such as the Cijambu River along the main road which tends to form trellis flow patterns. In detail, the spatial distribution of drainage density in the Cijambu watershed is presented in Figure 58.
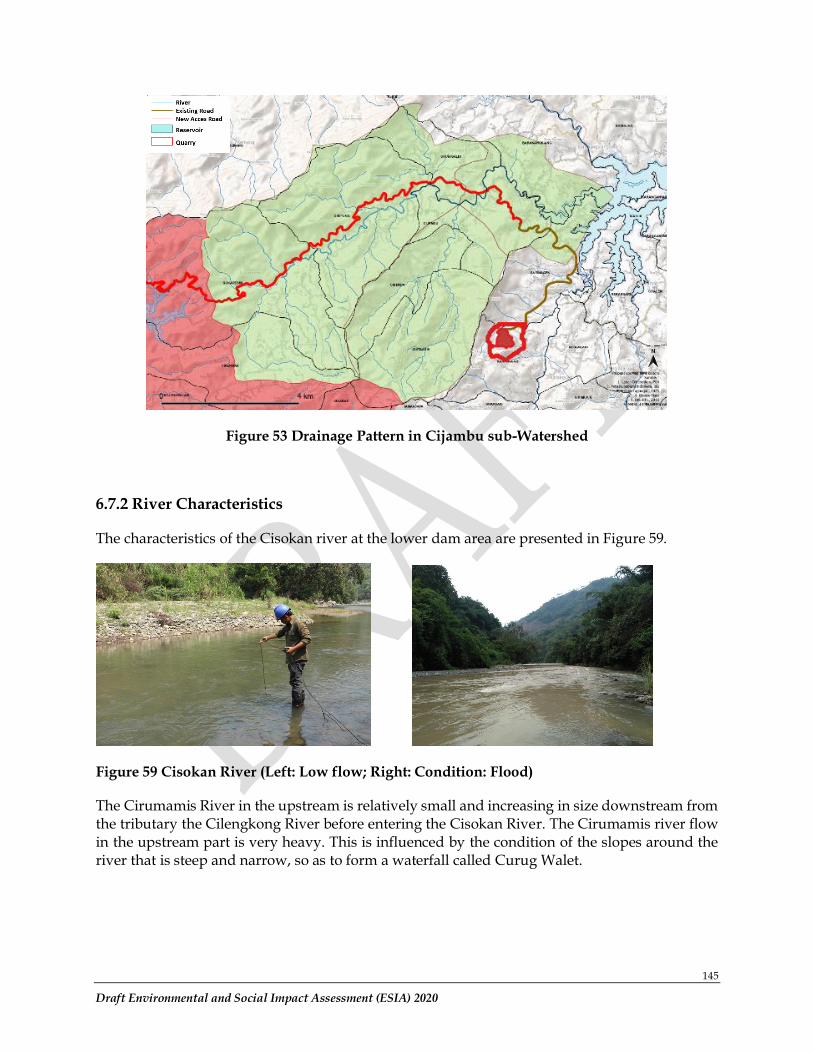
145
Draft Environmental and Social Impact Assessment (ESIA) 2020
Figure 53 Drainage Pattern in Cijambu sub-Watershed
6.7.2 River Characteristics
The characteristics of the Cisokan river at the lower dam area are presented in Figure 59.
Figure 59 Cisokan River (Left: Low flow; Right: Condition: Flood)
The Cirumamis River in the upstream is relatively small and increasing in size downstream from the tributary the Cilengkong River before entering the Cisokan River. The Cirumamis river flow in the upstream part is very heavy. This is influenced by the condition of the slopes around the river that is steep and narrow, so as to form a waterfall called Curug Walet.
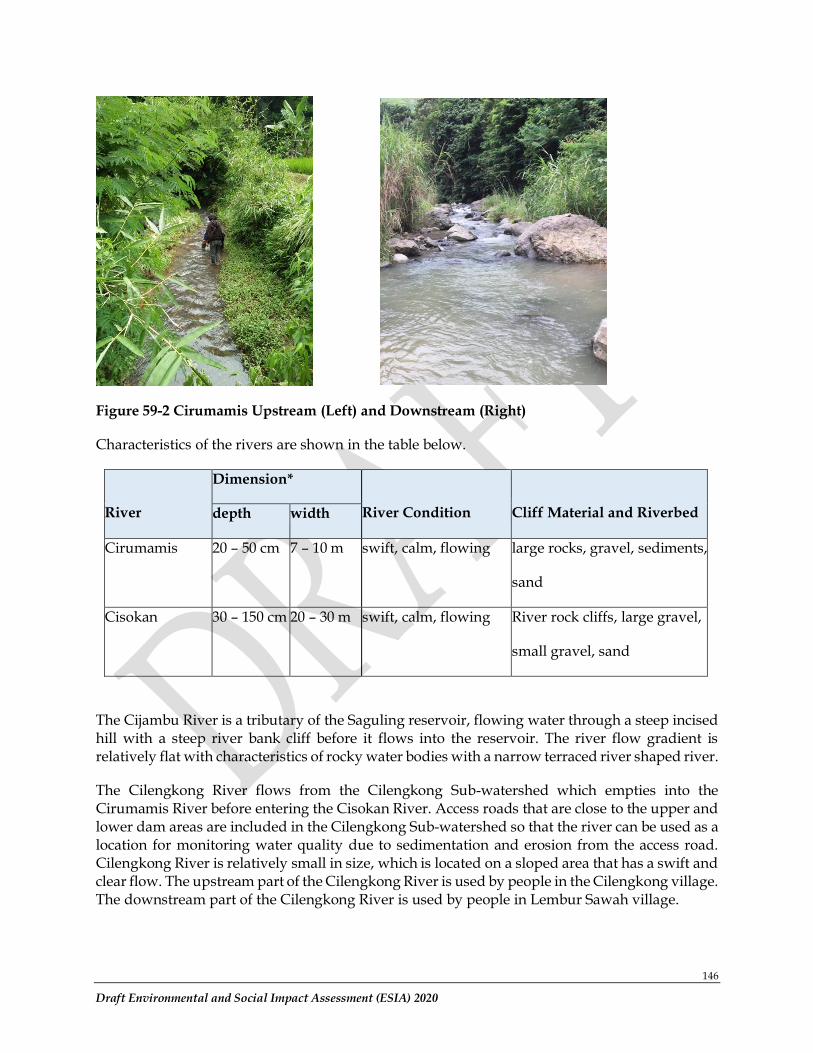
146
Draft Environmental and Social Impact Assessment (ESIA) 2020
Figure 59-2 Cirumamis Upstream (Left) and Downstream (Right)
Characteristics of the rivers are shown in the table below.
River
Dimension*
River Condition
Cliff Material and Riverbed depth width
Cirumamis 20 – 50 cm 7 – 10 m swift, calm, flowing large rocks, gravel, sediments,
sand
Cisokan 30 – 150 cm 20 – 30 m swift, calm, flowing River rock cliffs, large gravel,
small gravel, sand
The Cijambu River is a tributary of the Saguling reservoir, flowing water through a steep incised hill with a steep river bank cliff before it flows into the reservoir. The river flow gradient is relatively flat with characteristics of rocky water bodies with a narrow terraced river shaped river.
The Cilengkong River flows from the Cilengkong Sub-watershed which empties into the Cirumamis River before entering the Cisokan River. Access roads that are close to the upper and lower dam areas are included in the Cilengkong Sub-watershed so that the river can be used as a location for monitoring water quality due to sedimentation and erosion from the access road. Cilengkong River is relatively small in size, which is located on a sloped area that has a swift and clear flow. The upstream part of the Cilengkong River is used by people in the Cilengkong village. The downstream part of the Cilengkong River is used by people in Lembur Sawah village.
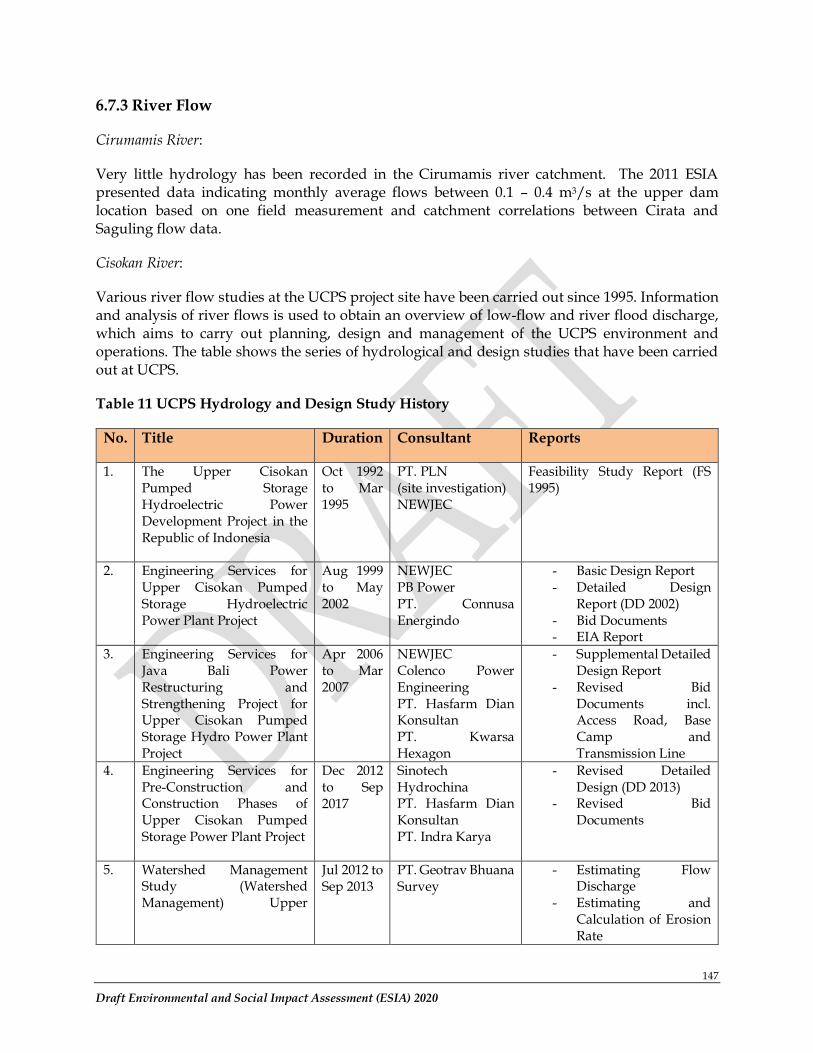
147
Draft Environmental and Social Impact Assessment (ESIA) 2020
6.7.3 River Flow
Cirumamis River:
Very little hydrology has been recorded in the Cirumamis river catchment. The 2011 ESIA presented data indicating monthly average flows between 0.1 – 0.4 m3/s at the upper dam location based on one field measurement and catchment correlations between Cirata and Saguling flow data.
Cisokan River:
Various river flow studies at the UCPS project site have been carried out since 1995. Information and analysis of river flows is used to obtain an overview of low-flow and river flood discharge, which aims to carry out planning, design and management of the UCPS environment and operations. The table shows the series of hydrological and design studies that have been carried out at UCPS.
Table 11 UCPS Hydrology and Design Study History
No. Title Duration Consultant Reports
1. The Upper Cisokan Pumped Storage Hydroelectric Power Development Project in the Republic of Indonesia
Oct 1992 to Mar 1995
PT. PLN (site investigation) NEWJEC
Feasibility Study Report (FS 1995)
2. Engineering Services for Upper Cisokan Pumped Storage Hydroelectric Power Plant Project
Aug 1999 to May 2002
NEWJEC PB Power PT. Connusa Energindo
- Basic Design Report - Detailed Design
Report (DD 2002) - Bid Documents - EIA Report
3. Engineering Services for Java Bali Power Restructuring and Strengthening Project for Upper Cisokan Pumped Storage Hydro Power Plant Project
Apr 2006 to Mar 2007
NEWJEC Colenco Power Engineering PT. Hasfarm Dian Konsultan PT. Kwarsa Hexagon
- Supplemental Detailed Design Report
- Revised Bid Documents incl. Access Road, Base Camp and Transmission Line
4. Engineering Services for Pre-Construction and Construction Phases of Upper Cisokan Pumped Storage Power Plant Project
Dec 2012 to Sep 2017
Sinotech Hydrochina PT. Hasfarm Dian Konsultan PT. Indra Karya
- Revised Detailed Design (DD 2013)
- Revised Bid Documents
5. Watershed Management Study (Watershed Management) Upper
Jul 2012 to Sep 2013
PT. Geotrav Bhuana Survey
- Estimating Flow Discharge
- Estimating and Calculation of Erosion Rate
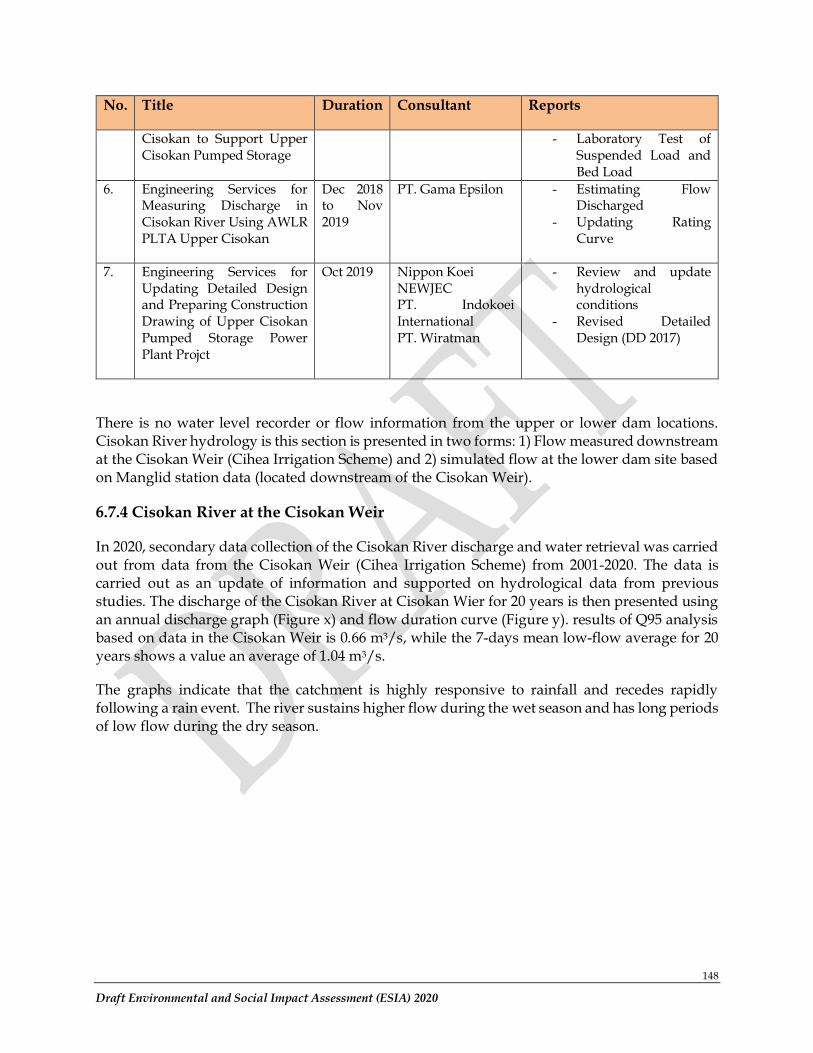
148
Draft Environmental and Social Impact Assessment (ESIA) 2020
No. Title Duration Consultant Reports
Cisokan to Support Upper Cisokan Pumped Storage
- Laboratory Test of Suspended Load and Bed Load
6. Engineering Services for Measuring Discharge in Cisokan River Using AWLR PLTA Upper Cisokan
Dec 2018 to Nov 2019
PT. Gama Epsilon - Estimating Flow Discharged
- Updating Rating Curve
7. Engineering Services for Updating Detailed Design and Preparing Construction Drawing of Upper Cisokan Pumped Storage Power Plant Projct
Oct 2019 Nippon Koei NEWJEC PT. Indokoei International PT. Wiratman
- Review and update hydrological conditions
- Revised Detailed Design (DD 2017)
There is no water level recorder or flow information from the upper or lower dam locations. Cisokan River hydrology is this section is presented in two forms: 1) Flow measured downstream at the Cisokan Weir (Cihea Irrigation Scheme) and 2) simulated flow at the lower dam site based on Manglid station data (located downstream of the Cisokan Weir).
6.7.4 Cisokan River at the Cisokan Weir
In 2020, secondary data collection of the Cisokan River discharge and water retrieval was carried out from data from the Cisokan Weir (Cihea Irrigation Scheme) from 2001-2020. The data is carried out as an update of information and supported on hydrological data from previous studies. The discharge of the Cisokan River at Cisokan Wier for 20 years is then presented using an annual discharge graph (Figure x) and flow duration curve (Figure y). results of Q95 analysis based on data in the Cisokan Weir is 0.66 m3/s, while the 7-days mean low-flow average for 20 years shows a value an average of 1.04 m3/s.
The graphs indicate that the catchment is highly responsive to rainfall and recedes rapidly following a rain event. The river sustains higher flow during the wet season and has long periods of low flow during the dry season.
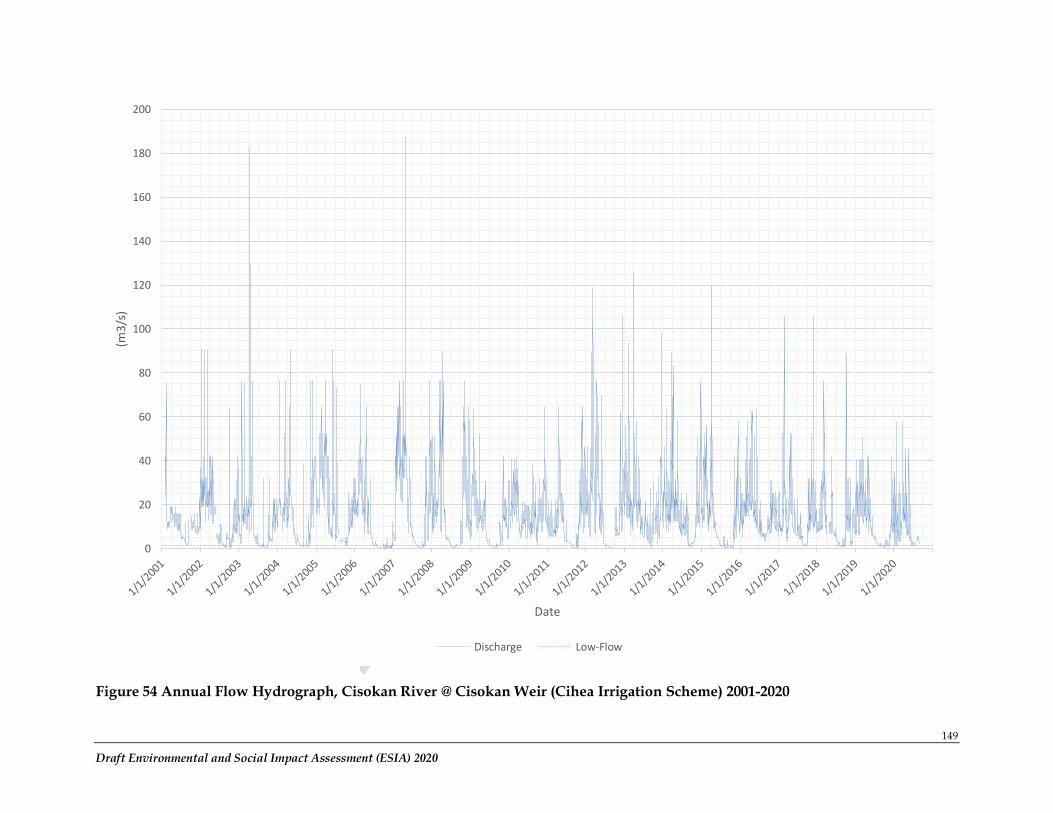
149
Draft Environmental and Social Impact Assessment (ESIA) 2020
Figure 54 Annual Flow Hydrograph, Cisokan River @ Cisokan Weir (Cihea Irrigation Scheme) 2001-2020
0
20
40
60
80
100
120
140
160
180
200(m
3/s
)
Date
Discharge Low-Flow

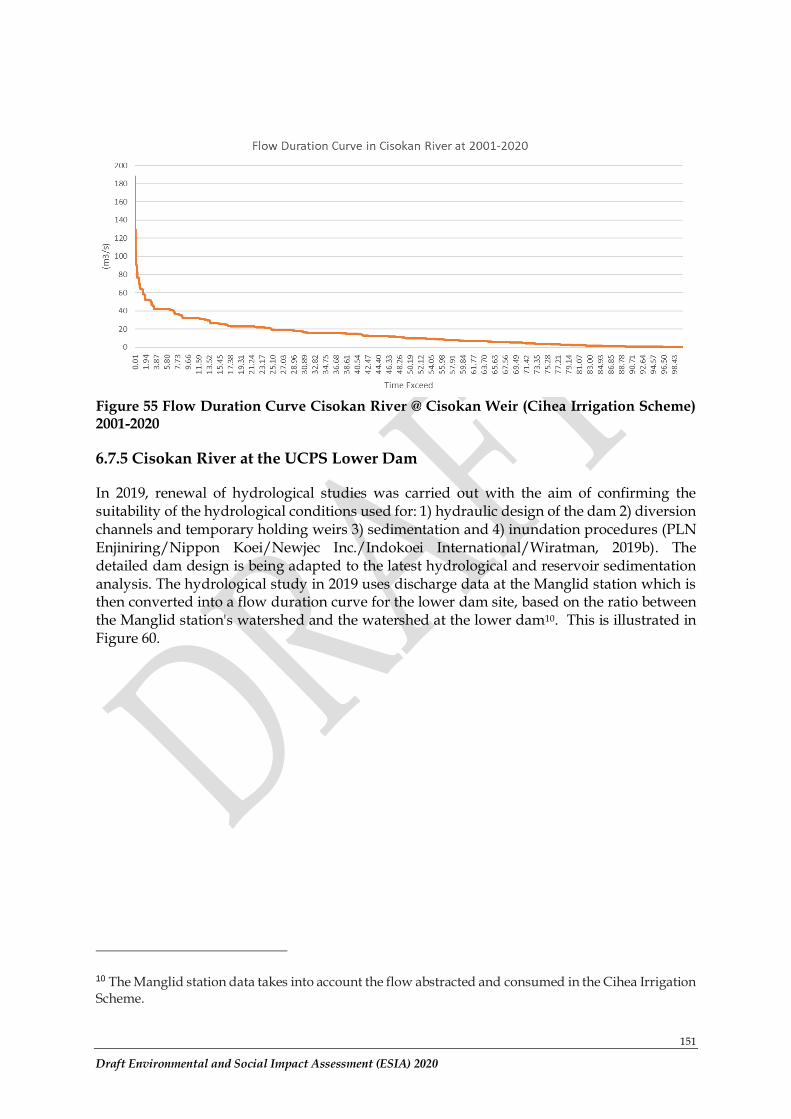
151
Draft Environmental and Social Impact Assessment (ESIA) 2020
Figure 55 Flow Duration Curve Cisokan River @ Cisokan Weir (Cihea Irrigation Scheme) 2001-2020
6.7.5 Cisokan River at the UCPS Lower Dam
In 2019, renewal of hydrological studies was carried out with the aim of confirming the suitability of the hydrological conditions used for: 1) hydraulic design of the dam 2) diversion channels and temporary holding weirs 3) sedimentation and 4) inundation procedures (PLN Enjiniring/Nippon Koei/Newjec Inc./Indokoei International/Wiratman, 2019b). The detailed dam design is being adapted to the latest hydrological and reservoir sedimentation analysis. The hydrological study in 2019 uses discharge data at the Manglid station which is then converted into a flow duration curve for the lower dam site, based on the ratio between the Manglid station's watershed and the watershed at the lower dam10. This is illustrated in Figure 60.
10 The Manglid station data takes into account the flow abstracted and consumed in the Cihea Irrigation Scheme.
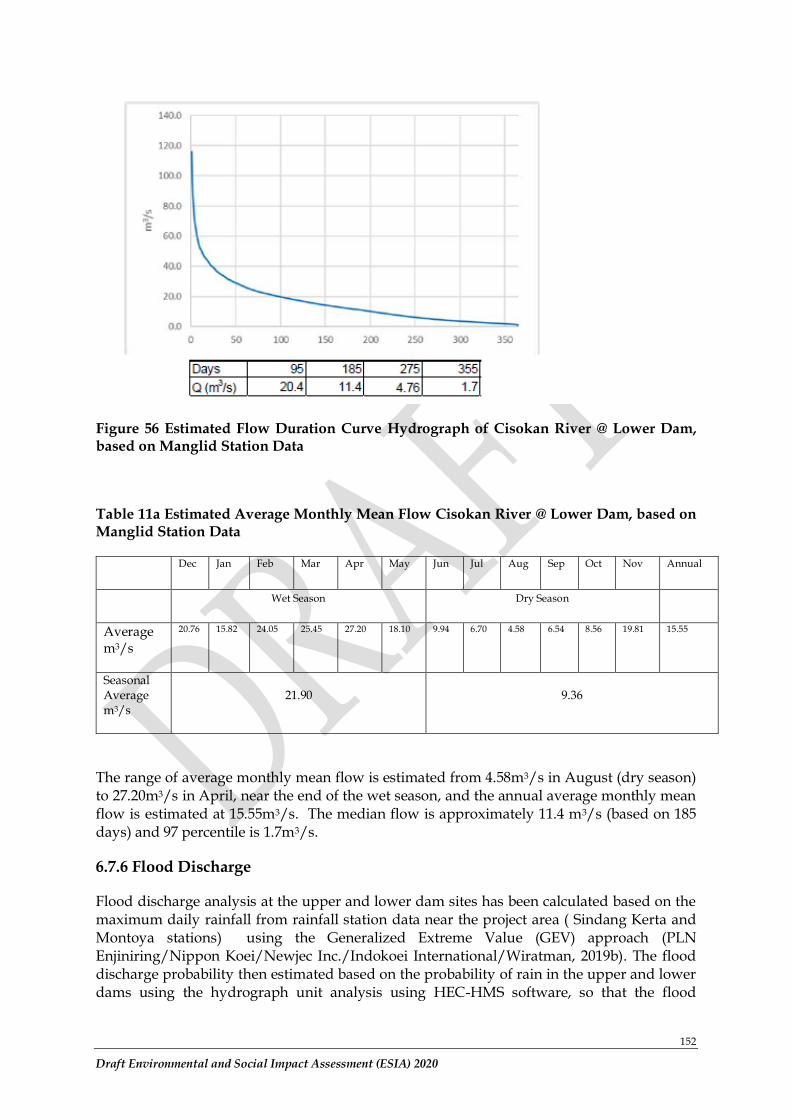
152
Draft Environmental and Social Impact Assessment (ESIA) 2020
Figure 56 Estimated Flow Duration Curve Hydrograph of Cisokan River @ Lower Dam, based on Manglid Station Data
Table 11a Estimated Average Monthly Mean Flow Cisokan River @ Lower Dam, based on Manglid Station Data
Dec Jan Feb Mar Apr May Jun Jul Aug Sep Oct Nov Annual
Wet Season Dry Season
Average m3/s
20.76 15.82 24.05 25.45 27.20 18.10 9.94 6.70 4.58 6.54 8.56 19.81 15.55
Seasonal Average m3/s
21.90 9.36
The range of average monthly mean flow is estimated from 4.58m3/s in August (dry season) to 27.20m3/s in April, near the end of the wet season, and the annual average monthly mean flow is estimated at 15.55m3/s. The median flow is approximately 11.4 m3/s (based on 185 days) and 97 percentile is 1.7m3/s.
6.7.6 Flood Discharge
Flood discharge analysis at the upper and lower dam sites has been calculated based on the maximum daily rainfall from rainfall station data near the project area ( Sindang Kerta and Montoya stations) using the Generalized Extreme Value (GEV) approach (PLN Enjiniring/Nippon Koei/Newjec Inc./Indokoei International/Wiratman, 2019b). The flood discharge probability then estimated based on the probability of rain in the upper and lower dams using the hydrograph unit analysis using HEC-HMS software, so that the flood
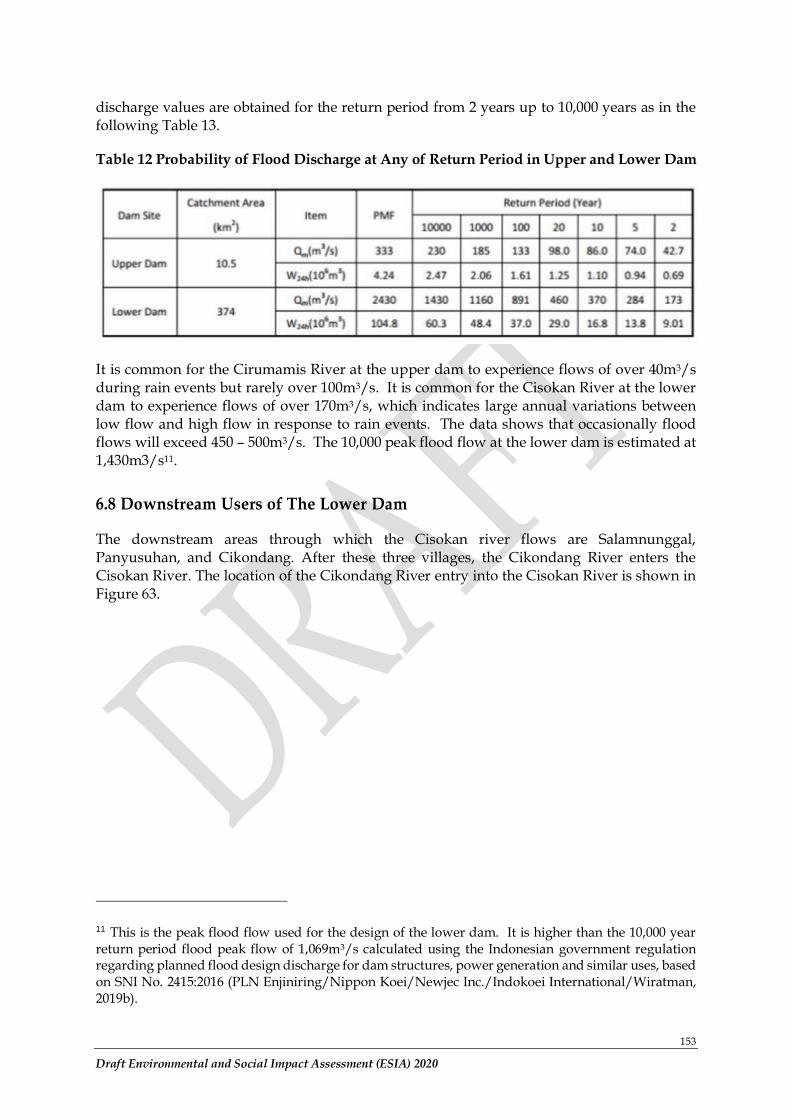
153
Draft Environmental and Social Impact Assessment (ESIA) 2020
discharge values are obtained for the return period from 2 years up to 10,000 years as in the following Table 13.
Table 12 Probability of Flood Discharge at Any of Return Period in Upper and Lower Dam
It is common for the Cirumamis River at the upper dam to experience flows of over 40m3/s during rain events but rarely over 100m3/s. It is common for the Cisokan River at the lower dam to experience flows of over 170m3/s, which indicates large annual variations between low flow and high flow in response to rain events. The data shows that occasionally flood flows will exceed 450 – 500m3/s. The 10,000 peak flood flow at the lower dam is estimated at 1,430m3/s11.
6.8 Downstream Users of The Lower Dam
The downstream areas through which the Cisokan river flows are Salamnunggal, Panyusuhan, and Cikondang. After these three villages, the Cikondang River enters the Cisokan River. The location of the Cikondang River entry into the Cisokan River is shown in Figure 63.
11 This is the peak flood flow used for the design of the lower dam. It is higher than the 10,000 year return period flood peak flow of 1,069m3/s calculated using the Indonesian government regulation regarding planned flood design discharge for dam structures, power generation and similar uses, based on SNI No. 2415:2016 (PLN Enjiniring/Nippon Koei/Newjec Inc./Indokoei International/Wiratman, 2019b).
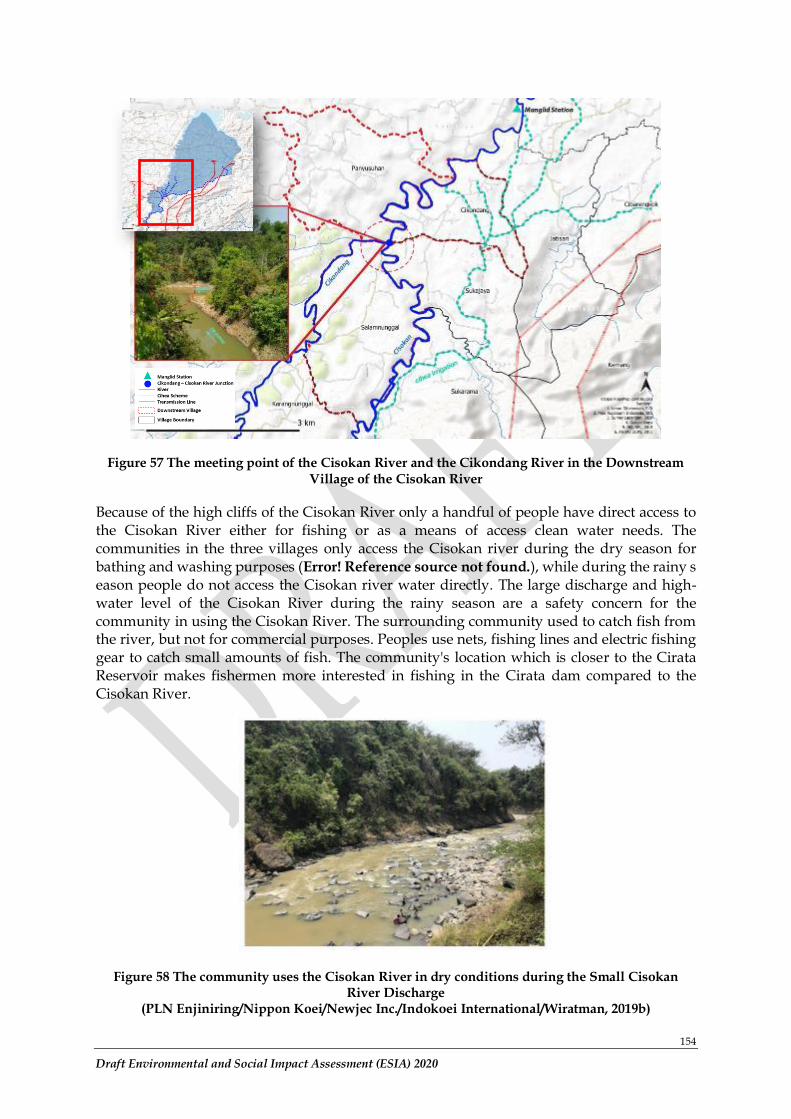
154
Draft Environmental and Social Impact Assessment (ESIA) 2020
Figure 57 The meeting point of the Cisokan River and the Cikondang River in the Downstream Village of the Cisokan River
Because of the high cliffs of the Cisokan River only a handful of people have direct access to the Cisokan River either for fishing or as a means of access clean water needs. The communities in the three villages only access the Cisokan river during the dry season for bathing and washing purposes (Error! Reference source not found.), while during the rainy season people do not access the Cisokan river water directly. The large discharge and high-water level of the Cisokan River during the rainy season are a safety concern for the community in using the Cisokan River. The surrounding community used to catch fish from the river, but not for commercial purposes. Peoples use nets, fishing lines and electric fishing gear to catch small amounts of fish. The community's location which is closer to the Cirata Reservoir makes fishermen more interested in fishing in the Cirata dam compared to the Cisokan River.
Figure 58 The community uses the Cisokan River in dry conditions during the Small Cisokan River Discharge
(PLN Enjiniring/Nippon Koei/Newjec Inc./Indokoei International/Wiratman, 2019b)
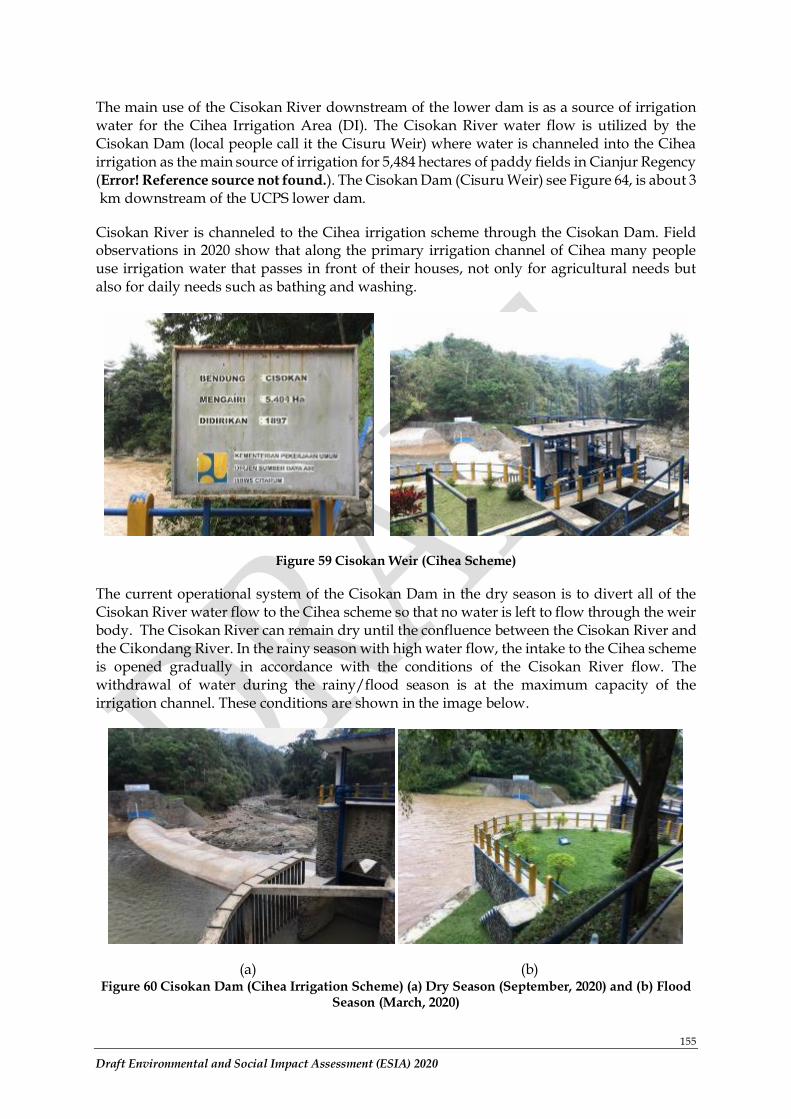
155
Draft Environmental and Social Impact Assessment (ESIA) 2020
The main use of the Cisokan River downstream of the lower dam is as a source of irrigation water for the Cihea Irrigation Area (DI). The Cisokan River water flow is utilized by the Cisokan Dam (local people call it the Cisuru Weir) where water is channeled into the Cihea irrigation as the main source of irrigation for 5,484 hectares of paddy fields in Cianjur Regency (Error! Reference source not found.). The Cisokan Dam (Cisuru Weir) see Figure 64, is about 3 km downstream of the UCPS lower dam.
Cisokan River is channeled to the Cihea irrigation scheme through the Cisokan Dam. Field observations in 2020 show that along the primary irrigation channel of Cihea many people use irrigation water that passes in front of their houses, not only for agricultural needs but also for daily needs such as bathing and washing.
Figure 59 Cisokan Weir (Cihea Scheme)
The current operational system of the Cisokan Dam in the dry season is to divert all of the Cisokan River water flow to the Cihea scheme so that no water is left to flow through the weir body. The Cisokan River can remain dry until the confluence between the Cisokan River and the Cikondang River. In the rainy season with high water flow, the intake to the Cihea scheme is opened gradually in accordance with the conditions of the Cisokan River flow. The withdrawal of water during the rainy/flood season is at the maximum capacity of the irrigation channel. These conditions are shown in the image below.
(a) (b) Figure 60 Cisokan Dam (Cihea Irrigation Scheme) (a) Dry Season (September, 2020) and (b) Flood
Season (March, 2020)
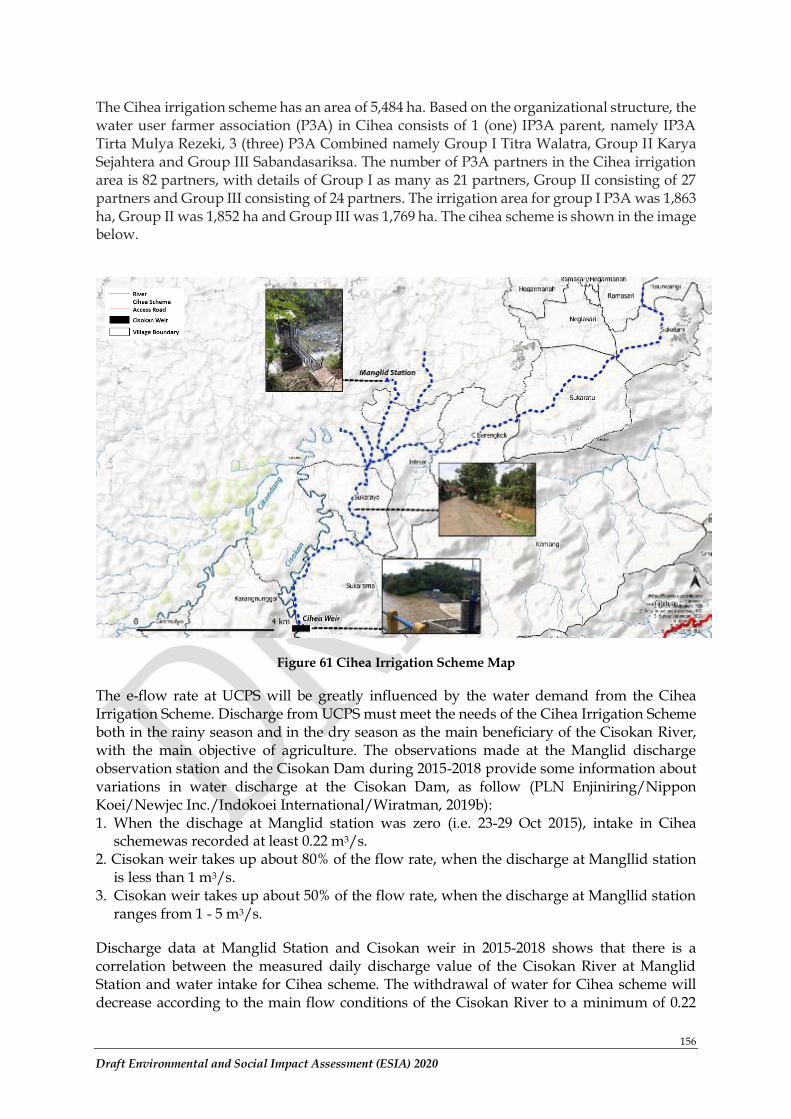
156
Draft Environmental and Social Impact Assessment (ESIA) 2020
The Cihea irrigation scheme has an area of 5,484 ha. Based on the organizational structure, the water user farmer association (P3A) in Cihea consists of 1 (one) IP3A parent, namely IP3A Tirta Mulya Rezeki, 3 (three) P3A Combined namely Group I Titra Walatra, Group II Karya Sejahtera and Group III Sabandasariksa. The number of P3A partners in the Cihea irrigation area is 82 partners, with details of Group I as many as 21 partners, Group II consisting of 27 partners and Group III consisting of 24 partners. The irrigation area for group I P3A was 1,863 ha, Group II was 1,852 ha and Group III was 1,769 ha. The cihea scheme is shown in the image below.
Figure 61 Cihea Irrigation Scheme Map
The e-flow rate at UCPS will be greatly influenced by the water demand from the Cihea Irrigation Scheme. Discharge from UCPS must meet the needs of the Cihea Irrigation Scheme both in the rainy season and in the dry season as the main beneficiary of the Cisokan River, with the main objective of agriculture. The observations made at the Manglid discharge observation station and the Cisokan Dam during 2015-2018 provide some information about variations in water discharge at the Cisokan Dam, as follow (PLN Enjiniring/Nippon Koei/Newjec Inc./Indokoei International/Wiratman, 2019b): 1. When the dischage at Manglid station was zero (i.e. 23-29 Oct 2015), intake in Cihea
schemewas recorded at least 0.22 m3/s. 2. Cisokan weir takes up about 80% of the flow rate, when the discharge at Mangllid station
is less than 1 m3/s. 3. Cisokan weir takes up about 50% of the flow rate, when the discharge at Mangllid station
ranges from 1 - 5 m3/s.
Discharge data at Manglid Station and Cisokan weir in 2015-2018 shows that there is a correlation between the measured daily discharge value of the Cisokan River at Manglid Station and water intake for Cihea scheme. The withdrawal of water for Cihea scheme will decrease according to the main flow conditions of the Cisokan River to a minimum of 0.22
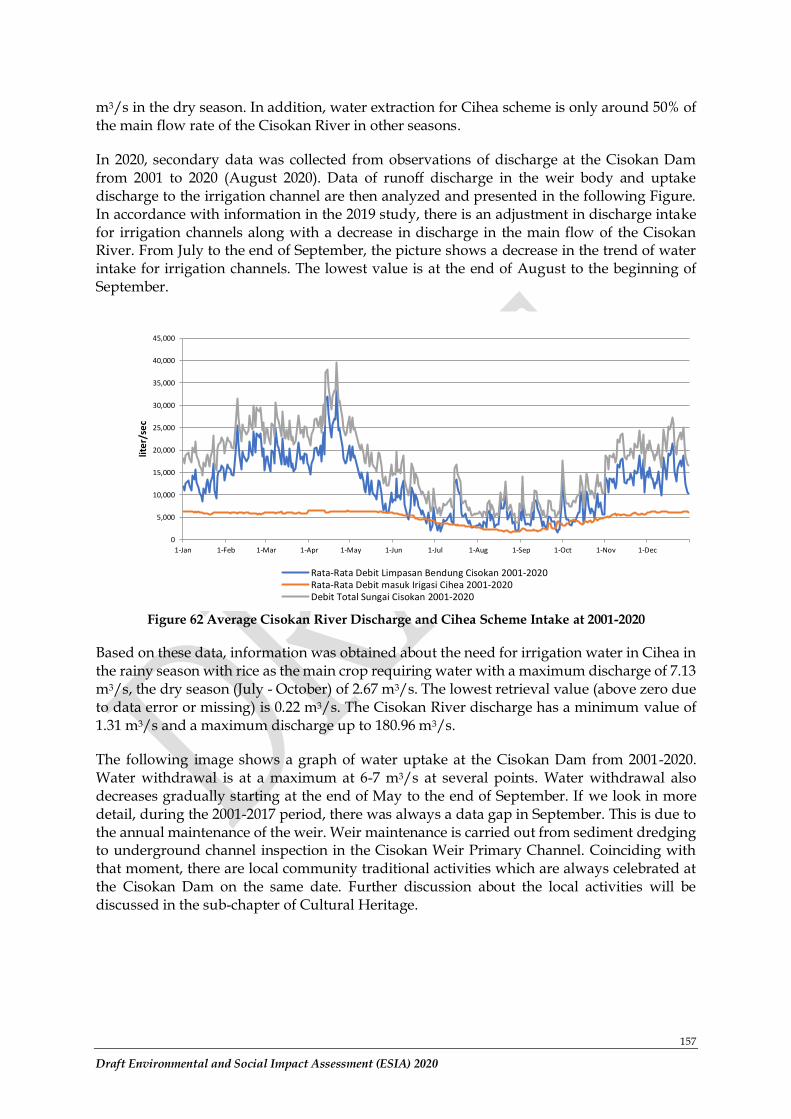
157
Draft Environmental and Social Impact Assessment (ESIA) 2020
m3/s in the dry season. In addition, water extraction for Cihea scheme is only around 50% of the main flow rate of the Cisokan River in other seasons.
In 2020, secondary data was collected from observations of discharge at the Cisokan Dam from 2001 to 2020 (August 2020). Data of runoff discharge in the weir body and uptake discharge to the irrigation channel are then analyzed and presented in the following Figure. In accordance with information in the 2019 study, there is an adjustment in discharge intake for irrigation channels along with a decrease in discharge in the main flow of the Cisokan River. From July to the end of September, the picture shows a decrease in the trend of water intake for irrigation channels. The lowest value is at the end of August to the beginning of September.
Figure 62 Average Cisokan River Discharge and Cihea Scheme Intake at 2001-2020
Based on these data, information was obtained about the need for irrigation water in Cihea in the rainy season with rice as the main crop requiring water with a maximum discharge of 7.13 m3/s, the dry season (July - October) of 2.67 m3/s. The lowest retrieval value (above zero due to data error or missing) is 0.22 m3/s. The Cisokan River discharge has a minimum value of 1.31 m3/s and a maximum discharge up to 180.96 m3/s.
The following image shows a graph of water uptake at the Cisokan Dam from 2001-2020. Water withdrawal is at a maximum at 6-7 m3/s at several points. Water withdrawal also decreases gradually starting at the end of May to the end of September. If we look in more detail, during the 2001-2017 period, there was always a data gap in September. This is due to the annual maintenance of the weir. Weir maintenance is carried out from sediment dredging to underground channel inspection in the Cisokan Weir Primary Channel. Coinciding with that moment, there are local community traditional activities which are always celebrated at the Cisokan Dam on the same date. Further discussion about the local activities will be discussed in the sub-chapter of Cultural Heritage.
0
5,000
10,000
15,000
20,000
25,000
30,000
35,000
40,000
45,000
1-Jan 1-Feb 1-Mar 1-Apr 1-May 1-Jun 1-Jul 1-Aug 1-Sep 1-Oct 1-Nov 1-Dec
lite
r/se
c
Rata-Rata Debit Limpasan Bendung Cisokan 2001-2020Rata-Rata Debit masuk Irigasi Cihea 2001-2020Debit Total Sungai Cisokan 2001-2020
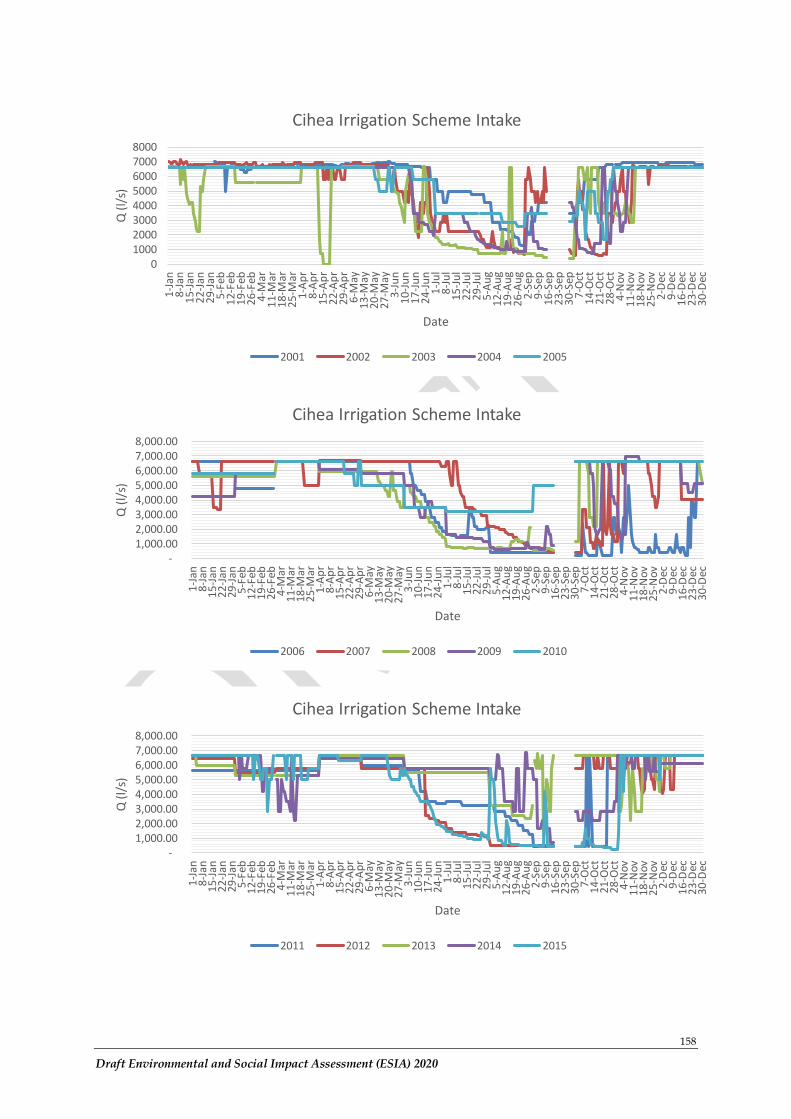
158
Draft Environmental and Social Impact Assessment (ESIA) 2020
010002000300040005000600070008000
1-Ja
n8-
Jan
15-J
an22
-Jan
29-J
an5-
Feb
12
-Feb
19
-Feb
26
-Feb
4-M
ar1
1-M
ar1
8-M
ar2
5-M
ar1-
Ap
r8-
Ap
r15
-Ap
r22
-Ap
r29
-Ap
r6-
May
13-M
ay20
-May
27-M
ay3-
Jun
10-J
un
17-J
un
24-J
un
1-Ju
l8-
Jul
15-J
ul
22-J
ul
29-J
ul
5-A
ug
12-A
ug
19-A
ug
26-A
ug
2-Se
p9-
Sep
16
-Sep
23
-Sep
30
-Sep
7-O
ct14
-Oct
21-O
ct28
-Oct
4-N
ov11
-Nov
18-N
ov25
-Nov
2-D
ec9-
Dec
16-D
ec23
-Dec
30-D
ec
Q (
l/s)
Date
Cihea Irrigation Scheme Intake
2001 2002 2003 2004 2005
- 1,000.00 2,000.00 3,000.00 4,000.00 5,000.00 6,000.00 7,000.00 8,000.00
1-Ja
n8-
Jan
15-J
an22
-Jan
29-J
an5-
Feb
12-F
eb19
-Feb
26-F
eb4-
Mar
11-M
ar18
-Mar
25-M
ar1-
Ap
r8-
Ap
r15
-Ap
r22
-Ap
r29
-Ap
r6-
May
13-M
ay20
-May
27-M
ay3-
Jun
10
-Ju
n1
7-J
un
24
-Ju
n1-
Jul
8-Ju
l15
-Ju
l22
-Ju
l29
-Ju
l5-
Au
g12
-Au
g19
-Au
g26
-Au
g2-
Sep
9-Se
p16
-Sep
23-S
ep30
-Sep
7-O
ct14
-Oct
21-O
ct28
-Oct
4-N
ov11
-Nov
18-N
ov25
-Nov
2-D
ec9-
Dec
16-D
ec23
-Dec
30-D
ec
Q (
l/s)
Date
Cihea Irrigation Scheme Intake
2006 2007 2008 2009 2010
- 1,000.00 2,000.00 3,000.00 4,000.00 5,000.00 6,000.00 7,000.00 8,000.00
1-Ja
n8-
Jan
15-J
an22
-Jan
29-J
an5-
Feb
12-F
eb19
-Feb
26-F
eb4-
Mar
11-M
ar18
-Mar
25-M
ar1-
Ap
r8-
Ap
r15
-Ap
r22
-Ap
r29
-Ap
r6-
May
13-M
ay20
-May
27-M
ay3-
Jun
10-J
un
17-J
un
24-J
un
1-Ju
l8-
Jul
15-J
ul
22-J
ul
29-J
ul
5-A
ug
12-A
ug
19-A
ug
26-A
ug
2-Se
p9-
Sep
16-S
ep23
-Sep
30-S
ep7
-Oct
14-O
ct21
-Oct
28-O
ct4-
Nov
11-N
ov18
-Nov
25-N
ov2-
Dec
9-D
ec16
-Dec
23-D
ec30
-Dec
Q (
l/s)
Date
Cihea Irrigation Scheme Intake
2011 2012 2013 2014 2015
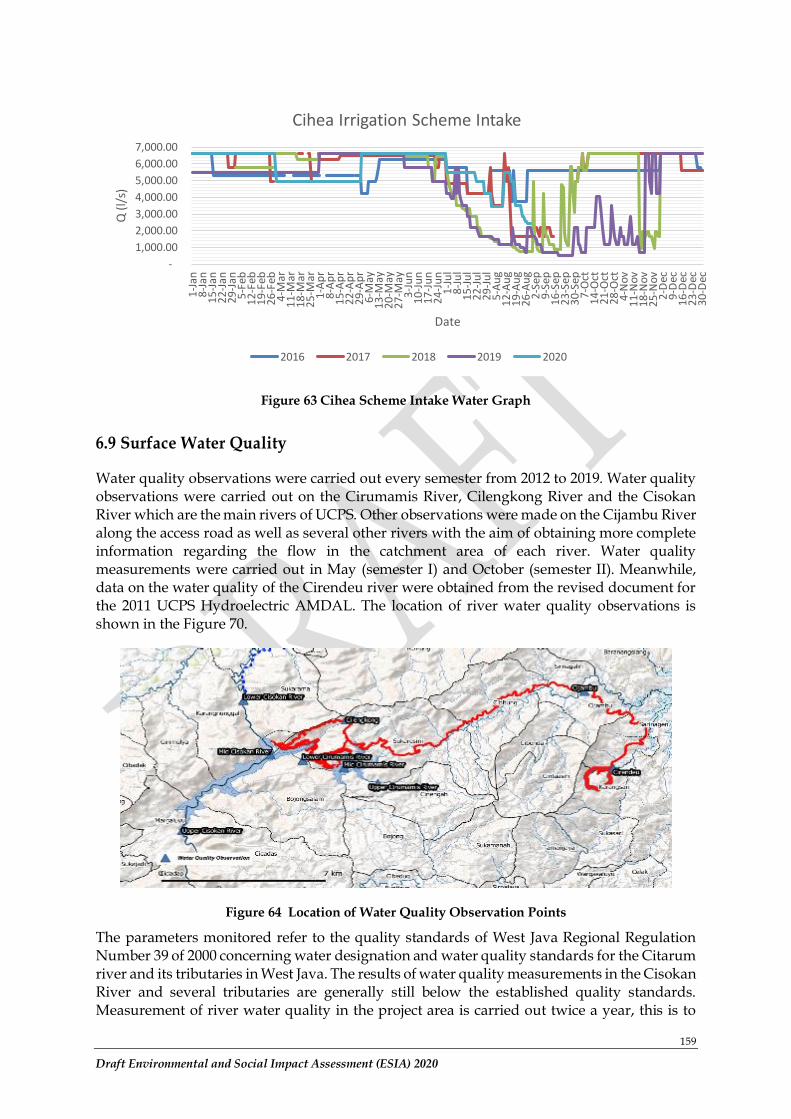
159
Draft Environmental and Social Impact Assessment (ESIA) 2020
Figure 63 Cihea Scheme Intake Water Graph
6.9 Surface Water Quality
Water quality observations were carried out every semester from 2012 to 2019. Water quality observations were carried out on the Cirumamis River, Cilengkong River and the Cisokan River which are the main rivers of UCPS. Other observations were made on the Cijambu River along the access road as well as several other rivers with the aim of obtaining more complete information regarding the flow in the catchment area of each river. Water quality measurements were carried out in May (semester I) and October (semester II). Meanwhile, data on the water quality of the Cirendeu river were obtained from the revised document for the 2011 UCPS Hydroelectric AMDAL. The location of river water quality observations is shown in the Figure 70.
Figure 64 Location of Water Quality Observation Points
The parameters monitored refer to the quality standards of West Java Regional Regulation Number 39 of 2000 concerning water designation and water quality standards for the Citarum river and its tributaries in West Java. The results of water quality measurements in the Cisokan River and several tributaries are generally still below the established quality standards. Measurement of river water quality in the project area is carried out twice a year, this is to
-
1,000.00
2,000.00
3,000.00
4,000.00
5,000.00
6,000.00
7,000.00
1-Ja
n8-
Jan
15-J
an22
-Jan
29-J
an5-
Feb
12
-Feb
19
-Feb
26
-Feb
4-M
ar1
1-M
ar1
8-M
ar2
5-M
ar1-
Ap
r8-
Ap
r15
-Ap
r22
-Ap
r29
-Ap
r6-
May
13-M
ay20
-May
27-M
ay3-
Jun
10-J
un
17-J
un
24-J
un
1-Ju
l8-
Jul
15-J
ul
22-J
ul
29-J
ul
5-A
ug
12-A
ug
19-A
ug
26-A
ug
2-Se
p9-
Sep
16
-Sep
23
-Sep
30
-Sep
7-O
ct14
-Oct
21-O
ct28
-Oct
4-N
ov11
-Nov
18-N
ov25
-Nov
2-D
ec9-
Dec
16-D
ec23
-Dec
30-D
ec
Q (
l/s)
Date
Cihea Irrigation Scheme Intake
2016 2017 2018 2019 2020
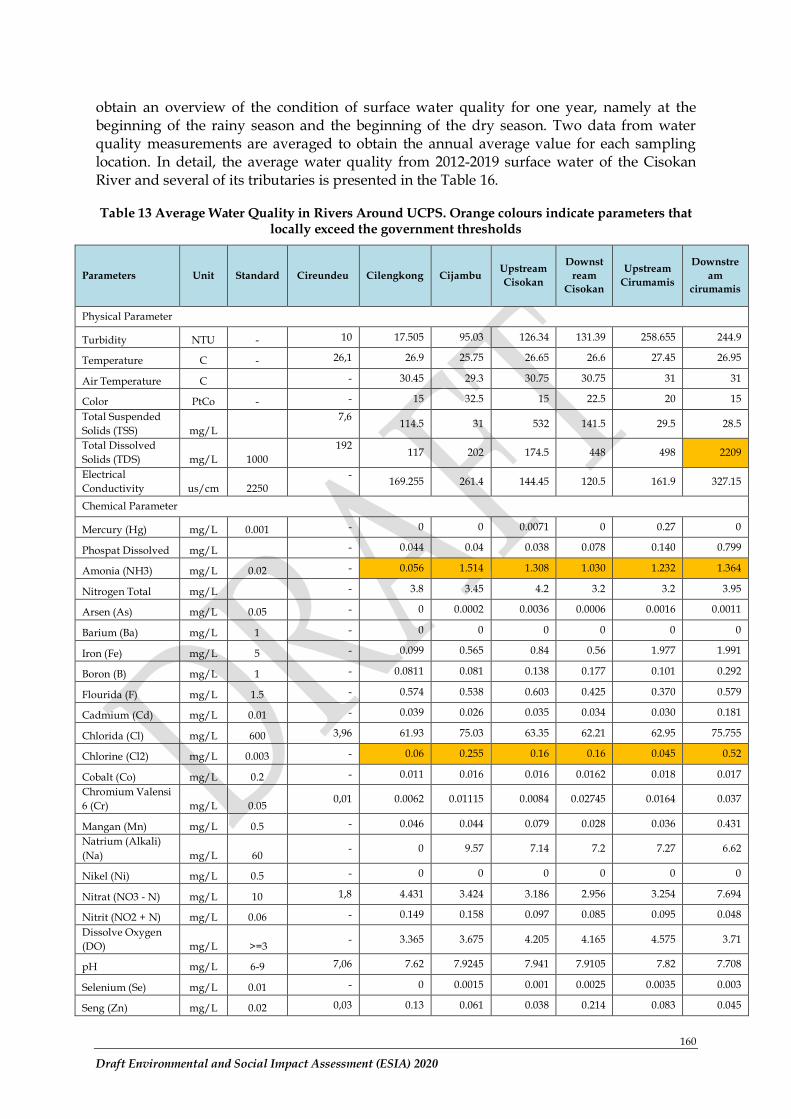
160
Draft Environmental and Social Impact Assessment (ESIA) 2020
obtain an overview of the condition of surface water quality for one year, namely at the beginning of the rainy season and the beginning of the dry season. Two data from water quality measurements are averaged to obtain the annual average value for each sampling location. In detail, the average water quality from 2012-2019 surface water of the Cisokan River and several of its tributaries is presented in the Table 16.
Table 13 Average Water Quality in Rivers Around UCPS. Orange colours indicate parameters that locally exceed the government thresholds
Parameters Unit Standard Cireundeu Cilengkong Cijambu Upstream
Cisokan
Downst
ream
Cisokan
Upstream
Cirumamis
Downstre
am
cirumamis
Physical Parameter
Turbidity NTU - 10 17.505 95.03 126.34 131.39 258.655 244.9
Temperature C - 26,1 26.9 25.75 26.65 26.6 27.45 26.95
Air Temperature C - 30.45 29.3 30.75 30.75 31 31
Color PtCo - - 15 32.5 15 22.5 20 15
Total Suspended
Solids (TSS) mg/L
7,6 114.5 31 532 141.5 29.5 28.5
Total Dissolved
Solids (TDS) mg/L 1000
192 117 202 174.5 448 498 2209
Electrical
Conductivity us/cm 2250
- 169.255 261.4 144.45 120.5 161.9 327.15
Chemical Parameter
Mercury (Hg) mg/L 0.001 - 0 0 0.0071 0 0.27 0
Phospat Dissolved mg/L - 0.044 0.04 0.038 0.078 0.140 0.799
Amonia (NH3) mg/L 0.02 - 0.056 1.514 1.308 1.030 1.232 1.364
Nitrogen Total mg/L - 3.8 3.45 4.2 3.2 3.2 3.95
Arsen (As) mg/L 0.05 - 0 0.0002 0.0036 0.0006 0.0016 0.0011
Barium (Ba) mg/L 1 - 0 0 0 0 0 0
Iron (Fe) mg/L 5 - 0.099 0.565 0.84 0.56 1.977 1.991
Boron (B) mg/L 1 - 0.0811 0.081 0.138 0.177 0.101 0.292
Flourida (F) mg/L 1.5 - 0.574 0.538 0.603 0.425 0.370 0.579
Cadmium (Cd) mg/L 0.01 - 0.039 0.026 0.035 0.034 0.030 0.181
Chlorida (Cl) mg/L 600 3,96 61.93 75.03 63.35 62.21 62.95 75.755
Chlorine (Cl2) mg/L 0.003 - 0.06 0.255 0.16 0.16 0.045 0.52
Cobalt (Co) mg/L 0.2 - 0.011 0.016 0.016 0.0162 0.018 0.017
Chromium Valensi
6 (Cr) mg/L 0.05 0,01 0.0062 0.01115 0.0084 0.02745 0.0164 0.037
Mangan (Mn) mg/L 0.5 - 0.046 0.044 0.079 0.028 0.036 0.431
Natrium (Alkali)
(Na) mg/L 60 - 0 9.57 7.14 7.2 7.27 6.62
Nikel (Ni) mg/L 0.5 - 0 0 0 0 0 0
Nitrat (NO3 - N) mg/L 10 1,8 4.431 3.424 3.186 2.956 3.254 7.694
Nitrit (NO2 + N) mg/L 0.06 - 0.149 0.158 0.097 0.085 0.095 0.048
Dissolve Oxygen
(DO) mg/L >=3 - 3.365 3.675 4.205 4.165 4.575 3.71
pH mg/L 6-9 7,06 7.62 7.9245 7.941 7.9105 7.82 7.708
Selenium (Se) mg/L 0.01 - 0 0.0015 0.001 0.0025 0.0035 0.003
Seng (Zn) mg/L 0.02 0,03 0.13 0.061 0.038 0.214 0.083 0.045
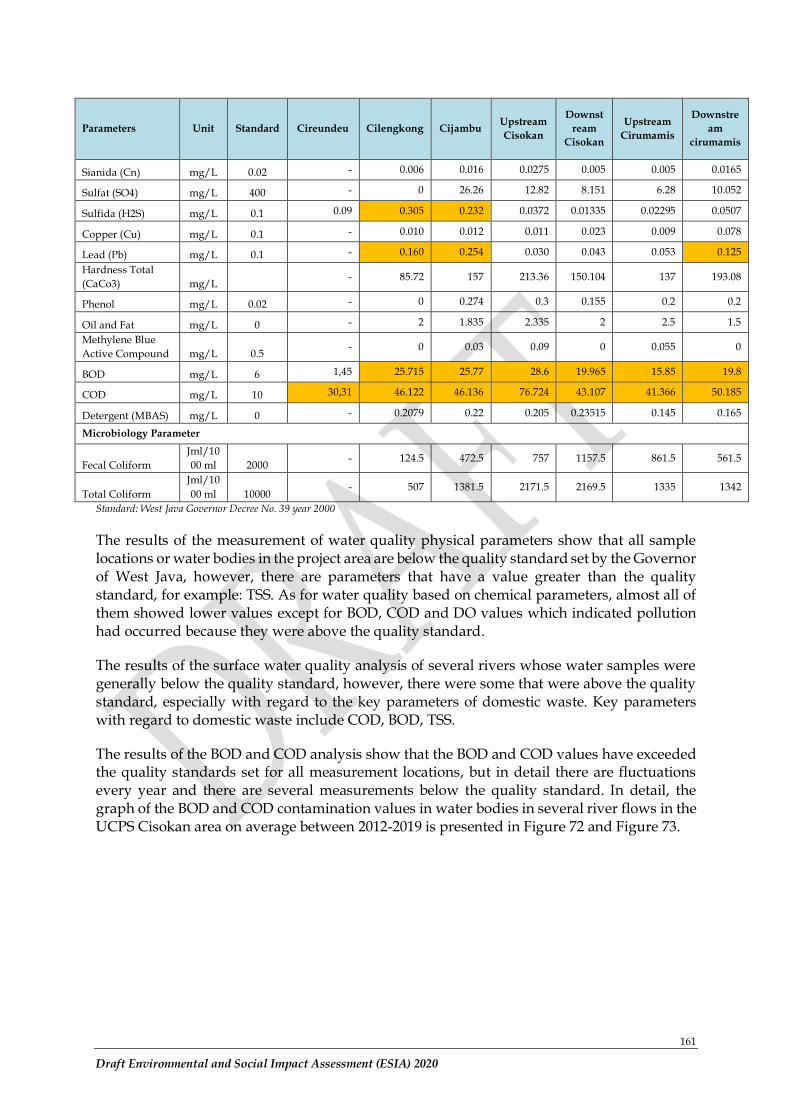
161
Draft Environmental and Social Impact Assessment (ESIA) 2020
Parameters Unit Standard Cireundeu Cilengkong Cijambu Upstream
Cisokan
Downst
ream
Cisokan
Upstream
Cirumamis
Downstre
am
cirumamis
Sianida (Cn) mg/L 0.02 - 0.006 0.016 0.0275 0.005 0.005 0.0165
Sulfat (SO4) mg/L 400 - 0 26.26 12.82 8.151 6.28 10.052
Sulfida (H2S) mg/L 0.1 0.09 0.305 0.232 0.0372 0.01335 0.02295 0.0507
Copper (Cu) mg/L 0.1 - 0.010 0.012 0.011 0.023 0.009 0.078
Lead (Pb) mg/L 0.1 - 0.160 0.254 0.030 0.043 0.053 0.125
Hardness Total
(CaCo3) mg/L - 85.72 157 213.36 150.104 137 193.08
Phenol mg/L 0.02 - 0 0.274 0.3 0.155 0.2 0.2
Oil and Fat mg/L 0 - 2 1.835 2.335 2 2.5 1.5
Methylene Blue
Active Compound mg/L 0.5 - 0 0.03 0.09 0 0.055 0
BOD mg/L 6 1,45 25.715 25.77 28.6 19.965 15.85 19.8
COD mg/L 10 30,31 46.122 46.136 76.724 43.107 41.366 50.185
Detergent (MBAS) mg/L 0 - 0.2079 0.22 0.205 0.23515 0.145 0.165
Microbiology Parameter
Fecal Coliform
Jml/10
00 ml 2000 - 124.5 472.5 757 1157.5 861.5 561.5
Total Coliform
Jml/10
00 ml 10000 - 507 1381.5 2171.5 2169.5 1335 1342
Standard: West Java Governor Decree No. 39 year 2000
The results of the measurement of water quality physical parameters show that all sample locations or water bodies in the project area are below the quality standard set by the Governor of West Java, however, there are parameters that have a value greater than the quality standard, for example: TSS. As for water quality based on chemical parameters, almost all of them showed lower values except for BOD, COD and DO values which indicated pollution had occurred because they were above the quality standard.
The results of the surface water quality analysis of several rivers whose water samples were generally below the quality standard, however, there were some that were above the quality standard, especially with regard to the key parameters of domestic waste. Key parameters with regard to domestic waste include COD, BOD, TSS.
The results of the BOD and COD analysis show that the BOD and COD values have exceeded the quality standards set for all measurement locations, but in detail there are fluctuations every year and there are several measurements below the quality standard. In detail, the graph of the BOD and COD contamination values in water bodies in several river flows in the UCPS Cisokan area on average between 2012-2019 is presented in Figure 72 and Figure 73.
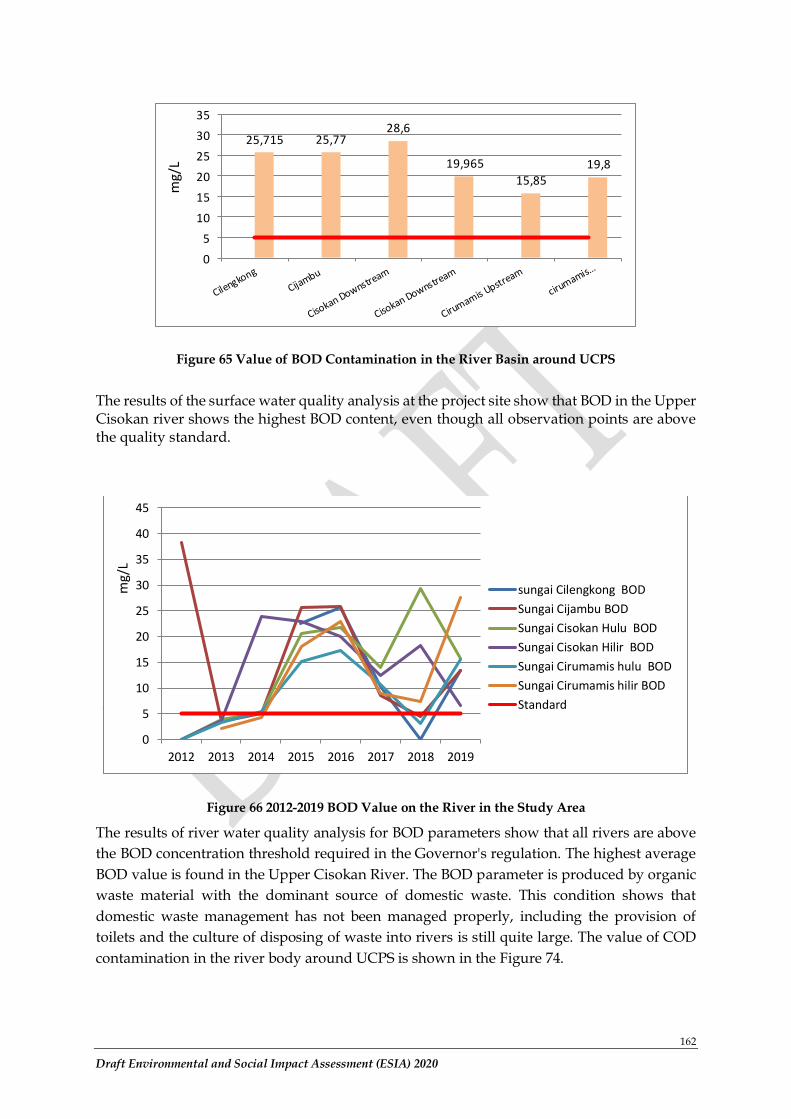
162
Draft Environmental and Social Impact Assessment (ESIA) 2020
25,715 25,7728,6
19,965
15,8519,8
0
5
10
15
20
25
30
35
mg/
L
Figure 65 Value of BOD Contamination in the River Basin around UCPS
The results of the surface water quality analysis at the project site show that BOD in the Upper Cisokan river shows the highest BOD content, even though all observation points are above the quality standard.
Figure 66 2012-2019 BOD Value on the River in the Study Area
The results of river water quality analysis for BOD parameters show that all rivers are above
the BOD concentration threshold required in the Governor's regulation. The highest average
BOD value is found in the Upper Cisokan River. The BOD parameter is produced by organic
waste material with the dominant source of domestic waste. This condition shows that
domestic waste management has not been managed properly, including the provision of
toilets and the culture of disposing of waste into rivers is still quite large. The value of COD
contamination in the river body around UCPS is shown in the Figure 74.
0
5
10
15
20
25
30
35
40
45
2012 2013 2014 2015 2016 2017 2018 2019
sungai Cilengkong BOD
Sungai Cijambu BOD
Sungai Cisokan Hulu BOD
Sungai Cisokan Hilir BOD
Sungai Cirumamis hulu BOD
Sungai Cirumamis hilir BOD
Standard
mg/
L
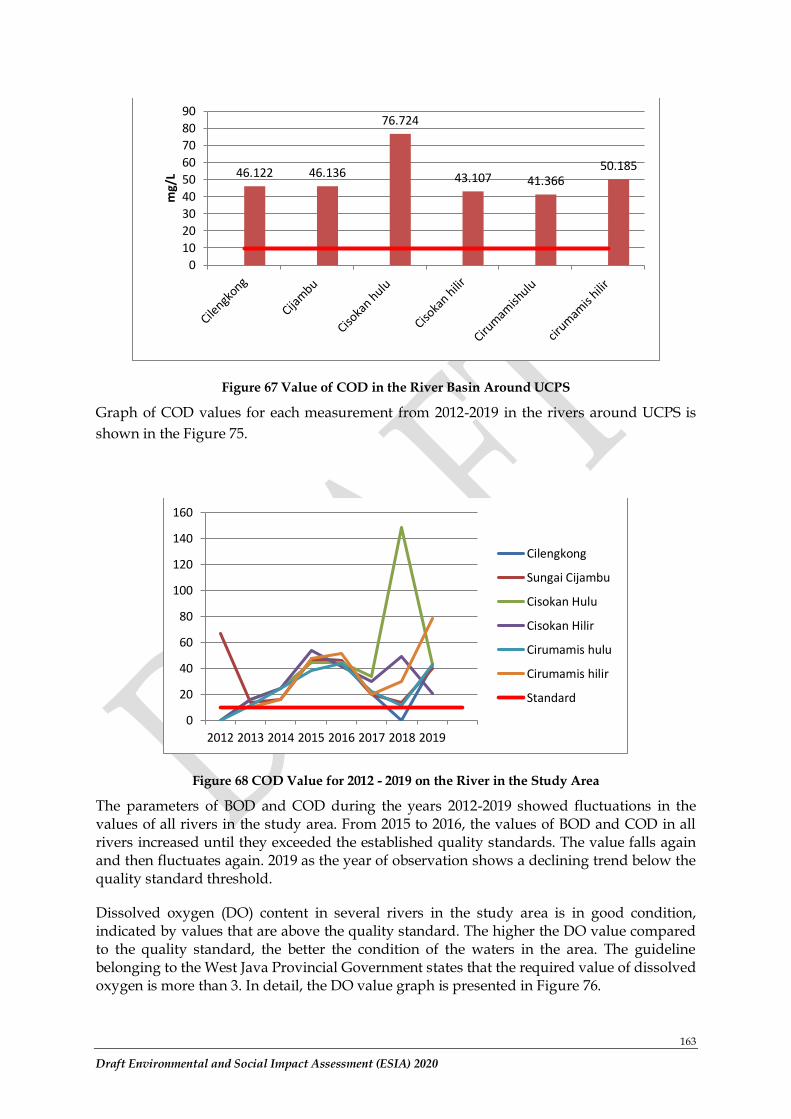
163
Draft Environmental and Social Impact Assessment (ESIA) 2020
Figure 67 Value of COD in the River Basin Around UCPS
Graph of COD values for each measurement from 2012-2019 in the rivers around UCPS is
shown in the Figure 75.
Figure 68 COD Value for 2012 - 2019 on the River in the Study Area
The parameters of BOD and COD during the years 2012-2019 showed fluctuations in the values of all rivers in the study area. From 2015 to 2016, the values of BOD and COD in all rivers increased until they exceeded the established quality standards. The value falls again and then fluctuates again. 2019 as the year of observation shows a declining trend below the quality standard threshold.
Dissolved oxygen (DO) content in several rivers in the study area is in good condition, indicated by values that are above the quality standard. The higher the DO value compared to the quality standard, the better the condition of the waters in the area. The guideline belonging to the West Java Provincial Government states that the required value of dissolved oxygen is more than 3. In detail, the DO value graph is presented in Figure 76.
46.122 46.136
76.724
43.107 41.36650.185
0
10
20
30
40
50
60
70
80
90
mg/
L
0
20
40
60
80
100
120
140
160
2012 2013 2014 2015 2016 2017 2018 2019
Cilengkong
Sungai Cijambu
Cisokan Hulu
Cisokan Hilir
Cirumamis hulu
Cirumamis hilir
Standard
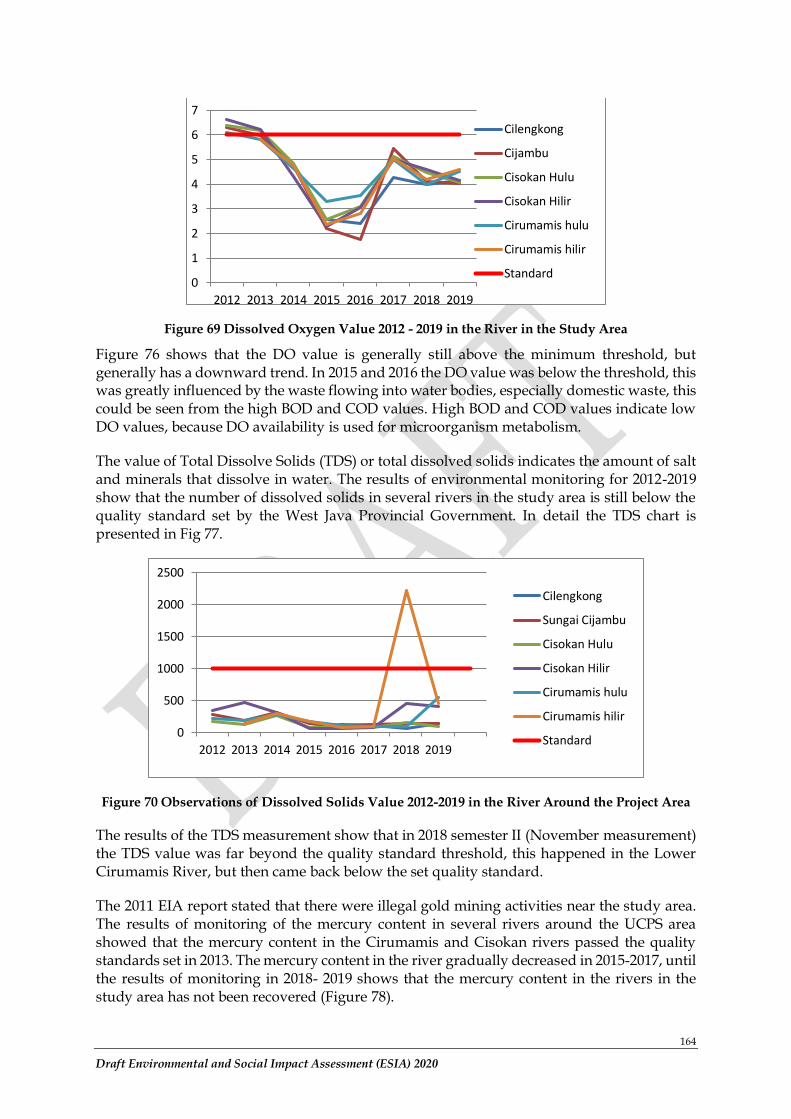
164
Draft Environmental and Social Impact Assessment (ESIA) 2020
Figure 69 Dissolved Oxygen Value 2012 - 2019 in the River in the Study Area
Figure 76 shows that the DO value is generally still above the minimum threshold, but generally has a downward trend. In 2015 and 2016 the DO value was below the threshold, this was greatly influenced by the waste flowing into water bodies, especially domestic waste, this could be seen from the high BOD and COD values. High BOD and COD values indicate low DO values, because DO availability is used for microorganism metabolism.
The value of Total Dissolve Solids (TDS) or total dissolved solids indicates the amount of salt and minerals that dissolve in water. The results of environmental monitoring for 2012-2019 show that the number of dissolved solids in several rivers in the study area is still below the quality standard set by the West Java Provincial Government. In detail the TDS chart is presented in Fig 77.
Figure 70 Observations of Dissolved Solids Value 2012-2019 in the River Around the Project Area
The results of the TDS measurement show that in 2018 semester II (November measurement) the TDS value was far beyond the quality standard threshold, this happened in the Lower Cirumamis River, but then came back below the set quality standard.
The 2011 EIA report stated that there were illegal gold mining activities near the study area. The results of monitoring of the mercury content in several rivers around the UCPS area showed that the mercury content in the Cirumamis and Cisokan rivers passed the quality standards set in 2013. The mercury content in the river gradually decreased in 2015-2017, until the results of monitoring in 2018- 2019 shows that the mercury content in the rivers in the study area has not been recovered (Figure 78).
0
1
2
3
4
5
6
7
2012 2013 2014 2015 2016 2017 2018 2019
Cilengkong
Cijambu
Cisokan Hulu
Cisokan Hilir
Cirumamis hulu
Cirumamis hilir
Standard
0
500
1000
1500
2000
2500
2012 2013 2014 2015 2016 2017 2018 2019
Cilengkong
Sungai Cijambu
Cisokan Hulu
Cisokan Hilir
Cirumamis hulu
Cirumamis hilir
Standard
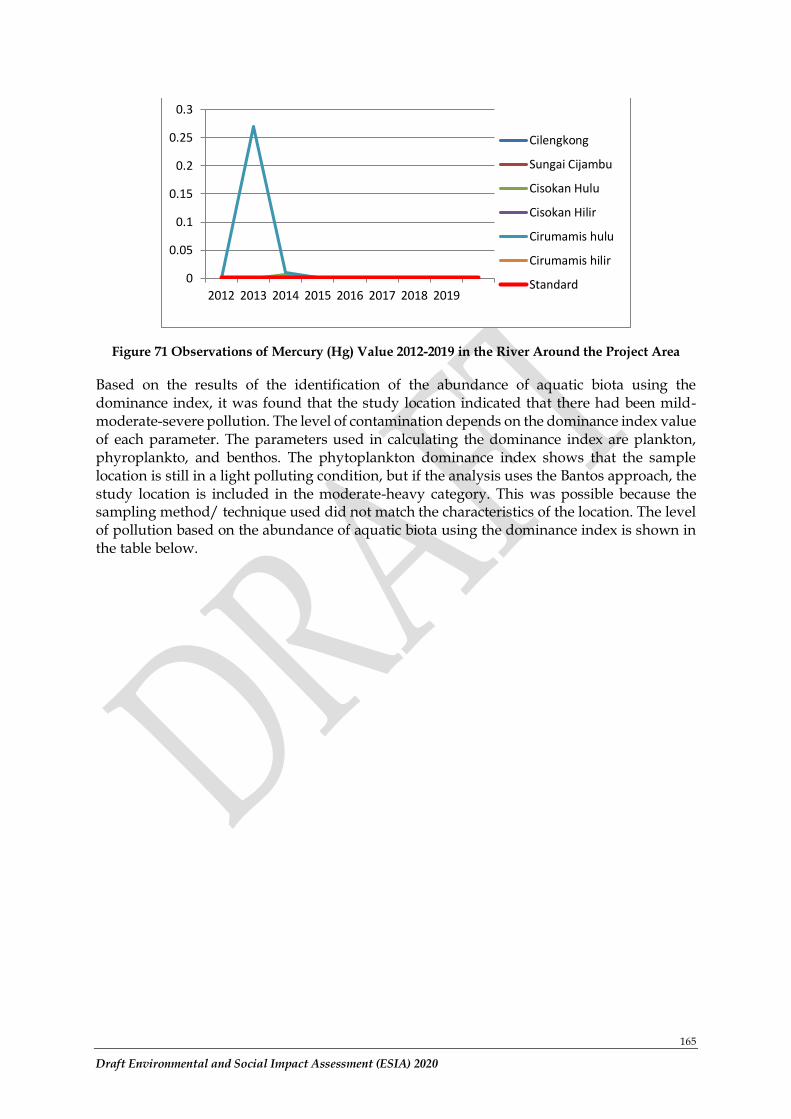
165
Draft Environmental and Social Impact Assessment (ESIA) 2020
Figure 71 Observations of Mercury (Hg) Value 2012-2019 in the River Around the Project Area
Based on the results of the identification of the abundance of aquatic biota using the dominance index, it was found that the study location indicated that there had been mild-moderate-severe pollution. The level of contamination depends on the dominance index value of each parameter. The parameters used in calculating the dominance index are plankton, phyroplankto, and benthos. The phytoplankton dominance index shows that the sample location is still in a light polluting condition, but if the analysis uses the Bantos approach, the study location is included in the moderate-heavy category. This was possible because the sampling method/ technique used did not match the characteristics of the location. The level of pollution based on the abundance of aquatic biota using the dominance index is shown in the table below.
0
0.05
0.1
0.15
0.2
0.25
0.3
2012 2013 2014 2015 2016 2017 2018 2019
Cilengkong
Sungai Cijambu
Cisokan Hulu
Cisokan Hilir
Cirumamis hulu
Cirumamis hilir
Standard
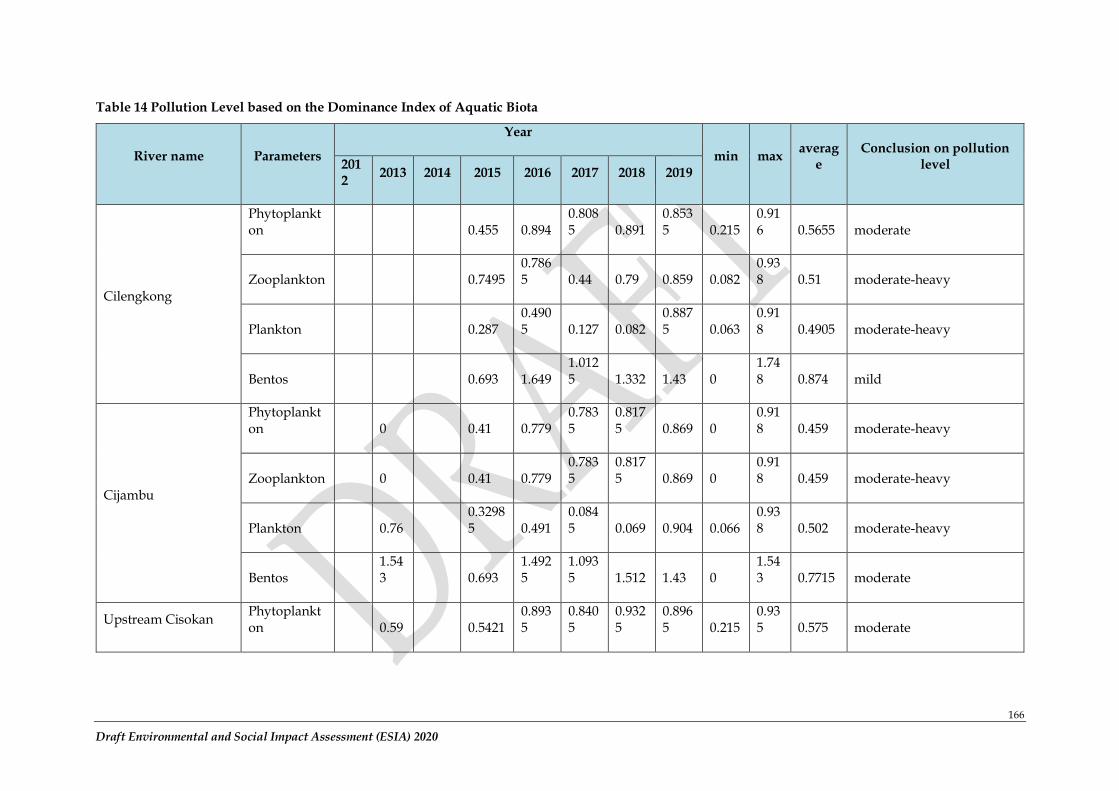
166
Draft Environmental and Social Impact Assessment (ESIA) 2020
Table 14 Pollution Level based on the Dominance Index of Aquatic Biota
River name Parameters
Year
min max averag
e Conclusion on pollution
level 2012
2013 2014 2015 2016 2017 2018 2019
Cilengkong
Phytoplankton
0.455 0.894 0.8085 0.891
0.8535 0.215
0.916 0.5655 moderate
Zooplankton
0.7495 0.7865 0.44 0.79 0.859 0.082
0.938 0.51 moderate-heavy
Plankton
0.287 0.4905 0.127 0.082
0.8875 0.063
0.918 0.4905 moderate-heavy
Bentos
0.693 1.649 1.0125 1.332 1.43 0
1.748 0.874 mild
Cijambu
Phytoplankton
0
0.41 0.779 0.7835
0.8175 0.869 0
0.918 0.459 moderate-heavy
Zooplankton
0
0.41 0.779 0.7835
0.8175 0.869 0
0.918 0.459 moderate-heavy
Plankton
0.76
0.32985 0.491
0.0845 0.069 0.904 0.066
0.938 0.502 moderate-heavy
Bentos
1.543
0.693 1.4925
1.0935 1.512 1.43 0
1.543 0.7715 moderate
Upstream Cisokan Phytoplankton
0.59
0.5421 0.8935
0.8405
0.9325
0.8965 0.215
0.935 0.575 moderate
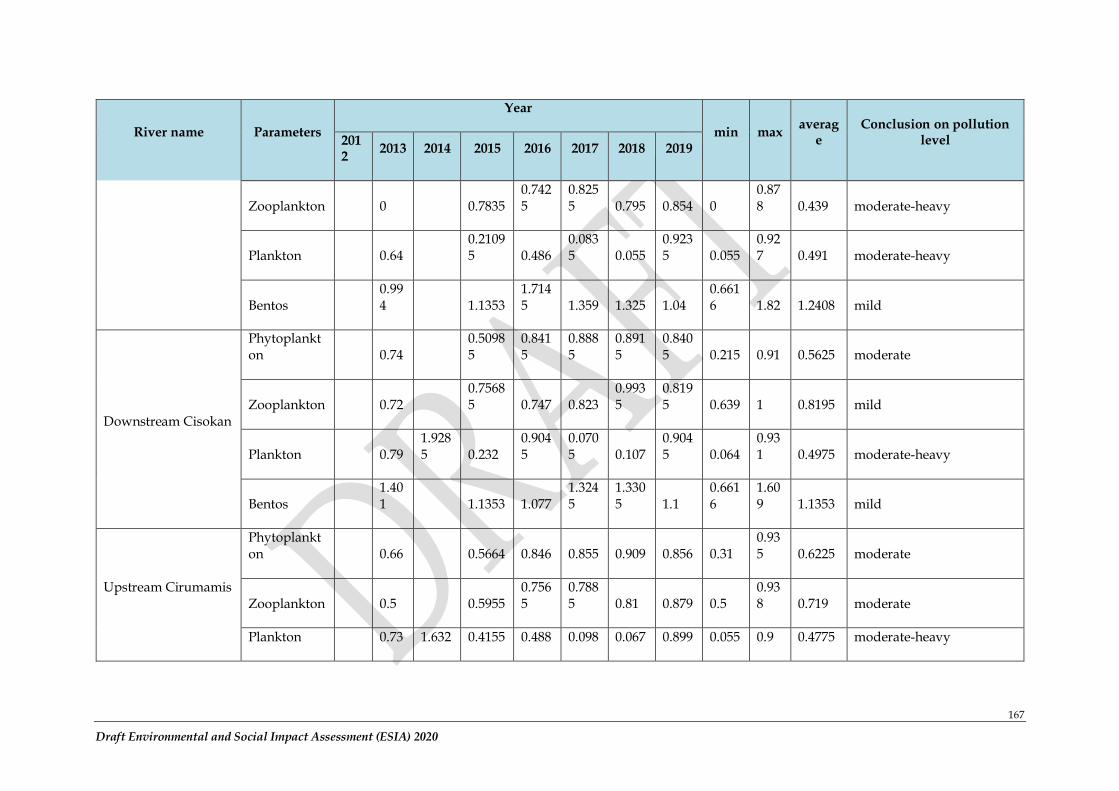
167
Draft Environmental and Social Impact Assessment (ESIA) 2020
River name Parameters
Year
min max averag
e Conclusion on pollution
level 2012
2013 2014 2015 2016 2017 2018 2019
Zooplankton
0
0.7835 0.7425
0.8255 0.795 0.854 0
0.878 0.439 moderate-heavy
Plankton
0.64
0.21095 0.486
0.0835 0.055
0.9235 0.055
0.927 0.491 moderate-heavy
Bentos
0.994
1.1353 1.7145 1.359 1.325 1.04
0.6616 1.82 1.2408 mild
Downstream Cisokan
Phytoplankton
0.74
0.50985
0.8415
0.8885
0.8915
0.8405 0.215 0.91 0.5625 moderate
Zooplankton
0.72
0.75685 0.747 0.823
0.9935
0.8195 0.639 1 0.8195 mild
Plankton
0.79 1.9285 0.232
0.9045
0.0705 0.107
0.9045 0.064
0.931 0.4975 moderate-heavy
Bentos
1.401
1.1353 1.077 1.3245
1.3305 1.1
0.6616
1.609 1.1353 mild
Upstream Cirumamis
Phytoplankton
0.66
0.5664 0.846 0.855 0.909 0.856 0.31 0.935 0.6225 moderate
Zooplankton
0.5
0.5955 0.7565
0.7885 0.81 0.879 0.5
0.938 0.719 moderate
Plankton
0.73 1.632 0.4155 0.488 0.098 0.067 0.899 0.055 0.9 0.4775 moderate-heavy
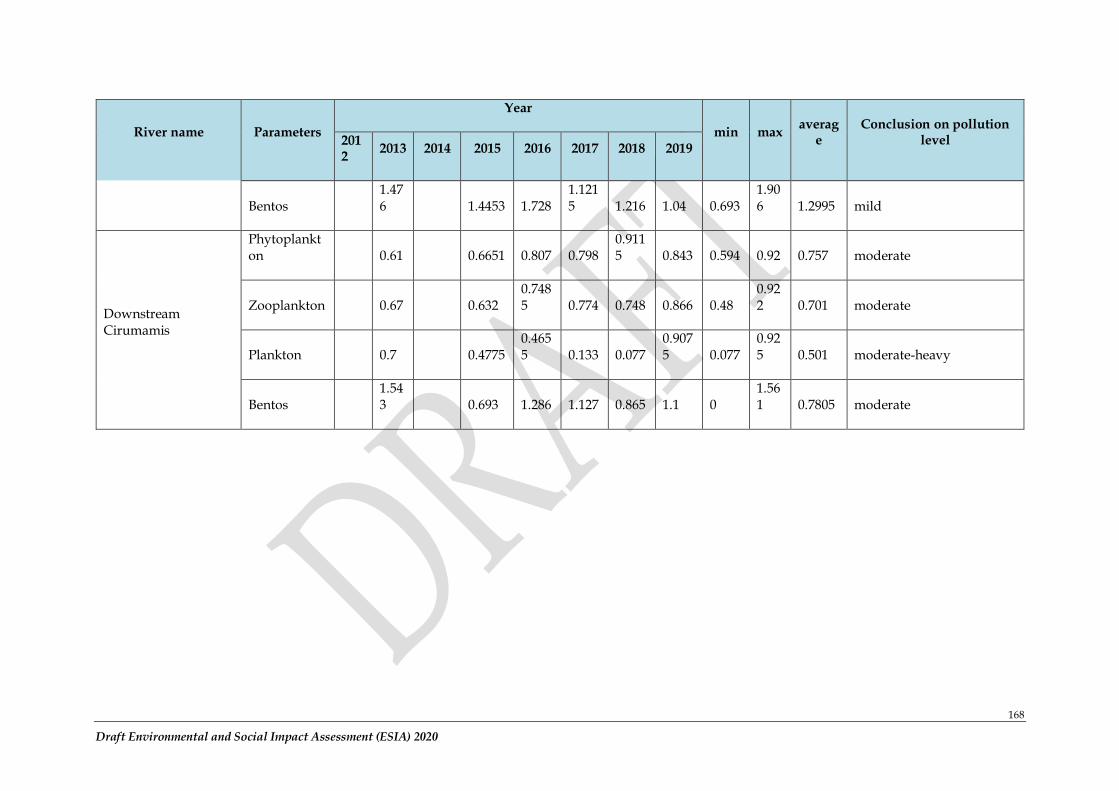
168
Draft Environmental and Social Impact Assessment (ESIA) 2020
River name Parameters
Year
min max averag
e Conclusion on pollution
level 2012
2013 2014 2015 2016 2017 2018 2019
Bentos
1.476
1.4453 1.728 1.1215 1.216 1.04 0.693
1.906 1.2995 mild
Downstream Cirumamis
Phytoplankton
0.61
0.6651 0.807 0.798 0.9115 0.843 0.594 0.92 0.757 moderate
Zooplankton
0.67
0.632 0.7485 0.774 0.748 0.866 0.48
0.922 0.701 moderate
Plankton
0.7
0.4775 0.4655 0.133 0.077
0.9075 0.077
0.925 0.501 moderate-heavy
Bentos
1.543
0.693 1.286 1.127 0.865 1.1 0 1.561 0.7805 moderate
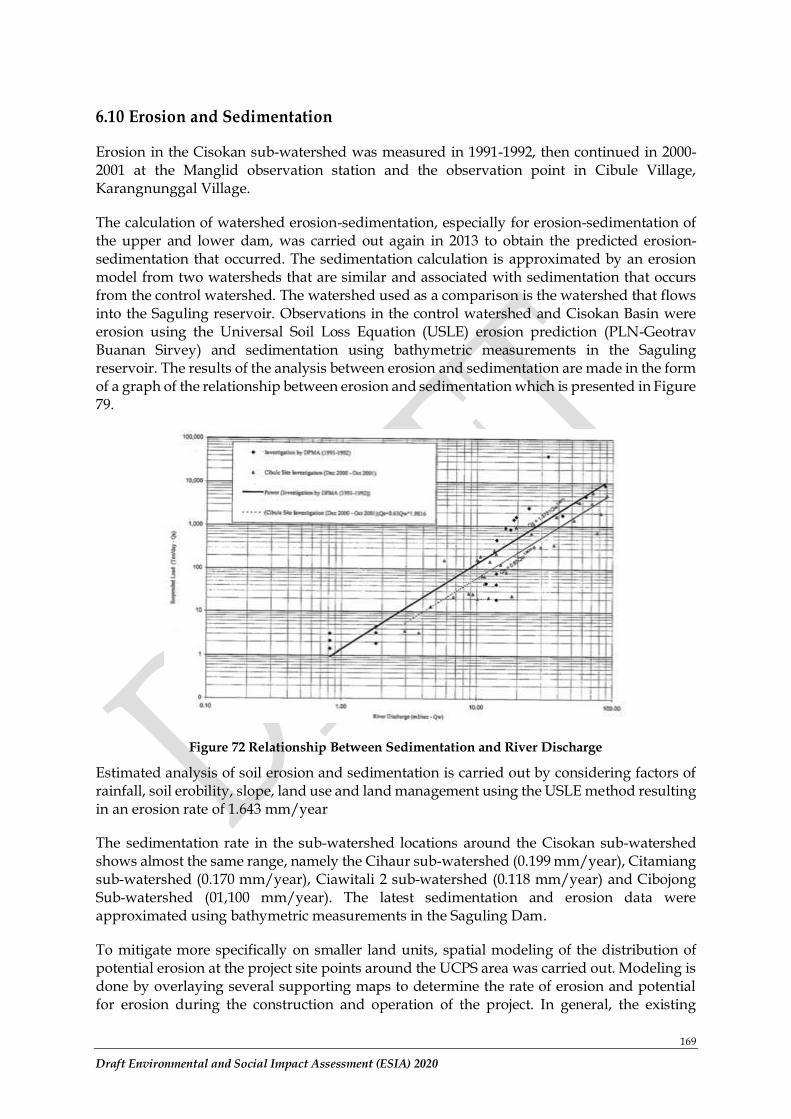
169
Draft Environmental and Social Impact Assessment (ESIA) 2020
6.10 Erosion and Sedimentation
Erosion in the Cisokan sub-watershed was measured in 1991-1992, then continued in 2000-2001 at the Manglid observation station and the observation point in Cibule Village, Karangnunggal Village.
The calculation of watershed erosion-sedimentation, especially for erosion-sedimentation of the upper and lower dam, was carried out again in 2013 to obtain the predicted erosion-sedimentation that occurred. The sedimentation calculation is approximated by an erosion model from two watersheds that are similar and associated with sedimentation that occurs from the control watershed. The watershed used as a comparison is the watershed that flows into the Saguling reservoir. Observations in the control watershed and Cisokan Basin were erosion using the Universal Soil Loss Equation (USLE) erosion prediction (PLN-Geotrav Buanan Sirvey) and sedimentation using bathymetric measurements in the Saguling reservoir. The results of the analysis between erosion and sedimentation are made in the form of a graph of the relationship between erosion and sedimentation which is presented in Figure 79.
Figure 72 Relationship Between Sedimentation and River Discharge
Estimated analysis of soil erosion and sedimentation is carried out by considering factors of rainfall, soil erobility, slope, land use and land management using the USLE method resulting in an erosion rate of 1.643 mm/year
The sedimentation rate in the sub-watershed locations around the Cisokan sub-watershed shows almost the same range, namely the Cihaur sub-watershed (0.199 mm/year), Citamiang sub-watershed (0.170 mm/year), Ciawitali 2 sub-watershed (0.118 mm/year) and Cibojong Sub-watershed (01,100 mm/year). The latest sedimentation and erosion data were approximated using bathymetric measurements in the Saguling Dam.
To mitigate more specifically on smaller land units, spatial modeling of the distribution of potential erosion at the project site points around the UCPS area was carried out. Modeling is done by overlaying several supporting maps to determine the rate of erosion and potential for erosion during the construction and operation of the project. In general, the existing
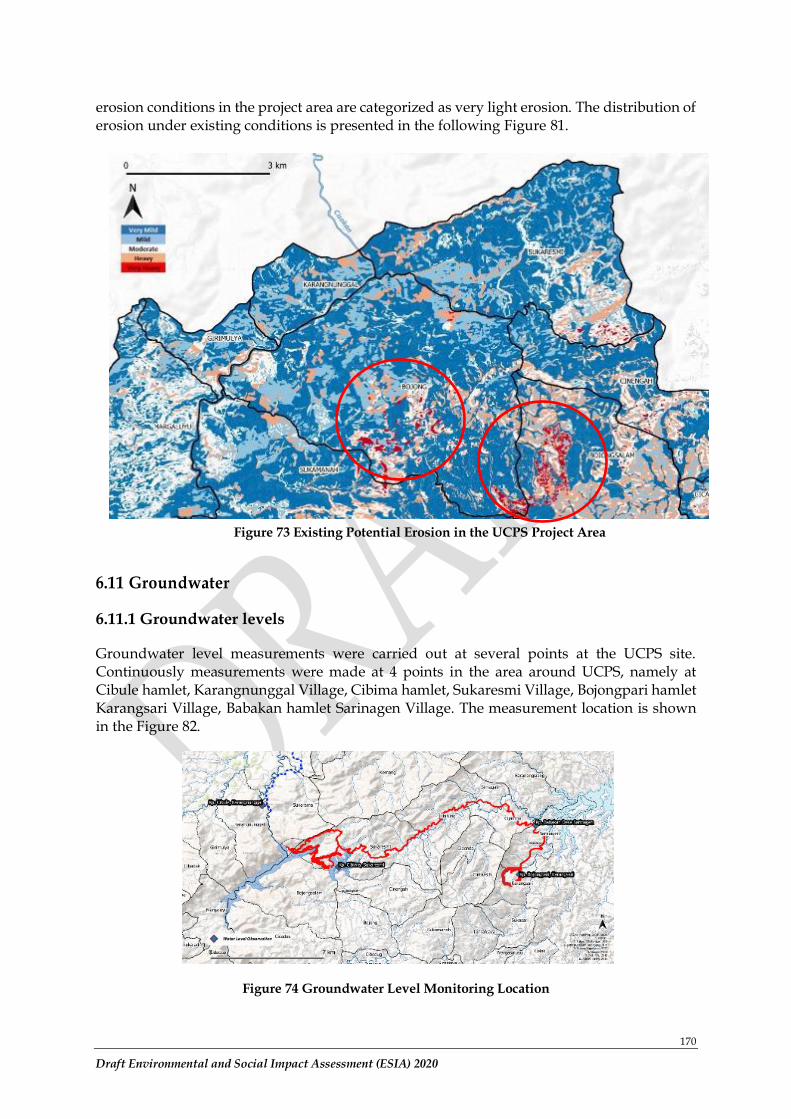
170
Draft Environmental and Social Impact Assessment (ESIA) 2020
erosion conditions in the project area are categorized as very light erosion. The distribution of erosion under existing conditions is presented in the following Figure 81.
Figure 73 Existing Potential Erosion in the UCPS Project Area
6.11 Groundwater
6.11.1 Groundwater levels
Groundwater level measurements were carried out at several points at the UCPS site. Continuously measurements were made at 4 points in the area around UCPS, namely at Cibule hamlet, Karangnunggal Village, Cibima hamlet, Sukaresmi Village, Bojongpari hamlet Karangsari Village, Babakan hamlet Sarinagen Village. The measurement location is shown in the Figure 82.
Figure 74 Groundwater Level Monitoring Location
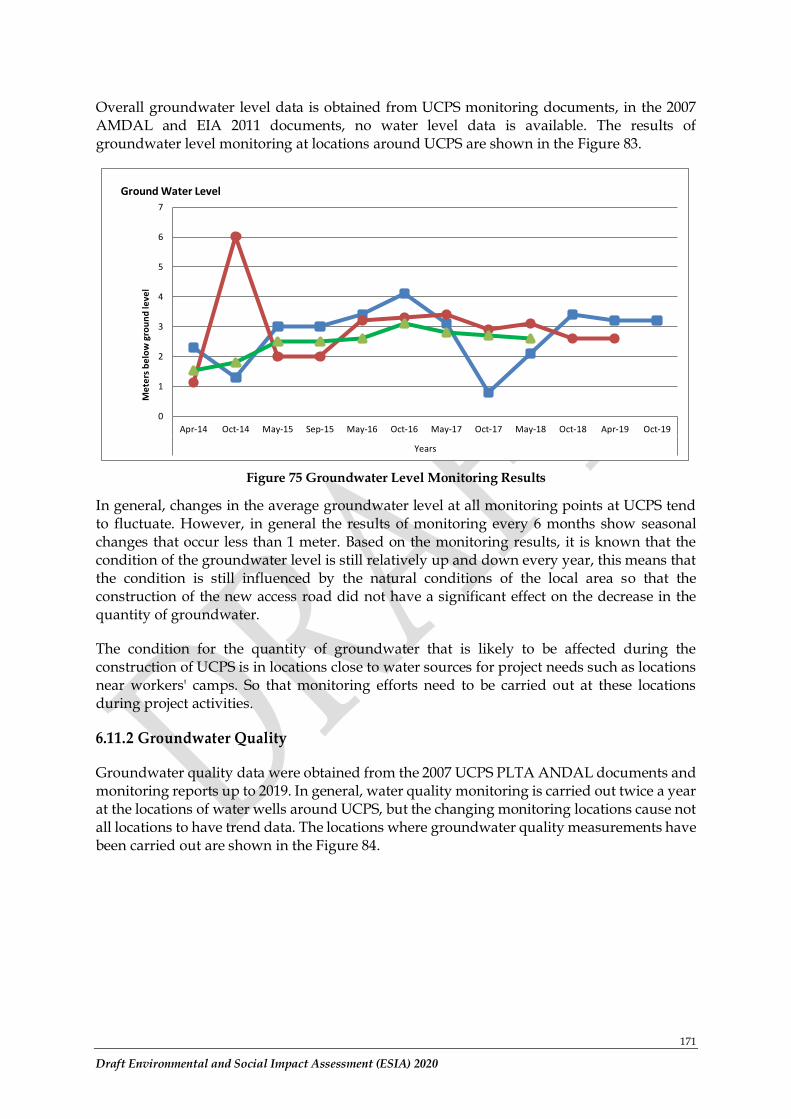
171
Draft Environmental and Social Impact Assessment (ESIA) 2020
Overall groundwater level data is obtained from UCPS monitoring documents, in the 2007 AMDAL and EIA 2011 documents, no water level data is available. The results of groundwater level monitoring at locations around UCPS are shown in the Figure 83.
Figure 75 Groundwater Level Monitoring Results
In general, changes in the average groundwater level at all monitoring points at UCPS tend to fluctuate. However, in general the results of monitoring every 6 months show seasonal changes that occur less than 1 meter. Based on the monitoring results, it is known that the condition of the groundwater level is still relatively up and down every year, this means that the condition is still influenced by the natural conditions of the local area so that the construction of the new access road did not have a significant effect on the decrease in the quantity of groundwater.
The condition for the quantity of groundwater that is likely to be affected during the construction of UCPS is in locations close to water sources for project needs such as locations near workers' camps. So that monitoring efforts need to be carried out at these locations during project activities.
6.11.2 Groundwater Quality
Groundwater quality data were obtained from the 2007 UCPS PLTA ANDAL documents and monitoring reports up to 2019. In general, water quality monitoring is carried out twice a year at the locations of water wells around UCPS, but the changing monitoring locations cause not all locations to have trend data. The locations where groundwater quality measurements have been carried out are shown in the Figure 84.
0
1
2
3
4
5
6
7
Apr-14 Oct-14 May-15 Sep-15 May-16 Oct-16 May-17 Oct-17 May-18 Oct-18 Apr-19 Oct-19
Years
Me
ters
be
low
gro
un
d le
vel
Ground Water Level
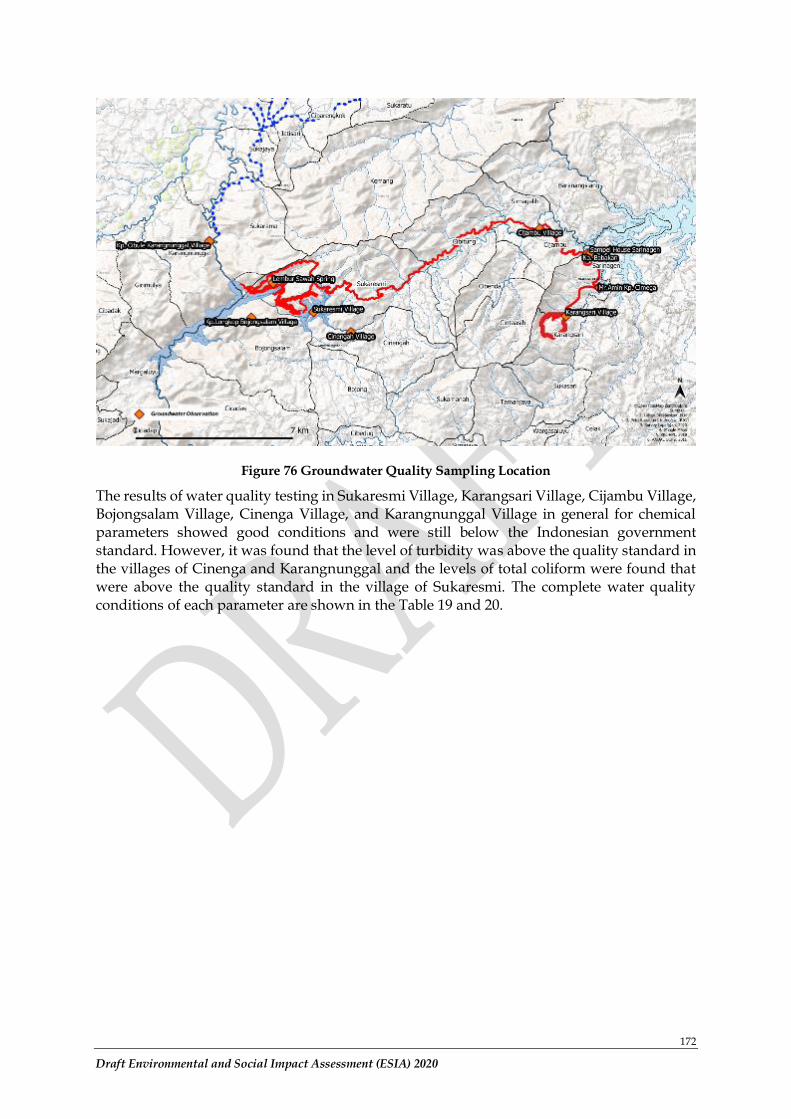
172
Draft Environmental and Social Impact Assessment (ESIA) 2020
Figure 76 Groundwater Quality Sampling Location
The results of water quality testing in Sukaresmi Village, Karangsari Village, Cijambu Village, Bojongsalam Village, Cinenga Village, and Karangnunggal Village in general for chemical parameters showed good conditions and were still below the Indonesian government standard. However, it was found that the level of turbidity was above the quality standard in the villages of Cinenga and Karangnunggal and the levels of total coliform were found that were above the quality standard in the village of Sukaresmi. The complete water quality conditions of each parameter are shown in the Table 19 and 20.
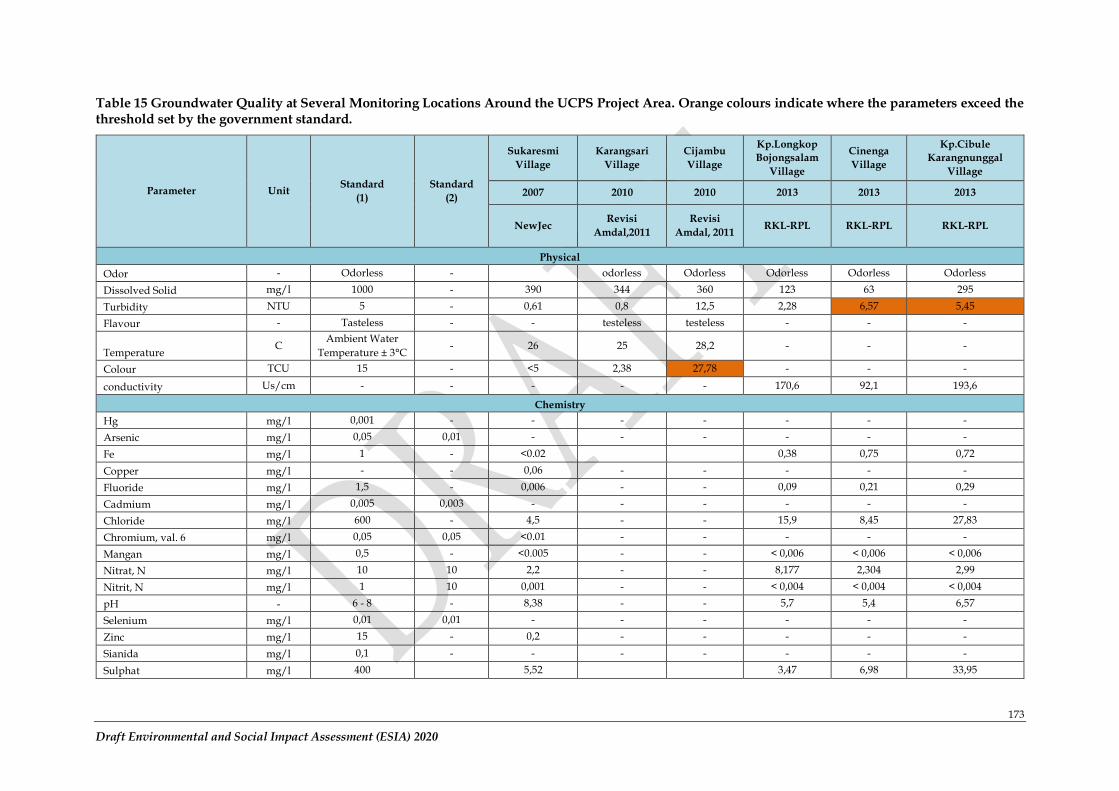
173
Draft Environmental and Social Impact Assessment (ESIA) 2020
Table 15 Groundwater Quality at Several Monitoring Locations Around the UCPS Project Area. Orange colours indicate where the parameters exceed the threshold set by the government standard.
Parameter Unit Standard
(1)
Standard
(2)
Sukaresmi
Village
Karangsari
Village
Cijambu
Village
Kp.Longkop
Bojongsalam
Village
Cinenga
Village
Kp.Cibule
Karangnunggal
Village
2007 2010 2010 2013 2013 2013
NewJec Revisi
Amdal,2011
Revisi
Amdal, 2011 RKL-RPL RKL-RPL RKL-RPL
Physical
Odor - Odorless - odorless Odorless Odorless Odorless Odorless
Dissolved Solid mg/l 1000 - 390 344 360 123 63 295
Turbidity NTU 5 - 0,61 0,8 12,5 2,28 6,57 5,45
Flavour - Tasteless - - testeless testeless - - -
Temperature C
Ambient Water
Temperature ± 3°C - 26 25 28,2 - - -
Colour TCU 15 - <5 2,38 27,78 - - -
conductivity Us/cm - - - - - 170,6 92,1 193,6
Chemistry
Hg mg/l 0,001 - - - - - - -
Arsenic mg/l 0,05 0,01 - - - - - -
Fe mg/l 1 - <0.02 0,38 0,75 0,72
Copper mg/l - - 0,06 - - - - -
Fluoride mg/l 1,5 - 0,006 - - 0,09 0,21 0,29
Cadmium mg/l 0,005 0,003 - - - - - -
Chloride mg/l 600 - 4,5 - - 15,9 8,45 27,83
Chromium, val. 6 mg/l 0,05 0,05 <0.01 - - - - -
Mangan mg/l 0,5 - <0.005 - - < 0,006 < 0,006 < 0,006
Nitrat, N mg/l 10 10 2,2 - - 8,177 2,304 2,99
Nitrit, N mg/l 1 10 0,001 - - < 0,004 < 0,004 < 0,004
pH - 6 - 8 - 8,38 - - 5,7 5,4 6,57
Selenium mg/l 0,01 0,01 - - - - - -
Zinc mg/l 15 - 0,2 - - - - -
Sianida mg/l 0,1 - - - - - - -
Sulphat mg/l 400 5,52 3,47 6,98 33,95
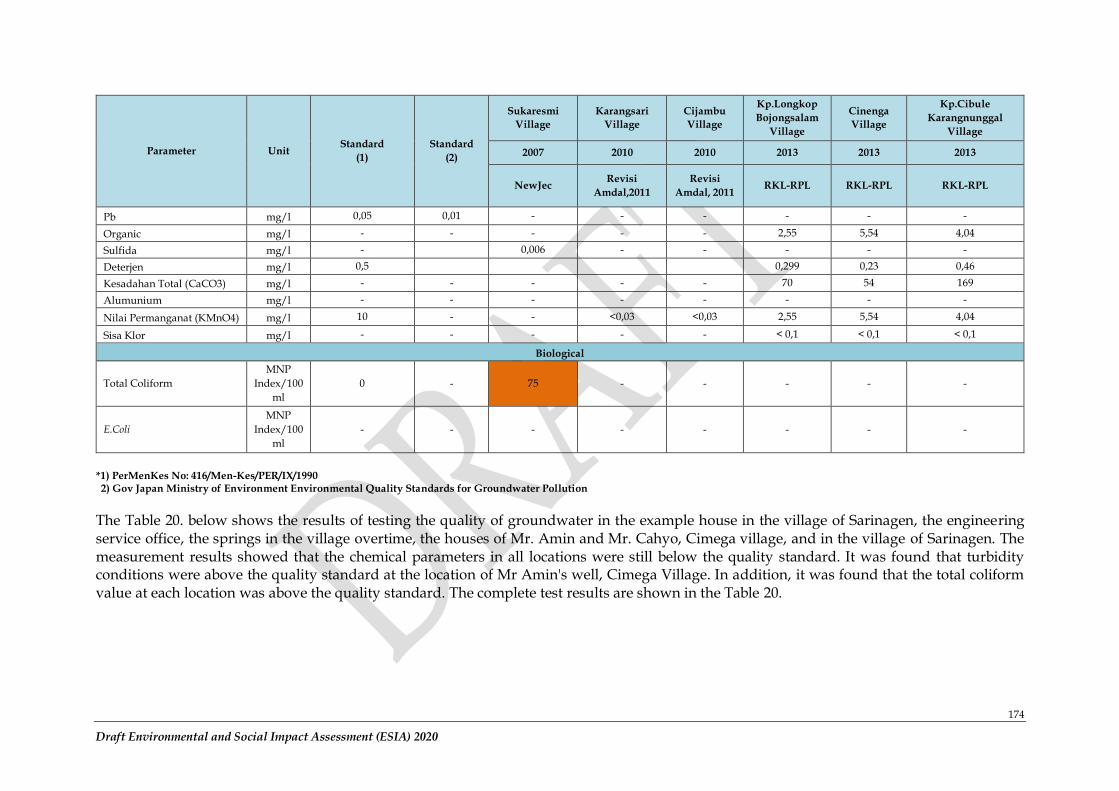
174
Draft Environmental and Social Impact Assessment (ESIA) 2020
Parameter Unit Standard
(1)
Standard
(2)
Sukaresmi
Village
Karangsari
Village
Cijambu
Village
Kp.Longkop
Bojongsalam
Village
Cinenga
Village
Kp.Cibule
Karangnunggal
Village
2007 2010 2010 2013 2013 2013
NewJec Revisi
Amdal,2011
Revisi
Amdal, 2011 RKL-RPL RKL-RPL RKL-RPL
Pb mg/l 0,05 0,01 - - - - - -
Organic mg/l - - - - - 2,55 5,54 4,04
Sulfida mg/l - 0,006 - - - - -
Deterjen mg/l 0,5 0,299 0,23 0,46
Kesadahan Total (CaCO3) mg/l - - - - - 70 54 169
Alumunium mg/l - - - - - - - -
Nilai Permanganat (KMnO4) mg/l 10 - - <0,03 <0,03 2,55 5,54 4,04
Sisa Klor mg/l - - - - - < 0,1 < 0,1 < 0,1
Biological
Total Coliform
MNP
Index/100
ml
0 - 75 - - - - -
E.Coli
MNP
Index/100
ml
- - - - - - - -
*1) PerMenKes No: 416/Men-Kes/PER/IX/1990 2) Gov Japan Ministry of Environment Environmental Quality Standards for Groundwater Pollution
The Table 20. below shows the results of testing the quality of groundwater in the example house in the village of Sarinagen, the engineering service office, the springs in the village overtime, the houses of Mr. Amin and Mr. Cahyo, Cimega village, and in the village of Sarinagen. The measurement results showed that the chemical parameters in all locations were still below the quality standard. It was found that turbidity conditions were above the quality standard at the location of Mr Amin's well, Cimega Village. In addition, it was found that the total coliform value at each location was above the quality standard. The complete test results are shown in the Table 20.
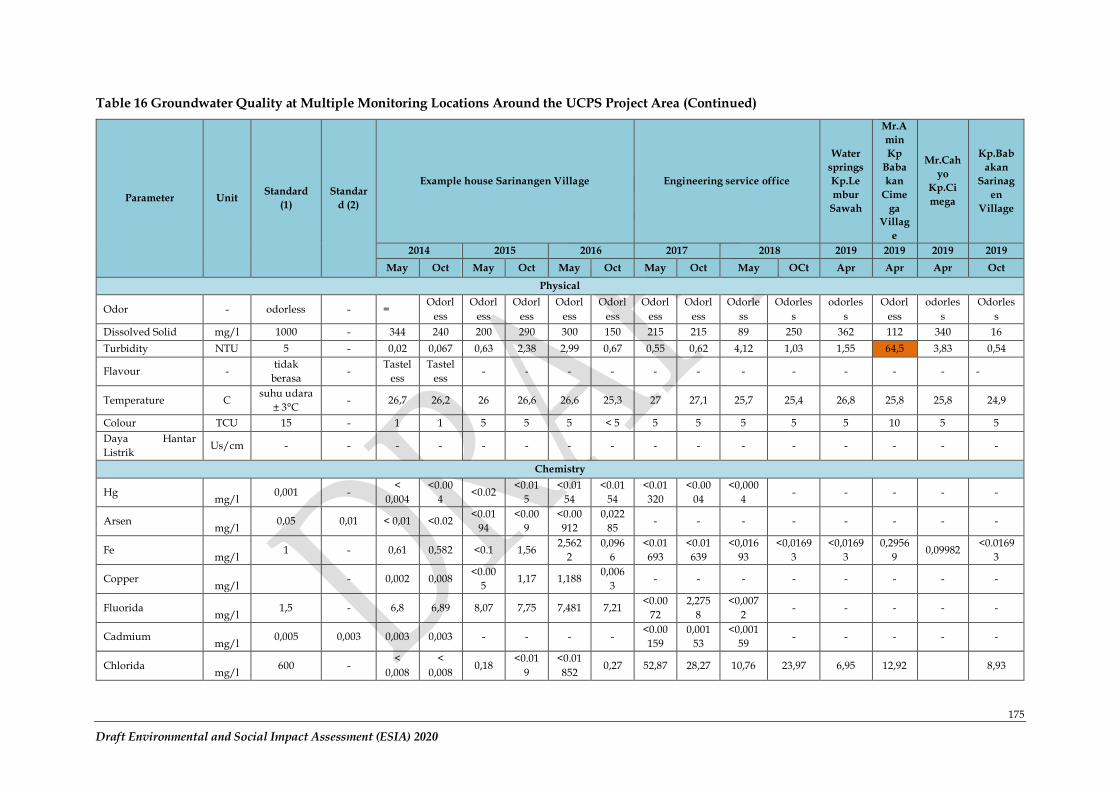
175
Draft Environmental and Social Impact Assessment (ESIA) 2020
Table 16 Groundwater Quality at Multiple Monitoring Locations Around the UCPS Project Area (Continued)
Parameter Unit Standard
(1)
Standar
d (2)
Example house Sarinangen Village Engineering service office
Water
springs
Kp.Le
mbur
Sawah
Mr.A
min
Kp
Baba
kan
Cime
ga
Villag
e
Mr.Cah
yo
Kp.Ci
mega
Kp.Bab
akan
Sarinag
en
Village
2014 2015 2016 2017 2018 2019 2019 2019 2019
May Oct May Oct May Oct May Oct May OCt Apr Apr Apr Oct
Physical
Odor - odorless - = Odorl
ess
Odorl
ess
Odorl
ess
Odorl
ess
Odorl
ess
Odorl
ess
Odorl
ess
Odorle
ss
Odorles
s
odorles
s
Odorl
ess
odorles
s
Odorles
s
Dissolved Solid mg/l 1000 - 344 240 200 290 300 150 215 215 89 250 362 112 340 16
Turbidity NTU 5 - 0,02 0,067 0,63 2,38 2,99 0,67 0,55 0,62 4,12 1,03 1,55 64,5 3,83 0,54
Flavour - tidak
berasa -
Tastel
ess
Tastel
ess - - - - - - - - - - - -
Temperature C suhu udara
± 3°C - 26,7 26,2 26 26,6 26,6 25,3 27 27,1 25,7 25,4 26,8 25,8 25,8 24,9
Colour TCU 15 - 1 1 5 5 5 < 5 5 5 5 5 5 10 5 5
Daya Hantar
Listrik Us/cm - - - - - - - - - - - - - - - -
Chemistry
Hg mg/l
0,001 - <
0,004
<0.00
4 <0.02
<0.01
5
<0.01
54
<0.01
54
<0.01
320
<0.00
04
<0,000
4 - - - - -
Arsen mg/l
0,05 0,01 < 0,01 <0.02 <0.01
94
<0.00
9
<0.00
912
0,022
85 - - - - - - - -
Fe mg/l
1 - 0,61 0,582 <0.1 1,56 2,562
2
0,096
6
<0.01
693
<0.01
639
<0,016
93
<0,0169
3
<0,0169
3
0,2956
9 0,09982
<0.0169
3
Copper mg/l
- 0,002 0,008 <0.00
5 1,17 1,188
0,006
3 - - - - - - - -
Fluorida mg/l
1,5 - 6,8 6,89 8,07 7,75 7,481 7,21 <0.00
72
2,275
8
<0,007
2 - - - - -
Cadmium mg/l
0,005 0,003 0,003 0,003 - - - - <0.00
159
0,001
53
<0,001
59 - - - - -
Chlorida mg/l
600 - <
0,008
<
0,008 0,18
<0.01
9
<0.01
852 0,27 52,87 28,27 10,76 23,97 6,95 12,92 8,93
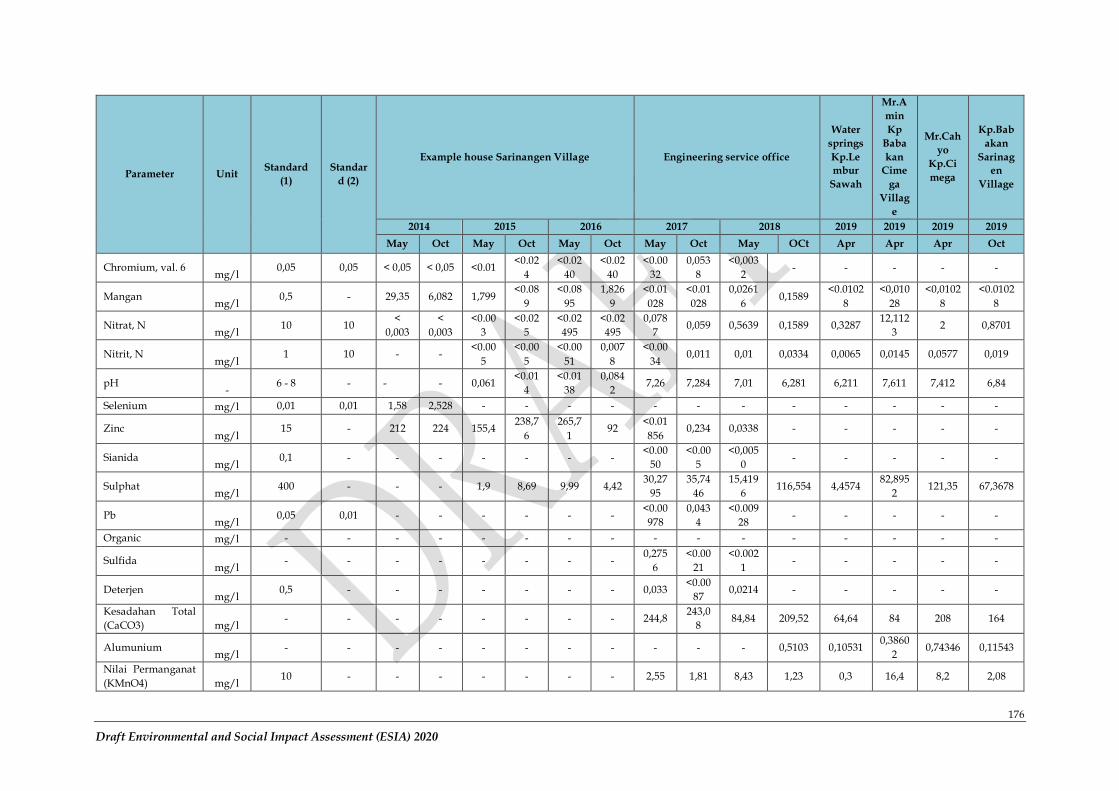
176
Draft Environmental and Social Impact Assessment (ESIA) 2020
Parameter Unit Standard
(1)
Standar
d (2)
Example house Sarinangen Village Engineering service office
Water
springs
Kp.Le
mbur
Sawah
Mr.A
min
Kp
Baba
kan
Cime
ga
Villag
e
Mr.Cah
yo
Kp.Ci
mega
Kp.Bab
akan
Sarinag
en
Village
2014 2015 2016 2017 2018 2019 2019 2019 2019
May Oct May Oct May Oct May Oct May OCt Apr Apr Apr Oct
Chromium, val. 6 mg/l
0,05 0,05 < 0,05 < 0,05 <0.01 <0.02
4
<0.02
40
<0.02
40
<0.00
32
0,053
8
<0,003
2 - - - - -
Mangan mg/l
0,5 - 29,35 6,082 1,799 <0.08
9
<0.08
95
1,826
9
<0.01
028
<0.01
028
0,0261
6 0,1589
<0.0102
8
<0,010
28
<0,0102
8
<0.0102
8
Nitrat, N mg/l
10 10 <
0,003
<
0,003
<0.00
3
<0.02
5
<0.02
495
<0.02
495
0,078
7 0,059 0,5639 0,1589 0,3287
12,112
3 2 0,8701
Nitrit, N mg/l
1 10 - - <0.00
5
<0.00
5
<0.00
51
0,007
8
<0.00
34 0,011 0,01 0,0334 0,0065 0,0145 0,0577 0,019
pH -
6 - 8 - - - 0,061 <0.01
4
<0.01
38
0,084
2 7,26 7,284 7,01 6,281 6,211 7,611 7,412 6,84
Selenium mg/l 0,01 0,01 1,58 2,528 - - - - - - - - - - - -
Zinc mg/l
15 - 212 224 155,4 238,7
6
265,7
1 92
<0.01
856 0,234 0,0338 - - - - -
Sianida mg/l
0,1 - - - - - - - <0.00
50
<0.00
5
<0,005
0 - - - - -
Sulphat mg/l
400 - - - 1,9 8,69 9,99 4,42 30,27
95
35,74
46
15,419
6 116,554 4,4574
82,895
2 121,35 67,3678
Pb mg/l
0,05 0,01 - - - - - - <0.00
978
0,043
4
<0.009
28 - - - - -
Organic mg/l - - - - - - - - - - - - - - - -
Sulfida mg/l
- - - - - - - - 0,275
6
<0.00
21
<0.002
1 - - - - -
Deterjen mg/l
0,5 - - - - - - - 0,033 <0.00
87 0,0214 - - - - -
Kesadahan Total
(CaCO3) mg/l - - - - - - - - 244,8
243,0
8 84,84 209,52 64,64 84 208 164
Alumunium mg/l
- - - - - - - - - - - 0,5103 0,10531 0,3860
2 0,74346 0,11543
Nilai Permanganat
(KMnO4) mg/l 10 - - - - - - - 2,55 1,81 8,43 1,23 0,3 16,4 8,2 2,08
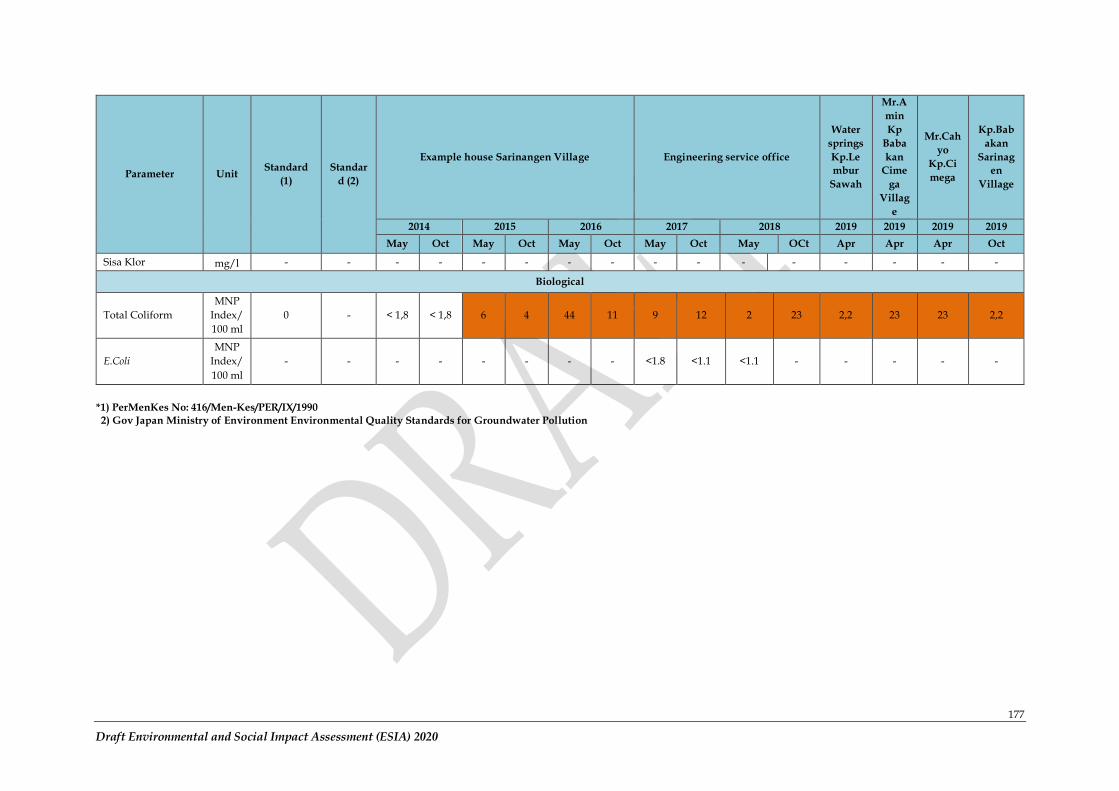
177
Draft Environmental and Social Impact Assessment (ESIA) 2020
Parameter Unit Standard
(1)
Standar
d (2)
Example house Sarinangen Village Engineering service office
Water
springs
Kp.Le
mbur
Sawah
Mr.A
min
Kp
Baba
kan
Cime
ga
Villag
e
Mr.Cah
yo
Kp.Ci
mega
Kp.Bab
akan
Sarinag
en
Village
2014 2015 2016 2017 2018 2019 2019 2019 2019
May Oct May Oct May Oct May Oct May OCt Apr Apr Apr Oct
Sisa Klor mg/l - - - - - - - - - - - - - - - -
Biological
Total Coliform
MNP
Index/
100 ml
0 - < 1,8 < 1,8 6 4 44 11 9 12 2 23 2,2 23 23 2,2
E.Coli
MNP
Index/
100 ml
- - - - - - - - <1.8 <1.1 <1.1 - - - - -
*1) PerMenKes No: 416/Men-Kes/PER/IX/1990
2) Gov Japan Ministry of Environment Environmental Quality Standards for Groundwater Pollution
178
Draft Environmental and Social Impact Assessment (ESIA) 2020
6.12 Biodiversity
The biodiversity section is prepared in accordance with the World Bank Environmental and Social Standard 6 (ESS6) Biodiversity Conservation and Sustainable Management of Living Natural Resources, ESF Guidance Note 6 Biodiversity Conservation, as well as relevant Indonesian laws and regulations. The International Finance Corporation (IFC) Performance Standard (PS) 6 was also used to provide guidance on identifying Critical Habitat triggers and assessment of offset requirements.
The objectives of ESS 6 are:
• To protect and conserve biodiversity and habitats.
• To apply the mitigation hierarchy and the precautionary approach in the design and implementation of projects that could have an impact on biodiversity.
• To promote the sustainable management of living natural resources.
• To support livelihoods of local communities, including Indigenous Peoples, and inclusive economic development through the adoption of practices that integrate conservation needs and development priorities.
The following sections outline the assessment of terrestrial and aquatic biodiversity values undertaken within the UCPS footprint area. Biodiversity surveys commenced in 2009 to establish the baseline but follow up surveys were conducted 2012, 2104, 2015 and 2020. The focus of the surveys was to:
• Determine presence of likely presence of aquatic and terrestrial biodiversity values that may trigger critical habitat (as defined under ESS6);
• Delineate the areas of natural and modified habitat according to the definition contained with ESS6; and
• Deterine the existing ecological health/condition of aquatic and terrestrial biodiversity values and threats, including invasive alien species.
6.12.1 Regional Biodiversity Values
Indonesia is among the most biologically diverse nations on Earth, ranking third behind Brazil and Colombia in total species richness, and second in terms of endemic species (Mittermeier et al. 2005; Whitten et al. 2004). The country supports the third largest expanse of tropical forest in the world (behind Brazil and the Democratic Republic of Congo). It encompasses two of the world’s seven major biogeographic regions, two of the world’s 25 Biodiversity Hotspots, 21 of 238 Global Ecoregions (WWF) and 23 of the world’s 218 Endemic Bird Areas (BirdLife International). Indonesia contains some 17% of all known species on Earth, including an estimated 11% of the world’s plant species, 12% of its mammals, 16% of all reptile and amphibian species, 17% of birds and 25% or more of all fish species (Mittermeier & Mittermeier 1998).
179
Draft Environmental and Social Impact Assessment (ESIA) 2020
Java Island is located in the south-west of the Malayan Archipelago, an area of extremely high levels of species diversity in the contact zone between Australasian and Indomalayan biological regions. Some 6,500 species of plant have been reported on Java, of which 4,500 are native to the island, and some 325 only occur on Java, i.e., they are endemic to the island (Whitten et al. 1996). Some of the rarer and many endemic plants have only been collected once and their status in the wild is poorly known, making it hard to develop and implement effective conservation programs for protecting them.
Java is also rich in animal species, although not as rich as during the Pleistocene when a varied fauna existed that included dirk-toothed cats, pygmy hippopotamuses, and a range of elephant-like species (Louys & Meijaard 2010). Still, a rich fauna remains with a wide-variety of mammal species, many of which are endemic to the island, birds, reptiles, fish and amphibians, as well as numerous invertebrate species. A count of these vertebrate species in 1996 totaled 864 species on Java (Whitten et al. 1996), but since then many new species discoveries and taxonomic revisions have added a considerable number and the total is now close to 1,000 species.
Java mostly consists of a long chain of volcanoes which have created some of the most fertile soils in the South-East Asian region. The island therefore has a long history of agricultural use and it supports some of the highest human population densities in the world. This high population density and demand for agricultural land has resulted in high deforestation rates. Especially lowland and coastal forests have been targeted and few such stands now remain. Presently only about 1.1 million hectares of forest remain on Java (Prasetyo et al. 2013), covering about 7% of the land area. Most of these forests, like those in Cisokan, are at high elevation.
Because most species on Java are ecologically associated with or dependent on forests, the island’s high deforestation rates are a major threat to its species. In addition, collection and hunting pressure is also high. With 58% of interviewed households on Java having had a cage bird in the past 10 years, and most birds being obtained from the wild (Jepson & Ladle 2009), it is obvious how high the collection pressure is in Indonesian forests. This also includes mammal species, such as pangolins, and reptiles such as the common gecko, which are both highly valued for the medicinal trade, and increasingly rare in the wild (Meijaard & Achdiawan 2011). Thus, there are few forests on Java that remain pristine and with a complete fauna. As a result, there are presently 44 species on Java listed as Critically Endangered or Endangered on the IUCN Red List of Threatened Species, the global authority on species conservation needs.
6.12.2 Floral Biodiversity
The vegetation type survey has been conducted since 1995. The most comprehensive survey is a survey conducted by Rahmat (2009). Based on field observations, 226 plant species were found from around 69 plant families. The access road location has the highest number of plant species, namely 173 species, quite large compared to the mining area, which has the least number of plant species, namely 86 species. The access road has various habitats along the track, while in the quarry area, forest vegetation has been clearing for a long time and is now dominated by grass and shrubs. No rare or protected plants were found during the survey period whereas, laurel (Eugenia polyantha), baros (Magnolia glauca), manglid (Magnolia blumei), and kitambaga (Eugenis cuprea) were rarely encountered under land use stress. The most intact and diverse native vegetation community is the secondary forest at the Cirumamis River's location.
180
Draft Environmental and Social Impact Assessment (ESIA) 2020
Based on the 2019 vegetation survey results at the research location, the plant composition of 135 plant species from 54 families was obtained (see Appendix A1 for full species list). Vegetation communities obtained per study location are 113 types on existing roads, 116 types on access roads, 90 types on lower dams, and 70 types on upper dams. Of the four locations, the highest number of plant species was at the access road location, namely 116 plant species. This number means that the access road's study location is still in good condition and supports the vegetation's life. The number of plant species was obtained per category from the total locations, namely tree category with 25 plant species, 45 plant species for pole category, 47 plant species for saplings, 28 plant species for saplings with 40 types of ground cover. This number shows that in the research location, there is still a complete vegetation community structure..
The 2019 vegetation survey identified several plant species that are included in the IUCN Red List conservation status (see Appendix A1). From the monitoring of vegetation communities in all study locations, 4 species with conservation status Least Concern (LC) were identified. The vegetation in the UCPS area is dominated by common and introduced species but one Endangered species (Rosewood) and one Vulnerable species (Merkus’s Pine) were identified in the UCPS area.
Tree species found along the transmission line route include Bamboo (Bambusa sp.), Albasiah (Paraserianthes falcataria), Mahogany (Switenia mahagony), Mindi (Melia azaderachta), Teak (Tectona grandis), Kihiang (Albizia procera), Saga (Adenanthera pavonina), Suren (Toona sureni), and Tisuk (Hibiscus macrophyllus). While the many non-timber groups found on the transmission line are: Banana Plants (Musa paradisiaca), Snakefruit (Salacca edulis), Coffee (Coffea sp.), Sugarpalm (Arenga pinnata), Durian (Durio zibethinus), Jengkol (Pithecelobium jeringa), Jackfruit (Artocarpus integra), Petai (Parkia speciosa), Vanilla (Vanilla sp.).
6.12.3 Faunal Biodiversity
Mammals found directly in the 2012 survey were Small Indian Civet (Viverricula malaccensis), Squirrel (Tupaia sp.), and Rats (Rattus sp.), While other types of mammals obtained from local community information were wild boar (Sus scrofa) and Oriental Small-clawed Otter (Aonyx cinerea). Meanwhile, the 2020 field survey identified 16 species of mammals around the Transmission Line and 11 of them have high conservation value. According to the Ministry of Environment and Forestry Regulation No. P. 106 in 2018, six types of mammals are included in the protected species.
According to the IUCN Criteria, there are as many as six species of important mammals. Two species are categorized as Critically Endangered (CR), which means that they have the highest threat of extinction. Two types are included in the Endangered (EN) category, which means the species with the second-highest extinction threat level. The last two species which are vulnerable to extinction are categorized in the Vulnerable (VU) category.
According to the CITES criteria, there are as many as eight types of mammals with high conservation value. Two of these are included in the CITES Appendix I, which means that these types of mammals are considered very rare. Their use is only in cases of extraordinary nature (not for commercial purposes) and regulation. Strict regulations govern trade in this category. Three types of mammals are included in Appendix II of CITES, which means that this species is considered rare but can still be used on a limited basis through a quota and supervision system.
181
Draft Environmental and Social Impact Assessment (ESIA) 2020
The role of scientific authorities in the process of granting export and import permits is also crucial. As many as five species are included in Appendix III CITES, these mammals are considered very rare for certain countries/regions. Hence, they need to be protected from exploitation. In this category, scientific and management authorities play a significant role in the licensing process.
Several species with conservation status need attention, such as Oriental Small-clawed Otter (VU), Pangolin (CR), Grizzled Leaf Monkey (EN), Javan Langur (VU), Less (CR). The large number of mammals found is supported by the ecosystem's condition in the transmission line location, which currently tends to have no significant holes. Currently, the location of the Transmission Line is still good and supports the life of Mammals.
The reptiles identified in the 2012 survey included a protected species, the gibug snake (Trimersurus puniceus). Besides, there are also Flying Lizards (Draco volans), Chameleons (Calotes jubattes), and Lizards (Mabuia multifasciata). As many as 29 herpetofauna species were recorded during the survey at the Transmission Route location, which consists of four types of amphibians and 25 species of reptiles. Of the Amphibian class, the most recorded species composition came from the Dicroglossidae family, with two species. The Bufonidae Family and the Rhacophoridae Family are also recorded, each with one species.
For the Reptile class, from the snake's group, the composition of species recorded was mostly from the Colubridae family, with seven species; this was followed by the Elapidae Family of three types; and two types of family Pythonidae. Meanwhile, from the lizard group, the Gekkonidae family was the family with the most species records, namely four species; followed by the Agamidae Family with three types; There are two types of family Scincidae; as well as one type of Family Lacertidae and Varanidae each.
Avifauna found on the Transmission Line in the 2012 survey totaled 37 dominant species, with five protected bird species (see Appendix). The 2020 field survey identified 55 types of avifauna from 23 families, of which 16 species have high conservation value because the five types of avifauna are protected according to the Ministry of Environment and Forestry Regulation No. P. 106 in 2018. Five types of avifauna are included in appendix II, while four types are endemic, namely those with limited distribution, and four types including migrant avifauna, where this type of migrant avifauna does not breed in Indonesia
One example of a protected type of avifauna included in the CITES appendix II and a migrant type is Pernis ptilorhynchus Temminck, 1821. Meanwhile, Halcyon cyanoventris Vieillot, 1818 is an example of an endemic species avifauna which has limited distribution. There is as much as one type of avifauna recorded in this study that has never been recorded in previous studies, namely the Sikatan Bubik (Muscicapa dauurica Pallas, 1811).
The abundance of avifauna species indicates that the transmission line area is still a good location for avifauna life. There is a risk of displacement of the migratory swallows (Hirundo rustica) rest area to the transmission line from the current place around Ciranjang Market, although the risk is small and has not occurred at this time but needs to be watched out. Currently there are an existing transmission line (Saguling) but the displacement of bird is also not occurring. This because the warmer temperature in the existing bird rest area, the presence of crowds, and sufficient food sources, which are not found in the existing or future transmission line areas.
182
Draft Environmental and Social Impact Assessment (ESIA) 2020
6.12.4 Aquatic Biodiversity
Broad studies on the macro invertebrate and fish communities have been undertaken that, along with the water quality data, provide a basic picture of the health of the aquatic environment and its ability to support a functioning ecosystem.
Macro invertebrates
Changes in water quality as a result of nutrients entering the aquatic environment will affect the life of plankton and benthos (i.e., communities of the stream bottom), which in turn influences the survival of fish and aquatic larvae. Furthermore, the abundance and diversity of benthos are useful bio-indicators of water quality, because different species have different sensitivities of the types and concentrations of pollutants. The low mobility of benthos and their rapid responses to environmental substances, makes it relatively easy to obtain, identify and analyze benthos as aquatic indicators compared to other organisms. Indirectly, the benthos indicators through their availability as food for fish and amphibians, become general indicators of water and habitat quality.
The river geomorphology, river flow and water quality data described in the earlier section on hydrology suggest that there should be reasonable habitat available for a wide range of macro-invertebrates, including beetles, mayflies, caddis flies, stoneflies, snails and mollusks, despite reduced water quality and sedimentation. The macro invertebrate samples from 2006 show poor representation of macro invertebrate communities at all seven water quality sampling sites. There were few individuals collected at each site (2 – 33), and low diversity of species (<6). The most abundant genera were snails, which are generally tolerant of poor water quality. Indicators of good water quality and healthy benthic habitat, such as mayflies, caddis flies and stonefly larvae, were present, but not abundant. The results of the abundance analysis of plankton, phytoplankton, and benthos using the dominance index indicated mild, moderate, or severe pollution depending on which indicator was used. The phytoplankton dominance index shows that the sample location is still in a lightly polluted condition, but if the analysis uses the benthos approach, the study location is included in the moderate-heavy category. This was possible because the sampling method used did not match the characteristics of the location. The level of pollution based on the abundance of aquatic biota using the dominance index is shown in the table below.
The abundance of plankton varies in each river between 1320 and 4140 ind./L. These results are divided into 2 categories, namely oligotrophic waters in the Cijambu and Cilengkong Rivers, and the upstream parts of the Cirumamis and Cisokan Rivers, with plankton quantities of 1410-1830 ind/L. The oligotrophic category of less than 2000 ind/L also indicates that the waters are still clean and have not been polluted by nutrients (Suryanto and Umi, 2009). According to Zulfa and Aisyah (2013), oligotrophic waters are generally clear and there is no abundance of aquatic plants and algae. Meanwhile, the downstream Cirumamis and Cisokan Rivers are mesotrophic with a plankton abundance of 2610-4140 ind/L which means they have moderate levels of nutrient pollution, likely resulting from anthropogenic activities in downstream areas such as agricultural activities.
Table 20. Plankton and Benthos identification Year 2019
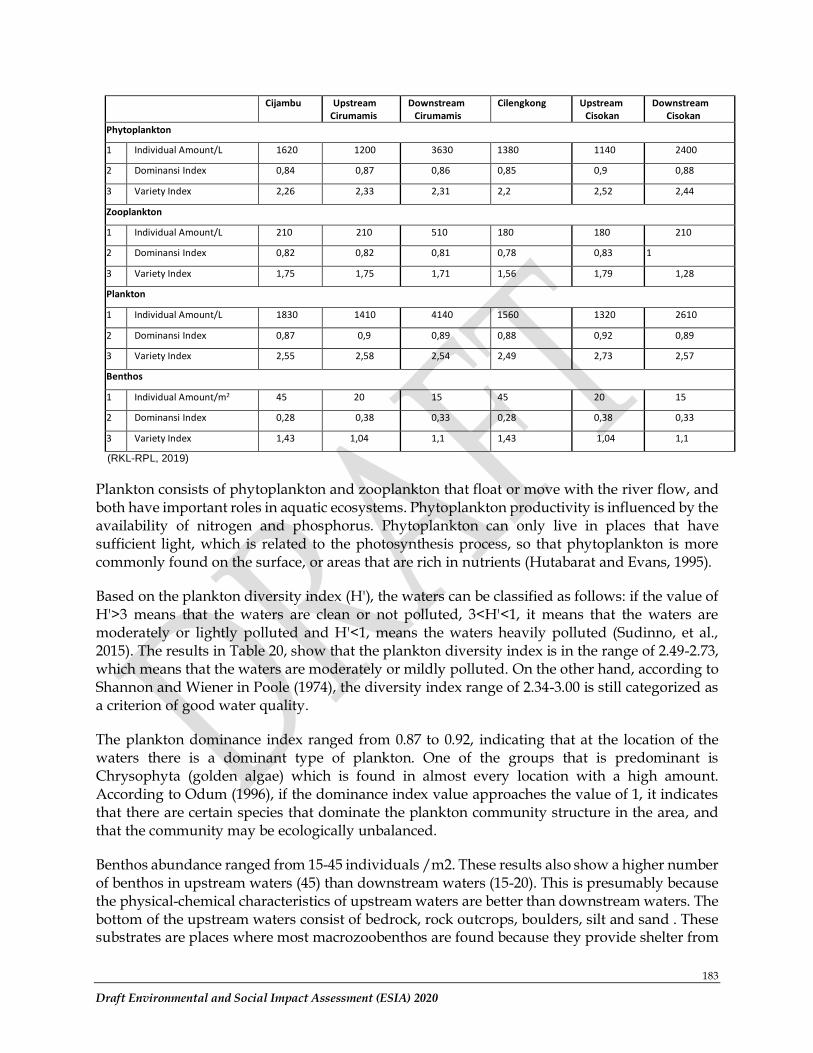
183
Draft Environmental and Social Impact Assessment (ESIA) 2020
Cijambu Upstream Cirumamis
Downstream Cirumamis
Cilengkong Upstream Cisokan
Downstream Cisokan
Phytoplankton
1 Individual Amount/L 1620 1200 3630 1380 1140 2400
2 Dominansi Index 0,84 0,87 0,86 0,85 0,9 0,88
3 Variety Index 2,26 2,33 2,31 2,2 2,52 2,44
Zooplankton
1 Individual Amount/L 210 210 510 180 180 210
2 Dominansi Index 0,82 0,82 0,81 0,78 0,83 1
3 Variety Index 1,75 1,75 1,71 1,56 1,79 1,28
Plankton
1 Individual Amount/L 1830 1410 4140 1560 1320 2610
2 Dominansi Index 0,87 0,9 0,89 0,88 0,92 0,89
3 Variety Index 2,55 2,58 2,54 2,49 2,73 2,57
Benthos
1 Individual Amount/m2 45 20 15 45 20 15
2 Dominansi Index 0,28 0,38 0,33 0,28 0,38 0,33
3 Variety Index 1,43 1,04 1,1 1,43 1,04 1,1
(RKL-RPL, 2019)
Plankton consists of phytoplankton and zooplankton that float or move with the river flow, and both have important roles in aquatic ecosystems. Phytoplankton productivity is influenced by the availability of nitrogen and phosphorus. Phytoplankton can only live in places that have sufficient light, which is related to the photosynthesis process, so that phytoplankton is more commonly found on the surface, or areas that are rich in nutrients (Hutabarat and Evans, 1995).
Based on the plankton diversity index (H'), the waters can be classified as follows: if the value of H'>3 means that the waters are clean or not polluted, 3<H'<1, it means that the waters are moderately or lightly polluted and H'<1, means the waters heavily polluted (Sudinno, et al., 2015). The results in Table 20, show that the plankton diversity index is in the range of 2.49-2.73, which means that the waters are moderately or mildly polluted. On the other hand, according to Shannon and Wiener in Poole (1974), the diversity index range of 2.34-3.00 is still categorized as a criterion of good water quality.
The plankton dominance index ranged from 0.87 to 0.92, indicating that at the location of the waters there is a dominant type of plankton. One of the groups that is predominant is Chrysophyta (golden algae) which is found in almost every location with a high amount. According to Odum (1996), if the dominance index value approaches the value of 1, it indicates that there are certain species that dominate the plankton community structure in the area, and that the community may be ecologically unbalanced.
Benthos abundance ranged from 15-45 individuals /m2. These results also show a higher number of benthos in upstream waters (45) than downstream waters (15-20). This is presumably because the physical-chemical characteristics of upstream waters are better than downstream waters. The bottom of the upstream waters consist of bedrock, rock outcrops, boulders, silt and sand . These substrates are places where most macrozoobenthos are found because they provide shelter from
184
Draft Environmental and Social Impact Assessment (ESIA) 2020
currents (Meisaroh, et al, 2019). Meanwhile, downstream waters have a muddy sand substrate which is less suitable for macrozoobenthos as it is less well protected from currents (Koesbiono 1979). The low value of several parameters of water quality, likely related to human activities, is also thought to affect the level of abundance of macrozoobenthos (Meisaroh, et al, 2019).
The dominance index for benthos ranges from 0.28 to 0.38, which according to Odum (1993) indicates low dominance criteria. These results indicate no species dominate and the number of species obtained is high. A low dominance index means that no species dominates significantly, suggesting stable environmental conditions and low ecological pressure in these waters.
Shrimp and Fish
Only one species of shrimp has been identified in the UCPS area, the river shrimp (Macrobrachium rosenbergii), which was found during river surveys in 2015 and 2016 in all river systems. This is a small part of the total of 20-30 shrimp species that could occur in Javan streams (Hernawati et al. 2020), but it is unclear whether this diversity was overlooked in the surveys (e.g., because of insufficient taxonomic knowledge of this group), or because indeed the shrimp diversity is low in the area. Additional surveys would be required to assess the diversity of this group, which includes the Endangered species Macrobrachium poeti and M. leptodactylus from West Java, which is listed as Extinct, as it hasn’t been found in 30 years.
The initial fish surveys were conducted in 2009 by Rahmat (2009) who described 19 species. Subsequent surveys were conducted in 2012 with 15 species identified (LIPI, 2012), and more recently in 2020 a total of 17 species was found. When compared with the total number of freshwater fish species recorded on Java, which is 135 species, the location shows poor fish species diversity. The fish species found in Cisokan are all generally common in Java, and are often used for consumption by local people. Eighty percent of the fish species found in Cisokan are native to Java, with 20% being introduced, including Guppy (Poecillia reticulata), Platyfish (Xiphophorus helleri) and Cichlid (Aequidens rivulatus). Some types of fish such as Rasbora lateristriata and Hemibagrus nemurus which are usually found in highland rivers, are difficult to obtain using fish sampling techniques (LIPI, 2012). The fish species were assessed for conservation status, and national protection status but none met any of these criteria.
Local species that are categorized as difficult to find should be carefully monitored, such as Kancra (Tor douronensis) (see 8.2.2. regarding the cultural importance of this species), and Sengal (Macrones nemurus). These are local migratory species whose behaviour might be influenced by changes in riverbank habitats that flow to flooded rivers. A similarly low-density species, Hampala (Hampala macrolepidota), was found in the 2009 study but not in the following 10 years, until in the 2020 field study it was again confirmed. This could indicate local population fluctuations because of changing river conditions or supra-annual dispersal of populations to different parts of the river system.
Tilapia, goldfish and catfish are categorized as food species and can live in a variety of habitats, including slow-flowing habitats, river and lake environments and environments with soft sediments. Catfish can also live in rice fields and hypoxic and muddy environments. Tilapia are included in the IUCN top list as the worst alien species to disrupt native species from their habitat. Other species, such as Channa gachua, are not native fish, but have a high tolerance for temperature and pH changes. Guppies prefer fast-flowing habitats, along with the Platyfish are
185
Draft Environmental and Social Impact Assessment (ESIA) 2020
categorized as non-native fish which are not a food source. Both fish are omnivorous and can survive on a variety of food sources.
In general, the fish species that occur in the UCPS area are potamodromous species (which migrate locally from freshwater to other freshwater). The only amphidromous species found are tilapia, which are species that migrate from freshwater to seawater during their lifetime, but not for hatchery. Species sensitive to river damming are catadromous fish that live in inland rivers and lay their eggs in the sea (for example, eels) and anadromous whose adults live in the sea and lay their eggs in the upstream of the river (eg salmon). These two categories of fish species are rarely found in rivers that empty into the Java Sea.
6.12.5 Critical Habitat, Natural Habitat and Modified Habitat Assessment
ESS 6 requires a differentiated risk management approach to habitats based on their sensitivity and values. ESS addresses all habitats, categorized as ‘modified habitat’, ‘natural habitat’, and ‘critical habitat’, along with ‘legally protected and internationally and regionally recognized areas of biodiversity value’ which may encompass habitat in any or all of these categories.
The relevant definitions are as follows:
Project Area of Influence: is defined as the geographical area in which biodiversity may potentially be significantly impacted by the UCPS construction and operation activities. This area excludes the wider area which may be affected by cumulative impacts.
Modified habitats are areas that may contain a large proportion of plant and/or animal species of non-native origin, and/or where human activity has substantially modified an area’s primary ecological functions and species composition. Modified habitats may include, for example, areas managed for agriculture, forest plantations, reclaimed coastal zones, and reclaimed wetlands.
Natural habitats are areas composed of viable assemblages of plant and/or animal species of largely native origin, and/or where human activity has not essentially modified an area’s primary ecological functions and species composition.
Critical habitat is defined as areas with high biodiversity importance or value, including: (a) habitat of significant importance to Critically Endangered or Endangered species, as listed in the IUCN Red List of threatened species or equivalent national approaches; (b) habitat of significant importance to endemic or restricted-range species; (c) habitat supporting globally or nationally significant concentrations of migratory or congregatory species; (d) highly threatened or unique ecosystems; (e) ecological functions or characteristics that are needed to maintain the viability of the biodiversity values described above in (a) to (d).
Restricted-range/ Endemic Species = Species with world distributions of less than 50,000 km2
Migratory species = Any species or lower taxon of wild animals, in which a significant proportion of the members of the entire population or any geographically separate part of the population cyclically and predictably crosses one or more national jurisdictional boundaries.
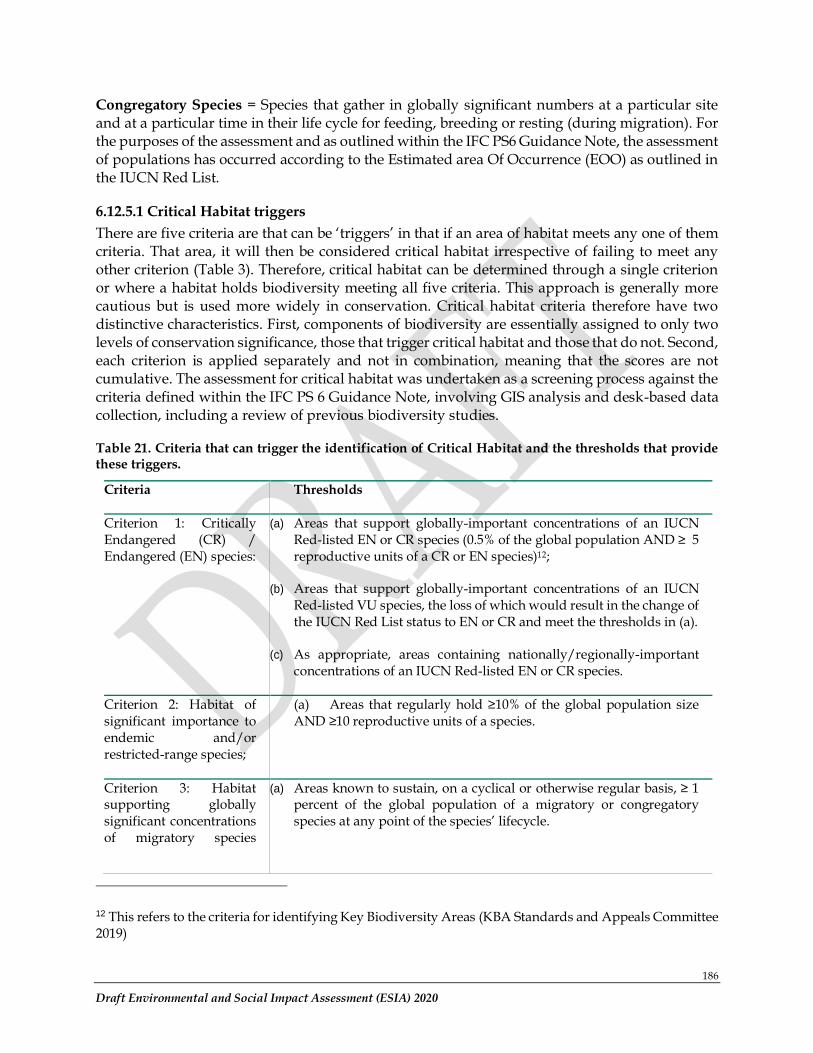
186
Draft Environmental and Social Impact Assessment (ESIA) 2020
Congregatory Species = Species that gather in globally significant numbers at a particular site and at a particular time in their life cycle for feeding, breeding or resting (during migration). For the purposes of the assessment and as outlined within the IFC PS6 Guidance Note, the assessment of populations has occurred according to the Estimated area Of Occurrence (EOO) as outlined in the IUCN Red List.
6.12.5.1 Critical Habitat triggers
There are five criteria are that can be ‘triggers’ in that if an area of habitat meets any one of them criteria. That area, it will then be considered critical habitat irrespective of failing to meet any other criterion (Table 3). Therefore, critical habitat can be determined through a single criterion or where a habitat holds biodiversity meeting all five criteria. This approach is generally more cautious but is used more widely in conservation. Critical habitat criteria therefore have two distinctive characteristics. First, components of biodiversity are essentially assigned to only two levels of conservation significance, those that trigger critical habitat and those that do not. Second, each criterion is applied separately and not in combination, meaning that the scores are not cumulative. The assessment for critical habitat was undertaken as a screening process against the criteria defined within the IFC PS 6 Guidance Note, involving GIS analysis and desk-based data collection, including a review of previous biodiversity studies.
Table 21. Criteria that can trigger the identification of Critical Habitat and the thresholds that provide these triggers.
Criteria Thresholds
Criterion 1: Critically Endangered (CR) / Endangered (EN) species:
(a) Areas that support globally-important concentrations of an IUCN Red-listed EN or CR species (0.5% of the global population AND ≥ 5 reproductive units of a CR or EN species)12;
(b) Areas that support globally-important concentrations of an IUCN Red-listed VU species, the loss of which would result in the change of the IUCN Red List status to EN or CR and meet the thresholds in (a).
(c) As appropriate, areas containing nationally/regionally-important concentrations of an IUCN Red-listed EN or CR species.
Criterion 2: Habitat of significant importance to endemic and/or restricted-range species;
(a) Areas that regularly hold ≥10% of the global population size AND ≥10 reproductive units of a species.
Criterion 3: Habitat supporting globally significant concentrations of migratory species
(a) Areas known to sustain, on a cyclical or otherwise regular basis, ≥ 1 percent of the global population of a migratory or congregatory species at any point of the species’ lifecycle.
12 This refers to the criteria for identifying Key Biodiversity Areas (KBA Standards and Appeals Committee 2019)
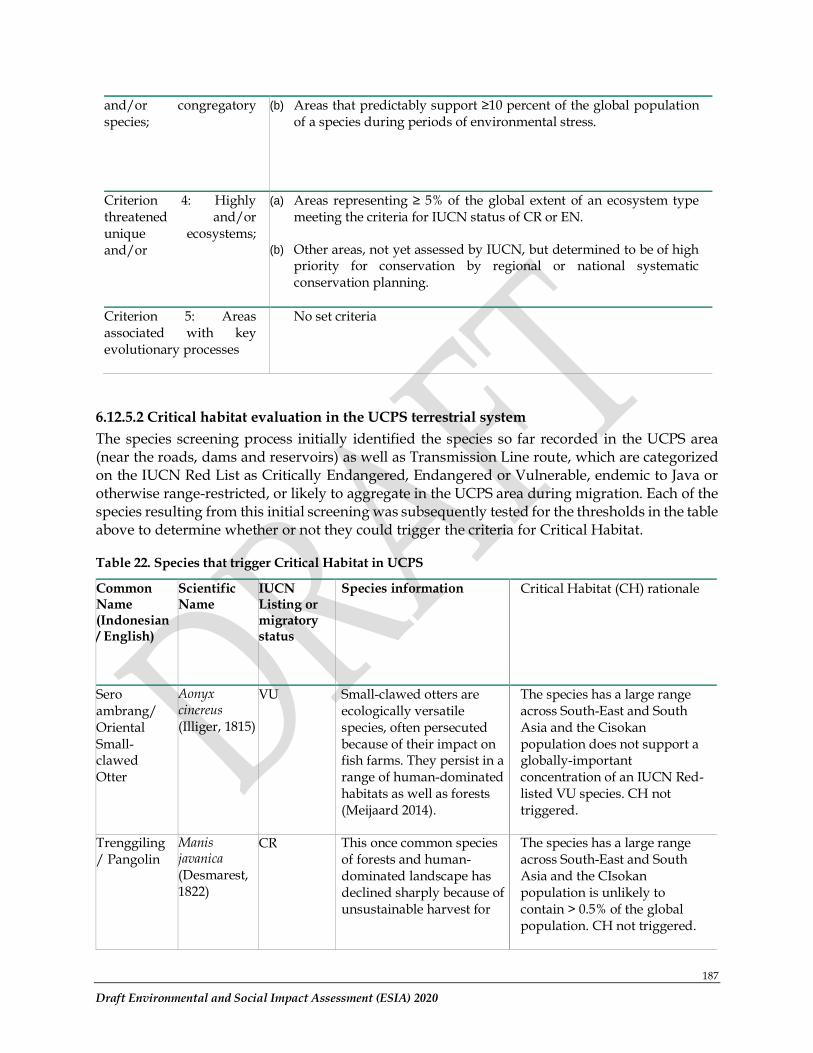
187
Draft Environmental and Social Impact Assessment (ESIA) 2020
and/or congregatory species;
(b) Areas that predictably support ≥10 percent of the global population of a species during periods of environmental stress.
Criterion 4: Highly threatened and/or unique ecosystems; and/or
(a) Areas representing ≥ 5% of the global extent of an ecosystem type meeting the criteria for IUCN status of CR or EN.
(b) Other areas, not yet assessed by IUCN, but determined to be of high priority for conservation by regional or national systematic conservation planning.
Criterion 5: Areas associated with key evolutionary processes
No set criteria
6.12.5.2 Critical habitat evaluation in the UCPS terrestrial system
The species screening process initially identified the species so far recorded in the UCPS area (near the roads, dams and reservoirs) as well as Transmission Line route, which are categorized on the IUCN Red List as Critically Endangered, Endangered or Vulnerable, endemic to Java or otherwise range-restricted, or likely to aggregate in the UCPS area during migration. Each of the species resulting from this initial screening was subsequently tested for the thresholds in the table above to determine whether or not they could trigger the criteria for Critical Habitat.
Table 22. Species that trigger Critical Habitat in UCPS
Common Name (Indonesian / English)
Scientific Name
IUCN Listing or migratory status
Species information Critical Habitat (CH) rationale
Sero ambrang/ Oriental Small-clawed Otter
Aonyx cinereus (Illiger, 1815)
VU Small-clawed otters are ecologically versatile species, often persecuted because of their impact on fish farms. They persist in a range of human-dominated habitats as well as forests (Meijaard 2014).
The species has a large range across South-East and South Asia and the Cisokan population does not support a globally-important concentration of an IUCN Red-listed VU species. CH not triggered.
Trenggiling/ Pangolin
Manis javanica (Desmarest, 1822)
CR This once common species of forests and human-dominated landscape has declined sharply because of unsustainable harvest for
The species has a large range across South-East and South Asia and the CIsokan population is unlikely to contain > 0.5% of the global population. CH not triggered.
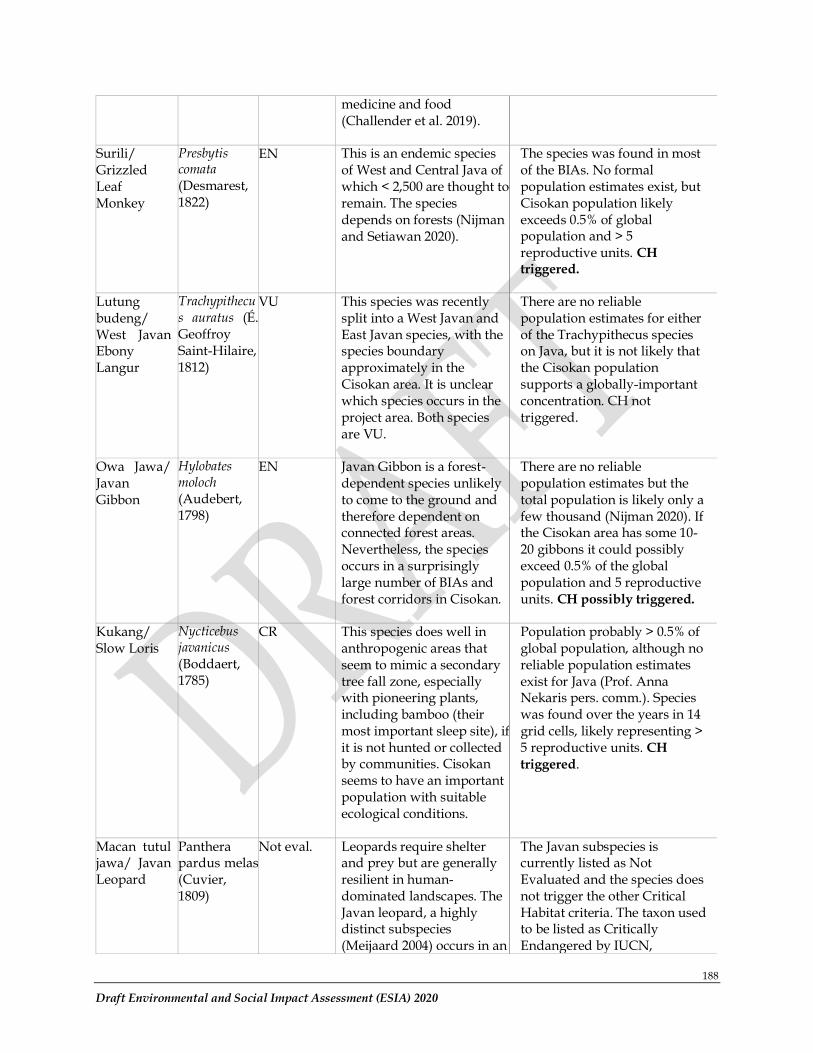
188
Draft Environmental and Social Impact Assessment (ESIA) 2020
medicine and food (Challender et al. 2019).
Surili/ Grizzled Leaf Monkey
Presbytis comata (Desmarest, 1822)
EN This is an endemic species of West and Central Java of which < 2,500 are thought to remain. The species depends on forests (Nijman and Setiawan 2020).
The species was found in most of the BIAs. No formal population estimates exist, but Cisokan population likely exceeds 0.5% of global population and > 5 reproductive units. CH triggered.
Lutung budeng/ West Javan Ebony Langur
Trachypithecus auratus (É. Geoffroy Saint-Hilaire, 1812)
VU This species was recently split into a West Javan and East Javan species, with the species boundary approximately in the Cisokan area. It is unclear which species occurs in the project area. Both species are VU.
There are no reliable population estimates for either of the Trachypithecus species on Java, but it is not likely that the Cisokan population supports a globally-important concentration. CH not triggered.
Owa Jawa/ Javan Gibbon
Hylobates moloch (Audebert, 1798)
EN Javan Gibbon is a forest-dependent species unlikely to come to the ground and therefore dependent on connected forest areas. Nevertheless, the species occurs in a surprisingly large number of BIAs and forest corridors in Cisokan.
There are no reliable population estimates but the total population is likely only a few thousand (Nijman 2020). If the Cisokan area has some 10-20 gibbons it could possibly exceed 0.5% of the global population and 5 reproductive units. CH possibly triggered.
Kukang/ Slow Loris
Nycticebus javanicus (Boddaert, 1785)
CR This species does well in anthropogenic areas that seem to mimic a secondary tree fall zone, especially with pioneering plants, including bamboo (their most important sleep site), if it is not hunted or collected by communities. Cisokan seems to have an important population with suitable ecological conditions.
Population probably > 0.5% of global population, although no reliable population estimates exist for Java (Prof. Anna Nekaris pers. comm.). Species was found over the years in 14 grid cells, likely representing > 5 reproductive units. CH triggered.
Macan tutul jawa/ Javan Leopard
Panthera pardus melas (Cuvier, 1809)
Not eval. Leopards require shelter and prey but are generally resilient in human-dominated landscapes. The Javan leopard, a highly distinct subspecies (Meijaard 2004) occurs in an
The Javan subspecies is currently listed as Not Evaluated and the species does not trigger the other Critical Habitat criteria. The taxon used to be listed as Critically Endangered by IUCN,
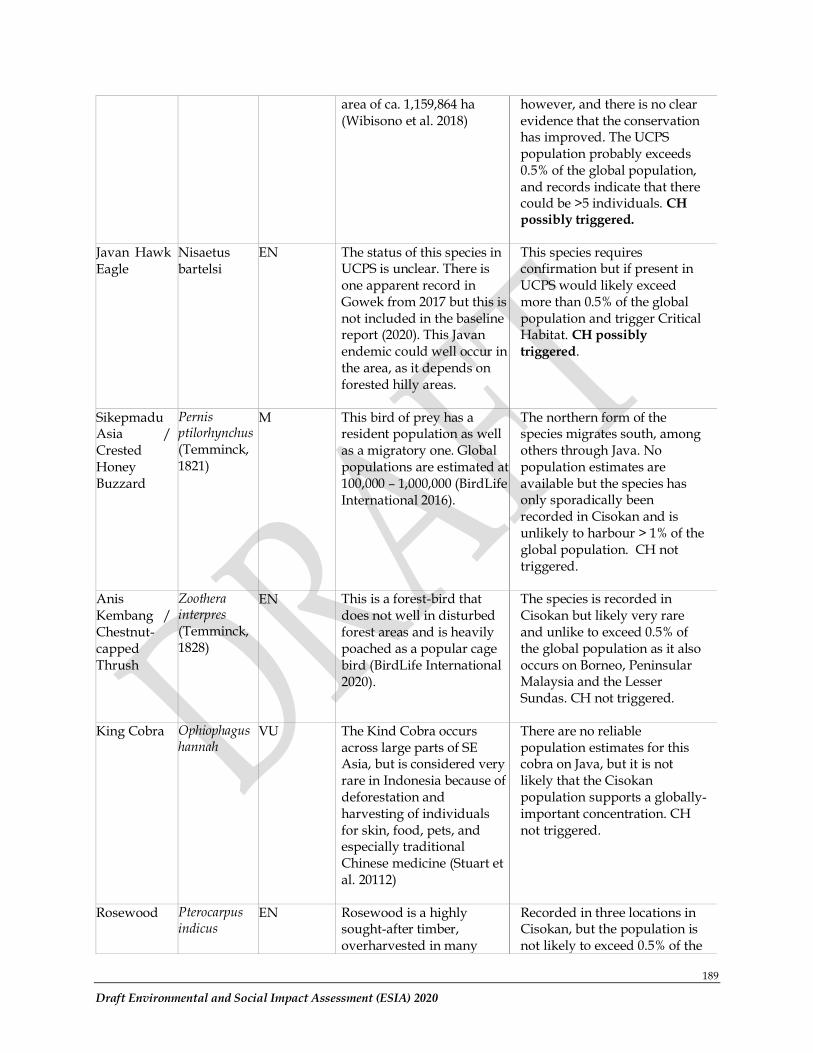
189
Draft Environmental and Social Impact Assessment (ESIA) 2020
area of ca. 1,159,864 ha (Wibisono et al. 2018)
however, and there is no clear evidence that the conservation has improved. The UCPS population probably exceeds 0.5% of the global population, and records indicate that there could be >5 individuals. CH possibly triggered.
Javan Hawk Eagle
Nisaetus bartelsi
EN The status of this species in UCPS is unclear. There is one apparent record in Gowek from 2017 but this is not included in the baseline report (2020). This Javan endemic could well occur in the area, as it depends on forested hilly areas.
This species requires confirmation but if present in UCPS would likely exceed more than 0.5% of the global population and trigger Critical Habitat. CH possibly triggered.
Sikepmadu Asia / Crested Honey Buzzard
Pernis ptilorhynchus (Temminck, 1821)
M This bird of prey has a resident population as well as a migratory one. Global populations are estimated at 100,000 – 1,000,000 (BirdLife International 2016).
The northern form of the species migrates south, among others through Java. No population estimates are available but the species has only sporadically been recorded in Cisokan and is unlikely to harbour > 1% of the global population. CH not triggered.
Anis Kembang / Chestnut-capped Thrush
Zoothera interpres (Temminck, 1828)
EN This is a forest-bird that does not well in disturbed forest areas and is heavily poached as a popular cage bird (BirdLife International 2020).
The species is recorded in Cisokan but likely very rare and unlike to exceed 0.5% of the global population as it also occurs on Borneo, Peninsular Malaysia and the Lesser Sundas. CH not triggered.
King Cobra Ophiophagus hannah
VU The Kind Cobra occurs across large parts of SE Asia, but is considered very rare in Indonesia because of deforestation and harvesting of individuals for skin, food, pets, and especially traditional Chinese medicine (Stuart et al. 20112)
There are no reliable population estimates for this cobra on Java, but it is not likely that the Cisokan population supports a globally-important concentration. CH not triggered.
Rosewood Pterocarpus indicus
EN Rosewood is a highly sought-after timber, overharvested in many
Recorded in three locations in Cisokan, but the population is not likely to exceed 0.5% of the
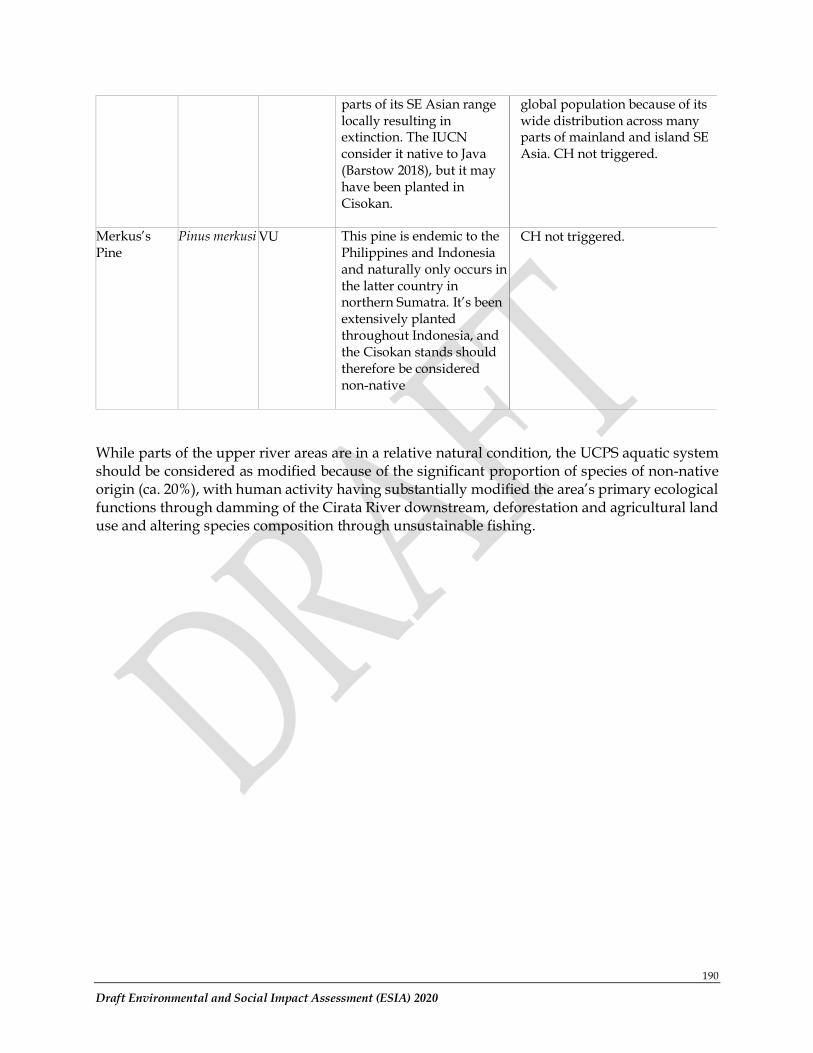
190
Draft Environmental and Social Impact Assessment (ESIA) 2020
parts of its SE Asian range locally resulting in extinction. The IUCN consider it native to Java (Barstow 2018), but it may have been planted in Cisokan.
global population because of its wide distribution across many parts of mainland and island SE Asia. CH not triggered.
Merkus’s Pine
Pinus merkusi VU This pine is endemic to the Philippines and Indonesia and naturally only occurs in the latter country in northern Sumatra. It’s been extensively planted throughout Indonesia, and the Cisokan stands should therefore be considered non-native
CH not triggered.
While parts of the upper river areas are in a relative natural condition, the UCPS aquatic system should be considered as modified because of the significant proportion of species of non-native origin (ca. 20%), with human activity having substantially modified the area’s primary ecological functions through damming of the Cirata River downstream, deforestation and agricultural land use and altering species composition through unsustainable fishing.
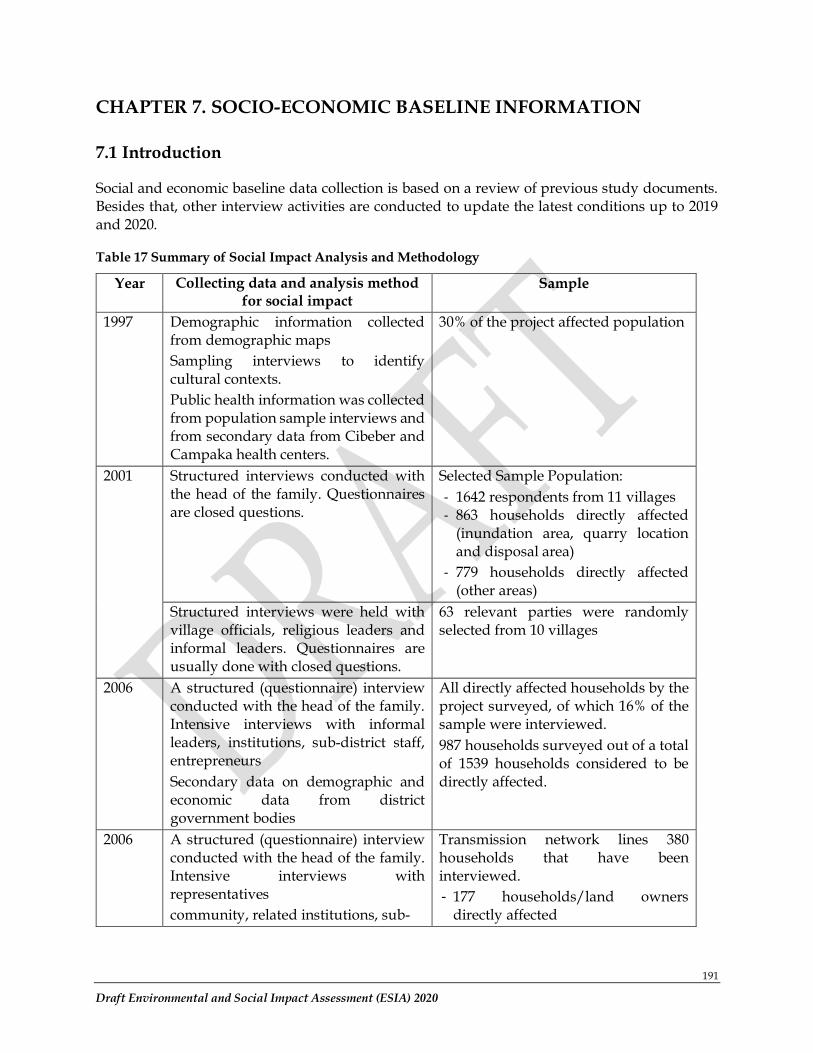
191
Draft Environmental and Social Impact Assessment (ESIA) 2020
CHAPTER 7. SOCIO-ECONOMIC BASELINE INFORMATION
7.1 Introduction
Social and economic baseline data collection is based on a review of previous study documents. Besides that, other interview activities are conducted to update the latest conditions up to 2019 and 2020.
Table 17 Summary of Social Impact Analysis and Methodology
Year Collecting data and analysis method for social impact
Sample
1997 Demographic information collected from demographic maps
Sampling interviews to identify cultural contexts.
Public health information was collected from population sample interviews and from secondary data from Cibeber and Campaka health centers.
30% of the project affected population
2001 Structured interviews conducted with the head of the family. Questionnaires are closed questions.
Selected Sample Population:
- 1642 respondents from 11 villages - 863 households directly affected
(inundation area, quarry location and disposal area)
- 779 households directly affected (other areas)
Structured interviews were held with village officials, religious leaders and informal leaders. Questionnaires are usually done with closed questions.
63 relevant parties were randomly selected from 10 villages
2006 A structured (questionnaire) interview conducted with the head of the family. Intensive interviews with informal leaders, institutions, sub-district staff, entrepreneurs
Secondary data on demographic and economic data from district government bodies
All directly affected households by the project surveyed, of which 16% of the sample were interviewed.
987 households surveyed out of a total of 1539 households considered to be directly affected.
2006 A structured (questionnaire) interview conducted with the head of the family. Intensive interviews with representatives
community, related institutions, sub-
Transmission network lines 380 households that have been interviewed.
- 177 households/land owners directly affected
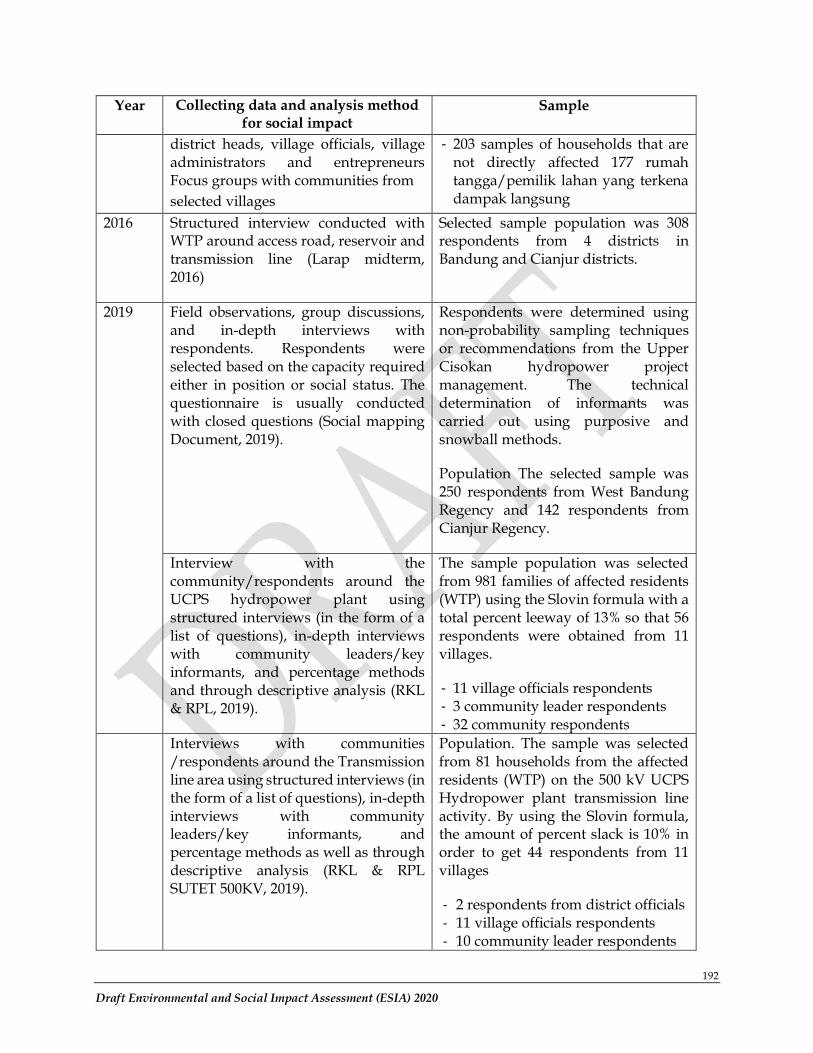
192
Draft Environmental and Social Impact Assessment (ESIA) 2020
Year Collecting data and analysis method for social impact
Sample
district heads, village officials, village administrators and entrepreneurs Focus groups with communities from
selected villages
- 203 samples of households that are not directly affected 177 rumah tangga/pemilik lahan yang terkena dampak langsung
2016 Structured interview conducted with WTP around access road, reservoir and transmission line (Larap midterm, 2016)
Selected sample population was 308 respondents from 4 districts in Bandung and Cianjur districts.
2019 Field observations, group discussions, and in-depth interviews with respondents. Respondents were selected based on the capacity required either in position or social status. The questionnaire is usually conducted with closed questions (Social mapping Document, 2019).
Respondents were determined using non-probability sampling techniques or recommendations from the Upper Cisokan hydropower project management. The technical determination of informants was carried out using purposive and snowball methods.
Population The selected sample was 250 respondents from West Bandung Regency and 142 respondents from Cianjur Regency.
Interview with the community/respondents around the UCPS hydropower plant using structured interviews (in the form of a list of questions), in-depth interviews with community leaders/key informants, and percentage methods and through descriptive analysis (RKL & RPL, 2019).
The sample population was selected from 981 families of affected residents (WTP) using the Slovin formula with a total percent leeway of 13% so that 56 respondents were obtained from 11 villages.
- 11 village officials respondents - 3 community leader respondents - 32 community respondents
Interviews with communities /respondents around the Transmission line area using structured interviews (in the form of a list of questions), in-depth interviews with community leaders/key informants, and percentage methods as well as through descriptive analysis (RKL & RPL SUTET 500KV, 2019).
Population. The sample was selected from 81 households from the affected residents (WTP) on the 500 kV UCPS Hydropower plant transmission line activity. By using the Slovin formula, the amount of percent slack is 10% in order to get 44 respondents from 11 villages
- 2 respondents from district officials - 11 village officials respondents - 10 community leader respondents
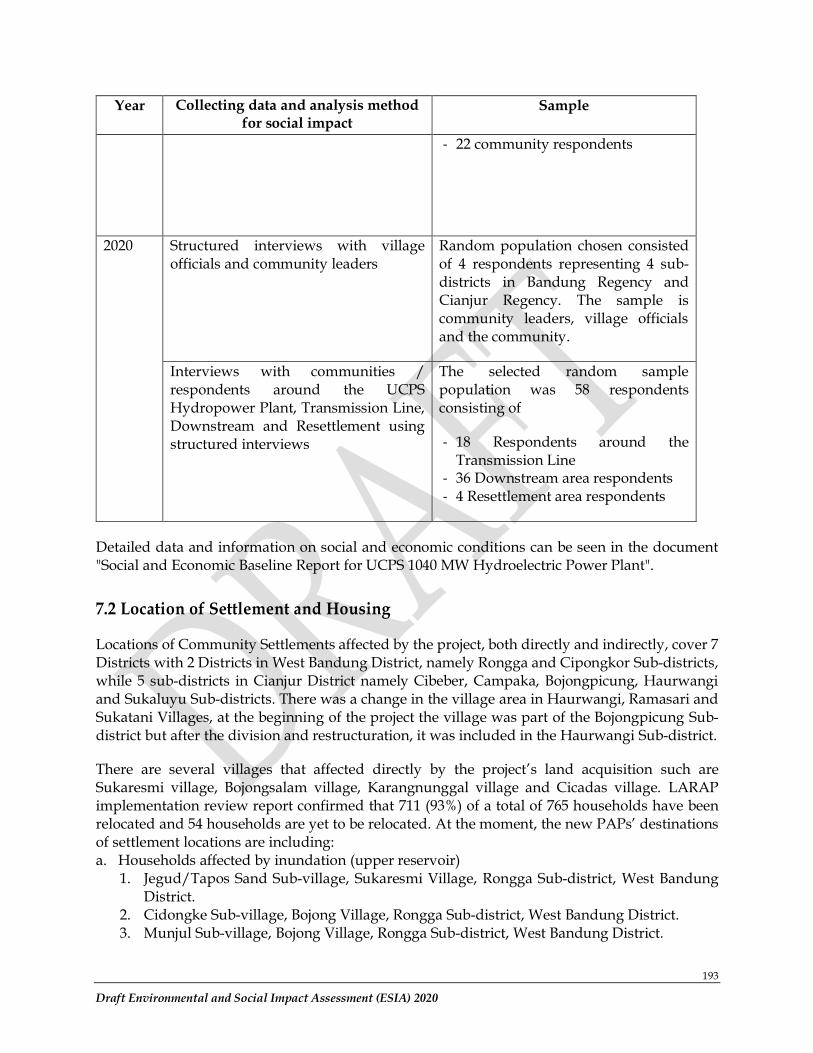
193
Draft Environmental and Social Impact Assessment (ESIA) 2020
Year Collecting data and analysis method for social impact
Sample
- 22 community respondents
2020 Structured interviews with village officials and community leaders
Random population chosen consisted of 4 respondents representing 4 sub-districts in Bandung Regency and Cianjur Regency. The sample is community leaders, village officials and the community.
Interviews with communities / respondents around the UCPS Hydropower Plant, Transmission Line, Downstream and Resettlement using structured interviews
The selected random sample population was 58 respondents consisting of
- 18 Respondents around the Transmission Line
- 36 Downstream area respondents - 4 Resettlement area respondents
Detailed data and information on social and economic conditions can be seen in the document "Social and Economic Baseline Report for UCPS 1040 MW Hydroelectric Power Plant".
7.2 Location of Settlement and Housing
Locations of Community Settlements affected by the project, both directly and indirectly, cover 7 Districts with 2 Districts in West Bandung District, namely Rongga and Cipongkor Sub-districts, while 5 sub-districts in Cianjur District namely Cibeber, Campaka, Bojongpicung, Haurwangi and Sukaluyu Sub-districts. There was a change in the village area in Haurwangi, Ramasari and Sukatani Villages, at the beginning of the project the village was part of the Bojongpicung Sub-district but after the division and restructuration, it was included in the Haurwangi Sub-district.
There are several villages that affected directly by the project’s land acquisition such are Sukaresmi village, Bojongsalam village, Karangnunggal village and Cicadas village. LARAP implementation review report confirmed that 711 (93%) of a total of 765 households have been relocated and 54 households are yet to be relocated. At the moment, the new PAPs’ destinations of settlement locations are including: a. Households affected by inundation (upper reservoir)
1. Jegud/Tapos Sand Sub-village, Sukaresmi Village, Rongga Sub-district, West Bandung District.
2. Cidongke Sub-village, Bojong Village, Rongga Sub-district, West Bandung District. 3. Munjul Sub-village, Bojong Village, Rongga Sub-district, West Bandung District.
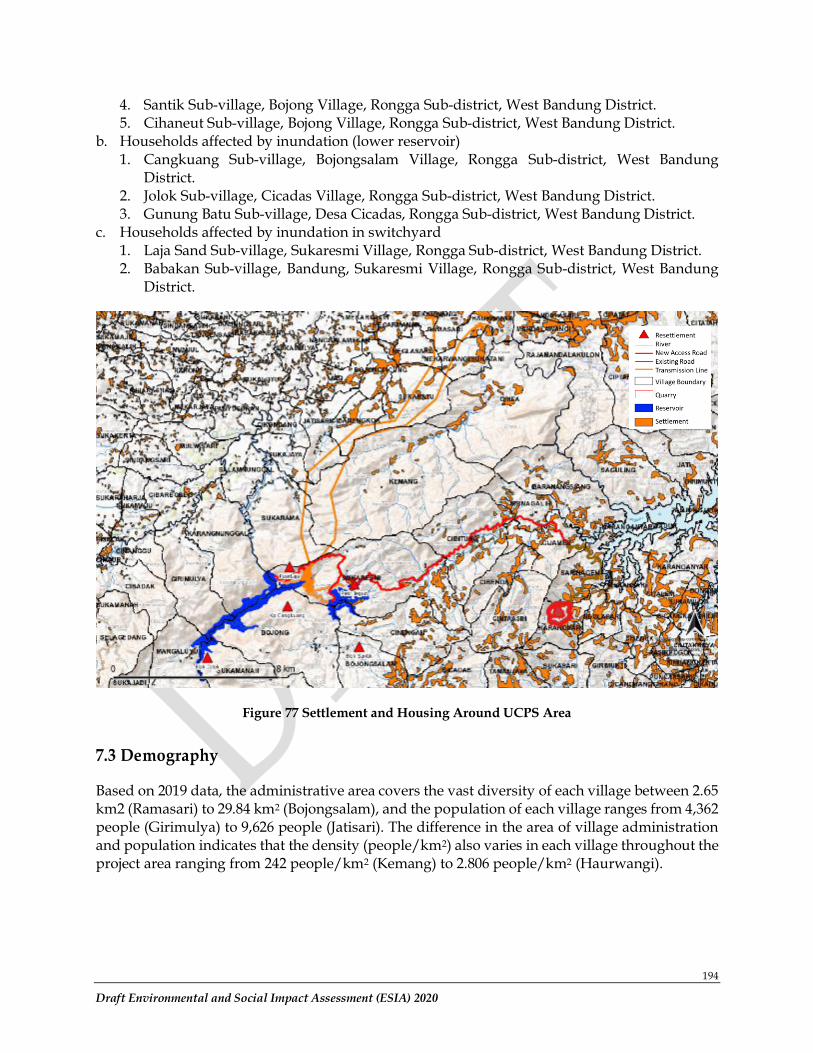
194
Draft Environmental and Social Impact Assessment (ESIA) 2020
4. Santik Sub-village, Bojong Village, Rongga Sub-district, West Bandung District. 5. Cihaneut Sub-village, Bojong Village, Rongga Sub-district, West Bandung District.
b. Households affected by inundation (lower reservoir) 1. Cangkuang Sub-village, Bojongsalam Village, Rongga Sub-district, West Bandung
District. 2. Jolok Sub-village, Cicadas Village, Rongga Sub-district, West Bandung District. 3. Gunung Batu Sub-village, Desa Cicadas, Rongga Sub-district, West Bandung District.
c. Households affected by inundation in switchyard 1. Laja Sand Sub-village, Sukaresmi Village, Rongga Sub-district, West Bandung District. 2. Babakan Sub-village, Bandung, Sukaresmi Village, Rongga Sub-district, West Bandung
District.
Figure 77 Settlement and Housing Around UCPS Area
7.3 Demography
Based on 2019 data, the administrative area covers the vast diversity of each village between 2.65 km2 (Ramasari) to 29.84 km2 (Bojongsalam), and the population of each village ranges from 4,362 people (Girimulya) to 9,626 people (Jatisari). The difference in the area of village administration and population indicates that the density (people/km2) also varies in each village throughout the project area ranging from 242 people/km2 (Kemang) to 2.806 people/km2 (Haurwangi).
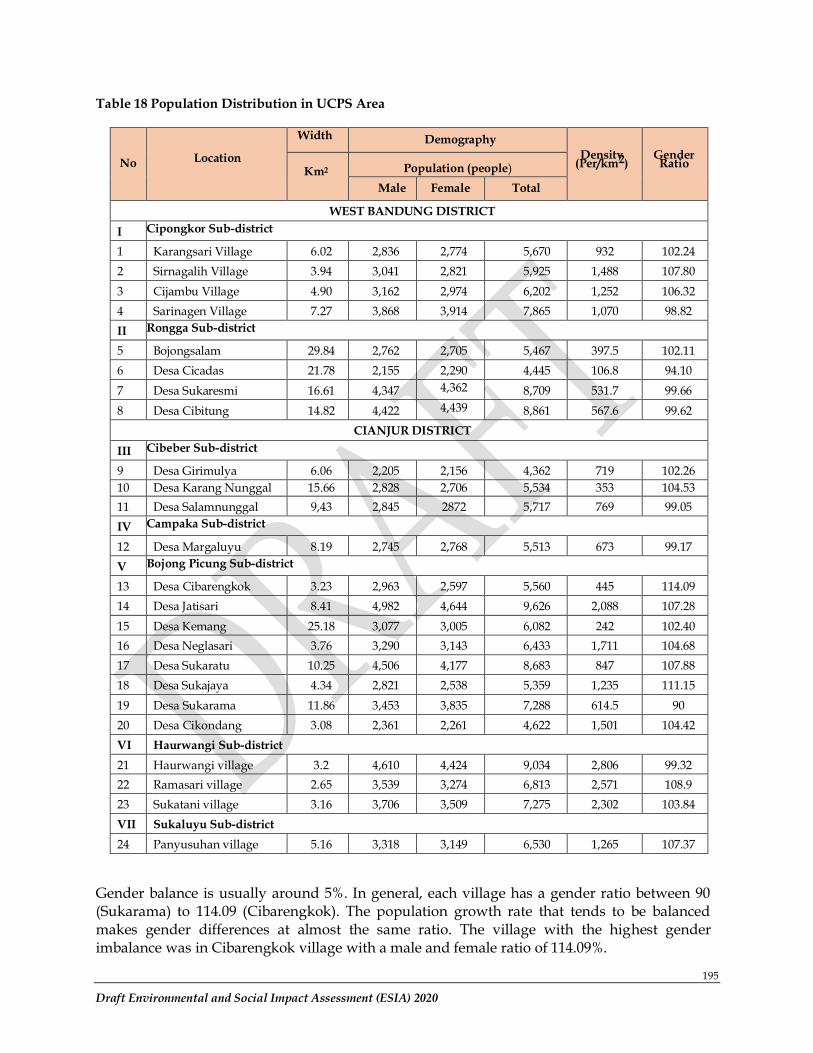
195
Draft Environmental and Social Impact Assessment (ESIA) 2020
Table 18 Population Distribution in UCPS Area
No
Location
Width Demography
Density (Per/km2)
Gender Ratio
Km2
Population (people)
Male
Female
Total
WEST BANDUNG DISTRICT
I Cipongkor Sub-district
1 Karangsari Village 6.02 2,836 2,774 5,670 932 102.24
2 Sirnagalih Village 3.94 3,041 2,821 5,925 1,488 107.80
3 Cijambu Village 4.90 3,162 2,974 6,202 1,252 106.32
4 Sarinagen Village 7.27 3,868 3,914 7,865 1,070 98.82
II Rongga Sub-district
5 Bojongsalam 29.84 2,762 2,705 5,467 397.5 102.11
6 Desa Cicadas 21.78 2,155 2,290 4,445 106.8 94.10
7 Desa Sukaresmi 16.61 4,347 4,362 8,709 531.7 99.66
8 Desa Cibitung 14.82 4,422 4,439 8,861 567.6 99.62
CIANJUR DISTRICT
III Cibeber Sub-district
9 Desa Girimulya 6.06 2,205 2,156 4,362 719 102.26
10 Desa Karang Nunggal 15.66 2,828 2,706 5,534 353 104.53
11 Desa Salamnunggal 9,43 2,845 2872 5,717 769 99.05
IV Campaka Sub-district
12 Desa Margaluyu 8.19 2,745 2,768 5,513 673 99.17
V Bojong Picung Sub-district
13 Desa Cibarengkok 3.23 2,963 2,597 5,560 445 114.09
14 Desa Jatisari 8.41 4,982 4,644 9,626 2,088 107.28
15 Desa Kemang 25.18 3,077 3,005 6,082 242 102.40
16 Desa Neglasari 3.76 3,290 3,143 6,433 1,711 104.68
17 Desa Sukaratu 10.25 4,506 4,177 8,683 847 107.88
18 Desa Sukajaya 4.34 2,821 2,538 5,359 1,235 111.15
19 Desa Sukarama 11.86 3,453 3,835 7,288 614.5 90
20 Desa Cikondang 3.08 2,361 2,261 4,622 1,501 104.42
VI Haurwangi Sub-district
10.25
4,506
4,177
8,683
847
107.88
21 Haurwangi village 3.2 4,610 4,424 9,034 2,806 99.32
22 Ramasari village 2.65 3,539 3,274 6,813 2,571 108.9
23 Sukatani village 3.16 3,706 3,509 7,275 2,302 103.84
VII Sukaluyu Sub-district
24 Panyusuhan village 5.16 3,318 3,149 6,530 1,265 107.37
Gender balance is usually around 5%. In general, each village has a gender ratio between 90 (Sukarama) to 114.09 (Cibarengkok). The population growth rate that tends to be balanced makes gender differences at almost the same ratio. The village with the highest gender imbalance was in Cibarengkok village with a male and female ratio of 114.09%.
196
Draft Environmental and Social Impact Assessment (ESIA) 2020
The new paved road in 2019 open community access to various places and productive resources. As the result of better road access, mobility of the younger working-class group out of the village flows profusely, particularly into industrial and urban centers are. LARAP implementation review report confoirmed that younger generation of the affected communities migrate to urban areas, either for schooling, becoming factory workers, working abroad trading, and others.
Women participation in general (especially the wives) in work fields, both agricultural and non-agricultural, is not very high (51% in the agricultural sector and only 13% in the non-agricultural sector), although, for those involved in agricultural livelihoods, 35% of the wives are the agricultural landowners. However, since the improvement of road access, the roles of women have increased, particularly in the stalls, trading, and handicraft business. This indicates a shift in the composition of breadwinner within the households, which previously dominated by the male household heads (husbands) to the women.
7.4 Community Structure
7.4.1. Community Structure and Services
The population is distributed throughout Kampungs (hamlets) and comprises small rural families and communities with strong kinship and traditional social and cultural attitudes. The Muslim religion strongly influences their day-to-day activities, and village and religious leaders play an essential role in decision-making, problem-solving and village development. Men are considered the heads of households, the main bread-winners and decision-makers, whilst women manage household and family matters, as well as undertaking planting and harvesting activities.
Education levels are low in all regions, and almost all communities have only received primary school education. The mid term report of LARAP reported around 93% of the peoples affected by land acquisition in various locations are categorized as only elementary school graduates and not elementary school graduates. Most of the people only graduated from Primary school /equivalent in the villages of Girimulya, Karangnunggal, Margaluyu, Haurwangi, and Sukatani. Meanwhile, the villages of Sukaresmi, Cijambu, Cinengah, Sukarama, Kemang, Cibitung, Karangsari, Cicadas, Bojongsalam, the majority of the people have education up to Junior High School/equivalent. Only a handful of people who have a diploma and bachelor degrees, and most of them are teachers, and some are civil servants.
7.4.2 Family and Community Structure
In general, kinship pattern is characterized by traditional Sundanese community system which determines the descent bilateral relations. In areas characterized by dry land and forestry agriculture, bilateral kinship patterns are common and have a strong influence on settlement clusters. In communities with wetland farming, types of bilateral kinship patterns persist but do not have much influence on settlement patterns.
Topography affects community relations in the project area. For the communities living in hilly areas, with dry land or forestry agricultural activities, settlements are divided into small hamlet groups. With limited transportation and accessibility, these small group areas are relatively isolated.

197
Draft Environmental and Social Impact Assessment (ESIA) 2020
In areas dominated by dry land and forestry agriculture, leaders are defined through kinship and socio-religious interests and dominate the decision-making process. Disagreements among residents are usually discussed among family members with the head of the family as the most significant influence. Such leadership patterns prevent one leader from influencing more than one small area.
With strong kinship among the hamlet groups, cohesiveness in the community usually deteriorates when there are disagreeing opinions. Community organizations such as youth groups and farmer organizations (which did not always have ties to the family or hamlet) often did not benefit from the tendency for hamlets to unite against other hamlets. Therefore, even though there is one administrative area (for example, a village), its citizens are not necessarily able to function as a solid community.
Different patterns of social relations develop in wetland farming communities that are close to the quarry and the existing road. The area is more open and more receptive to changes with a broad settlement pattern. Social stratification arises as a result of differences in education and also as a result of differences in wealth and control over resources, such as landowners. Although kinship networks still have influence, differences in power are more defined by wealth and control over resources. The occurrence of this pattern clearly depicts people who have higher levels of education and more incredible wealth compared to other communities in the area. Village leaders and landowners reportedly form lucrative business relationships that further strengthen their position of leadership and influence.
7.4.3 Religion and Culture
Islam is the religion that dominates and reflects everyday life, such as prayer, recitation of the Qur'an, etiquette and social interactions between communities. Social interactions beyond the scope of work, family and friends are also dominated by religious activities, including the recitation of the Qur'an, prayers and religious rituals. Religious life is well preserved, one of the factors is the spread of 97 Islamic boarding schools in Cipongkor and Rongga District.
Apart from Islam and its classical educational institutions, Sundanese cultural values are still well preserved. Starting from language, mutual cooperation, to mysticism. For the latter, it is still very much present in everyday life, one such example is about the presence of Malela waterfall watchman in Cicadas Village, a person known as Eyang Taji Malela and prohibition to bathe on Monday, especially for individuals who are not married.
Customary or tradition values are still maintained, including various traditional ceremonies that are still being carried out. One these intangible cultural objects of note is the interesting tradition ceremony associated with farming activities, this is called the Mantra Tandur in Karangnunggal Village, Cibeber District. It is an ancestral tradition, a symbol of farmers maintaining an agrarian culture especially for paddy planting. The existence of the mantra is an attempt to request protection for those things outside of human control. It also shows the awareness that humans have limitations and have the ability to try, one of which is praying to God. This celebration is held at the Cisokan weir at the same time as the weir maintenance activities were carried out.
Another popular form of entertainment is the 'arisan', which is a money-gathering that is organized on a rotating basis. Arisan is also a community forum to gather to discuss and
198
Draft Environmental and Social Impact Assessment (ESIA) 2020
cooperate on local issues, build and maintain community facilities, inform business opportunities and employment, and assist in food shortages or other difficulties in the form of mutual cooperation.
Myths and folkore concerning animals are also present in the area. The biodiversity surveys included interviews with community members who highlighted the importance of certain species in local folklore. Rahmat (2009) reports that in the Cisokan community there are animal folklore stories about fish that live in the river, which are “parented” by two larger sized fish named Rawing and Tambal. The two said fish are identified as a species of freshwater carp (Kancra, Tor douronensis, by some thought to be synonymous with T. tambra) and each is thought to weigh no less than 15 kg. The community believes that if these parent fish are caught or killed that there will no longer be any more fish when they fish in the Cisokan River. Therefore, if a fishing tool or net catches a large size Kancra fish, the community will release the fish straight away for fear that the fish they caught is the parent fish (Rahmat 2009).
The myth that circulates in the community indicates that preserving or protecting these fish is an important matter for the community even though fishing is not their main livelihood. Aside from that, there is a fear that something bad will happen if they catch or kill these fish. The belief of this species of fish as a sacred fish is widespread among Sundanese people because of its rarity. The species was reported to be present in the Cisokan River by Rahmat (2009), and by Sutrisno et al. (2009), but has not been recorded in subsequent surveys.
In Sundanese communities in West Java there is also a clear presence of taboos against disturbing or collecting slow lorises, in part linked to beliefs about the blood of slow lorises or their perceived importance as links to the afterlife (Nijman and Nektaris, 2014). These beliefs were strongest where slow lorises were observed to live side by side with humans; where these beliefs had eroded, or were simply not present, there was a greater incentive to exploit these animals.
7.4.4 Social Relation and Gathering
The population is spread across the villages (hamlets) and includes small village families and communities with strong kinship and traditional attitudes and culture. Islam and religious leaders strongly influence their daily activities. The village has a decisive role in decision making, problem-solving and village development. Men are considered the 'head of the household' and are the primary breadwinners and decision-makers. At the same time, women manage household and family affairs, as well as carry out planting and harvesting activities. Education levels are low in all regions, and almost all communities have only received primary school education.
Quran recitation/study group (“majlis ta’lim”) is the most active social institution in the community, either on a small scale (in prayer rooms), medium-scale (mosques), and on a large scale in Islamic boarding schools (“pesantren”). The data shows that several social institutions are perceived to have positive function include Quran recitation group, sports, collective action (collaboration, participation), and the sharing traditions (sharing, reciprocal, social protection). Other social institutions are farming groups.
Various economic restoration programs which have been implemented as part of Land Acquisition and Resettlement Plan has strengthened the existing social institutions and created new ones such as cooperatives, women group in craftsmen (banana and palm sugar processors),
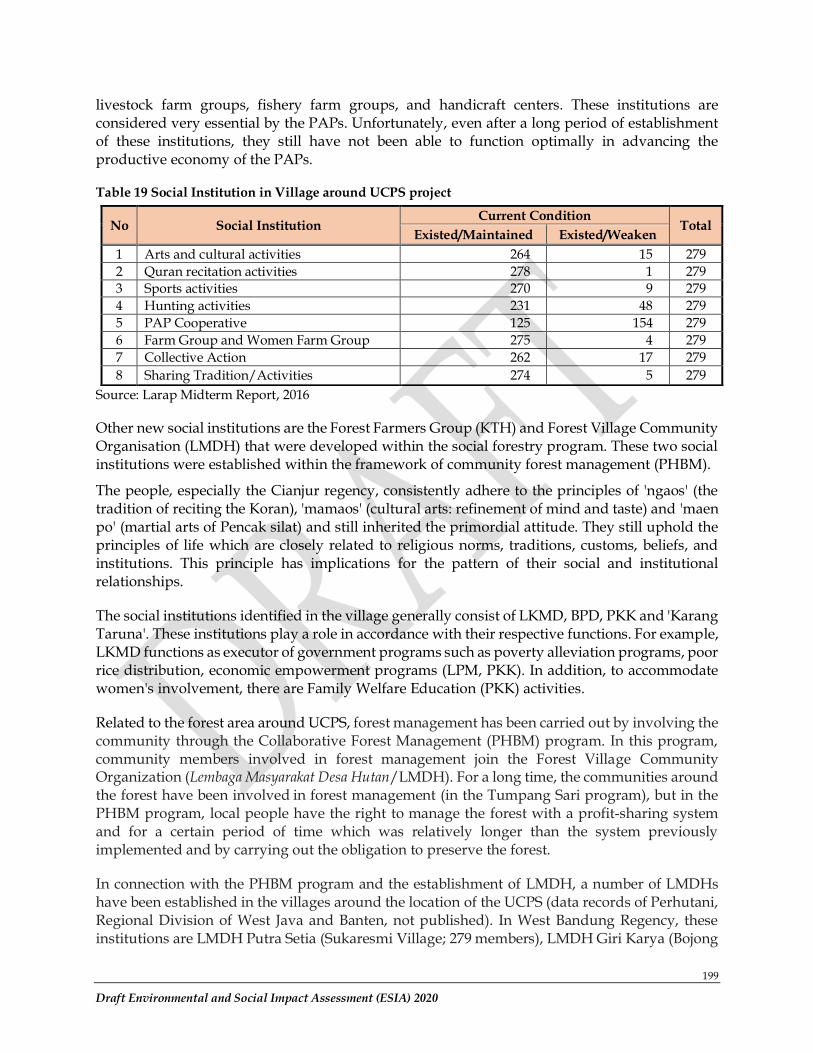
199
Draft Environmental and Social Impact Assessment (ESIA) 2020
livestock farm groups, fishery farm groups, and handicraft centers. These institutions are considered very essential by the PAPs. Unfortunately, even after a long period of establishment of these institutions, they still have not been able to function optimally in advancing the productive economy of the PAPs.
Table 19 Social Institution in Village around UCPS project
Source: Larap Midterm Report, 2016
Other new social institutions are the Forest Farmers Group (KTH) and Forest Village Community Organisation (LMDH) that were developed within the social forestry program. These two social institutions were established within the framework of community forest management (PHBM).
The people, especially the Cianjur regency, consistently adhere to the principles of 'ngaos' (the tradition of reciting the Koran), 'mamaos' (cultural arts: refinement of mind and taste) and 'maen po' (martial arts of Pencak silat) and still inherited the primordial attitude. They still uphold the principles of life which are closely related to religious norms, traditions, customs, beliefs, and institutions. This principle has implications for the pattern of their social and institutional relationships.
The social institutions identified in the village generally consist of LKMD, BPD, PKK and 'Karang Taruna'. These institutions play a role in accordance with their respective functions. For example, LKMD functions as executor of government programs such as poverty alleviation programs, poor rice distribution, economic empowerment programs (LPM, PKK). In addition, to accommodate women's involvement, there are Family Welfare Education (PKK) activities.
Related to the forest area around UCPS, forest management has been carried out by involving the community through the Collaborative Forest Management (PHBM) program. In this program, community members involved in forest management join the Forest Village Community Organization (Lembaga Masyarakat Desa Hutan/LMDH). For a long time, the communities around the forest have been involved in forest management (in the Tumpang Sari program), but in the PHBM program, local people have the right to manage the forest with a profit-sharing system and for a certain period of time which was relatively longer than the system previously implemented and by carrying out the obligation to preserve the forest.
In connection with the PHBM program and the establishment of LMDH, a number of LMDHs have been established in the villages around the location of the UCPS (data records of Perhutani, Regional Division of West Java and Banten, not published). In West Bandung Regency, these institutions are LMDH Putra Setia (Sukaresmi Village; 279 members), LMDH Giri Karya (Bojong
No Social Institution Current Condition
Total Existed/Maintained Existed/Weaken
1 Arts and cultural activities 264 15 279
2 Quran recitation activities 278 1 279
3 Sports activities 270 9 279
4 Hunting activities 231 48 279
5 PAP Cooperative 125 154 279
6 Farm Group and Women Farm Group 275 4 279
7 Collective Action 262 17 279
8 Sharing Tradition/Activities 274 5 279
200
Draft Environmental and Social Impact Assessment (ESIA) 2020
Salam Village; 159 members), LMDH Rinjani (Cinengah Village; 129 members) and LMDH Gentrawana (Cicadas Village; 441 members). In Cianjur Regency, LMDH Karya Mukti (Sukarama Village; 165 members) and LMDH Wana Mekar Harapan (Karang Nunggal Village; 265 members) were
formed.
7.5 Gender and Gender Based Violence
7.5.1 Local Gender Relations and Socio-Economic Context
Managing the domestic aspects of the household is seen as the women’s primary role. The survey findings for the LARAP found that domestic responsibilities in PAP households are mostly (88.89%) handled by women (especially wives). Women are responsible for range from preparing meals, cleaning the house, sweeping the yard, taking care of children, washing clothes, being agricultural laborers, fetching water, shopping for daily necessities, caring for children or parents, processing crops, sell crops, and so on. This includes household financial management, harvest utilization, and management, decisions to participate in "arisan" (social gathering) and savings and loans, decisions to participate in cooperatives, participation in family planning counseling, and so on.
In the productive sector outside of the home, business decisions are primarily (92.5%) made by men (husbands), although women are increasingly active in the agriculture sector and MSMEs. Of the surveyed women, 51% are in agriculture and only 13% in non-agricultural sectors. Men are very visible in project work, especially in the construction of roads and bridges. However, due to the migration of males to urban areas, there is an increasing trend of rural women in business management, particularly in the stalls, trading, and handicraft business. In the study location, there are food processing businesses (banana chips), food product packaging (banana chips, palm sugar), and fast food businesses are run by women’s groups. Village officials, Islamic boarding school caretakers, and property traders some of the professions undertaken by the women in the area. The profession of shop owner is the dominant livelihood for women (PAP's wives) in the project location. This indicates a shift in the composition of breadwinner within PAP households, a role which was previously dominated by the male household heads (husbands).
Limited non-agricultural livelihood opportunities mean migration is a way of life in the project area, especially for women. Several villages in the UCPS project location, namely KBB and Cianjur Regency, are known to have quite high numbers of migrant workers. According to data from 2016, women migrants actually outnumbered men 1425 to 192, with most traveling to the Middle-East to work as domestic workers.
Land ownership data from the LARAP shows almost 90% (250 out of 279) of the land owned or controlled primarily by men, including land use as tenants. This data contrasts with the fact that of the households that had decided to resettle, a little over half (41 out of 77) made either decided together either as the whole family or the husband and wife. For only one household was the decision made by the wife, compared to 36 of the household where the decision was made by the husband only. Indeed, the fact is that in various meetings held by project implementing parties, there is no active participation of these women (LARAP 2019).
201
Draft Environmental and Social Impact Assessment (ESIA) 2020
7.5.2 Local Gender Based Violence Context
West Java Province is one of the provinces in Indonesia that has a fairly high rate of violence against women. The Indonesian Women's National Commission noted that during 2020, 2,738 women in West Java were victims of violence. They become victims of physical, psychological, sexual violence, economic neglect, online-based sexual violence, and trafficking or problematic migrant workers.
Based on the existing data, both KBB and Cianjur Regency have a relatively high rate of violence. The Integrated Service Center for the Protection of Women and Children Cianjur, West Java, received 20 reports of cases of violence against women and children throughout 2019. Most of the reports submitted were sexual abuse or violence with a total of 12 cases and the number of sexual violence against children. 80 cases were recorded. As for cases of sexual abuse and trafficking to date, there have been three cases and two cases of domestic violence. Meanwhile, until July 2020, P2TP2A recorded 24 cases reported. The average age of victims is 5 to 17 years old, with the most types of violence occurring in the form of sexual abuse and child rape. Similarly, the Cianjur Regency, West Bandung District, it is also facing serious problems related to cases of violence against women and children. West Bandung Regency (KBB) is one of the areas where cases of violence against children are still high. In the first quarter, at least 19 cases had been processed legally with assistance from the West Bandung Regency Government. Data from the West Bandung District Population Control, Family Planning, Women's Empowerment and Child Protection Agency (DPPKBP3A) shows that the number of cases of violence against children in the first quarter of 2019 was higher than 25 cases last year. The 2019 case occurred in every sub-district even though it was still dominated by the southern region. The victims generally received rough treatment from the perpetrators which led to sexual harassment. The victims are still aged from children to adolescents aged 17, 16, even 10 years. The type of violence against children that occurs is not only in the physical form, but also in the verbal form which is usually called bullying. This data description is useful for ensuring that case handling has been carried out by local governments and service agencies, which later can become information to map who can be involved in the focal point for handling GBVs in the UCPS hydropower project area.
Based on secondary data obtained from several previous studies and the results of FGDs conducted in September 2020 by the ESIA team, there are several vulnerabilities in two categories, namely the vulnerability of the community situation (educational aspect) and the Vulnerable locations to GBVs. Based on previous studies in Cianjur District, most of the community education was only elementary school graduates. Meanwhile, the vulnerable locations for GBVs include housing or school locations close to the temporary houses of workers who come from outside the village (foreign workers or local workers); condition of the area without adequate electric lighting; roads built (risk of traffic accidents, especially children); areas where the blasting process is carried out (it can cause pollution, decrease water quality, etc. which have direct or indirect implications for the health of residents, especially women and children).
The number of child marriages in the project area is still quite high. In many villages around hydropower project, culturally, there are still child marriages of girls who have dropped out of school. Based on data from the Cianjur Religious Court, every year there are dozens to dozens of
202
Draft Environmental and Social Impact Assessment (ESIA) 2020
marriage dispensation applications. There were 12 applications for dispensation of marriage in 2016 with a total of eight cases granted. In 2017 there were 26 cases of dispensation with 26 cases granted, while in 2018 the figure again increased to 33 cases with a total of around 30 cases granted. Based on this, the Cianjur District Government issued a Regent Regulation (Perbup) No. 10 of 2020 concerning Prevention of Child Marriage.
7.6 Community Infrastructure
Infrastructure is a means of facility that functions to support various community activities, be it socially, economically, educationally and culturally. The existence and availability of infrastructure are very influential in accelerating social change. The availability of adequate and proper infrastructure is an indicator of a region's success in carrying out development.
7.6.1 Water
The source of water that the community gets comes from wells and rivers. Shallow wells dug by hand are the primary source of drinking water. In some houses or hamlets with streams/small rivers near settlements, only 6% of the total population will use groundwater (PLN/Newjec Inc., 2007b). Water quality samples from both wells in 2006 indicated contamination of pathogenic bacteria that can cause abdominal pain. Well water may be contaminated from activities at ground level because it is not safely protected (not covered and paved).
Based on the results of interviews in 2020, villages in downstream areas use the Cisokan river water during the dry season. The community usually uses this water for household needs such as washing clothes and bathing, just like the people of Ciputat village, Salamnunggal village, who depend heavily on water from the Cisokan river.
The result of Social Mapping in 2019 shows that some villages, such as villages such as Cicadas, Sukaresmi, Sirnagalih, Cijambu and Cibarengkok, are having easy access to water, but sometimes insufficient. Meanwhile, in Cibitung, Bojongsalam and Sukaratu villages water sources are easy to find, but not sufficient. The adequacy of water in villages of Girimulya and Haurwangi for household needs are difficult to find and insufficient. LARAP report also stated that 4 relocation location which are Cangkuang, Santik, Munjul, and Cidongke haven’t received clean water facilities (boreholes sibel) provision from PT. PLN (Persero).
7.6.2 Electricity
Based on the 2019 UCPS PLN Social and Stakeholder Mapping report supported by survey results in September 2020, the majority of residents in the Upper Cisokan Pumped Storage area already have electricity (PLN, 2019d). Data on PAPs electricity connection in 2016 confirmed that 85% of the PAPs have direct access to electricity grid, 15% got electricity supply by connecting to their neighbour and 1% of PAPs used power generator and/ or household scale of windmill to generate electricity. This data can be used to indicate the overall condition electricity connection around the project location.
203
Draft Environmental and Social Impact Assessment (ESIA) 2020
7.6.3 Road and Bridge
Road access has supported the community in economic and social activities around the project to the downstream area. Based on interviews with community stakeholders in January 2020. The access road from Baranangsiang village to Sirnagalih for 4.8 km and Cibenah to Cinta Asih for 7 km has developed. The community has felt almost all pivot roads connecting villages and sub-districts with the existence of Upper Cisokan. Economic impacts such as land prices with access roads have increased from Rp 25.000/m2 and now up to 400.000/m2.
In general, the people's economy improves due to easier access to the city of Bandung. Many residents who own vehicles now have since the construction of Upper Cisokan. The existence of a means of transportation helps people shop and sell crops, makes activities more comfortable and faster, creates equitable development, opens alternative routes, and facilitates roads to tourist attractions.
On the other hand, community connectivity around the dam will affect families who will not be resettled, there may be periods of unrest and disturbance during resettlement where service facilities and religious buildings are lost or moved and employment and business opportunities change. Furthermore, during land clearing and reservoir preparation, the productive environment of the forest or river, or access to a walking or motorbike path, including river crossing, may change or be permanently displaced. The new bridge will connect parts of the village and will be constructed and operational prior to inundation, to prevent the isolation of communities from markets, schools and communities in the west.
Based on Social and Social Mapping 2019, Community of Margaluyu Village will have lost access to the road / bridge connecting Girimulya Village, Karangnunggal and surrounding villages. Because the area is an area that will be inundated by the river / reservoir PLTA Upper Cisokan. Even though the bridge is an access to agricultural and economic activities for residents.
The connectivity bridge from Blok Jolok to Margaluyu Village is made of bamboo and can only be accessed by foot and motorbike. The trip to the bridge location is also through a path and is quite steep. Even so, the existence of this bridge is very useful for community connectivity, which mainly uses the bridge to carry crops / livestock and access to land and fishing grounds.
Two bridges will be built across the Cisokan River and the lower reservoir, to replace the four suspension bridges that currently provide access between West Bandung Regency and Cianjur Regency over the Cisokan River. The bridge serves as access from settlements in the resettlement location of Kampung Cangkuang and Blok Jolok towards Cianjur. The length of the bridge required is approximately 350 m and 200 m. The location of the bridge is illustrated in Figure 87.
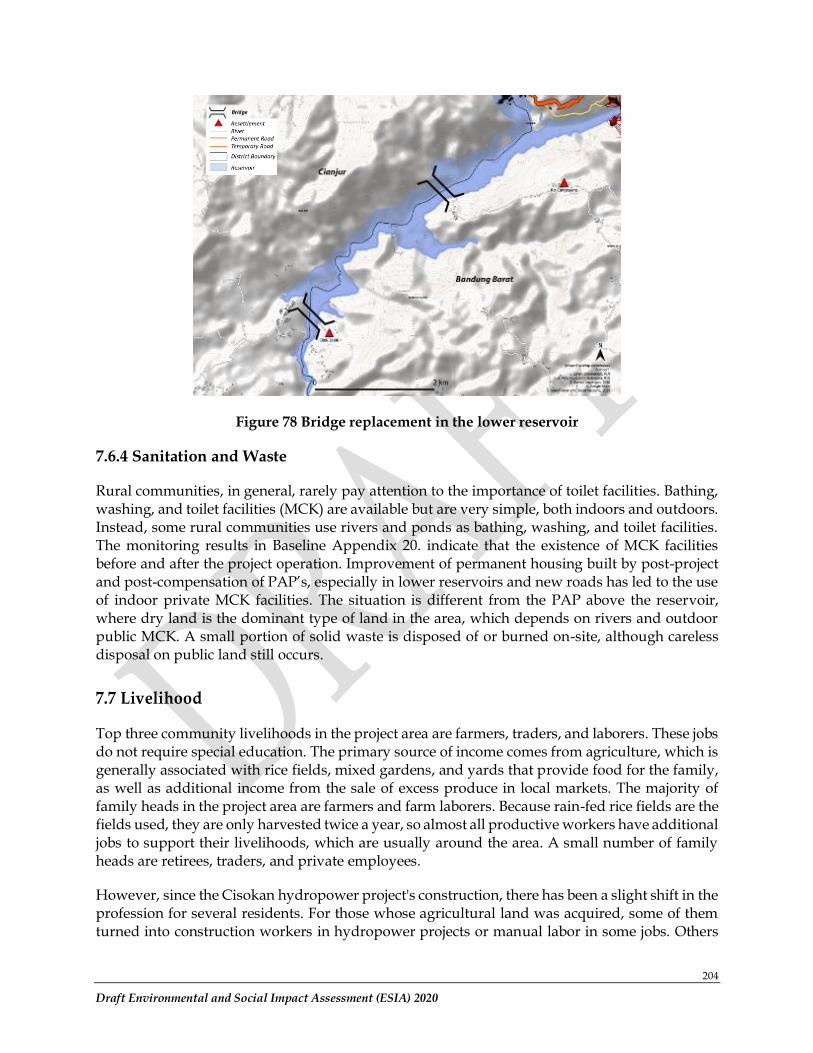
204
Draft Environmental and Social Impact Assessment (ESIA) 2020
Figure 78 Bridge replacement in the lower reservoir
7.6.4 Sanitation and Waste
Rural communities, in general, rarely pay attention to the importance of toilet facilities. Bathing, washing, and toilet facilities (MCK) are available but are very simple, both indoors and outdoors. Instead, some rural communities use rivers and ponds as bathing, washing, and toilet facilities. The monitoring results in Baseline Appendix 20. indicate that the existence of MCK facilities before and after the project operation. Improvement of permanent housing built by post-project and post-compensation of PAP’s, especially in lower reservoirs and new roads has led to the use of indoor private MCK facilities. The situation is different from the PAP above the reservoir, where dry land is the dominant type of land in the area, which depends on rivers and outdoor public MCK. A small portion of solid waste is disposed of or burned on-site, although careless disposal on public land still occurs.
7.7 Livelihood
Top three community livelihoods in the project area are farmers, traders, and laborers. These jobs do not require special education. The primary source of income comes from agriculture, which is generally associated with rice fields, mixed gardens, and yards that provide food for the family, as well as additional income from the sale of excess produce in local markets. The majority of family heads in the project area are farmers and farm laborers. Because rain-fed rice fields are the fields used, they are only harvested twice a year, so almost all productive workers have additional jobs to support their livelihoods, which are usually around the area. A small number of family heads are retirees, traders, and private employees.
However, since the Cisokan hydropower project's construction, there has been a slight shift in the profession for several residents. For those whose agricultural land was acquired, some of them turned into construction workers in hydropower projects or manual labor in some jobs. Others
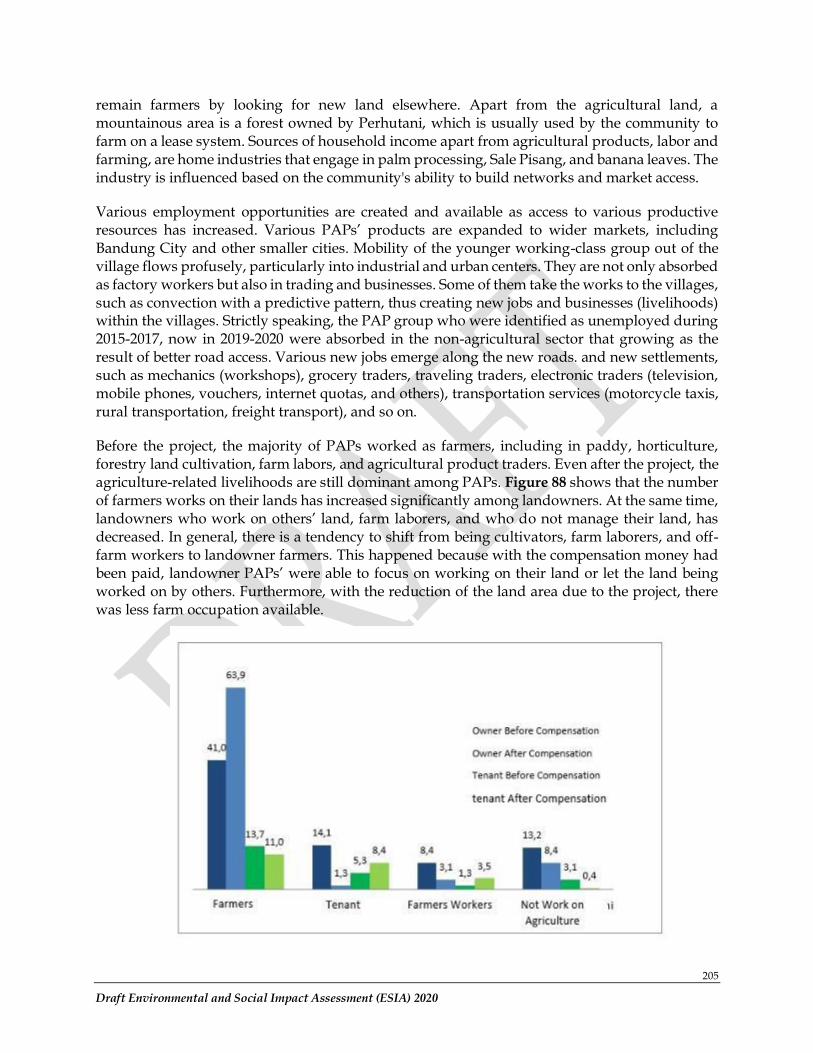
205
Draft Environmental and Social Impact Assessment (ESIA) 2020
remain farmers by looking for new land elsewhere. Apart from the agricultural land, a mountainous area is a forest owned by Perhutani, which is usually used by the community to farm on a lease system. Sources of household income apart from agricultural products, labor and farming, are home industries that engage in palm processing, Sale Pisang, and banana leaves. The industry is influenced based on the community's ability to build networks and market access.
Various employment opportunities are created and available as access to various productive resources has increased. Various PAPs’ products are expanded to wider markets, including Bandung City and other smaller cities. Mobility of the younger working-class group out of the village flows profusely, particularly into industrial and urban centers. They are not only absorbed as factory workers but also in trading and businesses. Some of them take the works to the villages, such as convection with a predictive pattern, thus creating new jobs and businesses (livelihoods) within the villages. Strictly speaking, the PAP group who were identified as unemployed during 2015-2017, now in 2019-2020 were absorbed in the non-agricultural sector that growing as the result of better road access. Various new jobs emerge along the new roads. and new settlements, such as mechanics (workshops), grocery traders, traveling traders, electronic traders (television, mobile phones, vouchers, internet quotas, and others), transportation services (motorcycle taxis, rural transportation, freight transport), and so on.
Before the project, the majority of PAPs worked as farmers, including in paddy, horticulture, forestry land cultivation, farm labors, and agricultural product traders. Even after the project, the agriculture-related livelihoods are still dominant among PAPs. Figure 88 shows that the number of farmers works on their lands has increased significantly among landowners. At the same time, landowners who work on others’ land, farm laborers, and who do not manage their land, has decreased. In general, there is a tendency to shift from being cultivators, farm laborers, and off-farm workers to landowner farmers. This happened because with the compensation money had been paid, landowner PAPs’ were able to focus on working on their land or let the land being worked on by others. Furthermore, with the reduction of the land area due to the project, there was less farm occupation available.
206
Draft Environmental and Social Impact Assessment (ESIA) 2020
Figure 79 New main agriculture-related occupations of the PAPs based on the land status before and after the compensation payment (%)
For those PAPs whose livelihoods were affected by the project, there were training and assistance to prepare them for new livelihoods, such as provisions of (1) the opportunity to start up food stalls business along the new road; (2) the opportunity to work on PT. Perhutani’s land, in particular within the production zone; (3) training on how to be a breeder (sheep, chickens); (4) training on how to be in fishery business; (5) the opportunity to start up paddy cultivation on dry land which accessible to water sources by providing water pump and tractors; (6) the opportunity on how to be in craftsman business (wood processing, palm sugar processor, banana processor); (7) the opportunity on how to be in trading business (product packaging, online marketing); (8) the opportunity on how to be in the brick processor business (“lio”); (9) training on how to be a mechanic (motor vehicle workshop training); (10) training on how to be a tailor (convection); and (11) training and assistance on how to be officials for a business group (Community Resilience Institution/LKM, PAP Cooperative). PLN has also implemented economic/ livelihood restotarion programs for the PAPs include five trainings and three capital assistance packages namely:
a) Animal Husbandry Engineering Training b) Technical Training and Agricultural Products c) Micro Business Development Training d) Business/Marketing Incubation Training e) Agricultural Intensification Training f) Animal Capital Package g) Agricultural Business Capital Package h) Small Trader Capital Package
7.8 Employment Opportunity
There is a change in employment from the affected area that becomes better. There was a significant increase in land ownership and fewer agricultural workers and a slight change from land workers to off-farm workers. The majority of people affected by the project depend on agriculture and related sectors such as farmers, poultry breeders, sharecroppers, and tractor operators. A small proportion of people work in the trade and handicraft sector (which depend on creativity), and most of them depend heavily on the third person, such as farmers, construction workers, or private workers.
7.9 Income and Poverty Levels
The poverty line in Indonesia is determined based on a minimum calorie intake of 2,100 kcal per capita per month. In March 2019, the Central Statistics Agency determined the poverty line was recorded at Rp425,250/capita/month with the Food Poverty Line's composition at Rp313,232 (73.66 percent) and the Non-Food Poverty Line at Rp112,018, - (26.34 percent).
Poverty condition in the impacted area within Cianjur Regency is projected using data from Social Department of West Java Province on Families with Social Welfare Problems (Penyandang Masalah Kesejahteraan Sosial-PMKS) at District level in the following table:
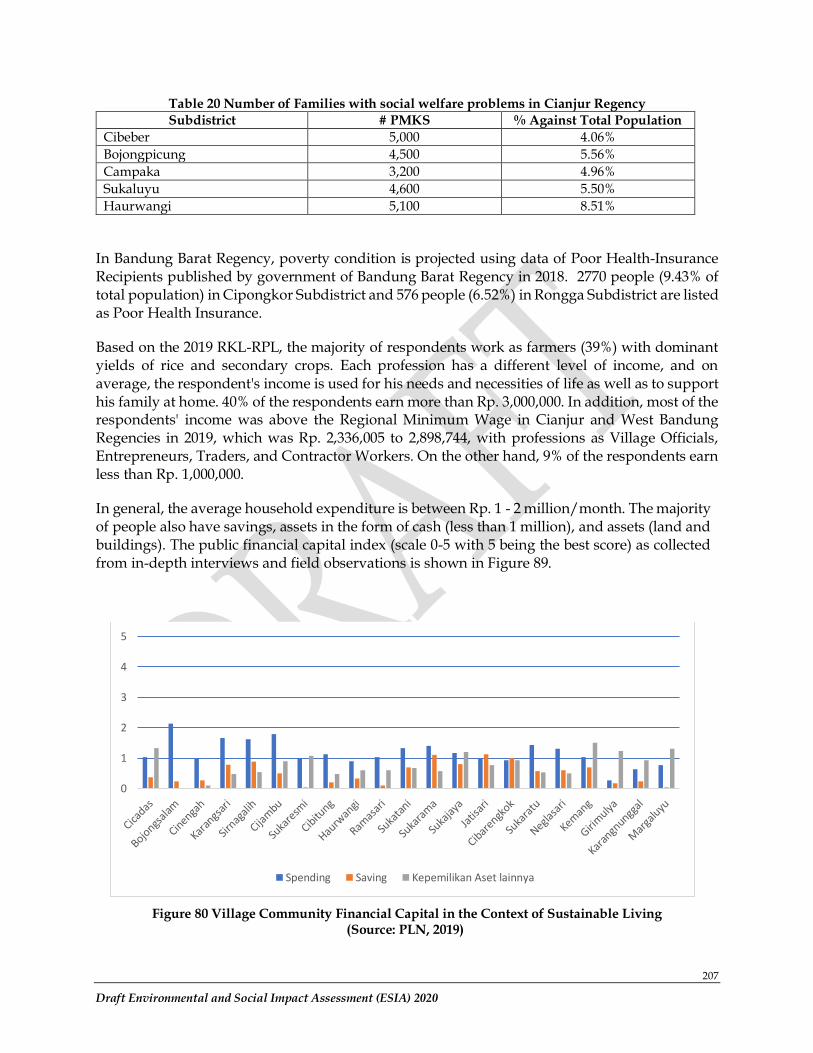
207
Draft Environmental and Social Impact Assessment (ESIA) 2020
Table 20 Number of Families with social welfare problems in Cianjur Regency Subdistrict # PMKS % Against Total Population
Cibeber 5,000 4.06%
Bojongpicung 4,500 5.56%
Campaka 3,200 4.96%
Sukaluyu 4,600 5.50%
Haurwangi 5,100 8.51%
In Bandung Barat Regency, poverty condition is projected using data of Poor Health-Insurance Recipients published by government of Bandung Barat Regency in 2018. 2770 people (9.43% of total population) in Cipongkor Subdistrict and 576 people (6.52%) in Rongga Subdistrict are listed as Poor Health Insurance.
Based on the 2019 RKL-RPL, the majority of respondents work as farmers (39%) with dominant yields of rice and secondary crops. Each profession has a different level of income, and on average, the respondent's income is used for his needs and necessities of life as well as to support his family at home. 40% of the respondents earn more than Rp. 3,000,000. In addition, most of the respondents' income was above the Regional Minimum Wage in Cianjur and West Bandung Regencies in 2019, which was Rp. 2,336,005 to 2,898,744, with professions as Village Officials, Entrepreneurs, Traders, and Contractor Workers. On the other hand, 9% of the respondents earn less than Rp. 1,000,000.
In general, the average household expenditure is between Rp. 1 - 2 million/month. The majority of people also have savings, assets in the form of cash (less than 1 million), and assets (land and buildings). The public financial capital index (scale 0-5 with 5 being the best score) as collected from in-depth interviews and field observations is shown in Figure 89.
Figure 80 Village Community Financial Capital in the Context of Sustainable Living (Source: PLN, 2019)
0
1
2
3
4
5
Spending Saving Kepemilikan Aset lainnya
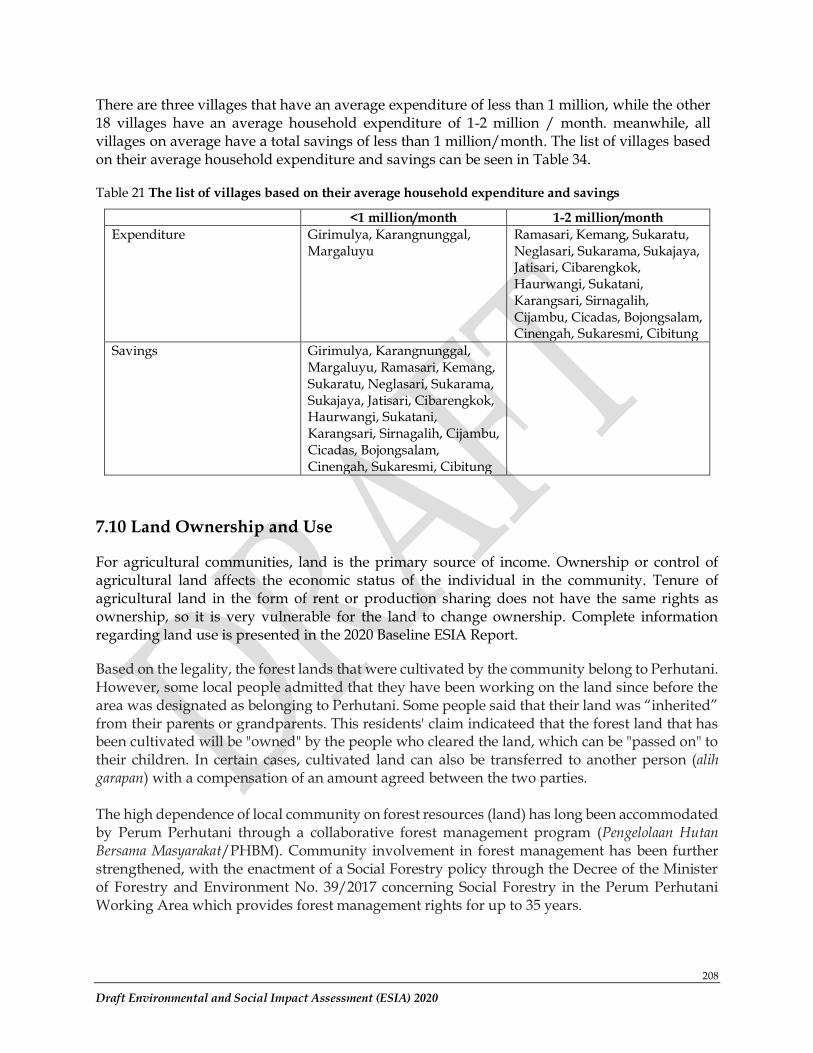
208
Draft Environmental and Social Impact Assessment (ESIA) 2020
There are three villages that have an average expenditure of less than 1 million, while the other 18 villages have an average household expenditure of 1-2 million / month. meanwhile, all villages on average have a total savings of less than 1 million/month. The list of villages based on their average household expenditure and savings can be seen in Table 34.
Table 21 The list of villages based on their average household expenditure and savings
<1 million/month 1-2 million/month
Expenditure Girimulya, Karangnunggal, Margaluyu
Ramasari, Kemang, Sukaratu, Neglasari, Sukarama, Sukajaya, Jatisari, Cibarengkok, Haurwangi, Sukatani, Karangsari, Sirnagalih, Cijambu, Cicadas, Bojongsalam, Cinengah, Sukaresmi, Cibitung
Savings Girimulya, Karangnunggal, Margaluyu, Ramasari, Kemang, Sukaratu, Neglasari, Sukarama, Sukajaya, Jatisari, Cibarengkok, Haurwangi, Sukatani, Karangsari, Sirnagalih, Cijambu, Cicadas, Bojongsalam, Cinengah, Sukaresmi, Cibitung
7.10 Land Ownership and Use
For agricultural communities, land is the primary source of income. Ownership or control of agricultural land affects the economic status of the individual in the community. Tenure of agricultural land in the form of rent or production sharing does not have the same rights as ownership, so it is very vulnerable for the land to change ownership. Complete information regarding land use is presented in the 2020 Baseline ESIA Report.
Based on the legality, the forest lands that were cultivated by the community belong to Perhutani. However, some local people admitted that they have been working on the land since before the area was designated as belonging to Perhutani. Some people said that their land was “inherited” from their parents or grandparents. This residents' claim indicateed that the forest land that has been cultivated will be "owned" by the people who cleared the land, which can be "passed on" to their children. In certain cases, cultivated land can also be transferred to another person (alih garapan) with a compensation of an amount agreed between the two parties. The high dependence of local community on forest resources (land) has long been accommodated by Perum Perhutani through a collaborative forest management program (Pengelolaan Hutan Bersama Masyarakat/PHBM). Community involvement in forest management has been further strengthened, with the enactment of a Social Forestry policy through the Decree of the Minister of Forestry and Environment No. 39/2017 concerning Social Forestry in the Perum Perhutani Working Area which provides forest management rights for up to 35 years.

209
Draft Environmental and Social Impact Assessment (ESIA) 2020
7.11 Ecosystem Services
The Millennium Ecosystem Assessment (2005) defines ecosystem services as the benefits that humans obtain through ecosystems. Ecosystems are complex entities consisting of a dynamic community of plants, animals and micro-organisms and their abiotic environments that interact with each other as a single functional unit (MEA, 2005). An ecosystem can consist of plants, animals, microorganisms, soil, rocks, minerals, water sources and local atmosphere interacting with one another.
Ecosystem function is the ability of ecosystem components to carry out natural processes in providing materials/goods and services needed to meet human needs, both directly and indirectly (de Groot et al. 2012). Thus, ecosystem services are the benefits or benefits derived by humans from ecosystems both directly and indirectly (Costanza et al. 1997; Costanza et al. 2011; de Groot et al. 2012) or in other words ecosystem services are benefits that humans can obtain from various natural resources and processes that are jointly provided by an ecosystem.
7.11.1 Types of Ecosystem Services
The Millennium Ecosystem Assessment (2005) classifies ecosystem services into 4 categories of ecosystem services, namely:
1. Provisioning services such as sources of food, water, genetic resources and fiber, fuels and other materials.
2. Regulatory services such as: air quality regulation, climate regulation, regulation of water flow and flooding, prevention and protection against natural disasters, water purification, waste treatment, and natural pollination control of pest control
3. Cultural services such as cultural identity and diversity, religious and spiritual values, knowledge (traditional and formal), inspiration, aesthetic values, social relations, heritage values, recreation and others.
4. Supporting services such as primary production, land formation, oxygen production, soil resistance, pollination, habitat availability, nutrient cycle.
7.11.2 The Use of Natural Resources and Ecosystem Services
Ecosystems have arranged and provided natural resources for humans to be utilized to meet their needs and livelihood. These natural resources are called ecosystem services or products. Each community group varies in needs and dependence on the type of ecosystem service. Certain ecosystem services such as various types of edible nuts or tubers, wood production, and extreme climate balancing are very important services for the lives and food security of the poor. Meanwhile, for other community groups, cultural and religious services can be more valuable than other services (Rosa et al. 2003). In general, all individuals are very dependent on the existence of ecosystem services (Rosa et al. 2003).
Therefore, based on literature studies of existing documents such as: BPS Data (Kecamatan in Number 2019), Monitoring Report on RKL/RPL Implementation, Journal or the results of
210
Draft Environmental and Social Impact Assessment (ESIA) 2020
previous studies on ecosystem services in Cianjur Regency and West Bandung Regency, several ecosystem services can be identified in the UCPS project area that can and has been utilized by the PAPs, and other Citizens.
7.11.2.1 Provisioning Services
Ecosystems in the UCPS region can provide benefits in the form of provision of food derived from biological sources (plants and animals) and water (fish), both processed and untreated, which are designated as human consumption. Food supply by ecosystems can be derived from agricultural and plantation products, and fishery products. This is reflected by the existence of paddy fields in Bojongpicung District (2,661.73 ha), Campaka District (Margaluyu Village: 275 ha, Sukajadi Village (304 ha), Cibeber District (Girimulya Village: 115 ha, Karangnunggal Village: 201.7 ha, and Salamnunggal Village: 194.5 ha). For Cipongkor and Rongga Districts, there are plantations for vegetables and fruits such as long beans, large chilies, cayenne pepper, mushrooms, tomatoes, eggplant, beans, cucumbers, squash, kale, spinach, melons, watermelons and cantaloupe. Fishery products in the form of freshwater fish are caught by residents both for consumption and for sale.
Cianjur and West Bandung District as administrative areas within the Cisokan watershed area, have the potential for productive agricultural commodity land. A total of 103,493 tonnes/year of agricultural commodities are produced from productive lands in this watershed. The largest amount is produced from rice production of 92,006 tons in one year from the seven sub-districts in the Cisokan watershed area. The area that produces the most rice is the sub-district Rongga, West Bandung District, amounting to 20,201 tons in a year, or in two planting periods.
Apart from rice, the local community also manages the land by cultivating cassava, sweet potato, corn and soybeans. Cassava and maize are the commodities that have contributed the highest production figures after rice commodities, respectively worth 5,476 tons and 5,013 tons in one year. It can be seen that the agricultural land in the Cisokan watershed is still able to meet the main food needs of the local community, and can even be used as industry to be marketed to other areas.
Ecosystems in the UCPS region also provide the benefits of water supply, namely the availability of water both from surface water and ground water (including its storage capacity), even rainwater can be used for domestic and agricultural purposes. The provision of clean water services is strongly influenced by rainfall conditions and layers of soil or rocks that can store water (aquifers) as well as factors that can affect groundwater storage systems. There are dug wells, pump wells, springs and piped water that are used as a source of clean water and drinking water for residents in the UCPS area.
Energy supply can also be obtained from ecosystems in the UCPS region. Alternative energy sources from nature such as hydropower and solar energy can be developed for community use. Based on BPS data (2019), some residents, especially in Bojongpicung District (Jatisari Village) and Cibeber District (Cibeber Village) use firewood as an energy source.
7.11.2.2 Regulating Services
Naturally the ecosystems in the UCPS region have the function of climate regulation services, which include the regulation of temperature, humidity and rain, wind, control of greenhouse gases & carbon sequestration. The function of climate regulation is influenced by the presence of
211
Draft Environmental and Social Impact Assessment (ESIA) 2020
biotic factors, especially vegetation, location and physiographic factors such as altitude and landform. The UCPS area has a dense vegetation density and large elevations such as mountains. This will result in a better climate regulation system that directly benefits in reducing carbon dioxide emissions and the greenhouse effect and reducing the impact of global warming. The condition of climate trends in the UCPS region can be seen in section 3.2.1.
Hydrological cycle, is the movement of water in a hydrosphere which includes the process of evaporation, condensation, rain, and flowing. Hydrologic cycles that occur in the atmosphere include the formation of rain clouds, the formation of rain, and evaporation, transpiration, evapotranspiration. While the hydrologic cycle that occurs in the biosphere and lithosphere is the aquatic ecosystem which includes surface runoff, freshwater ecosystems, and sea water ecosystems. A normal hydrological cycle will have an impact on good water management for various purposes such as water storage, flood control, and maintenance of water availability. Water management by hydrological cycle is strongly influenced by the presence of land cover and the physiography of an area. Data on the hydrology of the UCPS region can be seen in section 3.2.2.
Ecosystems also contain regulatory elements in natural infrastructure for the prevention and protection of several types of disasters, especially natural disasters. Some functions of preventing natural disasters from land fires, erosion, abrasion, landslides, storms and tsunamis are closely related to the presence of land coverage and landforms. In the UCPS area which has close vegetation coverage can prevent the area from erosion and landslides. Besides the specific landforms can directly impacting the source of the disaster, for example erosion and landslide disasters generally occur in structural and denudational landforms with hilly morphology.
The ability to "cleanse" pollutants through chemical-physical-biological processes that occur naturally in water bodies is one of the ecosystem services regulatory functions. The ability to purify water naturally (self-purification) takes time and is influenced by the high and low load of pollutants and natural recovery techniques, especially the activity of natural bacteria in remodel organic matter, so that the capacity of water bodies in thinning, breaking down and absorbing pollutants increases. Data on water quality in the UCPS area can be seen in Appendix 11. This data indicates the ability of ecosystems to clean pollutants.
Ecosystem services include location capacity in neutralizing, extracting and absorbing waste and rubbish. In a limited capacity, the ecosystem has the ability to neutralize the organic substances present in wastewater. Nature provides a variety of microbes (aerobes) that are able to decompose organic substances contained in wastes and rubbish into inorganic substances that are stable and have no environmental impact. Aerobic microbes provided by the ecosystem and play a role in the process of neutralizing, breaking down and absorbing waste and garbage including bacteria, fungi, protozoa, algae.
Good air quality is one of the benefits provided by the ecosystem. Air quality is strongly influenced by interactions between various pollutants emitted into the air by meteorological factors (wind, temperature, rain, sunlight) and utilization of the earth's surface space. The higher the intensity of space utilization, the more dynamic the air quality. Air quality maintenance services in vegetated areas and in high-topographic areas are generally better than non-vegetation areas. Data on air quality in the UCPS region indicates the ability of ecosystems in the current air quality regulation can be seen in Appendix 12.
212
Draft Environmental and Social Impact Assessment (ESIA) 2020
Natural pollination is the process of pollination (the transfer of pollen from the anthers to the pistil) which specifically occurs in the same flower or between different flowers but in one plant or between flowers in the same plant clone. Ecosystems provide natural pollination regulation services, especially through the availability of habitat species that can assist the natural pollination process. Natural habitats such as forests and vegetation areas generally provide more abundant pollinating species media.
Pest control is the regulation of disturbing creatures or organisms called pests because they are considered to interfere with human health, ecology, or the economy. Pests and diseases are biotic threats that can reduce yields and can even cause crop failure. Ecosystems naturally provide a system for controlling pests and diseases through the presence of habitat for trigger species and controlling pests and diseases.
7.11.2.3 Cultural Services
Ecosystems provide positive benefits for humans, especially space to live and prosper. This living space is supported by the ability and suitability of land that is high so as to provide life support both socially, economically and culturally. Ecosystem services as a place to live and social space are strongly influenced by physical and geographical environmental conditions and greater regional development opportunities. UCPS region which has a high slope level is an area that does not have enough space to develop a good and quality residential area and living space. Areas that have mountainous ecoregions and folded hills are also areas that have large low and very low carrying capacity. Despite the fact that many settlements and community settlements are in areas of high slope, such settlements and settlements are certainly not within the carrying capacity of their environment.
Ecosystems provide landscape features, natural uniqueness, or certain values that become a tourist attraction. Various forms of landscape and the unique flora and fauna as well as the biodiversity contained in ecosystems provide characteristics and beauty for tourists. From the economic side, many benefits will be obtained as a large source of foreign exchange. The UCPS region which has mountainous ecoregions or folded hills has a high carrying capacity for this ecosystem service.
Ecosystems in the UCPS region that have landscapes such as mountains, valleys, rivers and so on have given a feel of natural beauty and amazing aesthetic values. The combination of landscape and cultural landscape further strengthens the beauty and aesthetic value that ecosystems have provided.
7.11.2.4 Supporting Services
One type of supporting ecosystem services is the formation of soil layers and maintenance of fertility. Land and its fertility are important capital for humans in developing agriculture, and sustaining other life, such as for building settlements, developing tourist activities and others. Land is one of the main natural resources on planet Earth and is the key to the success of living things. The soil is a thin layer of the earth's crust and is the outermost. Soil is the result of weathering or erosion of host rock (inorganic) mixed with organic matter. Soil contains rock or mineral particles, organic matter (organic compounds and organisms) water and air. Minerals are the main soil elements formed from inorganic solids and have a homogeneous composition. Ecosystems provide support services in the form of soil formation and maintenance of fertility
213
Draft Environmental and Social Impact Assessment (ESIA) 2020
which varies between locations. Locations that have fast weathered rock types, with conditions of rainfall and high sun exposure due to the shape of the earth's surface and are supported by the presence of organisms in soil and ground cover plants. Soil formation and fertility maintenance services support the provision of food, fiber, energy and genetic resource services to be able to develop due to the availability of fertile soil media for the growth of plants that produce food, produce fiber and energy, and the development of genetic resources. Fertile soil is also needed to support the growth of plants, so that photosynthesis occurs in absorbing carbon dioxide which pollutes the air and releases oxygen, so that air quality is maintained. The part of the UCPS area is in the form of forests that have good vegetation cover and have a high carrying capacity for this service.
The nutrient cycle in an ecosystem is an integrated process of movement/transfer of energy and nutrients within the ecosystem itself and also its interactions with the atmosphere, biosphere, geosphere and hydrosphere. The energy needed to drive the nutrient cycle is obtained from the processes that occur in the biosphere which is the process of photosynthesis. Ecosystems naturally provide nutrients needed by plants from the soil through their absorption of nutrients and then accumulated in plant tissues and return to the soil either directly or indirectly as organic material. The process of nutrient uptake, nutrient accumulation in plant bodies and return to the soil through various cycles according to plant conditions, climate and soil type itself so that ultimately affects the soil fertility and high levels of agricultural production. This nutrient cycle supports agricultural activities, because with a good nutrient cycle, the fertility of agricultural land is well maintained, and ultimately produces other ecosystem services such as food services, fiber services, energy, climate regulation, maintenance of air quality and other ecosystem services. The UCPS region which is a mountainous region is indicated to have a high carrying capacity for this ecosystem service.
Ecosystems in the UCPS region can also provide primary production services in the form of oxygen production and species habitat provision. This is proven by the existence of diversity of flora and fauna that need oxygen for the survival of life. Ecosystems provide oxygen-producing services while reducing carbon dioxide levels and air populations on earth. The existence of vegetation such as forests that absorb carbon dioxide for food production (photosynthesis). The result of photosynthesis is oxygen. This is the gas that living things need on earth to move and allow the growth of many species' habitats. Oxygen production services vary between locations and are closely related to the presence of vegetation and forests. Forested areas provide a very high and high carrying capacity. It can be understood that on the land thus there is an intensive process of photosynthesis. This photosynthesis process produces primary production, namely oxygen, fiber and other primary production. The process of photosynthesis at the same time also absorbs carbon dioxide in the results of the photosynthesis process which is stored in the form of fiber.
Ecosystems in the UCPS region have provided biodiversity services among living things from all sources, both terrestrial and other aquatic ecosystems and ecological complexes that are part of its diversity; includes diversity within species, between species and ecosystems that constitute a breeding habitat for flora and fauna. The higher the character of biodiversity, the higher the function of ecosystem support for livelihoods. In areas that have high primary production services, carrying capacity and capacity for biodiversity services are also high. Data on UCPS Biodiversity can be seen in Appendix 13.
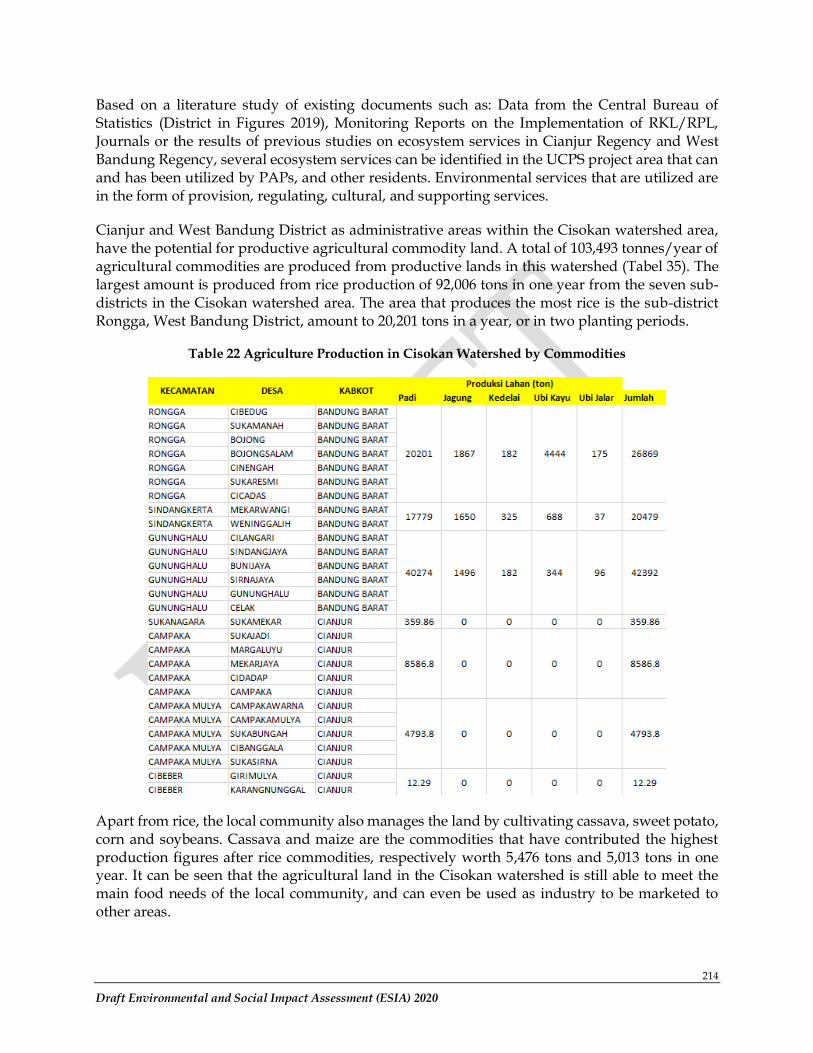
214
Draft Environmental and Social Impact Assessment (ESIA) 2020
Based on a literature study of existing documents such as: Data from the Central Bureau of Statistics (District in Figures 2019), Monitoring Reports on the Implementation of RKL/RPL, Journals or the results of previous studies on ecosystem services in Cianjur Regency and West Bandung Regency, several ecosystem services can be identified in the UCPS project area that can and has been utilized by PAPs, and other residents. Environmental services that are utilized are in the form of provision, regulating, cultural, and supporting services.
Cianjur and West Bandung District as administrative areas within the Cisokan watershed area, have the potential for productive agricultural commodity land. A total of 103,493 tonnes/year of agricultural commodities are produced from productive lands in this watershed (Tabel 35). The largest amount is produced from rice production of 92,006 tons in one year from the seven sub-districts in the Cisokan watershed area. The area that produces the most rice is the sub-district Rongga, West Bandung District, amount to 20,201 tons in a year, or in two planting periods.
Table 22 Agriculture Production in Cisokan Watershed by Commodities
Apart from rice, the local community also manages the land by cultivating cassava, sweet potato, corn and soybeans. Cassava and maize are the commodities that have contributed the highest production figures after rice commodities, respectively worth 5,476 tons and 5,013 tons in one year. It can be seen that the agricultural land in the Cisokan watershed is still able to meet the main food needs of the local community, and can even be used as industry to be marketed to other areas.
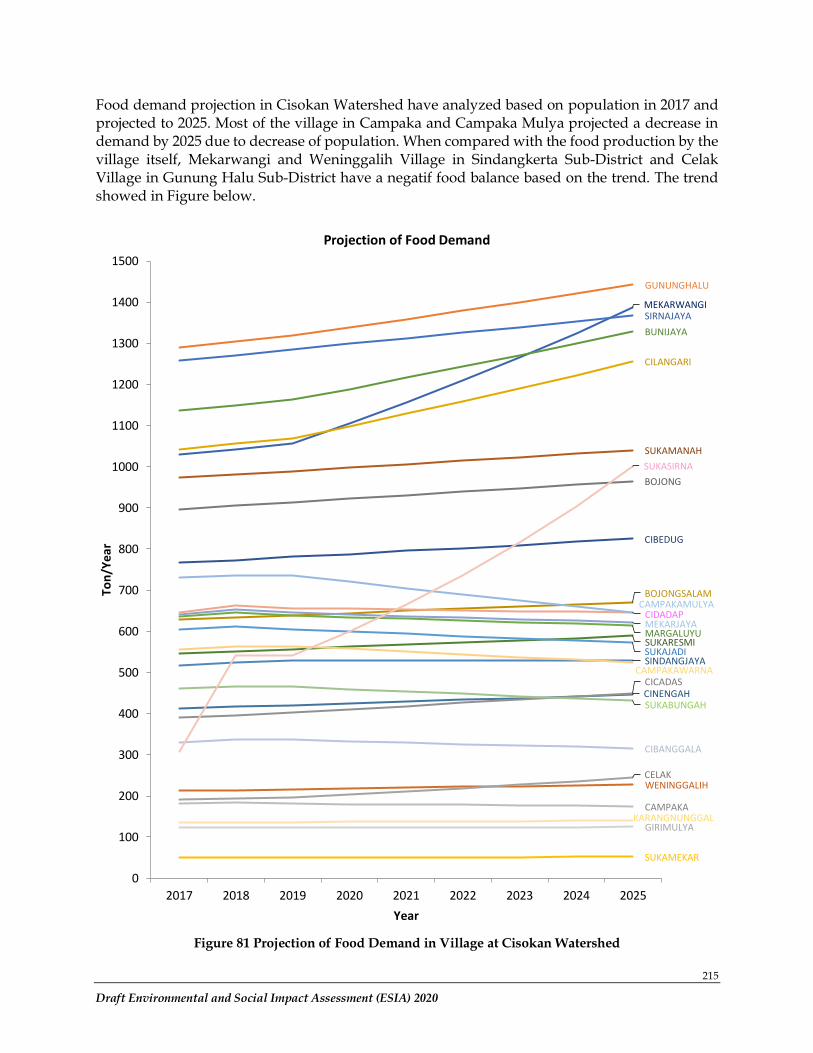
215
Draft Environmental and Social Impact Assessment (ESIA) 2020
Food demand projection in Cisokan Watershed have analyzed based on population in 2017 and projected to 2025. Most of the village in Campaka and Campaka Mulya projected a decrease in demand by 2025 due to decrease of population. When compared with the food production by the village itself, Mekarwangi and Weninggalih Village in Sindangkerta Sub-District and Celak Village in Gunung Halu Sub-District have a negatif food balance based on the trend. The trend showed in Figure below.
Figure 81 Projection of Food Demand in Village at Cisokan Watershed
CIBEDUG
SUKAMANAH
BOJONG
BOJONGSALAM
CINENGAH
SUKARESMI
MEKARWANGI
WENINGGALIH
CICADAS
CILANGARI
SINDANGJAYA
BUNIJAYA
SIRNAJAYA
GUNUNGHALU
CELAK
SUKAMEKAR
SUKAJADI
MARGALUYUMEKARJAYACIDADAP
CAMPAKA
CAMPAKAWARNA
CAMPAKAMULYA
SUKABUNGAH
CIBANGGALA
SUKASIRNA
GIRIMULYAKARANGNUNGGAL
0
100
200
300
400
500
600
700
800
900
1000
1100
1200
1300
1400
1500
2017 2018 2019 2020 2021 2022 2023 2024 2025
Ton
/Ye
ar
Year
Projection of Food Demand
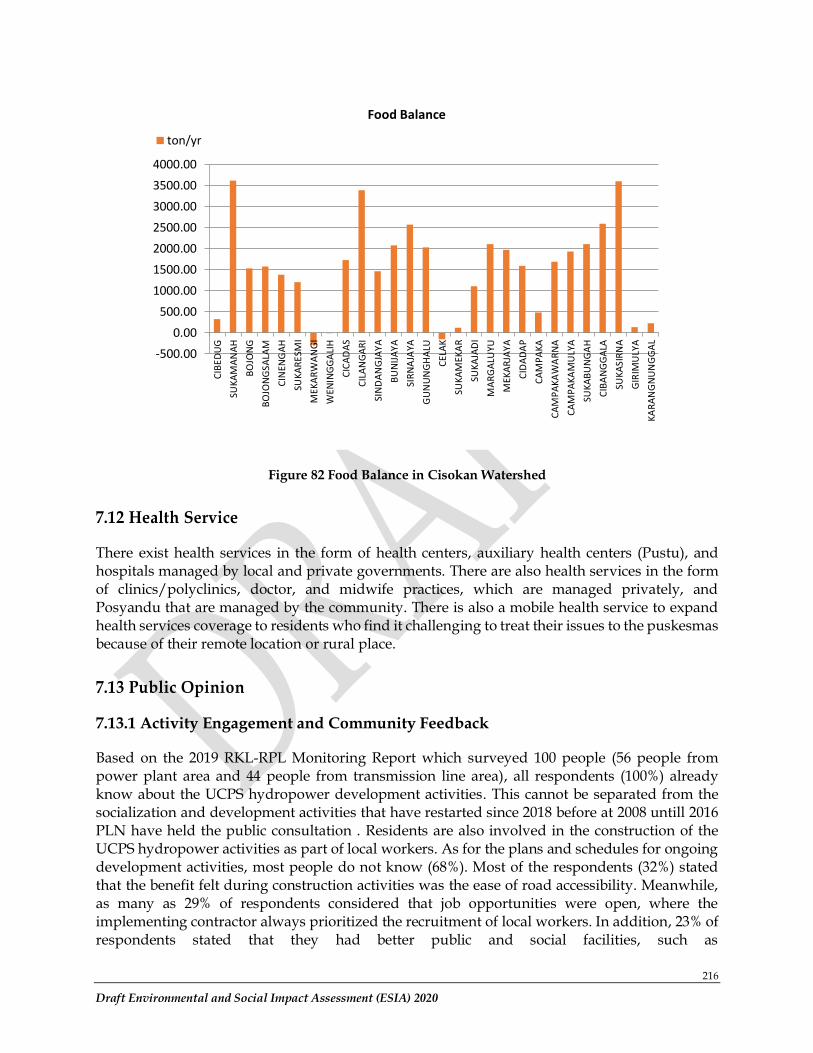
216
Draft Environmental and Social Impact Assessment (ESIA) 2020
Figure 82 Food Balance in Cisokan Watershed
7.12 Health Service
There exist health services in the form of health centers, auxiliary health centers (Pustu), and hospitals managed by local and private governments. There are also health services in the form of clinics/polyclinics, doctor, and midwife practices, which are managed privately, and Posyandu that are managed by the community. There is also a mobile health service to expand health services coverage to residents who find it challenging to treat their issues to the puskesmas because of their remote location or rural place.
7.13 Public Opinion
7.13.1 Activity Engagement and Community Feedback
Based on the 2019 RKL-RPL Monitoring Report which surveyed 100 people (56 people from power plant area and 44 people from transmission line area), all respondents (100%) already know about the UCPS hydropower development activities. This cannot be separated from the socialization and development activities that have restarted since 2018 before at 2008 untill 2016 PLN have held the public consultation . Residents are also involved in the construction of the UCPS hydropower activities as part of local workers. As for the plans and schedules for ongoing development activities, most people do not know (68%). Most of the respondents (32%) stated that the benefit felt during construction activities was the ease of road accessibility. Meanwhile, as many as 29% of respondents considered that job opportunities were open, where the implementing contractor always prioritized the recruitment of local workers. In addition, 23% of respondents stated that they had better public and social facilities, such as
-500.00
0.00
500.00
1000.00
1500.00
2000.00
2500.00
3000.00
3500.00
4000.00
CIB
ED
UG
SUK
AM
AN
AH
BO
JON
G
BO
JON
GSA
LAM
CIN
ENG
AH
SUK
AR
ESM
I
MEK
AR
WA
NG
I
WEN
ING
GA
LIH
CIC
AD
AS
CIL
AN
GA
RI
SIN
DA
NG
JAY
A
BU
NIJ
AY
A
SIR
NA
JAYA
GU
NU
NG
HA
LU
CEL
AK
SUK
AM
EKA
R
SUK
AJA
DI
MA
RG
ALU
YU
MEK
AR
JAY
A
CID
AD
AP
CA
MP
AK
A
CA
MP
AK
AW
AR
NA
CA
MP
AK
AM
ULY
A
SUK
AB
UN
GA
H
CIB
AN
GG
ALA
SUK
ASI
RN
A
GIR
IMU
LYA
KA
RA
NG
NU
NG
GA
L
Food Balance
ton/yr
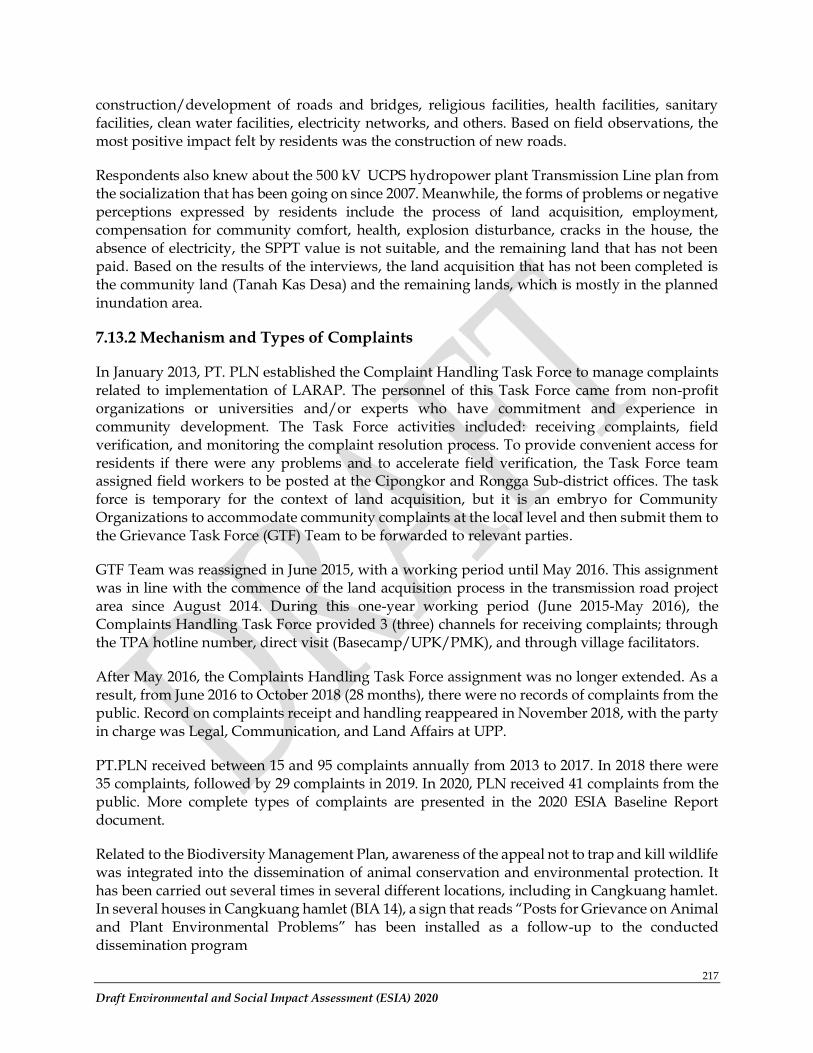
217
Draft Environmental and Social Impact Assessment (ESIA) 2020
construction/development of roads and bridges, religious facilities, health facilities, sanitary facilities, clean water facilities, electricity networks, and others. Based on field observations, the most positive impact felt by residents was the construction of new roads.
Respondents also knew about the 500 kV UCPS hydropower plant Transmission Line plan from the socialization that has been going on since 2007. Meanwhile, the forms of problems or negative perceptions expressed by residents include the process of land acquisition, employment, compensation for community comfort, health, explosion disturbance, cracks in the house, the absence of electricity, the SPPT value is not suitable, and the remaining land that has not been paid. Based on the results of the interviews, the land acquisition that has not been completed is the community land (Tanah Kas Desa) and the remaining lands, which is mostly in the planned inundation area.
7.13.2 Mechanism and Types of Complaints
In January 2013, PT. PLN established the Complaint Handling Task Force to manage complaints related to implementation of LARAP. The personnel of this Task Force came from non-profit organizations or universities and/or experts who have commitment and experience in community development. The Task Force activities included: receiving complaints, field verification, and monitoring the complaint resolution process. To provide convenient access for residents if there were any problems and to accelerate field verification, the Task Force team assigned field workers to be posted at the Cipongkor and Rongga Sub-district offices. The task force is temporary for the context of land acquisition, but it is an embryo for Community Organizations to accommodate community complaints at the local level and then submit them to the Grievance Task Force (GTF) Team to be forwarded to relevant parties.
GTF Team was reassigned in June 2015, with a working period until May 2016. This assignment was in line with the commence of the land acquisition process in the transmission road project area since August 2014. During this one-year working period (June 2015-May 2016), the Complaints Handling Task Force provided 3 (three) channels for receiving complaints; through the TPA hotline number, direct visit (Basecamp/UPK/PMK), and through village facilitators.
After May 2016, the Complaints Handling Task Force assignment was no longer extended. As a result, from June 2016 to October 2018 (28 months), there were no records of complaints from the public. Record on complaints receipt and handling reappeared in November 2018, with the party in charge was Legal, Communication, and Land Affairs at UPP.
PT.PLN received between 15 and 95 complaints annually from 2013 to 2017. In 2018 there were 35 complaints, followed by 29 complaints in 2019. In 2020, PLN received 41 complaints from the public. More complete types of complaints are presented in the 2020 ESIA Baseline Report document.
Related to the Biodiversity Management Plan, awareness of the appeal not to trap and kill wildlife was integrated into the dissemination of animal conservation and environmental protection. It has been carried out several times in several different locations, including in Cangkuang hamlet. In several houses in Cangkuang hamlet (BIA 14), a sign that reads “Posts for Grievance on Animal and Plant Environmental Problems” has been installed as a follow-up to the conducted dissemination program
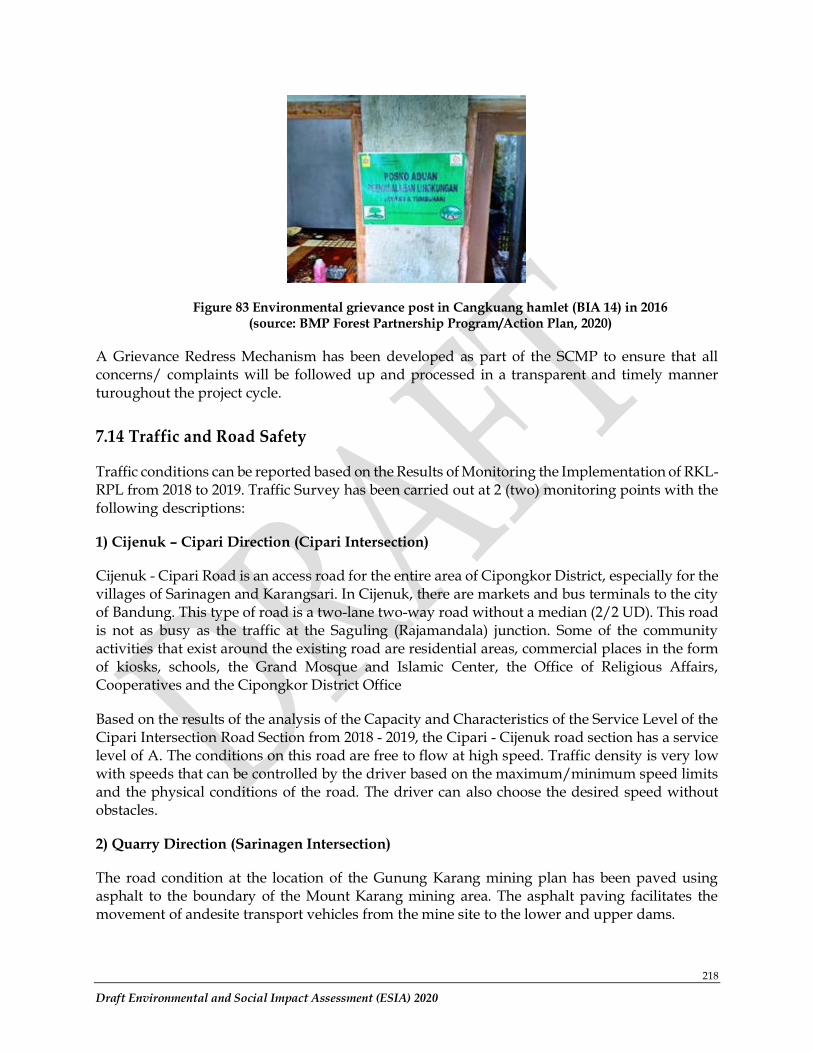
218
Draft Environmental and Social Impact Assessment (ESIA) 2020
Figure 83 Environmental grievance post in Cangkuang hamlet (BIA 14) in 2016 (source: BMP Forest Partnership Program/Action Plan, 2020)
A Grievance Redress Mechanism has been developed as part of the SCMP to ensure that all concerns/ complaints will be followed up and processed in a transparent and timely manner turoughout the project cycle.
7.14 Traffic and Road Safety
Traffic conditions can be reported based on the Results of Monitoring the Implementation of RKL-RPL from 2018 to 2019. Traffic Survey has been carried out at 2 (two) monitoring points with the following descriptions:
1) Cijenuk – Cipari Direction (Cipari Intersection)
Cijenuk - Cipari Road is an access road for the entire area of Cipongkor District, especially for the villages of Sarinagen and Karangsari. In Cijenuk, there are markets and bus terminals to the city of Bandung. This type of road is a two-lane two-way road without a median (2/2 UD). This road is not as busy as the traffic at the Saguling (Rajamandala) junction. Some of the community activities that exist around the existing road are residential areas, commercial places in the form of kiosks, schools, the Grand Mosque and Islamic Center, the Office of Religious Affairs, Cooperatives and the Cipongkor District Office
Based on the results of the analysis of the Capacity and Characteristics of the Service Level of the Cipari Intersection Road Section from 2018 - 2019, the Cipari - Cijenuk road section has a service level of A. The conditions on this road are free to flow at high speed. Traffic density is very low with speeds that can be controlled by the driver based on the maximum/minimum speed limits and the physical conditions of the road. The driver can also choose the desired speed without obstacles.
2) Quarry Direction (Sarinagen Intersection)
The road condition at the location of the Gunung Karang mining plan has been paved using asphalt to the boundary of the Mount Karang mining area. The asphalt paving facilitates the movement of andesite transport vehicles from the mine site to the lower and upper dams.
219
Draft Environmental and Social Impact Assessment (ESIA) 2020
The road from Cipari to the Bojong Loa intersection is a village road and provides access to the entire village area of Sarinagen and Karangsari, Cipongkor District. When the Saguling hydropower project was built, this road function as an access road to Gunung Karang (quarry). As a paved road with a width of ± 10 m, this type of road is a two-lane two-way road without a median (2/2 UD). This T-junction comes from the direction of Cipari - Gunung Karang - Cililin. There are several community activities around the old access road between Mount Karang and Cipari, which are from grocery stalls, food stalls, kiosks, residential areas, Cimega elementary schools, Cipongkor special-needs education school, and the Al-Barqunnajah Foundation School.
Based on the results of the analysis of the Capacity and Characteristics of the Service Level of the Bojong Loa Simpang Road Section from 2018 - 2019, the road to the hydropower plant has a service level of A. The conditions on this road are free to flow at high speed. Traffic density is very low with speeds that can be controlled by the driver based on the maximum/minimum speed limits and the physical conditions of the road. The driver can also choose the desired speed without obstacles. It should be noted that this road descends towards the Saguling hydropower plant, and there is also a traditional market precisely at the intersection.
Based on reports on the results of field observations and the trend of the results of the 2018 and 2019 UCPS RKL-RPL Monitoring, the road safety aspects have improved. Runoff control building, water seepage (groundwater seepage) in the form of drainage channels along the shoulder of the main road and the mine site of Gunung Karang that have been built are made of mortar and stone masonry permanently. The drainage channel needs maintenance because there are several conditions where some of the canals are already covered with vegetation. Overall, the management of erosion and sedimentation associated with road construction activities has undergone significant changes and has reached the lower limit of the dam.
The placement of warning signs and maximum speed restrictions at locations in and out of project vehicles have been installed along the existing road and new road. Road markings as a sign on the road surface or in the form of equipment on the road or signs that form longitudinal lines, transverse lines, oblique lines and other symbols that serve to direct the flow of traffic and limit the area of interest of traffic have also been implemented. Road dividing fences have also been installed at each corner of the road leading. However, some road signs/marks have been taken off or stolen by irresponsible people, for example a convex mirror mounted on the corner of the road that serves to find out/vehicles from the opposite direction. The plan is that the sign will be installed again, and monitoring will be carried out so that the incident does not happen again. Noise barriers are currently not installed along existing and new roads.
Street lighting has been installed on the left/right side of the existing road, which is used to illuminate the road and the environment around the road. The lighting on the new access road has not been implemented.
7.15 Natural Disaster Assessment
7.15.1 Seismic
Indonesia is located in a very active seismic zone, along the Pacific Ring of Fire. The project area is located in Seismic Zone 4, with small to medium earthquake risks for building construction
220
Draft Environmental and Social Impact Assessment (ESIA) 2020
(PLN, 2007). As an example of the frequency and nature of earthquakes in that area, 62 earthquakes were recorded in Cianjur Regency between 1992 and 1993. It has a depth of 344 km from the project location with a strength that can reach 5 on the Richter magnitude scale (PLN, 1998). Based on seismic hazard study in 2017, Peak Ground Acceleration (PGA) in UCPS area is 0.5 to 0.6g (PLN Enjiniring/Nippon Koei/Newjec Inc./Indokoei International/Wiratman, 2019c).
Figure 84 Indonesian Seismic Hazard Map in 2017 (PLN Enjiniring/Nippon Koei/Newjec Inc./Indokoei International/Wiratman, 2019c)
7.15.2 Slope Stability
Slope stability is a problem in the hilly landscape of the project area. Landslides occur quite frequently, due to loss of dense vegetation, high rainfall, earthquakes, modifications to the surface and glide plane, weathered rocks and thick hummus, and steep slopes.
There were nine landslides in the period 1990 to 1994, which affected the livelihoods of the community (but no fatalities) of nearly 1000 people in Cianjur Regency (PLN, 1998). In 2009 an earthquake measuring 7.3 on the Richter scale triggered a landslide in Cianjur Regency and killed several people.
Slope stability within the project area was studied in detail in 2007 to assess the level of landslide risk in the reservoir area. Several areas with the potential for landslides have been identified in the upper reservoir.
7.15.3 Landslide Characteristics and Management of Slope
The landslide observed on the main road of the Upper and Lower Cisokan Hydroelectric Power has different characteristics, both the type and causes. In general, these locations are on slopes with an angle that has more than 45 degrees. Aside from the slope, there are several other causes that cause landslides, namely weathering, erosion, weak field position, and the presence of clay shales. Landslides generally occur at the boundary between bedrock and soil. Landslides occur in many slopes. The soil on slopes is generally thin, with steep slopes of 40°-60° soil easily eroded,
221
Draft Environmental and Social Impact Assessment (ESIA) 2020
even leading to landslides. In hard sandstone lithology or igneous rocks, the soils are so thin that folding them leaves only the rock layer. Potential landslide locations on either side of the road leading to the cliff reinforcement have been carried out with various models. The cliff is strengthened with terracing, gabion ornaments or other reinforcement models.
Work on the management of slope and landslide areas was carried out in 2018, after the road construction in 2013 - 2016. Road repairs and coatings also accompanied this work. Work on handling the slope and landslide areas has been carried out at more than 60 points and the maintenance are still carried out until 2020. Some of the work at this stage includes work on gabion walls, soil retaining wall, river stone retaining wall, shotcrete work and rock bolt/soil nailing. From several landslide locations on the road that have been and are being repaired, 2 (two) locations identified as being of high potential are named ST.10 + 500 and ST.13 + 100. At present, handling and monitoring of landslide points have been carried out on access road access. Management of slopes that have the potential for landslides due to cutting road cliffs has mainly been strengthened. The techniques used are building retaining walls/rocks (DPT) with a shotcrete surface covering system, making concrete buildings and or from stone pairs (gabions), as well as on slopes below the hill. There is also afforestation in areas that have erosion potential, namely in steep/sloping contour areas with plants in the category of ground cover in the form of planting Akar Wangi/Vetiveria zizanoides on the New Road’s Cliff.
7.15.4 Rock Porosity
The level of rock porosity is important to predict the potential for water loss from reservoirs into groundwater and the interaction between surface water and groundwater. The level of water breakdown in the dam's foundation rock has been measured using a water pressure test in the test hole. The porosity level of bedrock in the upper and lower dam was generally low to very low, except for one sample in the upper dam. Most of the borehole test results show a higher level of porosity in the weathered rock near the surface at each of the dam sites.
Flood risk is discussed in the hydrology section.
7.16 Cultural Heritage
The customs and traditions of the community in and around the project area are representative of the customs and traditions of the Sundanese people. Sudanese artistic and cultural traditions are still preserved and practiced throughout the project area and the wider West Bandung Regency and Cianjur Regency. The Sundanese cultural traditions are present as both tangible and intangible objects, as mentioned in Section 7.4.3, for example grave sites, waterfalls and myths and folktore. Many traditions and ceremonies are still practicised and include Saweran, Qasidah, Selametan, Sunatan/Circumcision, Sawer Panganten, Lamaran, Tujuh Bulan, Puput Puser, Gotong Royong Lobaan (Gorol), and Ziarah (PLN, 2019d).
A comprehensive cultural heritage survey (Physical Cultural Resources Survey), which included religious buildings and private graves, was conducted in 2009. The survey was carried out in consultation with the community and included the identification of the location, grid reference location using GPS, and photographic recording. The report, which is provided as standalone
222
Draft Environmental and Social Impact Assessment (ESIA) 2020
report (App-E_UCPS Physical Cultural Resources Survey Report 2009), contains comprehensive descriptions, maps and photos for each location.
None of the sites which are registered with local and national authorities has legal or important protection. Locations that have particular importance, because they have religious or other significance, are considered sacred graves, by the surrounding community and pilgrims, namely Batu Bedil and Maqom Mbah Tubuy (famous ustadz graves). However, there are also many private graves and religious structures within the project area which should also be respected and protected during reservoir construction and preparation.
223
Draft Environmental and Social Impact Assessment (ESIA) 2020
CHAPTER 8. PUBLIC CONSULTATION AND FEEDBACK
This chapter summarizes the bullet points on the public/stakeholder consultation activities undertaken as part of the environmental and social impact assessment for the construction of the Upper Cisokan Pump Hydropower Plant and the 500kV transmission line. The public consultation was held on 30 September 2020, using the online Zoom meeting platform and in-person in 5 locations, namely the Bappeda Office of West Bandung Regency, Rongga District, Cipongkor District, Haurwangi District, and Bojongpicung District. A list of public consultation participants can be seen in Appendix D. Material presented at public consultation activities includes: 1. Inventory result data from environmental and social monitoring reports 2. Assessment and management of environmental and social risks and impacts 3. Acquisition of people's land used in the project (from now on referred to as aspects of LARAP) 4. Boundary Determination of project-affected people or PAPs 5. Risk determination of the UCPS project to the social and economic life of the people in the
affected area 6. Assessment of the project's impact on cultural heritage 7. Assessment of stakeholder engagement 8. Legislative aspects include the laws and regulations that have been established by the
government and become the legal basis for the preparation of the ESIA for the Development of the Upper Cisokan Pumped Storage (UCPS) Hydropower Plant.
This is not the first public consultation that has been held by PLN. There were several public consultation held since 2008 as describe in Table 43.
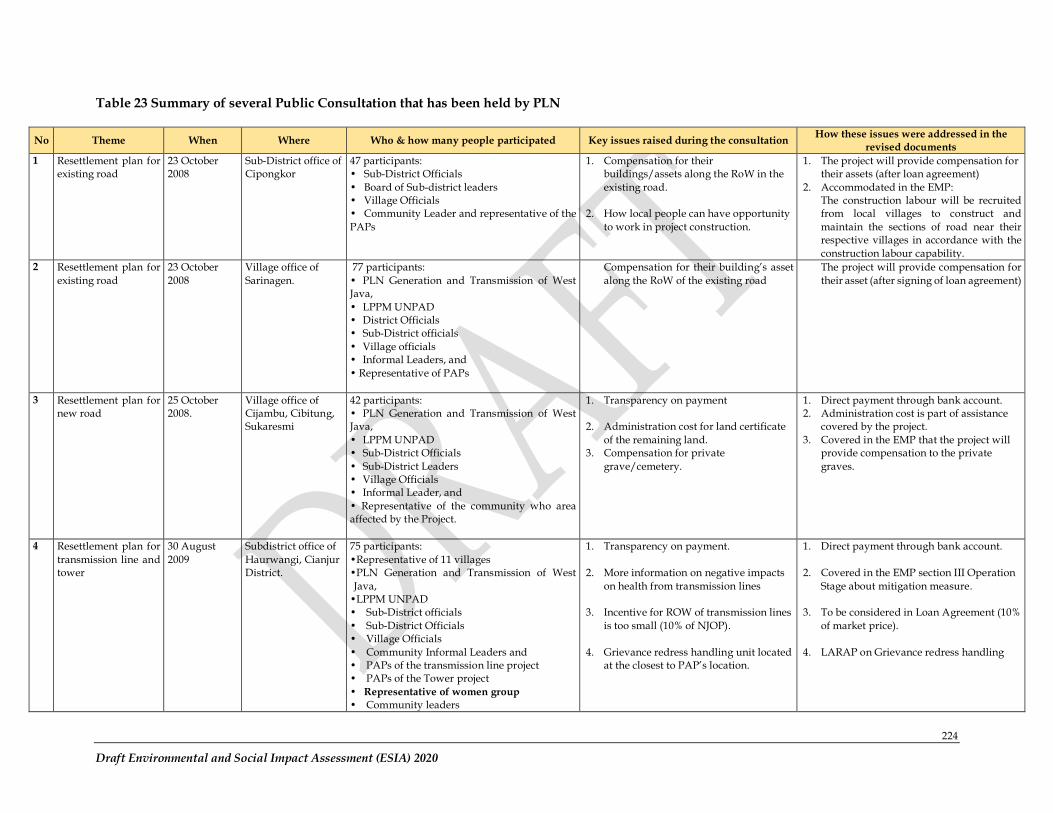
224
Draft Environmental and Social Impact Assessment (ESIA) 2020
Table 23 Summary of several Public Consultation that has been held by PLN
No Theme When Where Who & how many people participated Key issues raised during the consultation How these issues were addressed in the
revised documents
1 Resettlement plan for existing road
23 October 2008
Sub-District office of Cipongkor
47 participants: • Sub-District Officials
• Board of Sub-district leaders • Village Officials • Community Leader and representative of the
PAPs
1. Compensation for their buildings/assets along the RoW in the
existing road.
2. How local people can have opportunity
to work in project construction.
1. The project will provide compensation for their assets (after loan agreement)
2. Accommodated in the EMP: The construction labour will be recruited from local villages to construct and
maintain the sections of road near their respective villages in accordance with the
construction labour capability.
2 Resettlement plan for
existing road
23 October
2008
Village office of
Sarinagen.
77 participants:
• PLN Generation and Transmission of West Java,
• LPPM UNPAD • District Officials • Sub-District officials
• Village officials • Informal Leaders, and
• Representative of PAPs
Compensation for their building’s asset
along the RoW of the existing road
The project will provide compensation for
their asset (after signing of loan agreement)
3 Resettlement plan for new road
25 October 2008.
Village office of Cijambu, Cibitung, Sukaresmi
42 participants: • PLN Generation and Transmission of West Java,
• LPPM UNPAD • Sub-District Officials
• Sub-District Leaders • Village Officials • Informal Leader, and
• Representative of the community who area affected by the Project.
1. Transparency on payment
2. Administration cost for land certificate
of the remaining land. 3. Compensation for private
grave/cemetery.
1. Direct payment through bank account. 2. Administration cost is part of assistance
covered by the project.
3. Covered in the EMP that the project will provide compensation to the private
graves.
4 Resettlement plan for
transmission line and tower
30 August
2009
Subdistrict office of
Haurwangi, Cianjur District.
75 participants:
•Representative of 11 villages •PLN Generation and Transmission of West
Java, •LPPM UNPAD • Sub-District officials
• Sub-District Officials • Village Officials
• Community Informal Leaders and • PAPs of the transmission line project • PAPs of the Tower project
• Representative of women group • Community leaders
1. Transparency on payment.
2. More information on negative impacts
on health from transmission lines
3. Incentive for ROW of transmission lines
is too small (10% of NJOP).
4. Grievance redress handling unit located at the closest to PAP’s location.
1. Direct payment through bank account.
2. Covered in the EMP section III Operation
Stage about mitigation measure.
3. To be considered in Loan Agreement (10%
of market price).
4. LARAP on Grievance redress handling
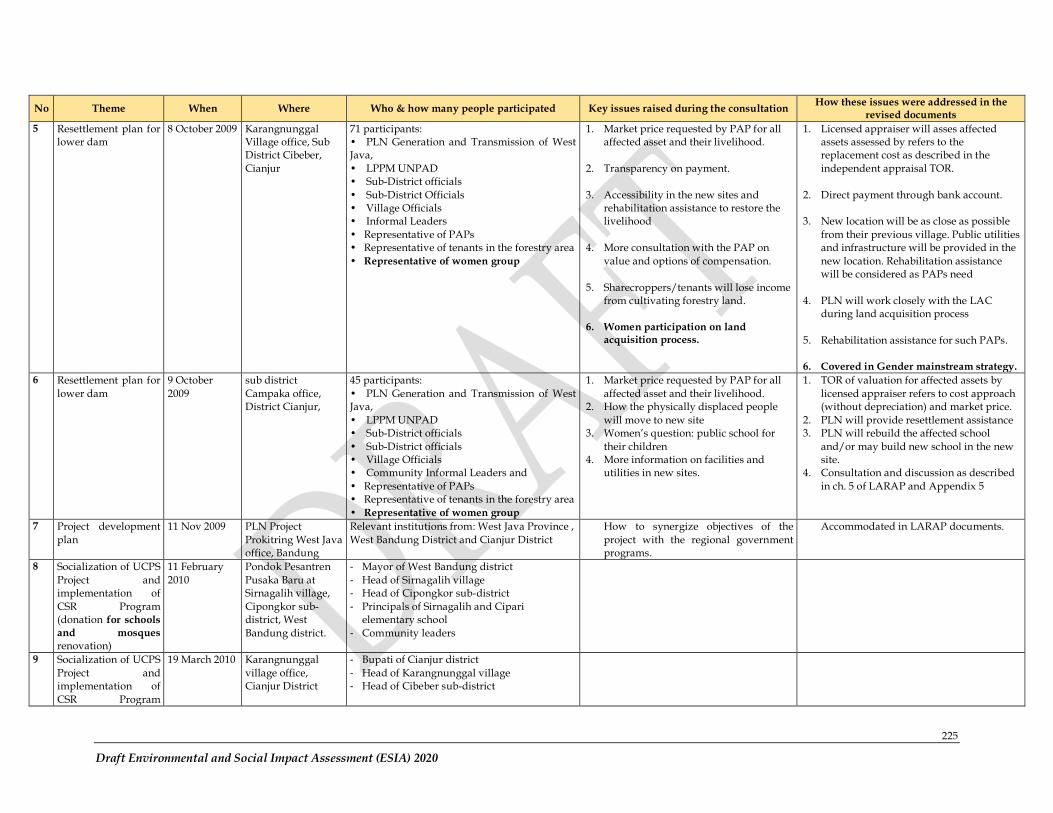
225
Draft Environmental and Social Impact Assessment (ESIA) 2020
No Theme When Where Who & how many people participated Key issues raised during the consultation How these issues were addressed in the
revised documents
5 Resettlement plan for lower dam
8 October 2009 Karangnunggal Village office, Sub District Cibeber,
Cianjur
71 participants: • PLN Generation and Transmission of West Java,
• LPPM UNPAD • Sub-District officials
• Sub-District Officials • Village Officials • Informal Leaders
• Representative of PAPs • Representative of tenants in the forestry area
• Representative of women group
1. Market price requested by PAP for all affected asset and their livelihood.
2. Transparency on payment.
3. Accessibility in the new sites and rehabilitation assistance to restore the livelihood
4. More consultation with the PAP on
value and options of compensation.
5. Sharecroppers/tenants will lose income from cultivating forestry land.
6. Women participation on land acquisition process.
1. Licensed appraiser will asses affected assets assessed by refers to the replacement cost as described in the
independent appraisal TOR.
2. Direct payment through bank account.
3. New location will be as close as possible
from their previous village. Public utilities and infrastructure will be provided in the
new location. Rehabilitation assistance will be considered as PAPs need
4. PLN will work closely with the LAC
during land acquisition process
5. Rehabilitation assistance for such PAPs.
6. Covered in Gender mainstream strategy.
6 Resettlement plan for
lower dam
9 October
2009
sub district
Campaka office, District Cianjur,
45 participants:
• PLN Generation and Transmission of West Java,
• LPPM UNPAD • Sub-District officials
• Sub-District officials • Village Officials • Community Informal Leaders and
• Representative of PAPs • Representative of tenants in the forestry area
• Representative of women group
1. Market price requested by PAP for all
affected asset and their livelihood. 2. How the physically displaced people
will move to new site 3. Women’s question: public school for
their children 4. More information on facilities and
utilities in new sites.
1. TOR of valuation for affected assets by
licensed appraiser refers to cost approach (without depreciation) and market price.
2. PLN will provide resettlement assistance 3. PLN will rebuild the affected school
and/or may build new school in the new site.
4. Consultation and discussion as described
in ch. 5 of LARAP and Appendix 5
7 Project development
plan
11 Nov 2009 PLN Project
Prokitring West Java office, Bandung
Relevant institutions from: West Java Province ,
West Bandung District and Cianjur District
How to synergize objectives of the
project with the regional government programs.
Accommodated in LARAP documents.
8 Socialization of UCPS
Project and implementation of
CSR Program (donation for schools
and mosques renovation)
11 February
2010
Pondok Pesantren
Pusaka Baru at Sirnagalih village,
Cipongkor sub-district, West
Bandung district.
- Mayor of West Bandung district
- Head of Sirnagalih village - Head of Cipongkor sub-district
- Principals of Sirnagalih and Cipari elementary school
- Community leaders
9 Socialization of UCPS
Project and implementation of
CSR Program
19 March 2010 Karangnunggal
village office, Cianjur District
- Bupati of Cianjur district
- Head of Karangnunggal village - Head of Cibeber sub-district
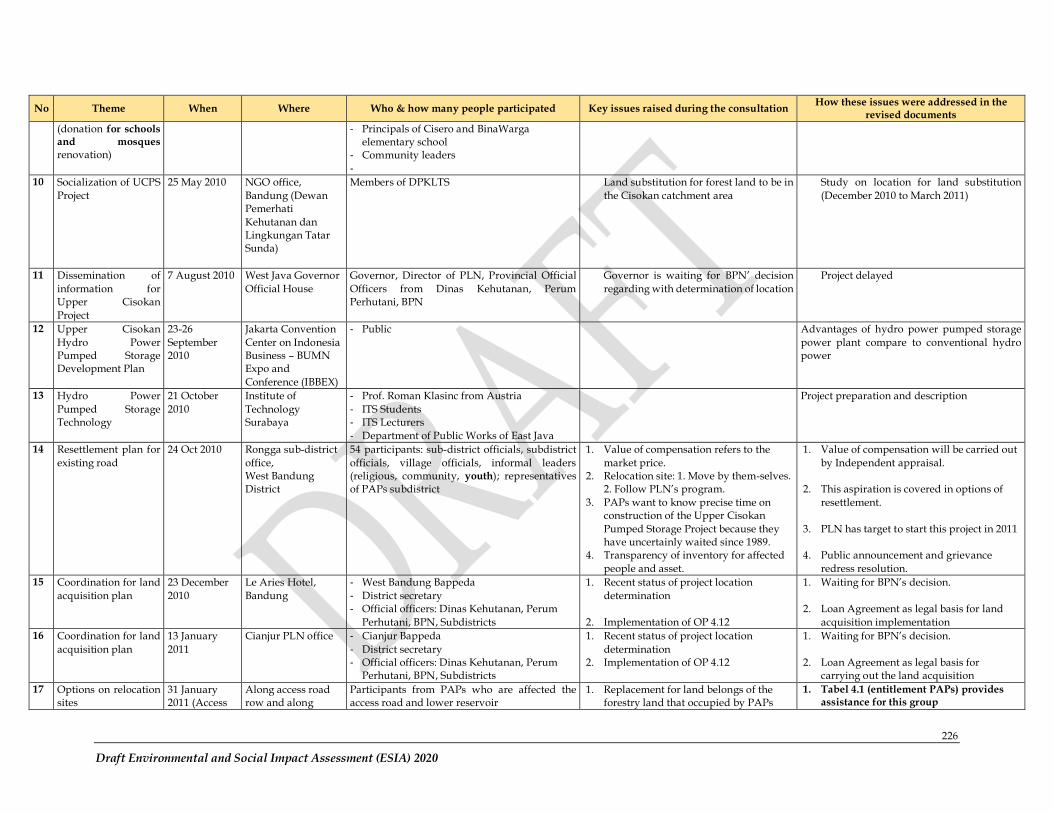
226
Draft Environmental and Social Impact Assessment (ESIA) 2020
No Theme When Where Who & how many people participated Key issues raised during the consultation How these issues were addressed in the
revised documents
(donation for schools and mosques renovation)
- Principals of Cisero and BinaWarga elementary school
- Community leaders
-
10 Socialization of UCPS
Project
25 May 2010 NGO office,
Bandung (Dewan Pemerhati
Kehutanan dan Lingkungan Tatar Sunda)
Members of DPKLTS Land substitution for forest land to be in
the Cisokan catchment area
Study on location for land substitution
(December 2010 to March 2011)
11 Dissemination of
information for Upper Cisokan
Project
7 August 2010 West Java Governor
Official House
Governor, Director of PLN, Provincial Official
Officers from Dinas Kehutanan, Perum Perhutani, BPN
Governor is waiting for BPN’ decision
regarding with determination of location
Project delayed
12 Upper Cisokan
Hydro Power Pumped Storage Development Plan
23-26
September 2010
Jakarta Convention
Center on Indonesia Business – BUMN Expo and
Conference (IBBEX)
- Public Advantages of hydro power pumped storage
power plant compare to conventional hydro power
13 Hydro Power
Pumped Storage Technology
21 October
2010
Institute of
Technology Surabaya
- Prof. Roman Klasinc from Austria
- ITS Students - ITS Lecturers
- Department of Public Works of East Java
Project preparation and description
14 Resettlement plan for
existing road
24 Oct 2010 Rongga sub-district
office, West Bandung District
54 participants: sub-district officials, subdistrict
officials, village officials, informal leaders (religious, community, youth); representatives of PAPs subdistrict
1. Value of compensation refers to the
market price. 2. Relocation site: 1. Move by them-selves.
2. Follow PLN’s program.
3. PAPs want to know precise time on construction of the Upper Cisokan
Pumped Storage Project because they have uncertainly waited since 1989.
4. Transparency of inventory for affected
people and asset.
1. Value of compensation will be carried out
by Independent appraisal.
2. This aspiration is covered in options of
resettlement.
3. PLN has target to start this project in 2011
4. Public announcement and grievance
redress resolution.
15 Coordination for land
acquisition plan
23 December
2010
Le Aries Hotel,
Bandung
- West Bandung Bappeda
- District secretary - Official officers: Dinas Kehutanan, Perum
Perhutani, BPN, Subdistricts
1. Recent status of project location
determination
2. Implementation of OP 4.12
1. Waiting for BPN’s decision.
2. Loan Agreement as legal basis for land
acquisition implementation
16 Coordination for land
acquisition plan
13 January
2011
Cianjur PLN office - Cianjur Bappeda
- District secretary - Official officers: Dinas Kehutanan, Perum
Perhutani, BPN, Subdistricts
1. Recent status of project location
determination 2. Implementation of OP 4.12
1. Waiting for BPN’s decision.
2. Loan Agreement as legal basis for
carrying out the land acquisition
17 Options on relocation sites
31 January 2011 (Access
Along access road row and along
Participants from PAPs who are affected the access road and lower reservoir
1. Replacement for land belongs of the forestry land that occupied by PAPs
1. Tabel 4.1 (entitlement PAPs) provides assistance for this group
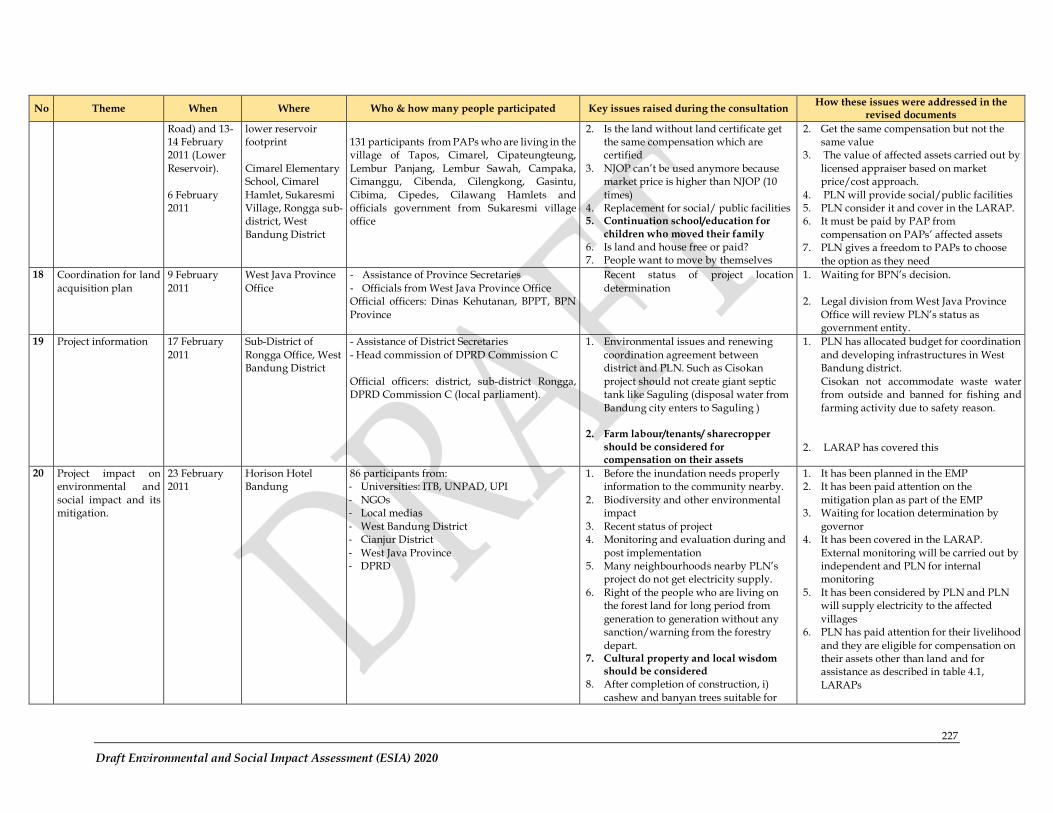
227
Draft Environmental and Social Impact Assessment (ESIA) 2020
No Theme When Where Who & how many people participated Key issues raised during the consultation How these issues were addressed in the
revised documents
Road) and 13-14 February 2011 (Lower
Reservoir).
6 February 2011
lower reservoir footprint
Cimarel Elementary School, Cimarel
Hamlet, Sukaresmi Village, Rongga sub-district, West
Bandung District
131 participants from PAPs who are living in the village of Tapos, Cimarel, Cipateungteung,
Lembur Panjang, Lembur Sawah, Campaka, Cimanggu, Cibenda, Cilengkong, Gasintu,
Cibima, Cipedes, Cilawang Hamlets and officials government from Sukaresmi village office
2. Is the land without land certificate get the same compensation which are certified
3. NJOP can’t be used anymore because market price is higher than NJOP (10
times) 4. Replacement for social/ public facilities 5. Continuation school/education for
children who moved their family
6. Is land and house free or paid? 7. People want to move by themselves
2. Get the same compensation but not the same value
3. The value of affected assets carried out by
licensed appraiser based on market price/cost approach.
4. PLN will provide social/public facilities 5. PLN consider it and cover in the LARAP. 6. It must be paid by PAP from
compensation on PAPs’ affected assets 7. PLN gives a freedom to PAPs to choose
the option as they need
18 Coordination for land
acquisition plan
9 February
2011
West Java Province
Office
- Assistance of Province Secretaries
- Officials from West Java Province Office Official officers: Dinas Kehutanan, BPPT, BPN
Province
Recent status of project location
determination
1. Waiting for BPN’s decision.
2. Legal division from West Java Province
Office will review PLN’s status as government entity.
19 Project information 17 February
2011
Sub-District of
Rongga Office, West Bandung District
- Assistance of District Secretaries
- Head commission of DPRD Commission C
Official officers: district, sub-district Rongga, DPRD Commission C (local parliament).
1. Environmental issues and renewing
coordination agreement between district and PLN. Such as Cisokan
project should not create giant septic tank like Saguling (disposal water from
Bandung city enters to Saguling ) 2. Farm labour/tenants/ sharecropper
should be considered for compensation on their assets
1. PLN has allocated budget for coordination
and developing infrastructures in West Bandung district.
Cisokan not accommodate waste water from outside and banned for fishing and
farming activity due to safety reason.
2. LARAP has covered this
20 Project impact on environmental and
social impact and its mitigation.
23 February 2011
Horison Hotel Bandung
86 participants from: - Universities: ITB, UNPAD, UPI
- NGOs - Local medias
- West Bandung District - Cianjur District
- West Java Province - DPRD
1. Before the inundation needs properly information to the community nearby.
2. Biodiversity and other environmental impact
3. Recent status of project 4. Monitoring and evaluation during and
post implementation 5. Many neighbourhoods nearby PLN’s
project do not get electricity supply.
6. Right of the people who are living on the forest land for long period from
generation to generation without any sanction/warning from the forestry
depart. 7. Cultural property and local wisdom
should be considered
8. After completion of construction, i)
cashew and banyan trees suitable for
1. It has been planned in the EMP 2. It has been paid attention on the
mitigation plan as part of the EMP 3. Waiting for location determination by
governor 4. It has been covered in the LARAP.
External monitoring will be carried out by independent and PLN for internal monitoring
5. It has been considered by PLN and PLN will supply electricity to the affected
villages 6. PLN has paid attention for their livelihood
and they are eligible for compensation on their assets other than land and for assistance as described in table 4.1,
LARAPs
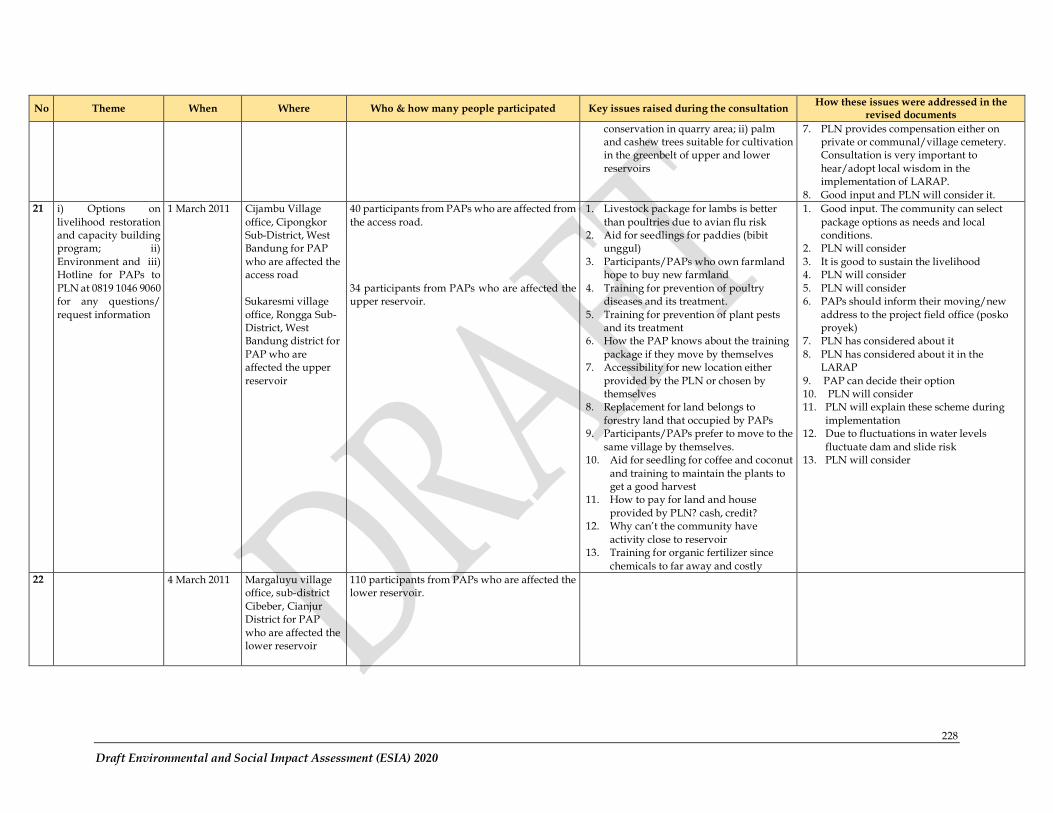
228
Draft Environmental and Social Impact Assessment (ESIA) 2020
No Theme When Where Who & how many people participated Key issues raised during the consultation How these issues were addressed in the
revised documents
conservation in quarry area; ii) palm and cashew trees suitable for cultivation in the greenbelt of upper and lower
reservoirs
7. PLN provides compensation either on private or communal/village cemetery. Consultation is very important to
hear/adopt local wisdom in the implementation of LARAP.
8. Good input and PLN will consider it.
21 i) Options on
livelihood restoration and capacity building program; ii)
Environment and iii) Hotline for PAPs to
PLN at 0819 1046 9060 for any questions/
request information
1 March 2011 Cijambu Village
office, Cipongkor Sub-District, West Bandung for PAP
who are affected the access road
Sukaresmi village
office, Rongga Sub-District, West Bandung district for
PAP who are affected the upper
reservoir
40 participants from PAPs who are affected from
the access road.
34 participants from PAPs who are affected the upper reservoir.
1. Livestock package for lambs is better
than poultries due to avian flu risk 2. Aid for seedlings for paddies (bibit
unggul)
3. Participants/PAPs who own farmland hope to buy new farmland
4. Training for prevention of poultry diseases and its treatment.
5. Training for prevention of plant pests and its treatment
6. How the PAP knows about the training
package if they move by themselves 7. Accessibility for new location either
provided by the PLN or chosen by themselves
8. Replacement for land belongs to
forestry land that occupied by PAPs 9. Participants/PAPs prefer to move to the
same village by themselves. 10. Aid for seedling for coffee and coconut
and training to maintain the plants to get a good harvest
11. How to pay for land and house
provided by PLN? cash, credit? 12. Why can’t the community have
activity close to reservoir 13. Training for organic fertilizer since
chemicals to far away and costly
1. Good input. The community can select
package options as needs and local conditions.
2. PLN will consider
3. It is good to sustain the livelihood 4. PLN will consider
5. PLN will consider 6. PAPs should inform their moving/new
address to the project field office (posko proyek)
7. PLN has considered about it
8. PLN has considered about it in the LARAP
9. PAP can decide their option 10. PLN will consider 11. PLN will explain these scheme during
implementation 12. Due to fluctuations in water levels
fluctuate dam and slide risk 13. PLN will consider
22 4 March 2011 Margaluyu village office, sub-district
Cibeber, Cianjur District for PAP
who are affected the lower reservoir
110 participants from PAPs who are affected the lower reservoir.
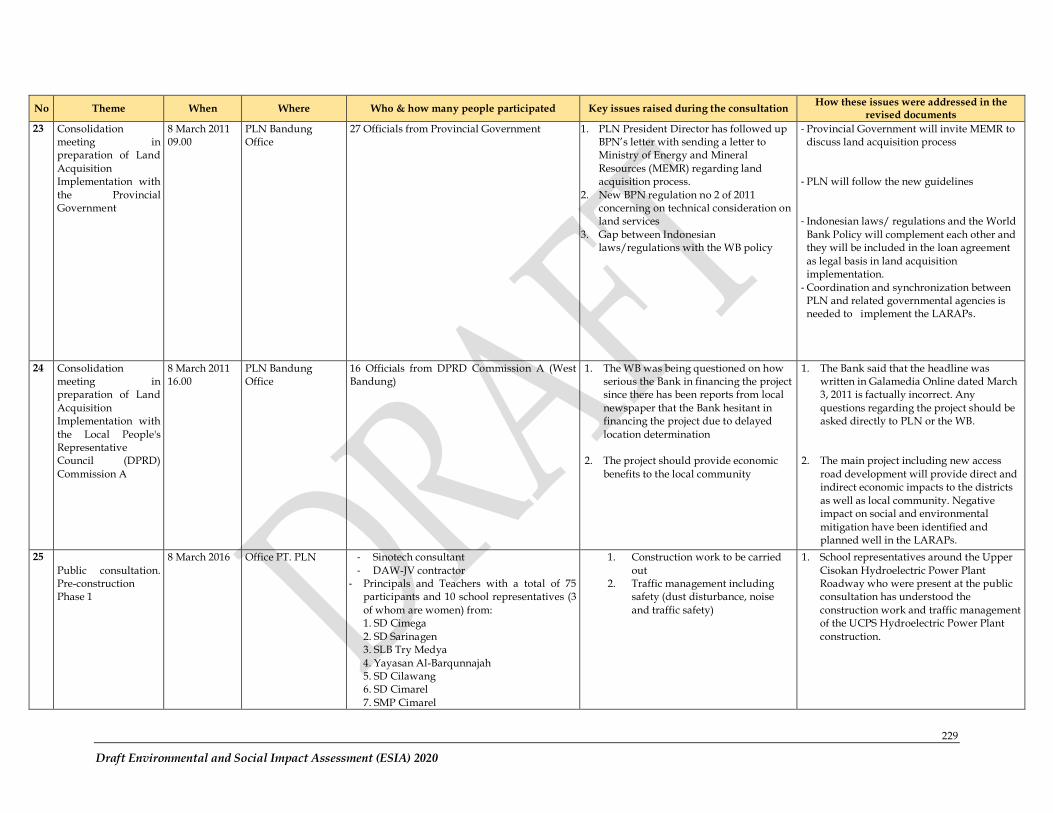
229
Draft Environmental and Social Impact Assessment (ESIA) 2020
No Theme When Where Who & how many people participated Key issues raised during the consultation How these issues were addressed in the
revised documents
23 Consolidation meeting in preparation of Land
Acquisition Implementation with
the Provincial Government
8 March 2011 09.00
PLN Bandung Office
27 Officials from Provincial Government 1. PLN President Director has followed up BPN’s letter with sending a letter to Ministry of Energy and Mineral
Resources (MEMR) regarding land acquisition process.
2. New BPN regulation no 2 of 2011 concerning on technical consideration on land services
3. Gap between Indonesian laws/regulations with the WB policy
- Provincial Government will invite MEMR to discuss land acquisition process
- PLN will follow the new guidelines
- Indonesian laws/ regulations and the World
Bank Policy will complement each other and they will be included in the loan agreement
as legal basis in land acquisition implementation.
- Coordination and synchronization between PLN and related governmental agencies is needed to implement the LARAPs.
24 Consolidation meeting in preparation of Land
Acquisition Implementation with
the Local People's Representative Council (DPRD)
Commission A
8 March 2011 16.00
PLN Bandung Office
16 Officials from DPRD Commission A (West Bandung)
1. The WB was being questioned on how serious the Bank in financing the project since there has been reports from local
newspaper that the Bank hesitant in financing the project due to delayed
location determination
2. The project should provide economic
benefits to the local community
1. The Bank said that the headline was written in Galamedia Online dated March 3, 2011 is factually incorrect. Any
questions regarding the project should be asked directly to PLN or the WB.
2. The main project including new access
road development will provide direct and indirect economic impacts to the districts
as well as local community. Negative impact on social and environmental
mitigation have been identified and planned well in the LARAPs.
25
Public consultation. Pre-construction Phase 1
8 March 2016 Office PT. PLN - Sinotech consultant
- DAW-JV contractor - Principals and Teachers with a total of 75
participants and 10 school representatives (3
of whom are women) from: 1. SD Cimega
2. SD Sarinagen 3. SLB Try Medya
4. Yayasan Al-Barqunnajah 5. SD Cilawang 6. SD Cimarel
7. SMP Cimarel
1. Construction work to be carried
out 2. Traffic management including
safety (dust disturbance, noise
and traffic safety)
1. School representatives around the Upper
Cisokan Hydroelectric Power Plant Roadway who were present at the public consultation has understood the
construction work and traffic management of the UCPS Hydroelectric Power Plant
construction.
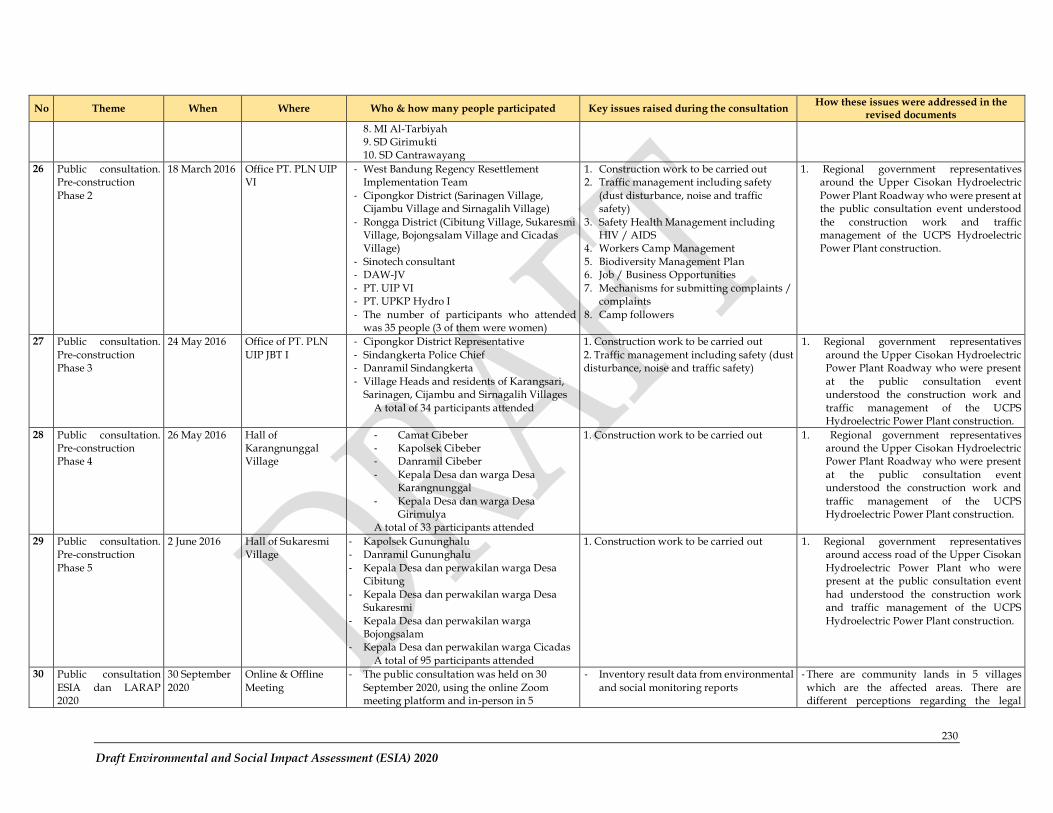
230
Draft Environmental and Social Impact Assessment (ESIA) 2020
No Theme When Where Who & how many people participated Key issues raised during the consultation How these issues were addressed in the
revised documents
8. MI Al-Tarbiyah 9. SD Girimukti 10. SD Cantrawayang
26 Public consultation. Pre-construction
Phase 2
18 March 2016 Office PT. PLN UIP VI
- West Bandung Regency Resettlement Implementation Team
- Cipongkor District (Sarinagen Village, Cijambu Village and Sirnagalih Village)
- Rongga District (Cibitung Village, Sukaresmi Village, Bojongsalam Village and Cicadas Village)
- Sinotech consultant - DAW-JV
- PT. UIP VI - PT. UPKP Hydro I
- The number of participants who attended was 35 people (3 of them were women)
1. Construction work to be carried out 2. Traffic management including safety
(dust disturbance, noise and traffic safety)
3. Safety Health Management including HIV / AIDS
4. Workers Camp Management
5. Biodiversity Management Plan 6. Job / Business Opportunities
7. Mechanisms for submitting complaints / complaints
8. Camp followers
1. Regional government representatives around the Upper Cisokan Hydroelectric
Power Plant Roadway who were present at the public consultation event understood
the construction work and traffic management of the UCPS Hydroelectric Power Plant construction.
27 Public consultation.
Pre-construction Phase 3
24 May 2016 Office of PT. PLN
UIP JBT I
- Cipongkor District Representative
- Sindangkerta Police Chief - Danramil Sindangkerta
- Village Heads and residents of Karangsari, Sarinagen, Cijambu and Sirnagalih Villages
A total of 34 participants attended
1. Construction work to be carried out
2. Traffic management including safety (dust disturbance, noise and traffic safety)
1. Regional government representatives
around the Upper Cisokan Hydroelectric Power Plant Roadway who were present
at the public consultation event understood the construction work and
traffic management of the UCPS Hydroelectric Power Plant construction.
28 Public consultation. Pre-construction Phase 4
26 May 2016 Hall of Karangnunggal Village
- Camat Cibeber - Kapolsek Cibeber - Danramil Cibeber
- Kepala Desa dan warga Desa Karangnunggal
- Kepala Desa dan warga Desa Girimulya
A total of 33 participants attended
1. Construction work to be carried out 1. Regional government representatives around the Upper Cisokan Hydroelectric Power Plant Roadway who were present
at the public consultation event understood the construction work and
traffic management of the UCPS Hydroelectric Power Plant construction.
29 Public consultation. Pre-construction
Phase 5
2 June 2016 Hall of Sukaresmi Village
- Kapolsek Gununghalu - Danramil Gununghalu
- Kepala Desa dan perwakilan warga Desa Cibitung
- Kepala Desa dan perwakilan warga Desa Sukaresmi
- Kepala Desa dan perwakilan warga Bojongsalam
- Kepala Desa dan perwakilan warga Cicadas
A total of 95 participants attended
1. Construction work to be carried out 1. Regional government representatives around access road of the Upper Cisokan
Hydroelectric Power Plant who were present at the public consultation event
had understood the construction work and traffic management of the UCPS
Hydroelectric Power Plant construction.
30 Public consultation
ESIA dan LARAP 2020
30 September
2020
Online & Offline
Meeting
- The public consultation was held on 30
September 2020, using the online Zoom meeting platform and in-person in 5
- Inventory result data from environmental
and social monitoring reports
- There are community lands in 5 villages
which are the affected areas. There are different perceptions regarding the legal
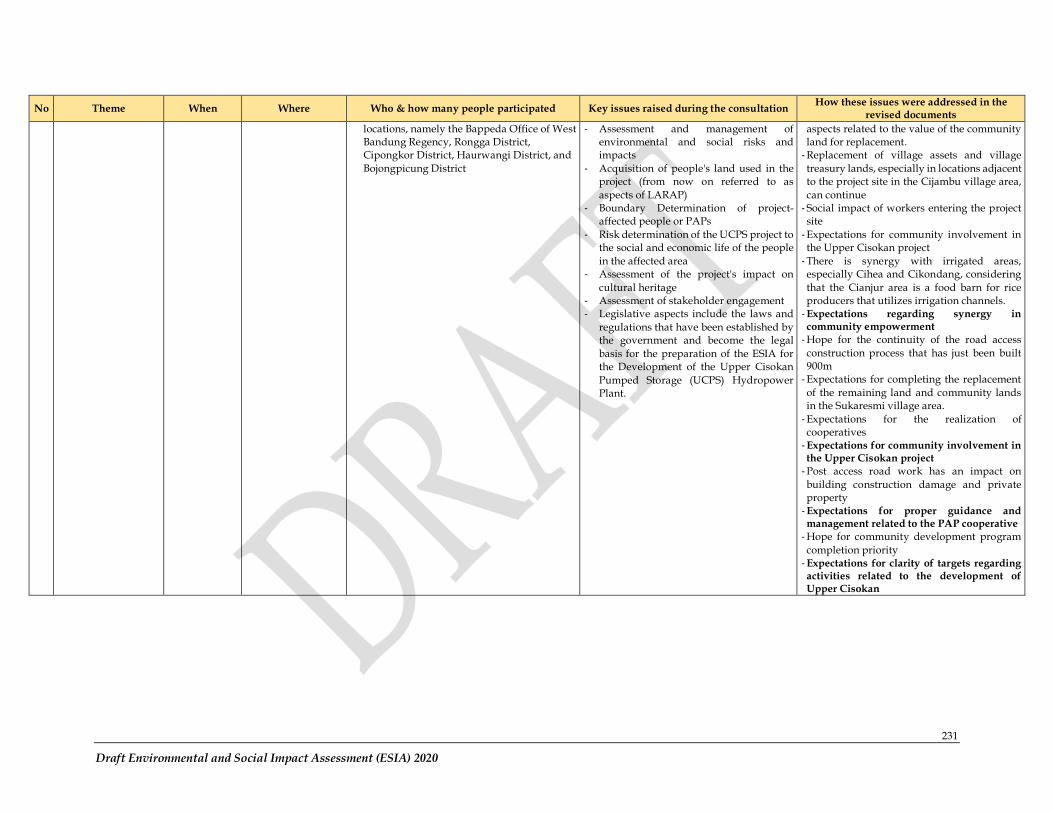
231
Draft Environmental and Social Impact Assessment (ESIA) 2020
No Theme When Where Who & how many people participated Key issues raised during the consultation How these issues were addressed in the
revised documents
locations, namely the Bappeda Office of West Bandung Regency, Rongga District, Cipongkor District, Haurwangi District, and
Bojongpicung District
- Assessment and management of environmental and social risks and impacts
- Acquisition of people's land used in the project (from now on referred to as
aspects of LARAP) - Boundary Determination of project-
affected people or PAPs
- Risk determination of the UCPS project to the social and economic life of the people
in the affected area - Assessment of the project's impact on
cultural heritage - Assessment of stakeholder engagement - Legislative aspects include the laws and
regulations that have been established by the government and become the legal
basis for the preparation of the ESIA for the Development of the Upper Cisokan
Pumped Storage (UCPS) Hydropower Plant.
aspects related to the value of the community land for replacement. - Replacement of village assets and village
treasury lands, especially in locations adjacent to the project site in the Cijambu village area,
can continue - Social impact of workers entering the project site
- Expectations for community involvement in the Upper Cisokan project
- There is synergy with irrigated areas, especially Cihea and Cikondang, considering
that the Cianjur area is a food barn for rice producers that utilizes irrigation channels. - Expectations regarding synergy in community empowerment
- Hope for the continuity of the road access
construction process that has just been built 900m - Expectations for completing the replacement
of the remaining land and community lands in the Sukaresmi village area.
- Expectations for the realization of cooperatives - Expectations for community involvement in the Upper Cisokan project - Post access road work has an impact on
building construction damage and private property - Expectations for proper guidance and management related to the PAP cooperative
- Hope for community development program
completion priority - Expectations for clarity of targets regarding activities related to the development of Upper Cisokan
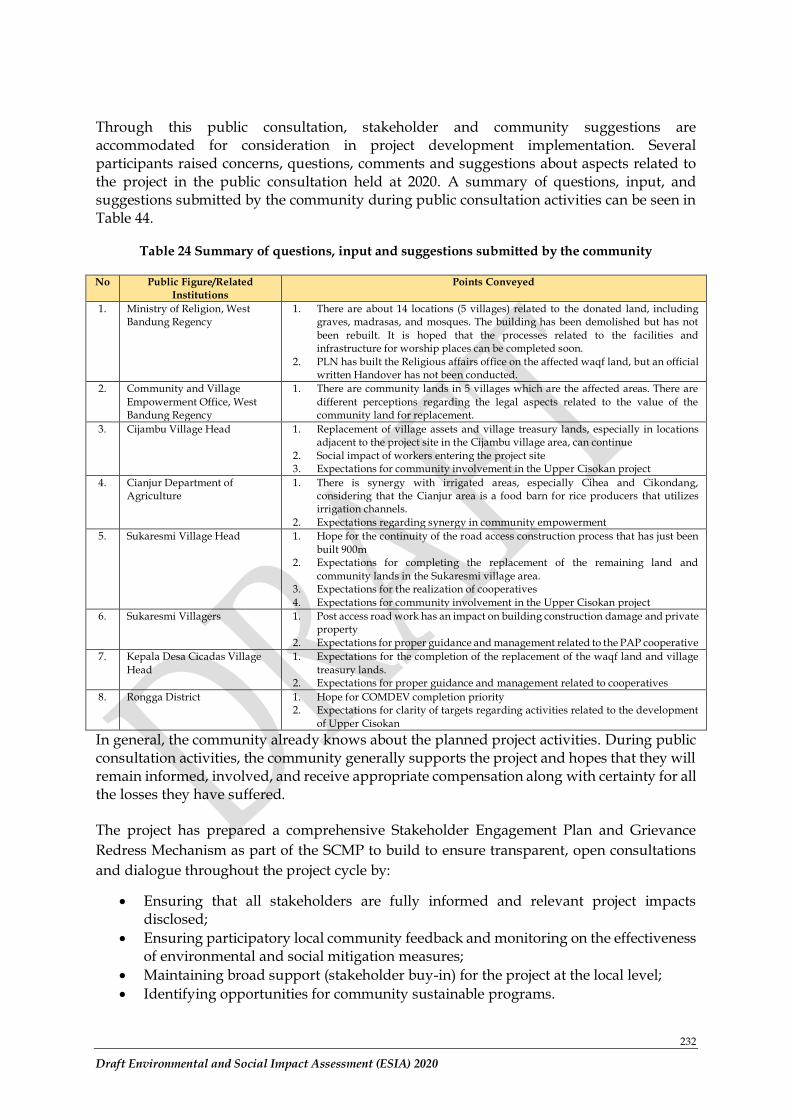
232
Draft Environmental and Social Impact Assessment (ESIA) 2020
Through this public consultation, stakeholder and community suggestions are accommodated for consideration in project development implementation. Several participants raised concerns, questions, comments and suggestions about aspects related to the project in the public consultation held at 2020. A summary of questions, input, and suggestions submitted by the community during public consultation activities can be seen in Table 44.
Table 24 Summary of questions, input and suggestions submitted by the community
No Public Figure/Related
Institutions
Points Conveyed
1. Ministry of Religion, West Bandung Regency
1. There are about 14 locations (5 villages) related to the donated land, including graves, madrasas, and mosques. The building has been demolished but has not
been rebuilt. It is hoped that the processes related to the facilities and infrastructure for worship places can be completed soon.
2. PLN has built the Religious affairs office on the affected waqf land, but an official written Handover has not been conducted.
2. Community and Village
Empowerment Office, West Bandung Regency
1. There are community lands in 5 villages which are the affected areas. There are
different perceptions regarding the legal aspects related to the value of the community land for replacement.
3. Cijambu Village Head 1. Replacement of village assets and village treasury lands, especially in locations adjacent to the project site in the Cijambu village area, can continue
2. Social impact of workers entering the project site 3. Expectations for community involvement in the Upper Cisokan project
4. Cianjur Department of Agriculture
1. There is synergy with irrigated areas, especially Cihea and Cikondang, considering that the Cianjur area is a food barn for rice producers that utilizes irrigation channels.
2. Expectations regarding synergy in community empowerment
5. Sukaresmi Village Head
1. Hope for the continuity of the road access construction process that has just been
built 900m 2. Expectations for completing the replacement of the remaining land and
community lands in the Sukaresmi village area. 3. Expectations for the realization of cooperatives
4. Expectations for community involvement in the Upper Cisokan project
6. Sukaresmi Villagers 1. Post access road work has an impact on building construction damage and private property
2. Expectations for proper guidance and management related to the PAP cooperative
7. Kepala Desa Cicadas Village
Head
1. Expectations for the completion of the replacement of the waqf land and village
treasury lands. 2. Expectations for proper guidance and management related to cooperatives
8. Rongga District 1. Hope for COMDEV completion priority 2. Expectations for clarity of targets regarding activities related to the development
of Upper Cisokan
In general, the community already knows about the planned project activities. During public consultation activities, the community generally supports the project and hopes that they will remain informed, involved, and receive appropriate compensation along with certainty for all the losses they have suffered.
The project has prepared a comprehensive Stakeholder Engagement Plan and Grievance
Redress Mechanism as part of the SCMP to build to ensure transparent, open consultations
and dialogue throughout the project cycle by:
• Ensuring that all stakeholders are fully informed and relevant project impacts disclosed;
• Ensuring participatory local community feedback and monitoring on the effectiveness of environmental and social mitigation measures;
• Maintaining broad support (stakeholder buy-in) for the project at the local level;
• Identifying opportunities for community sustainable programs.
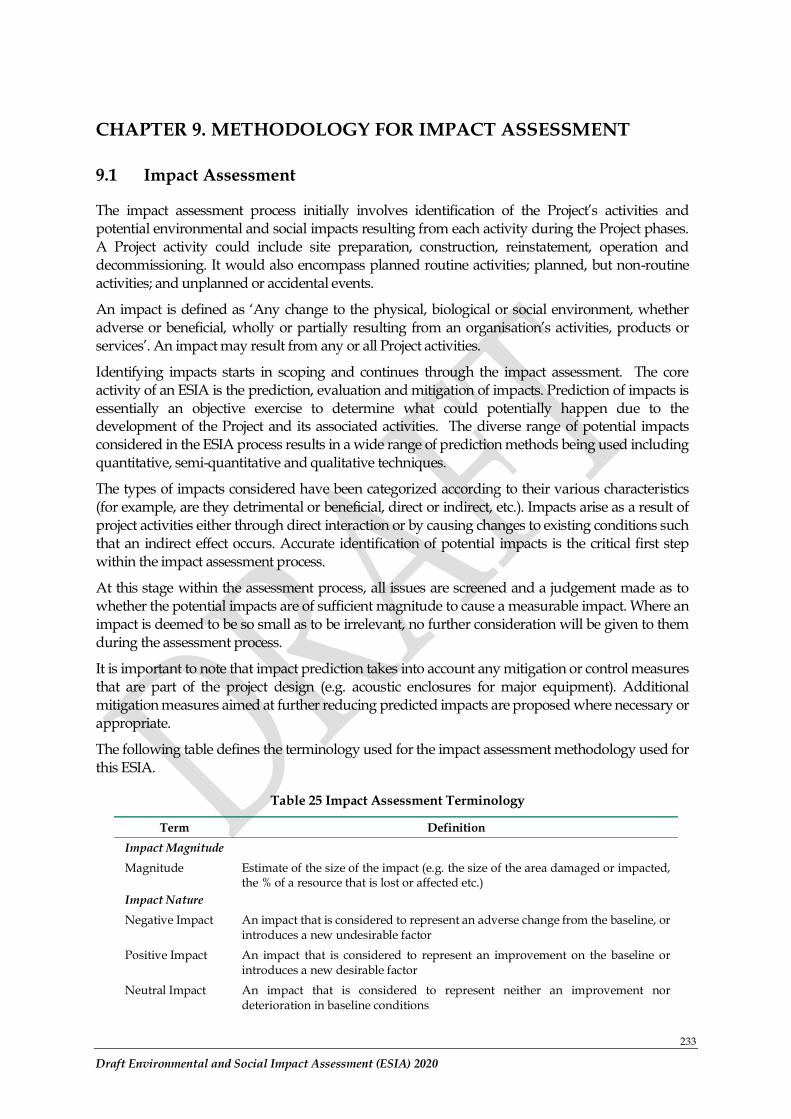
233
Draft Environmental and Social Impact Assessment (ESIA) 2020
CHAPTER 9. METHODOLOGY FOR IMPACT ASSESSMENT
9.1 Impact Assessment
The impact assessment process initially involves identification of the Project’s activities and potential environmental and social impacts resulting from each activity during the Project phases. A Project activity could include site preparation, construction, reinstatement, operation and decommissioning. It would also encompass planned routine activities; planned, but non-routine activities; and unplanned or accidental events.
An impact is defined as ‘Any change to the physical, biological or social environment, whether adverse or beneficial, wholly or partially resulting from an organisation’s activities, products or services’. An impact may result from any or all Project activities.
Identifying impacts starts in scoping and continues through the impact assessment. The core activity of an ESIA is the prediction, evaluation and mitigation of impacts. Prediction of impacts is essentially an objective exercise to determine what could potentially happen due to the development of the Project and its associated activities. The diverse range of potential impacts considered in the ESIA process results in a wide range of prediction methods being used including quantitative, semi-quantitative and qualitative techniques.
The types of impacts considered have been categorized according to their various characteristics (for example, are they detrimental or beneficial, direct or indirect, etc.). Impacts arise as a result of project activities either through direct interaction or by causing changes to existing conditions such that an indirect effect occurs. Accurate identification of potential impacts is the critical first step within the impact assessment process.
At this stage within the assessment process, all issues are screened and a judgement made as to whether the potential impacts are of sufficient magnitude to cause a measurable impact. Where an impact is deemed to be so small as to be irrelevant, no further consideration will be given to them during the assessment process.
It is important to note that impact prediction takes into account any mitigation or control measures that are part of the project design (e.g. acoustic enclosures for major equipment). Additional mitigation measures aimed at further reducing predicted impacts are proposed where necessary or appropriate.
The following table defines the terminology used for the impact assessment methodology used for this ESIA.
Table 25 Impact Assessment Terminology
Term Definition
Impact Magnitude
Magnitude Estimate of the size of the impact (e.g. the size of the area damaged or impacted, the % of a resource that is lost or affected etc.)
Impact Nature
Negative Impact An impact that is considered to represent an adverse change from the baseline, or introduces a new undesirable factor
Positive Impact An impact that is considered to represent an improvement on the baseline or introduces a new desirable factor
Neutral Impact An impact that is considered to represent neither an improvement nor deterioration in baseline conditions
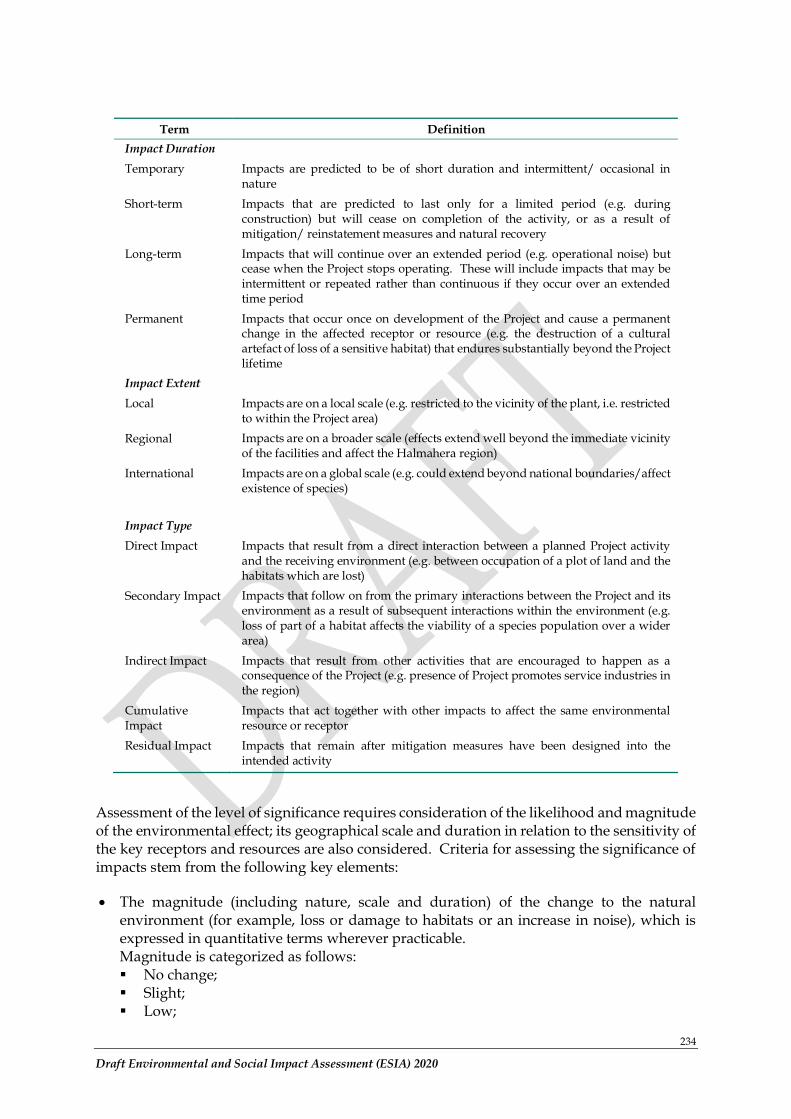
234
Draft Environmental and Social Impact Assessment (ESIA) 2020
Term Definition
Impact Duration
Temporary Impacts are predicted to be of short duration and intermittent/ occasional in nature
Short-term Impacts that are predicted to last only for a limited period (e.g. during construction) but will cease on completion of the activity, or as a result of mitigation/ reinstatement measures and natural recovery
Long-term Impacts that will continue over an extended period (e.g. operational noise) but cease when the Project stops operating. These will include impacts that may be intermittent or repeated rather than continuous if they occur over an extended time period
Permanent Impacts that occur once on development of the Project and cause a permanent change in the affected receptor or resource (e.g. the destruction of a cultural artefact of loss of a sensitive habitat) that endures substantially beyond the Project lifetime
Impact Extent
Local Impacts are on a local scale (e.g. restricted to the vicinity of the plant, i.e. restricted to within the Project area)
Regional Impacts are on a broader scale (effects extend well beyond the immediate vicinity of the facilities and affect the Halmahera region)
International Impacts are on a global scale (e.g. could extend beyond national boundaries/affect existence of species)
Impact Type
Direct Impact Impacts that result from a direct interaction between a planned Project activity and the receiving environment (e.g. between occupation of a plot of land and the habitats which are lost)
Secondary Impact Impacts that follow on from the primary interactions between the Project and its environment as a result of subsequent interactions within the environment (e.g. loss of part of a habitat affects the viability of a species population over a wider area)
Indirect Impact Impacts that result from other activities that are encouraged to happen as a consequence of the Project (e.g. presence of Project promotes service industries in the region)
Cumulative Impact
Impacts that act together with other impacts to affect the same environmental resource or receptor
Residual Impact Impacts that remain after mitigation measures have been designed into the intended activity
Assessment of the level of significance requires consideration of the likelihood and magnitude of the environmental effect; its geographical scale and duration in relation to the sensitivity of the key receptors and resources are also considered. Criteria for assessing the significance of impacts stem from the following key elements:
• The magnitude (including nature, scale and duration) of the change to the natural environment (for example, loss or damage to habitats or an increase in noise), which is expressed in quantitative terms wherever practicable. Magnitude is categorized as follows: ▪ No change; ▪ Slight; ▪ Low;
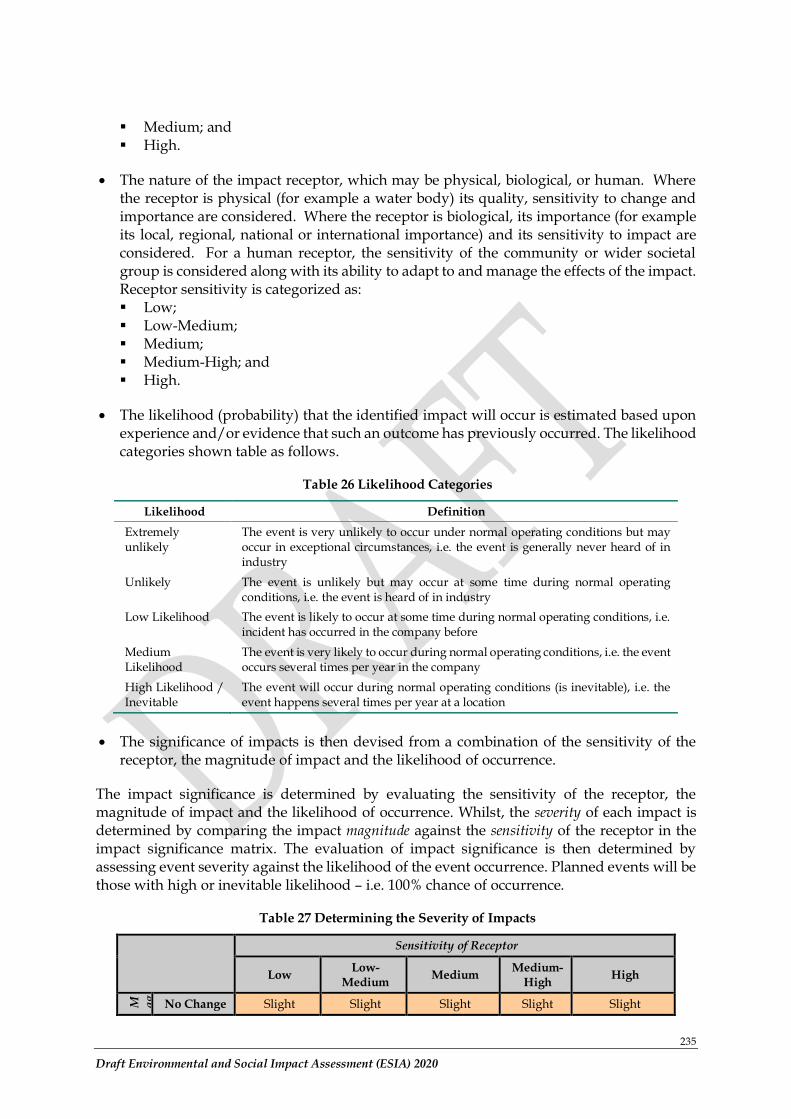
235
Draft Environmental and Social Impact Assessment (ESIA) 2020
▪ Medium; and ▪ High.
• The nature of the impact receptor, which may be physical, biological, or human. Where the receptor is physical (for example a water body) its quality, sensitivity to change and importance are considered. Where the receptor is biological, its importance (for example its local, regional, national or international importance) and its sensitivity to impact are considered. For a human receptor, the sensitivity of the community or wider societal group is considered along with its ability to adapt to and manage the effects of the impact. Receptor sensitivity is categorized as: ▪ Low; ▪ Low-Medium; ▪ Medium; ▪ Medium-High; and ▪ High.
• The likelihood (probability) that the identified impact will occur is estimated based upon experience and/or evidence that such an outcome has previously occurred. The likelihood categories shown table as follows.
Table 26 Likelihood Categories
Likelihood Definition
Extremely unlikely
The event is very unlikely to occur under normal operating conditions but may occur in exceptional circumstances, i.e. the event is generally never heard of in industry
Unlikely The event is unlikely but may occur at some time during normal operating conditions, i.e. the event is heard of in industry
Low Likelihood The event is likely to occur at some time during normal operating conditions, i.e. incident has occurred in the company before
Medium Likelihood
The event is very likely to occur during normal operating conditions, i.e. the event occurs several times per year in the company
High Likelihood / Inevitable
The event will occur during normal operating conditions (is inevitable), i.e. the event happens several times per year at a location
• The significance of impacts is then devised from a combination of the sensitivity of the receptor, the magnitude of impact and the likelihood of occurrence.
The impact significance is determined by evaluating the sensitivity of the receptor, the magnitude of impact and the likelihood of occurrence. Whilst, the severity of each impact is determined by comparing the impact magnitude against the sensitivity of the receptor in the impact significance matrix. The evaluation of impact significance is then determined by assessing event severity against the likelihood of the event occurrence. Planned events will be those with high or inevitable likelihood – i.e. 100% chance of occurrence.
Table 27 Determining the Severity of Impacts
Sensitivity of Receptor
Low Low-
Medium Medium
Medium-High
High
M ag
nit ud e No Change Slight Slight Slight Slight Slight
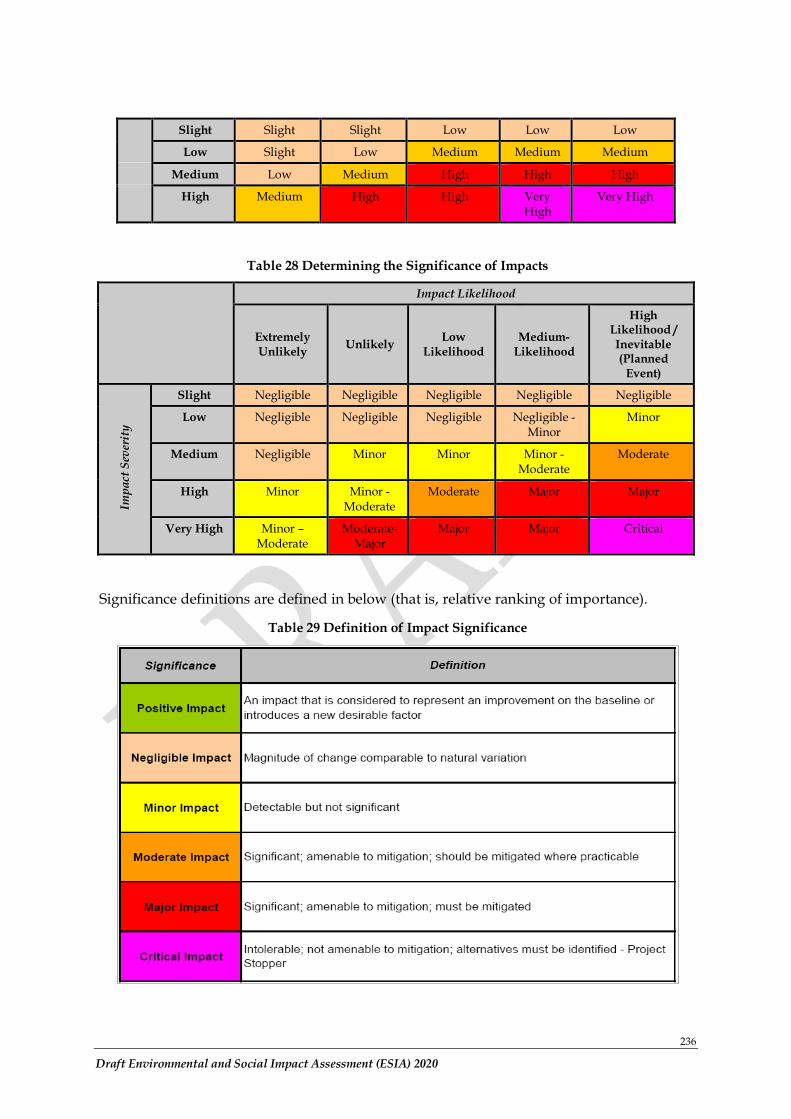
236
Draft Environmental and Social Impact Assessment (ESIA) 2020
Slight Slight Slight Low Low Low
Low Slight Low Medium Medium Medium
Medium Low Medium High High High
High Medium High High Very High
Very High
Table 28 Determining the Significance of Impacts
Impact Likelihood
Extremely Unlikely
Unlikely Low
Likelihood Medium-
Likelihood
High Likelihood / Inevitable (Planned
Event)
Imp
act
Sev
erit
y
Slight Negligible Negligible Negligible Negligible Negligible
Low Negligible Negligible Negligible Negligible - Minor
Minor
Medium Negligible Minor Minor Minor -Moderate
Moderate
High Minor Minor -Moderate
Moderate Major Major
Very High Minor –Moderate
Moderate- Major
Major Major Critical
Significance definitions are defined in below (that is, relative ranking of importance).
Table 29 Definition of Impact Significance
237
Draft Environmental and Social Impact Assessment (ESIA) 2020
Impacts assessed as Negligible or Minor will require no additional management or mitigation measures (on the basis that the magnitude of the impact is sufficiently small, or that the receptor is of low sensitivity and/ or that adequate controls are already included in the Project design). Negligible and Minor impacts are therefore deemed to be “Insignificant” and fall within the “No Action” criterion.
Impacts evaluated as Moderate or Major require the implementation of further management or mitigation measures. Major and Moderate impacts are therefore deemed to be “Significant”.
Major impacts always require further management or mitigation measures to minimize or reduce the impact to an acceptable level. A generally “acceptable level” is the reduction of a Major impact to a Moderate one after mitigation. Where Major impacts cannot be reduced further, a range of additional measures will be needed, including repair and remedy during either the operational or closure phase (such as the rehabilitation of mining pits to replace biodiversity losses, or removal of Project infrastructure during the closure phase in the case of visual impacts), community development programs and/or the implementation of a biodiversity offset strategy.
In seeking to mitigate Moderate impacts, the emphasis is on demonstrating that the impact has been reduced to a level that is as low as reasonably practicable (ALARP). It will not always be practical to reduce Moderate impacts to Minor ones in consideration of the cost-ineffectiveness of such an approach (due to the diminishing return of a reduction of impact versus cost).
Impacts evaluated as Critical cannot be managed or mitigated and require the identification of alternatives (elimination of source of potential impact). Such impacts are Intolerable and could potentially result in abandonment of a project (potential “project stoppers”).
9.2 Mitigation Measures
A key element and outcome of the ESIA process is to explore and develop practical measures of avoiding, reducing or offsetting potential impacts associated with the Project. These are commonly referred to as mitigation measures and will be incorporated into the Project either as direct design measures, or as commitments to be implemented at various stages within the Project life. Mitigation is aimed at preventing, reducing or managing significant negative impacts to as low as reasonably practicable (ALARP) and optimizing and maximizing any potential benefits of the Project, where applicable. For the purposes of this ESIA, ALARP is defined as the point at which the cost and effort of further risk reduction is grossly disproportionate to the risk reduction achieved.
The approach taken to identifying and incorporating mitigation measures into the Project is based on a typical hierarchy of decisions and measures, as outlined within following table. This is aimed at ensuring that wherever possible potential impacts are mitigated at source rather than mitigated through restoration after the impact has occurred. Thus, the majority of mitigation measures fall within the upper two tiers of mitigation hierarchy and are effectively built into the planned Project.
Table 30 Mitigation Hierarchy
THE MITIGATION HIERARCHY FOR PLANNED PROJECT ACTIVITIES Avoid at Source; Reduce at Source
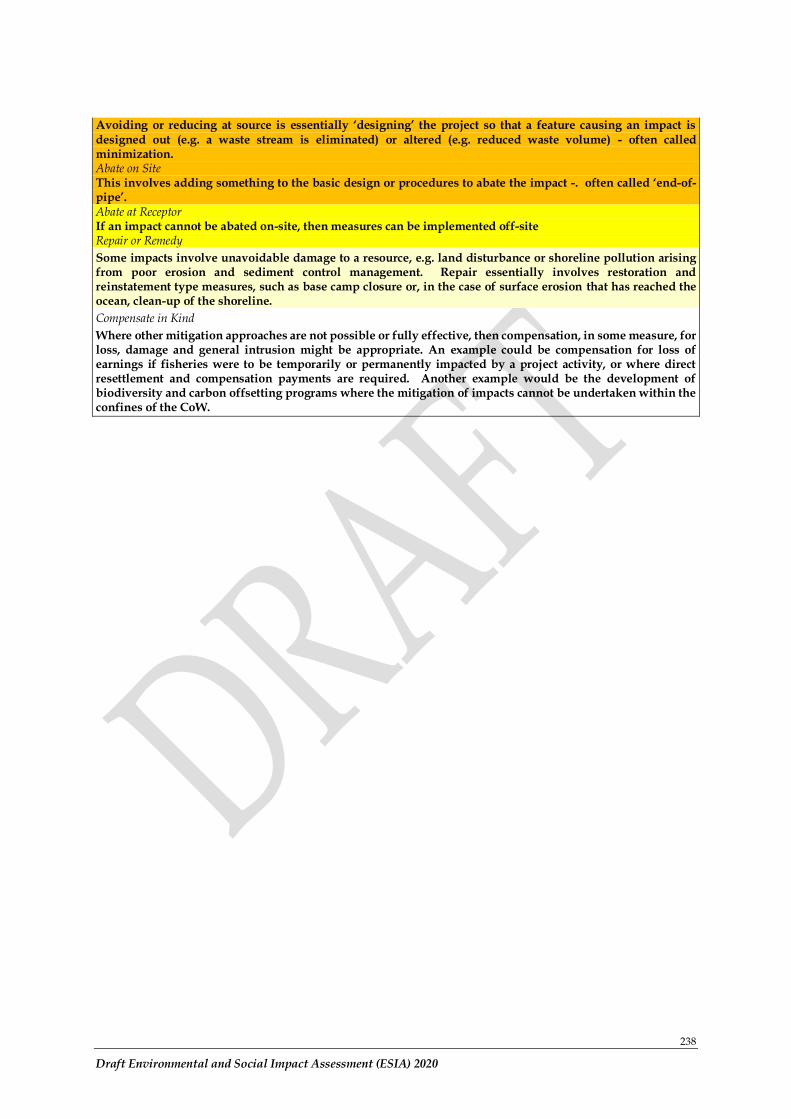
238
Draft Environmental and Social Impact Assessment (ESIA) 2020
Avoiding or reducing at source is essentially ‘designing’ the project so that a feature causing an impact is designed out (e.g. a waste stream is eliminated) or altered (e.g. reduced waste volume) - often called minimization. Abate on Site This involves adding something to the basic design or procedures to abate the impact -. often called ‘end-of-pipe’. Abate at Receptor If an impact cannot be abated on-site, then measures can be implemented off-site Repair or Remedy
Some impacts involve unavoidable damage to a resource, e.g. land disturbance or shoreline pollution arising from poor erosion and sediment control management. Repair essentially involves restoration and reinstatement type measures, such as base camp closure or, in the case of surface erosion that has reached the ocean, clean-up of the shoreline.
Compensate in Kind
Where other mitigation approaches are not possible or fully effective, then compensation, in some measure, for loss, damage and general intrusion might be appropriate. An example could be compensation for loss of earnings if fisheries were to be temporarily or permanently impacted by a project activity, or where direct resettlement and compensation payments are required. Another example would be the development of biodiversity and carbon offsetting programs where the mitigation of impacts cannot be undertaken within the confines of the CoW.
239
Draft Environmental and Social Impact Assessment (ESIA) 2020
CHAPTER 10. ENVIRONMENTAL AND SOCIO-ECONOMIC IMPACT – CONSTRUCTION STAGE
10.1 Introduction
The environmental and social impacts associated with major construction activities (construction of upper dams, lower dams, and other supporting facilities, quarry operations, construction of transmission networks) are discussed in this section.
The following list is an outline of the environmental and social impacts that are expected to occur when construction activities are carried out at the UCPS for the dams, reservoir:
• Impact on river habitat and water quality
• Impact on erosion and sedimentation levels
• Impact on air quality
• Impact on noise
• Impact on vibration
• Impact on water sources in Gunungkarang quarry
• Impact on biodiversity
• Impact on socio-economic aspects in the surrounding community due to the project
• Potential impacts on health and safety
Each impact is described further in each section in this chapter.
10.2 Environmental Impact of the Construction Stage
Impact prediction is a screening process of several potential impacts that may occur in connection with the construction activity process. The process of identifying potential impacts for each environmental parameter was carried out using quantitative and qualitative methods, and will be used as the basis for determining the mitigation that must be carried out to minimize and prevent impacts from occurring. This follows the key objective of ESS 6 to protect and conserve biodiversity and habitats, by applying the mitigation hierarchy and the precautionary approach in the design and implementation of projects that could have an impact on biodiversity.
10.2.1 Erosion and Sedimentation
Earthworks in the watershed and in riverbeds, including vegetation clearance, reservoir preparation, slope stabilization and landslide removal, blasting, excavation, filling and quarry operations, will contribute to the movement of large amounts of exposed soil and rock around the project site. The risk of erosion is considered high given the steep topography, high levels of rainfall and heavy river flows during the rainy season, the scale of earthworks and the characteristics of the excessive loads in the area (easy to erode).
The potential impact of erosion is the flow of sediment into the river system. Sediment can impact habitats and aquatic organisms when the sediments are suspended in the water and they enter riverbeds and riverbanks.
Table 31 Potential Impacts on Water Bodies Due to Sediment Disturbance during Construction
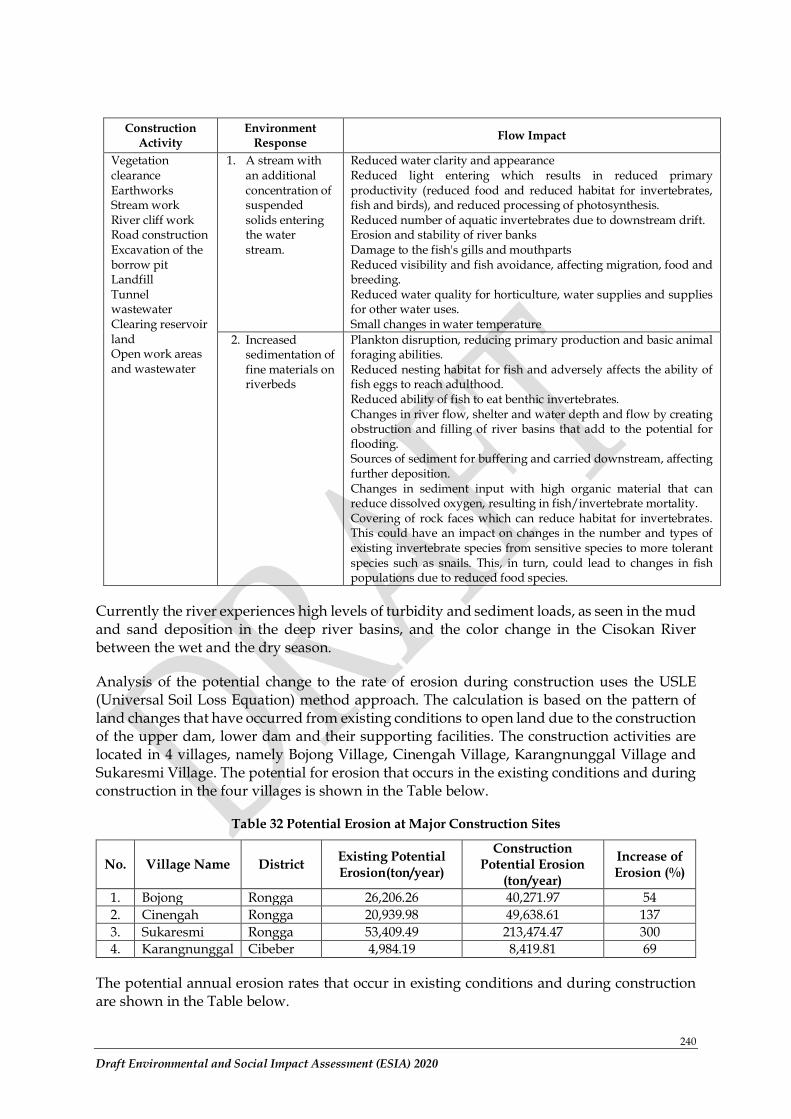
240
Draft Environmental and Social Impact Assessment (ESIA) 2020
Construction Activity
Environment Response
Flow Impact
Vegetation clearance Earthworks Stream work River cliff work Road construction Excavation of the borrow pit Landfill Tunnel wastewater Clearing reservoir land Open work areas and wastewater
1. A stream with an additional concentration of suspended solids entering the water stream.
Reduced water clarity and appearance Reduced light entering which results in reduced primary productivity (reduced food and reduced habitat for invertebrates, fish and birds), and reduced processing of photosynthesis. Reduced number of aquatic invertebrates due to downstream drift. Erosion and stability of river banks Damage to the fish's gills and mouthparts Reduced visibility and fish avoidance, affecting migration, food and breeding. Reduced water quality for horticulture, water supplies and supplies for other water uses. Small changes in water temperature
2. Increased sedimentation of fine materials on riverbeds
Plankton disruption, reducing primary production and basic animal foraging abilities. Reduced nesting habitat for fish and adversely affects the ability of fish eggs to reach adulthood. Reduced ability of fish to eat benthic invertebrates. Changes in river flow, shelter and water depth and flow by creating obstruction and filling of river basins that add to the potential for flooding. Sources of sediment for buffering and carried downstream, affecting further deposition. Changes in sediment input with high organic material that can reduce dissolved oxygen, resulting in fish/invertebrate mortality. Covering of rock faces which can reduce habitat for invertebrates. This could have an impact on changes in the number and types of existing invertebrate species from sensitive species to more tolerant species such as snails. This, in turn, could lead to changes in fish populations due to reduced food species.
Currently the river experiences high levels of turbidity and sediment loads, as seen in the mud and sand deposition in the deep river basins, and the color change in the Cisokan River between the wet and the dry season.
Analysis of the potential change to the rate of erosion during construction uses the USLE (Universal Soil Loss Equation) method approach. The calculation is based on the pattern of land changes that have occurred from existing conditions to open land due to the construction of the upper dam, lower dam and their supporting facilities. The construction activities are located in 4 villages, namely Bojong Village, Cinengah Village, Karangnunggal Village and Sukaresmi Village. The potential for erosion that occurs in the existing conditions and during construction in the four villages is shown in the Table below.
Table 32 Potential Erosion at Major Construction Sites
No. Village Name District Existing Potential Erosion(ton/year)
Construction Potential Erosion
(ton/year)
Increase of Erosion (%)
1. Bojong Rongga 26,206.26 40,271.97 54
2. Cinengah Rongga 20,939.98 49,638.61 137
3. Sukaresmi Rongga 53,409.49 213,474.47 300
4. Karangnunggal Cibeber 4,984.19 8,419.81 69
The potential annual erosion rates that occur in existing conditions and during construction are shown in the Table below.
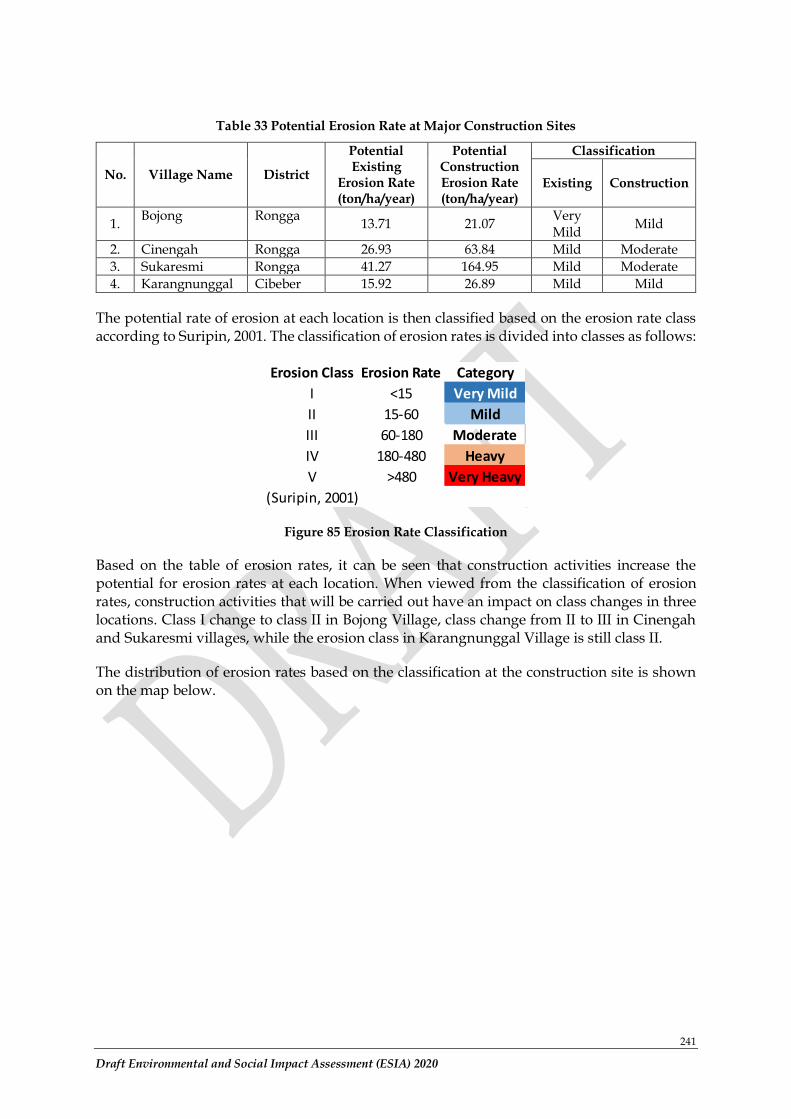
241
Draft Environmental and Social Impact Assessment (ESIA) 2020
Table 33 Potential Erosion Rate at Major Construction Sites
No. Village Name District
Potential Existing
Erosion Rate (ton/ha/year)
Potential Construction Erosion Rate (ton/ha/year)
Classification
Existing Construction
1. Bojong Rongga
13.71 21.07 Very Mild
Mild
2. Cinengah Rongga 26.93 63.84 Mild Moderate
3. Sukaresmi Rongga 41.27 164.95 Mild Moderate
4. Karangnunggal Cibeber 15.92 26.89 Mild Mild
The potential rate of erosion at each location is then classified based on the erosion rate class according to Suripin, 2001. The classification of erosion rates is divided into classes as follows:
Figure 85 Erosion Rate Classification
Based on the table of erosion rates, it can be seen that construction activities increase the potential for erosion rates at each location. When viewed from the classification of erosion rates, construction activities that will be carried out have an impact on class changes in three locations. Class I change to class II in Bojong Village, class change from II to III in Cinengah and Sukaresmi villages, while the erosion class in Karangnunggal Village is still class II.
The distribution of erosion rates based on the classification at the construction site is shown on the map below.
Erosion Class Erosion Rate Category
I <15 Very Mild
II 15-60 Mild
III 60-180 Moderate
IV 180-480 Heavy
V >480 Very Heavy
(Suripin, 2001)
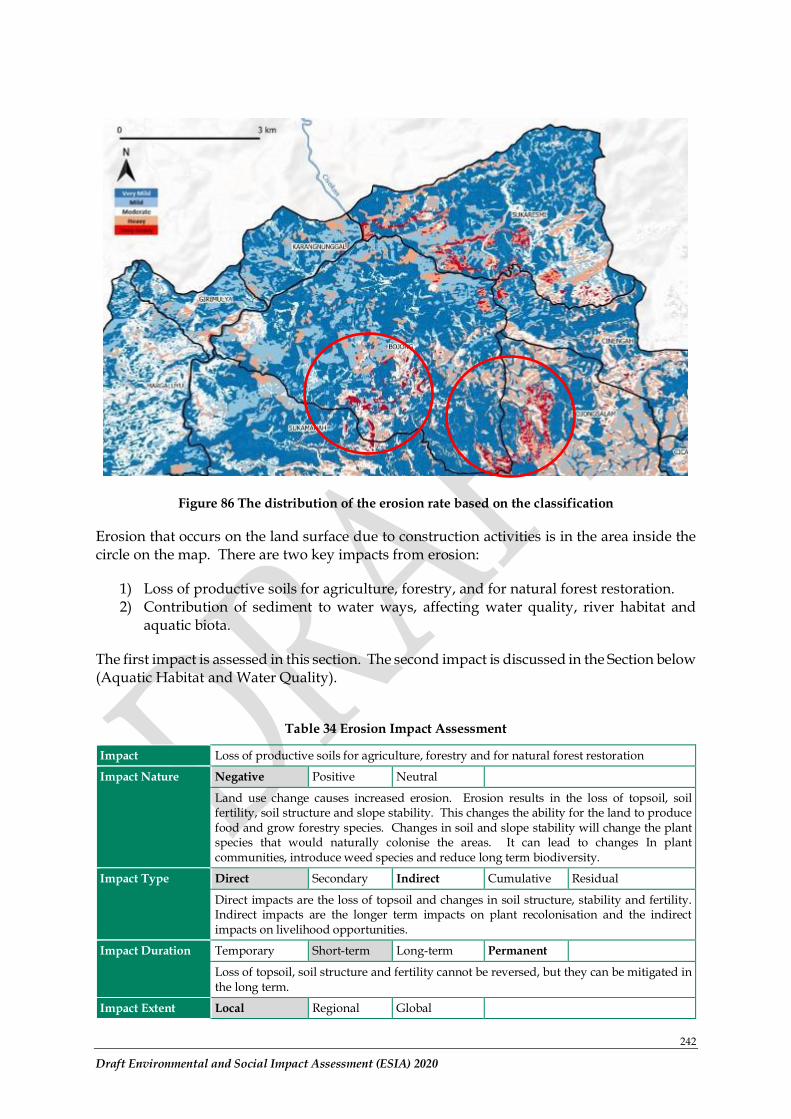
242
Draft Environmental and Social Impact Assessment (ESIA) 2020
Figure 86 The distribution of the erosion rate based on the classification
Erosion that occurs on the land surface due to construction activities is in the area inside the circle on the map. There are two key impacts from erosion:
1) Loss of productive soils for agriculture, forestry, and for natural forest restoration. 2) Contribution of sediment to water ways, affecting water quality, river habitat and
aquatic biota.
The first impact is assessed in this section. The second impact is discussed in the Section below (Aquatic Habitat and Water Quality).
Table 34 Erosion Impact Assessment
Impact Loss of productive soils for agriculture, forestry and for natural forest restoration
Impact Nature Negative Positive Neutral
Land use change causes increased erosion. Erosion results in the loss of topsoil, soil fertility, soil structure and slope stability. This changes the ability for the land to produce food and grow forestry species. Changes in soil and slope stability will change the plant species that would naturally colonise the areas. It can lead to changes In plant communities, introduce weed species and reduce long term biodiversity.
Impact Type Direct Secondary Indirect Cumulative Residual
Direct impacts are the loss of topsoil and changes in soil structure, stability and fertility. Indirect impacts are the longer term impacts on plant recolonisation and the indirect impacts on livelihood opportunities.
Impact Duration Temporary Short-term Long-term Permanent
Loss of topsoil, soil structure and fertility cannot be reversed, but they can be mitigated in the long term.
Impact Extent Local Regional Global
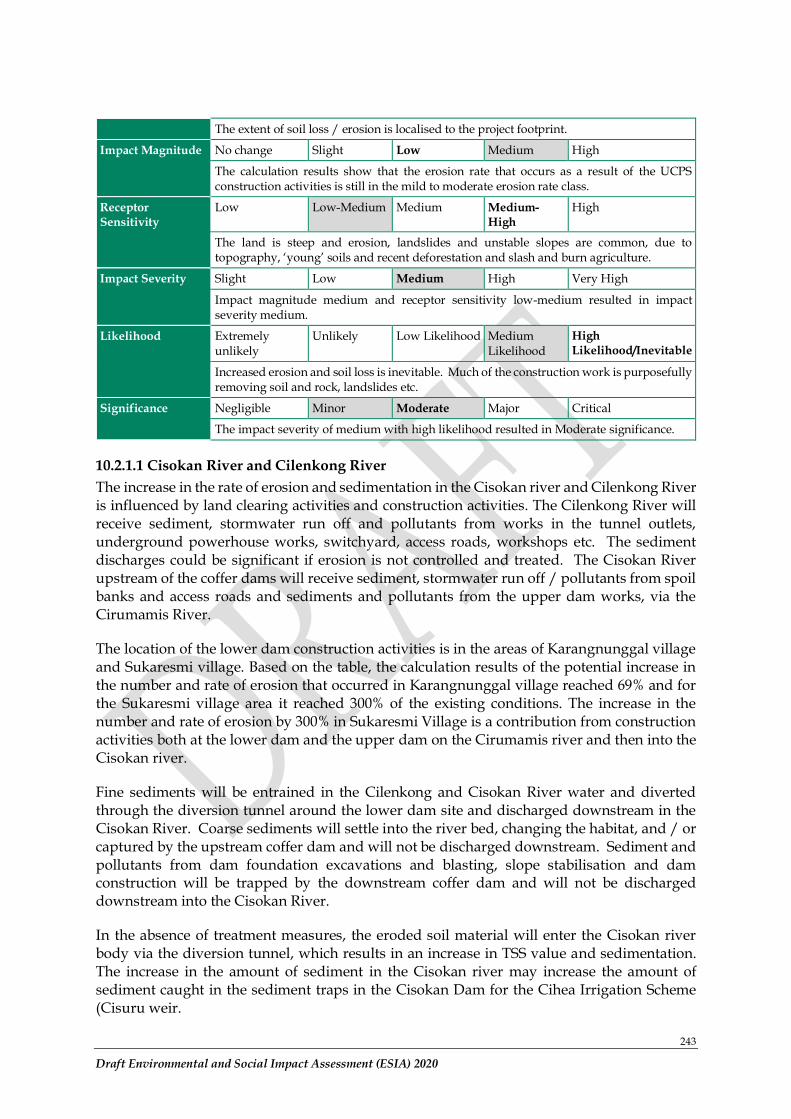
243
Draft Environmental and Social Impact Assessment (ESIA) 2020
The extent of soil loss / erosion is localised to the project footprint.
Impact Magnitude No change Slight Low Medium High
The calculation results show that the erosion rate that occurs as a result of the UCPS construction activities is still in the mild to moderate erosion rate class.
Receptor Sensitivity
Low Low-Medium Medium Medium-High
High
The land is steep and erosion, landslides and unstable slopes are common, due to topography, ‘young’ soils and recent deforestation and slash and burn agriculture.
Impact Severity Slight Low Medium High Very High
Impact magnitude medium and receptor sensitivity low-medium resulted in impact severity medium.
Likelihood Extremely unlikely
Unlikely Low Likelihood Medium Likelihood
High Likelihood/Inevitable
Increased erosion and soil loss is inevitable. Much of the construction work is purposefully removing soil and rock, landslides etc.
Significance Negligible Minor Moderate Major Critical
The impact severity of medium with high likelihood resulted in Moderate significance.
10.2.1.1 Cisokan River and Cilenkong River
The increase in the rate of erosion and sedimentation in the Cisokan river and Cilenkong River is influenced by land clearing activities and construction activities. The Cilenkong River will receive sediment, stormwater run off and pollutants from works in the tunnel outlets, underground powerhouse works, switchyard, access roads, workshops etc. The sediment discharges could be significant if erosion is not controlled and treated. The Cisokan River upstream of the coffer dams will receive sediment, stormwater run off / pollutants from spoil banks and access roads and sediments and pollutants from the upper dam works, via the Cirumamis River.
The location of the lower dam construction activities is in the areas of Karangnunggal village and Sukaresmi village. Based on the table, the calculation results of the potential increase in the number and rate of erosion that occurred in Karangnunggal village reached 69% and for the Sukaresmi village area it reached 300% of the existing conditions. The increase in the number and rate of erosion by 300% in Sukaresmi Village is a contribution from construction activities both at the lower dam and the upper dam on the Cirumamis river and then into the Cisokan river.
Fine sediments will be entrained in the Cilenkong and Cisokan River water and diverted through the diversion tunnel around the lower dam site and discharged downstream in the Cisokan River. Coarse sediments will settle into the river bed, changing the habitat, and / or captured by the upstream coffer dam and will not be discharged downstream. Sediment and pollutants from dam foundation excavations and blasting, slope stabilisation and dam construction will be trapped by the downstream coffer dam and will not be discharged downstream into the Cisokan River.
In the absence of treatment measures, the eroded soil material will enter the Cisokan river body via the diversion tunnel, which results in an increase in TSS value and sedimentation. The increase in the amount of sediment in the Cisokan river may increase the amount of sediment caught in the sediment traps in the Cisokan Dam for the Cihea Irrigation Scheme (Cisuru weir.
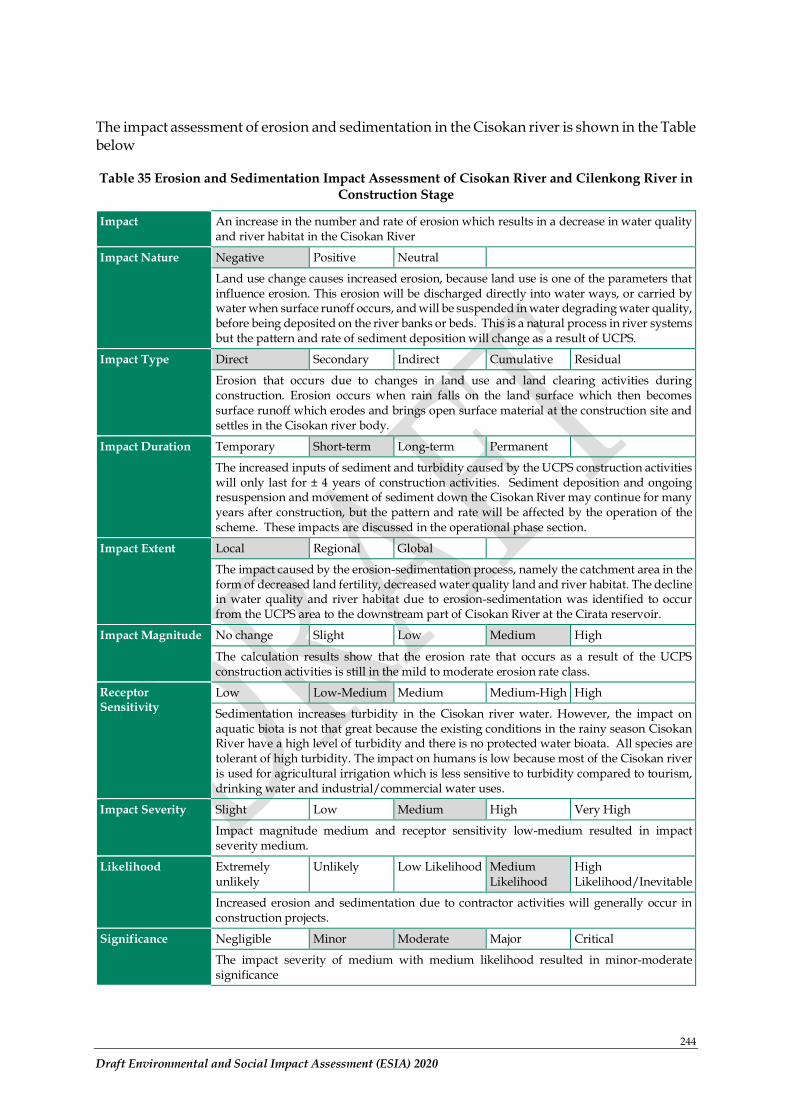
244
Draft Environmental and Social Impact Assessment (ESIA) 2020
The impact assessment of erosion and sedimentation in the Cisokan river is shown in the Table below
Table 35 Erosion and Sedimentation Impact Assessment of Cisokan River and Cilenkong River in Construction Stage
Impact An increase in the number and rate of erosion which results in a decrease in water quality and river habitat in the Cisokan River
Impact Nature Negative Positive Neutral
Land use change causes increased erosion, because land use is one of the parameters that influence erosion. This erosion will be discharged directly into water ways, or carried by water when surface runoff occurs, and will be suspended in water degrading water quality, before being deposited on the river banks or beds. This is a natural process in river systems but the pattern and rate of sediment deposition will change as a result of UCPS.
Impact Type Direct Secondary Indirect Cumulative Residual
Erosion that occurs due to changes in land use and land clearing activities during construction. Erosion occurs when rain falls on the land surface which then becomes surface runoff which erodes and brings open surface material at the construction site and settles in the Cisokan river body.
Impact Duration Temporary Short-term Long-term Permanent
The increased inputs of sediment and turbidity caused by the UCPS construction activities will only last for ± 4 years of construction activities. Sediment deposition and ongoing resuspension and movement of sediment down the Cisokan River may continue for many years after construction, but the pattern and rate will be affected by the operation of the scheme. These impacts are discussed in the operational phase section.
Impact Extent Local Regional Global
The impact caused by the erosion-sedimentation process, namely the catchment area in the form of decreased land fertility, decreased water quality land and river habitat. The decline in water quality and river habitat due to erosion-sedimentation was identified to occur from the UCPS area to the downstream part of Cisokan River at the Cirata reservoir.
Impact Magnitude No change Slight Low Medium High
The calculation results show that the erosion rate that occurs as a result of the UCPS construction activities is still in the mild to moderate erosion rate class.
Receptor Sensitivity
Low Low-Medium Medium Medium-High High
Sedimentation increases turbidity in the Cisokan river water. However, the impact on aquatic biota is not that great because the existing conditions in the rainy season Cisokan River have a high level of turbidity and there is no protected water bioata. All species are tolerant of high turbidity. The impact on humans is low because most of the Cisokan river is used for agricultural irrigation which is less sensitive to turbidity compared to tourism, drinking water and industrial/commercial water uses.
Impact Severity Slight Low Medium High Very High
Impact magnitude medium and receptor sensitivity low-medium resulted in impact severity medium.
Likelihood Extremely unlikely
Unlikely Low Likelihood Medium Likelihood
High Likelihood/Inevitable
Increased erosion and sedimentation due to contractor activities will generally occur in construction projects.
Significance Negligible Minor Moderate Major Critical
The impact severity of medium with medium likelihood resulted in minor-moderate significance
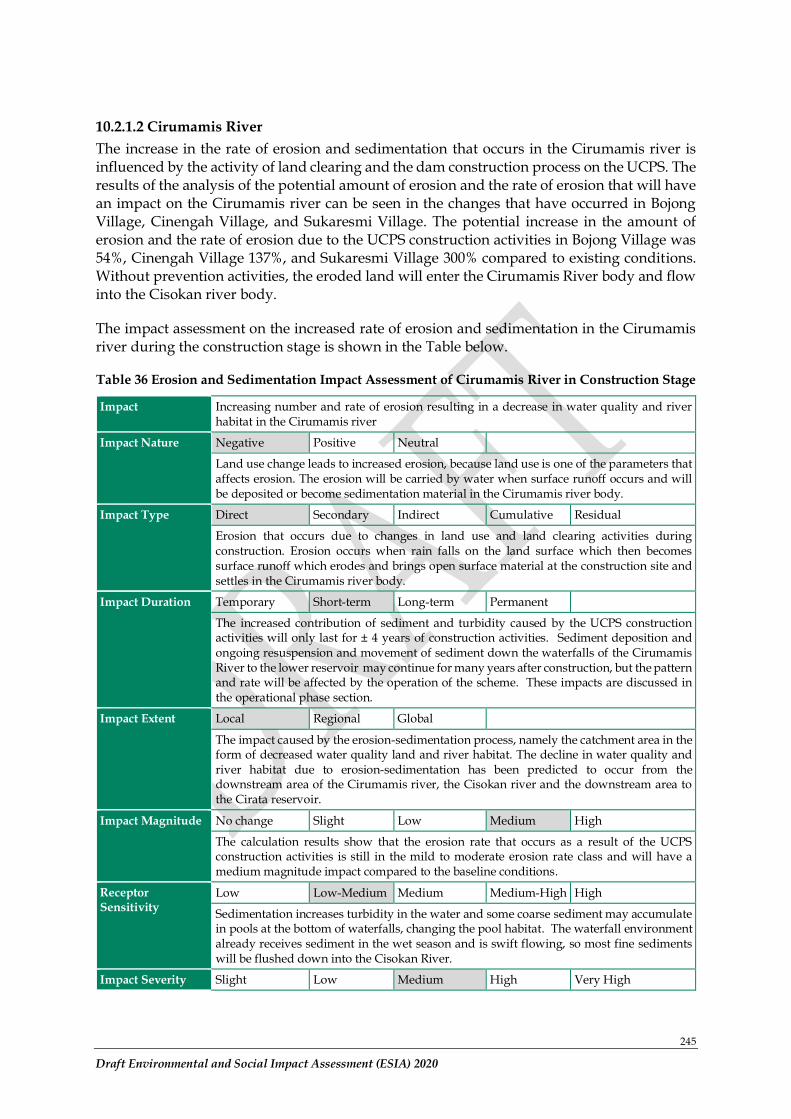
245
Draft Environmental and Social Impact Assessment (ESIA) 2020
10.2.1.2 Cirumamis River
The increase in the rate of erosion and sedimentation that occurs in the Cirumamis river is influenced by the activity of land clearing and the dam construction process on the UCPS. The results of the analysis of the potential amount of erosion and the rate of erosion that will have an impact on the Cirumamis river can be seen in the changes that have occurred in Bojong Village, Cinengah Village, and Sukaresmi Village. The potential increase in the amount of erosion and the rate of erosion due to the UCPS construction activities in Bojong Village was 54%, Cinengah Village 137%, and Sukaresmi Village 300% compared to existing conditions. Without prevention activities, the eroded land will enter the Cirumamis River body and flow into the Cisokan river body.
The impact assessment on the increased rate of erosion and sedimentation in the Cirumamis river during the construction stage is shown in the Table below.
Table 36 Erosion and Sedimentation Impact Assessment of Cirumamis River in Construction Stage
Impact Increasing number and rate of erosion resulting in a decrease in water quality and river habitat in the Cirumamis river
Impact Nature Negative Positive Neutral
Land use change leads to increased erosion, because land use is one of the parameters that affects erosion. The erosion will be carried by water when surface runoff occurs and will be deposited or become sedimentation material in the Cirumamis river body.
Impact Type Direct Secondary Indirect Cumulative Residual
Erosion that occurs due to changes in land use and land clearing activities during construction. Erosion occurs when rain falls on the land surface which then becomes surface runoff which erodes and brings open surface material at the construction site and settles in the Cirumamis river body.
Impact Duration Temporary Short-term Long-term Permanent
The increased contribution of sediment and turbidity caused by the UCPS construction activities will only last for ± 4 years of construction activities. Sediment deposition and ongoing resuspension and movement of sediment down the waterfalls of the Cirumamis River to the lower reservoir may continue for many years after construction, but the pattern and rate will be affected by the operation of the scheme. These impacts are discussed in the operational phase section.
Impact Extent Local Regional Global
The impact caused by the erosion-sedimentation process, namely the catchment area in the form of decreased water quality land and river habitat. The decline in water quality and river habitat due to erosion-sedimentation has been predicted to occur from the downstream area of the Cirumamis river, the Cisokan river and the downstream area to the Cirata reservoir.
Impact Magnitude No change Slight Low Medium High
The calculation results show that the erosion rate that occurs as a result of the UCPS construction activities is still in the mild to moderate erosion rate class and will have a medium magnitude impact compared to the baseline conditions.
Receptor Sensitivity
Low Low-Medium Medium Medium-High High
Sedimentation increases turbidity in the water and some coarse sediment may accumulate in pools at the bottom of waterfalls, changing the pool habitat. The waterfall environment already receives sediment in the wet season and is swift flowing, so most fine sediments will be flushed down into the Cisokan River.
Impact Severity Slight Low Medium High Very High
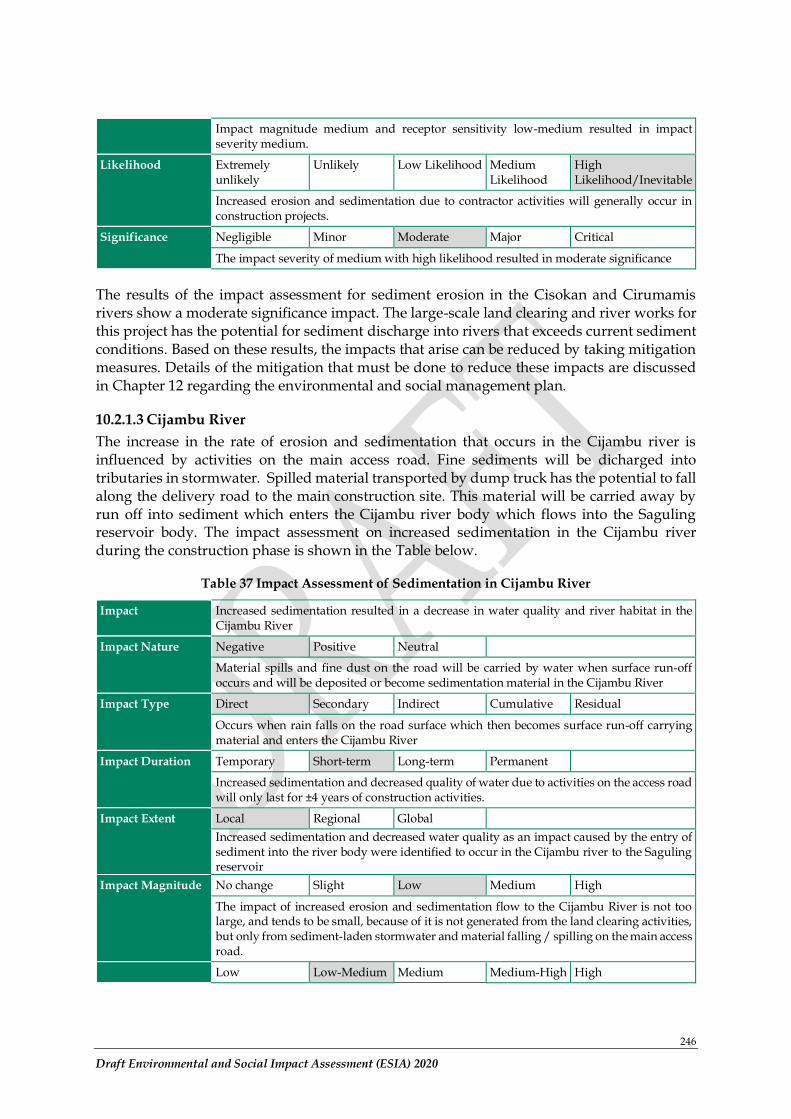
246
Draft Environmental and Social Impact Assessment (ESIA) 2020
Impact magnitude medium and receptor sensitivity low-medium resulted in impact severity medium.
Likelihood Extremely unlikely
Unlikely Low Likelihood Medium Likelihood
High Likelihood/Inevitable
Increased erosion and sedimentation due to contractor activities will generally occur in construction projects.
Significance Negligible Minor Moderate Major Critical
The impact severity of medium with high likelihood resulted in moderate significance
The results of the impact assessment for sediment erosion in the Cisokan and Cirumamis rivers show a moderate significance impact. The large-scale land clearing and river works for this project has the potential for sediment discharge into rivers that exceeds current sediment conditions. Based on these results, the impacts that arise can be reduced by taking mitigation measures. Details of the mitigation that must be done to reduce these impacts are discussed in Chapter 12 regarding the environmental and social management plan.
10.2.1.3 Cijambu River
The increase in the rate of erosion and sedimentation that occurs in the Cijambu river is influenced by activities on the main access road. Fine sediments will be dicharged into tributaries in stormwater. Spilled material transported by dump truck has the potential to fall along the delivery road to the main construction site. This material will be carried away by run off into sediment which enters the Cijambu river body which flows into the Saguling reservoir body. The impact assessment on increased sedimentation in the Cijambu river during the construction phase is shown in the Table below.
Table 37 Impact Assessment of Sedimentation in Cijambu River
Impact Increased sedimentation resulted in a decrease in water quality and river habitat in the Cijambu River
Impact Nature Negative Positive Neutral
Material spills and fine dust on the road will be carried by water when surface run-off occurs and will be deposited or become sedimentation material in the Cijambu River
Impact Type Direct Secondary Indirect Cumulative Residual
Occurs when rain falls on the road surface which then becomes surface run-off carrying material and enters the Cijambu River
Impact Duration Temporary Short-term Long-term Permanent
Increased sedimentation and decreased quality of water due to activities on the access road will only last for ±4 years of construction activities.
Impact Extent Local Regional Global
Increased sedimentation and decreased water quality as an impact caused by the entry of sediment into the river body were identified to occur in the Cijambu river to the Saguling reservoir
Impact Magnitude No change Slight Low Medium High
The impact of increased erosion and sedimentation flow to the Cijambu River is not too large, and tends to be small, because of it is not generated from the land clearing activities, but only from sediment-laden stormwater and material falling / spilling on the main access road.
Low Low-Medium Medium Medium-High High
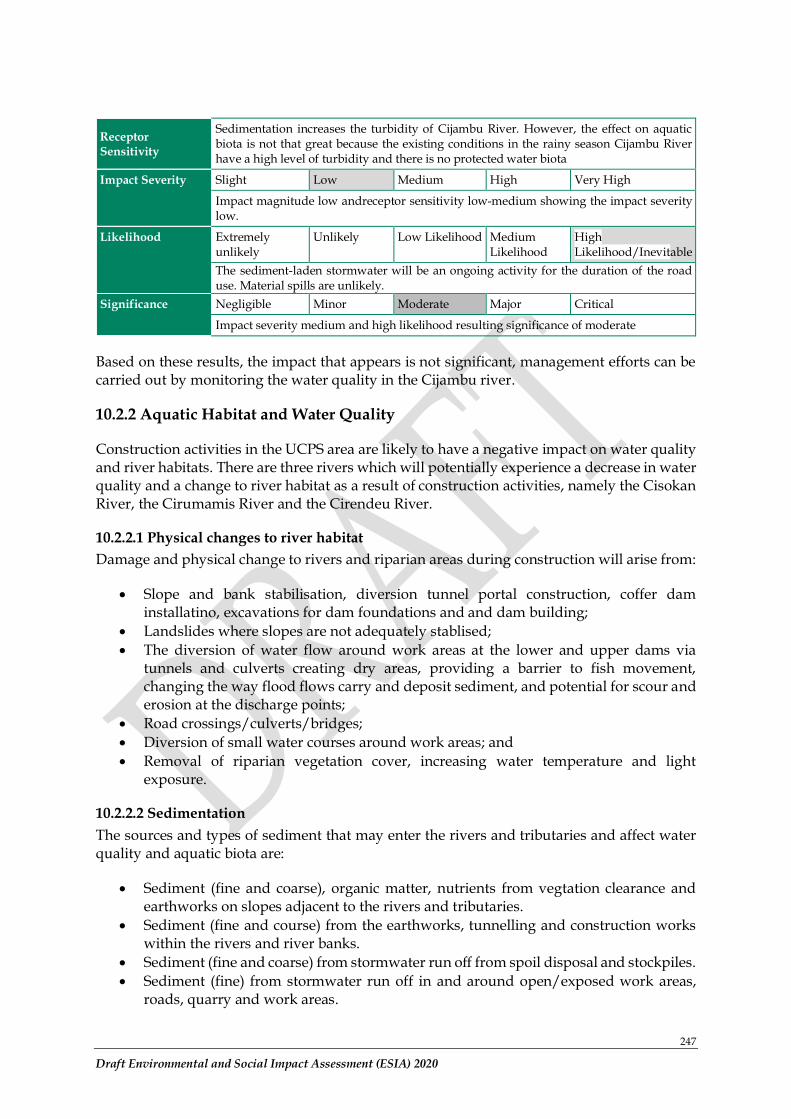
247
Draft Environmental and Social Impact Assessment (ESIA) 2020
Receptor Sensitivity
Sedimentation increases the turbidity of Cijambu River. However, the effect on aquatic biota is not that great because the existing conditions in the rainy season Cijambu River have a high level of turbidity and there is no protected water biota
Impact Severity Slight Low Medium High Very High
Impact magnitude low andreceptor sensitivity low-medium showing the impact severity low.
Likelihood Extremely unlikely
Unlikely Low Likelihood Medium Likelihood
High Likelihood/Inevitable
The sediment-laden stormwater will be an ongoing activity for the duration of the road use. Material spills are unlikely.
Significance Negligible Minor Moderate Major Critical
Impact severity medium and high likelihood resulting significance of moderate
Based on these results, the impact that appears is not significant, management efforts can be carried out by monitoring the water quality in the Cijambu river.
10.2.2 Aquatic Habitat and Water Quality
Construction activities in the UCPS area are likely to have a negative impact on water quality and river habitats. There are three rivers which will potentially experience a decrease in water quality and a change to river habitat as a result of construction activities, namely the Cisokan River, the Cirumamis River and the Cirendeu River.
10.2.2.1 Physical changes to river habitat
Damage and physical change to rivers and riparian areas during construction will arise from:
• Slope and bank stabilisation, diversion tunnel portal construction, coffer dam installatino, excavations for dam foundations and and dam building;
• Landslides where slopes are not adequately stablised;
• The diversion of water flow around work areas at the lower and upper dams via tunnels and culverts creating dry areas, providing a barrier to fish movement, changing the way flood flows carry and deposit sediment, and potential for scour and erosion at the discharge points;
• Road crossings/culverts/bridges;
• Diversion of small water courses around work areas; and
• Removal of riparian vegetation cover, increasing water temperature and light exposure.
10.2.2.2 Sedimentation
The sources and types of sediment that may enter the rivers and tributaries and affect water quality and aquatic biota are:
• Sediment (fine and coarse), organic matter, nutrients from vegtation clearance and earthworks on slopes adjacent to the rivers and tributaries.
• Sediment (fine and course) from the earthworks, tunnelling and construction works within the rivers and river banks.
• Sediment (fine and coarse) from stormwater run off from spoil disposal and stockpiles.
• Sediment (fine) from stormwater run off in and around open/exposed work areas, roads, quarry and work areas.
248
Draft Environmental and Social Impact Assessment (ESIA) 2020
10.2.2.3 Pollutants
The sources and types of pollutant that may enter the rivers and tributaries and affect water quality and aquatic biota are:
• High pH and suspended solids from cement storage and concrete batching areas.
• High pH, heavy metals, hydrocarbons and suspended solids from fly ash storage and handling.
• Hydrocarbons, heavy metals, nutrients, pH changes from spills, deliberate discharges, and poor storage, handling and disposal of hazardous materials, fuels, waste oils etc. These pollutants also come from untreated stormwater run off from working areas.
• Solid waste from littering and poor handling of waste.
10.2.2.4 Domestic waste
The sources and types of domestic waste that may enter the rivers and tributaries and affect water quality and aquatic biota are:
• Organic material, pathogenic bacteria and nutrients from poor siting and management of Contractor’s sewage treatment and siting of septic tanks that could lead to seepage to rivers.
• Organic material, pathogenic bacteria and nutrients from untreated sewage from informal settlements, camp followers and field-based defacation.
Increasing domestic waste with the key parameters BOD, COD and TSS could cause a decrease in the quality of water bodies, thus reducing the quality of habitat for aquatic organisms. The results of the measurement of water quality in several rivers showed that the levels of BOD and COD were above the quality standard, especially water bodies contaminated with domestic waste. This shows that the management of domestic waste by the community is still low, due to the facilities for collecting waste from baths, washing and latrines (gray water and black water), so that most of the domestic waste is channeled directly into water bodies. The construction phase will involve the arrival of many workers with the potential to increase domestic waste discharge to water bodies in the unlikley event that environmental sanitation facilities are not available in camps and at works sites and domestic waste is discharged directly into rivers, resulting in increased levels of BOD, COD, TSS. The results of the analysis of pollution predictions using pollution load analysis (Directorate General of Pollution Control and Environmental Damage, Ministry of Environment and Forestry, 2018) which are calculated based on the emission standards discharged by each person per day for BOD, COD parameters indicate that the increase in construction stage workers and an increase in the number population will increase domestic waste by 4.4% with the addition of the number of workers in peak conditions will increase levels of BOD, COD, because the addition of workers by 1%.
10.2.2.1 Water quality in Cisokan River and Cilenkong River
During construction the Cisokan River, immediately downstream of the Cilenkong River confluence, will be modified by the installation of upstream and downstream coffer dams and the diversion of water for several hundred meters. The diversion reach will be dry for dam preparation and construction. The decline in water quality and habitat for the Cisokan River and Cilenkong River is affected by the land clearing activities and the construction process of the UCPS lower dam. The results
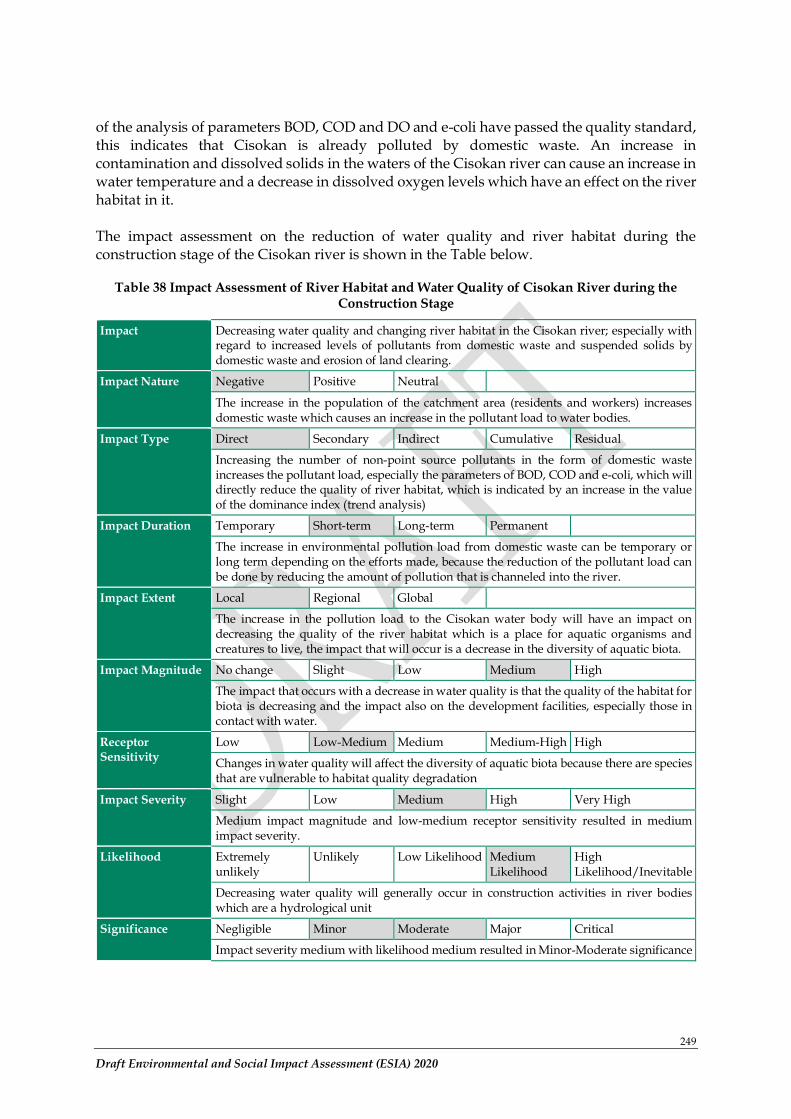
249
Draft Environmental and Social Impact Assessment (ESIA) 2020
of the analysis of parameters BOD, COD and DO and e-coli have passed the quality standard, this indicates that Cisokan is already polluted by domestic waste. An increase in contamination and dissolved solids in the waters of the Cisokan river can cause an increase in water temperature and a decrease in dissolved oxygen levels which have an effect on the river habitat in it. The impact assessment on the reduction of water quality and river habitat during the construction stage of the Cisokan river is shown in the Table below.
Table 38 Impact Assessment of River Habitat and Water Quality of Cisokan River during the Construction Stage
Impact Decreasing water quality and changing river habitat in the Cisokan river; especially with regard to increased levels of pollutants from domestic waste and suspended solids by domestic waste and erosion of land clearing.
Impact Nature Negative Positive Neutral
The increase in the population of the catchment area (residents and workers) increases domestic waste which causes an increase in the pollutant load to water bodies.
Impact Type Direct Secondary Indirect Cumulative Residual
Increasing the number of non-point source pollutants in the form of domestic waste increases the pollutant load, especially the parameters of BOD, COD and e-coli, which will directly reduce the quality of river habitat, which is indicated by an increase in the value of the dominance index (trend analysis)
Impact Duration Temporary Short-term Long-term Permanent
The increase in environmental pollution load from domestic waste can be temporary or long term depending on the efforts made, because the reduction of the pollutant load can be done by reducing the amount of pollution that is channeled into the river.
Impact Extent Local Regional Global
The increase in the pollution load to the Cisokan water body will have an impact on decreasing the quality of the river habitat which is a place for aquatic organisms and creatures to live, the impact that will occur is a decrease in the diversity of aquatic biota.
Impact Magnitude No change Slight Low Medium High
The impact that occurs with a decrease in water quality is that the quality of the habitat for biota is decreasing and the impact also on the development facilities, especially those in contact with water.
Receptor Sensitivity
Low Low-Medium Medium Medium-High High
Changes in water quality will affect the diversity of aquatic biota because there are species that are vulnerable to habitat quality degradation
Impact Severity Slight Low Medium High Very High
Medium impact magnitude and low-medium receptor sensitivity resulted in medium impact severity.
Likelihood Extremely unlikely
Unlikely Low Likelihood Medium Likelihood
High Likelihood/Inevitable
Decreasing water quality will generally occur in construction activities in river bodies which are a hydrological unit
Significance Negligible Minor Moderate Major Critical
Impact severity medium with likelihood medium resulted in Minor-Moderate significance
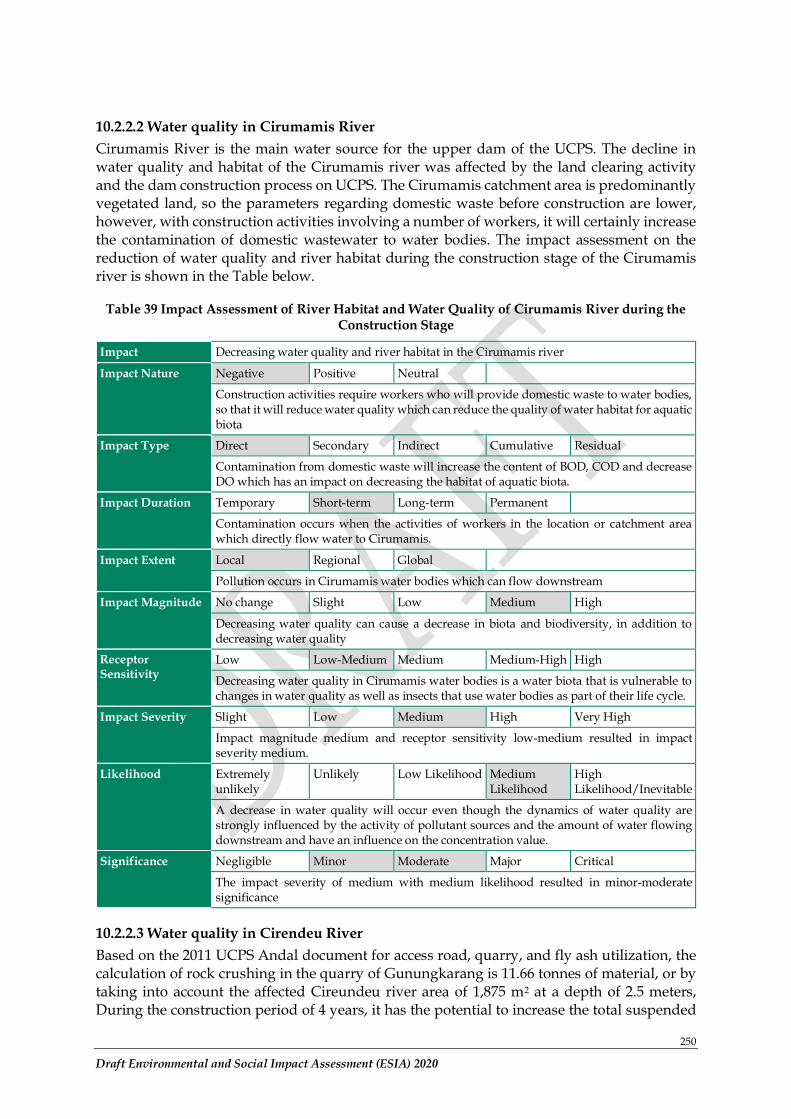
250
Draft Environmental and Social Impact Assessment (ESIA) 2020
10.2.2.2 Water quality in Cirumamis River
Cirumamis River is the main water source for the upper dam of the UCPS. The decline in water quality and habitat of the Cirumamis river was affected by the land clearing activity and the dam construction process on UCPS. The Cirumamis catchment area is predominantly vegetated land, so the parameters regarding domestic waste before construction are lower, however, with construction activities involving a number of workers, it will certainly increase the contamination of domestic wastewater to water bodies. The impact assessment on the reduction of water quality and river habitat during the construction stage of the Cirumamis river is shown in the Table below.
Table 39 Impact Assessment of River Habitat and Water Quality of Cirumamis River during the Construction Stage
Impact Decreasing water quality and river habitat in the Cirumamis river
Impact Nature Negative Positive Neutral
Construction activities require workers who will provide domestic waste to water bodies, so that it will reduce water quality which can reduce the quality of water habitat for aquatic biota
Impact Type Direct Secondary Indirect Cumulative Residual
Contamination from domestic waste will increase the content of BOD, COD and decrease DO which has an impact on decreasing the habitat of aquatic biota.
Impact Duration Temporary Short-term Long-term Permanent
Contamination occurs when the activities of workers in the location or catchment area which directly flow water to Cirumamis.
Impact Extent Local Regional Global
Pollution occurs in Cirumamis water bodies which can flow downstream
Impact Magnitude No change Slight Low Medium High
Decreasing water quality can cause a decrease in biota and biodiversity, in addition to decreasing water quality
Receptor Sensitivity
Low Low-Medium Medium Medium-High High
Decreasing water quality in Cirumamis water bodies is a water biota that is vulnerable to changes in water quality as well as insects that use water bodies as part of their life cycle.
Impact Severity Slight Low Medium High Very High
Impact magnitude medium and receptor sensitivity low-medium resulted in impact severity medium.
Likelihood Extremely unlikely
Unlikely Low Likelihood Medium Likelihood
High Likelihood/Inevitable
A decrease in water quality will occur even though the dynamics of water quality are strongly influenced by the activity of pollutant sources and the amount of water flowing downstream and have an influence on the concentration value.
Significance Negligible Minor Moderate Major Critical
The impact severity of medium with medium likelihood resulted in minor-moderate significance
10.2.2.3 Water quality in Cirendeu River
Based on the 2011 UCPS Andal document for access road, quarry, and fly ash utilization, the calculation of rock crushing in the quarry of Gunungkarang is 11.66 tonnes of material, or by taking into account the affected Cireundeu river area of 1,875 m2 at a depth of 2.5 meters, During the construction period of 4 years, it has the potential to increase the total suspended
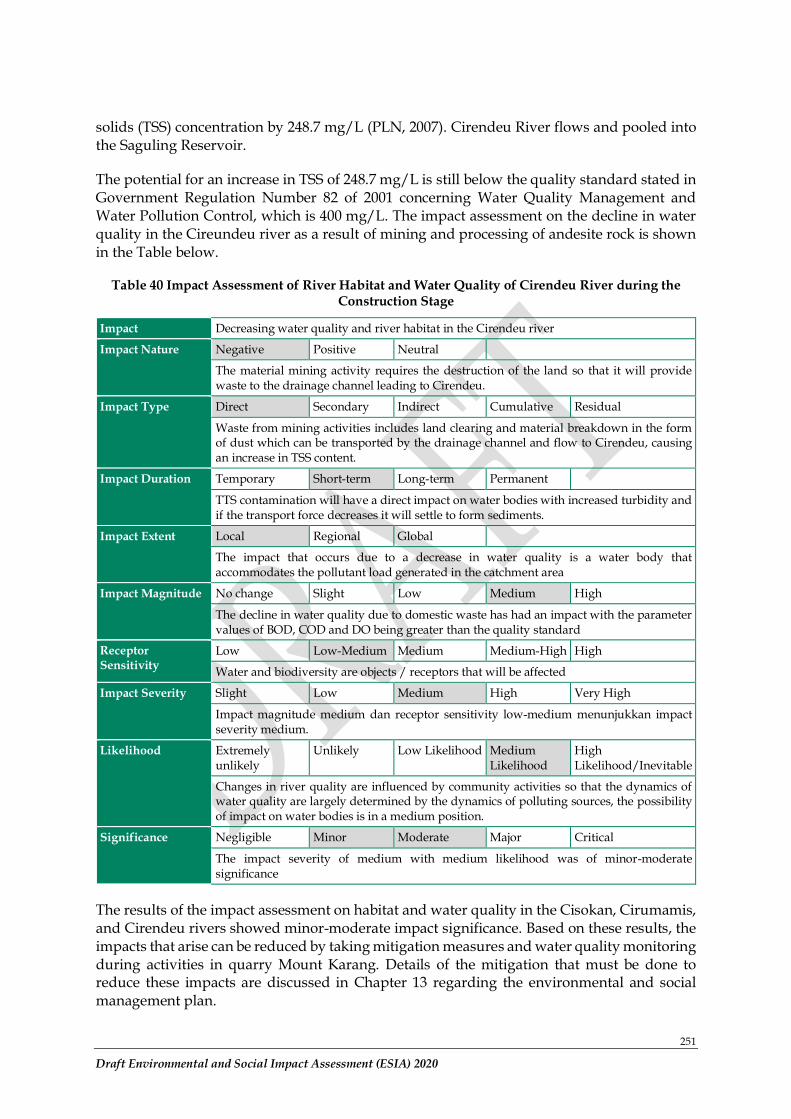
251
Draft Environmental and Social Impact Assessment (ESIA) 2020
solids (TSS) concentration by 248.7 mg/L (PLN, 2007). Cirendeu River flows and pooled into the Saguling Reservoir.
The potential for an increase in TSS of 248.7 mg/L is still below the quality standard stated in Government Regulation Number 82 of 2001 concerning Water Quality Management and Water Pollution Control, which is 400 mg/L. The impact assessment on the decline in water quality in the Cireundeu river as a result of mining and processing of andesite rock is shown in the Table below.
Table 40 Impact Assessment of River Habitat and Water Quality of Cirendeu River during the Construction Stage
Impact Decreasing water quality and river habitat in the Cirendeu river
Impact Nature Negative Positive Neutral
The material mining activity requires the destruction of the land so that it will provide waste to the drainage channel leading to Cirendeu.
Impact Type Direct Secondary Indirect Cumulative Residual
Waste from mining activities includes land clearing and material breakdown in the form of dust which can be transported by the drainage channel and flow to Cirendeu, causing an increase in TSS content.
Impact Duration Temporary Short-term Long-term Permanent
TTS contamination will have a direct impact on water bodies with increased turbidity and if the transport force decreases it will settle to form sediments.
Impact Extent Local Regional Global
The impact that occurs due to a decrease in water quality is a water body that accommodates the pollutant load generated in the catchment area
Impact Magnitude No change Slight Low Medium High
The decline in water quality due to domestic waste has had an impact with the parameter values of BOD, COD and DO being greater than the quality standard
Receptor Sensitivity
Low Low-Medium Medium Medium-High High
Water and biodiversity are objects / receptors that will be affected
Impact Severity Slight Low Medium High Very High
Impact magnitude medium dan receptor sensitivity low-medium menunjukkan impact severity medium.
Likelihood Extremely unlikely
Unlikely Low Likelihood Medium Likelihood
High Likelihood/Inevitable
Changes in river quality are influenced by community activities so that the dynamics of water quality are largely determined by the dynamics of polluting sources, the possibility of impact on water bodies is in a medium position.
Significance Negligible Minor Moderate Major Critical
The impact severity of medium with medium likelihood was of minor-moderate significance
The results of the impact assessment on habitat and water quality in the Cisokan, Cirumamis, and Cirendeu rivers showed minor-moderate impact significance. Based on these results, the impacts that arise can be reduced by taking mitigation measures and water quality monitoring during activities in quarry Mount Karang. Details of the mitigation that must be done to reduce these impacts are discussed in Chapter 13 regarding the environmental and social management plan.
252
Draft Environmental and Social Impact Assessment (ESIA) 2020
10.2.3 Aquatic biota
Various construction activities show the influence of disturbance of aquatic biota, reducing primary production and the ability of basic animals to forage. The flow of contaminants into river bodies causes a decrease in fish nesting habitat and adversely affects the ability of fish eggs to reach the adult stage. Changes in sediment input with high organic material which can reduce dissolved oxygen, resulting in fish/invertebrate mortality. The ability of fish to eat benthic invertebrates is also decreasing. Construction also causes changes in the dimensions of the river flow, so that water flows that form obstacles and niches for shelter contain sediment. Covering rock faces reduces habitat for invertebrates. This has an impact on changes in the number and types of existing invertebrate species from sensitive species to more tolerant species such as snails, which can lead to changes in fish populations due to decreasing food sources.
The construction stage may lead to a decrease in water quality which has a significant impact on the disruption of river habitats, especially fish. RKL RPL data until 2019 shows that there has been a decrease in the number of fish finds, especially in 2015-2016 which is the initial period of construction. Causality between project development and these trends are, however, not clear because most developments have been around the access road which should not have impacted rivers. Increased fishing pressure, sampling issues, or other factors by have resulted in changes in fish numbers.
Based on baseline information for the rivers potentially affected by the project, such as the Cirendeu, Cijambu, Cirumamis, Cilengkong and Cisokan there are still 10-15 fish species present and if the total number of fish species recorded at the time of the survey is accumulated, it reaches 17 species plus turtles and shrimp. Species monitoring in the Cirendeu river recorded 12 fish species and in the Cisokan river 14 fish species. The Hampala species (Hampala macrolepidota), which recorded in the 2009 study but subsequently not recorded during monitoring up until 2019. These results are strengthened by limited communication from sources who work as fishermen in the Cisokan River who catch the Hampala species 5-6 times a week. These findings were mostly found in the Cirumamis River, as several informants who had caught fish in the river found Hampala species 6-7 times a week.
The findings of the hampala fish indicate that the conditions of the rivers in the project area, especially the upstream areas, still have good ecosystem integrity. The data concerning plankton between 1,410-1,830 ind/L shows that the upstream sections of the Cijambu, Cilengkong, Cirumamis and Cisokan rivers are categorized as oligotrophic, which means they are still clean and have not been polluted with nutrients. Meanwhile, the Cirumamis and Cisokan river lower sections found 2,610-4,140 ind/L plankton, which means mesotrophic or moderately polluted, generally by anthropogenic activities in the downstream area
Fish migration in this river system has already been affected by two existing dams located downstream of the Cisokan river, which have blocked off upriver to sea connections for several decades. The Cisokan River is a tributary of the Citarum river which empties into the Java Sea. Currently, there are 3 dams in the Citarum River, in order from downstream to upstream, namely Jatiluhur (1967), Cirata (1987) and Saguling (1985). The diversity of native fish species in the Citarum River has decreased drastically. As many as 34 types of native fish that live in the Upper Citarum River, Kaskade Reservoir and Citarum Hilir, only 26 types of fish remain and as many as eight species which are economically important fish have not been caught again in recent years (Kartamihardja, 2019). The diversity of caught fish species is
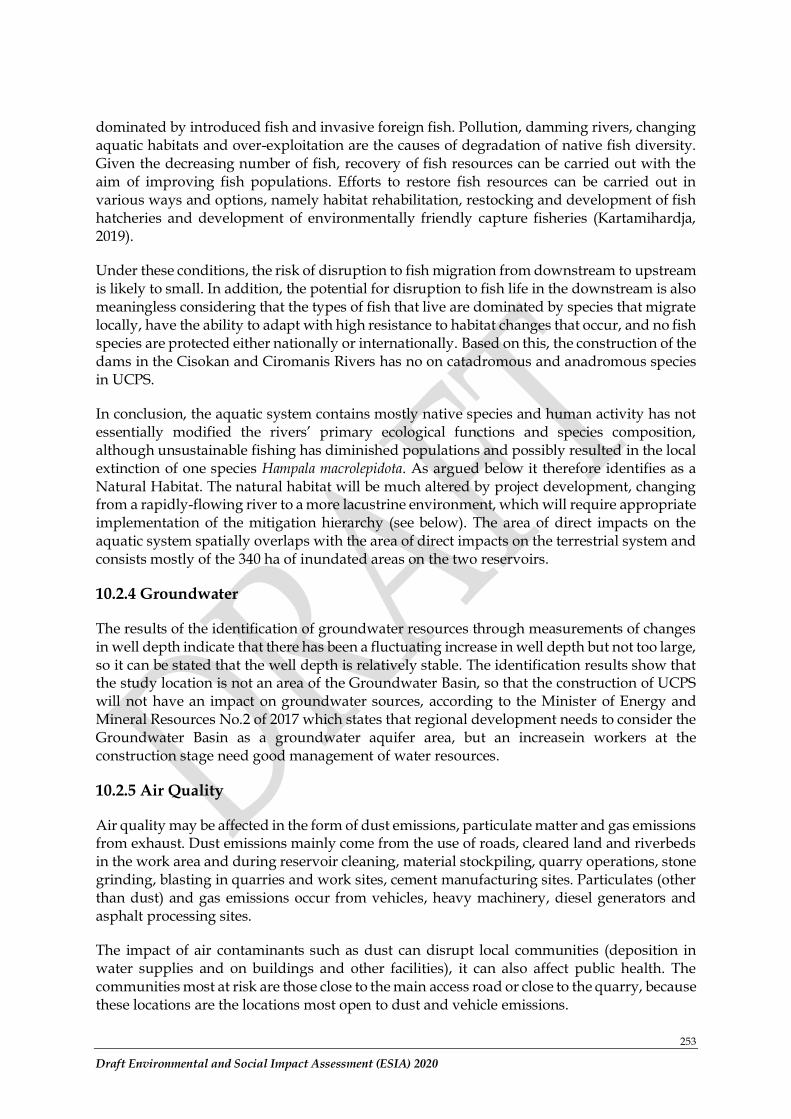
253
Draft Environmental and Social Impact Assessment (ESIA) 2020
dominated by introduced fish and invasive foreign fish. Pollution, damming rivers, changing aquatic habitats and over-exploitation are the causes of degradation of native fish diversity. Given the decreasing number of fish, recovery of fish resources can be carried out with the aim of improving fish populations. Efforts to restore fish resources can be carried out in various ways and options, namely habitat rehabilitation, restocking and development of fish hatcheries and development of environmentally friendly capture fisheries (Kartamihardja, 2019).
Under these conditions, the risk of disruption to fish migration from downstream to upstream is likely to small. In addition, the potential for disruption to fish life in the downstream is also meaningless considering that the types of fish that live are dominated by species that migrate locally, have the ability to adapt with high resistance to habitat changes that occur, and no fish species are protected either nationally or internationally. Based on this, the construction of the dams in the Cisokan and Ciromanis Rivers has no on catadromous and anadromous species in UCPS.
In conclusion, the aquatic system contains mostly native species and human activity has not essentially modified the rivers’ primary ecological functions and species composition, although unsustainable fishing has diminished populations and possibly resulted in the local extinction of one species Hampala macrolepidota. As argued below it therefore identifies as a Natural Habitat. The natural habitat will be much altered by project development, changing from a rapidly-flowing river to a more lacustrine environment, which will require appropriate implementation of the mitigation hierarchy (see below). The area of direct impacts on the aquatic system spatially overlaps with the area of direct impacts on the terrestrial system and consists mostly of the 340 ha of inundated areas on the two reservoirs.
10.2.4 Groundwater
The results of the identification of groundwater resources through measurements of changes in well depth indicate that there has been a fluctuating increase in well depth but not too large, so it can be stated that the well depth is relatively stable. The identification results show that the study location is not an area of the Groundwater Basin, so that the construction of UCPS will not have an impact on groundwater sources, according to the Minister of Energy and Mineral Resources No.2 of 2017 which states that regional development needs to consider the Groundwater Basin as a groundwater aquifer area, but an increasein workers at the construction stage need good management of water resources.
10.2.5 Air Quality
Air quality may be affected in the form of dust emissions, particulate matter and gas emissions from exhaust. Dust emissions mainly come from the use of roads, cleared land and riverbeds in the work area and during reservoir cleaning, material stockpiling, quarry operations, stone grinding, blasting in quarries and work sites, cement manufacturing sites. Particulates (other than dust) and gas emissions occur from vehicles, heavy machinery, diesel generators and asphalt processing sites.
The impact of air contaminants such as dust can disrupt local communities (deposition in water supplies and on buildings and other facilities), it can also affect public health. The communities most at risk are those close to the main access road or close to the quarry, because these locations are the locations most open to dust and vehicle emissions.
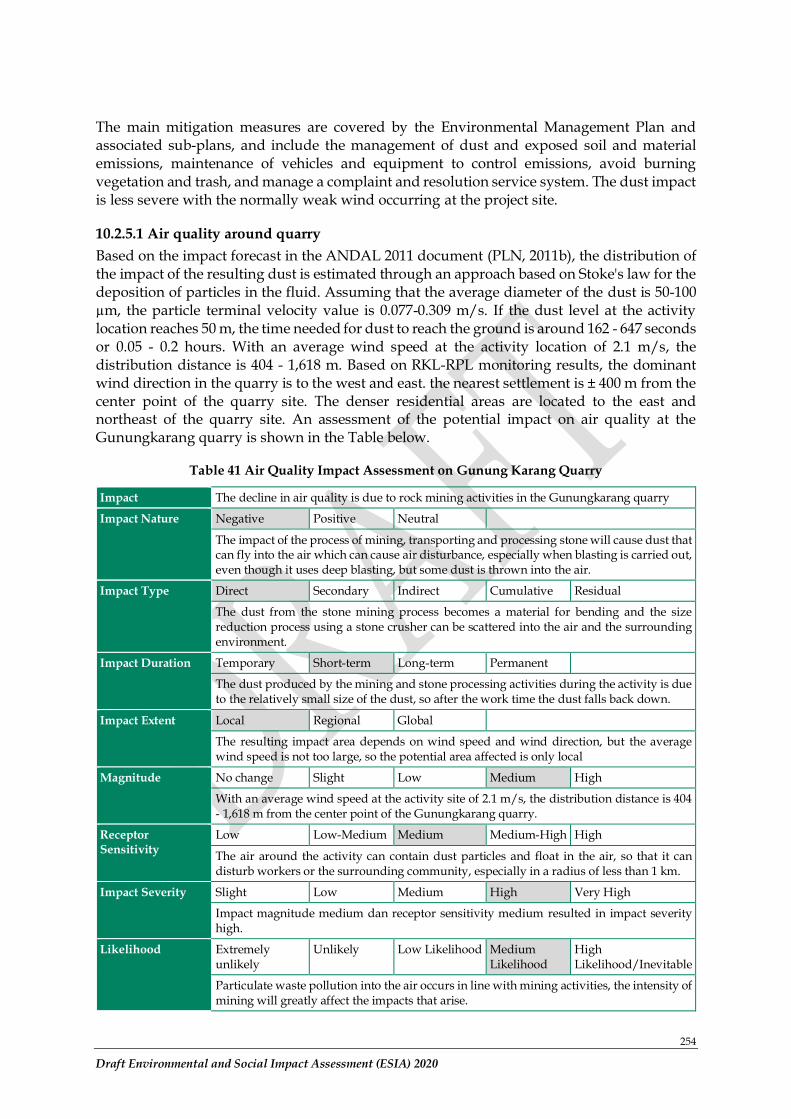
254
Draft Environmental and Social Impact Assessment (ESIA) 2020
The main mitigation measures are covered by the Environmental Management Plan and associated sub-plans, and include the management of dust and exposed soil and material emissions, maintenance of vehicles and equipment to control emissions, avoid burning vegetation and trash, and manage a complaint and resolution service system. The dust impact is less severe with the normally weak wind occurring at the project site.
10.2.5.1 Air quality around quarry
Based on the impact forecast in the ANDAL 2011 document (PLN, 2011b), the distribution of the impact of the resulting dust is estimated through an approach based on Stoke's law for the deposition of particles in the fluid. Assuming that the average diameter of the dust is 50-100 µm, the particle terminal velocity value is 0.077-0.309 m/s. If the dust level at the activity location reaches 50 m, the time needed for dust to reach the ground is around 162 - 647 seconds or 0.05 - 0.2 hours. With an average wind speed at the activity location of 2.1 m/s, the distribution distance is 404 - 1,618 m. Based on RKL-RPL monitoring results, the dominant wind direction in the quarry is to the west and east. the nearest settlement is ± 400 m from the center point of the quarry site. The denser residential areas are located to the east and northeast of the quarry site. An assessment of the potential impact on air quality at the Gunungkarang quarry is shown in the Table below.
Table 41 Air Quality Impact Assessment on Gunung Karang Quarry
Impact The decline in air quality is due to rock mining activities in the Gunungkarang quarry
Impact Nature Negative Positive Neutral
The impact of the process of mining, transporting and processing stone will cause dust that can fly into the air which can cause air disturbance, especially when blasting is carried out, even though it uses deep blasting, but some dust is thrown into the air.
Impact Type Direct Secondary Indirect Cumulative Residual
The dust from the stone mining process becomes a material for bending and the size reduction process using a stone crusher can be scattered into the air and the surrounding environment.
Impact Duration Temporary Short-term Long-term Permanent
The dust produced by the mining and stone processing activities during the activity is due to the relatively small size of the dust, so after the work time the dust falls back down.
Impact Extent Local Regional Global
The resulting impact area depends on wind speed and wind direction, but the average wind speed is not too large, so the potential area affected is only local
Magnitude No change Slight Low Medium High
With an average wind speed at the activity site of 2.1 m/s, the distribution distance is 404 - 1,618 m from the center point of the Gunungkarang quarry.
Receptor Sensitivity
Low Low-Medium Medium Medium-High High
The air around the activity can contain dust particles and float in the air, so that it can disturb workers or the surrounding community, especially in a radius of less than 1 km.
Impact Severity Slight Low Medium High Very High
Impact magnitude medium dan receptor sensitivity medium resulted in impact severity high.
Likelihood Extremely unlikely
Unlikely Low Likelihood Medium Likelihood
High Likelihood/Inevitable
Particulate waste pollution into the air occurs in line with mining activities, the intensity of mining will greatly affect the impacts that arise.
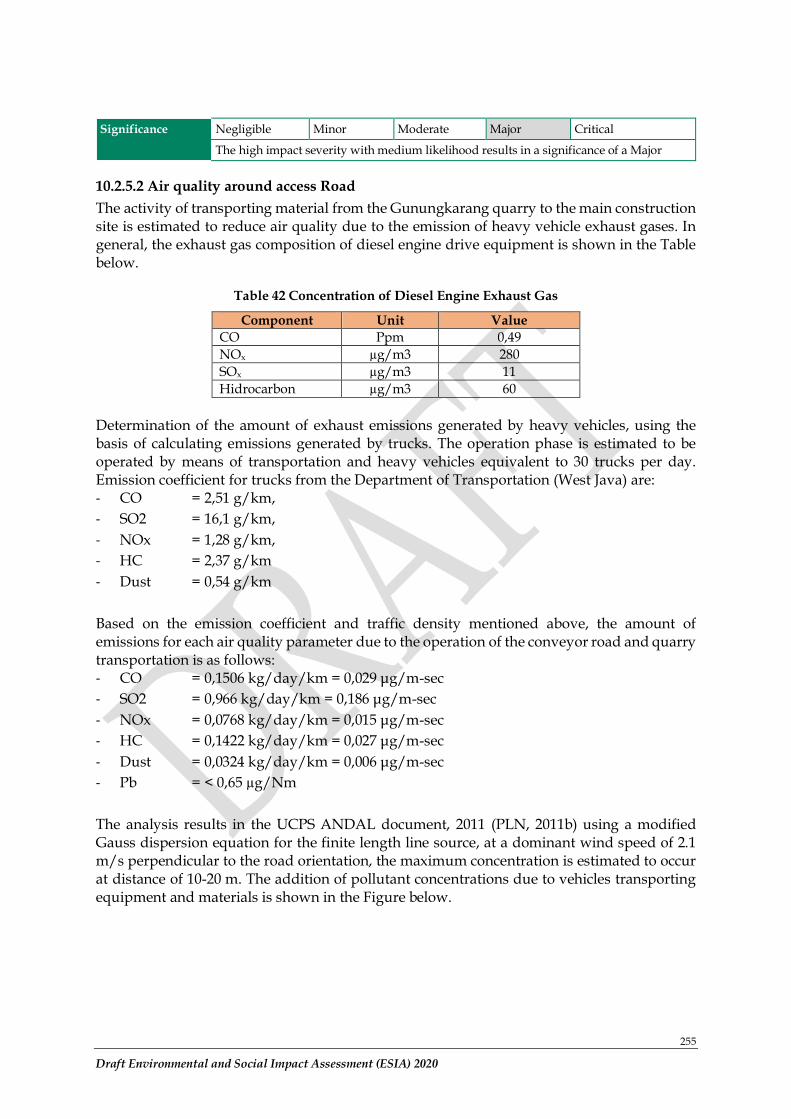
255
Draft Environmental and Social Impact Assessment (ESIA) 2020
Significance Negligible Minor Moderate Major Critical
The high impact severity with medium likelihood results in a significance of a Major
10.2.5.2 Air quality around access Road
The activity of transporting material from the Gunungkarang quarry to the main construction site is estimated to reduce air quality due to the emission of heavy vehicle exhaust gases. In general, the exhaust gas composition of diesel engine drive equipment is shown in the Table below.
Table 42 Concentration of Diesel Engine Exhaust Gas
Component Unit Value
CO Ppm 0,49
NOx µg/m3 280
SOx µg/m3 11
Hidrocarbon µg/m3 60
Determination of the amount of exhaust emissions generated by heavy vehicles, using the basis of calculating emissions generated by trucks. The operation phase is estimated to be operated by means of transportation and heavy vehicles equivalent to 30 trucks per day. Emission coefficient for trucks from the Department of Transportation (West Java) are: - CO = 2,51 g/km,
- SO2 = 16,1 g/km,
- NOx = 1,28 g/km,
- HC = 2,37 g/km
- Dust = 0,54 g/km
Based on the emission coefficient and traffic density mentioned above, the amount of emissions for each air quality parameter due to the operation of the conveyor road and quarry transportation is as follows: - CO = 0,1506 kg/day/km = 0,029 μg/m-sec
- SO2 = 0,966 kg/day/km = 0,186 μg/m-sec
- NOx = 0,0768 kg/day/km = 0,015 μg/m-sec
- HC = 0,1422 kg/day/km = 0,027 μg/m-sec
- Dust = 0,0324 kg/day/km = 0,006 μg/m-sec
- Pb = < 0,65 µg/Nm
The analysis results in the UCPS ANDAL document, 2011 (PLN, 2011b) using a modified Gauss dispersion equation for the finite length line source, at a dominant wind speed of 2.1 m/s perpendicular to the road orientation, the maximum concentration is estimated to occur at distance of 10-20 m. The addition of pollutant concentrations due to vehicles transporting equipment and materials is shown in the Figure below.
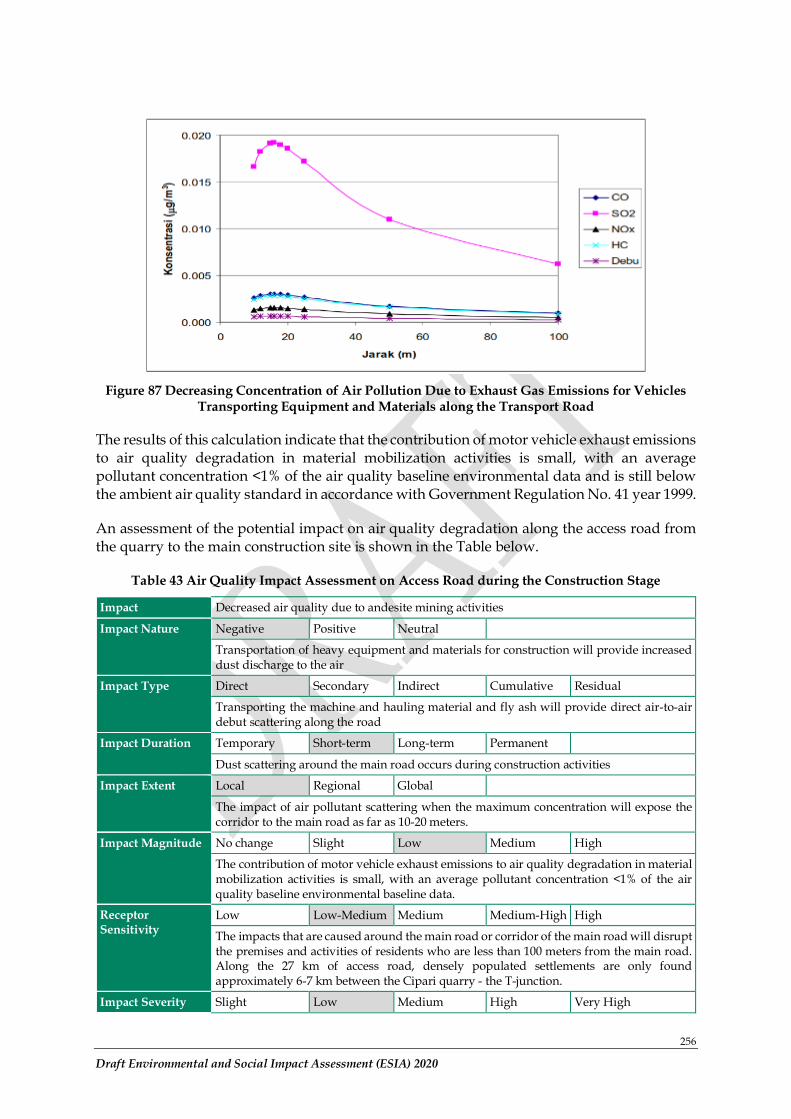
256
Draft Environmental and Social Impact Assessment (ESIA) 2020
Figure 87 Decreasing Concentration of Air Pollution Due to Exhaust Gas Emissions for Vehicles Transporting Equipment and Materials along the Transport Road
The results of this calculation indicate that the contribution of motor vehicle exhaust emissions to air quality degradation in material mobilization activities is small, with an average pollutant concentration <1% of the air quality baseline environmental data and is still below the ambient air quality standard in accordance with Government Regulation No. 41 year 1999.
An assessment of the potential impact on air quality degradation along the access road from the quarry to the main construction site is shown in the Table below.
Table 43 Air Quality Impact Assessment on Access Road during the Construction Stage
Impact Decreased air quality due to andesite mining activities
Impact Nature Negative Positive Neutral
Transportation of heavy equipment and materials for construction will provide increased dust discharge to the air
Impact Type Direct Secondary Indirect Cumulative Residual
Transporting the machine and hauling material and fly ash will provide direct air-to-air debut scattering along the road
Impact Duration Temporary Short-term Long-term Permanent
Dust scattering around the main road occurs during construction activities
Impact Extent Local Regional Global
The impact of air pollutant scattering when the maximum concentration will expose the corridor to the main road as far as 10-20 meters.
Impact Magnitude No change Slight Low Medium High
The contribution of motor vehicle exhaust emissions to air quality degradation in material mobilization activities is small, with an average pollutant concentration <1% of the air quality baseline environmental baseline data.
Receptor Sensitivity
Low Low-Medium Medium Medium-High High
The impacts that are caused around the main road or corridor of the main road will disrupt the premises and activities of residents who are less than 100 meters from the main road. Along the 27 km of access road, densely populated settlements are only found approximately 6-7 km between the Cipari quarry - the T-junction.
Impact Severity Slight Low Medium High Very High
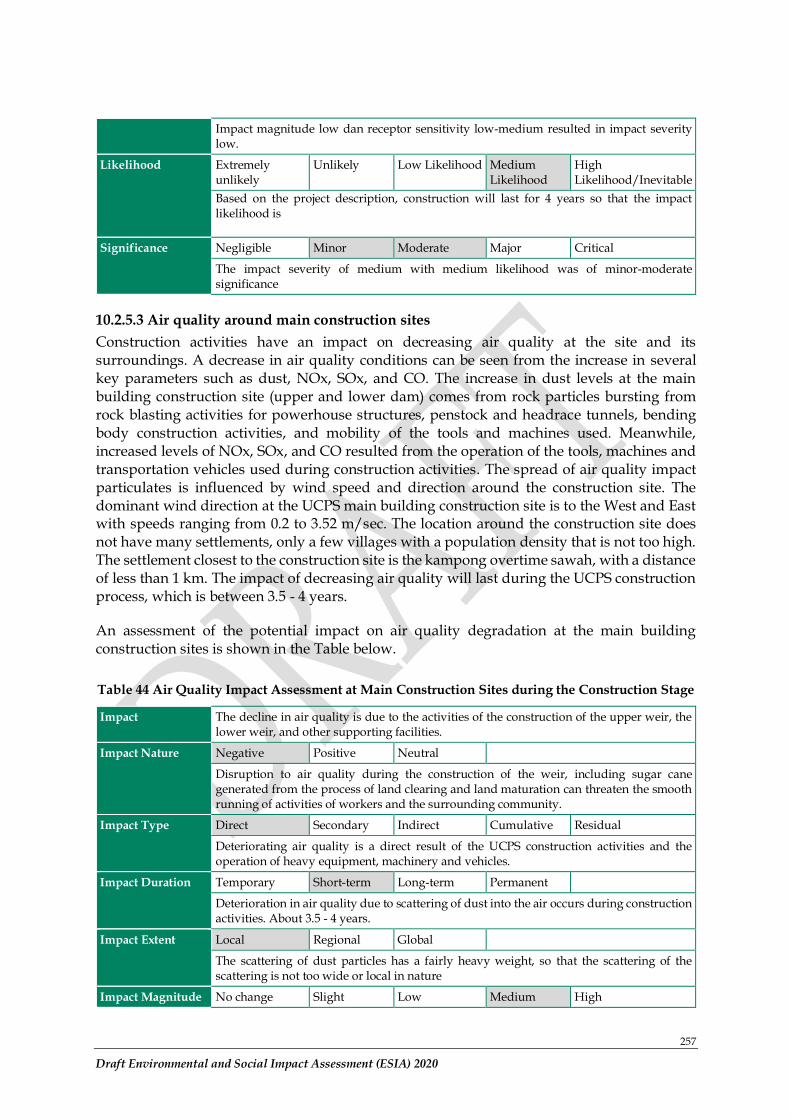
257
Draft Environmental and Social Impact Assessment (ESIA) 2020
Impact magnitude low dan receptor sensitivity low-medium resulted in impact severity low.
Likelihood Extremely unlikely
Unlikely Low Likelihood Medium Likelihood
High Likelihood/Inevitable
Based on the project description, construction will last for 4 years so that the impact likelihood is
Significance Negligible Minor Moderate Major Critical
The impact severity of medium with medium likelihood was of minor-moderate significance
10.2.5.3 Air quality around main construction sites
Construction activities have an impact on decreasing air quality at the site and its surroundings. A decrease in air quality conditions can be seen from the increase in several key parameters such as dust, NOx, SOx, and CO. The increase in dust levels at the main building construction site (upper and lower dam) comes from rock particles bursting from rock blasting activities for powerhouse structures, penstock and headrace tunnels, bending body construction activities, and mobility of the tools and machines used. Meanwhile, increased levels of NOx, SOx, and CO resulted from the operation of the tools, machines and transportation vehicles used during construction activities. The spread of air quality impact particulates is influenced by wind speed and direction around the construction site. The dominant wind direction at the UCPS main building construction site is to the West and East with speeds ranging from 0.2 to 3.52 m/sec. The location around the construction site does not have many settlements, only a few villages with a population density that is not too high. The settlement closest to the construction site is the kampong overtime sawah, with a distance of less than 1 km. The impact of decreasing air quality will last during the UCPS construction process, which is between 3.5 - 4 years.
An assessment of the potential impact on air quality degradation at the main building construction sites is shown in the Table below.
Table 44 Air Quality Impact Assessment at Main Construction Sites during the Construction Stage
Impact The decline in air quality is due to the activities of the construction of the upper weir, the lower weir, and other supporting facilities.
Impact Nature Negative Positive Neutral
Disruption to air quality during the construction of the weir, including sugar cane generated from the process of land clearing and land maturation can threaten the smooth running of activities of workers and the surrounding community.
Impact Type Direct Secondary Indirect Cumulative Residual
Deteriorating air quality is a direct result of the UCPS construction activities and the operation of heavy equipment, machinery and vehicles.
Impact Duration Temporary Short-term Long-term Permanent
Deterioration in air quality due to scattering of dust into the air occurs during construction activities. About 3.5 - 4 years.
Impact Extent Local Regional Global
The scattering of dust particles has a fairly heavy weight, so that the scattering of the scattering is not too wide or local in nature
Impact Magnitude No change Slight Low Medium High
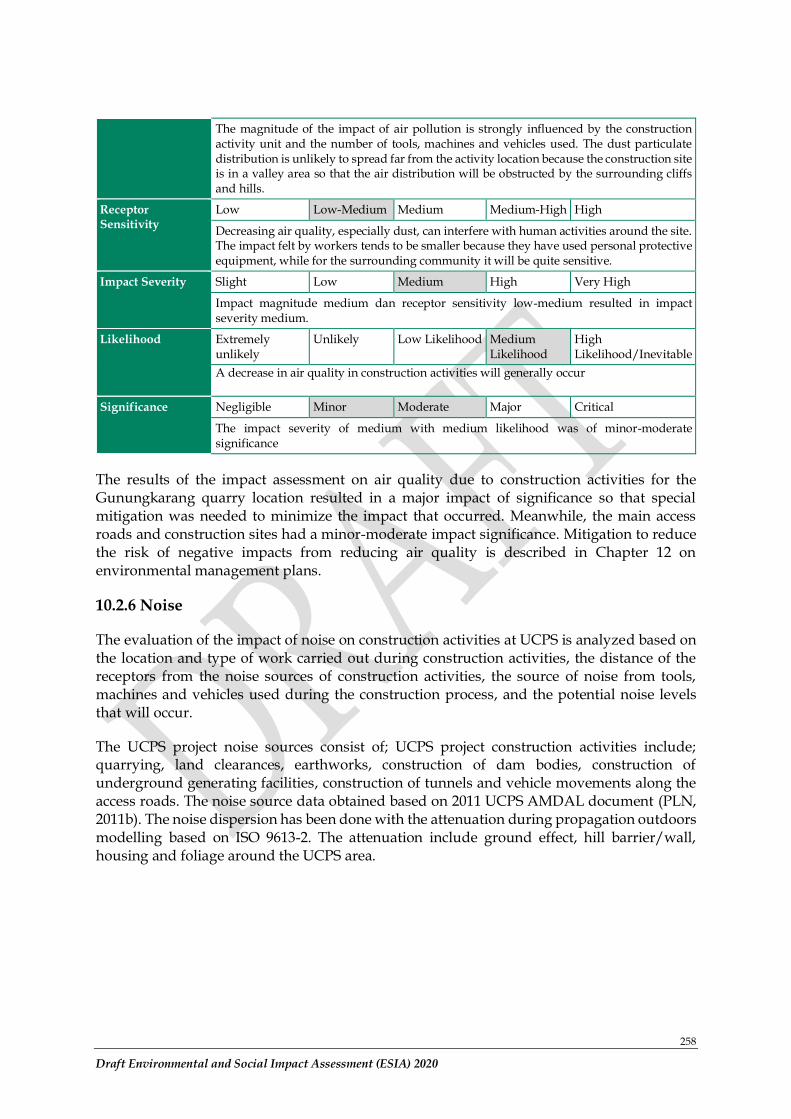
258
Draft Environmental and Social Impact Assessment (ESIA) 2020
The magnitude of the impact of air pollution is strongly influenced by the construction activity unit and the number of tools, machines and vehicles used. The dust particulate distribution is unlikely to spread far from the activity location because the construction site is in a valley area so that the air distribution will be obstructed by the surrounding cliffs and hills.
Receptor Sensitivity
Low Low-Medium Medium Medium-High High
Decreasing air quality, especially dust, can interfere with human activities around the site. The impact felt by workers tends to be smaller because they have used personal protective equipment, while for the surrounding community it will be quite sensitive.
Impact Severity Slight Low Medium High Very High
Impact magnitude medium dan receptor sensitivity low-medium resulted in impact severity medium.
Likelihood Extremely unlikely
Unlikely Low Likelihood Medium Likelihood
High Likelihood/Inevitable
A decrease in air quality in construction activities will generally occur
Significance Negligible Minor Moderate Major Critical
The impact severity of medium with medium likelihood was of minor-moderate significance
The results of the impact assessment on air quality due to construction activities for the Gunungkarang quarry location resulted in a major impact of significance so that special mitigation was needed to minimize the impact that occurred. Meanwhile, the main access roads and construction sites had a minor-moderate impact significance. Mitigation to reduce the risk of negative impacts from reducing air quality is described in Chapter 12 on environmental management plans.
10.2.6 Noise
The evaluation of the impact of noise on construction activities at UCPS is analyzed based on the location and type of work carried out during construction activities, the distance of the receptors from the noise sources of construction activities, the source of noise from tools, machines and vehicles used during the construction process, and the potential noise levels that will occur.
The UCPS project noise sources consist of; UCPS project construction activities include; quarrying, land clearances, earthworks, construction of dam bodies, construction of underground generating facilities, construction of tunnels and vehicle movements along the access roads. The noise source data obtained based on 2011 UCPS AMDAL document (PLN, 2011b). The noise dispersion has been done with the attenuation during propagation outdoors modelling based on ISO 9613-2. The attenuation include ground effect, hill barrier/wall, housing and foliage around the UCPS area.
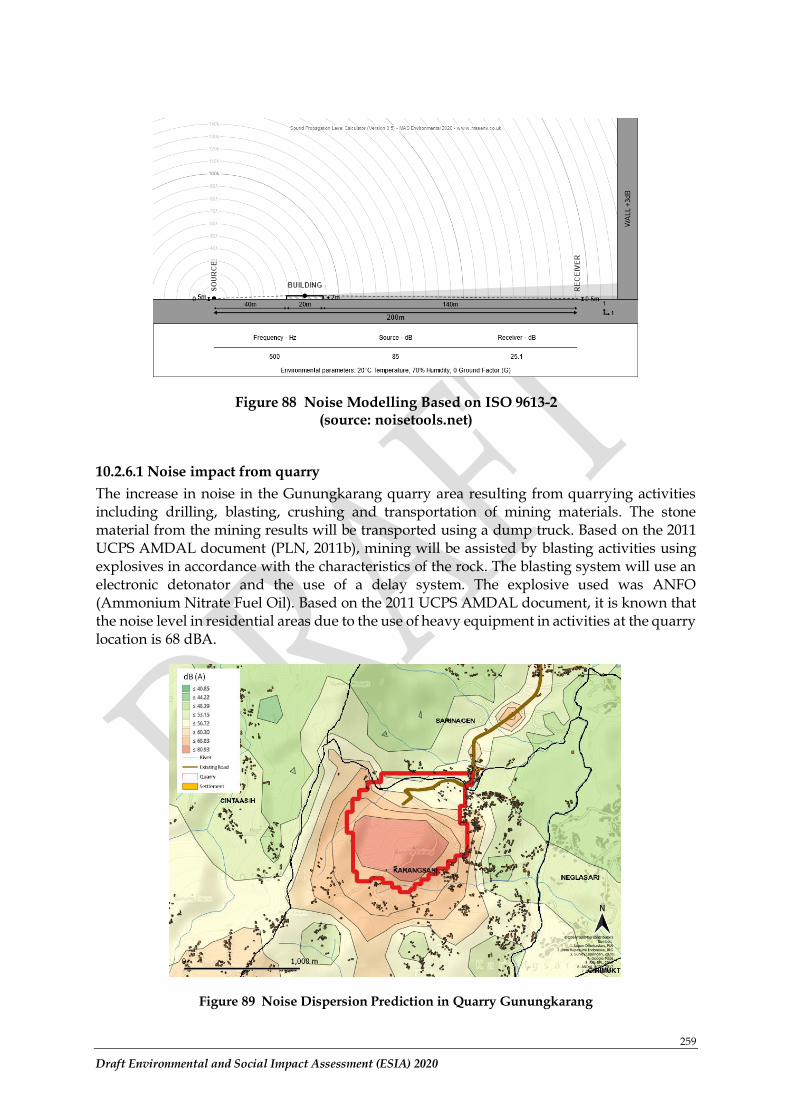
259
Draft Environmental and Social Impact Assessment (ESIA) 2020
Figure 88 Noise Modelling Based on ISO 9613-2 (source: noisetools.net)
10.2.6.1 Noise impact from quarry
The increase in noise in the Gunungkarang quarry area resulting from quarrying activities including drilling, blasting, crushing and transportation of mining materials. The stone material from the mining results will be transported using a dump truck. Based on the 2011 UCPS AMDAL document (PLN, 2011b), mining will be assisted by blasting activities using explosives in accordance with the characteristics of the rock. The blasting system will use an electronic detonator and the use of a delay system. The explosive used was ANFO (Ammonium Nitrate Fuel Oil). Based on the 2011 UCPS AMDAL document, it is known that the noise level in residential areas due to the use of heavy equipment in activities at the quarry location is 68 dBA.
Figure 89 Noise Dispersion Prediction in Quarry Gunungkarang
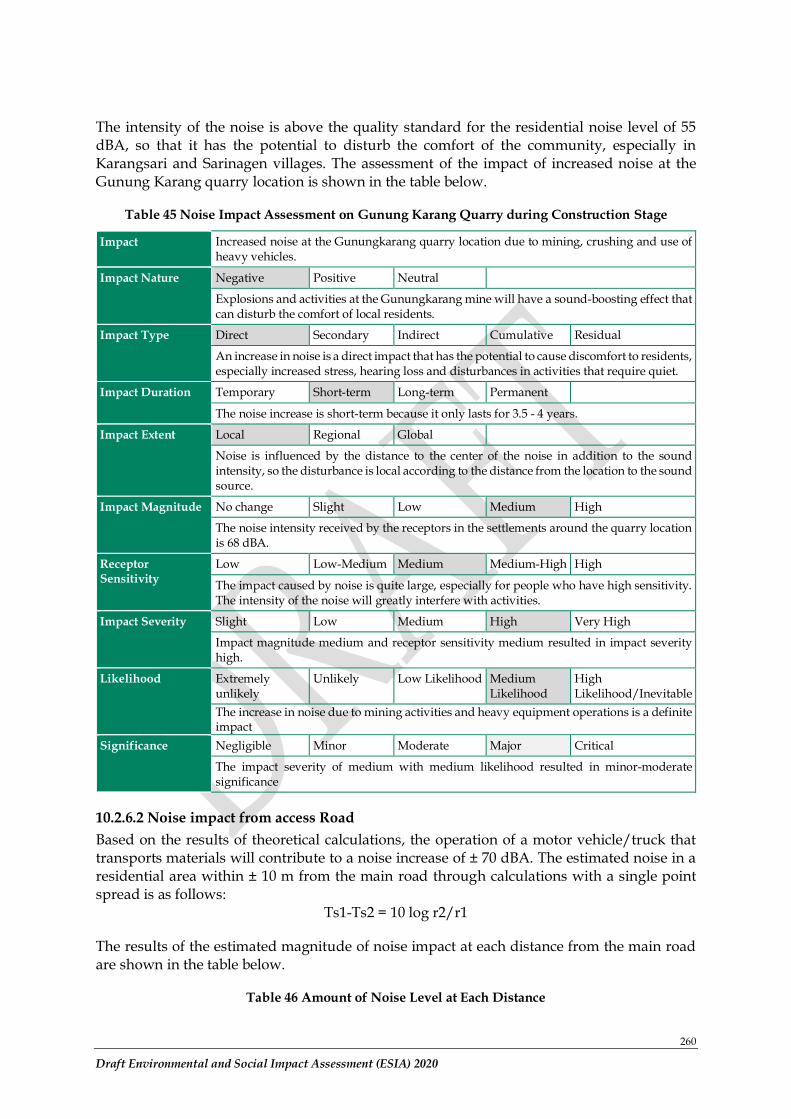
260
Draft Environmental and Social Impact Assessment (ESIA) 2020
The intensity of the noise is above the quality standard for the residential noise level of 55 dBA, so that it has the potential to disturb the comfort of the community, especially in Karangsari and Sarinagen villages. The assessment of the impact of increased noise at the Gunung Karang quarry location is shown in the table below.
Table 45 Noise Impact Assessment on Gunung Karang Quarry during Construction Stage
Impact Increased noise at the Gunungkarang quarry location due to mining, crushing and use of heavy vehicles.
Impact Nature Negative Positive Neutral
Explosions and activities at the Gunungkarang mine will have a sound-boosting effect that can disturb the comfort of local residents.
Impact Type Direct Secondary Indirect Cumulative Residual
An increase in noise is a direct impact that has the potential to cause discomfort to residents, especially increased stress, hearing loss and disturbances in activities that require quiet.
Impact Duration Temporary Short-term Long-term Permanent
The noise increase is short-term because it only lasts for 3.5 - 4 years.
Impact Extent Local Regional Global
Noise is influenced by the distance to the center of the noise in addition to the sound intensity, so the disturbance is local according to the distance from the location to the sound source.
Impact Magnitude No change Slight Low Medium High
The noise intensity received by the receptors in the settlements around the quarry location is 68 dBA.
Receptor Sensitivity
Low Low-Medium Medium Medium-High High
The impact caused by noise is quite large, especially for people who have high sensitivity. The intensity of the noise will greatly interfere with activities.
Impact Severity Slight Low Medium High Very High
Impact magnitude medium and receptor sensitivity medium resulted in impact severity high.
Likelihood Extremely unlikely
Unlikely Low Likelihood Medium Likelihood
High Likelihood/Inevitable
The increase in noise due to mining activities and heavy equipment operations is a definite impact
Significance Negligible Minor Moderate Major Critical
The impact severity of medium with medium likelihood resulted in minor-moderate significance
10.2.6.2 Noise impact from access Road
Based on the results of theoretical calculations, the operation of a motor vehicle/truck that transports materials will contribute to a noise increase of ± 70 dBA. The estimated noise in a residential area within ± 10 m from the main road through calculations with a single point spread is as follows:
Ts1-Ts2 = 10 log r2/r1
The results of the estimated magnitude of noise impact at each distance from the main road are shown in the table below.
Table 46 Amount of Noise Level at Each Distance
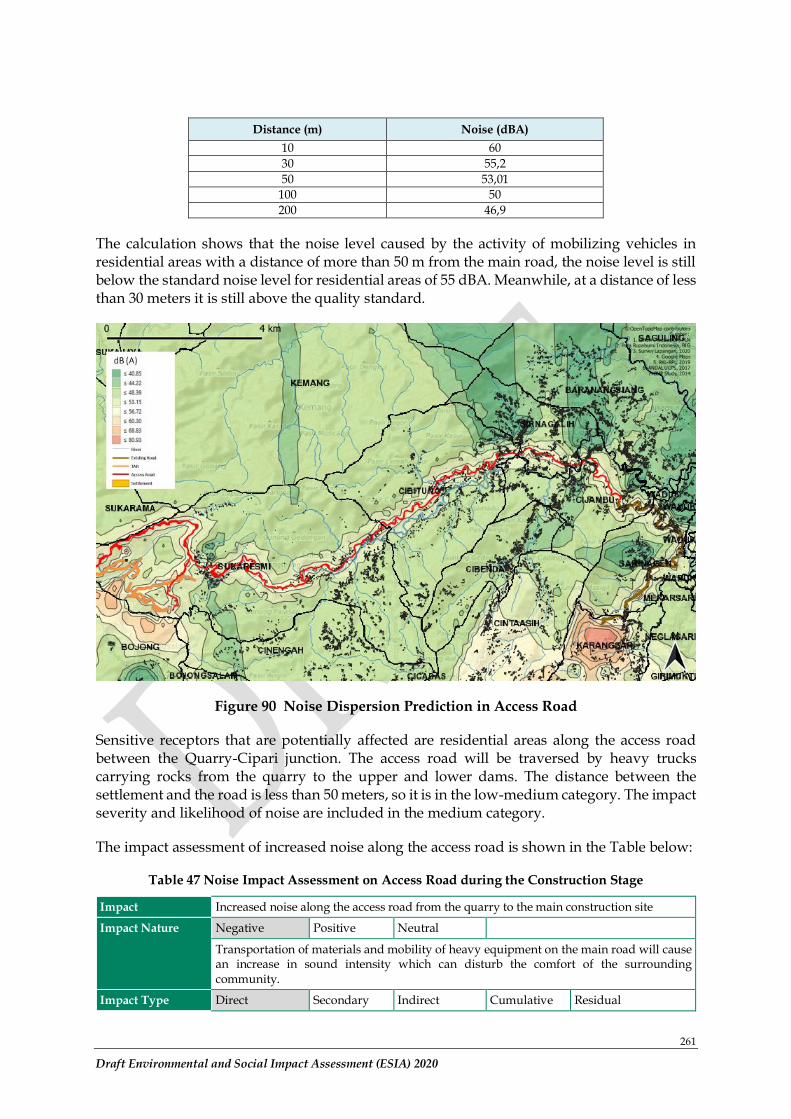
261
Draft Environmental and Social Impact Assessment (ESIA) 2020
Distance (m) Noise (dBA)
10 60
30 55,2
50 53,01
100 50
200 46,9
The calculation shows that the noise level caused by the activity of mobilizing vehicles in residential areas with a distance of more than 50 m from the main road, the noise level is still below the standard noise level for residential areas of 55 dBA. Meanwhile, at a distance of less than 30 meters it is still above the quality standard.
Figure 90 Noise Dispersion Prediction in Access Road
Sensitive receptors that are potentially affected are residential areas along the access road between the Quarry-Cipari junction. The access road will be traversed by heavy trucks carrying rocks from the quarry to the upper and lower dams. The distance between the settlement and the road is less than 50 meters, so it is in the low-medium category. The impact severity and likelihood of noise are included in the medium category.
The impact assessment of increased noise along the access road is shown in the Table below:
Table 47 Noise Impact Assessment on Access Road during the Construction Stage
Impact Increased noise along the access road from the quarry to the main construction site
Impact Nature Negative Positive Neutral
Transportation of materials and mobility of heavy equipment on the main road will cause an increase in sound intensity which can disturb the comfort of the surrounding community.
Impact Type Direct Secondary Indirect Cumulative Residual
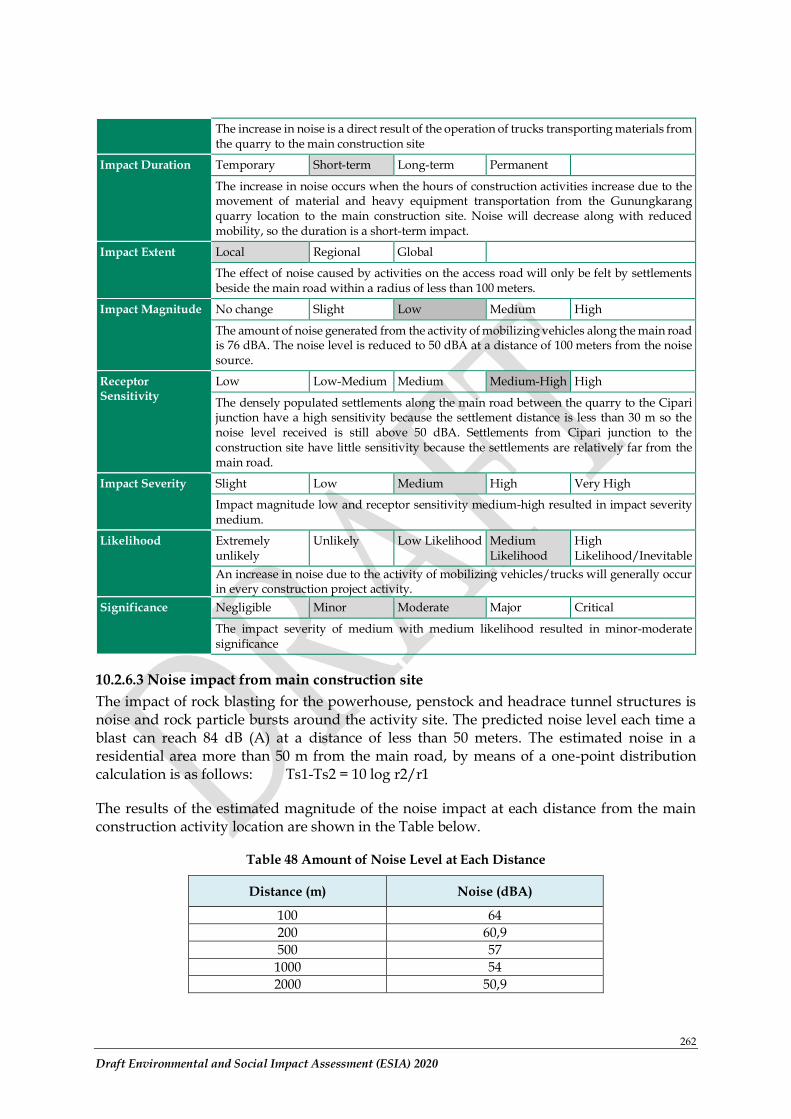
262
Draft Environmental and Social Impact Assessment (ESIA) 2020
The increase in noise is a direct result of the operation of trucks transporting materials from the quarry to the main construction site
Impact Duration Temporary Short-term Long-term Permanent
The increase in noise occurs when the hours of construction activities increase due to the movement of material and heavy equipment transportation from the Gunungkarang quarry location to the main construction site. Noise will decrease along with reduced mobility, so the duration is a short-term impact.
Impact Extent Local Regional Global
The effect of noise caused by activities on the access road will only be felt by settlements beside the main road within a radius of less than 100 meters.
Impact Magnitude No change Slight Low Medium High
The amount of noise generated from the activity of mobilizing vehicles along the main road is 76 dBA. The noise level is reduced to 50 dBA at a distance of 100 meters from the noise source.
Receptor Sensitivity
Low Low-Medium Medium Medium-High High
The densely populated settlements along the main road between the quarry to the Cipari junction have a high sensitivity because the settlement distance is less than 30 m so the noise level received is still above 50 dBA. Settlements from Cipari junction to the construction site have little sensitivity because the settlements are relatively far from the main road.
Impact Severity Slight Low Medium High Very High
Impact magnitude low and receptor sensitivity medium-high resulted in impact severity medium.
Likelihood Extremely unlikely
Unlikely Low Likelihood Medium Likelihood
High Likelihood/Inevitable
An increase in noise due to the activity of mobilizing vehicles/trucks will generally occur in every construction project activity.
Significance Negligible Minor Moderate Major Critical
The impact severity of medium with medium likelihood resulted in minor-moderate significance
10.2.6.3 Noise impact from main construction site
The impact of rock blasting for the powerhouse, penstock and headrace tunnel structures is noise and rock particle bursts around the activity site. The predicted noise level each time a blast can reach 84 dB (A) at a distance of less than 50 meters. The estimated noise in a residential area more than 50 m from the main road, by means of a one-point distribution calculation is as follows: Ts1-Ts2 = 10 log r2/r1
The results of the estimated magnitude of the noise impact at each distance from the main construction activity location are shown in the Table below.
Table 48 Amount of Noise Level at Each Distance
Distance (m) Noise (dBA)
100 64
200 60,9
500 57
1000 54
2000 50,9
263
Draft Environmental and Social Impact Assessment (ESIA) 2020
Figure 91 Noise Dispersion Prediction in Main Construction
The increase in ambient air noise will take place at the activity location, especially at the beginning of tunneling because it is carried out on the outer surface of the rock. Meanwhile, in the next stage, the blasting was carried out in a tunnel so that the noise did not disturb the comfort of the residents who lived about 1 km from the location of the activity (Lembur Sawah Village). The impact felt by workers is relatively small because they have been equipped with personal protection equipment.
The increase in noise due to construction activities has a negative impact, especially for human and animal receptors. The impact of noise is directly during the activity. The duration of the impact of noise is included in the short-term in only about 3.5 - 4 years. The noise level resulting from UCPS construction activities is local in nature only affects areas near the construction site. the magnitude of the impact of the noise will decrease as the distance of the receptors gets further. The intensity of the impact will be continuous as long as the supporting machine construction activities take place.
The impact assessment of increased noise at major construction sites is shown in the Table below:
Table 49 Noise Impact Assessment at Main Construction Sites during the Construction Stage
Impact Increased noise levels due to activities in the construction of the upper weir, the lower weir, and other supporting facilities.
Impact Nature Negative Positive Neutral
Noise at construction sites is a hotspot for UCPS activity which causes noise problems that can interfere with receptors such as humans and animals.
264
Draft Environmental and Social Impact Assessment (ESIA) 2020
Impact Type Direct Secondary Indirect Cumulative Residual
Increased noise is a direct result of operating tools, machinery and heavy vehicles at major construction sites.
Impact Duration Temporary Short-term Long-term Permanent
It is estimated that construction activities will last for 3.5 - 4 years. The increase in noise occurs during the hours of construction activities and will decrease with the reduction in activities, so that the duration is a short-term impact.
Impact Extent Local Regional Global
The noise effect caused by the main construction activities is local in nature because based on the calculation of the noise level which is still above the quality standard, it is at a radius of 500 meters. More than 500 meters the noise level is below the quality standard for settlements.
Impact Magnitude No change Slight Low Medium High
The amount of noise generated from the main construction activities is 84 dBA. The noise level is reduced to 57 dBA at a distance of 500 meters from the noise source. And at a distance of 1000 meters of 54 dBA (below the quality standard for settlements).
Receptor Sensitivity
Low Low-Medium Medium Medium-High High
In general, at the main UCPS construction site there are not many residents living in the area. However, there are settlements located close to the construction sites, namely Lembur sawah and Pasirlaja hamlets. Of concern is that the main construction site is located close to animal habitats which may be disturbed by increased noise. So that the receptor sensitivity is of medium-high value
Impact Severity Slight Low Medium High Very High
Impact magnitude low and receptor sensitivity medium-high resulted in impact severity medium.
Likelihood Extremely unlikely
Unlikely Low Likelihood Medium Likelihood
High Likelihood/Inevitable
An increase in noise due to the operation of vehicles, tools and machines will generally occur in every construction project activity.
Significance Negligible Minor Moderate Major Critical
The impact severity of medium with medium likelihood resulted in minor-moderate significance
10.2.6.4 Noise impact from Transmission Line
The increase in noise during the construction activities for the high voltage 500kV transmission line resulted from the mobilization of tools and materials, land clearing activities, tower construction activities (erection of tower), and stringing activities. In general, the impact of noise arising from transmission line construction activities is small or negligible. The potential impact of noise that may result from mobilizing tools and materials is due to the use of transport vehicles, however, most of the tower site locations are in areas that are difficult to reach by 4-wheeled vehicles, causing vehicle use to be limited to the outer area, not to the tower site location. Thus, the noise level is small. Likewise, with construction activities, because access limitations are carried out using medium tools and machines so that the resulting noise is not so great. Potential receptors for impact are residents who live on the side of the road through which the project vehicle activities are used. The area of the impact distribution is limited along the traffic path of the project vehicle and along the transmission line. The duration of the impact lasts intermittently during construction activities.
The impact assessment of increased noise from transmission line construction activities is shown in the Table below:
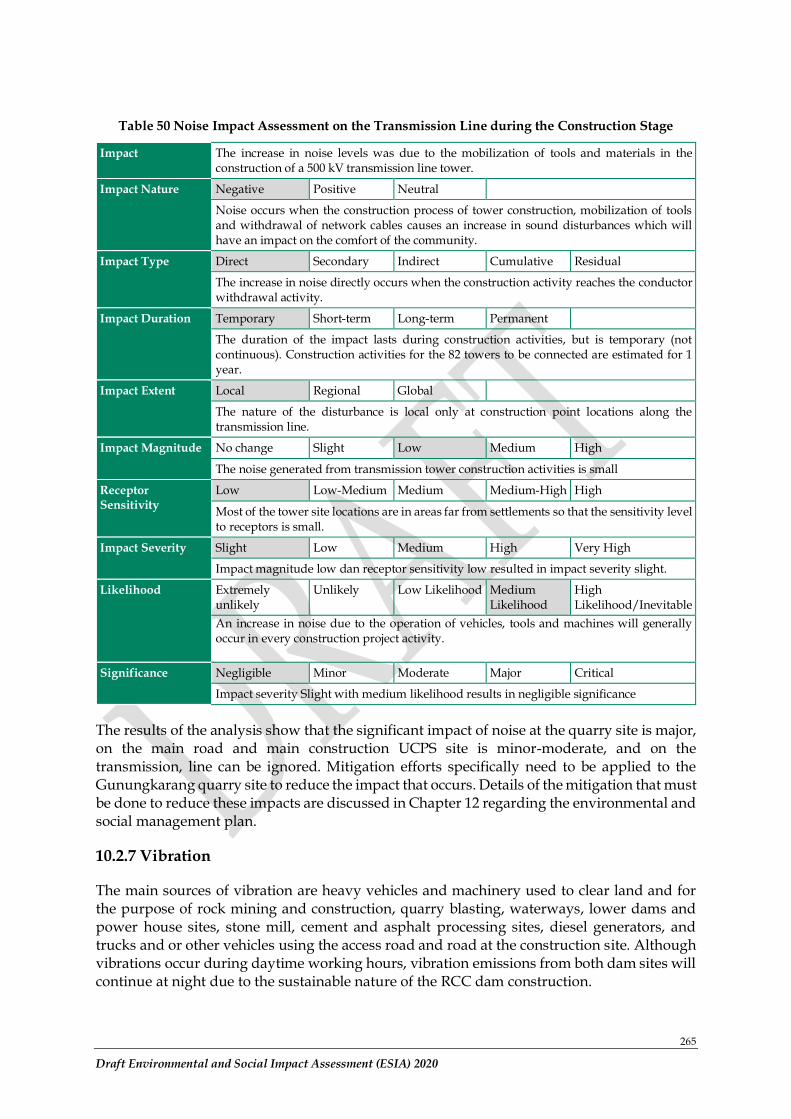
265
Draft Environmental and Social Impact Assessment (ESIA) 2020
Table 50 Noise Impact Assessment on the Transmission Line during the Construction Stage
Impact The increase in noise levels was due to the mobilization of tools and materials in the construction of a 500 kV transmission line tower.
Impact Nature Negative Positive Neutral
Noise occurs when the construction process of tower construction, mobilization of tools and withdrawal of network cables causes an increase in sound disturbances which will have an impact on the comfort of the community.
Impact Type Direct Secondary Indirect Cumulative Residual
The increase in noise directly occurs when the construction activity reaches the conductor withdrawal activity.
Impact Duration Temporary Short-term Long-term Permanent
The duration of the impact lasts during construction activities, but is temporary (not continuous). Construction activities for the 82 towers to be connected are estimated for 1 year.
Impact Extent Local Regional Global
The nature of the disturbance is local only at construction point locations along the transmission line.
Impact Magnitude No change Slight Low Medium High
The noise generated from transmission tower construction activities is small
Receptor Sensitivity
Low Low-Medium Medium Medium-High High
Most of the tower site locations are in areas far from settlements so that the sensitivity level to receptors is small.
Impact Severity Slight Low Medium High Very High
Impact magnitude low dan receptor sensitivity low resulted in impact severity slight.
Likelihood Extremely unlikely
Unlikely Low Likelihood Medium Likelihood
High Likelihood/Inevitable
An increase in noise due to the operation of vehicles, tools and machines will generally occur in every construction project activity.
Significance Negligible Minor Moderate Major Critical
Impact severity Slight with medium likelihood results in negligible significance
The results of the analysis show that the significant impact of noise at the quarry site is major, on the main road and main construction UCPS site is minor-moderate, and on the transmission, line can be ignored. Mitigation efforts specifically need to be applied to the Gunungkarang quarry site to reduce the impact that occurs. Details of the mitigation that must be done to reduce these impacts are discussed in Chapter 12 regarding the environmental and social management plan.
10.2.7 Vibration
The main sources of vibration are heavy vehicles and machinery used to clear land and for the purpose of rock mining and construction, quarry blasting, waterways, lower dams and power house sites, stone mill, cement and asphalt processing sites, diesel generators, and trucks and or other vehicles using the access road and road at the construction site. Although vibrations occur during daytime working hours, vibration emissions from both dam sites will continue at night due to the sustainable nature of the RCC dam construction.
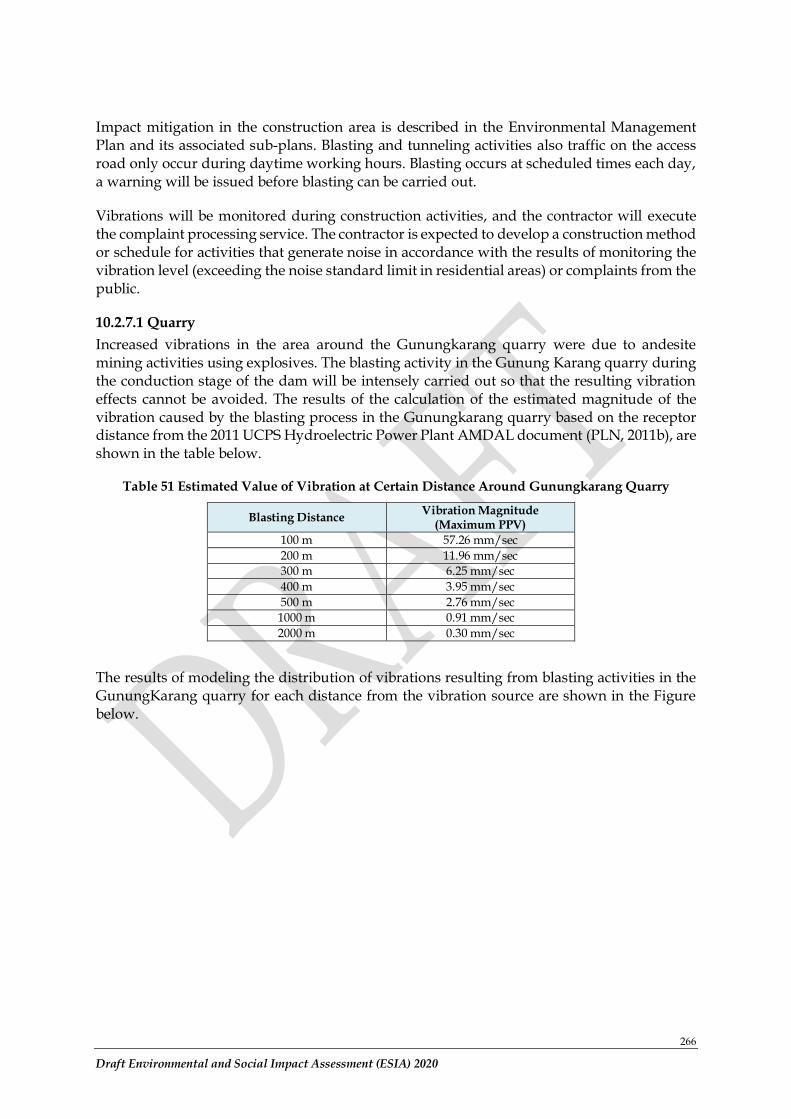
266
Draft Environmental and Social Impact Assessment (ESIA) 2020
Impact mitigation in the construction area is described in the Environmental Management Plan and its associated sub-plans. Blasting and tunneling activities also traffic on the access road only occur during daytime working hours. Blasting occurs at scheduled times each day, a warning will be issued before blasting can be carried out.
Vibrations will be monitored during construction activities, and the contractor will execute the complaint processing service. The contractor is expected to develop a construction method or schedule for activities that generate noise in accordance with the results of monitoring the vibration level (exceeding the noise standard limit in residential areas) or complaints from the public.
10.2.7.1 Quarry
Increased vibrations in the area around the Gunungkarang quarry were due to andesite mining activities using explosives. The blasting activity in the Gunung Karang quarry during the conduction stage of the dam will be intensely carried out so that the resulting vibration effects cannot be avoided. The results of the calculation of the estimated magnitude of the vibration caused by the blasting process in the Gunungkarang quarry based on the receptor distance from the 2011 UCPS Hydroelectric Power Plant AMDAL document (PLN, 2011b), are shown in the table below.
Table 51 Estimated Value of Vibration at Certain Distance Around Gunungkarang Quarry
Blasting Distance Vibration Magnitude
(Maximum PPV)
100 m 57.26 mm/sec
200 m 11.96 mm/sec
300 m 6.25 mm/sec
400 m 3.95 mm/sec
500 m 2.76 mm/sec
1000 m 0.91 mm/sec
2000 m 0.30 mm/sec
The results of modeling the distribution of vibrations resulting from blasting activities in the GunungKarang quarry for each distance from the vibration source are shown in the Figure below.
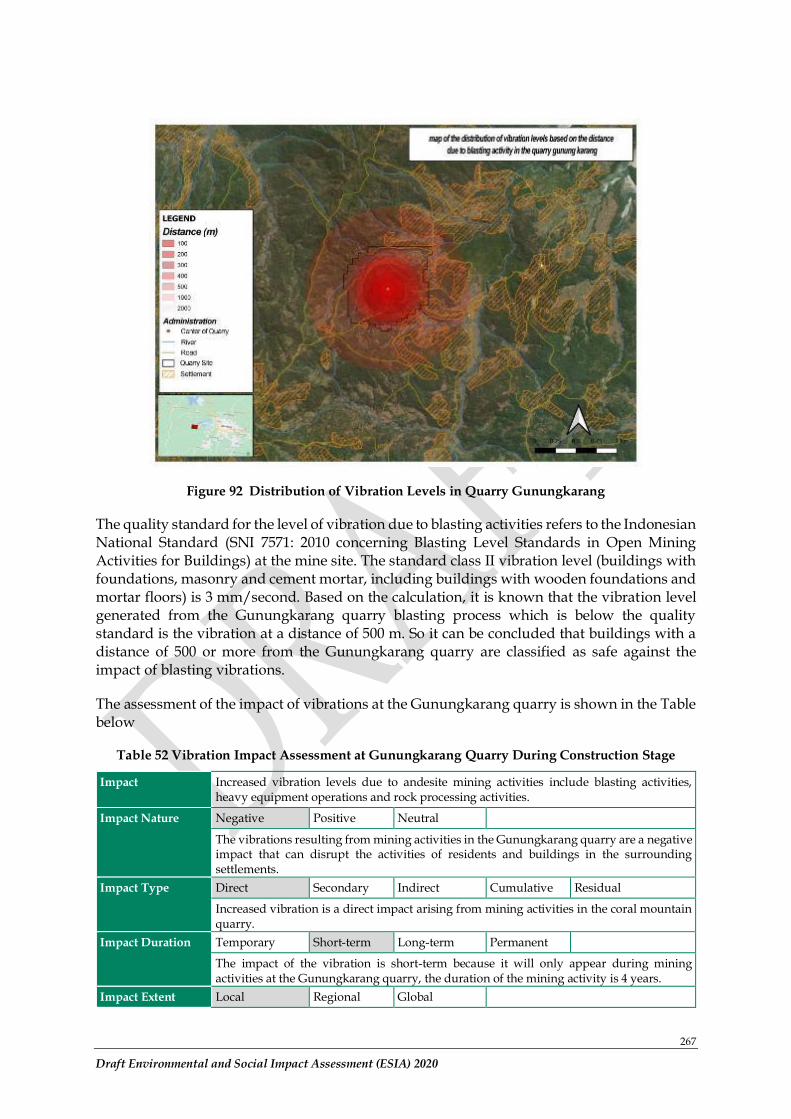
267
Draft Environmental and Social Impact Assessment (ESIA) 2020
Figure 92 Distribution of Vibration Levels in Quarry Gunungkarang
The quality standard for the level of vibration due to blasting activities refers to the Indonesian National Standard (SNI 7571: 2010 concerning Blasting Level Standards in Open Mining Activities for Buildings) at the mine site. The standard class II vibration level (buildings with foundations, masonry and cement mortar, including buildings with wooden foundations and mortar floors) is 3 mm/second. Based on the calculation, it is known that the vibration level generated from the Gunungkarang quarry blasting process which is below the quality standard is the vibration at a distance of 500 m. So it can be concluded that buildings with a distance of 500 or more from the Gunungkarang quarry are classified as safe against the impact of blasting vibrations.
The assessment of the impact of vibrations at the Gunungkarang quarry is shown in the Table below
Table 52 Vibration Impact Assessment at Gunungkarang Quarry During Construction Stage
Impact Increased vibration levels due to andesite mining activities include blasting activities, heavy equipment operations and rock processing activities.
Impact Nature Negative Positive Neutral
The vibrations resulting from mining activities in the Gunungkarang quarry are a negative impact that can disrupt the activities of residents and buildings in the surrounding settlements.
Impact Type Direct Secondary Indirect Cumulative Residual
Increased vibration is a direct impact arising from mining activities in the coral mountain quarry.
Impact Duration Temporary Short-term Long-term Permanent
The impact of the vibration is short-term because it will only appear during mining activities at the Gunungkarang quarry, the duration of the mining activity is 4 years.
Impact Extent Local Regional Global
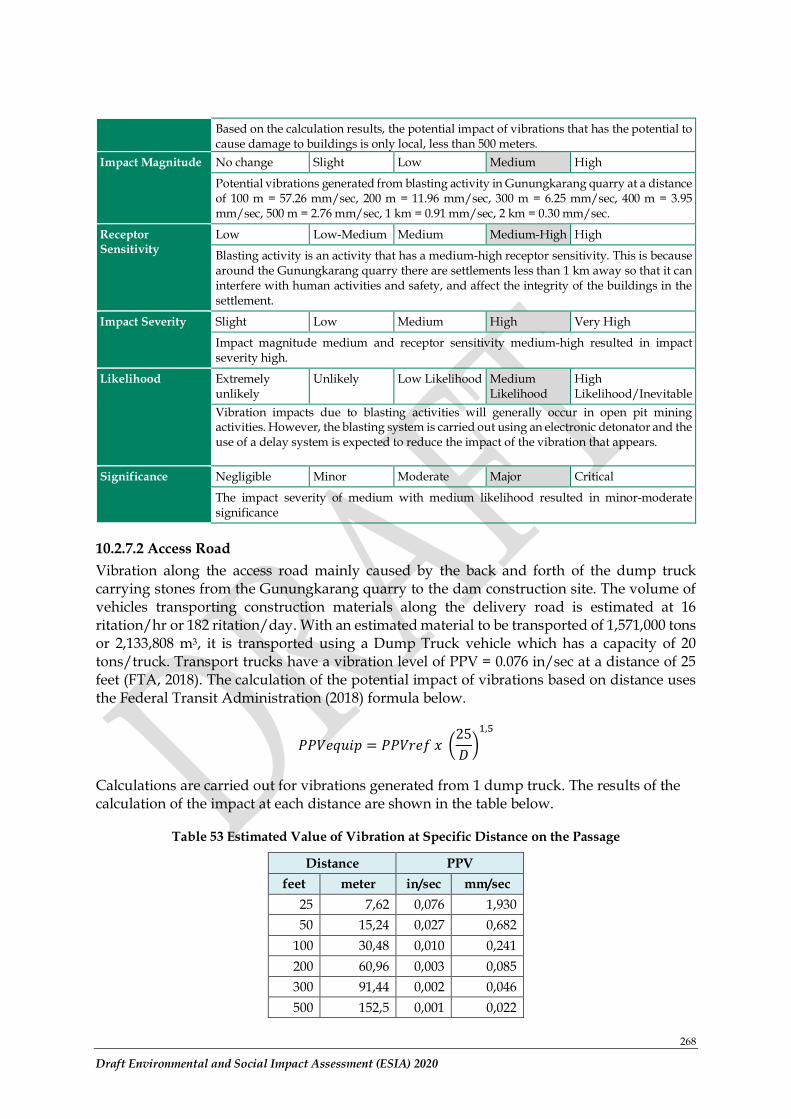
268
Draft Environmental and Social Impact Assessment (ESIA) 2020
Based on the calculation results, the potential impact of vibrations that has the potential to cause damage to buildings is only local, less than 500 meters.
Impact Magnitude No change Slight Low Medium High
Potential vibrations generated from blasting activity in Gunungkarang quarry at a distance of 100 m = 57.26 mm/sec, 200 m = 11.96 mm/sec, 300 m = 6.25 mm/sec, 400 m = 3.95 mm/sec, 500 m = 2.76 mm/sec, 1 km = 0.91 mm/sec, 2 km = 0.30 mm/sec.
Receptor Sensitivity
Low Low-Medium Medium Medium-High High
Blasting activity is an activity that has a medium-high receptor sensitivity. This is because around the Gunungkarang quarry there are settlements less than 1 km away so that it can interfere with human activities and safety, and affect the integrity of the buildings in the settlement.
Impact Severity Slight Low Medium High Very High
Impact magnitude medium and receptor sensitivity medium-high resulted in impact severity high.
Likelihood Extremely unlikely
Unlikely Low Likelihood Medium Likelihood
High Likelihood/Inevitable
Vibration impacts due to blasting activities will generally occur in open pit mining activities. However, the blasting system is carried out using an electronic detonator and the use of a delay system is expected to reduce the impact of the vibration that appears.
Significance Negligible Minor Moderate Major Critical
The impact severity of medium with medium likelihood resulted in minor-moderate significance
10.2.7.2 Access Road
Vibration along the access road mainly caused by the back and forth of the dump truck carrying stones from the Gunungkarang quarry to the dam construction site. The volume of vehicles transporting construction materials along the delivery road is estimated at 16 ritation/hr or 182 ritation/day. With an estimated material to be transported of 1,571,000 tons or 2,133,808 m3, it is transported using a Dump Truck vehicle which has a capacity of 20 tons/truck. Transport trucks have a vibration level of PPV = 0.076 in/sec at a distance of 25 feet (FTA, 2018). The calculation of the potential impact of vibrations based on distance uses the Federal Transit Administration (2018) formula below.
𝑃𝑃𝑉𝑒𝑞𝑢𝑖𝑝 = 𝑃𝑃𝑉𝑟𝑒𝑓 𝑥 (25
𝐷)
1,5
Calculations are carried out for vibrations generated from 1 dump truck. The results of the calculation of the impact at each distance are shown in the table below.
Table 53 Estimated Value of Vibration at Specific Distance on the Passage
Distance PPV
feet meter in/sec mm/sec
25 7,62 0,076 1,930
50 15,24 0,027 0,682
100 30,48 0,010 0,241
200 60,96 0,003 0,085
300 91,44 0,002 0,046
500 152,5 0,001 0,022
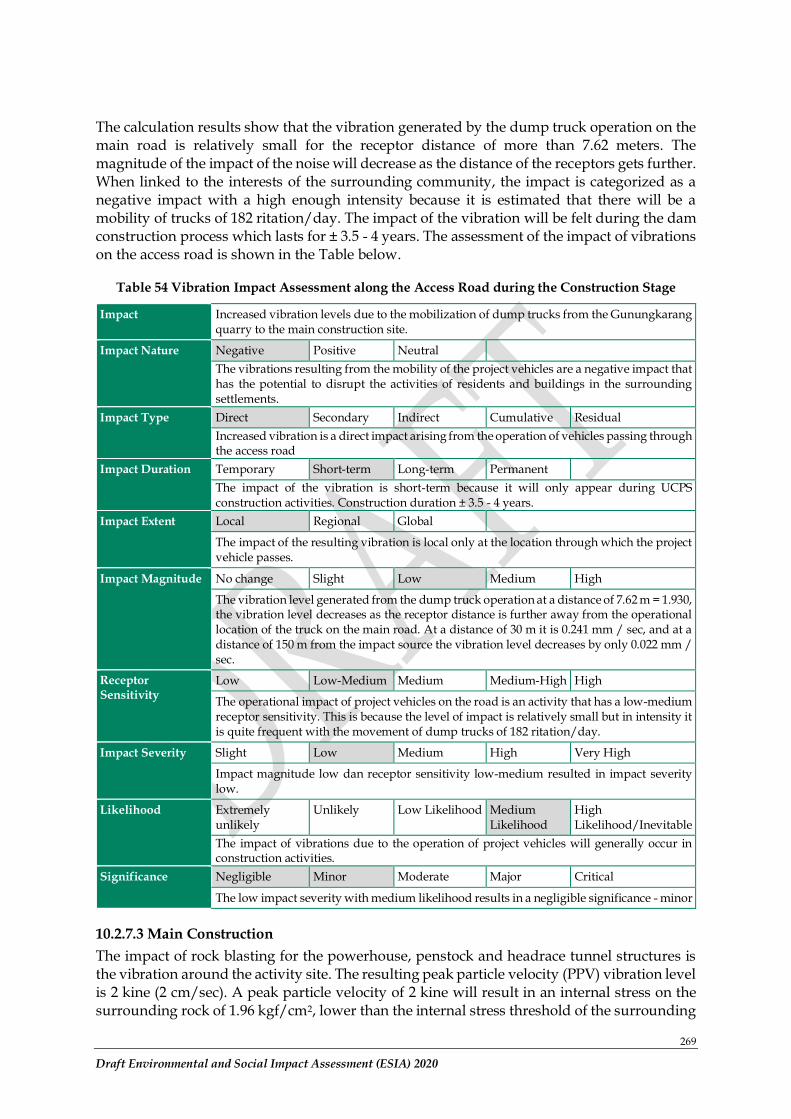
269
Draft Environmental and Social Impact Assessment (ESIA) 2020
The calculation results show that the vibration generated by the dump truck operation on the main road is relatively small for the receptor distance of more than 7.62 meters. The magnitude of the impact of the noise will decrease as the distance of the receptors gets further. When linked to the interests of the surrounding community, the impact is categorized as a negative impact with a high enough intensity because it is estimated that there will be a mobility of trucks of 182 ritation/day. The impact of the vibration will be felt during the dam construction process which lasts for ± 3.5 - 4 years. The assessment of the impact of vibrations on the access road is shown in the Table below.
Table 54 Vibration Impact Assessment along the Access Road during the Construction Stage
Impact Increased vibration levels due to the mobilization of dump trucks from the Gunungkarang quarry to the main construction site.
Impact Nature Negative Positive Neutral
The vibrations resulting from the mobility of the project vehicles are a negative impact that has the potential to disrupt the activities of residents and buildings in the surrounding settlements.
Impact Type Direct Secondary Indirect Cumulative Residual
Increased vibration is a direct impact arising from the operation of vehicles passing through the access road
Impact Duration Temporary Short-term Long-term Permanent
The impact of the vibration is short-term because it will only appear during UCPS construction activities. Construction duration ± 3.5 - 4 years.
Impact Extent Local Regional Global
The impact of the resulting vibration is local only at the location through which the project vehicle passes.
Impact Magnitude No change Slight Low Medium High
The vibration level generated from the dump truck operation at a distance of 7.62 m = 1.930, the vibration level decreases as the receptor distance is further away from the operational location of the truck on the main road. At a distance of 30 m it is 0.241 mm / sec, and at a distance of 150 m from the impact source the vibration level decreases by only 0.022 mm / sec.
Receptor Sensitivity
Low Low-Medium Medium Medium-High High
The operational impact of project vehicles on the road is an activity that has a low-medium receptor sensitivity. This is because the level of impact is relatively small but in intensity it is quite frequent with the movement of dump trucks of 182 ritation/day.
Impact Severity Slight Low Medium High Very High
Impact magnitude low dan receptor sensitivity low-medium resulted in impact severity low.
Likelihood Extremely unlikely
Unlikely Low Likelihood Medium Likelihood
High Likelihood/Inevitable
The impact of vibrations due to the operation of project vehicles will generally occur in construction activities.
Significance Negligible Minor Moderate Major Critical
The low impact severity with medium likelihood results in a negligible significance - minor
10.2.7.3 Main Construction
The impact of rock blasting for the powerhouse, penstock and headrace tunnel structures is the vibration around the activity site. The resulting peak particle velocity (PPV) vibration level is 2 kine (2 cm/sec). A peak particle velocity of 2 kine will result in an internal stress on the surrounding rock of 1.96 kgf/cm2, lower than the internal stress threshold of the surrounding
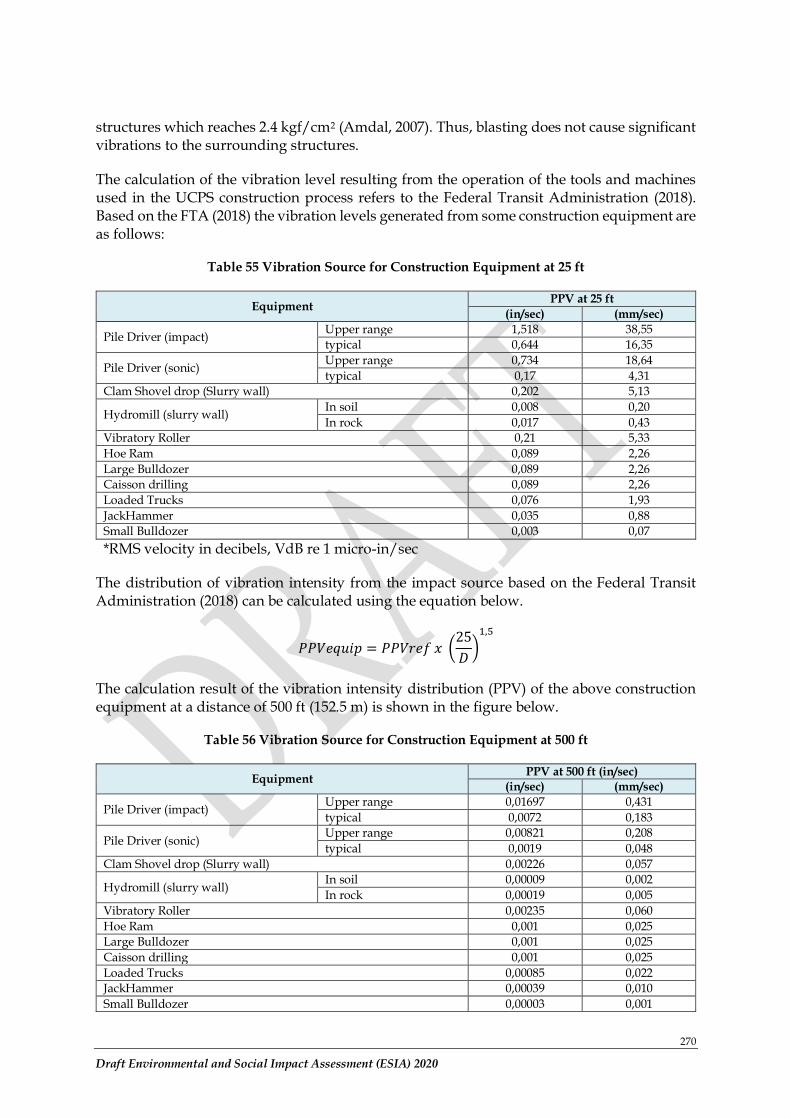
270
Draft Environmental and Social Impact Assessment (ESIA) 2020
structures which reaches 2.4 kgf/cm2 (Amdal, 2007). Thus, blasting does not cause significant vibrations to the surrounding structures.
The calculation of the vibration level resulting from the operation of the tools and machines used in the UCPS construction process refers to the Federal Transit Administration (2018). Based on the FTA (2018) the vibration levels generated from some construction equipment are as follows:
Table 55 Vibration Source for Construction Equipment at 25 ft
Equipment PPV at 25 ft
(in/sec) (mm/sec)
Pile Driver (impact) Upper range 1,518 38,55
typical 0,644 16,35
Pile Driver (sonic) Upper range 0,734 18,64
typical 0,17 4,31
Clam Shovel drop (Slurry wall) 0,202 5,13
Hydromill (slurry wall) In soil 0,008 0,20
In rock 0,017 0,43
Vibratory Roller 0,21 5,33
Hoe Ram 0,089 2,26
Large Bulldozer 0,089 2,26
Caisson drilling 0,089 2,26
Loaded Trucks 0,076 1,93
JackHammer 0,035 0,88
Small Bulldozer 0,003 0,07
*RMS velocity in decibels, VdB re 1 micro-in/sec
The distribution of vibration intensity from the impact source based on the Federal Transit Administration (2018) can be calculated using the equation below.
𝑃𝑃𝑉𝑒𝑞𝑢𝑖𝑝 = 𝑃𝑃𝑉𝑟𝑒𝑓 𝑥 (25
𝐷)
1,5
The calculation result of the vibration intensity distribution (PPV) of the above construction equipment at a distance of 500 ft (152.5 m) is shown in the figure below.
Table 56 Vibration Source for Construction Equipment at 500 ft
Equipment PPV at 500 ft (in/sec)
(in/sec) (mm/sec)
Pile Driver (impact) Upper range 0,01697 0,431
typical 0,0072 0,183
Pile Driver (sonic) Upper range 0,00821 0,208
typical 0,0019 0,048
Clam Shovel drop (Slurry wall) 0,00226 0,057
Hydromill (slurry wall) In soil 0,00009 0,002
In rock 0,00019 0,005
Vibratory Roller 0,00235 0,060
Hoe Ram 0,001 0,025
Large Bulldozer 0,001 0,025
Caisson drilling 0,001 0,025
Loaded Trucks 0,00085 0,022
JackHammer 0,00039 0,010
Small Bulldozer 0,00003 0,001
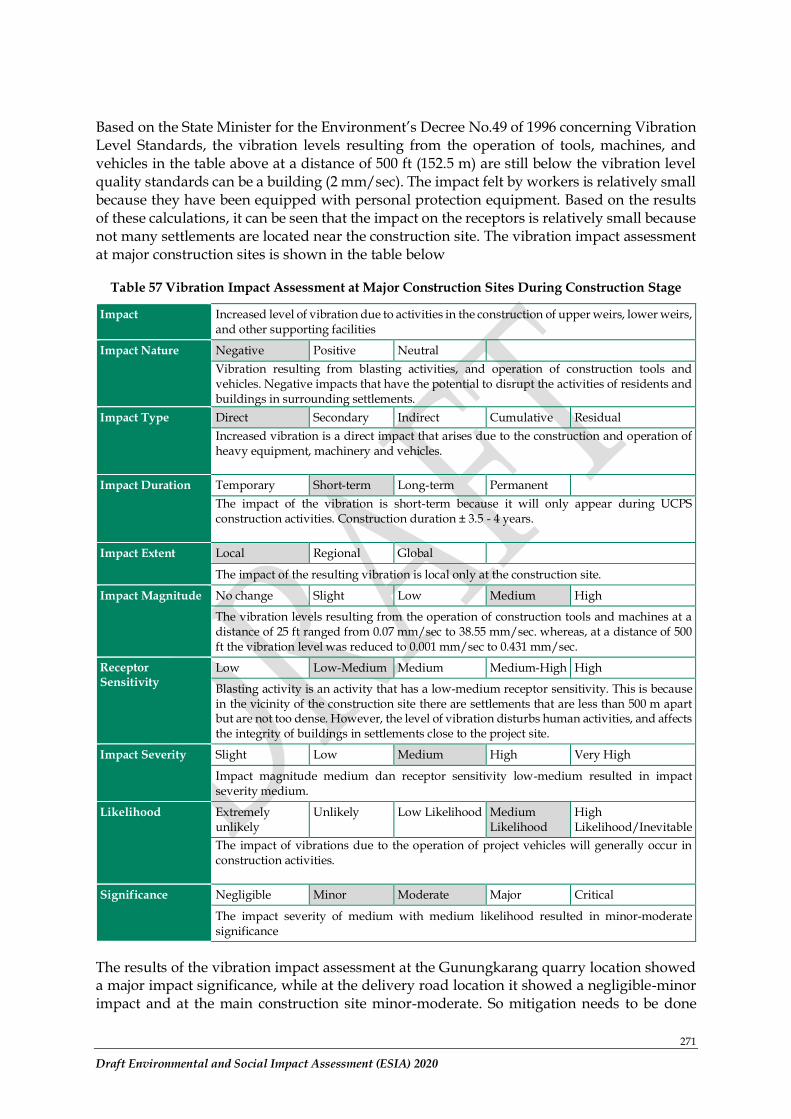
271
Draft Environmental and Social Impact Assessment (ESIA) 2020
Based on the State Minister for the Environment’s Decree No.49 of 1996 concerning Vibration Level Standards, the vibration levels resulting from the operation of tools, machines, and vehicles in the table above at a distance of 500 ft (152.5 m) are still below the vibration level quality standards can be a building (2 mm/sec). The impact felt by workers is relatively small because they have been equipped with personal protection equipment. Based on the results of these calculations, it can be seen that the impact on the receptors is relatively small because not many settlements are located near the construction site. The vibration impact assessment at major construction sites is shown in the table below
Table 57 Vibration Impact Assessment at Major Construction Sites During Construction Stage
Impact Increased level of vibration due to activities in the construction of upper weirs, lower weirs, and other supporting facilities
Impact Nature Negative Positive Neutral
Vibration resulting from blasting activities, and operation of construction tools and vehicles. Negative impacts that have the potential to disrupt the activities of residents and buildings in surrounding settlements.
Impact Type Direct Secondary Indirect Cumulative Residual
Increased vibration is a direct impact that arises due to the construction and operation of heavy equipment, machinery and vehicles.
Impact Duration Temporary Short-term Long-term Permanent
The impact of the vibration is short-term because it will only appear during UCPS construction activities. Construction duration ± 3.5 - 4 years.
Impact Extent Local Regional Global
The impact of the resulting vibration is local only at the construction site.
Impact Magnitude No change Slight Low Medium High
The vibration levels resulting from the operation of construction tools and machines at a distance of 25 ft ranged from 0.07 mm/sec to 38.55 mm/sec. whereas, at a distance of 500 ft the vibration level was reduced to 0.001 mm/sec to 0.431 mm/sec.
Receptor Sensitivity
Low Low-Medium Medium Medium-High High
Blasting activity is an activity that has a low-medium receptor sensitivity. This is because in the vicinity of the construction site there are settlements that are less than 500 m apart but are not too dense. However, the level of vibration disturbs human activities, and affects the integrity of buildings in settlements close to the project site.
Impact Severity Slight Low Medium High Very High
Impact magnitude medium dan receptor sensitivity low-medium resulted in impact severity medium.
Likelihood Extremely unlikely
Unlikely Low Likelihood Medium Likelihood
High Likelihood/Inevitable
The impact of vibrations due to the operation of project vehicles will generally occur in construction activities.
Significance Negligible Minor Moderate Major Critical
The impact severity of medium with medium likelihood resulted in minor-moderate significance
The results of the vibration impact assessment at the Gunungkarang quarry location showed a major impact significance, while at the delivery road location it showed a negligible-minor impact and at the main construction site minor-moderate. So mitigation needs to be done
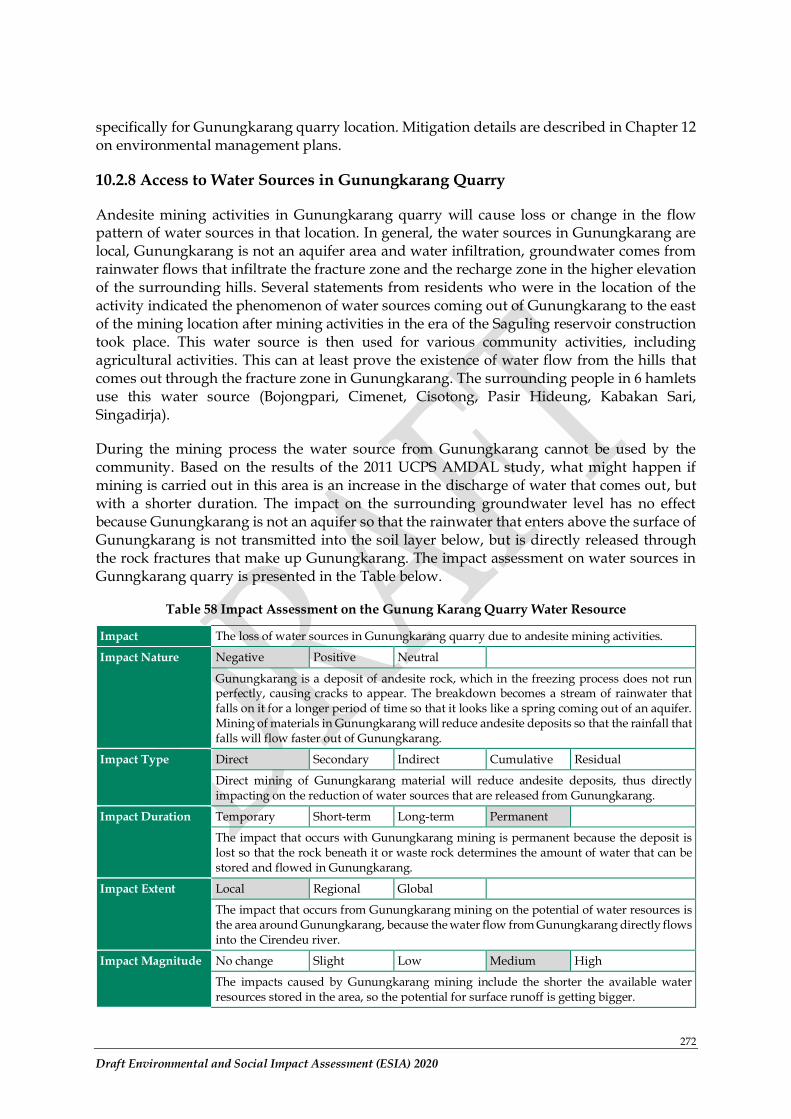
272
Draft Environmental and Social Impact Assessment (ESIA) 2020
specifically for Gunungkarang quarry location. Mitigation details are described in Chapter 12 on environmental management plans.
10.2.8 Access to Water Sources in Gunungkarang Quarry
Andesite mining activities in Gunungkarang quarry will cause loss or change in the flow pattern of water sources in that location. In general, the water sources in Gunungkarang are local, Gunungkarang is not an aquifer area and water infiltration, groundwater comes from rainwater flows that infiltrate the fracture zone and the recharge zone in the higher elevation of the surrounding hills. Several statements from residents who were in the location of the activity indicated the phenomenon of water sources coming out of Gunungkarang to the east of the mining location after mining activities in the era of the Saguling reservoir construction took place. This water source is then used for various community activities, including agricultural activities. This can at least prove the existence of water flow from the hills that comes out through the fracture zone in Gunungkarang. The surrounding people in 6 hamlets use this water source (Bojongpari, Cimenet, Cisotong, Pasir Hideung, Kabakan Sari, Singadirja).
During the mining process the water source from Gunungkarang cannot be used by the community. Based on the results of the 2011 UCPS AMDAL study, what might happen if mining is carried out in this area is an increase in the discharge of water that comes out, but with a shorter duration. The impact on the surrounding groundwater level has no effect because Gunungkarang is not an aquifer so that the rainwater that enters above the surface of Gunungkarang is not transmitted into the soil layer below, but is directly released through the rock fractures that make up Gunungkarang. The impact assessment on water sources in Gunngkarang quarry is presented in the Table below.
Table 58 Impact Assessment on the Gunung Karang Quarry Water Resource
Impact The loss of water sources in Gunungkarang quarry due to andesite mining activities.
Impact Nature Negative Positive Neutral
Gunungkarang is a deposit of andesite rock, which in the freezing process does not run perfectly, causing cracks to appear. The breakdown becomes a stream of rainwater that falls on it for a longer period of time so that it looks like a spring coming out of an aquifer. Mining of materials in Gunungkarang will reduce andesite deposits so that the rainfall that falls will flow faster out of Gunungkarang.
Impact Type Direct Secondary Indirect Cumulative Residual
Direct mining of Gunungkarang material will reduce andesite deposits, thus directly impacting on the reduction of water sources that are released from Gunungkarang.
Impact Duration Temporary Short-term Long-term Permanent
The impact that occurs with Gunungkarang mining is permanent because the deposit is lost so that the rock beneath it or waste rock determines the amount of water that can be stored and flowed in Gunungkarang.
Impact Extent Local Regional Global
The impact that occurs from Gunungkarang mining on the potential of water resources is the area around Gunungkarang, because the water flow from Gunungkarang directly flows into the Cirendeu river.
Impact Magnitude No change Slight Low Medium High
The impacts caused by Gunungkarang mining include the shorter the available water resources stored in the area, so the potential for surface runoff is getting bigger.
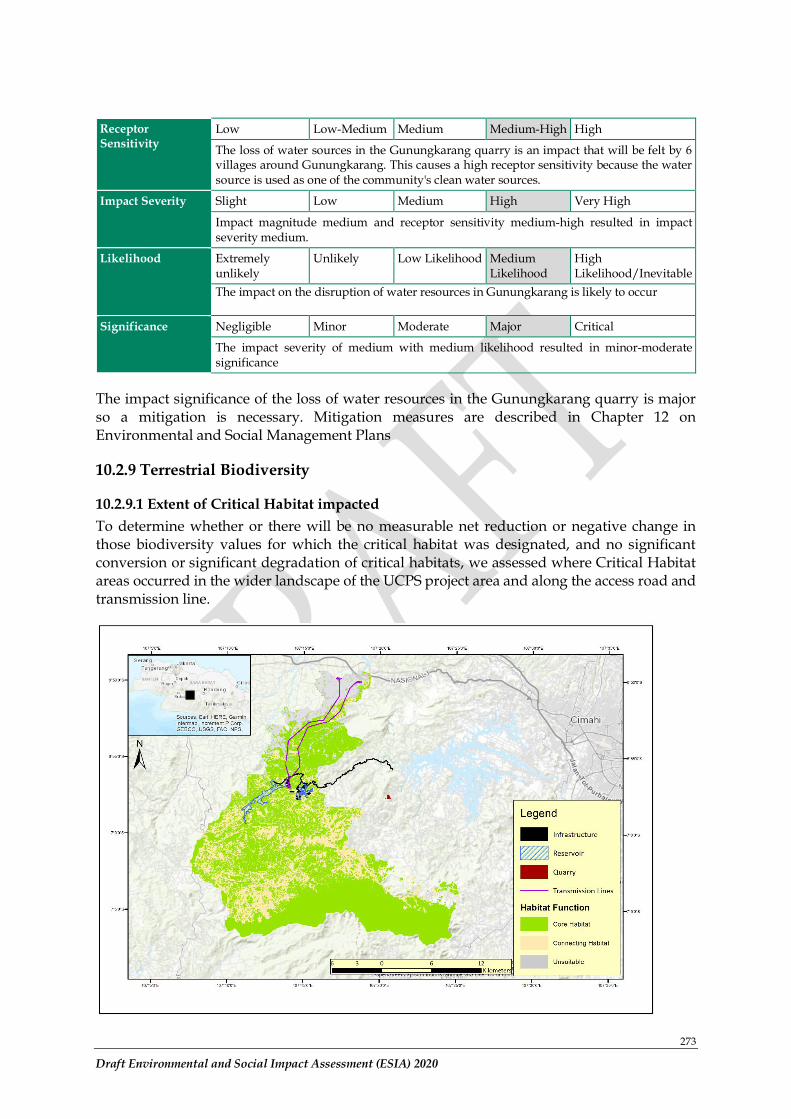
273
Draft Environmental and Social Impact Assessment (ESIA) 2020
Receptor Sensitivity
Low Low-Medium Medium Medium-High High
The loss of water sources in the Gunungkarang quarry is an impact that will be felt by 6 villages around Gunungkarang. This causes a high receptor sensitivity because the water source is used as one of the community's clean water sources.
Impact Severity Slight Low Medium High Very High
Impact magnitude medium and receptor sensitivity medium-high resulted in impact severity medium.
Likelihood Extremely unlikely
Unlikely Low Likelihood Medium Likelihood
High Likelihood/Inevitable
The impact on the disruption of water resources in Gunungkarang is likely to occur
Significance Negligible Minor Moderate Major Critical
The impact severity of medium with medium likelihood resulted in minor-moderate significance
The impact significance of the loss of water resources in the Gunungkarang quarry is major so a mitigation is necessary. Mitigation measures are described in Chapter 12 on Environmental and Social Management Plans
10.2.9 Terrestrial Biodiversity
10.2.9.1 Extent of Critical Habitat impacted
To determine whether or there will be no measurable net reduction or negative change in those biodiversity values for which the critical habitat was designated, and no significant conversion or significant degradation of critical habitats, we assessed where Critical Habitat areas occurred in the wider landscape of the UCPS project area and along the access road and transmission line.
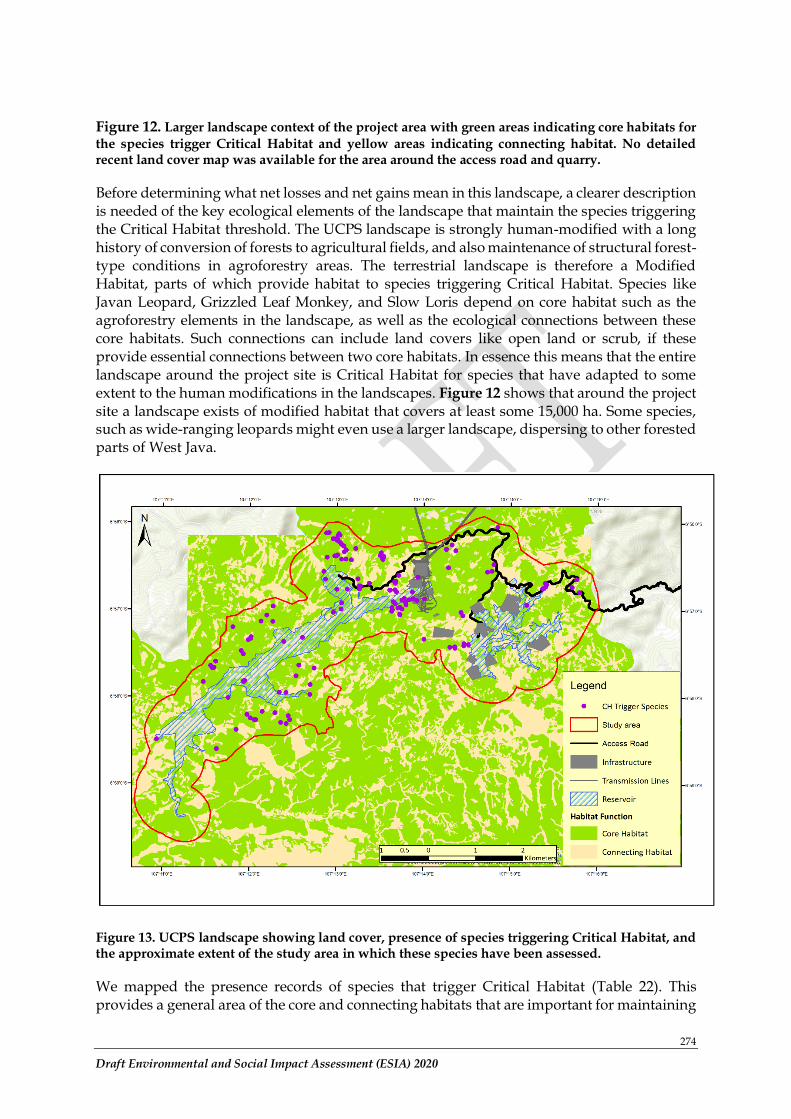
274
Draft Environmental and Social Impact Assessment (ESIA) 2020
Figure 12. Larger landscape context of the project area with green areas indicating core habitats for the species trigger Critical Habitat and yellow areas indicating connecting habitat. No detailed recent land cover map was available for the area around the access road and quarry.
Before determining what net losses and net gains mean in this landscape, a clearer description is needed of the key ecological elements of the landscape that maintain the species triggering the Critical Habitat threshold. The UCPS landscape is strongly human-modified with a long history of conversion of forests to agricultural fields, and also maintenance of structural forest-type conditions in agroforestry areas. The terrestrial landscape is therefore a Modified Habitat, parts of which provide habitat to species triggering Critical Habitat. Species like Javan Leopard, Grizzled Leaf Monkey, and Slow Loris depend on core habitat such as the agroforestry elements in the landscape, as well as the ecological connections between these core habitats. Such connections can include land covers like open land or scrub, if these provide essential connections between two core habitats. In essence this means that the entire landscape around the project site is Critical Habitat for species that have adapted to some extent to the human modifications in the landscapes. Figure 12 shows that around the project site a landscape exists of modified habitat that covers at least some 15,000 ha. Some species, such as wide-ranging leopards might even use a larger landscape, dispersing to other forested parts of West Java.
Figure 13. UCPS landscape showing land cover, presence of species triggering Critical Habitat, and the approximate extent of the study area in which these species have been assessed.
We mapped the presence records of species that trigger Critical Habitat (Table 22). This provides a general area of the core and connecting habitats that are important for maintaining
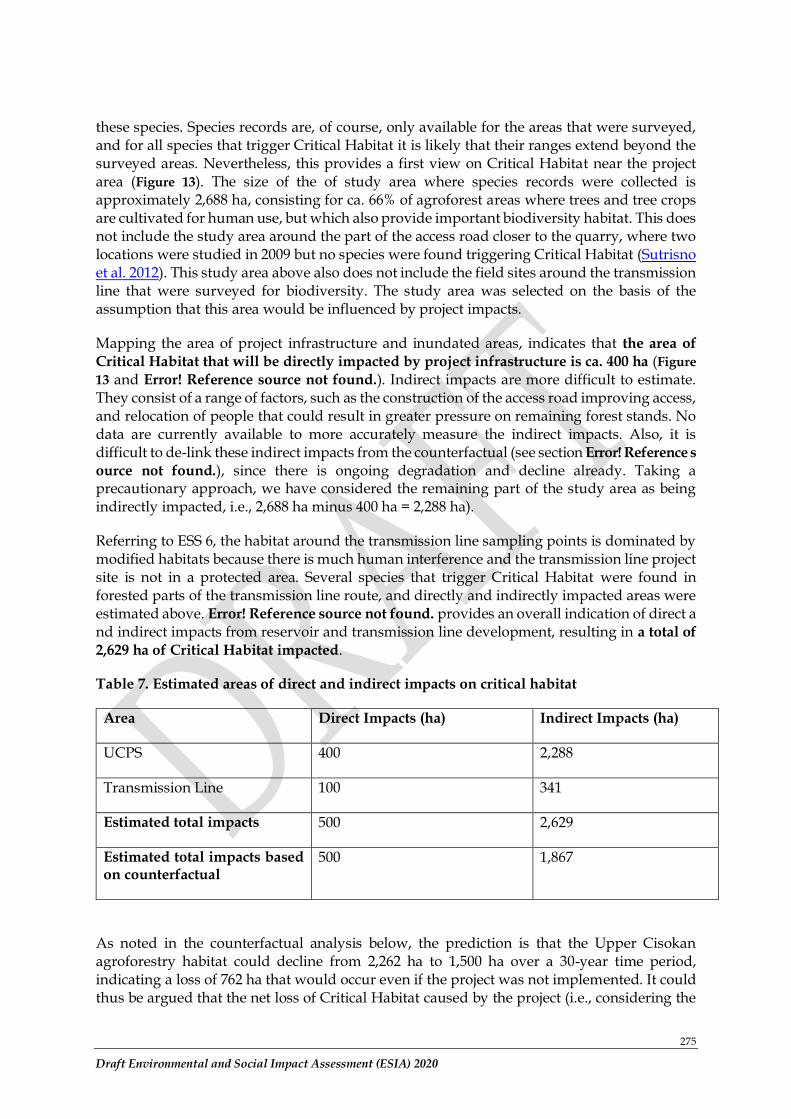
275
Draft Environmental and Social Impact Assessment (ESIA) 2020
these species. Species records are, of course, only available for the areas that were surveyed, and for all species that trigger Critical Habitat it is likely that their ranges extend beyond the surveyed areas. Nevertheless, this provides a first view on Critical Habitat near the project area (Figure 13). The size of the of study area where species records were collected is approximately 2,688 ha, consisting for ca. 66% of agroforest areas where trees and tree crops are cultivated for human use, but which also provide important biodiversity habitat. This does not include the study area around the part of the access road closer to the quarry, where two locations were studied in 2009 but no species were found triggering Critical Habitat (Sutrisno et al. 2012). This study area above also does not include the field sites around the transmission line that were surveyed for biodiversity. The study area was selected on the basis of the assumption that this area would be influenced by project impacts.
Mapping the area of project infrastructure and inundated areas, indicates that the area of
Critical Habitat that will be directly impacted by project infrastructure is ca. 400 ha (Figure
13 and Error! Reference source not found.). Indirect impacts are more difficult to estimate. They consist of a range of factors, such as the construction of the access road improving access, and relocation of people that could result in greater pressure on remaining forest stands. No data are currently available to more accurately measure the indirect impacts. Also, it is difficult to de-link these indirect impacts from the counterfactual (see section Error! Reference s
ource not found.), since there is ongoing degradation and decline already. Taking a precautionary approach, we have considered the remaining part of the study area as being indirectly impacted, i.e., 2,688 ha minus 400 ha = 2,288 ha).
Referring to ESS 6, the habitat around the transmission line sampling points is dominated by modified habitats because there is much human interference and the transmission line project site is not in a protected area. Several species that trigger Critical Habitat were found in forested parts of the transmission line route, and directly and indirectly impacted areas were estimated above. Error! Reference source not found. provides an overall indication of direct and indirect impacts from reservoir and transmission line development, resulting in a total of
2,629 ha of Critical Habitat impacted.
Table 7. Estimated areas of direct and indirect impacts on critical habitat
Area Direct Impacts (ha) Indirect Impacts (ha)
UCPS 400 2,288
Transmission Line 100 341
Estimated total impacts 500 2,629
Estimated total impacts based on counterfactual
500 1,867
As noted in the counterfactual analysis below, the prediction is that the Upper Cisokan agroforestry habitat could decline from 2,262 ha to 1,500 ha over a 30-year time period, indicating a loss of 762 ha that would occur even if the project was not implemented. It could thus be argued that the net loss of Critical Habitat caused by the project (i.e., considering the
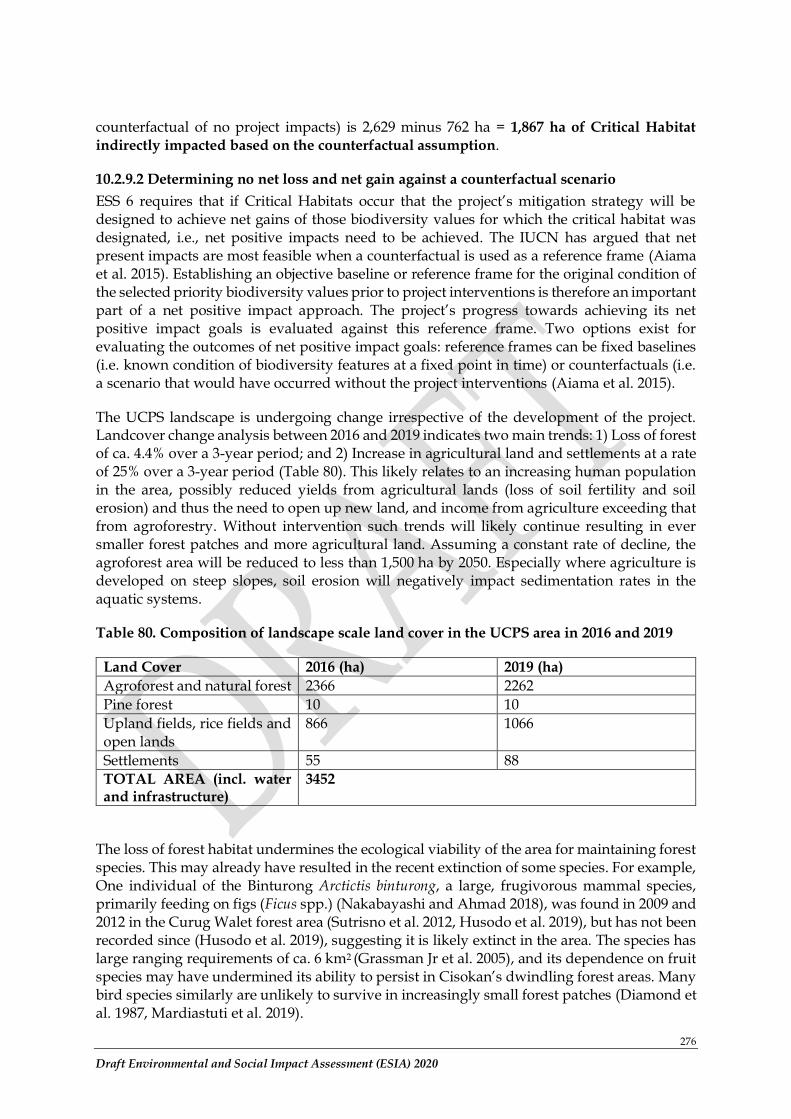
276
Draft Environmental and Social Impact Assessment (ESIA) 2020
counterfactual of no project impacts) is 2,629 minus 762 ha = 1,867 ha of Critical Habitat
indirectly impacted based on the counterfactual assumption.
10.2.9.2 Determining no net loss and net gain against a counterfactual scenario
ESS 6 requires that if Critical Habitats occur that the project’s mitigation strategy will be designed to achieve net gains of those biodiversity values for which the critical habitat was designated, i.e., net positive impacts need to be achieved. The IUCN has argued that net present impacts are most feasible when a counterfactual is used as a reference frame (Aiama et al. 2015). Establishing an objective baseline or reference frame for the original condition of the selected priority biodiversity values prior to project interventions is therefore an important part of a net positive impact approach. The project’s progress towards achieving its net positive impact goals is evaluated against this reference frame. Two options exist for evaluating the outcomes of net positive impact goals: reference frames can be fixed baselines (i.e. known condition of biodiversity features at a fixed point in time) or counterfactuals (i.e. a scenario that would have occurred without the project interventions (Aiama et al. 2015).
The UCPS landscape is undergoing change irrespective of the development of the project. Landcover change analysis between 2016 and 2019 indicates two main trends: 1) Loss of forest of ca. 4.4% over a 3-year period; and 2) Increase in agricultural land and settlements at a rate of 25% over a 3-year period (Table 80). This likely relates to an increasing human population in the area, possibly reduced yields from agricultural lands (loss of soil fertility and soil erosion) and thus the need to open up new land, and income from agriculture exceeding that from agroforestry. Without intervention such trends will likely continue resulting in ever smaller forest patches and more agricultural land. Assuming a constant rate of decline, the agroforest area will be reduced to less than 1,500 ha by 2050. Especially where agriculture is developed on steep slopes, soil erosion will negatively impact sedimentation rates in the aquatic systems.
Table 80. Composition of landscape scale land cover in the UCPS area in 2016 and 2019
Land Cover 2016 (ha) 2019 (ha)
Agroforest and natural forest 2366 2262
Pine forest 10 10
Upland fields, rice fields and open lands
866 1066
Settlements 55 88 TOTAL AREA (incl. water and infrastructure)
3452
The loss of forest habitat undermines the ecological viability of the area for maintaining forest species. This may already have resulted in the recent extinction of some species. For example, One individual of the Binturong Arctictis binturong, a large, frugivorous mammal species, primarily feeding on figs (Ficus spp.) (Nakabayashi and Ahmad 2018), was found in 2009 and 2012 in the Curug Walet forest area (Sutrisno et al. 2012, Husodo et al. 2019), but has not been recorded since (Husodo et al. 2019), suggesting it is likely extinct in the area. The species has large ranging requirements of ca. 6 km2 (Grassman Jr et al. 2005), and its dependence on fruit species may have undermined its ability to persist in Cisokan’s dwindling forest areas. Many bird species similarly are unlikely to survive in increasingly small forest patches (Diamond et al. 1987, Mardiastuti et al. 2019).
277
Draft Environmental and Social Impact Assessment (ESIA) 2020
Not only habitat loss is threatening biodiversity under the counterfactual scenario. Unsustainable poaching and collecting rates is also threatening species, such as the commercially valuable Pangolin, and a range of song bird species that have been collected for many years in the area (Rahmat 2009). Many bird species that were once common in these kinds of lowland and hilly parts of Java are now extinct in the area and have never been encountered in recent surveys. This includes species like Crescent-chested Babbler (Stachyris melanothorax), Western Yellow Wagtail (Motacilla flava), Great Tit (Parus major), and Javan Myna (Acridotheres javanicus), which should be common in human-dominated areas on Java but have rapidly decreased populations because of bird hunting activities (Hakim et al. 2020). One fish species, Hampala macrolepidota, may also have disappeared because of unsustainable fishing.
In conclusion, the counterfactual scenario is one of declining ecological values in an already heavily modified landscape, resulting in theand extinction of especially larger forest-depending species such as gibbons and langurs. The question is whether the no net loss needs to take this counterfactual into consideration. Should the project’s impacts be measured against the project’s biodiversity baseline, or against the trend that would likely have occurred if the project had not been implemented? Either way, it is difficult in this environment to de-link the baseline with the project and it seems obvious that major ecological restoration is needed in the area to avoid further declines in biodiversity. This includes significant reforestation efforts with species that provide both social and environmental benefits. Such reforestation would increase the ecological viability of remaining forest patches from a current estimated 25% of what the ecological value would be in primary forest conditions, but also improve the quality of the aquatic system by protecting streams that flow into the reservoirs, providing improved fish spawning sites, better habitat for invertebrates, reducing the temperature of the water through increased shading, etc. The ecological restoration and biodiversity management objectives aim to increase the ecological value of the landscape from 25 now to 50% after forest restoration has been fully implemented.
10.2.9.3 Applying the mitigation hierarchy
ESS 6 states that for the protection and conservation of habitats and the biodiversity they support, the mitigation hierarchy includes biodiversity offsets. Offsets will be considered as a last resort, only if significant residual adverse impacts remain after all technically and financially feasible avoidance, minimization, and restoration measures have been considered (Figure 86).
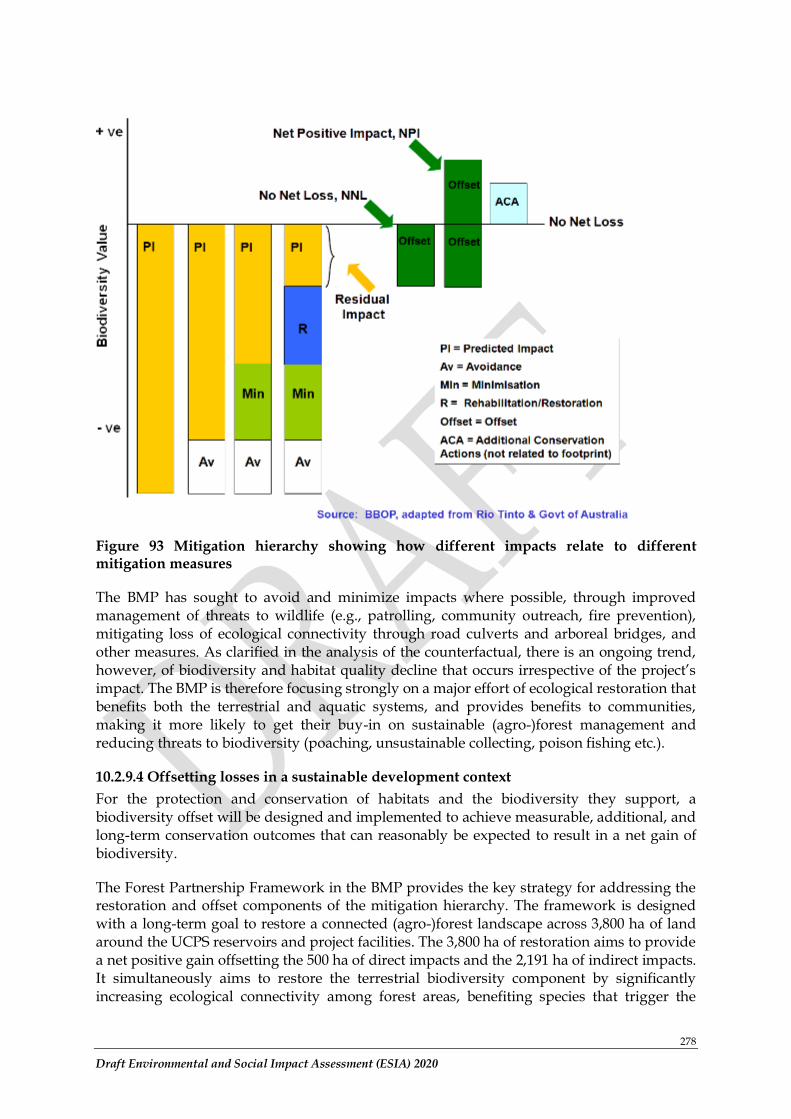
278
Draft Environmental and Social Impact Assessment (ESIA) 2020
Figure 93 Mitigation hierarchy showing how different impacts relate to different mitigation measures
The BMP has sought to avoid and minimize impacts where possible, through improved management of threats to wildlife (e.g., patrolling, community outreach, fire prevention), mitigating loss of ecological connectivity through road culverts and arboreal bridges, and other measures. As clarified in the analysis of the counterfactual, there is an ongoing trend, however, of biodiversity and habitat quality decline that occurs irrespective of the project’s impact. The BMP is therefore focusing strongly on a major effort of ecological restoration that benefits both the terrestrial and aquatic systems, and provides benefits to communities, making it more likely to get their buy-in on sustainable (agro-)forest management and reducing threats to biodiversity (poaching, unsustainable collecting, poison fishing etc.).
10.2.9.4 Offsetting losses in a sustainable development context
For the protection and conservation of habitats and the biodiversity they support, a biodiversity offset will be designed and implemented to achieve measurable, additional, and long-term conservation outcomes that can reasonably be expected to result in a net gain of biodiversity.
The Forest Partnership Framework in the BMP provides the key strategy for addressing the restoration and offset components of the mitigation hierarchy. The framework is designed with a long-term goal to restore a connected (agro-)forest landscape across 3,800 ha of land around the UCPS reservoirs and project facilities. The 3,800 ha of restoration aims to provide a net positive gain offsetting the 500 ha of direct impacts and the 2,191 ha of indirect impacts. It simultaneously aims to restore the terrestrial biodiversity component by significantly increasing ecological connectivity among forest areas, benefiting species that trigger the
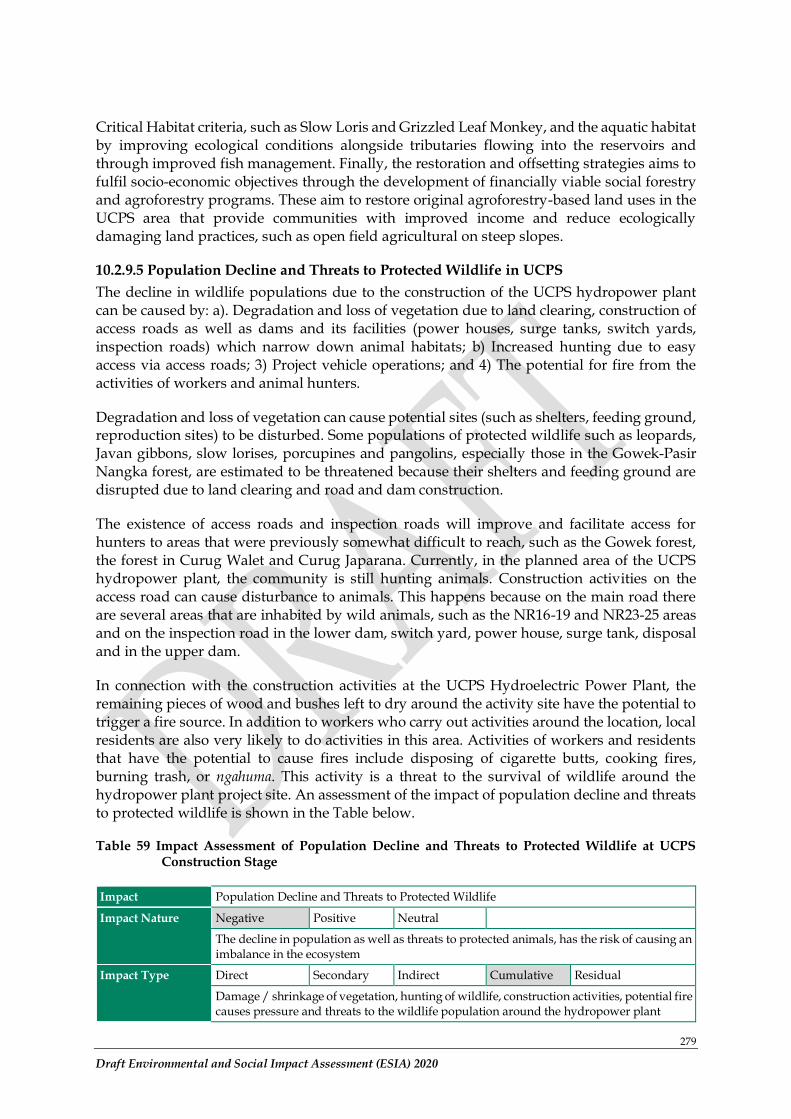
279
Draft Environmental and Social Impact Assessment (ESIA) 2020
Critical Habitat criteria, such as Slow Loris and Grizzled Leaf Monkey, and the aquatic habitat by improving ecological conditions alongside tributaries flowing into the reservoirs and through improved fish management. Finally, the restoration and offsetting strategies aims to fulfil socio-economic objectives through the development of financially viable social forestry and agroforestry programs. These aim to restore original agroforestry-based land uses in the UCPS area that provide communities with improved income and reduce ecologically damaging land practices, such as open field agricultural on steep slopes.
10.2.9.5 Population Decline and Threats to Protected Wildlife in UCPS
The decline in wildlife populations due to the construction of the UCPS hydropower plant can be caused by: a). Degradation and loss of vegetation due to land clearing, construction of access roads as well as dams and its facilities (power houses, surge tanks, switch yards, inspection roads) which narrow down animal habitats; b) Increased hunting due to easy access via access roads; 3) Project vehicle operations; and 4) The potential for fire from the activities of workers and animal hunters.
Degradation and loss of vegetation can cause potential sites (such as shelters, feeding ground, reproduction sites) to be disturbed. Some populations of protected wildlife such as leopards, Javan gibbons, slow lorises, porcupines and pangolins, especially those in the Gowek-Pasir Nangka forest, are estimated to be threatened because their shelters and feeding ground are disrupted due to land clearing and road and dam construction.
The existence of access roads and inspection roads will improve and facilitate access for hunters to areas that were previously somewhat difficult to reach, such as the Gowek forest, the forest in Curug Walet and Curug Japarana. Currently, in the planned area of the UCPS hydropower plant, the community is still hunting animals. Construction activities on the access road can cause disturbance to animals. This happens because on the main road there are several areas that are inhabited by wild animals, such as the NR16-19 and NR23-25 areas and on the inspection road in the lower dam, switch yard, power house, surge tank, disposal and in the upper dam.
In connection with the construction activities at the UCPS Hydroelectric Power Plant, the remaining pieces of wood and bushes left to dry around the activity site have the potential to trigger a fire source. In addition to workers who carry out activities around the location, local residents are also very likely to do activities in this area. Activities of workers and residents that have the potential to cause fires include disposing of cigarette butts, cooking fires, burning trash, or ngahuma. This activity is a threat to the survival of wildlife around the hydropower plant project site. An assessment of the impact of population decline and threats to protected wildlife is shown in the Table below.
Table 59 Impact Assessment of Population Decline and Threats to Protected Wildlife at UCPS Construction Stage
Impact Population Decline and Threats to Protected Wildlife
Impact Nature Negative Positive Neutral
The decline in population as well as threats to protected animals, has the risk of causing an imbalance in the ecosystem
Impact Type Direct Secondary Indirect Cumulative Residual
Damage / shrinkage of vegetation, hunting of wildlife, construction activities, potential fire causes pressure and threats to the wildlife population around the hydropower plant
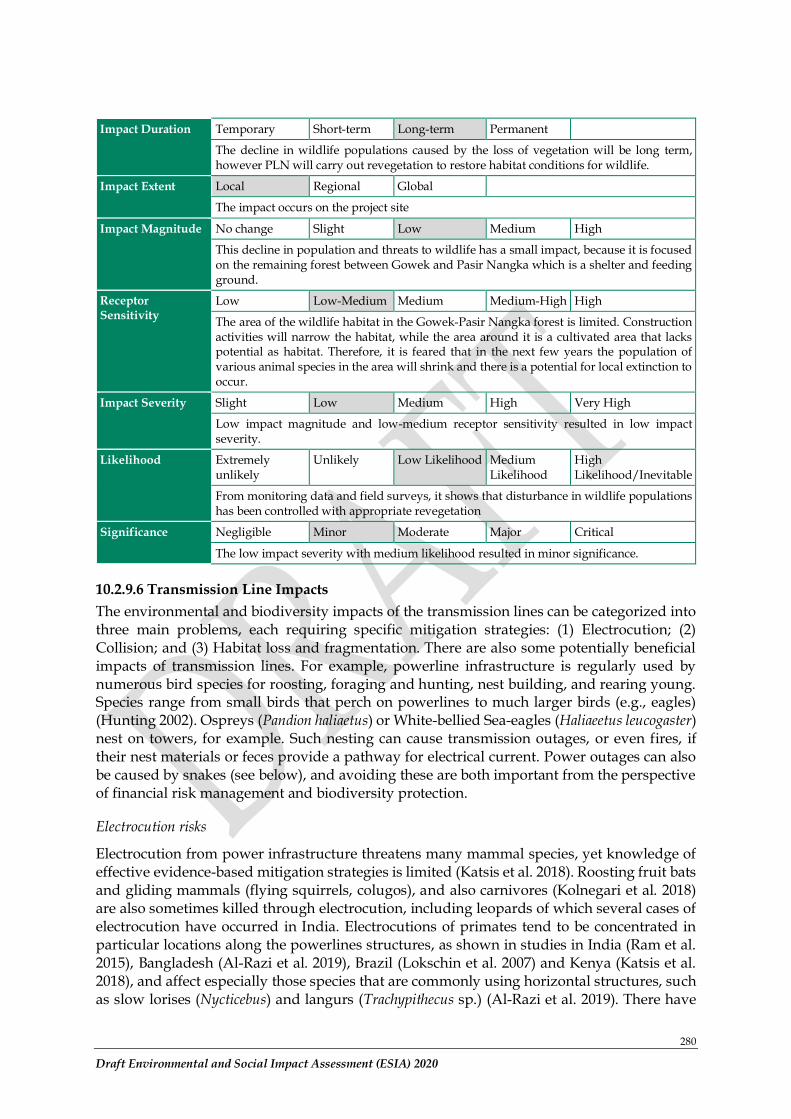
280
Draft Environmental and Social Impact Assessment (ESIA) 2020
Impact Duration Temporary Short-term Long-term Permanent
The decline in wildlife populations caused by the loss of vegetation will be long term, however PLN will carry out revegetation to restore habitat conditions for wildlife.
Impact Extent Local Regional Global
The impact occurs on the project site
Impact Magnitude No change Slight Low Medium High
This decline in population and threats to wildlife has a small impact, because it is focused on the remaining forest between Gowek and Pasir Nangka which is a shelter and feeding ground.
Receptor Sensitivity
Low Low-Medium Medium Medium-High High
The area of the wildlife habitat in the Gowek-Pasir Nangka forest is limited. Construction activities will narrow the habitat, while the area around it is a cultivated area that lacks potential as habitat. Therefore, it is feared that in the next few years the population of various animal species in the area will shrink and there is a potential for local extinction to occur.
Impact Severity Slight Low Medium High Very High
Low impact magnitude and low-medium receptor sensitivity resulted in low impact severity.
Likelihood Extremely unlikely
Unlikely Low Likelihood Medium Likelihood
High Likelihood/Inevitable
From monitoring data and field surveys, it shows that disturbance in wildlife populations has been controlled with appropriate revegetation
Significance Negligible Minor Moderate Major Critical
The low impact severity with medium likelihood resulted in minor significance.
10.2.9.6 Transmission Line Impacts
The environmental and biodiversity impacts of the transmission lines can be categorized into three main problems, each requiring specific mitigation strategies: (1) Electrocution; (2) Collision; and (3) Habitat loss and fragmentation. There are also some potentially beneficial impacts of transmission lines. For example, powerline infrastructure is regularly used by numerous bird species for roosting, foraging and hunting, nest building, and rearing young. Species range from small birds that perch on powerlines to much larger birds (e.g., eagles) (Hunting 2002). Ospreys (Pandion haliaetus) or White-bellied Sea-eagles (Haliaeetus leucogaster) nest on towers, for example. Such nesting can cause transmission outages, or even fires, if their nest materials or feces provide a pathway for electrical current. Power outages can also be caused by snakes (see below), and avoiding these are both important from the perspective of financial risk management and biodiversity protection.
Electrocution risks
Electrocution from power infrastructure threatens many mammal species, yet knowledge of effective evidence-based mitigation strategies is limited (Katsis et al. 2018). Roosting fruit bats and gliding mammals (flying squirrels, colugos), and also carnivores (Kolnegari et al. 2018) are also sometimes killed through electrocution, including leopards of which several cases of electrocution have occurred in India. Electrocutions of primates tend to be concentrated in particular locations along the powerlines structures, as shown in studies in India (Ram et al. 2015), Bangladesh (Al-Razi et al. 2019), Brazil (Lokschin et al. 2007) and Kenya (Katsis et al. 2018), and affect especially those species that are commonly using horizontal structures, such as slow lorises (Nycticebus) and langurs (Trachypithecus sp.) (Al-Razi et al. 2019). There have
281
Draft Environmental and Social Impact Assessment (ESIA) 2020
been anecdotal stories of slow lorises between electrocuted on Java, but this was likely on smaller transmission line infrastructure (V. Nijman, pers. comm.).
Mortalities in snakes from electrocution on powerlines are anecdotally documented but have not been well studied. Larger, climbing snakes such as pythons could be at particular risk. For example, on the island of Guam, the Brown Tree Snake (Boiga irregularis), which is non-native species on Java, causes frequent electrical power outages, especially on high voltage transmission lines, on transformers, and inside electrical substations (Fritts 2002). These snakes caused more than 1600 power outages in a 20-yr period, with a single outage spanning the entire island and lasting 8 or more hours estimated to cost in excess of $3,000,000 in lost productivity.
Avian electrocution can occur if a bird simultaneously contacts either two phase wires or an energized phase wire and a grounded (earthed) contact, such as a steel member. Avian electrocutions can cause line faults and outages that negatively impact system reliability and power quality. Because of behavioral factors, raptors are more susceptible to electrocution than other groups of birds, although many other bird species are larger than raptors (Eccleston and Harness 2018). For Java, the raptor species that are most likely to be affected are Crested Serpent Eagle (Spilornis cheela), Crested Hawk-Eagle (Nisaetus cirrhatus) or Black Eagle (Ictinaetus malaiensis) that might perch or nest on power infrastructure, and which have all been identified as present in the transmission line area. Storks, herons and egrets can also be affected, although no stork species have been recorded in the UCPS or transmission line areas.
Collision risks
Collisions with transmission infrastructure are mostly a problem for birds. Bird collisions most often occur in raptors, species with either poor maneuverability (e.g., egrets), fast fliers, such as imperial pigeons (Ducula spp.) and quails (Janss 2000), or waterbirds, such as ducks and rails (MWH and Stantec 2018). For Java, the raptor species that is of most concern for being affected by the transmission infrastructure is the endemic and Endangered Javan Hawk-eagle (Nisaetus bartelsi). Furthermore, migratory species that, especially during the September to November migration pass west-to-east through the Javan highlands and to the north of these (Nijman et al. 2006) could collide with towers or powerlines (Figure 87). This includes Chinese Goshawk (Accipiter soloensis), Japanese Sparrowhawk (Accipiter gularis), Oriental Honey-Buzzard (Pernis ptilorhynchus), Black Baza (Aviceda leuphotes), and Short-toed Eagle (Circaetus gallicus).
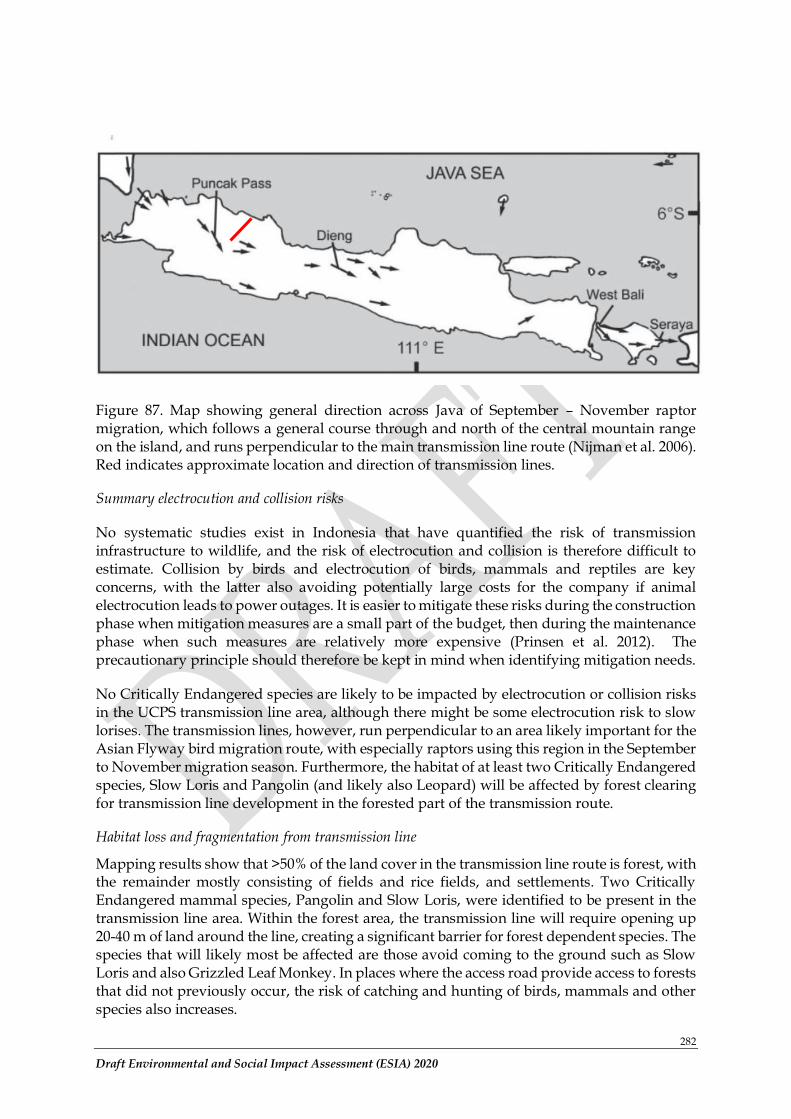
282
Draft Environmental and Social Impact Assessment (ESIA) 2020
Figure 87. Map showing general direction across Java of September – November raptor migration, which follows a general course through and north of the central mountain range on the island, and runs perpendicular to the main transmission line route (Nijman et al. 2006). Red indicates approximate location and direction of transmission lines.
Summary electrocution and collision risks
No systematic studies exist in Indonesia that have quantified the risk of transmission infrastructure to wildlife, and the risk of electrocution and collision is therefore difficult to estimate. Collision by birds and electrocution of birds, mammals and reptiles are key concerns, with the latter also avoiding potentially large costs for the company if animal electrocution leads to power outages. It is easier to mitigate these risks during the construction phase when mitigation measures are a small part of the budget, then during the maintenance phase when such measures are relatively more expensive (Prinsen et al. 2012). The precautionary principle should therefore be kept in mind when identifying mitigation needs.
No Critically Endangered species are likely to be impacted by electrocution or collision risks in the UCPS transmission line area, although there might be some electrocution risk to slow lorises. The transmission lines, however, run perpendicular to an area likely important for the Asian Flyway bird migration route, with especially raptors using this region in the September to November migration season. Furthermore, the habitat of at least two Critically Endangered species, Slow Loris and Pangolin (and likely also Leopard) will be affected by forest clearing for transmission line development in the forested part of the transmission route.
Habitat loss and fragmentation from transmission line
Mapping results show that >50% of the land cover in the transmission line route is forest, with the remainder mostly consisting of fields and rice fields, and settlements. Two Critically Endangered mammal species, Pangolin and Slow Loris, were identified to be present in the transmission line area. Within the forest area, the transmission line will require opening up 20-40 m of land around the line, creating a significant barrier for forest dependent species. The species that will likely most be affected are those avoid coming to the ground such as Slow Loris and also Grizzled Leaf Monkey. In places where the access road provide access to forests that did not previously occur, the risk of catching and hunting of birds, mammals and other species also increases.
283
Draft Environmental and Social Impact Assessment (ESIA) 2020
The total length of the new transmission line is 31.4 km and width is 20-40 m, requiring an area of over 100 ha of cleared land, of which 50% is in secondary and plantation forest. No primary forest occurs along the transmission line route. The two Critically Endangered mammal species indicate that the forest areas converted for the transmission line are Critical Habitat. The Slow Loris will be affected by the significant non-forest barrier as it is a forest-dependent species. Other primates such as the Grizzled Leaf Monkey would also be affected as they need to come to the ground to cross the non-forest barrier, where they are more likely to be hunted. Where new roads are built into forest areas, increased access to forest will increase hunting pressure and deforestation risks. Elsewhere on Java, it was found that proximity to roads is a driver for land use and land cover change, particularly up to 1 km of the road but tapering off further than a kilometer away (CarbonTropic 2017). Published research also shows that a 1 km buffer around roads represents an indication of indirect impacts from increased hunting, which decline linearly with distance from roads (Clayton et al. 1997, Laurance et al. 2006). Access to forests via transmission line routes will be much more difficult than roads due to the lack of vehicle access or ability to settle and use land within the corridor, but it is possible, due to land pressures in Java, that the cleared route could increase informal agriculture, settlement and hunting in the project area, even without road access. Indirect impacts on critical habitat are therefore estimated at 31.4 km (transmission line length) * 0.5 (percentage in forest) * 0.2 km (zone indirectly impacted, applying lower rate of impact compared to roads) = 314 ha indirectly impacted.
10.3 Land Acquisition and Resettlement Impacts
The Project requires approximately 752, 39 ha of land for access road, upper and lower reservoir, and transmission line. Identified impacts due to land acquisition include loss of land, houses/buildings/ other assets experienced by the landowners; loss of/ damage to public infrastructures such as school, mosque, water source, road, bridge, sewage water system etc.; loss of forest land. The LARAP documents provide mitigation measures to address the impacts above include payment of cash compensation for loss of land and assets; protection, relocation, and rehabilitation of affected public facilities; replacement of forestry land and budget provision for revegetation; livelihood assistance and restoration programs. There are several villages that affected directly by the project such are Sukaresmi village, Bojongsalam village, Karangnunggal village and Cicadas village.
A Review on the Implementation of the LARAP was held from February to November 2020 by independent consultants. Detailed information is available in LARAP Implementation Review Report, 2021. Key findings include:
- Access road with total of 55.1 ha have been fully acquired and 562 landowners have been fully compensated. A total of 251.85 ha owned by 891 landowners of upper and lower reservoir have been compensated. There is a need for approximately 3.4 ha of additional land owned by 37 Households which will be confirmed and process in the next phase of the project. 59 landowners of Total of 2.70 Ha for transmission line have been compensated. Only one owner (of 0.05 ha) has not received compensation as the owner lives in another province.
- Approximately 2.12 Ha of unviable land have been identified in Bandung Barat Regency. Identification of similar land in Cianjur Regency has not commenced. None of the unviable land has been compensated. This will be followed up by PLN.
284
Draft Environmental and Social Impact Assessment (ESIA) 2020
- PLN will need to follow up on replacement/ compensation for aftected village treasury land and waqf land.
- There are 765 Household that must be relocated from the impacted area. Total of 199
household in the access road were relocated within a same village while 566
households of PAPs in reservoir area must be relocated to other villages. 54 HH have
not relocated due to various reasons. Reportedly, 12 households will move as soon as
PLN build a mosque in their resettlement area. The rest of the households expressed
other reasons including running out of compensation money and therefore being
unable to afford buying a new house in another area, waiting for PLN to build
religious/worship facilities in the new resettlement area, and other personal
constraints. Although all PAPs opted for self-relocation meaning managing their own
relocation proess after receiving cash compensation, PLN supported construction of
public facilities in 2 resettlement locations.
- PLN has implemented economic assistance and livelihood restoration programs
benefited the PAPs.
At the moment, the new PAPs’ destinations of settlement locations are including: a. Households affected by inundation (upper reservoir)
1. Jegud/Tapos Sand Sub-village, Sukaresmi Village, Rongga Sub-district, West Bandung District.
2. Cidongke Sub-village, Bojong Village, Rongga Sub-district, West Bandung District. 3. Munjul Sub-village, Bojong Village, Rongga Sub-district, West Bandung District. 4. Santik Sub-village, Bojong Village, Rongga Sub-district, West Bandung District. 5. Cihaneut Sub-village, Bojong Village, Rongga Sub-district, West Bandung District.
b. Households affected by inundation (lower reservoir) 1. Cangkuang Sub-village, Bojongsalam Village, Rongga Sub-district, West Bandung
District. 2. Jolok Sub-village, Cicadas Village, Rongga Sub-district, West Bandung District. 3. Gunung Batu Sub-village, Desa Cicadas, Rongga Sub-district, West Bandung District.
c. Households affected by inundation in switchyard 1. Laja Sand Sub-village, Sukaresmi Village, Rongga Sub-district, West Bandung
District. 2. Babakan Sub-village, Bandung, Sukaresmi Village, Rongga Sub-district, West
Bandung District.
There is a potential of additional land acquisition required for the construction of ancillary facilities such as a workforce base camp, surge tank, spoil bank, and access to a powerhouse. Referring to the estimated plan in LARAP Report, the additional land requirement above private lands is estimated to be less than 5 ha. Land Acquisition and Resettlement Policy Framework (LARPF) has been developed to guide future land acquisition. The requirement for additional land is maximized by using Perhutani's land and in areas that have obtained a Borrowing-Use Permit from the Ministry of Environment and Forestry (KLHK). However, if the suitable land is located outside the area that already has a permit from the KLHK, then PT. PLN needs to submit a change in the permit area to the KLHK. Besides, land acquisition is also possible on land owned by individuals (non-forest). However, Area Switchyard is given a priority to ensure safety slope protection, and also because it’s above private land.
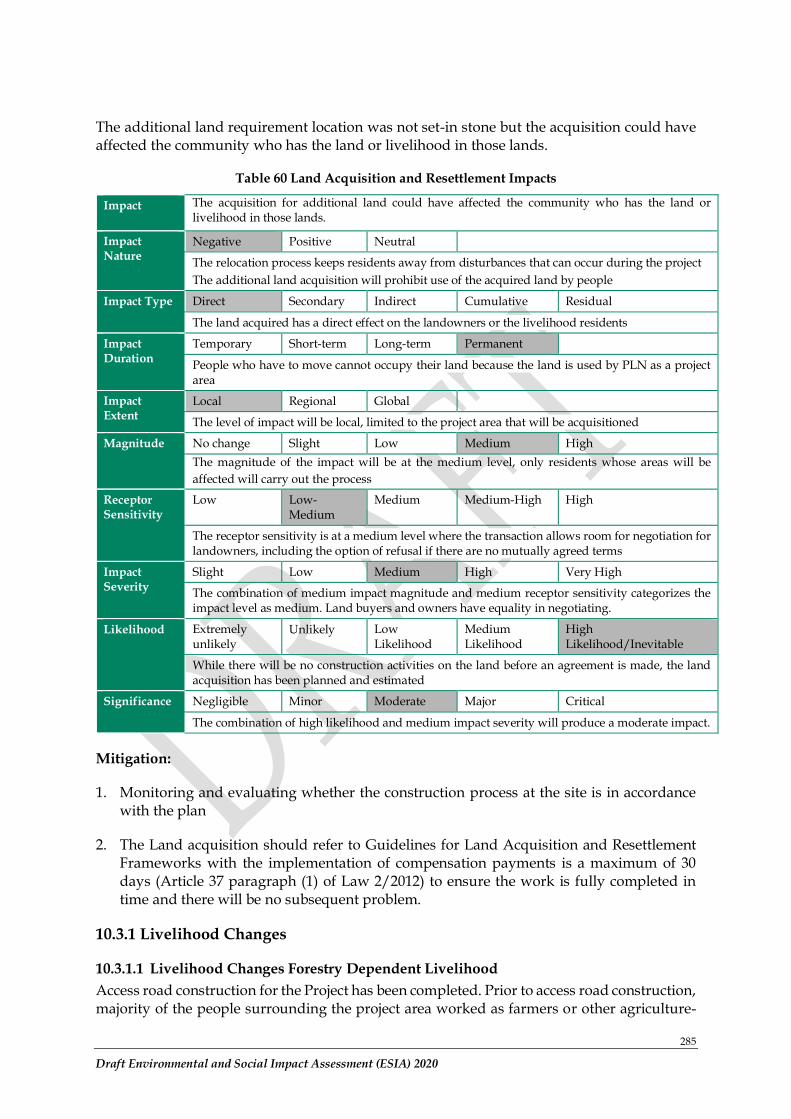
285
Draft Environmental and Social Impact Assessment (ESIA) 2020
The additional land requirement location was not set-in stone but the acquisition could have affected the community who has the land or livelihood in those lands.
Table 60 Land Acquisition and Resettlement Impacts
Impact The acquisition for additional land could have affected the community who has the land or livelihood in those lands.
Impact Nature
Negative Positive Neutral
The relocation process keeps residents away from disturbances that can occur during the project
The additional land acquisition will prohibit use of the acquired land by people
Impact Type Direct Secondary Indirect Cumulative Residual
The land acquired has a direct effect on the landowners or the livelihood residents
Impact Duration
Temporary Short-term Long-term Permanent
People who have to move cannot occupy their land because the land is used by PLN as a project area
Impact Extent
Local Regional Global
The level of impact will be local, limited to the project area that will be acquisitioned
Magnitude No change Slight Low Medium High
The magnitude of the impact will be at the medium level, only residents whose areas will be
affected will carry out the process
Receptor Sensitivity
Low Low-Medium
Medium Medium-High High
The receptor sensitivity is at a medium level where the transaction allows room for negotiation for landowners, including the option of refusal if there are no mutually agreed terms
Impact Severity
Slight Low Medium High Very High
The combination of medium impact magnitude and medium receptor sensitivity categorizes the impact level as medium. Land buyers and owners have equality in negotiating.
Likelihood Extremely unlikely
Unlikely Low Likelihood
Medium Likelihood
High Likelihood/Inevitable
While there will be no construction activities on the land before an agreement is made, the land acquisition has been planned and estimated
Significance Negligible Minor Moderate Major Critical
The combination of high likelihood and medium impact severity will produce a moderate impact.
Mitigation:
1. Monitoring and evaluating whether the construction process at the site is in accordance with the plan
2. The Land acquisition should refer to Guidelines for Land Acquisition and Resettlement Frameworks with the implementation of compensation payments is a maximum of 30 days (Article 37 paragraph (1) of Law 2/2012) to ensure the work is fully completed in time and there will be no subsequent problem.
10.3.1 Livelihood Changes
10.3.1.1 Livelihood Changes Forestry Dependent Livelihood
Access road construction for the Project has been completed. Prior to access road construction, majority of the people surrounding the project area worked as farmers or other agriculture-
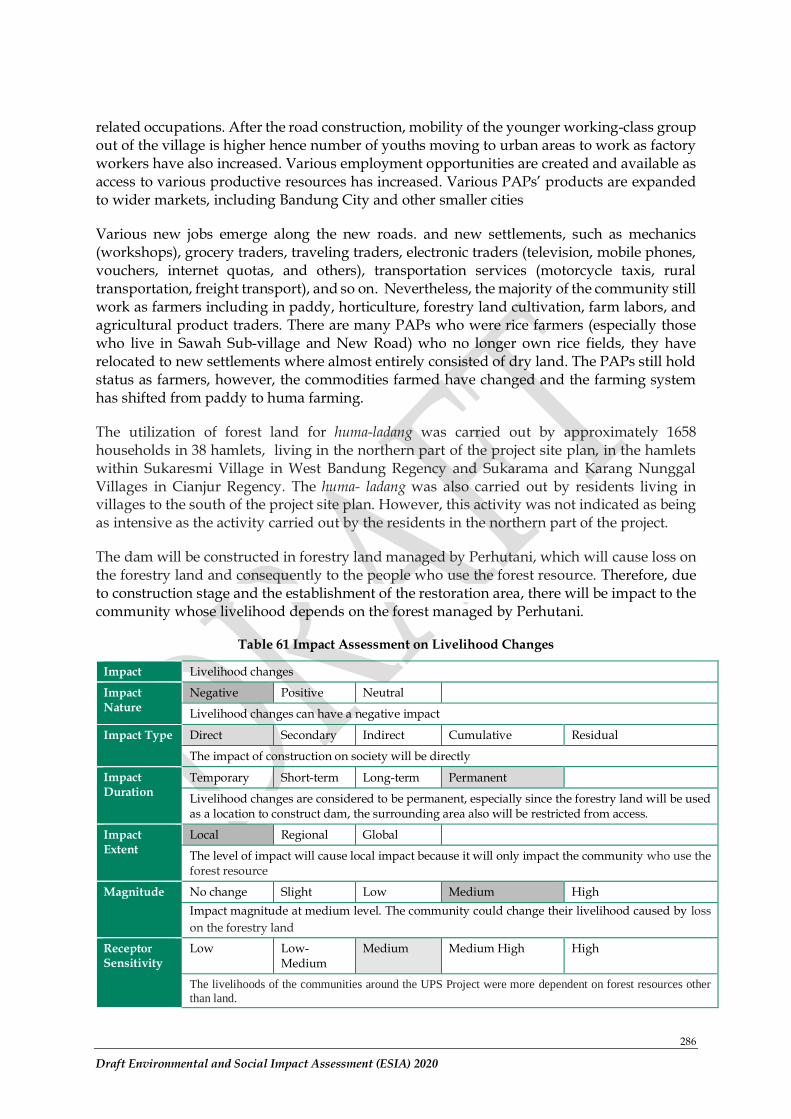
286
Draft Environmental and Social Impact Assessment (ESIA) 2020
related occupations. After the road construction, mobility of the younger working-class group out of the village is higher hence number of youths moving to urban areas to work as factory workers have also increased. Various employment opportunities are created and available as access to various productive resources has increased. Various PAPs’ products are expanded to wider markets, including Bandung City and other smaller cities
Various new jobs emerge along the new roads. and new settlements, such as mechanics (workshops), grocery traders, traveling traders, electronic traders (television, mobile phones, vouchers, internet quotas, and others), transportation services (motorcycle taxis, rural transportation, freight transport), and so on. Nevertheless, the majority of the community still work as farmers including in paddy, horticulture, forestry land cultivation, farm labors, and agricultural product traders. There are many PAPs who were rice farmers (especially those who live in Sawah Sub-village and New Road) who no longer own rice fields, they have relocated to new settlements where almost entirely consisted of dry land. The PAPs still hold status as farmers, however, the commodities farmed have changed and the farming system has shifted from paddy to huma farming.
The utilization of forest land for huma-ladang was carried out by approximately 1658 households in 38 hamlets, living in the northern part of the project site plan, in the hamlets within Sukaresmi Village in West Bandung Regency and Sukarama and Karang Nunggal Villages in Cianjur Regency. The huma- ladang was also carried out by residents living in villages to the south of the project site plan. However, this activity was not indicated as being as intensive as the activity carried out by the residents in the northern part of the project.
The dam will be constructed in forestry land managed by Perhutani, which will cause loss on the forestry land and consequently to the people who use the forest resource. Therefore, due to construction stage and the establishment of the restoration area, there will be impact to the community whose livelihood depends on the forest managed by Perhutani.
Table 61 Impact Assessment on Livelihood Changes
Impact Livelihood changes
Impact Nature
Negative Positive Neutral
Livelihood changes can have a negative impact
Impact Type Direct Secondary Indirect Cumulative Residual
The impact of construction on society will be directly
Impact Duration
Temporary Short-term Long-term Permanent
Livelihood changes are considered to be permanent, especially since the forestry land will be used as a location to construct dam, the surrounding area also will be restricted from access.
Impact Extent
Local Regional Global
The level of impact will cause local impact because it will only impact the community who use the forest resource
Magnitude No change Slight Low Medium High
Impact magnitude at medium level. The community could change their livelihood caused by loss
on the forestry land
Receptor Sensitivity
Low Low-Medium
Medium Medium High High
The livelihoods of the communities around the UPS Project were more dependent on forest resources other
than land.
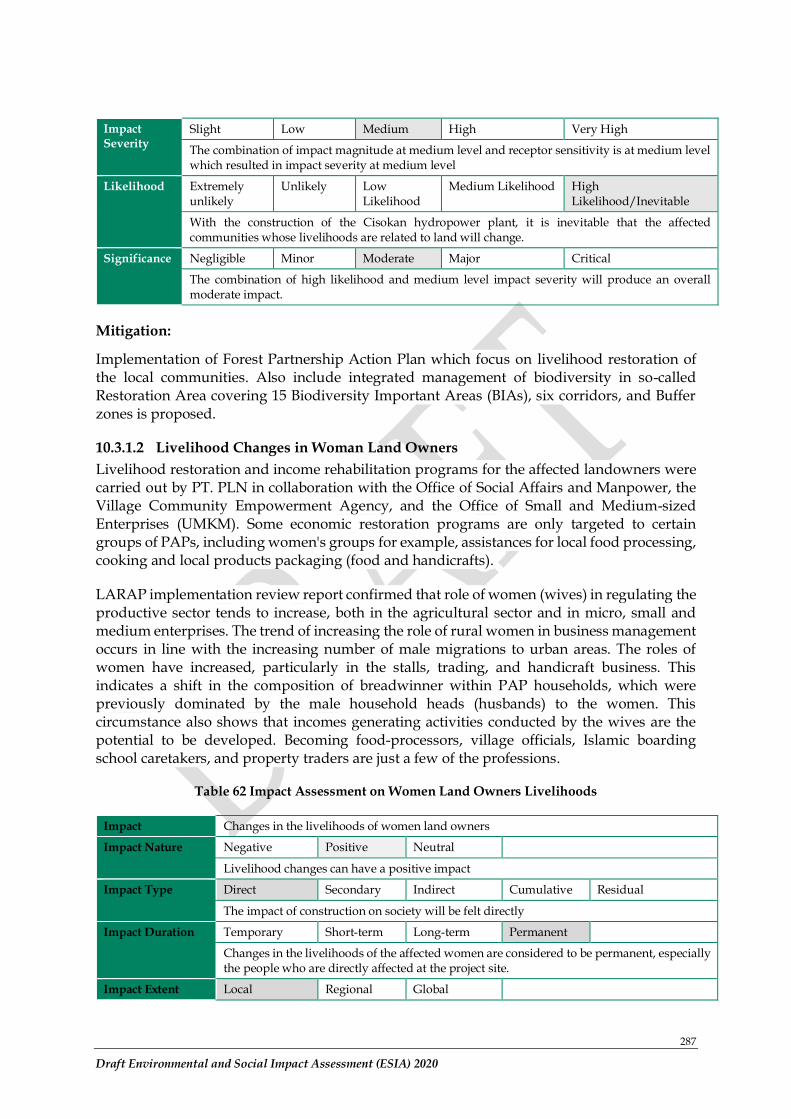
287
Draft Environmental and Social Impact Assessment (ESIA) 2020
Impact Severity
Slight Low Medium High Very High
The combination of impact magnitude at medium level and receptor sensitivity is at medium level which resulted in impact severity at medium level
Likelihood Extremely unlikely
Unlikely Low Likelihood
Medium Likelihood High Likelihood/Inevitable
With the construction of the Cisokan hydropower plant, it is inevitable that the affected communities whose livelihoods are related to land will change.
Significance Negligible Minor Moderate Major Critical
The combination of high likelihood and medium level impact severity will produce an overall moderate impact.
Mitigation:
Implementation of Forest Partnership Action Plan which focus on livelihood restoration of the local communities. Also include integrated management of biodiversity in so-called Restoration Area covering 15 Biodiversity Important Areas (BIAs), six corridors, and Buffer zones is proposed.
10.3.1.2 Livelihood Changes in Woman Land Owners
Livelihood restoration and income rehabilitation programs for the affected landowners were carried out by PT. PLN in collaboration with the Office of Social Affairs and Manpower, the Village Community Empowerment Agency, and the Office of Small and Medium-sized Enterprises (UMKM). Some economic restoration programs are only targeted to certain groups of PAPs, including women's groups for example, assistances for local food processing, cooking and local products packaging (food and handicrafts).
LARAP implementation review report confirmed that role of women (wives) in regulating the productive sector tends to increase, both in the agricultural sector and in micro, small and medium enterprises. The trend of increasing the role of rural women in business management occurs in line with the increasing number of male migrations to urban areas. The roles of women have increased, particularly in the stalls, trading, and handicraft business. This indicates a shift in the composition of breadwinner within PAP households, which were previously dominated by the male household heads (husbands) to the women. This circumstance also shows that incomes generating activities conducted by the wives are the potential to be developed. Becoming food-processors, village officials, Islamic boarding school caretakers, and property traders are just a few of the professions.
Table 62 Impact Assessment on Women Land Owners Livelihoods
Impact Changes in the livelihoods of women land owners
Impact Nature Negative Positive Neutral
Livelihood changes can have a positive impact
Impact Type Direct Secondary Indirect Cumulative Residual
The impact of construction on society will be felt directly
Impact Duration Temporary Short-term Long-term Permanent
Changes in the livelihoods of the affected women are considered to be permanent, especially the people who are directly affected at the project site.
Impact Extent Local Regional Global
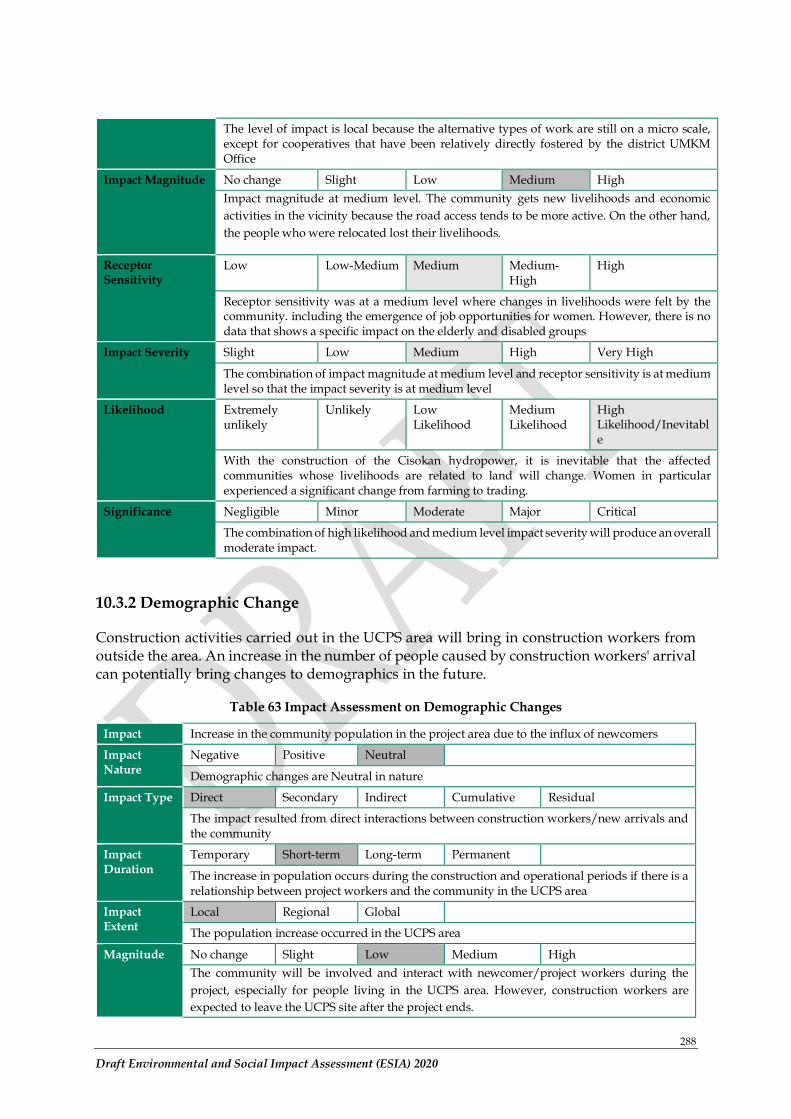
288
Draft Environmental and Social Impact Assessment (ESIA) 2020
The level of impact is local because the alternative types of work are still on a micro scale, except for cooperatives that have been relatively directly fostered by the district UMKM Office
Impact Magnitude No change Slight Low Medium High
Impact magnitude at medium level. The community gets new livelihoods and economic
activities in the vicinity because the road access tends to be more active. On the other hand,
the people who were relocated lost their livelihoods.
Receptor Sensitivity
Low Low-Medium Medium Medium-High
High
Receptor sensitivity was at a medium level where changes in livelihoods were felt by the community. including the emergence of job opportunities for women. However, there is no data that shows a specific impact on the elderly and disabled groups
Impact Severity Slight Low Medium High Very High
The combination of impact magnitude at medium level and receptor sensitivity is at medium level so that the impact severity is at medium level
Likelihood Extremely unlikely
Unlikely Low Likelihood
Medium Likelihood
High Likelihood/Inevitable
With the construction of the Cisokan hydropower, it is inevitable that the affected communities whose livelihoods are related to land will change. Women in particular experienced a significant change from farming to trading.
Significance Negligible Minor Moderate Major Critical
The combination of high likelihood and medium level impact severity will produce an overall moderate impact.
10.3.2 Demographic Change
Construction activities carried out in the UCPS area will bring in construction workers from outside the area. An increase in the number of people caused by construction workers' arrival can potentially bring changes to demographics in the future.
Table 63 Impact Assessment on Demographic Changes
Impact Increase in the community population in the project area due to the influx of newcomers
Impact Nature
Negative Positive Neutral
Demographic changes are Neutral in nature
Impact Type Direct Secondary Indirect Cumulative Residual
The impact resulted from direct interactions between construction workers/new arrivals and the community
Impact Duration
Temporary Short-term Long-term Permanent
The increase in population occurs during the construction and operational periods if there is a relationship between project workers and the community in the UCPS area
Impact Extent
Local Regional Global
The population increase occurred in the UCPS area
Magnitude No change Slight Low Medium High
The community will be involved and interact with newcomer/project workers during the
project, especially for people living in the UCPS area. However, construction workers are
expected to leave the UCPS site after the project ends.
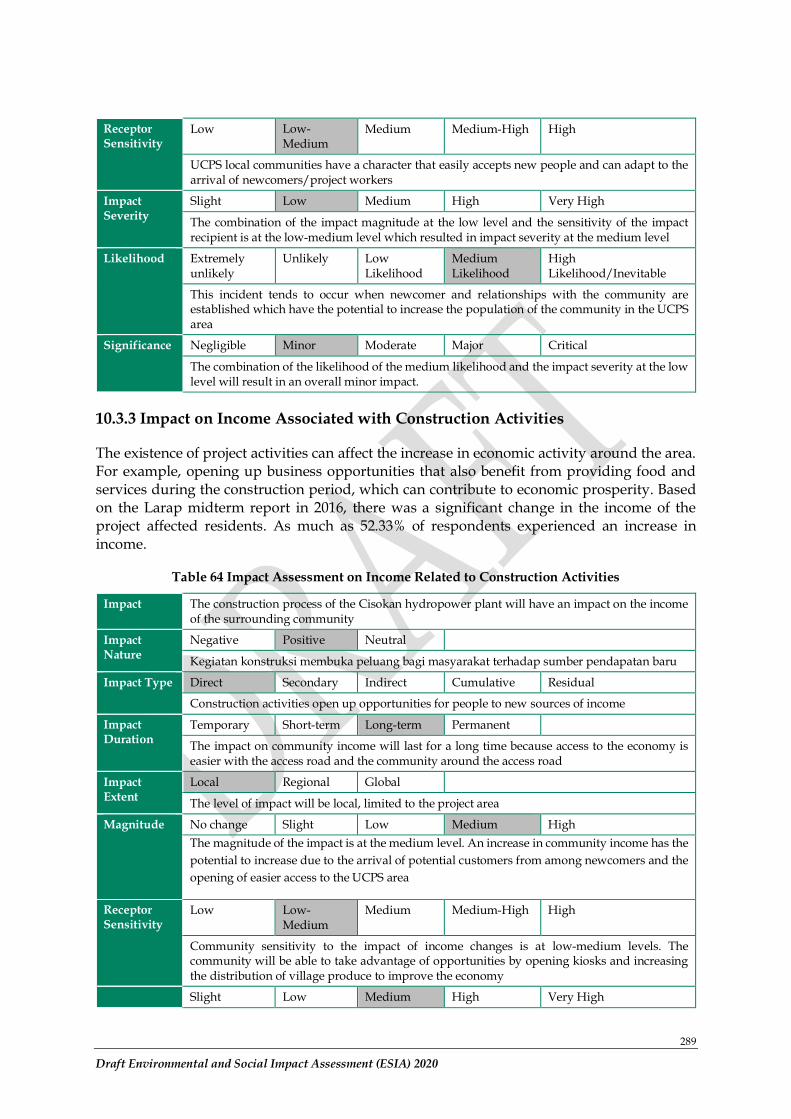
289
Draft Environmental and Social Impact Assessment (ESIA) 2020
Receptor Sensitivity
Low Low-Medium
Medium Medium-High High
UCPS local communities have a character that easily accepts new people and can adapt to the arrival of newcomers/project workers
Impact Severity
Slight Low Medium High Very High
The combination of the impact magnitude at the low level and the sensitivity of the impact recipient is at the low-medium level which resulted in impact severity at the medium level
Likelihood Extremely unlikely
Unlikely Low Likelihood
Medium Likelihood
High Likelihood/Inevitable
This incident tends to occur when newcomer and relationships with the community are established which have the potential to increase the population of the community in the UCPS area
Significance Negligible Minor Moderate Major Critical
The combination of the likelihood of the medium likelihood and the impact severity at the low level will result in an overall minor impact.
10.3.3 Impact on Income Associated with Construction Activities
The existence of project activities can affect the increase in economic activity around the area. For example, opening up business opportunities that also benefit from providing food and services during the construction period, which can contribute to economic prosperity. Based on the Larap midterm report in 2016, there was a significant change in the income of the project affected residents. As much as 52.33% of respondents experienced an increase in income.
Table 64 Impact Assessment on Income Related to Construction Activities
Impact The construction process of the Cisokan hydropower plant will have an impact on the income of the surrounding community
Impact Nature
Negative Positive Neutral
Kegiatan konstruksi membuka peluang bagi masyarakat terhadap sumber pendapatan baru
Impact Type Direct Secondary Indirect Cumulative Residual
Construction activities open up opportunities for people to new sources of income
Impact Duration
Temporary Short-term Long-term Permanent
The impact on community income will last for a long time because access to the economy is easier with the access road and the community around the access road
Impact Extent
Local Regional Global
The level of impact will be local, limited to the project area
Magnitude No change Slight Low Medium High
The magnitude of the impact is at the medium level. An increase in community income has the
potential to increase due to the arrival of potential customers from among newcomers and the
opening of easier access to the UCPS area
Receptor Sensitivity
Low Low-Medium
Medium Medium-High High
Community sensitivity to the impact of income changes is at low-medium levels. The community will be able to take advantage of opportunities by opening kiosks and increasing the distribution of village produce to improve the economy
Slight Low Medium High Very High
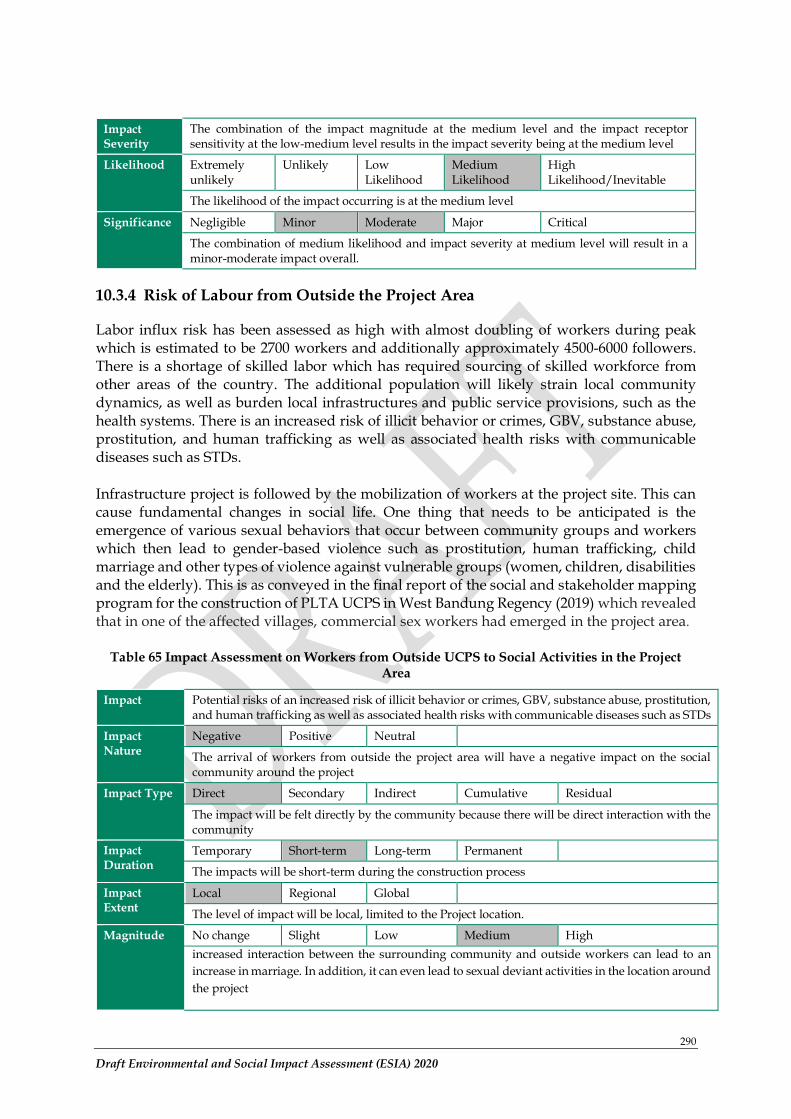
290
Draft Environmental and Social Impact Assessment (ESIA) 2020
Impact Severity
The combination of the impact magnitude at the medium level and the impact receptor sensitivity at the low-medium level results in the impact severity being at the medium level
Likelihood Extremely unlikely
Unlikely Low Likelihood
Medium Likelihood
High Likelihood/Inevitable
The likelihood of the impact occurring is at the medium level
Significance Negligible Minor Moderate Major Critical
The combination of medium likelihood and impact severity at medium level will result in a minor-moderate impact overall.
10.3.4 Risk of Labour from Outside the Project Area
Labor influx risk has been assessed as high with almost doubling of workers during peak which is estimated to be 2700 workers and additionally approximately 4500-6000 followers. There is a shortage of skilled labor which has required sourcing of skilled workforce from other areas of the country. The additional population will likely strain local community dynamics, as well as burden local infrastructures and public service provisions, such as the health systems. There is an increased risk of illicit behavior or crimes, GBV, substance abuse, prostitution, and human trafficking as well as associated health risks with communicable diseases such as STDs.
Infrastructure project is followed by the mobilization of workers at the project site. This can cause fundamental changes in social life. One thing that needs to be anticipated is the emergence of various sexual behaviors that occur between community groups and workers which then lead to gender-based violence such as prostitution, human trafficking, child marriage and other types of violence against vulnerable groups (women, children, disabilities and the elderly). This is as conveyed in the final report of the social and stakeholder mapping program for the construction of PLTA UCPS in West Bandung Regency (2019) which revealed that in one of the affected villages, commercial sex workers had emerged in the project area.
Table 65 Impact Assessment on Workers from Outside UCPS to Social Activities in the Project Area
Impact Potential risks of an increased risk of illicit behavior or crimes, GBV, substance abuse, prostitution, and human trafficking as well as associated health risks with communicable diseases such as STDs
Impact Nature
Negative Positive Neutral
The arrival of workers from outside the project area will have a negative impact on the social community around the project
Impact Type Direct Secondary Indirect Cumulative Residual
The impact will be felt directly by the community because there will be direct interaction with the community
Impact Duration
Temporary Short-term Long-term Permanent
The impacts will be short-term during the construction process
Impact Extent
Local Regional Global
The level of impact will be local, limited to the Project location.
Magnitude No change Slight Low Medium High
increased interaction between the surrounding community and outside workers can lead to an
increase in marriage. In addition, it can even lead to sexual deviant activities in the location around
the project
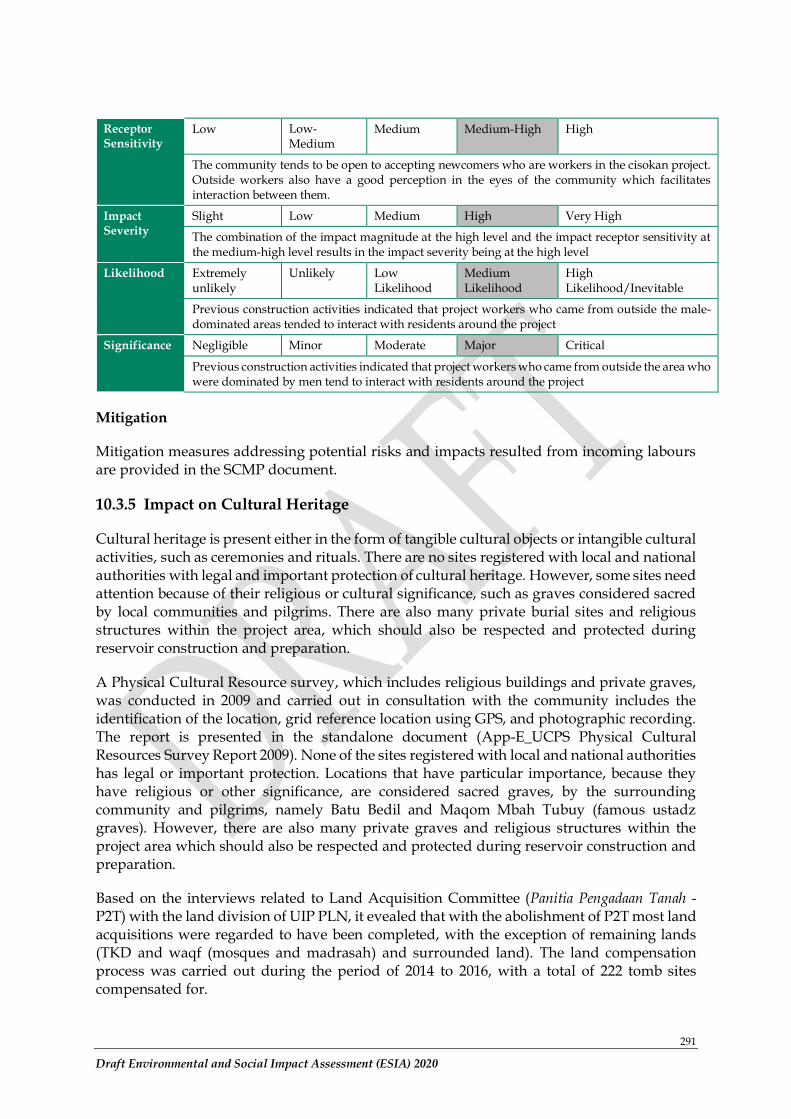
291
Draft Environmental and Social Impact Assessment (ESIA) 2020
Receptor Sensitivity
Low Low-Medium
Medium Medium-High High
The community tends to be open to accepting newcomers who are workers in the cisokan project. Outside workers also have a good perception in the eyes of the community which facilitates interaction between them.
Impact Severity
Slight Low Medium High Very High
The combination of the impact magnitude at the high level and the impact receptor sensitivity at the medium-high level results in the impact severity being at the high level
Likelihood Extremely unlikely
Unlikely Low Likelihood
Medium Likelihood
High Likelihood/Inevitable
Previous construction activities indicated that project workers who came from outside the male-dominated areas tended to interact with residents around the project
Significance Negligible Minor Moderate Major Critical
Previous construction activities indicated that project workers who came from outside the area who were dominated by men tend to interact with residents around the project
Mitigation
Mitigation measures addressing potential risks and impacts resulted from incoming labours are provided in the SCMP document.
10.3.5 Impact on Cultural Heritage
Cultural heritage is present either in the form of tangible cultural objects or intangible cultural activities, such as ceremonies and rituals. There are no sites registered with local and national authorities with legal and important protection of cultural heritage. However, some sites need attention because of their religious or cultural significance, such as graves considered sacred by local communities and pilgrims. There are also many private burial sites and religious structures within the project area, which should also be respected and protected during reservoir construction and preparation.
A Physical Cultural Resource survey, which includes religious buildings and private graves, was conducted in 2009 and carried out in consultation with the community includes the identification of the location, grid reference location using GPS, and photographic recording. The report is presented in the standalone document (App-E_UCPS Physical Cultural Resources Survey Report 2009). None of the sites registered with local and national authorities has legal or important protection. Locations that have particular importance, because they have religious or other significance, are considered sacred graves, by the surrounding community and pilgrims, namely Batu Bedil and Maqom Mbah Tubuy (famous ustadz graves). However, there are also many private graves and religious structures within the project area which should also be respected and protected during reservoir construction and preparation.
Based on the interviews related to Land Acquisition Committee (Panitia Pengadaan Tanah -P2T) with the land division of UIP PLN, it evealed that with the abolishment of P2T most land acquisitions were regarded to have been completed, with the exception of remaining lands (TKD and waqf (mosques and madrasah) and surrounded land). The land compensation process was carried out during the period of 2014 to 2016, with a total of 222 tomb sites compensated for.
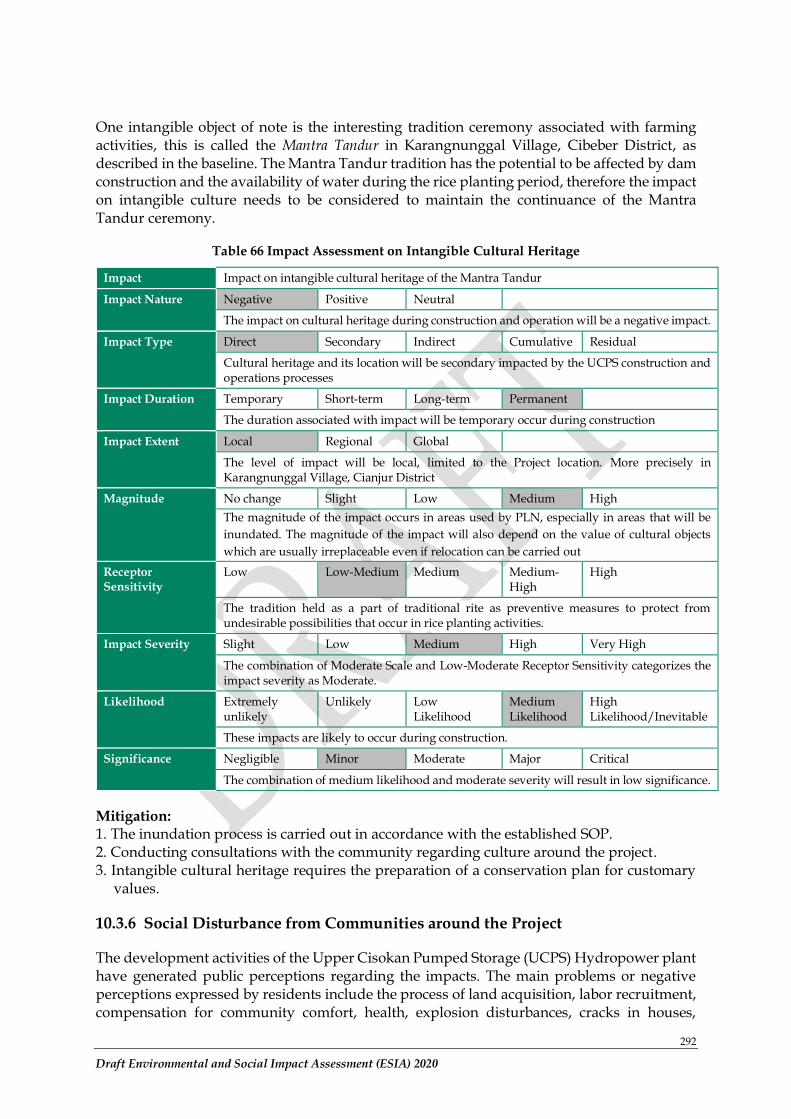
292
Draft Environmental and Social Impact Assessment (ESIA) 2020
One intangible object of note is the interesting tradition ceremony associated with farming activities, this is called the Mantra Tandur in Karangnunggal Village, Cibeber District, as described in the baseline. The Mantra Tandur tradition has the potential to be affected by dam construction and the availability of water during the rice planting period, therefore the impact on intangible culture needs to be considered to maintain the continuance of the Mantra Tandur ceremony.
Table 66 Impact Assessment on Intangible Cultural Heritage
Impact Impact on intangible cultural heritage of the Mantra Tandur
Impact Nature Negative Positive Neutral
The impact on cultural heritage during construction and operation will be a negative impact.
Impact Type Direct Secondary Indirect Cumulative Residual
Cultural heritage and its location will be secondary impacted by the UCPS construction and operations processes
Impact Duration Temporary Short-term Long-term Permanent
The duration associated with impact will be temporary occur during construction
Impact Extent Local Regional Global
The level of impact will be local, limited to the Project location. More precisely in Karangnunggal Village, Cianjur District
Magnitude No change Slight Low Medium High
The magnitude of the impact occurs in areas used by PLN, especially in areas that will be
inundated. The magnitude of the impact will also depend on the value of cultural objects
which are usually irreplaceable even if relocation can be carried out
Receptor Sensitivity
Low Low-Medium Medium Medium-High
High
The tradition held as a part of traditional rite as preventive measures to protect from undesirable possibilities that occur in rice planting activities.
Impact Severity Slight Low Medium High Very High
The combination of Moderate Scale and Low-Moderate Receptor Sensitivity categorizes the impact severity as Moderate.
Likelihood Extremely unlikely
Unlikely Low Likelihood
Medium Likelihood
High Likelihood/Inevitable
These impacts are likely to occur during construction.
Significance Negligible Minor Moderate Major Critical
The combination of medium likelihood and moderate severity will result in low significance.
Mitigation: 1. The inundation process is carried out in accordance with the established SOP. 2. Conducting consultations with the community regarding culture around the project. 3. Intangible cultural heritage requires the preparation of a conservation plan for customary
values.
10.3.6 Social Disturbance from Communities around the Project
The development activities of the Upper Cisokan Pumped Storage (UCPS) Hydropower plant have generated public perceptions regarding the impacts. The main problems or negative perceptions expressed by residents include the process of land acquisition, labor recruitment, compensation for community comfort, health, explosion disturbances, cracks in houses,
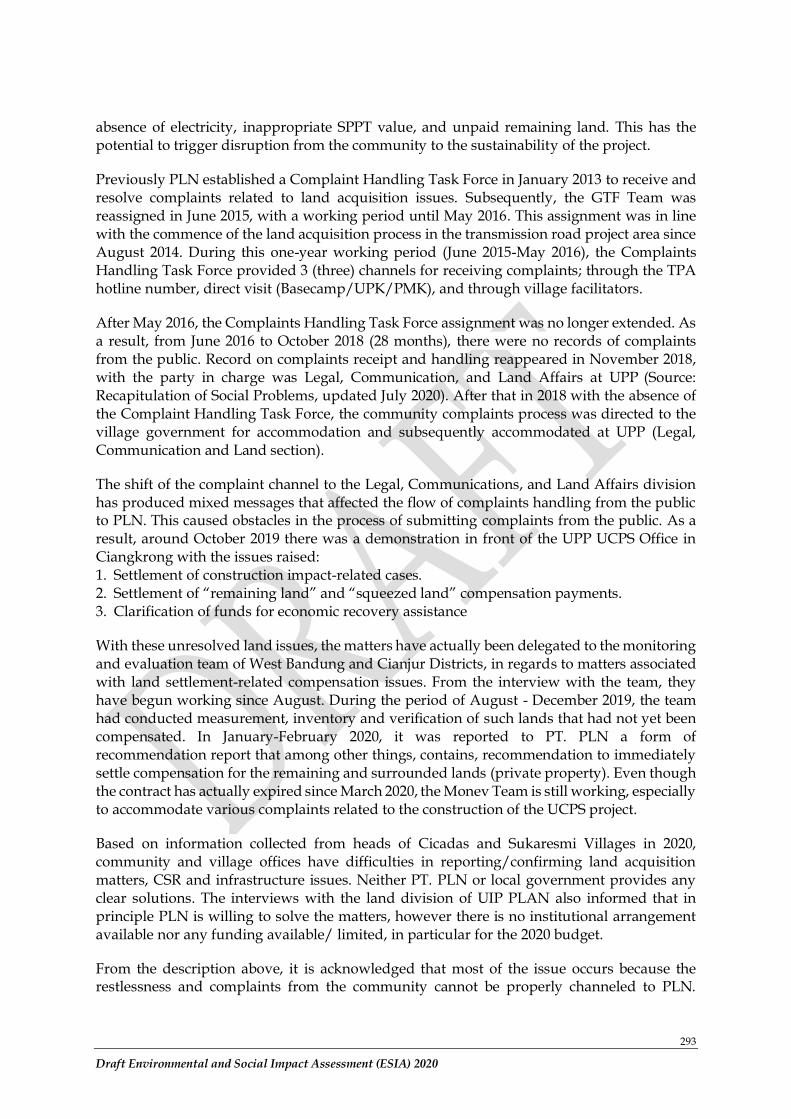
293
Draft Environmental and Social Impact Assessment (ESIA) 2020
absence of electricity, inappropriate SPPT value, and unpaid remaining land. This has the potential to trigger disruption from the community to the sustainability of the project.
Previously PLN established a Complaint Handling Task Force in January 2013 to receive and resolve complaints related to land acquisition issues. Subsequently, the GTF Team was reassigned in June 2015, with a working period until May 2016. This assignment was in line with the commence of the land acquisition process in the transmission road project area since August 2014. During this one-year working period (June 2015-May 2016), the Complaints Handling Task Force provided 3 (three) channels for receiving complaints; through the TPA hotline number, direct visit (Basecamp/UPK/PMK), and through village facilitators.
After May 2016, the Complaints Handling Task Force assignment was no longer extended. As a result, from June 2016 to October 2018 (28 months), there were no records of complaints from the public. Record on complaints receipt and handling reappeared in November 2018, with the party in charge was Legal, Communication, and Land Affairs at UPP (Source: Recapitulation of Social Problems, updated July 2020). After that in 2018 with the absence of the Complaint Handling Task Force, the community complaints process was directed to the village government for accommodation and subsequently accommodated at UPP (Legal, Communication and Land section).
The shift of the complaint channel to the Legal, Communications, and Land Affairs division has produced mixed messages that affected the flow of complaints handling from the public to PLN. This caused obstacles in the process of submitting complaints from the public. As a result, around October 2019 there was a demonstration in front of the UPP UCPS Office in Ciangkrong with the issues raised: 1. Settlement of construction impact-related cases. 2. Settlement of “remaining land” and “squeezed land” compensation payments. 3. Clarification of funds for economic recovery assistance
With these unresolved land issues, the matters have actually been delegated to the monitoring and evaluation team of West Bandung and Cianjur Districts, in regards to matters associated with land settlement-related compensation issues. From the interview with the team, they have begun working since August. During the period of August - December 2019, the team had conducted measurement, inventory and verification of such lands that had not yet been compensated. In January-February 2020, it was reported to PT. PLN a form of recommendation report that among other things, contains, recommendation to immediately settle compensation for the remaining and surrounded lands (private property). Even though the contract has actually expired since March 2020, the Monev Team is still working, especially to accommodate various complaints related to the construction of the UCPS project.
Based on information collected from heads of Cicadas and Sukaresmi Villages in 2020, community and village offices have difficulties in reporting/confirming land acquisition matters, CSR and infrastructure issues. Neither PT. PLN or local government provides any clear solutions. The interviews with the land division of UIP PLAN also informed that in principle PLN is willing to solve the matters, however there is no institutional arrangement available nor any funding available/ limited, in particular for the 2020 budget.
From the description above, it is acknowledged that most of the issue occurs because the restlessness and complaints from the community cannot be properly channeled to PLN.
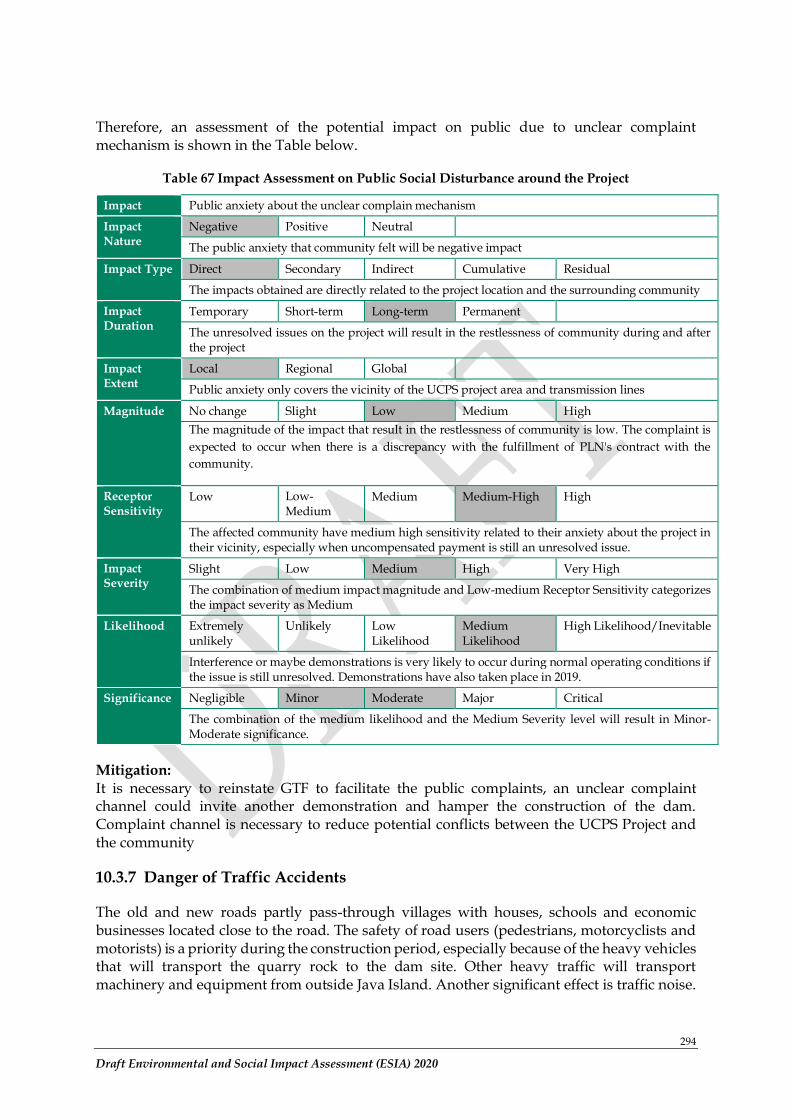
294
Draft Environmental and Social Impact Assessment (ESIA) 2020
Therefore, an assessment of the potential impact on public due to unclear complaint mechanism is shown in the Table below.
Table 67 Impact Assessment on Public Social Disturbance around the Project
Impact Public anxiety about the unclear complain mechanism
Impact Nature
Negative Positive Neutral
The public anxiety that community felt will be negative impact
Impact Type Direct Secondary Indirect Cumulative Residual
The impacts obtained are directly related to the project location and the surrounding community
Impact Duration
Temporary Short-term Long-term Permanent
The unresolved issues on the project will result in the restlessness of community during and after the project
Impact Extent
Local Regional Global
Public anxiety only covers the vicinity of the UCPS project area and transmission lines
Magnitude No change Slight Low Medium High
The magnitude of the impact that result in the restlessness of community is low. The complaint is
expected to occur when there is a discrepancy with the fulfillment of PLN's contract with the
community.
Receptor Sensitivity
Low Low-Medium
Medium Medium-High High
The affected community have medium high sensitivity related to their anxiety about the project in their vicinity, especially when uncompensated payment is still an unresolved issue.
Impact Severity
Slight Low Medium High Very High
The combination of medium impact magnitude and Low-medium Receptor Sensitivity categorizes the impact severity as Medium
Likelihood Extremely unlikely
Unlikely Low Likelihood
Medium Likelihood
High Likelihood/Inevitable
Interference or maybe demonstrations is very likely to occur during normal operating conditions if the issue is still unresolved. Demonstrations have also taken place in 2019.
Significance Negligible Minor Moderate Major Critical
The combination of the medium likelihood and the Medium Severity level will result in Minor-Moderate significance.
Mitigation:
It is necessary to reinstate GTF to facilitate the public complaints, an unclear complaint channel could invite another demonstration and hamper the construction of the dam. Complaint channel is necessary to reduce potential conflicts between the UCPS Project and the community
10.3.7 Danger of Traffic Accidents
The old and new roads partly pass-through villages with houses, schools and economic businesses located close to the road. The safety of road users (pedestrians, motorcyclists and motorists) is a priority during the construction period, especially because of the heavy vehicles that will transport the quarry rock to the dam site. Other heavy traffic will transport machinery and equipment from outside Java Island. Another significant effect is traffic noise.
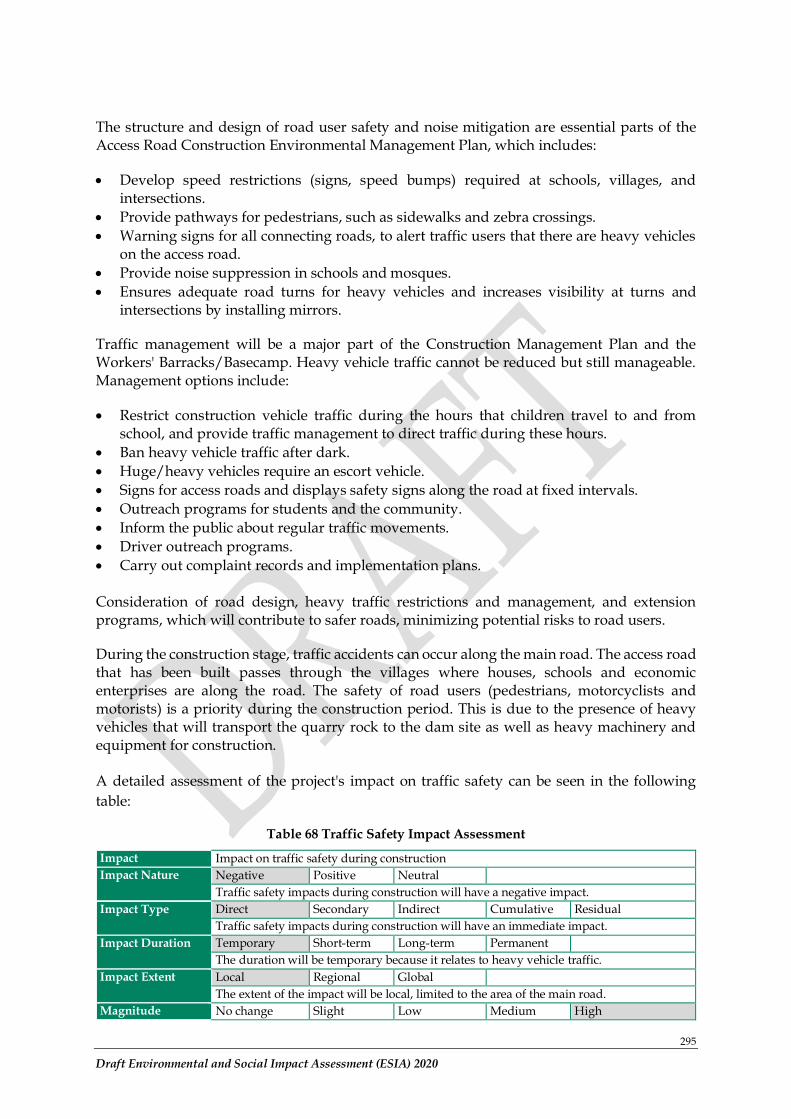
295
Draft Environmental and Social Impact Assessment (ESIA) 2020
The structure and design of road user safety and noise mitigation are essential parts of the Access Road Construction Environmental Management Plan, which includes:
• Develop speed restrictions (signs, speed bumps) required at schools, villages, and intersections.
• Provide pathways for pedestrians, such as sidewalks and zebra crossings.
• Warning signs for all connecting roads, to alert traffic users that there are heavy vehicles on the access road.
• Provide noise suppression in schools and mosques.
• Ensures adequate road turns for heavy vehicles and increases visibility at turns and intersections by installing mirrors.
Traffic management will be a major part of the Construction Management Plan and the Workers' Barracks/Basecamp. Heavy vehicle traffic cannot be reduced but still manageable. Management options include:
• Restrict construction vehicle traffic during the hours that children travel to and from school, and provide traffic management to direct traffic during these hours.
• Ban heavy vehicle traffic after dark.
• Huge/heavy vehicles require an escort vehicle.
• Signs for access roads and displays safety signs along the road at fixed intervals.
• Outreach programs for students and the community.
• Inform the public about regular traffic movements.
• Driver outreach programs.
• Carry out complaint records and implementation plans. Consideration of road design, heavy traffic restrictions and management, and extension programs, which will contribute to safer roads, minimizing potential risks to road users.
During the construction stage, traffic accidents can occur along the main road. The access road that has been built passes through the villages where houses, schools and economic enterprises are along the road. The safety of road users (pedestrians, motorcyclists and motorists) is a priority during the construction period. This is due to the presence of heavy vehicles that will transport the quarry rock to the dam site as well as heavy machinery and equipment for construction.
A detailed assessment of the project's impact on traffic safety can be seen in the following
table:
Table 68 Traffic Safety Impact Assessment
Impact Impact on traffic safety during construction
Impact Nature Negative Positive Neutral
Traffic safety impacts during construction will have a negative impact.
Impact Type Direct Secondary Indirect Cumulative Residual
Traffic safety impacts during construction will have an immediate impact.
Impact Duration Temporary Short-term Long-term Permanent
The duration will be temporary because it relates to heavy vehicle traffic.
Impact Extent Local Regional Global
The extent of the impact will be local, limited to the area of the main road.
Magnitude No change Slight Low Medium High
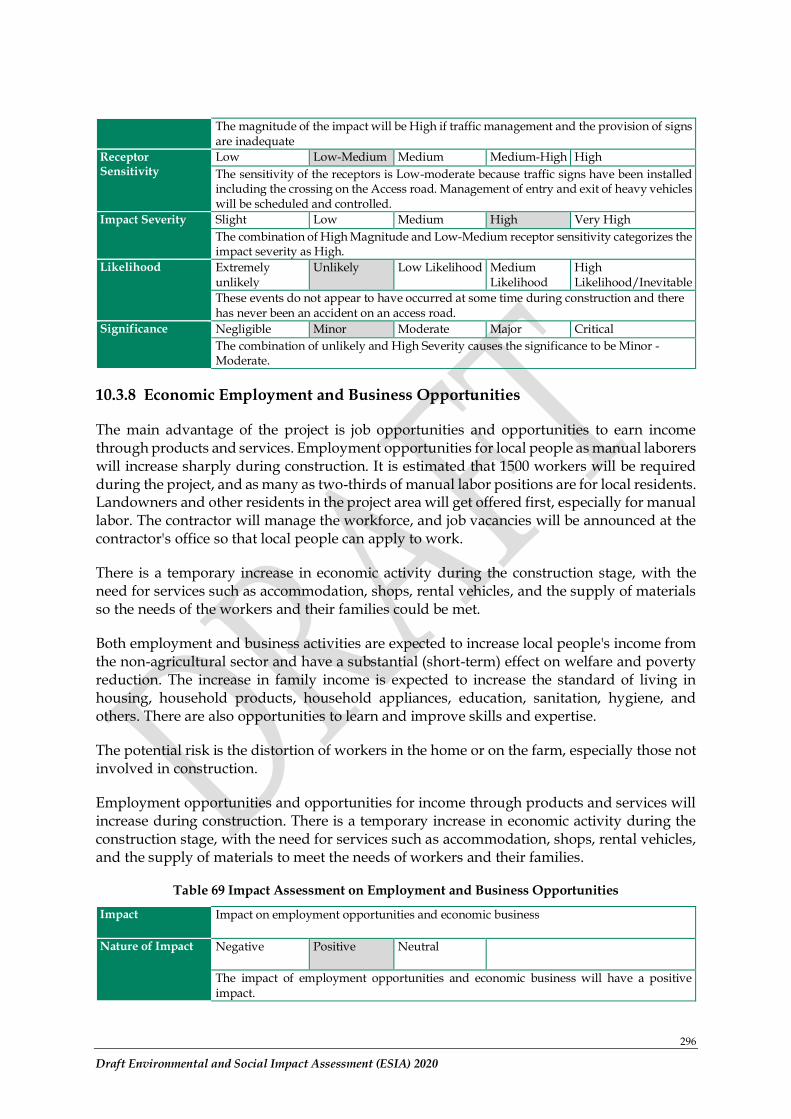
296
Draft Environmental and Social Impact Assessment (ESIA) 2020
The magnitude of the impact will be High if traffic management and the provision of signs are inadequate
Receptor Sensitivity
Low Low-Medium Medium Medium-High High
The sensitivity of the receptors is Low-moderate because traffic signs have been installed including the crossing on the Access road. Management of entry and exit of heavy vehicles will be scheduled and controlled.
Impact Severity Slight Low Medium High Very High
The combination of High Magnitude and Low-Medium receptor sensitivity categorizes the impact severity as High.
Likelihood Extremely unlikely
Unlikely Low Likelihood Medium Likelihood
High Likelihood/Inevitable
These events do not appear to have occurred at some time during construction and there has never been an accident on an access road.
Significance Negligible Minor Moderate Major Critical
The combination of unlikely and High Severity causes the significance to be Minor - Moderate.
10.3.8 Economic Employment and Business Opportunities
The main advantage of the project is job opportunities and opportunities to earn income through products and services. Employment opportunities for local people as manual laborers will increase sharply during construction. It is estimated that 1500 workers will be required during the project, and as many as two-thirds of manual labor positions are for local residents. Landowners and other residents in the project area will get offered first, especially for manual labor. The contractor will manage the workforce, and job vacancies will be announced at the contractor's office so that local people can apply to work.
There is a temporary increase in economic activity during the construction stage, with the need for services such as accommodation, shops, rental vehicles, and the supply of materials so the needs of the workers and their families could be met.
Both employment and business activities are expected to increase local people's income from the non-agricultural sector and have a substantial (short-term) effect on welfare and poverty reduction. The increase in family income is expected to increase the standard of living in housing, household products, household appliances, education, sanitation, hygiene, and others. There are also opportunities to learn and improve skills and expertise.
The potential risk is the distortion of workers in the home or on the farm, especially those not involved in construction.
Employment opportunities and opportunities for income through products and services will increase during construction. There is a temporary increase in economic activity during the construction stage, with the need for services such as accommodation, shops, rental vehicles, and the supply of materials to meet the needs of workers and their families.
Table 69 Impact Assessment on Employment and Business Opportunities
Impact Impact on employment opportunities and economic business
Nature of Impact
Negative Positive Neutral
The impact of employment opportunities and economic business will have a positive impact.
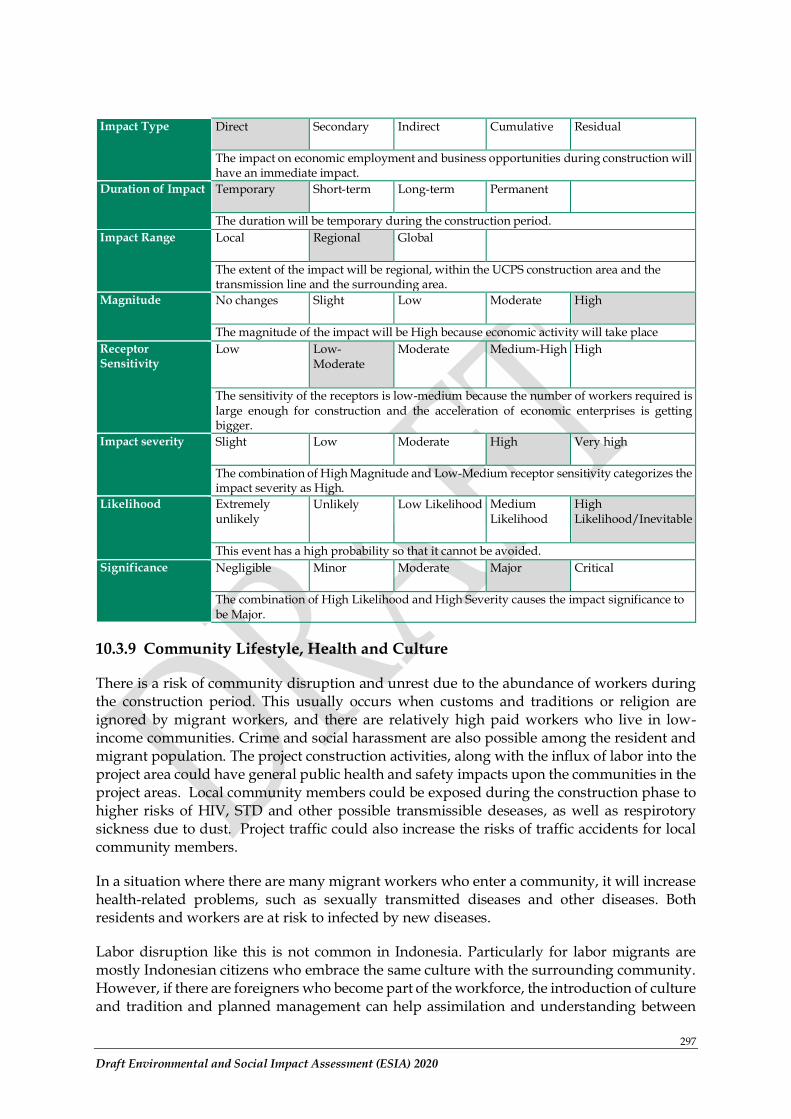
297
Draft Environmental and Social Impact Assessment (ESIA) 2020
Impact Type
Direct Secondary Indirect Cumulative Residual
The impact on economic employment and business opportunities during construction will have an immediate impact.
Duration of Impact
Temporary Short-term Long-term Permanent
The duration will be temporary during the construction period.
Impact Range
Local Regional Global
The extent of the impact will be regional, within the UCPS construction area and the transmission line and the surrounding area.
Magnitude
No changes Slight Low Moderate High
The magnitude of the impact will be High because economic activity will take place
Receptor Sensitivity
Low Low-Moderate
Moderate Medium-High High
The sensitivity of the receptors is low-medium because the number of workers required is large enough for construction and the acceleration of economic enterprises is getting bigger.
Impact severity
Slight Low Moderate High Very high
The combination of High Magnitude and Low-Medium receptor sensitivity categorizes the impact severity as High.
Likelihood
Extremely unlikely
Unlikely Low Likelihood Medium Likelihood
High Likelihood/Inevitable
This event has a high probability so that it cannot be avoided.
Significance
Negligible Minor Moderate Major Critical
The combination of High Likelihood and High Severity causes the impact significance to be Major.
10.3.9 Community Lifestyle, Health and Culture
There is a risk of community disruption and unrest due to the abundance of workers during the construction period. This usually occurs when customs and traditions or religion are ignored by migrant workers, and there are relatively high paid workers who live in low-income communities. Crime and social harassment are also possible among the resident and migrant population. The project construction activities, along with the influx of labor into the project area could have general public health and safety impacts upon the communities in the project areas. Local community members could be exposed during the construction phase to higher risks of HIV, STD and other possible transmissible deseases, as well as respirotory sickness due to dust. Project traffic could also increase the risks of traffic accidents for local community members.
In a situation where there are many migrant workers who enter a community, it will increase health-related problems, such as sexually transmitted diseases and other diseases. Both residents and workers are at risk to infected by new diseases.
Labor disruption like this is not common in Indonesia. Particularly for labor migrants are mostly Indonesian citizens who embrace the same culture with the surrounding community. However, if there are foreigners who become part of the workforce, the introduction of culture and tradition and planned management can help assimilation and understanding between
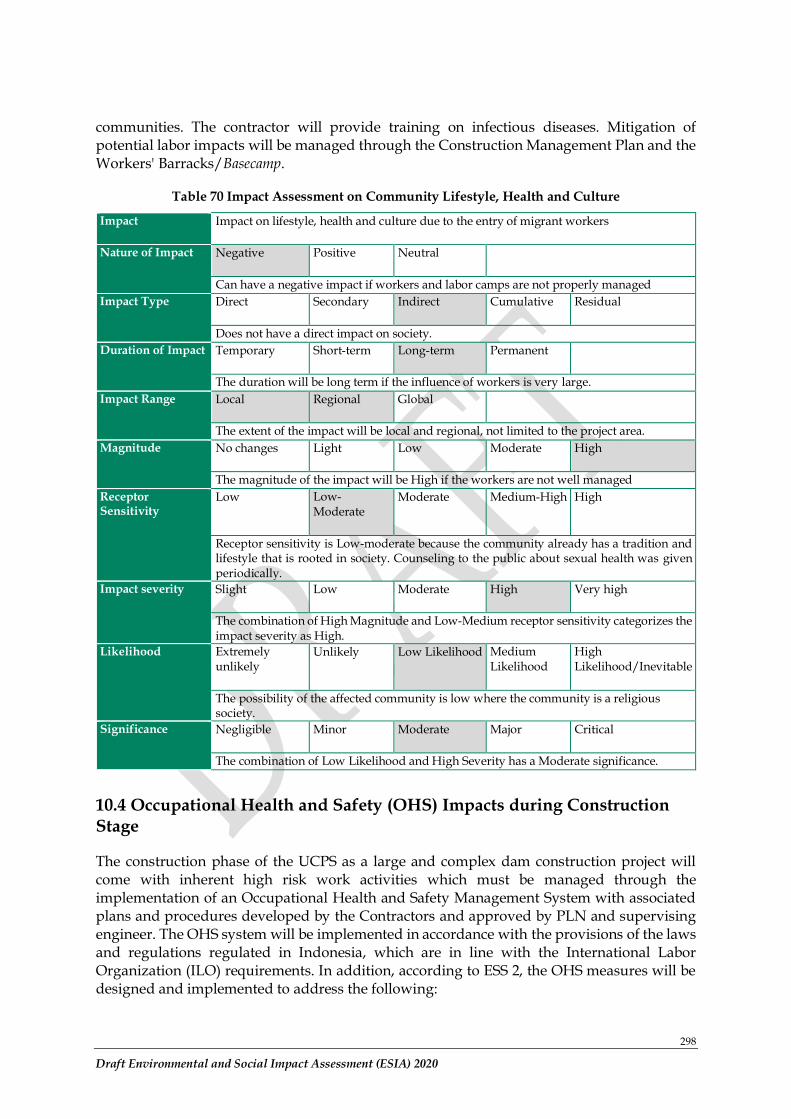
298
Draft Environmental and Social Impact Assessment (ESIA) 2020
communities. The contractor will provide training on infectious diseases. Mitigation of potential labor impacts will be managed through the Construction Management Plan and the Workers' Barracks/Basecamp.
Table 70 Impact Assessment on Community Lifestyle, Health and Culture
Impact Impact on lifestyle, health and culture due to the entry of migrant workers
Nature of Impact
Negative Positive Neutral
Can have a negative impact if workers and labor camps are not properly managed
Impact Type
Direct Secondary Indirect Cumulative Residual
Does not have a direct impact on society.
Duration of Impact
Temporary Short-term Long-term Permanent
The duration will be long term if the influence of workers is very large.
Impact Range
Local Regional Global
The extent of the impact will be local and regional, not limited to the project area.
Magnitude
No changes Light Low Moderate High
The magnitude of the impact will be High if the workers are not well managed
Receptor Sensitivity
Low Low-Moderate
Moderate Medium-High High
Receptor sensitivity is Low-moderate because the community already has a tradition and lifestyle that is rooted in society. Counseling to the public about sexual health was given periodically.
Impact severity
Slight Low Moderate High Very high
The combination of High Magnitude and Low-Medium receptor sensitivity categorizes the impact severity as High.
Likelihood
Extremely unlikely
Unlikely Low Likelihood Medium Likelihood
High Likelihood/Inevitable
The possibility of the affected community is low where the community is a religious society.
Significance
Negligible Minor Moderate Major Critical
The combination of Low Likelihood and High Severity has a Moderate significance.
10.4 Occupational Health and Safety (OHS) Impacts during Construction Stage
The construction phase of the UCPS as a large and complex dam construction project will come with inherent high risk work activities which must be managed through the implementation of an Occupational Health and Safety Management System with associated plans and procedures developed by the Contractors and approved by PLN and supervising engineer. The OHS system will be implemented in accordance with the provisions of the laws and regulations regulated in Indonesia, which are in line with the International Labor Organization (ILO) requirements. In addition, according to ESS 2, the OHS measures will be designed and implemented to address the following:
299
Draft Environmental and Social Impact Assessment (ESIA) 2020
(a) Indonesian Laws and regulations related to OHS, The World Bank Group EHS Guidelines Good Practice Note Environmental, Health and Safety Approaches for Hydropower Projects and other Good International Industry Practice for occupational health and safety.
(b) Identification of potential hazards to project workers, particularly those that may be life-threatening.
(c) Provision of preventive and protective measures, including modification, substitution, or elimination of hazardous conditions or substances.
(d) Training of project workers and maintenance of training records.
(e) Documentation and reporting of occupational accidents, diseases, and incidents.
(f) Emergency prevention and preparedness and response arrangements to emergency situations, including coordination with the with the Emergency Preparedness and Response measures established under ESS 4.
(g) Remedies for adverse impacts such as occupational injuries, deaths, disability, and disease. Such remedies should take into account, as applicable, the wage level and age of the project worker, the degree of adverse impact, and the number and age of dependents concerned.
Discussion of Impacts
OHS risks are anticipated from the construction activities and mobilization of construction workers under different Work Packages (WP). This includes construction of Upper and Lower Dams and Waterways, Power house, Switch Yard, and Building Works (including operation of the Gunung Karang Quarry), 500 kV Transmission Line, Hydraulic Metal Works, and provision of Pump Turbine, Generator-Motor, and Auxiliary Equipment.
The most significant Occupational Health and Safety (OHS) hazards associated with hydropower projects occur during the construction phase and include activities with carry an extremely high risk for workers. These activities carry an elevated risk of injury or fatality if not managed adequately, these activities are:
- Working near water such as rivers and reservoirs. - Working at heights, particularly during dam wall construction and transmission line
construction and stringing. - Working in confined spaces during tunneling for example. - Working underground. - Working with heavy machinery, particularly on steep and unstable slopes, tunnelling,
on public roads, in quarry. - Working with explosives. - Working on slopes and unstable ground. - Working with low voltage and high voltage electricity. - Using vehicles on public and project roads. - Extended or elevated exposure to dust, noise, the sun, heat and wet weather. - Working at night / shift work / fatigue / heat stress. - Working with hazardous materials such as fuels, cement, and fly ash.Exposure to
illnesses, communicable diseases, COVID-19 and others.
300
Draft Environmental and Social Impact Assessment (ESIA) 2020
- Exposure to mental or physical harassment, SEA/SH, and injury from interpersonal conflicts.
- Exposure to floods, earthquakes, landslides and other natural disasters.
A number of factors will influence the construction project’s success in managing these high severity risks, firstly supervision by the project owner (PLN) and its Supervision Engineer, secondly the experience and safety compliance and culture of the Contractor and its management of sub-contractors, and thirdly the level of training and skillset of the workforce.
Project workers are likely to be exposed to the above identified risks over the estimated 5 years of construction. Workers with low experience of working on large scale construction project are expected to be more vulnerable as their skillsets, experience and understanding of health and safety will probably be limited compared to the skilled workers who will have worked on similar projects and have sufficient training.
Furthermore, the project site location has limited high quality healthcare facilities is not conducive for providing a good response to moderate to serious accidents. Community health centers the area are not adequate to deal with emergency first-aid response or more serious accidents and the closest well-equipped hospitals are located in Bandung which is over 2 hours away by road.
Each Contractor for each package will be expected to conduct a risk identification and risk register using the Hazard Identification, Risk Analysis, and Risk Control (HIRARC) method.
The Hierarchy of Controls pyramid will form the foundation by which safety risks and hazards are managed and controlled. The most effective measure is elimination/substitution, followed by engineering controls, administrative and work practice controls and finally PPE as the least effective at the bottom.
The controls are discussed below:
1. Elimination/substitution. The best way to deal with a safety hazard is to eliminate it altogether by preventing exposure to the hazard before it even occurs. In substitution, one seeks to permanently reduce the risk by substituting a less hazardous material or reduction of system energy. These are process design solutions that require a permanent change to how a job is performed.
2. Engineering controls. Change the structure of the work area to reduce exposure using safety devices or barriers. An example would be to place a high fence around a dangerous location to prevent access.
3. Administrative and work practice controls. Implement procedures that require workers to do things to reduce their exposure to a risk. A lockout/tagout program is an example of an administrative control. Set expectations that workers will engage in safe work practices. Another example is the use of warning signs, sirens and alarms.
4. Personal protective equipment (PPE). Make sure employees wear the proper protective clothing, gloves and eyeglasses for the job. Examples are safety goggles, respirators, fall protection and hearing protection.
Impact Evaluation and Significance
Worker health and safety across the Project must have a ‘zero harm’ goal and be managed carefully to ensure minimal accidents and no fatalities occur. The main area of concern during
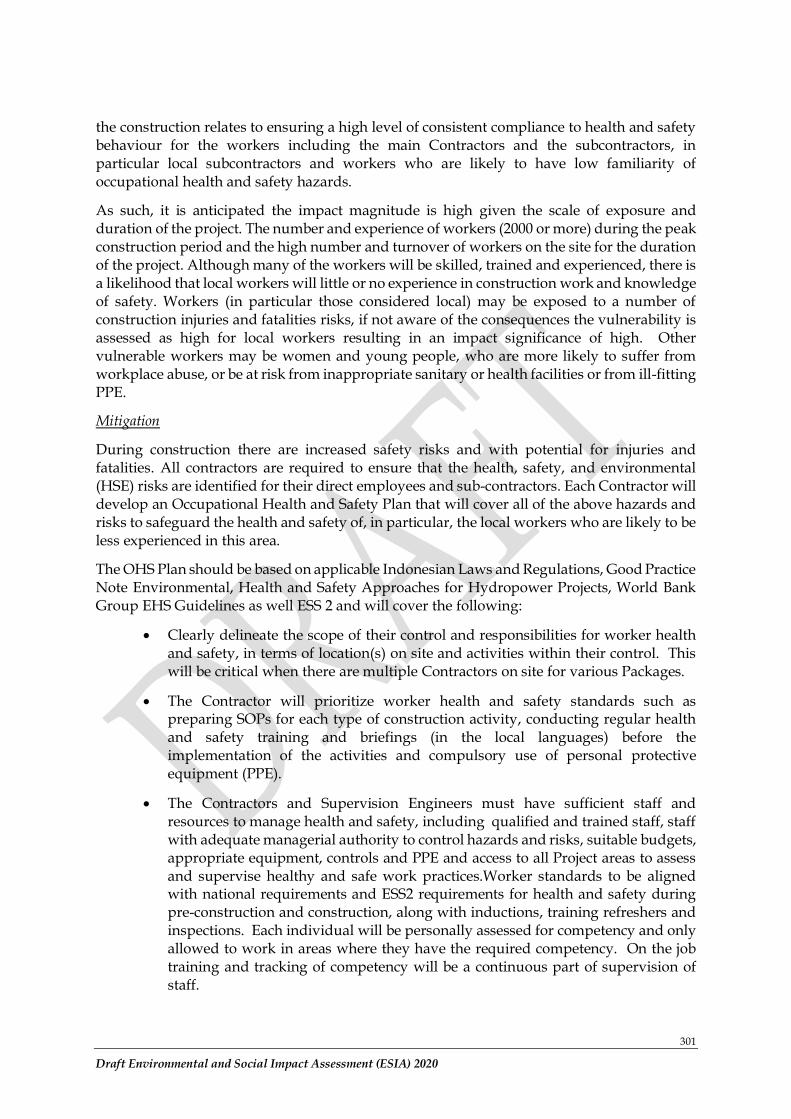
301
Draft Environmental and Social Impact Assessment (ESIA) 2020
the construction relates to ensuring a high level of consistent compliance to health and safety behaviour for the workers including the main Contractors and the subcontractors, in particular local subcontractors and workers who are likely to have low familiarity of occupational health and safety hazards.
As such, it is anticipated the impact magnitude is high given the scale of exposure and duration of the project. The number and experience of workers (2000 or more) during the peak construction period and the high number and turnover of workers on the site for the duration of the project. Although many of the workers will be skilled, trained and experienced, there is a likelihood that local workers will little or no experience in construction work and knowledge of safety. Workers (in particular those considered local) may be exposed to a number of construction injuries and fatalities risks, if not aware of the consequences the vulnerability is assessed as high for local workers resulting in an impact significance of high. Other vulnerable workers may be women and young people, who are more likely to suffer from workplace abuse, or be at risk from inappropriate sanitary or health facilities or from ill-fitting PPE.
Mitigation
During construction there are increased safety risks and with potential for injuries and fatalities. All contractors are required to ensure that the health, safety, and environmental (HSE) risks are identified for their direct employees and sub-contractors. Each Contractor will develop an Occupational Health and Safety Plan that will cover all of the above hazards and risks to safeguard the health and safety of, in particular, the local workers who are likely to be less experienced in this area.
The OHS Plan should be based on applicable Indonesian Laws and Regulations, Good Practice Note Environmental, Health and Safety Approaches for Hydropower Projects, World Bank Group EHS Guidelines as well ESS 2 and will cover the following:
• Clearly delineate the scope of their control and responsibilities for worker health and safety, in terms of location(s) on site and activities within their control. This will be critical when there are multiple Contractors on site for various Packages.
• The Contractor will prioritize worker health and safety standards such as preparing SOPs for each type of construction activity, conducting regular health and safety training and briefings (in the local languages) before the implementation of the activities and compulsory use of personal protective equipment (PPE).
• The Contractors and Supervision Engineers must have sufficient staff and resources to manage health and safety, including qualified and trained staff, staff with adequate managerial authority to control hazards and risks, suitable budgets, appropriate equipment, controls and PPE and access to all Project areas to assess and supervise healthy and safe work practices.Worker standards to be aligned with national requirements and ESS2 requirements for health and safety during pre-construction and construction, along with inductions, training refreshers and inspections. Each individual will be personally assessed for competency and only allowed to work in areas where they have the required competency. On the job training and tracking of competency will be a continuous part of supervision of staff.
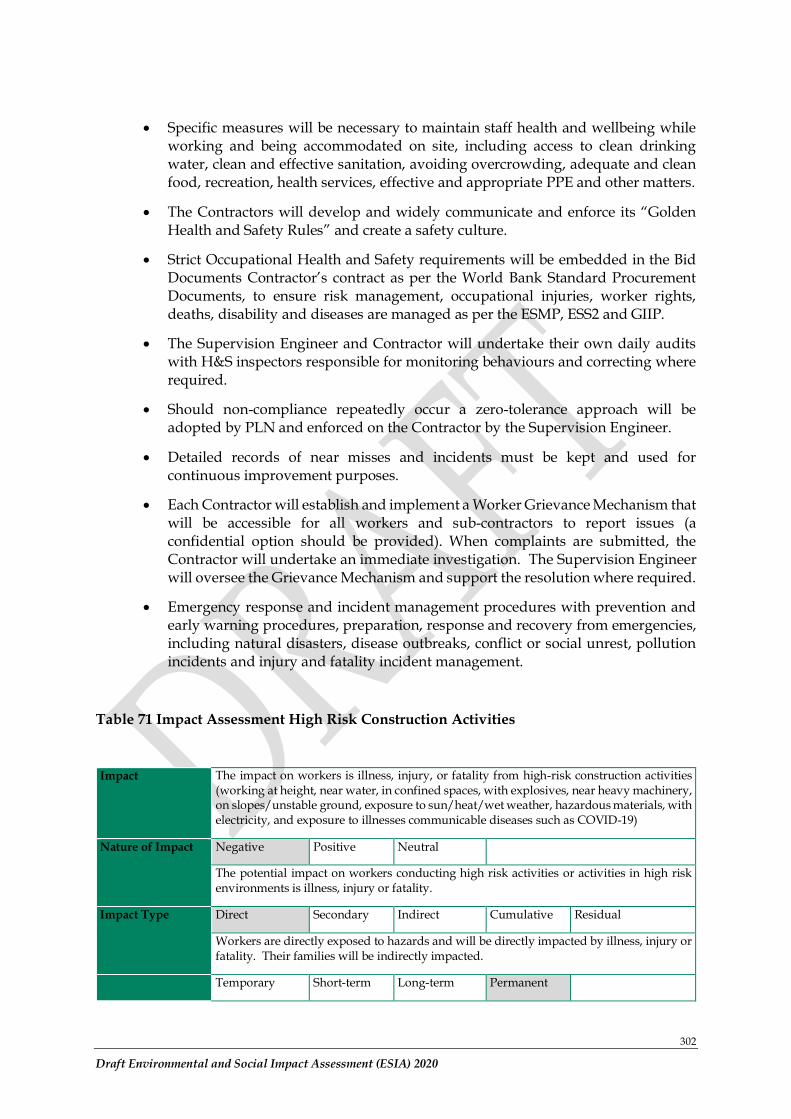
302
Draft Environmental and Social Impact Assessment (ESIA) 2020
• Specific measures will be necessary to maintain staff health and wellbeing while working and being accommodated on site, including access to clean drinking water, clean and effective sanitation, avoiding overcrowding, adequate and clean food, recreation, health services, effective and appropriate PPE and other matters.
• The Contractors will develop and widely communicate and enforce its “Golden Health and Safety Rules” and create a safety culture.
• Strict Occupational Health and Safety requirements will be embedded in the Bid Documents Contractor’s contract as per the World Bank Standard Procurement Documents, to ensure risk management, occupational injuries, worker rights, deaths, disability and diseases are managed as per the ESMP, ESS2 and GIIP.
• The Supervision Engineer and Contractor will undertake their own daily audits with H&S inspectors responsible for monitoring behaviours and correcting where required.
• Should non-compliance repeatedly occur a zero-tolerance approach will be adopted by PLN and enforced on the Contractor by the Supervision Engineer.
• Detailed records of near misses and incidents must be kept and used for continuous improvement purposes.
• Each Contractor will establish and implement a Worker Grievance Mechanism that will be accessible for all workers and sub-contractors to report issues (a confidential option should be provided). When complaints are submitted, the Contractor will undertake an immediate investigation. The Supervision Engineer will oversee the Grievance Mechanism and support the resolution where required.
• Emergency response and incident management procedures with prevention and early warning procedures, preparation, response and recovery from emergencies, including natural disasters, disease outbreaks, conflict or social unrest, pollution incidents and injury and fatality incident management.
Table 71 Impact Assessment High Risk Construction Activities
Impact The impact on workers is illness, injury, or fatality from high-risk construction activities (working at height, near water, in confined spaces, with explosives, near heavy machinery, on slopes/unstable ground, exposure to sun/heat/wet weather, hazardous materials, with electricity, and exposure to illnesses communicable diseases such as COVID-19)
Nature of Impact
Negative Positive Neutral
The potential impact on workers conducting high risk activities or activities in high risk environments is illness, injury or fatality.
Impact Type
Direct Secondary Indirect Cumulative Residual
Workers are directly exposed to hazards and will be directly impacted by illness, injury or fatality. Their families will be indirectly impacted.
Temporary Short-term Long-term Permanent
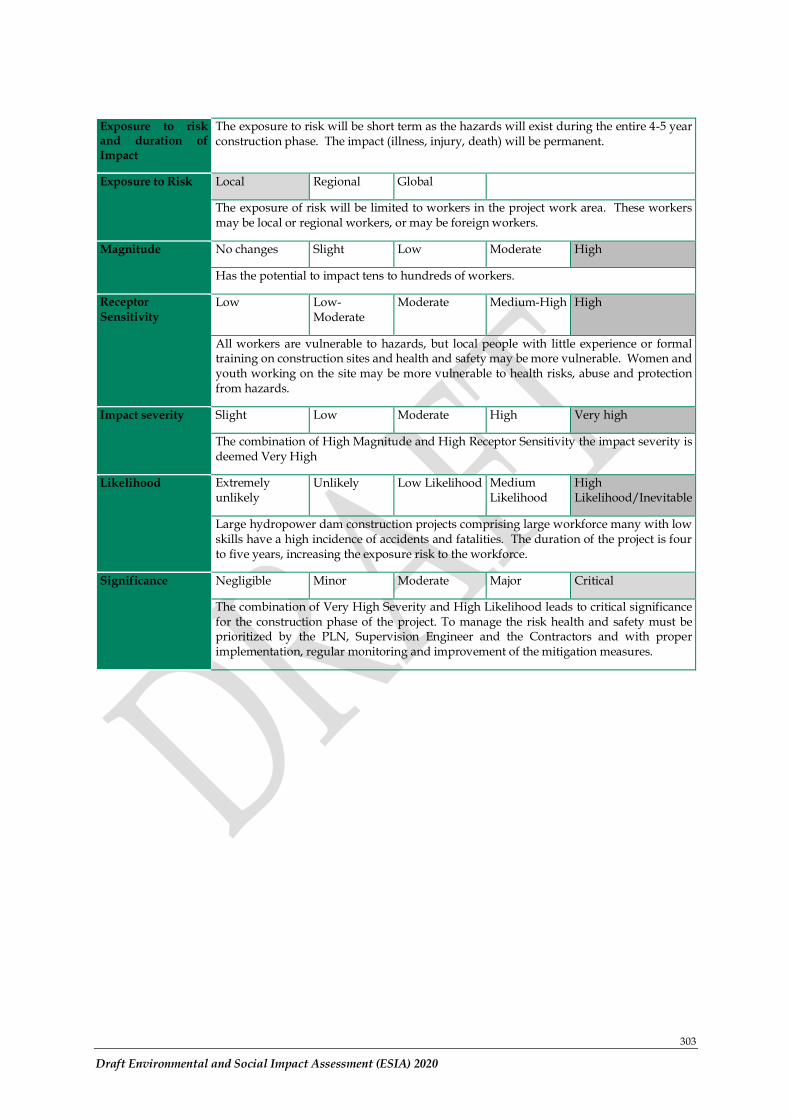
303
Draft Environmental and Social Impact Assessment (ESIA) 2020
Exposure to risk and duration of Impact
The exposure to risk will be short term as the hazards will exist during the entire 4-5 year construction phase. The impact (illness, injury, death) will be permanent.
Exposure to Risk
Local Regional Global
The exposure of risk will be limited to workers in the project work area. These workers may be local or regional workers, or may be foreign workers.
Magnitude
No changes Slight Low Moderate High
Has the potential to impact tens to hundreds of workers.
Receptor Sensitivity
Low Low-Moderate
Moderate Medium-High High
All workers are vulnerable to hazards, but local people with little experience or formal training on construction sites and health and safety may be more vulnerable. Women and youth working on the site may be more vulnerable to health risks, abuse and protection from hazards.
Impact severity
Slight Low Moderate High Very high
The combination of High Magnitude and High Receptor Sensitivity the impact severity is deemed Very High
Likelihood
Extremely unlikely
Unlikely Low Likelihood Medium Likelihood
High Likelihood/Inevitable
Large hydropower dam construction projects comprising large workforce many with low skills have a high incidence of accidents and fatalities. The duration of the project is four to five years, increasing the exposure risk to the workforce.
Significance
Negligible Minor Moderate Major Critical
The combination of Very High Severity and High Likelihood leads to critical significance for the construction phase of the project. To manage the risk health and safety must be prioritized by the PLN, Supervision Engineer and the Contractors and with proper implementation, regular monitoring and improvement of the mitigation measures.
304
Draft Environmental and Social Impact Assessment (ESIA) 2020
CHAPTER 11. ENVIRONMENTAL AND SOCIO-ECONOMIC IMPACTS – IMPOUNDMENT STAGE
11.1 Overview
The inundation process is carried out to fill water in the upper and lower dam reservoirs. Although the inundation phase is a small part of the overall project, there are potential impacts on hydrology, habitat and river biodiversity, use of downstream streams, river access and community connectivity. This is discussed in this section, as part of operational impacts.
11.2 Environmental Impact of the Inundation Phase
11.2.1 Changes in River Flow
The inundation phase is the period of time when the reservoirs are filled and commissioned.
Hydrology impacts during inundation are assessed separately from the operational phase
because the hydrological regimes are different. Inundation will occur during the wet season
(December to May), to minimise the risk that the rivers will be at low flow conditions. The
inundation process and water requirements are detailed in Section 4 and summarised here.
The dead storage area of the upper reservoir and the dead and active storage areas of the
lower reservoir will fill during the inundation phase. The total amount of water required is
as follows:
Reservoir Dead Storage volume (m3)
Active Storage volume (m3)
Total volume required for filling (m3)
Upper, on Cirumamis 530,000 0 530,000
Lower, on Cisokan 51,500,000 11,500,000 63,000,000
Total 52,030,000 11,500,000 63,530,000
Cirumamis River:
Prior to inundation the diversion infrastructure will be blocked and removed. The reservoir
will start to fill behind the dam. The bottom outlet will discharge all inflow. No variation in
flow will be experienced downstream of the upper dam in the Cirumamis River during this
phase.
Water will be pumped from the lower dam to the upper dam to fill the dead storage in the
reservoir during the inundation period and / or during commissioning. During the
commissioning stage the active storage will be filled by pumping water from the lower
reservoir and released back to the lower reservoir through the power generation plant.
In emergencies during this phase, the bottom outlet of the upper dam can be adjusted to allow
a maximum discharge of 0.96 m3/s.
Cisokan River:
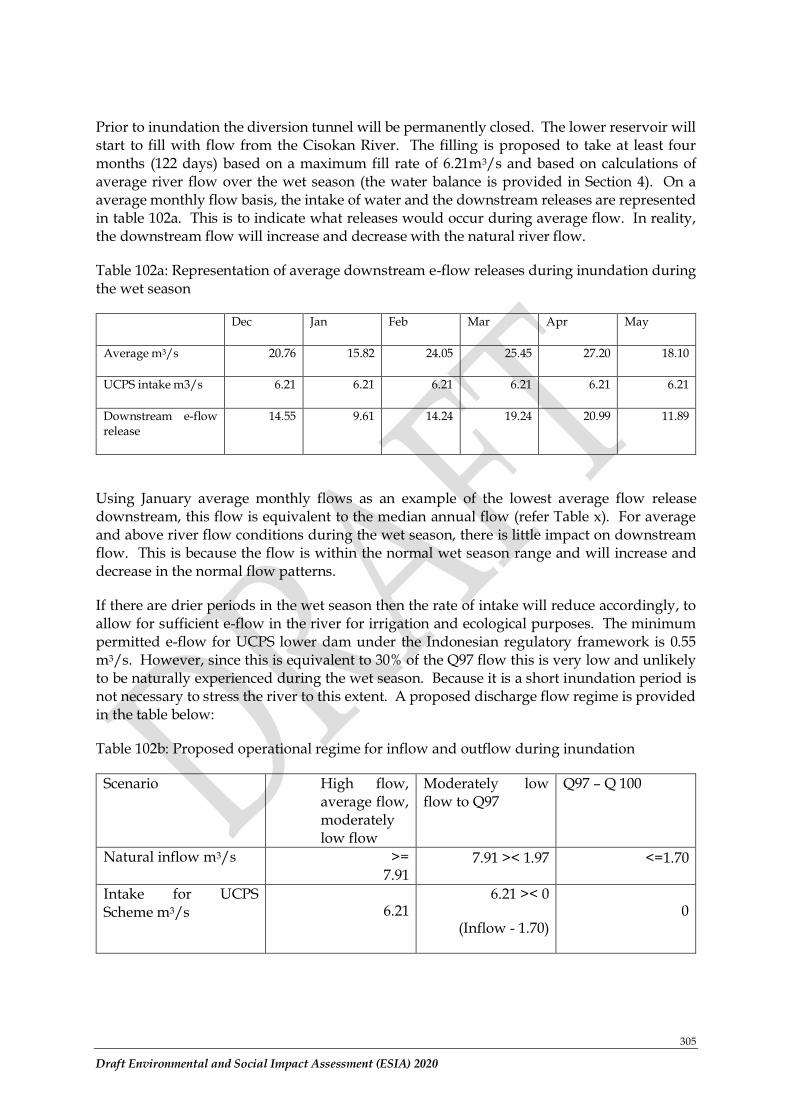
305
Draft Environmental and Social Impact Assessment (ESIA) 2020
Prior to inundation the diversion tunnel will be permanently closed. The lower reservoir will start to fill with flow from the Cisokan River. The filling is proposed to take at least four months (122 days) based on a maximum fill rate of 6.21m3/s and based on calculations of average river flow over the wet season (the water balance is provided in Section 4). On a average monthly flow basis, the intake of water and the downstream releases are represented in table 102a. This is to indicate what releases would occur during average flow. In reality, the downstream flow will increase and decrease with the natural river flow.
Table 102a: Representation of average downstream e-flow releases during inundation during the wet season
Dec Jan Feb Mar Apr May
Average m3/s 20.76 15.82 24.05 25.45 27.20 18.10
UCPS intake m3/s 6.21 6.21 6.21 6.21 6.21 6.21
Downstream e-flow release
14.55 9.61 14.24 19.24 20.99 11.89
Using January average monthly flows as an example of the lowest average flow release downstream, this flow is equivalent to the median annual flow (refer Table x). For average and above river flow conditions during the wet season, there is little impact on downstream flow. This is because the flow is within the normal wet season range and will increase and decrease in the normal flow patterns.
If there are drier periods in the wet season then the rate of intake will reduce accordingly, to allow for sufficient e-flow in the river for irrigation and ecological purposes. The minimum permitted e-flow for UCPS lower dam under the Indonesian regulatory framework is 0.55 m3/s. However, since this is equivalent to 30% of the Q97 flow this is very low and unlikely to be naturally experienced during the wet season. Because it is a short inundation period is not necessary to stress the river to this extent. A proposed discharge flow regime is provided in the table below:
Table 102b: Proposed operational regime for inflow and outflow during inundation
Scenario High flow, average flow, moderately low flow
Moderately low flow to Q97
Q97 – Q 100
Natural inflow m3/s >= 7.91
7.91 >< 1.97 <=1.70
Intake for UCPS Scheme m3/s 6.21
6.21 >< 0
(Inflow - 1.70) 0
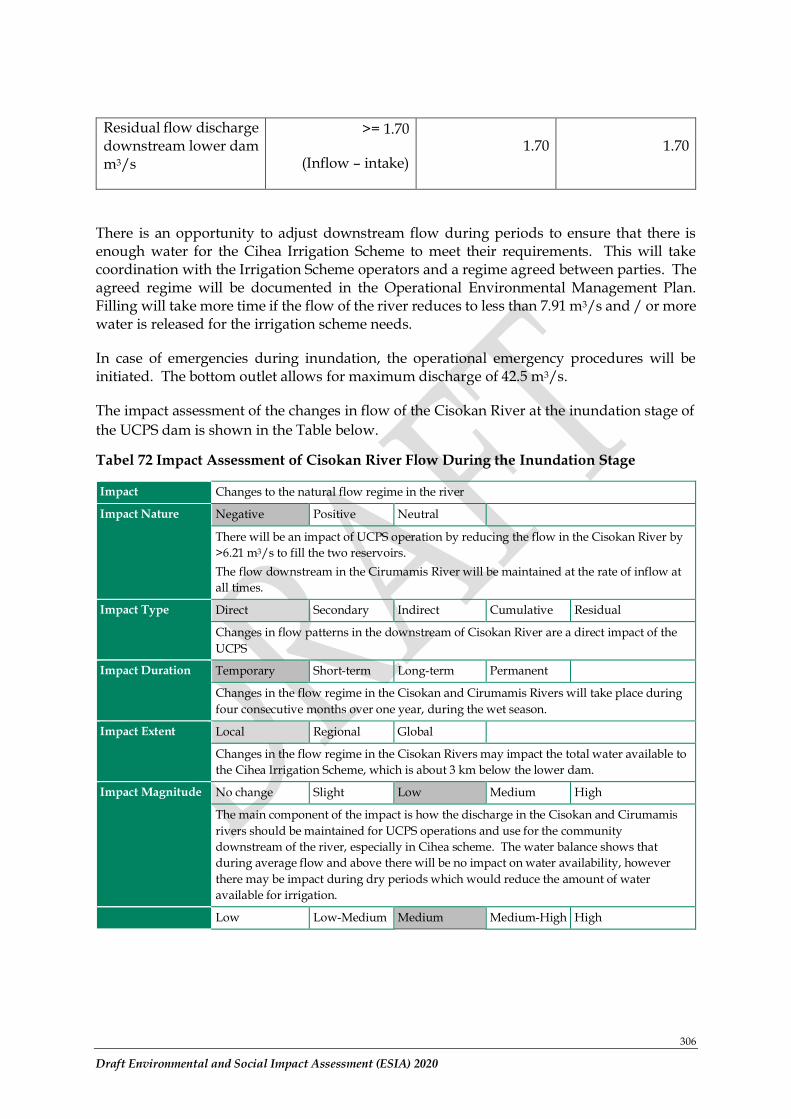
306
Draft Environmental and Social Impact Assessment (ESIA) 2020
Residual flow discharge downstream lower dam m3/s
>= 1.70
(Inflow – intake) 1.70 1.70
There is an opportunity to adjust downstream flow during periods to ensure that there is enough water for the Cihea Irrigation Scheme to meet their requirements. This will take coordination with the Irrigation Scheme operators and a regime agreed between parties. The agreed regime will be documented in the Operational Environmental Management Plan. Filling will take more time if the flow of the river reduces to less than 7.91 m3/s and / or more water is released for the irrigation scheme needs.
In case of emergencies during inundation, the operational emergency procedures will be initiated. The bottom outlet allows for maximum discharge of 42.5 m3/s.
The impact assessment of the changes in flow of the Cisokan River at the inundation stage of
the UCPS dam is shown in the Table below.
Tabel 72 Impact Assessment of Cisokan River Flow During the Inundation Stage
Impact Changes to the natural flow regime in the river
Impact Nature Negative Positive Neutral
There will be an impact of UCPS operation by reducing the flow in the Cisokan River by
>6.21 m3/s to fill the two reservoirs.
The flow downstream in the Cirumamis River will be maintained at the rate of inflow at
all times.
Impact Type Direct Secondary Indirect Cumulative Residual
Changes in flow patterns in the downstream of Cisokan River are a direct impact of the
UCPS
Impact Duration Temporary Short-term Long-term Permanent
Changes in the flow regime in the Cisokan and Cirumamis Rivers will take place during
four consecutive months over one year, during the wet season.
Impact Extent Local Regional Global
Changes in the flow regime in the Cisokan Rivers may impact the total water available to
the Cihea Irrigation Scheme, which is about 3 km below the lower dam.
Impact Magnitude No change Slight Low Medium High
The main component of the impact is how the discharge in the Cisokan and Cirumamis
rivers should be maintained for UCPS operations and use for the community
downstream of the river, especially in Cihea scheme. The water balance shows that
during average flow and above there will be no impact on water availability, however
there may be impact during dry periods which would reduce the amount of water
available for irrigation. Low Low-Medium Medium Medium-High High
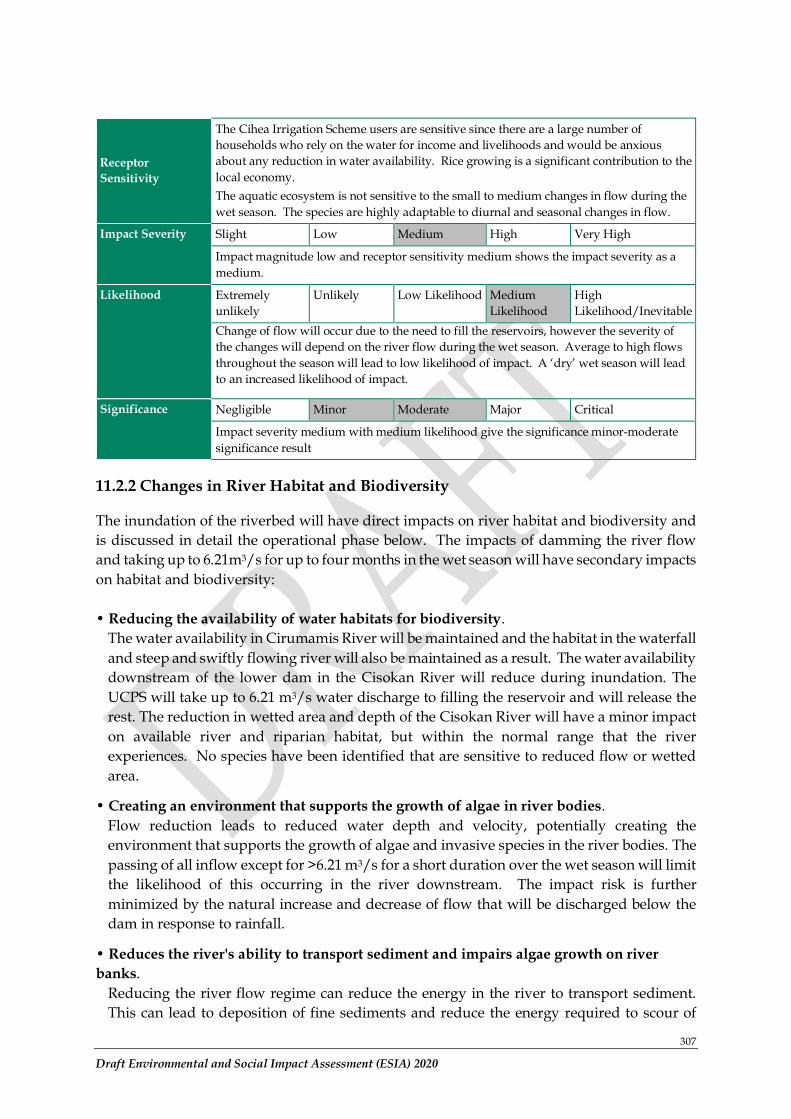
307
Draft Environmental and Social Impact Assessment (ESIA) 2020
Receptor
Sensitivity
The Cihea Irrigation Scheme users are sensitive since there are a large number of
households who rely on the water for income and livelihoods and would be anxious
about any reduction in water availability. Rice growing is a significant contribution to the
local economy.
The aquatic ecosystem is not sensitive to the small to medium changes in flow during the
wet season. The species are highly adaptable to diurnal and seasonal changes in flow.
Impact Severity Slight Low Medium High Very High
Impact magnitude low and receptor sensitivity medium shows the impact severity as a
medium.
Likelihood Extremely
unlikely
Unlikely Low Likelihood Medium
Likelihood
High
Likelihood/Inevitable
Change of flow will occur due to the need to fill the reservoirs, however the severity of
the changes will depend on the river flow during the wet season. Average to high flows
throughout the season will lead to low likelihood of impact. A ‘dry’ wet season will lead
to an increased likelihood of impact.
Significance Negligible Minor Moderate Major Critical
Impact severity medium with medium likelihood give the significance minor-moderate
significance result
11.2.2 Changes in River Habitat and Biodiversity
The inundation of the riverbed will have direct impacts on river habitat and biodiversity and
is discussed in detail the operational phase below. The impacts of damming the river flow
and taking up to 6.21m3/s for up to four months in the wet season will have secondary impacts
on habitat and biodiversity:
• Reducing the availability of water habitats for biodiversity.
The water availability in Cirumamis River will be maintained and the habitat in the waterfall
and steep and swiftly flowing river will also be maintained as a result. The water availability
downstream of the lower dam in the Cisokan River will reduce during inundation. The
UCPS will take up to 6.21 m3/s water discharge to filling the reservoir and will release the
rest. The reduction in wetted area and depth of the Cisokan River will have a minor impact
on available river and riparian habitat, but within the normal range that the river
experiences. No species have been identified that are sensitive to reduced flow or wetted
area.
• Creating an environment that supports the growth of algae in river bodies.
Flow reduction leads to reduced water depth and velocity, potentially creating the
environment that supports the growth of algae and invasive species in the river bodies. The
passing of all inflow except for >6.21 m3/s for a short duration over the wet season will limit
the likelihood of this occurring in the river downstream. The impact risk is further
minimized by the natural increase and decrease of flow that will be discharged below the
dam in response to rainfall.
• Reduces the river's ability to transport sediment and impairs algae growth on river
banks.
Reducing the river flow regime can reduce the energy in the river to transport sediment.
This can lead to deposition of fine sediments and reduce the energy required to scour of
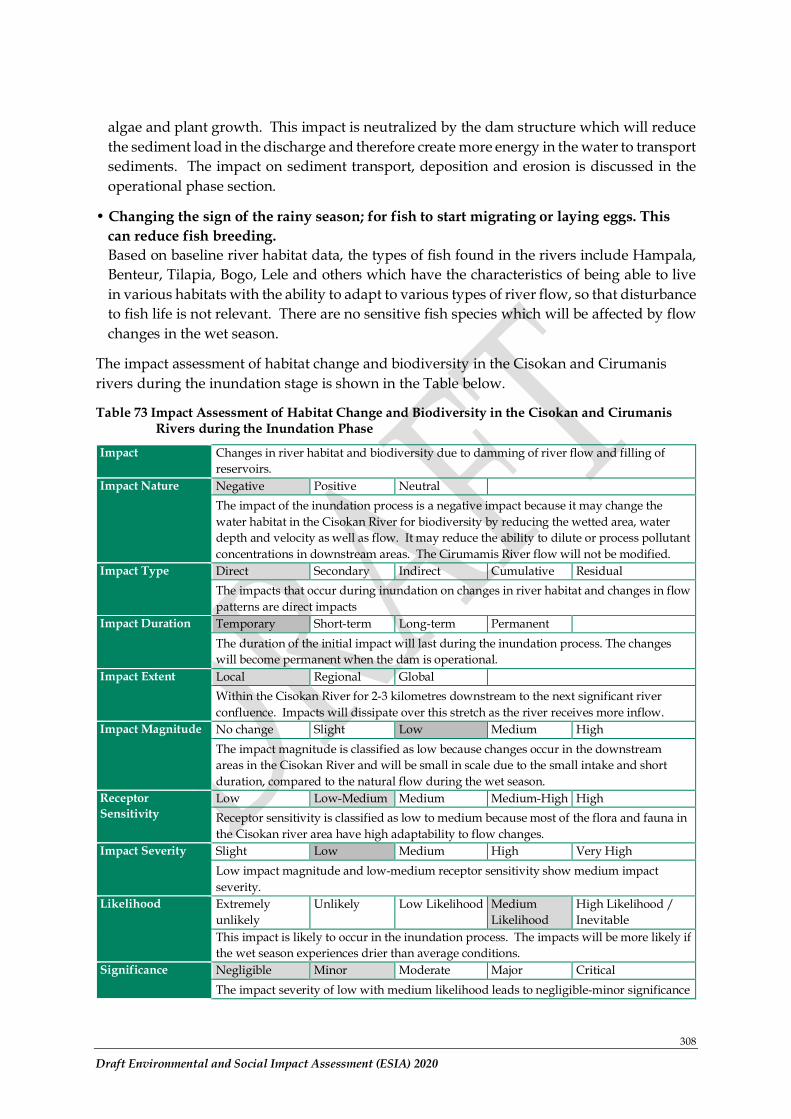
308
Draft Environmental and Social Impact Assessment (ESIA) 2020
algae and plant growth. This impact is neutralized by the dam structure which will reduce
the sediment load in the discharge and therefore create more energy in the water to transport
sediments. The impact on sediment transport, deposition and erosion is discussed in the
operational phase section.
• Changing the sign of the rainy season; for fish to start migrating or laying eggs. This
can reduce fish breeding.
Based on baseline river habitat data, the types of fish found in the rivers include Hampala,
Benteur, Tilapia, Bogo, Lele and others which have the characteristics of being able to live
in various habitats with the ability to adapt to various types of river flow, so that disturbance
to fish life is not relevant. There are no sensitive fish species which will be affected by flow
changes in the wet season.
The impact assessment of habitat change and biodiversity in the Cisokan and Cirumanis
rivers during the inundation stage is shown in the Table below.
Table 73 Impact Assessment of Habitat Change and Biodiversity in the Cisokan and Cirumanis Rivers during the Inundation Phase
Impact Changes in river habitat and biodiversity due to damming of river flow and filling of
reservoirs.
Impact Nature Negative Positive Neutral
The impact of the inundation process is a negative impact because it may change the
water habitat in the Cisokan River for biodiversity by reducing the wetted area, water
depth and velocity as well as flow. It may reduce the ability to dilute or process pollutant
concentrations in downstream areas. The Cirumamis River flow will not be modified.
Impact Type Direct Secondary Indirect Cumulative Residual
The impacts that occur during inundation on changes in river habitat and changes in flow
patterns are direct impacts
Impact Duration Temporary Short-term Long-term Permanent
The duration of the initial impact will last during the inundation process. The changes
will become permanent when the dam is operational.
Impact Extent Local Regional Global
Within the Cisokan River for 2-3 kilometres downstream to the next significant river
confluence. Impacts will dissipate over this stretch as the river receives more inflow.
Impact Magnitude No change Slight Low Medium High
The impact magnitude is classified as low because changes occur in the downstream
areas in the Cisokan River and will be small in scale due to the small intake and short
duration, compared to the natural flow during the wet season.
Receptor
Sensitivity
Low Low-Medium Medium Medium-High High
Receptor sensitivity is classified as low to medium because most of the flora and fauna in
the Cisokan river area have high adaptability to flow changes.
Impact Severity Slight Low Medium High Very High
Low impact magnitude and low-medium receptor sensitivity show medium impact
severity.
Likelihood Extremely
unlikely
Unlikely Low Likelihood Medium
Likelihood
High Likelihood /
Inevitable
This impact is likely to occur in the inundation process. The impacts will be more likely if
the wet season experiences drier than average conditions.
Significance Negligible Minor Moderate Major Critical
The impact severity of low with medium likelihood leads to negligible-minor significance
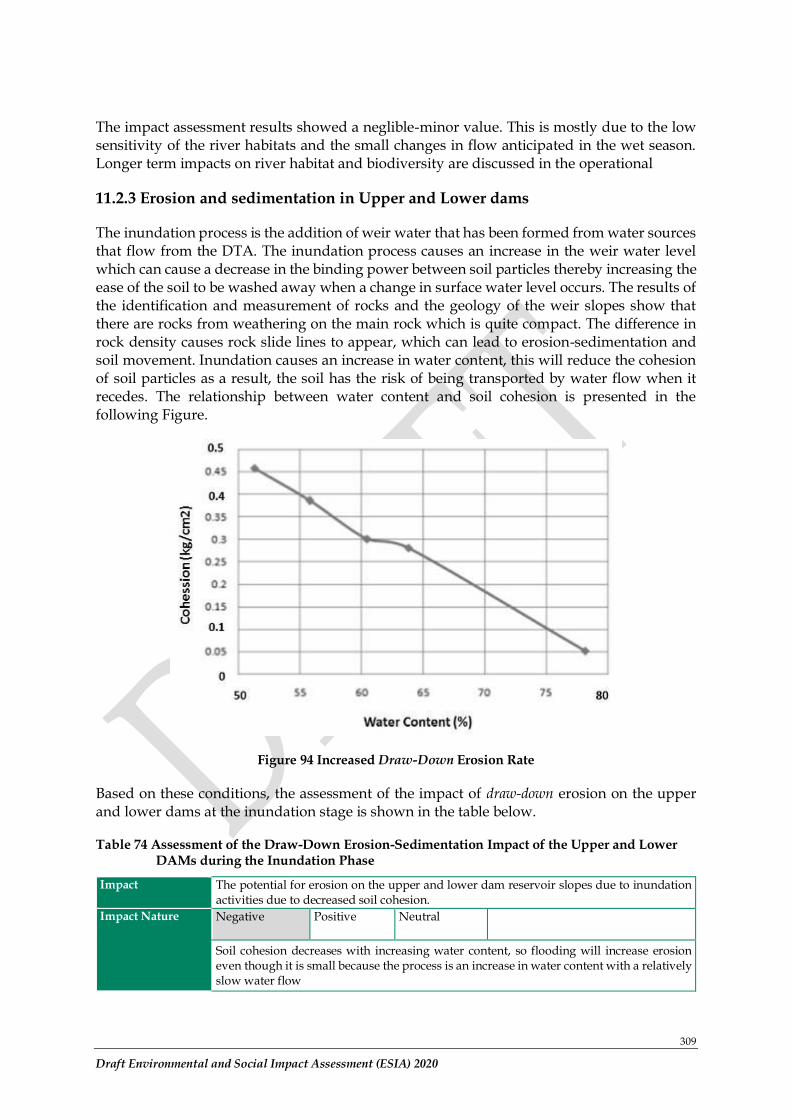
309
Draft Environmental and Social Impact Assessment (ESIA) 2020
The impact assessment results showed a neglible-minor value. This is mostly due to the low sensitivity of the river habitats and the small changes in flow anticipated in the wet season. Longer term impacts on river habitat and biodiversity are discussed in the operational
11.2.3 Erosion and sedimentation in Upper and Lower dams
The inundation process is the addition of weir water that has been formed from water sources that flow from the DTA. The inundation process causes an increase in the weir water level which can cause a decrease in the binding power between soil particles thereby increasing the ease of the soil to be washed away when a change in surface water level occurs. The results of the identification and measurement of rocks and the geology of the weir slopes show that there are rocks from weathering on the main rock which is quite compact. The difference in rock density causes rock slide lines to appear, which can lead to erosion-sedimentation and soil movement. Inundation causes an increase in water content, this will reduce the cohesion of soil particles as a result, the soil has the risk of being transported by water flow when it recedes. The relationship between water content and soil cohesion is presented in the following Figure.
Figure 94 Increased Draw-Down Erosion Rate
Based on these conditions, the assessment of the impact of draw-down erosion on the upper and lower dams at the inundation stage is shown in the table below.
Table 74 Assessment of the Draw-Down Erosion-Sedimentation Impact of the Upper and Lower DAMs during the Inundation Phase
Impact The potential for erosion on the upper and lower dam reservoir slopes due to inundation activities due to decreased soil cohesion.
Impact Nature
Negative Positive Neutral
Soil cohesion decreases with increasing water content, so flooding will increase erosion even though it is small because the process is an increase in water content with a relatively slow water flow
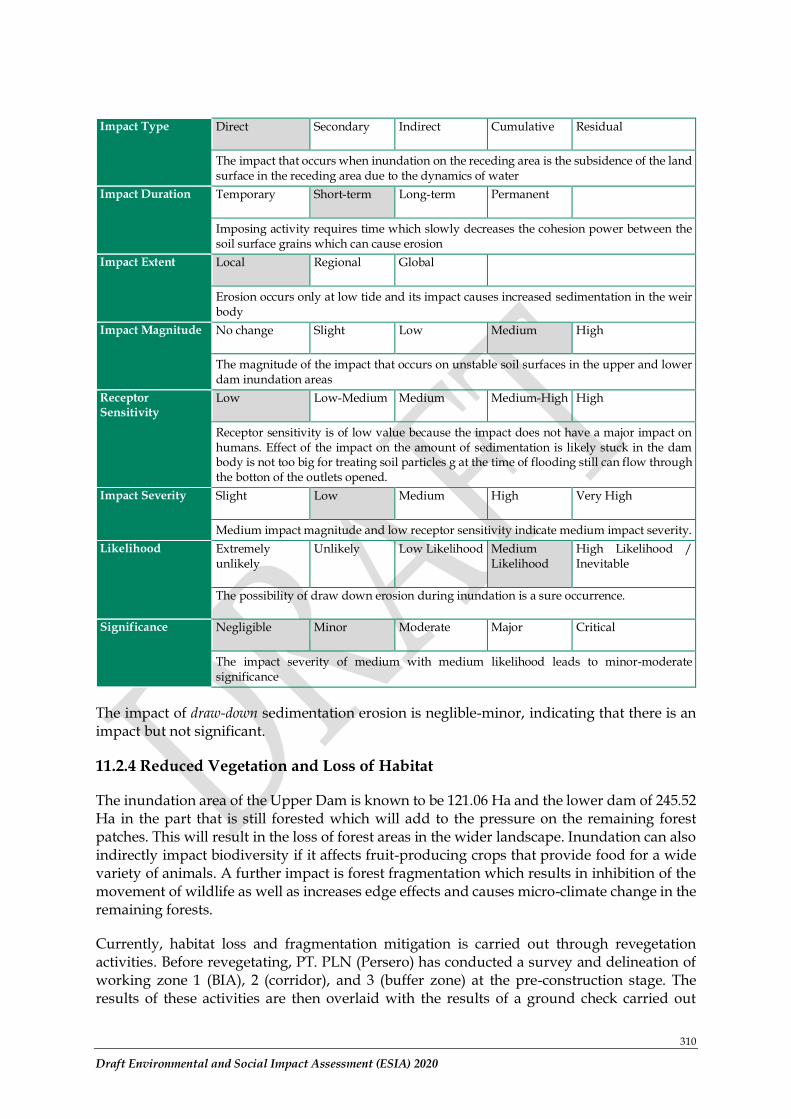
310
Draft Environmental and Social Impact Assessment (ESIA) 2020
Impact Type
Direct Secondary Indirect Cumulative Residual
The impact that occurs when inundation on the receding area is the subsidence of the land surface in the receding area due to the dynamics of water
Impact Duration
Temporary Short-term Long-term Permanent
Imposing activity requires time which slowly decreases the cohesion power between the soil surface grains which can cause erosion
Impact Extent
Local Regional Global
Erosion occurs only at low tide and its impact causes increased sedimentation in the weir body
Impact Magnitude
No change Slight Low Medium High
The magnitude of the impact that occurs on unstable soil surfaces in the upper and lower dam inundation areas
Receptor Sensitivity
Low Low-Medium Medium Medium-High High
Receptor sensitivity is of low value because the impact does not have a major impact on humans. Effect of the impact on the amount of sedimentation is likely stuck in the dam body is not too big for treating soil particles g at the time of flooding still can flow through the botton of the outlets opened.
Impact Severity
Slight Low Medium High Very High
Medium impact magnitude and low receptor sensitivity indicate medium impact severity.
Likelihood
Extremely unlikely
Unlikely Low Likelihood Medium Likelihood
High Likelihood / Inevitable
The possibility of draw down erosion during inundation is a sure occurrence.
Significance
Negligible Minor Moderate Major Critical
The impact severity of medium with medium likelihood leads to minor-moderate significance
The impact of draw-down sedimentation erosion is neglible-minor, indicating that there is an impact but not significant.
11.2.4 Reduced Vegetation and Loss of Habitat
The inundation area of the Upper Dam is known to be 121.06 Ha and the lower dam of 245.52 Ha in the part that is still forested which will add to the pressure on the remaining forest patches. This will result in the loss of forest areas in the wider landscape. Inundation can also indirectly impact biodiversity if it affects fruit-producing crops that provide food for a wide variety of animals. A further impact is forest fragmentation which results in inhibition of the movement of wildlife as well as increases edge effects and causes micro-climate change in the remaining forests.
Currently, habitat loss and fragmentation mitigation is carried out through revegetation activities. Before revegetating, PT. PLN (Persero) has conducted a survey and delineation of working zone 1 (BIA), 2 (corridor), and 3 (buffer zone) at the pre-construction stage. The results of these activities are then overlaid with the results of a ground check carried out
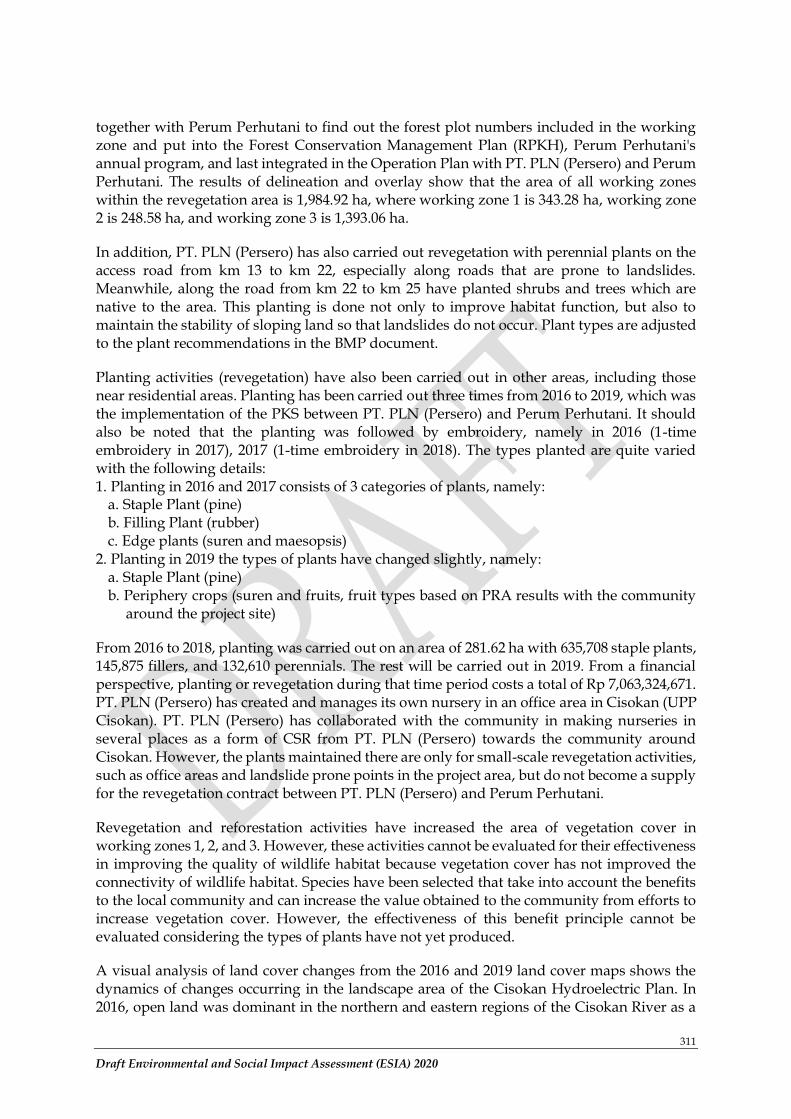
311
Draft Environmental and Social Impact Assessment (ESIA) 2020
together with Perum Perhutani to find out the forest plot numbers included in the working zone and put into the Forest Conservation Management Plan (RPKH), Perum Perhutani's annual program, and last integrated in the Operation Plan with PT. PLN (Persero) and Perum Perhutani. The results of delineation and overlay show that the area of all working zones within the revegetation area is 1,984.92 ha, where working zone 1 is 343.28 ha, working zone 2 is 248.58 ha, and working zone 3 is 1,393.06 ha.
In addition, PT. PLN (Persero) has also carried out revegetation with perennial plants on the access road from km 13 to km 22, especially along roads that are prone to landslides. Meanwhile, along the road from km 22 to km 25 have planted shrubs and trees which are native to the area. This planting is done not only to improve habitat function, but also to maintain the stability of sloping land so that landslides do not occur. Plant types are adjusted to the plant recommendations in the BMP document.
Planting activities (revegetation) have also been carried out in other areas, including those near residential areas. Planting has been carried out three times from 2016 to 2019, which was the implementation of the PKS between PT. PLN (Persero) and Perum Perhutani. It should also be noted that the planting was followed by embroidery, namely in 2016 (1-time embroidery in 2017), 2017 (1-time embroidery in 2018). The types planted are quite varied with the following details: 1. Planting in 2016 and 2017 consists of 3 categories of plants, namely:
a. Staple Plant (pine) b. Filling Plant (rubber) c. Edge plants (suren and maesopsis)
2. Planting in 2019 the types of plants have changed slightly, namely: a. Staple Plant (pine) b. Periphery crops (suren and fruits, fruit types based on PRA results with the community
around the project site)
From 2016 to 2018, planting was carried out on an area of 281.62 ha with 635,708 staple plants, 145,875 fillers, and 132,610 perennials. The rest will be carried out in 2019. From a financial perspective, planting or revegetation during that time period costs a total of Rp 7,063,324,671. PT. PLN (Persero) has created and manages its own nursery in an office area in Cisokan (UPP Cisokan). PT. PLN (Persero) has collaborated with the community in making nurseries in several places as a form of CSR from PT. PLN (Persero) towards the community around Cisokan. However, the plants maintained there are only for small-scale revegetation activities, such as office areas and landslide prone points in the project area, but do not become a supply for the revegetation contract between PT. PLN (Persero) and Perum Perhutani.
Revegetation and reforestation activities have increased the area of vegetation cover in working zones 1, 2, and 3. However, these activities cannot be evaluated for their effectiveness in improving the quality of wildlife habitat because vegetation cover has not improved the connectivity of wildlife habitat. Species have been selected that take into account the benefits to the local community and can increase the value obtained to the community from efforts to increase vegetation cover. However, the effectiveness of this benefit principle cannot be evaluated considering the types of plants have not yet produced.
A visual analysis of land cover changes from the 2016 and 2019 land cover maps shows the dynamics of changes occurring in the landscape area of the Cisokan Hydroelectric Plan. In 2016, open land was dominant in the northern and eastern regions of the Cisokan River as a
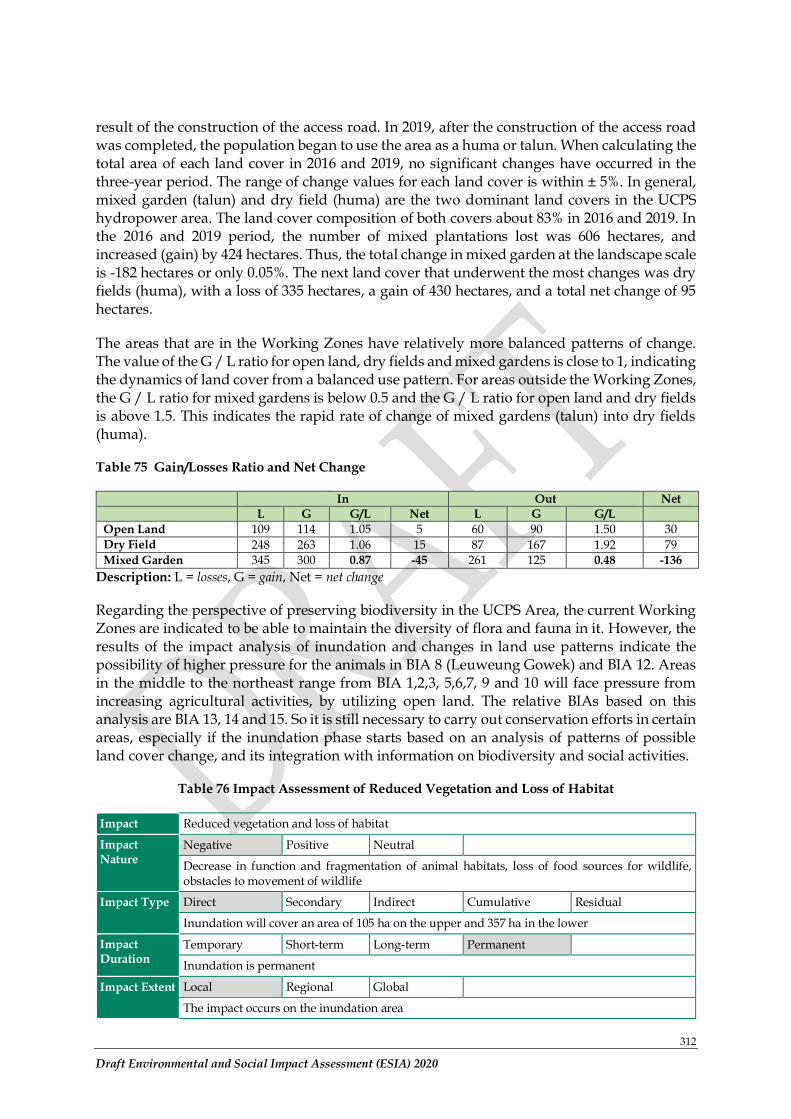
312
Draft Environmental and Social Impact Assessment (ESIA) 2020
result of the construction of the access road. In 2019, after the construction of the access road was completed, the population began to use the area as a huma or talun. When calculating the total area of each land cover in 2016 and 2019, no significant changes have occurred in the three-year period. The range of change values for each land cover is within ± 5%. In general, mixed garden (talun) and dry field (huma) are the two dominant land covers in the UCPS hydropower area. The land cover composition of both covers about 83% in 2016 and 2019. In the 2016 and 2019 period, the number of mixed plantations lost was 606 hectares, and increased (gain) by 424 hectares. Thus, the total change in mixed garden at the landscape scale is -182 hectares or only 0.05%. The next land cover that underwent the most changes was dry fields (huma), with a loss of 335 hectares, a gain of 430 hectares, and a total net change of 95 hectares.
The areas that are in the Working Zones have relatively more balanced patterns of change. The value of the G / L ratio for open land, dry fields and mixed gardens is close to 1, indicating the dynamics of land cover from a balanced use pattern. For areas outside the Working Zones, the G / L ratio for mixed gardens is below 0.5 and the G / L ratio for open land and dry fields is above 1.5. This indicates the rapid rate of change of mixed gardens (talun) into dry fields (huma).
Table 75 Gain/Losses Ratio and Net Change
In Out Net L G G/L Net L G G/L
Open Land 109 114 1.05 5 60 90 1.50 30
Dry Field 248 263 1.06 15 87 167 1.92 79
Mixed Garden 345 300 0.87 -45 261 125 0.48 -136
Description: L = losses, G = gain, Net = net change
Regarding the perspective of preserving biodiversity in the UCPS Area, the current Working Zones are indicated to be able to maintain the diversity of flora and fauna in it. However, the results of the impact analysis of inundation and changes in land use patterns indicate the possibility of higher pressure for the animals in BIA 8 (Leuweung Gowek) and BIA 12. Areas in the middle to the northeast range from BIA 1,2,3, 5,6,7, 9 and 10 will face pressure from increasing agricultural activities, by utilizing open land. The relative BIAs based on this analysis are BIA 13, 14 and 15. So it is still necessary to carry out conservation efforts in certain areas, especially if the inundation phase starts based on an analysis of patterns of possible land cover change, and its integration with information on biodiversity and social activities.
Table 76 Impact Assessment of Reduced Vegetation and Loss of Habitat
Impact Reduced vegetation and loss of habitat
Impact Nature
Negative Positive Neutral
Decrease in function and fragmentation of animal habitats, loss of food sources for wildlife, obstacles to movement of wildlife
Impact Type Direct Secondary Indirect Cumulative Residual
Inundation will cover an area of 105 ha on the upper and 357 ha in the lower
Impact Duration
Temporary Short-term Long-term Permanent
Inundation is permanent
Impact Extent Local Regional Global
The impact occurs on the inundation area
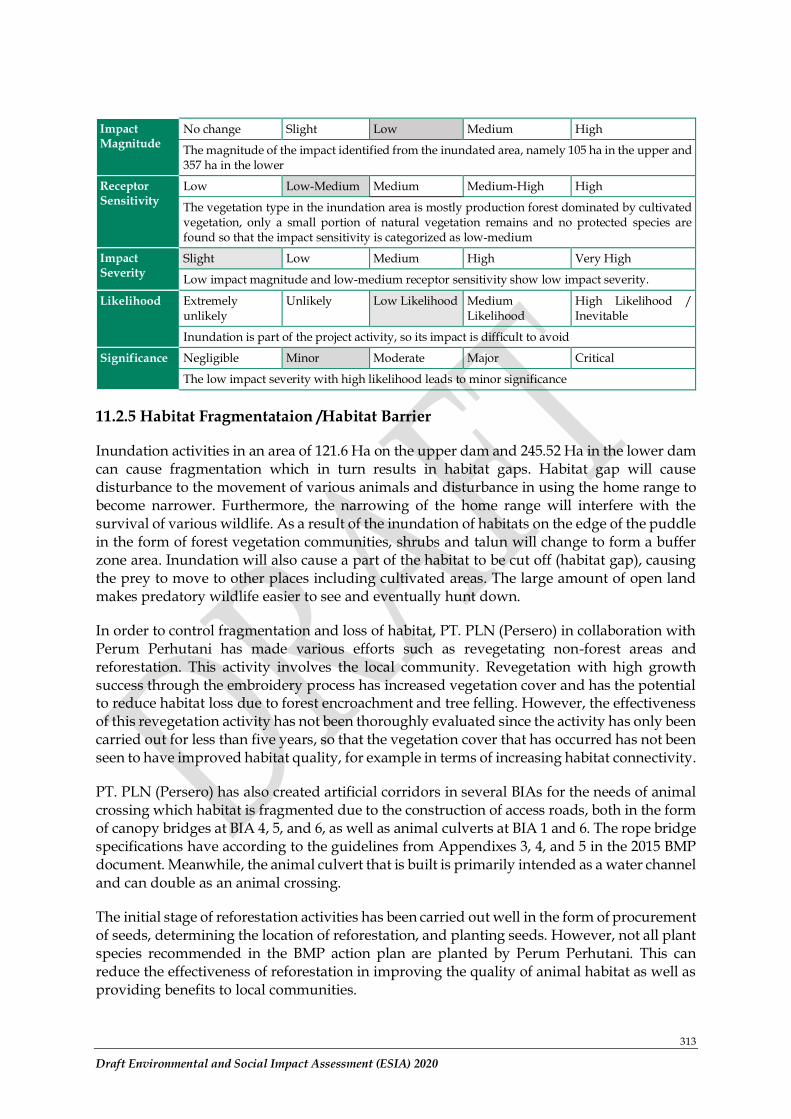
313
Draft Environmental and Social Impact Assessment (ESIA) 2020
Impact Magnitude
No change Slight Low Medium High
The magnitude of the impact identified from the inundated area, namely 105 ha in the upper and 357 ha in the lower
Receptor Sensitivity
Low Low-Medium Medium Medium-High High
The vegetation type in the inundation area is mostly production forest dominated by cultivated vegetation, only a small portion of natural vegetation remains and no protected species are found so that the impact sensitivity is categorized as low-medium
Impact Severity
Slight Low Medium High Very High
Low impact magnitude and low-medium receptor sensitivity show low impact severity.
Likelihood Extremely unlikely
Unlikely Low Likelihood Medium Likelihood
High Likelihood / Inevitable
Inundation is part of the project activity, so its impact is difficult to avoid
Significance Negligible Minor Moderate Major Critical
The low impact severity with high likelihood leads to minor significance
11.2.5 Habitat Fragmentataion /Habitat Barrier
Inundation activities in an area of 121.6 Ha on the upper dam and 245.52 Ha in the lower dam can cause fragmentation which in turn results in habitat gaps. Habitat gap will cause disturbance to the movement of various animals and disturbance in using the home range to become narrower. Furthermore, the narrowing of the home range will interfere with the survival of various wildlife. As a result of the inundation of habitats on the edge of the puddle in the form of forest vegetation communities, shrubs and talun will change to form a buffer zone area. Inundation will also cause a part of the habitat to be cut off (habitat gap), causing the prey to move to other places including cultivated areas. The large amount of open land makes predatory wildlife easier to see and eventually hunt down.
In order to control fragmentation and loss of habitat, PT. PLN (Persero) in collaboration with Perum Perhutani has made various efforts such as revegetating non-forest areas and reforestation. This activity involves the local community. Revegetation with high growth success through the embroidery process has increased vegetation cover and has the potential to reduce habitat loss due to forest encroachment and tree felling. However, the effectiveness of this revegetation activity has not been thoroughly evaluated since the activity has only been carried out for less than five years, so that the vegetation cover that has occurred has not been seen to have improved habitat quality, for example in terms of increasing habitat connectivity.
PT. PLN (Persero) has also created artificial corridors in several BIAs for the needs of animal crossing which habitat is fragmented due to the construction of access roads, both in the form of canopy bridges at BIA 4, 5, and 6, as well as animal culverts at BIA 1 and 6. The rope bridge specifications have according to the guidelines from Appendixes 3, 4, and 5 in the 2015 BMP document. Meanwhile, the animal culvert that is built is primarily intended as a water channel and can double as an animal crossing.
The initial stage of reforestation activities has been carried out well in the form of procurement of seeds, determining the location of reforestation, and planting seeds. However, not all plant species recommended in the BMP action plan are planted by Perum Perhutani. This can reduce the effectiveness of reforestation in improving the quality of animal habitat as well as providing benefits to local communities.
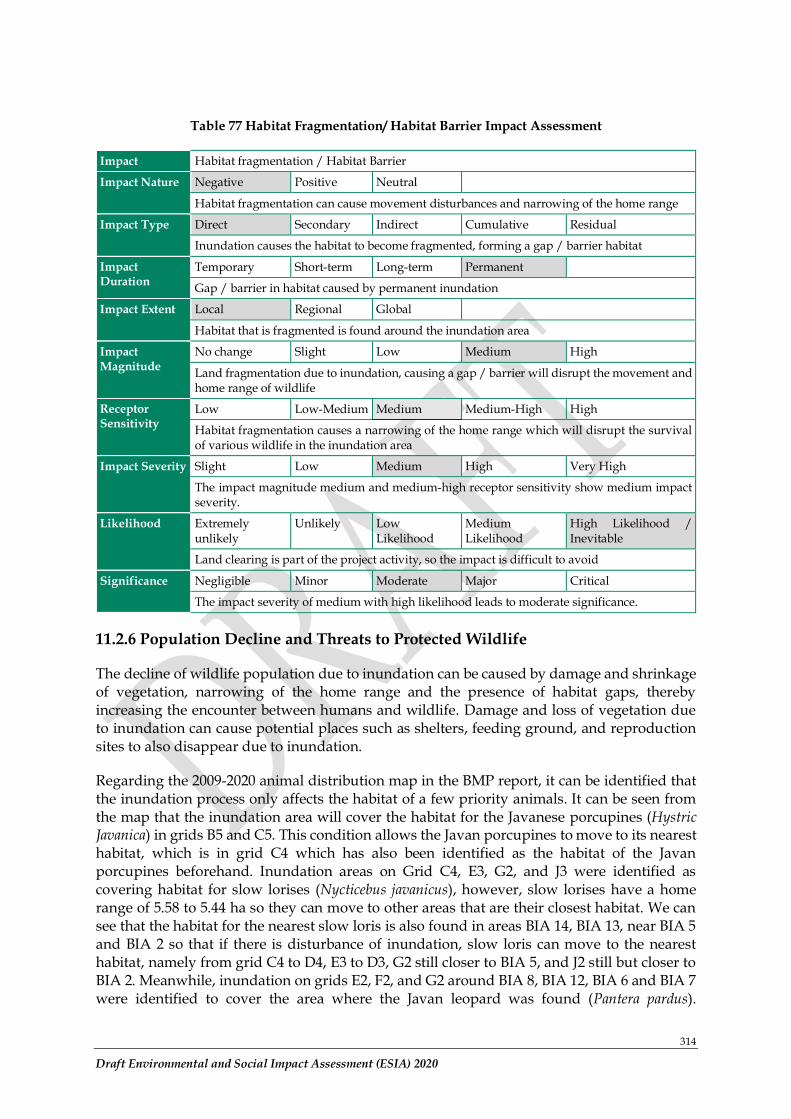
314
Draft Environmental and Social Impact Assessment (ESIA) 2020
Table 77 Habitat Fragmentation/ Habitat Barrier Impact Assessment
Impact Habitat fragmentation / Habitat Barrier
Impact Nature Negative Positive Neutral
Habitat fragmentation can cause movement disturbances and narrowing of the home range
Impact Type Direct Secondary Indirect Cumulative Residual
Inundation causes the habitat to become fragmented, forming a gap / barrier habitat
Impact Duration
Temporary Short-term Long-term Permanent
Gap / barrier in habitat caused by permanent inundation
Impact Extent Local Regional Global
Habitat that is fragmented is found around the inundation area
Impact Magnitude
No change Slight Low Medium High
Land fragmentation due to inundation, causing a gap / barrier will disrupt the movement and home range of wildlife
Receptor Sensitivity
Low Low-Medium Medium Medium-High High
Habitat fragmentation causes a narrowing of the home range which will disrupt the survival of various wildlife in the inundation area
Impact Severity Slight Low Medium High Very High
The impact magnitude medium and medium-high receptor sensitivity show medium impact severity.
Likelihood Extremely unlikely
Unlikely Low Likelihood
Medium Likelihood
High Likelihood / Inevitable
Land clearing is part of the project activity, so the impact is difficult to avoid
Significance Negligible Minor Moderate Major Critical
The impact severity of medium with high likelihood leads to moderate significance.
11.2.6 Population Decline and Threats to Protected Wildlife
The decline of wildlife population due to inundation can be caused by damage and shrinkage of vegetation, narrowing of the home range and the presence of habitat gaps, thereby increasing the encounter between humans and wildlife. Damage and loss of vegetation due to inundation can cause potential places such as shelters, feeding ground, and reproduction sites to also disappear due to inundation.
Regarding the 2009-2020 animal distribution map in the BMP report, it can be identified that the inundation process only affects the habitat of a few priority animals. It can be seen from the map that the inundation area will cover the habitat for the Javanese porcupines (Hystric Javanica) in grids B5 and C5. This condition allows the Javan porcupines to move to its nearest habitat, which is in grid C4 which has also been identified as the habitat of the Javan porcupines beforehand. Inundation areas on Grid C4, E3, G2, and J3 were identified as covering habitat for slow lorises (Nycticebus javanicus), however, slow lorises have a home range of 5.58 to 5.44 ha so they can move to other areas that are their closest habitat. We can see that the habitat for the nearest slow loris is also found in areas BIA 14, BIA 13, near BIA 5 and BIA 2 so that if there is disturbance of inundation, slow loris can move to the nearest habitat, namely from grid C4 to D4, E3 to D3, G2 still closer to BIA 5, and J2 still but closer to BIA 2. Meanwhile, inundation on grids E2, F2, and G2 around BIA 8, BIA 12, BIA 6 and BIA 7 were identified to cover the area where the Javan leopard was found (Pantera pardus).
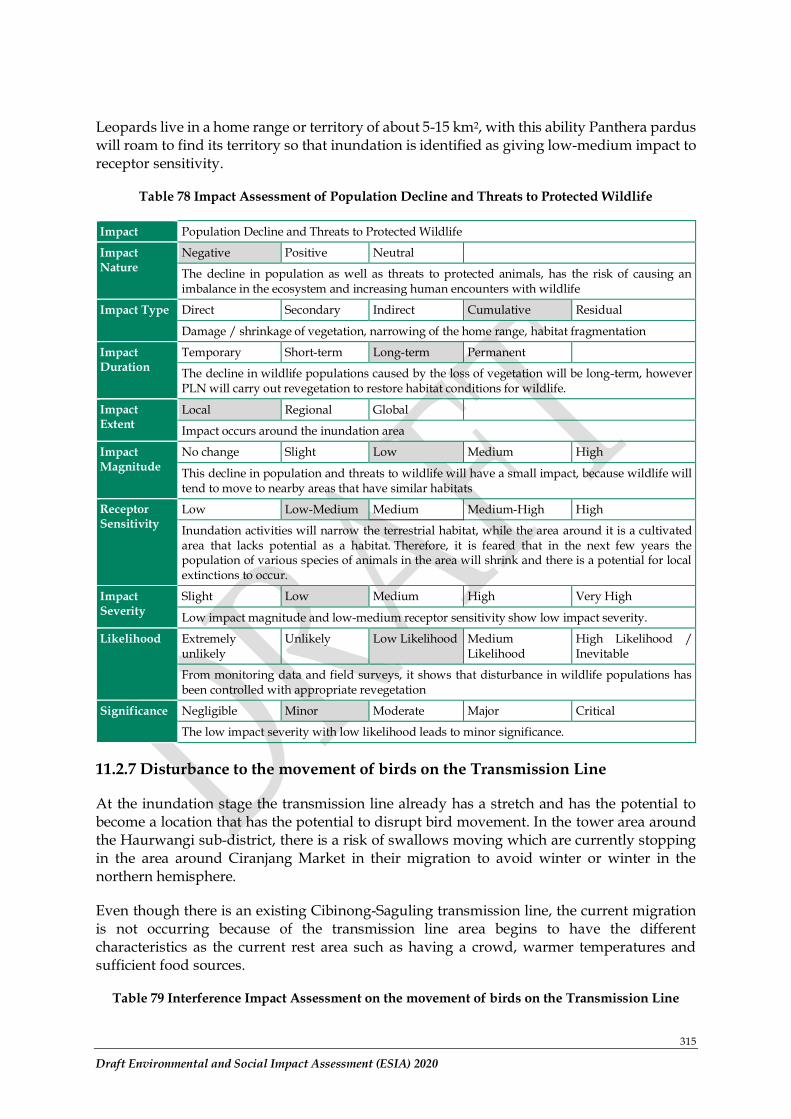
315
Draft Environmental and Social Impact Assessment (ESIA) 2020
Leopards live in a home range or territory of about 5-15 km2, with this ability Panthera pardus will roam to find its territory so that inundation is identified as giving low-medium impact to receptor sensitivity.
Table 78 Impact Assessment of Population Decline and Threats to Protected Wildlife
Impact Population Decline and Threats to Protected Wildlife
Impact Nature
Negative Positive Neutral
The decline in population as well as threats to protected animals, has the risk of causing an imbalance in the ecosystem and increasing human encounters with wildlife
Impact Type Direct Secondary Indirect Cumulative Residual
Damage / shrinkage of vegetation, narrowing of the home range, habitat fragmentation
Impact Duration
Temporary Short-term Long-term Permanent
The decline in wildlife populations caused by the loss of vegetation will be long-term, however PLN will carry out revegetation to restore habitat conditions for wildlife.
Impact Extent
Local Regional Global
Impact occurs around the inundation area
Impact Magnitude
No change Slight Low Medium High
This decline in population and threats to wildlife will have a small impact, because wildlife will tend to move to nearby areas that have similar habitats
Receptor Sensitivity
Low Low-Medium Medium Medium-High High
Inundation activities will narrow the terrestrial habitat, while the area around it is a cultivated area that lacks potential as a habitat. Therefore, it is feared that in the next few years the population of various species of animals in the area will shrink and there is a potential for local extinctions to occur.
Impact Severity
Slight Low Medium High Very High
Low impact magnitude and low-medium receptor sensitivity show low impact severity.
Likelihood Extremely unlikely
Unlikely Low Likelihood Medium Likelihood
High Likelihood / Inevitable
From monitoring data and field surveys, it shows that disturbance in wildlife populations has been controlled with appropriate revegetation
Significance Negligible Minor Moderate Major Critical
The low impact severity with low likelihood leads to minor significance.
11.2.7 Disturbance to the movement of birds on the Transmission Line
At the inundation stage the transmission line already has a stretch and has the potential to become a location that has the potential to disrupt bird movement. In the tower area around the Haurwangi sub-district, there is a risk of swallows moving which are currently stopping in the area around Ciranjang Market in their migration to avoid winter or winter in the northern hemisphere.
Even though there is an existing Cibinong-Saguling transmission line, the current migration is not occurring because of the transmission line area begins to have the different characteristics as the current rest area such as having a crowd, warmer temperatures and sufficient food sources.
Table 79 Interference Impact Assessment on the movement of birds on the Transmission Line
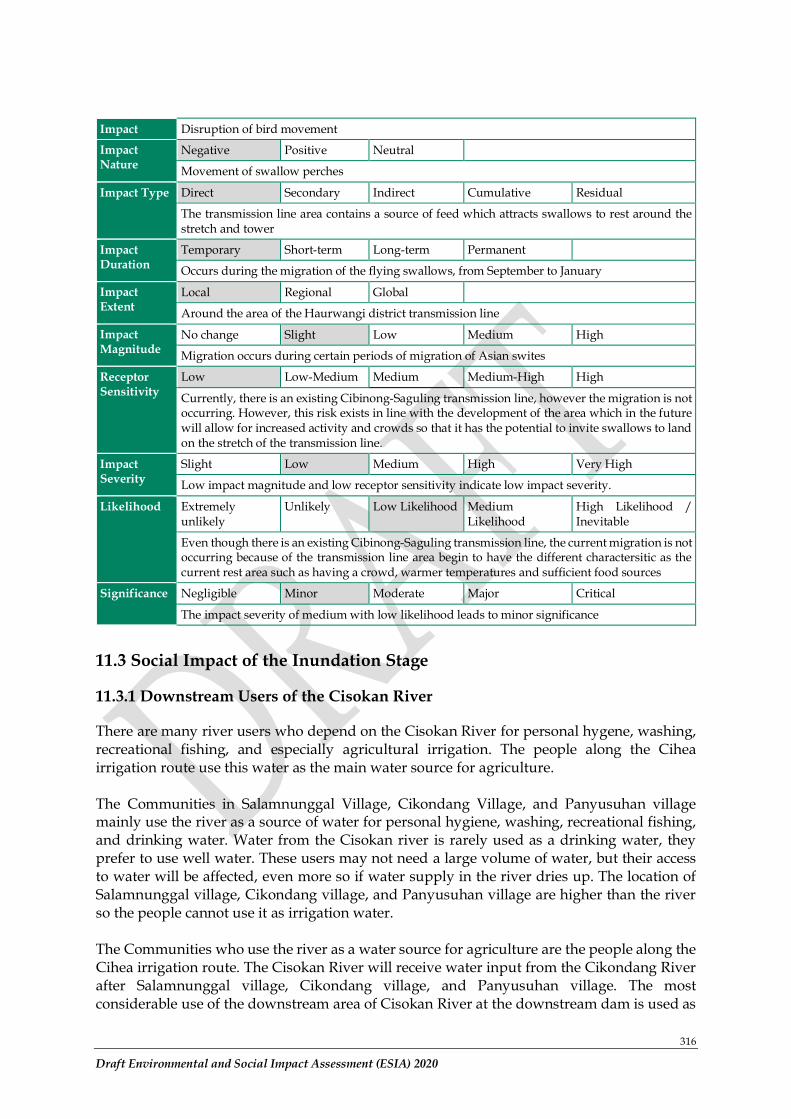
316
Draft Environmental and Social Impact Assessment (ESIA) 2020
Impact Disruption of bird movement
Impact Nature
Negative Positive Neutral
Movement of swallow perches
Impact Type Direct Secondary Indirect Cumulative Residual
The transmission line area contains a source of feed which attracts swallows to rest around the stretch and tower
Impact Duration
Temporary Short-term Long-term Permanent
Occurs during the migration of the flying swallows, from September to January
Impact Extent
Local Regional Global
Around the area of the Haurwangi district transmission line
Impact Magnitude
No change Slight Low Medium High
Migration occurs during certain periods of migration of Asian swites
Receptor Sensitivity
Low Low-Medium Medium Medium-High High
Currently, there is an existing Cibinong-Saguling transmission line, however the migration is not occurring. However, this risk exists in line with the development of the area which in the future will allow for increased activity and crowds so that it has the potential to invite swallows to land on the stretch of the transmission line.
Impact Severity
Slight Low Medium High Very High
Low impact magnitude and low receptor sensitivity indicate low impact severity.
Likelihood Extremely unlikely
Unlikely Low Likelihood Medium Likelihood
High Likelihood / Inevitable
Even though there is an existing Cibinong-Saguling transmission line, the current migration is not occurring because of the transmission line area begin to have the different charactersitic as the current rest area such as having a crowd, warmer temperatures and sufficient food sources
Significance Negligible Minor Moderate Major Critical
The impact severity of medium with low likelihood leads to minor significance
11.3 Social Impact of the Inundation Stage
11.3.1 Downstream Users of the Cisokan River
There are many river users who depend on the Cisokan River for personal hygene, washing, recreational fishing, and especially agricultural irrigation. The people along the Cihea irrigation route use this water as the main water source for agriculture. The Communities in Salamnunggal Village, Cikondang Village, and Panyusuhan village mainly use the river as a source of water for personal hygiene, washing, recreational fishing, and drinking water. Water from the Cisokan river is rarely used as a drinking water, they prefer to use well water. These users may not need a large volume of water, but their access to water will be affected, even more so if water supply in the river dries up. The location of Salamnunggal village, Cikondang village, and Panyusuhan village are higher than the river so the people cannot use it as irrigation water. The Communities who use the river as a water source for agriculture are the people along the Cihea irrigation route. The Cisokan River will receive water input from the Cikondang River after Salamnunggal village, Cikondang village, and Panyusuhan village. The most considerable use of the downstream area of Cisokan River at the downstream dam is used as
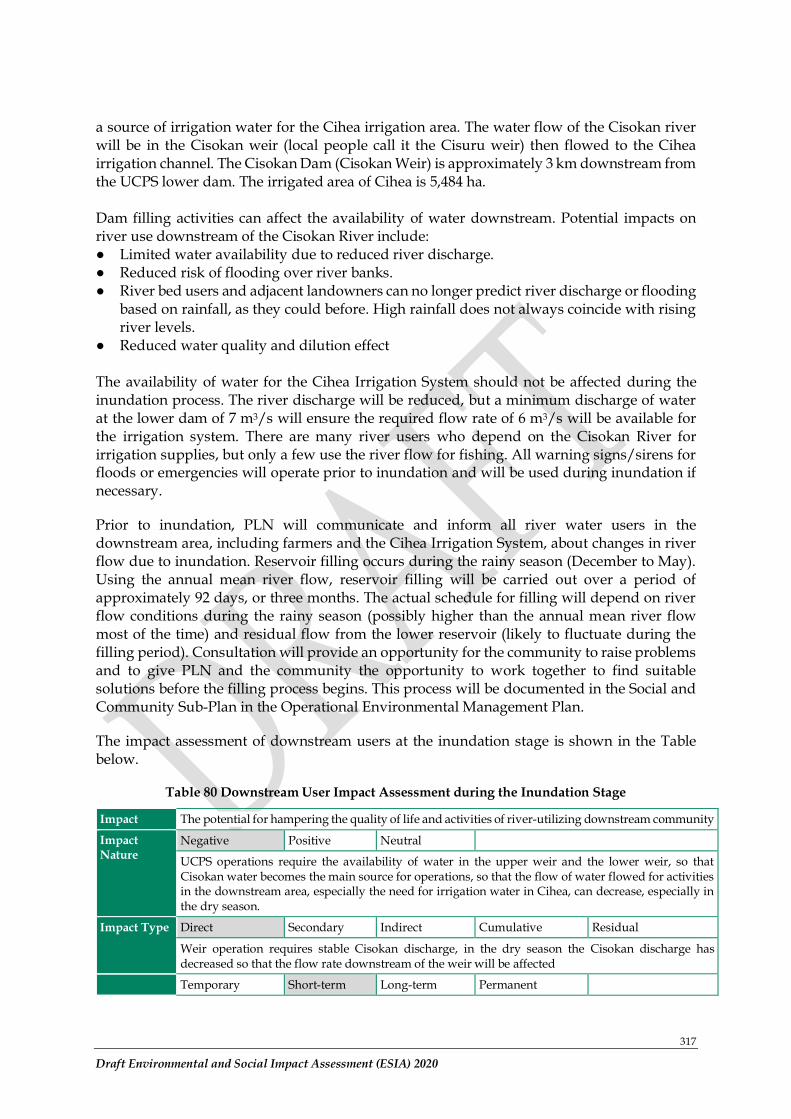
317
Draft Environmental and Social Impact Assessment (ESIA) 2020
a source of irrigation water for the Cihea irrigation area. The water flow of the Cisokan river will be in the Cisokan weir (local people call it the Cisuru weir) then flowed to the Cihea irrigation channel. The Cisokan Dam (Cisokan Weir) is approximately 3 km downstream from the UCPS lower dam. The irrigated area of Cihea is 5,484 ha. Dam filling activities can affect the availability of water downstream. Potential impacts on river use downstream of the Cisokan River include: ● Limited water availability due to reduced river discharge. ● Reduced risk of flooding over river banks. ● River bed users and adjacent landowners can no longer predict river discharge or flooding
based on rainfall, as they could before. High rainfall does not always coincide with rising river levels.
● Reduced water quality and dilution effect The availability of water for the Cihea Irrigation System should not be affected during the inundation process. The river discharge will be reduced, but a minimum discharge of water at the lower dam of 7 m3/s will ensure the required flow rate of 6 m3/s will be available for the irrigation system. There are many river users who depend on the Cisokan River for irrigation supplies, but only a few use the river flow for fishing. All warning signs/sirens for floods or emergencies will operate prior to inundation and will be used during inundation if necessary.
Prior to inundation, PLN will communicate and inform all river water users in the downstream area, including farmers and the Cihea Irrigation System, about changes in river flow due to inundation. Reservoir filling occurs during the rainy season (December to May). Using the annual mean river flow, reservoir filling will be carried out over a period of approximately 92 days, or three months. The actual schedule for filling will depend on river flow conditions during the rainy season (possibly higher than the annual mean river flow most of the time) and residual flow from the lower reservoir (likely to fluctuate during the filling period). Consultation will provide an opportunity for the community to raise problems and to give PLN and the community the opportunity to work together to find suitable solutions before the filling process begins. This process will be documented in the Social and Community Sub-Plan in the Operational Environmental Management Plan.
The impact assessment of downstream users at the inundation stage is shown in the Table below.
Table 80 Downstream User Impact Assessment during the Inundation Stage
Impact The potential for hampering the quality of life and activities of river-utilizing downstream community
Impact Nature
Negative Positive Neutral
UCPS operations require the availability of water in the upper weir and the lower weir, so that Cisokan water becomes the main source for operations, so that the flow of water flowed for activities in the downstream area, especially the need for irrigation water in Cihea, can decrease, especially in the dry season.
Impact Type Direct Secondary Indirect Cumulative Residual
Weir operation requires stable Cisokan discharge, in the dry season the Cisokan discharge has decreased so that the flow rate downstream of the weir will be affected
Temporary Short-term Long-term Permanent
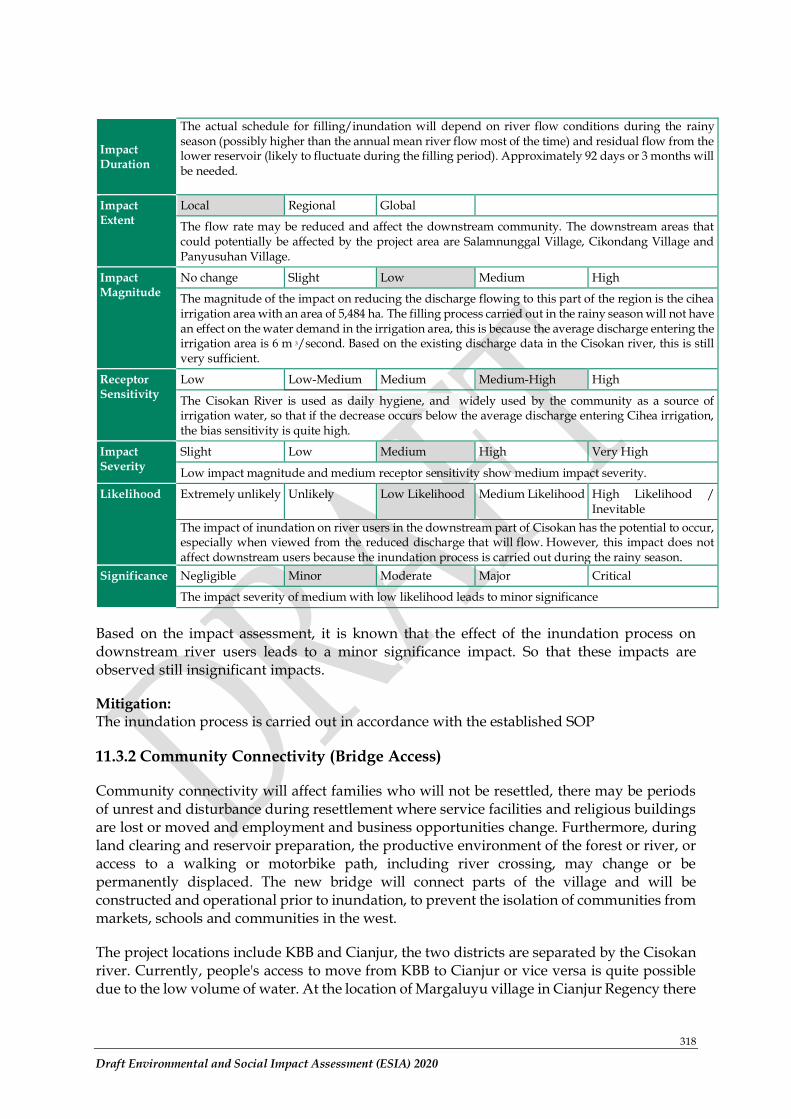
318
Draft Environmental and Social Impact Assessment (ESIA) 2020
Impact Duration
The actual schedule for filling/inundation will depend on river flow conditions during the rainy season (possibly higher than the annual mean river flow most of the time) and residual flow from the lower reservoir (likely to fluctuate during the filling period). Approximately 92 days or 3 months will be needed.
Impact Extent
Local Regional Global
The flow rate may be reduced and affect the downstream community. The downstream areas that could potentially be affected by the project area are Salamnunggal Village, Cikondang Village and Panyusuhan Village.
Impact Magnitude
No change Slight Low Medium High
The magnitude of the impact on reducing the discharge flowing to this part of the region is the cihea irrigation area with an area of 5,484 ha. The filling process carried out in the rainy season will not have an effect on the water demand in the irrigation area, this is because the average discharge entering the irrigation area is 6 m 3/second. Based on the existing discharge data in the Cisokan river, this is still very sufficient.
Receptor Sensitivity
Low Low-Medium Medium Medium-High High
The Cisokan River is used as daily hygiene, and widely used by the community as a source of irrigation water, so that if the decrease occurs below the average discharge entering Cihea irrigation, the bias sensitivity is quite high.
Impact Severity
Slight Low Medium High Very High
Low impact magnitude and medium receptor sensitivity show medium impact severity.
Likelihood Extremely unlikely Unlikely Low Likelihood Medium Likelihood High Likelihood / Inevitable
The impact of inundation on river users in the downstream part of Cisokan has the potential to occur, especially when viewed from the reduced discharge that will flow. However, this impact does not affect downstream users because the inundation process is carried out during the rainy season.
Significance Negligible Minor Moderate Major Critical
The impact severity of medium with low likelihood leads to minor significance
Based on the impact assessment, it is known that the effect of the inundation process on downstream river users leads to a minor significance impact. So that these impacts are observed still insignificant impacts.
Mitigation: The inundation process is carried out in accordance with the established SOP
11.3.2 Community Connectivity (Bridge Access)
Community connectivity will affect families who will not be resettled, there may be periods of unrest and disturbance during resettlement where service facilities and religious buildings are lost or moved and employment and business opportunities change. Furthermore, during land clearing and reservoir preparation, the productive environment of the forest or river, or access to a walking or motorbike path, including river crossing, may change or be permanently displaced. The new bridge will connect parts of the village and will be constructed and operational prior to inundation, to prevent the isolation of communities from markets, schools and communities in the west.
The project locations include KBB and Cianjur, the two districts are separated by the Cisokan river. Currently, people's access to move from KBB to Cianjur or vice versa is quite possible due to the low volume of water. At the location of Margaluyu village in Cianjur Regency there
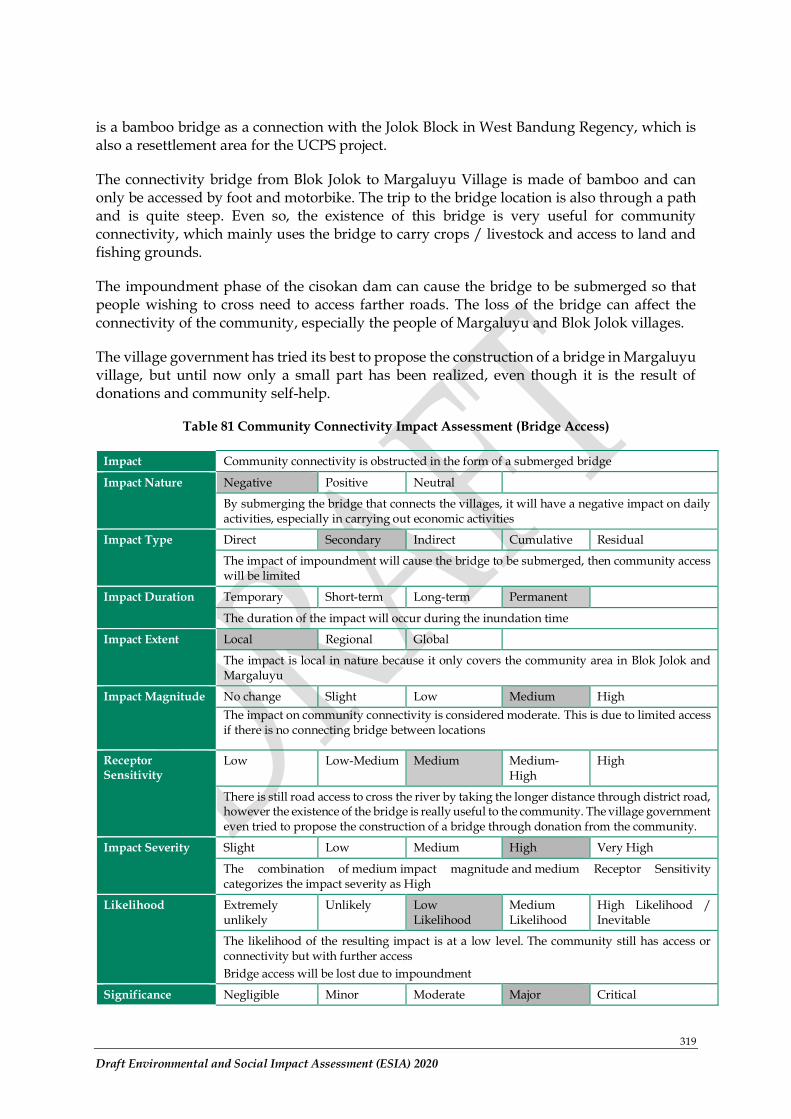
319
Draft Environmental and Social Impact Assessment (ESIA) 2020
is a bamboo bridge as a connection with the Jolok Block in West Bandung Regency, which is also a resettlement area for the UCPS project.
The connectivity bridge from Blok Jolok to Margaluyu Village is made of bamboo and can only be accessed by foot and motorbike. The trip to the bridge location is also through a path and is quite steep. Even so, the existence of this bridge is very useful for community connectivity, which mainly uses the bridge to carry crops / livestock and access to land and fishing grounds.
The impoundment phase of the cisokan dam can cause the bridge to be submerged so that people wishing to cross need to access farther roads. The loss of the bridge can affect the connectivity of the community, especially the people of Margaluyu and Blok Jolok villages.
The village government has tried its best to propose the construction of a bridge in Margaluyu village, but until now only a small part has been realized, even though it is the result of donations and community self-help.
Table 81 Community Connectivity Impact Assessment (Bridge Access)
Impact Community connectivity is obstructed in the form of a submerged bridge
Impact Nature Negative Positive Neutral
By submerging the bridge that connects the villages, it will have a negative impact on daily activities, especially in carrying out economic activities
Impact Type Direct Secondary Indirect Cumulative Residual
The impact of impoundment will cause the bridge to be submerged, then community access will be limited
Impact Duration Temporary Short-term Long-term Permanent
The duration of the impact will occur during the inundation time
Impact Extent Local Regional Global
The impact is local in nature because it only covers the community area in Blok Jolok and Margaluyu
Impact Magnitude No change Slight Low Medium High The impact on community connectivity is considered moderate. This is due to limited access if there is no connecting bridge between locations
Receptor Sensitivity
Low Low-Medium Medium Medium-High
High
There is still road access to cross the river by taking the longer distance through district road, however the existence of the bridge is really useful to the community. The village government even tried to propose the construction of a bridge through donation from the community.
Impact Severity Slight Low Medium High Very High
The combination of medium impact magnitude and medium Receptor Sensitivity categorizes the impact severity as High
Likelihood Extremely unlikely
Unlikely Low Likelihood
Medium Likelihood
High Likelihood / Inevitable
The likelihood of the resulting impact is at a low level. The community still has access or connectivity but with further access
Bridge access will be lost due to impoundment
Significance Negligible Minor Moderate Major Critical
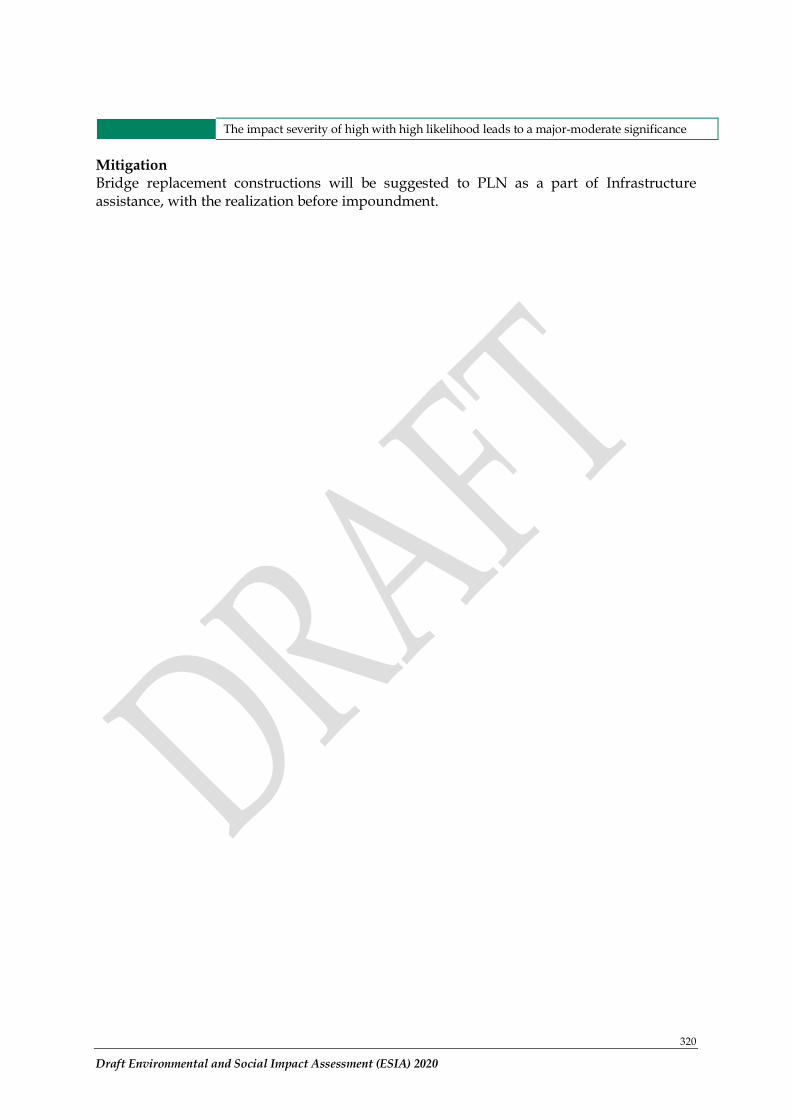
320
Draft Environmental and Social Impact Assessment (ESIA) 2020
The impact severity of high with high likelihood leads to a major-moderate significance
Mitigation Bridge replacement constructions will be suggested to PLN as a part of Infrastructure assistance, with the realization before impoundment.
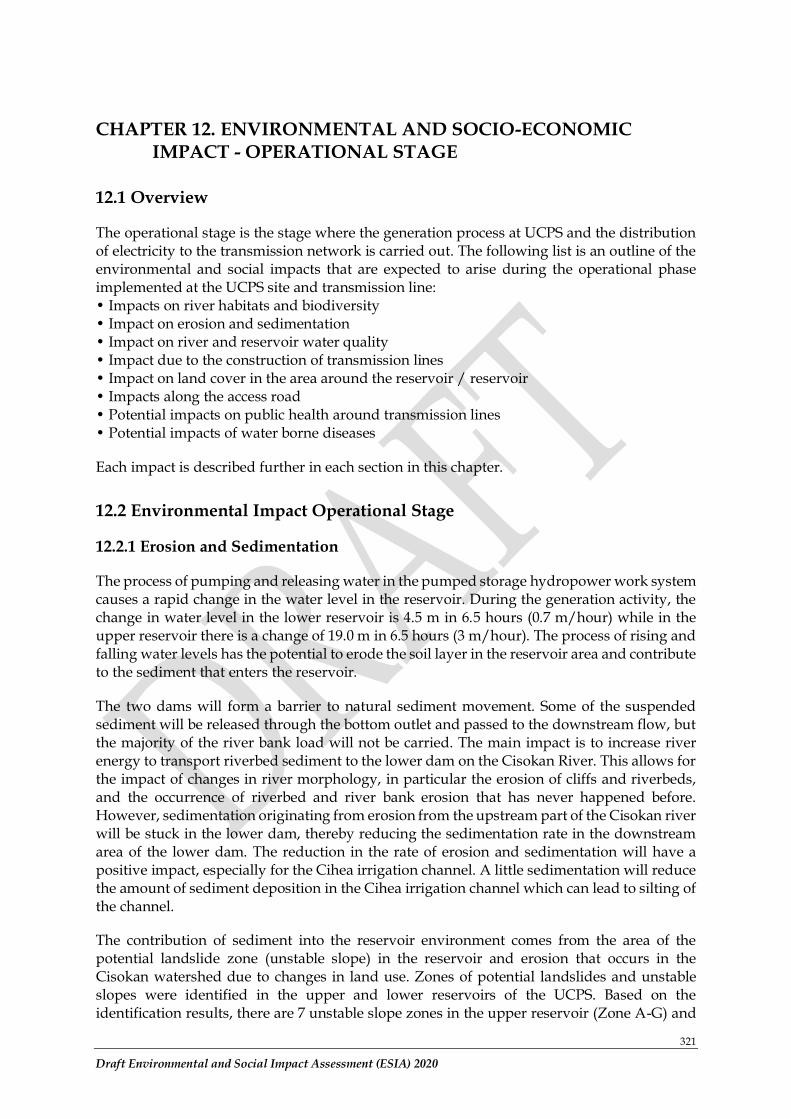
321
Draft Environmental and Social Impact Assessment (ESIA) 2020
CHAPTER 12. ENVIRONMENTAL AND SOCIO-ECONOMIC IMPACT - OPERATIONAL STAGE
12.1 Overview
The operational stage is the stage where the generation process at UCPS and the distribution of electricity to the transmission network is carried out. The following list is an outline of the environmental and social impacts that are expected to arise during the operational phase implemented at the UCPS site and transmission line: • Impacts on river habitats and biodiversity • Impact on erosion and sedimentation • Impact on river and reservoir water quality • Impact due to the construction of transmission lines • Impact on land cover in the area around the reservoir / reservoir • Impacts along the access road • Potential impacts on public health around transmission lines • Potential impacts of water borne diseases
Each impact is described further in each section in this chapter.
12.2 Environmental Impact Operational Stage
12.2.1 Erosion and Sedimentation
The process of pumping and releasing water in the pumped storage hydropower work system causes a rapid change in the water level in the reservoir. During the generation activity, the change in water level in the lower reservoir is 4.5 m in 6.5 hours (0.7 m/hour) while in the upper reservoir there is a change of 19.0 m in 6.5 hours (3 m/hour). The process of rising and falling water levels has the potential to erode the soil layer in the reservoir area and contribute to the sediment that enters the reservoir.
The two dams will form a barrier to natural sediment movement. Some of the suspended sediment will be released through the bottom outlet and passed to the downstream flow, but the majority of the river bank load will not be carried. The main impact is to increase river energy to transport riverbed sediment to the lower dam on the Cisokan River. This allows for the impact of changes in river morphology, in particular the erosion of cliffs and riverbeds, and the occurrence of riverbed and river bank erosion that has never happened before. However, sedimentation originating from erosion from the upstream part of the Cisokan river will be stuck in the lower dam, thereby reducing the sedimentation rate in the downstream area of the lower dam. The reduction in the rate of erosion and sedimentation will have a positive impact, especially for the Cihea irrigation channel. A little sedimentation will reduce the amount of sediment deposition in the Cihea irrigation channel which can lead to silting of the channel.
The contribution of sediment into the reservoir environment comes from the area of the potential landslide zone (unstable slope) in the reservoir and erosion that occurs in the Cisokan watershed due to changes in land use. Zones of potential landslides and unstable slopes were identified in the upper and lower reservoirs of the UCPS. Based on the identification results, there are 7 unstable slope zones in the upper reservoir (Zone A-G) and
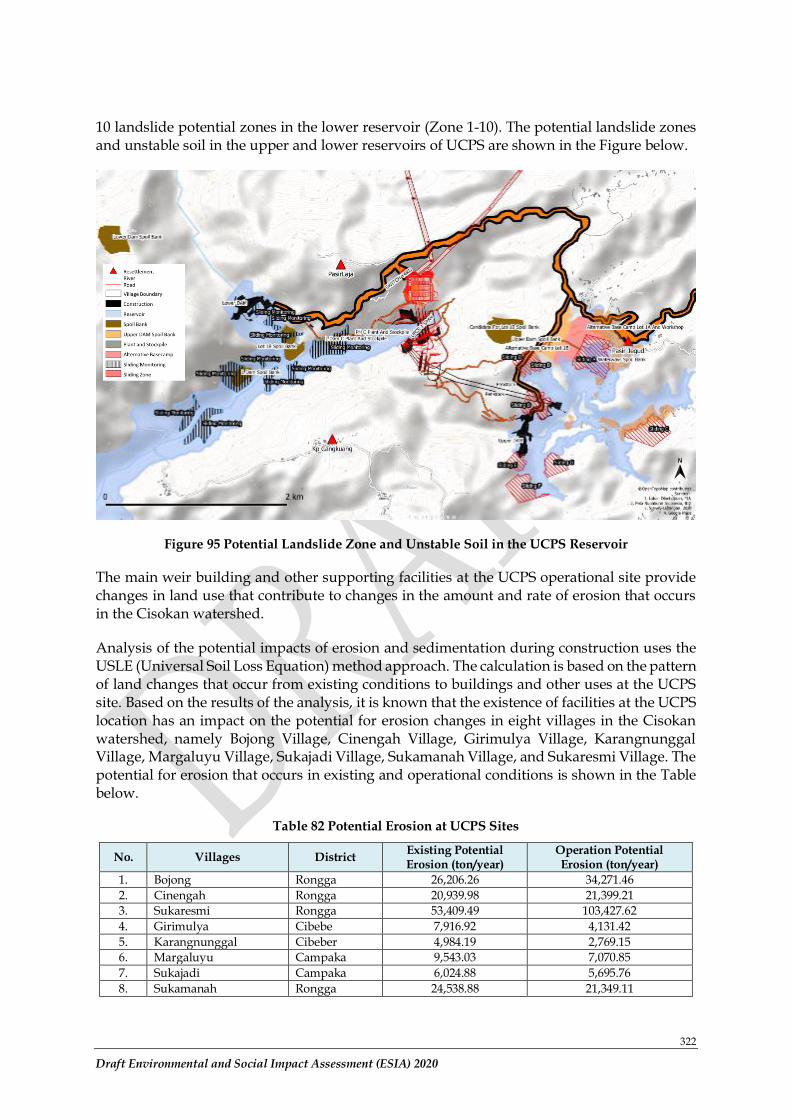
322
Draft Environmental and Social Impact Assessment (ESIA) 2020
10 landslide potential zones in the lower reservoir (Zone 1-10). The potential landslide zones and unstable soil in the upper and lower reservoirs of UCPS are shown in the Figure below.
Figure 95 Potential Landslide Zone and Unstable Soil in the UCPS Reservoir
The main weir building and other supporting facilities at the UCPS operational site provide changes in land use that contribute to changes in the amount and rate of erosion that occurs in the Cisokan watershed.
Analysis of the potential impacts of erosion and sedimentation during construction uses the USLE (Universal Soil Loss Equation) method approach. The calculation is based on the pattern of land changes that occur from existing conditions to buildings and other uses at the UCPS site. Based on the results of the analysis, it is known that the existence of facilities at the UCPS location has an impact on the potential for erosion changes in eight villages in the Cisokan watershed, namely Bojong Village, Cinengah Village, Girimulya Village, Karangnunggal Village, Margaluyu Village, Sukajadi Village, Sukamanah Village, and Sukaresmi Village. The potential for erosion that occurs in existing and operational conditions is shown in the Table below.
Table 82 Potential Erosion at UCPS Sites
No. Villages District Existing Potential Erosion (ton/year)
Operation Potential Erosion (ton/year)
1. Bojong Rongga 26,206.26 34,271.46
2. Cinengah Rongga 20,939.98 21,399.21
3. Sukaresmi Rongga 53,409.49 103,427.62
4. Girimulya Cibebe 7,916.92 4,131.42
5. Karangnunggal Cibeber 4,984.19 2,769.15
6. Margaluyu Campaka 9,543.03 7,070.85
7. Sukajadi Campaka 6,024.88 5,695.76
8. Sukamanah Rongga 24,538.88 21,349.11
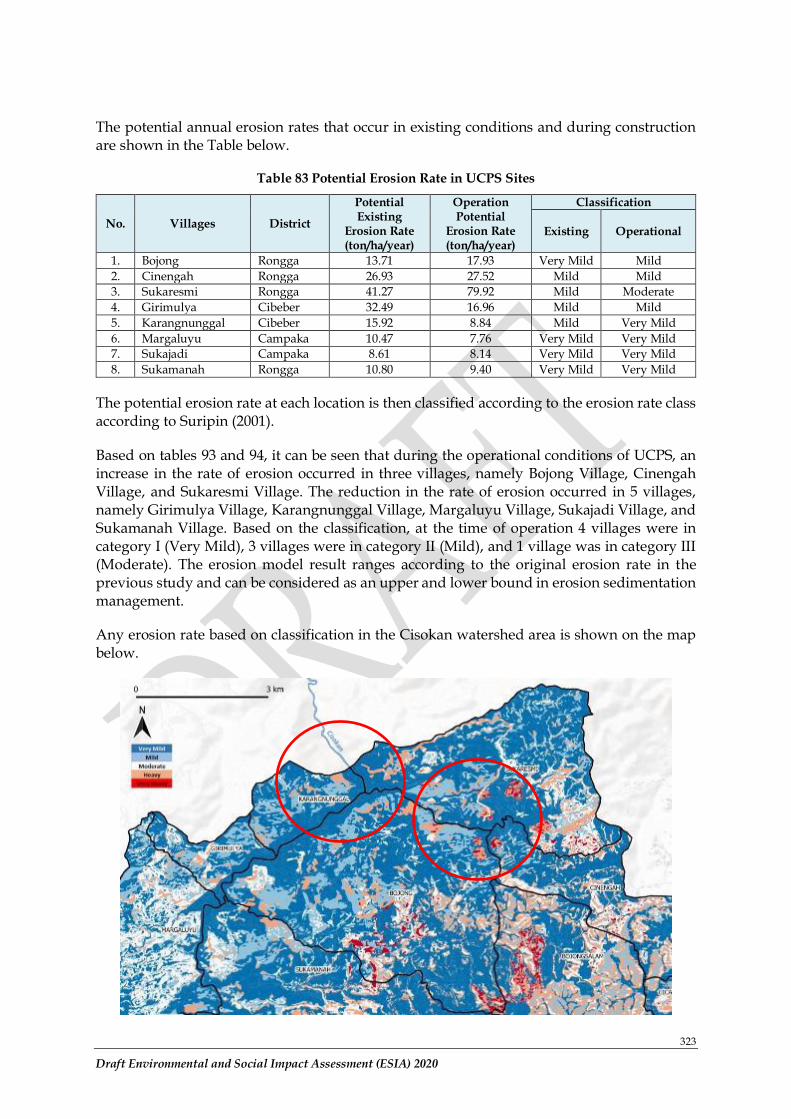
323
Draft Environmental and Social Impact Assessment (ESIA) 2020
The potential annual erosion rates that occur in existing conditions and during construction are shown in the Table below.
Table 83 Potential Erosion Rate in UCPS Sites
No. Villages District
Potential Existing
Erosion Rate (ton/ha/year)
Operation Potential
Erosion Rate (ton/ha/year)
Classification
Existing Operational
1. Bojong Rongga 13.71 17.93 Very Mild Mild
2. Cinengah Rongga 26.93 27.52 Mild Mild
3. Sukaresmi Rongga 41.27 79.92 Mild Moderate
4. Girimulya Cibeber 32.49 16.96 Mild Mild
5. Karangnunggal Cibeber 15.92 8.84 Mild Very Mild
6. Margaluyu Campaka 10.47 7.76 Very Mild Very Mild
7. Sukajadi Campaka 8.61 8.14 Very Mild Very Mild
8. Sukamanah Rongga 10.80 9.40 Very Mild Very Mild
The potential erosion rate at each location is then classified according to the erosion rate class according to Suripin (2001).
Based on tables 93 and 94, it can be seen that during the operational conditions of UCPS, an increase in the rate of erosion occurred in three villages, namely Bojong Village, Cinengah Village, and Sukaresmi Village. The reduction in the rate of erosion occurred in 5 villages, namely Girimulya Village, Karangnunggal Village, Margaluyu Village, Sukajadi Village, and Sukamanah Village. Based on the classification, at the time of operation 4 villages were in category I (Very Mild), 3 villages were in category II (Mild), and 1 village was in category III (Moderate). The erosion model result ranges according to the original erosion rate in the previous study and can be considered as an upper and lower bound in erosion sedimentation management.
Any erosion rate based on classification in the Cisokan watershed area is shown on the map below.
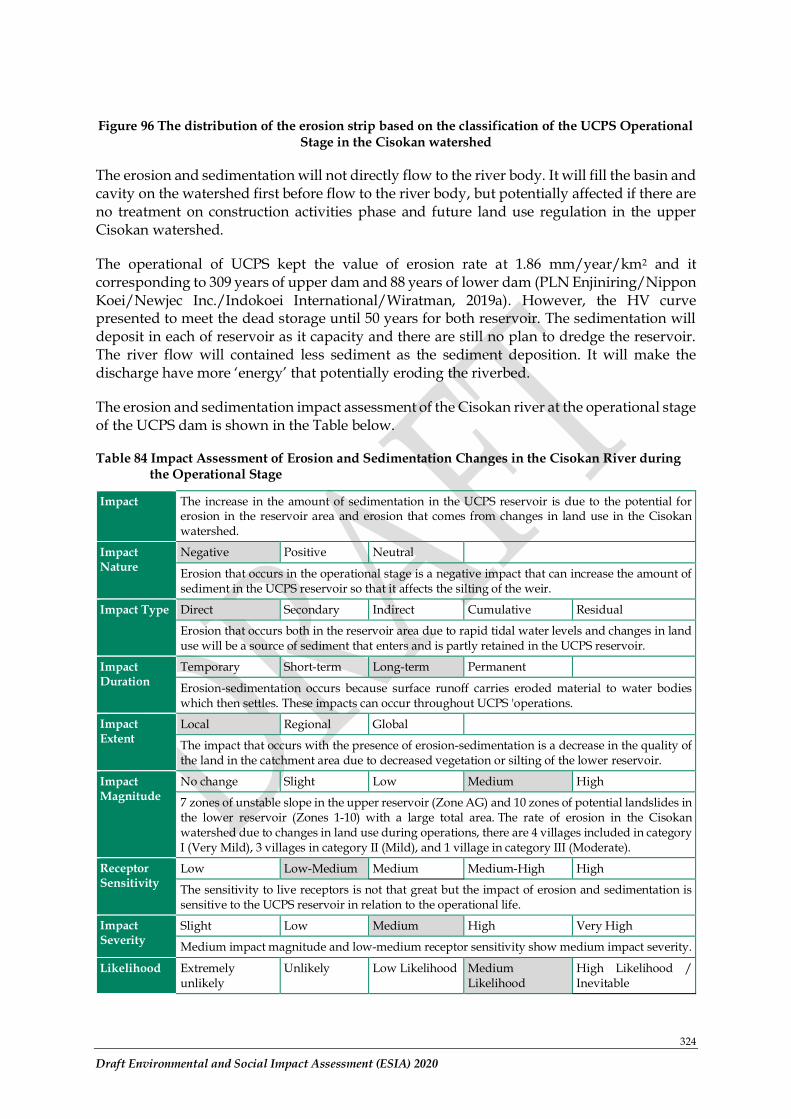
324
Draft Environmental and Social Impact Assessment (ESIA) 2020
Figure 96 The distribution of the erosion strip based on the classification of the UCPS Operational Stage in the Cisokan watershed
The erosion and sedimentation will not directly flow to the river body. It will fill the basin and cavity on the watershed first before flow to the river body, but potentially affected if there are no treatment on construction activities phase and future land use regulation in the upper Cisokan watershed.
The operational of UCPS kept the value of erosion rate at 1.86 mm/year/km2 and it corresponding to 309 years of upper dam and 88 years of lower dam (PLN Enjiniring/Nippon Koei/Newjec Inc./Indokoei International/Wiratman, 2019a). However, the HV curve presented to meet the dead storage until 50 years for both reservoir. The sedimentation will deposit in each of reservoir as it capacity and there are still no plan to dredge the reservoir. The river flow will contained less sediment as the sediment deposition. It will make the discharge have more ‘energy’ that potentially eroding the riverbed.
The erosion and sedimentation impact assessment of the Cisokan river at the operational stage of the UCPS dam is shown in the Table below.
Table 84 Impact Assessment of Erosion and Sedimentation Changes in the Cisokan River during the Operational Stage
Impact The increase in the amount of sedimentation in the UCPS reservoir is due to the potential for erosion in the reservoir area and erosion that comes from changes in land use in the Cisokan watershed.
Impact Nature
Negative Positive Neutral
Erosion that occurs in the operational stage is a negative impact that can increase the amount of sediment in the UCPS reservoir so that it affects the silting of the weir.
Impact Type Direct Secondary Indirect Cumulative Residual
Erosion that occurs both in the reservoir area due to rapid tidal water levels and changes in land use will be a source of sediment that enters and is partly retained in the UCPS reservoir.
Impact Duration
Temporary Short-term Long-term Permanent
Erosion-sedimentation occurs because surface runoff carries eroded material to water bodies which then settles. These impacts can occur throughout UCPS 'operations.
Impact Extent
Local Regional Global
The impact that occurs with the presence of erosion-sedimentation is a decrease in the quality of the land in the catchment area due to decreased vegetation or silting of the lower reservoir.
Impact Magnitude
No change Slight Low Medium High
7 zones of unstable slope in the upper reservoir (Zone AG) and 10 zones of potential landslides in the lower reservoir (Zones 1-10) with a large total area. The rate of erosion in the Cisokan watershed due to changes in land use during operations, there are 4 villages included in category I (Very Mild), 3 villages in category II (Mild), and 1 village in category III (Moderate).
Receptor Sensitivity
Low Low-Medium Medium Medium-High High
The sensitivity to live receptors is not that great but the impact of erosion and sedimentation is sensitive to the UCPS reservoir in relation to the operational life.
Impact Severity
Slight Low Medium High Very High
Medium impact magnitude and low-medium receptor sensitivity show medium impact severity.
Likelihood Extremely unlikely
Unlikely Low Likelihood Medium Likelihood
High Likelihood / Inevitable
325
Draft Environmental and Social Impact Assessment (ESIA) 2020
The impact of erosion that contributes to the introduction of sedimentation into water bodies and is held in reservoirs is a definite impact.
Significance Negligible Minor Moderate Major Critical
The impact severity of medium with medium likelihood leads to minor-moderate significance
The results of the impact assessment of erosion and sedimentation at the UCPS operational stage showed a minor-moderate level.
12.2.2 Hydrology, River Flow Discharge, and Water Availability for UCPS Downstream Users
Unlike conventional hydro schemes, a pumped storage scheme only cycles water between reservoirs and there is no capture and storage of water for future use, and there is no net downstream discharge when generating electricity. To maintain the active storage capacity within the pumped storage system, the scheme is designed to pass excess water downstream rather than store it within the reservoirs. So, as discussed in Section 4, most of the water that flows into the two reservoirs will either be passed through the bottom outlet or over the spillway so that the downstream hydrology will be very similar to the existing situation.
Cirumamis River:
The downstream flow in the Cirumamis River will be the same as the inflow for all flows,
except it is possible that very low flow periods, if the river reduces below 0.01 m3/s, the
downstream flow releases may exceed inflow13. The bottom outlet of the upper dam allows a
minimum of 0.01 m3/s and a maximum discharge of 0.96 m3/s. The discharge of the water
will flow directly into the Cirumamis River. The residual flow will decrease during periods of
low discharge (dry season and dry period in the rainy season) in accordance with the reduced
inflow into the reservoir. The maximum discharge of 0.96 m3/s will be achieved during the
rainy season or during high rainfall. Any discharge greater than 0.96 m3/s will be discharged
via the spillway when the reservoir is at full capacity.
Cisokan River:
The downstream flow in the Cisokan River will be the same as the inflow for all flows except for a small amount of flow, anticipated to be 0.2 m 3/s to replenish evaporation from the two reservoirs. The required ‘top up’ water will have no noticeable effect on the downstream Cisokan River during most flows with the exception of extreme low flow periods (less than Q97). For example, at Q97 inflow of 1.7 m3/s, the downstream will be 1.5 m3/s. In 2014, the Ministry of PUPR issued Ministerial Decree No. 619 / KPTS / M / 2014 concerning the granting of water resources utilization permits (SIPA) from the Cisokan River to PT. PLN (Persero). To maintain water availability for the purpose of river maintenance, a minimum e-flow of 0.55 m3/s is permitted. During the dry season where the Cisokan River discharge is below 0.55 m3/s, UCPS must discharge at least 0.55 m3/s. Using the rationale that the scheme only takes 0.2m3/s, this minimum e-flow would be reached when the inflow is at
13 This is difficult to conclude because the natural extreme low flow conditions has been recorded.
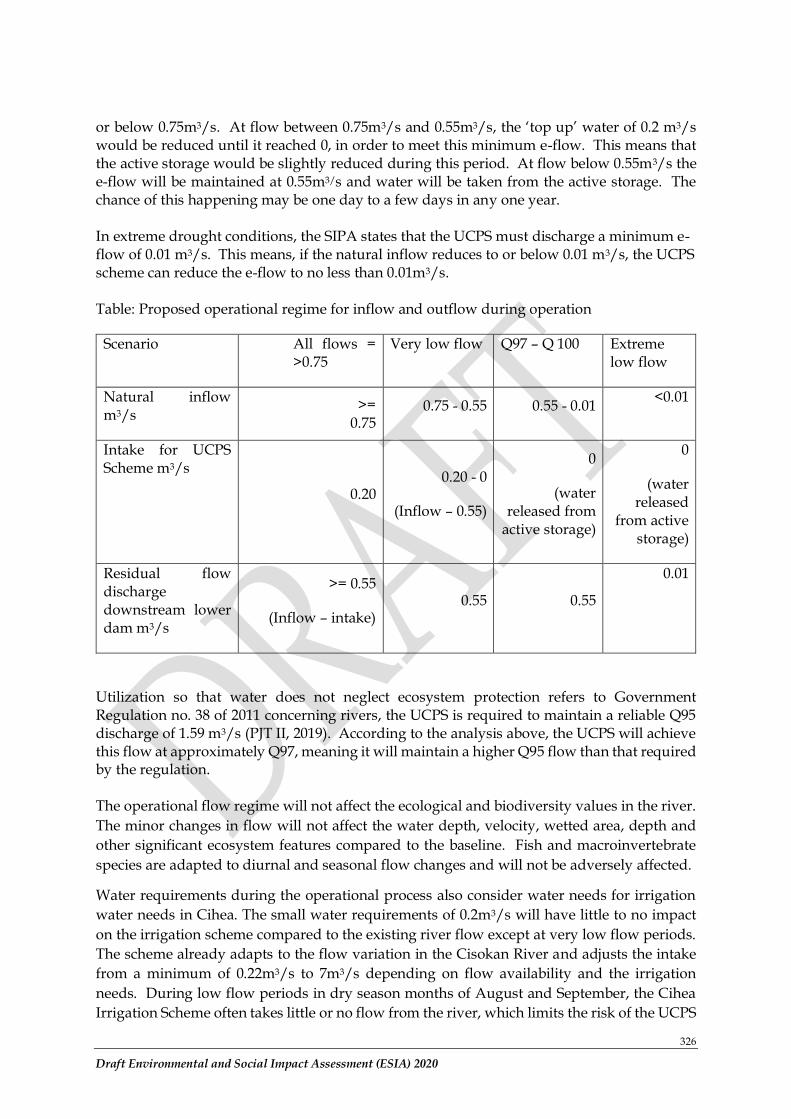
326
Draft Environmental and Social Impact Assessment (ESIA) 2020
or below 0.75m3/s. At flow between 0.75m3/s and 0.55m3/s, the ‘top up’ water of 0.2 m3/s would be reduced until it reached 0, in order to meet this minimum e-flow. This means that the active storage would be slightly reduced during this period. At flow below 0.55m3/s the e-flow will be maintained at 0.55m3/s and water will be taken from the active storage. The chance of this happening may be one day to a few days in any one year. In extreme drought conditions, the SIPA states that the UCPS must discharge a minimum e-flow of 0.01 m3/s. This means, if the natural inflow reduces to or below 0.01 m3/s, the UCPS scheme can reduce the e-flow to no less than 0.01m3/s. Table: Proposed operational regime for inflow and outflow during operation
Scenario All flows = >0.75
Very low flow Q97 – Q 100 Extreme low flow
Natural inflow m3/s
>= 0.75
0.75 - 0.55 0.55 - 0.01 <0.01
Intake for UCPS Scheme m3/s
0.20 0.20 - 0
(Inflow – 0.55)
0
(water released from
active storage)
0
(water released
from active storage)
Residual flow discharge downstream lower dam m3/s
>= 0.55
(Inflow – intake) 0.55 0.55
0.01
Utilization so that water does not neglect ecosystem protection refers to Government Regulation no. 38 of 2011 concerning rivers, the UCPS is required to maintain a reliable Q95 discharge of 1.59 m3/s (PJT II, 2019). According to the analysis above, the UCPS will achieve this flow at approximately Q97, meaning it will maintain a higher Q95 flow than that required by the regulation. The operational flow regime will not affect the ecological and biodiversity values in the river.
The minor changes in flow will not affect the water depth, velocity, wetted area, depth and
other significant ecosystem features compared to the baseline. Fish and macroinvertebrate
species are adapted to diurnal and seasonal flow changes and will not be adversely affected.
Water requirements during the operational process also consider water needs for irrigation
water needs in Cihea. The small water requirements of 0.2m3/s will have little to no impact
on the irrigation scheme compared to the existing river flow except at very low flow periods.
The scheme already adapts to the flow variation in the Cisokan River and adjusts the intake
from a minimum of 0.22m3/s to 7m3/s depending on flow availability and the irrigation
needs. During low flow periods in dry season months of August and September, the Cihea
Irrigation Scheme often takes little or no flow from the river, which limits the risk of the UCPS
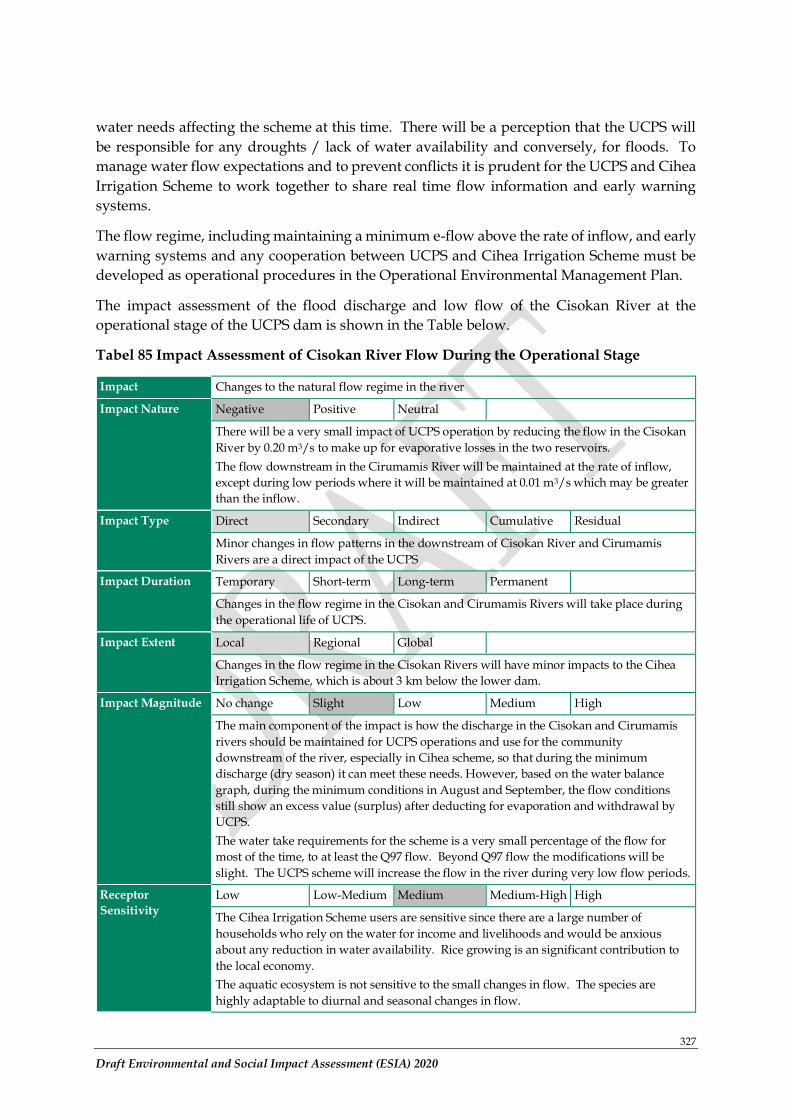
327
Draft Environmental and Social Impact Assessment (ESIA) 2020
water needs affecting the scheme at this time. There will be a perception that the UCPS will
be responsible for any droughts / lack of water availability and conversely, for floods. To
manage water flow expectations and to prevent conflicts it is prudent for the UCPS and Cihea
Irrigation Scheme to work together to share real time flow information and early warning
systems.
The flow regime, including maintaining a minimum e-flow above the rate of inflow, and early
warning systems and any cooperation between UCPS and Cihea Irrigation Scheme must be
developed as operational procedures in the Operational Environmental Management Plan.
The impact assessment of the flood discharge and low flow of the Cisokan River at the
operational stage of the UCPS dam is shown in the Table below.
Tabel 85 Impact Assessment of Cisokan River Flow During the Operational Stage
Impact Changes to the natural flow regime in the river
Impact Nature Negative Positive Neutral
There will be a very small impact of UCPS operation by reducing the flow in the Cisokan
River by 0.20 m3/s to make up for evaporative losses in the two reservoirs.
The flow downstream in the Cirumamis River will be maintained at the rate of inflow,
except during low periods where it will be maintained at 0.01 m3/s which may be greater
than the inflow.
Impact Type Direct Secondary Indirect Cumulative Residual
Minor changes in flow patterns in the downstream of Cisokan River and Cirumamis
Rivers are a direct impact of the UCPS
Impact Duration Temporary Short-term Long-term Permanent
Changes in the flow regime in the Cisokan and Cirumamis Rivers will take place during
the operational life of UCPS.
Impact Extent Local Regional Global
Changes in the flow regime in the Cisokan Rivers will have minor impacts to the Cihea
Irrigation Scheme, which is about 3 km below the lower dam.
Impact Magnitude No change Slight Low Medium High
The main component of the impact is how the discharge in the Cisokan and Cirumamis
rivers should be maintained for UCPS operations and use for the community
downstream of the river, especially in Cihea scheme, so that during the minimum
discharge (dry season) it can meet these needs. However, based on the water balance
graph, during the minimum conditions in August and September, the flow conditions
still show an excess value (surplus) after deducting for evaporation and withdrawal by
UCPS.
The water take requirements for the scheme is a very small percentage of the flow for
most of the time, to at least the Q97 flow. Beyond Q97 flow the modifications will be
slight. The UCPS scheme will increase the flow in the river during very low flow periods.
Receptor
Sensitivity
Low Low-Medium Medium Medium-High High
The Cihea Irrigation Scheme users are sensitive since there are a large number of
households who rely on the water for income and livelihoods and would be anxious
about any reduction in water availability. Rice growing is an significant contribution to
the local economy.
The aquatic ecosystem is not sensitive to the small changes in flow. The species are
highly adaptable to diurnal and seasonal changes in flow.
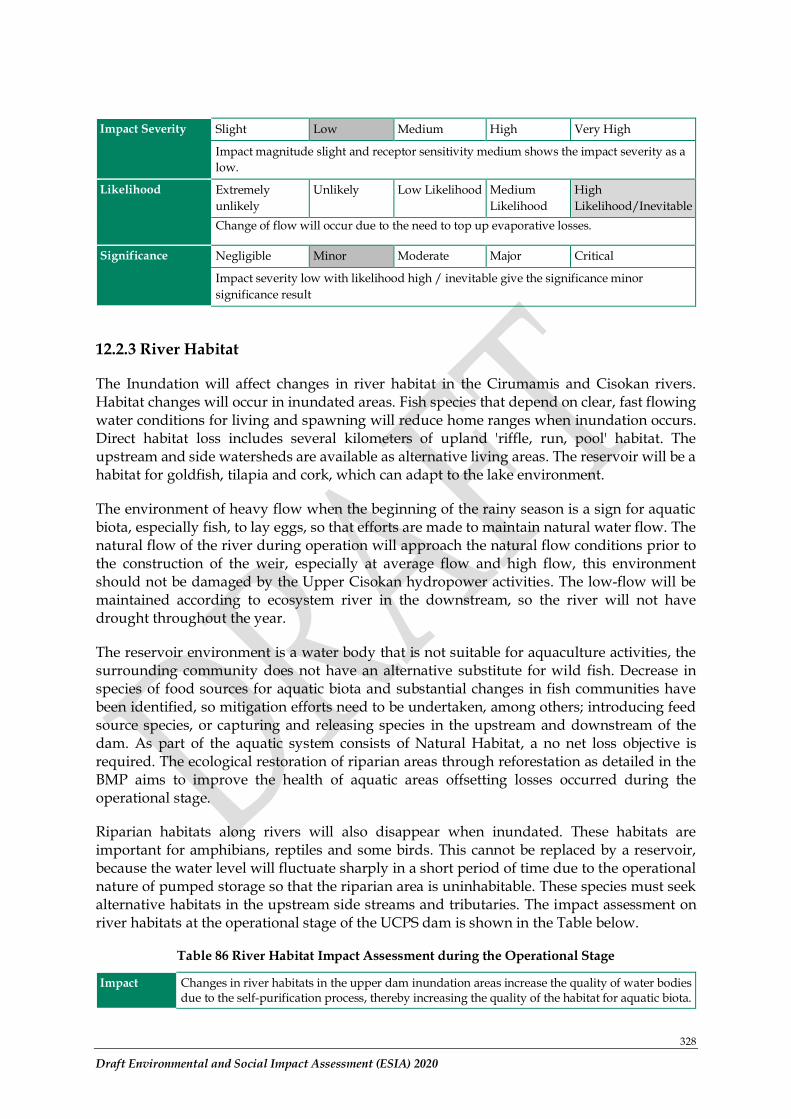
328
Draft Environmental and Social Impact Assessment (ESIA) 2020
Impact Severity Slight Low Medium High Very High
Impact magnitude slight and receptor sensitivity medium shows the impact severity as a
low.
Likelihood Extremely
unlikely
Unlikely Low Likelihood Medium
Likelihood
High
Likelihood/Inevitable
Change of flow will occur due to the need to top up evaporative losses.
Significance Negligible Minor Moderate Major Critical
Impact severity low with likelihood high / inevitable give the significance minor
significance result
12.2.3 River Habitat
The Inundation will affect changes in river habitat in the Cirumamis and Cisokan rivers. Habitat changes will occur in inundated areas. Fish species that depend on clear, fast flowing water conditions for living and spawning will reduce home ranges when inundation occurs. Direct habitat loss includes several kilometers of upland 'riffle, run, pool' habitat. The upstream and side watersheds are available as alternative living areas. The reservoir will be a habitat for goldfish, tilapia and cork, which can adapt to the lake environment.
The environment of heavy flow when the beginning of the rainy season is a sign for aquatic biota, especially fish, to lay eggs, so that efforts are made to maintain natural water flow. The natural flow of the river during operation will approach the natural flow conditions prior to the construction of the weir, especially at average flow and high flow, this environment should not be damaged by the Upper Cisokan hydropower activities. The low-flow will be maintained according to ecosystem river in the downstream, so the river will not have drought throughout the year.
The reservoir environment is a water body that is not suitable for aquaculture activities, the surrounding community does not have an alternative substitute for wild fish. Decrease in species of food sources for aquatic biota and substantial changes in fish communities have been identified, so mitigation efforts need to be undertaken, among others; introducing feed source species, or capturing and releasing species in the upstream and downstream of the dam. As part of the aquatic system consists of Natural Habitat, a no net loss objective is required. The ecological restoration of riparian areas through reforestation as detailed in the BMP aims to improve the health of aquatic areas offsetting losses occurred during the operational stage.
Riparian habitats along rivers will also disappear when inundated. These habitats are important for amphibians, reptiles and some birds. This cannot be replaced by a reservoir, because the water level will fluctuate sharply in a short period of time due to the operational nature of pumped storage so that the riparian area is uninhabitable. These species must seek alternative habitats in the upstream side streams and tributaries. The impact assessment on river habitats at the operational stage of the UCPS dam is shown in the Table below.
Table 86 River Habitat Impact Assessment during the Operational Stage
Impact Changes in river habitats in the upper dam inundation areas increase the quality of water bodies due to the self-purification process, thereby increasing the quality of the habitat for aquatic biota.
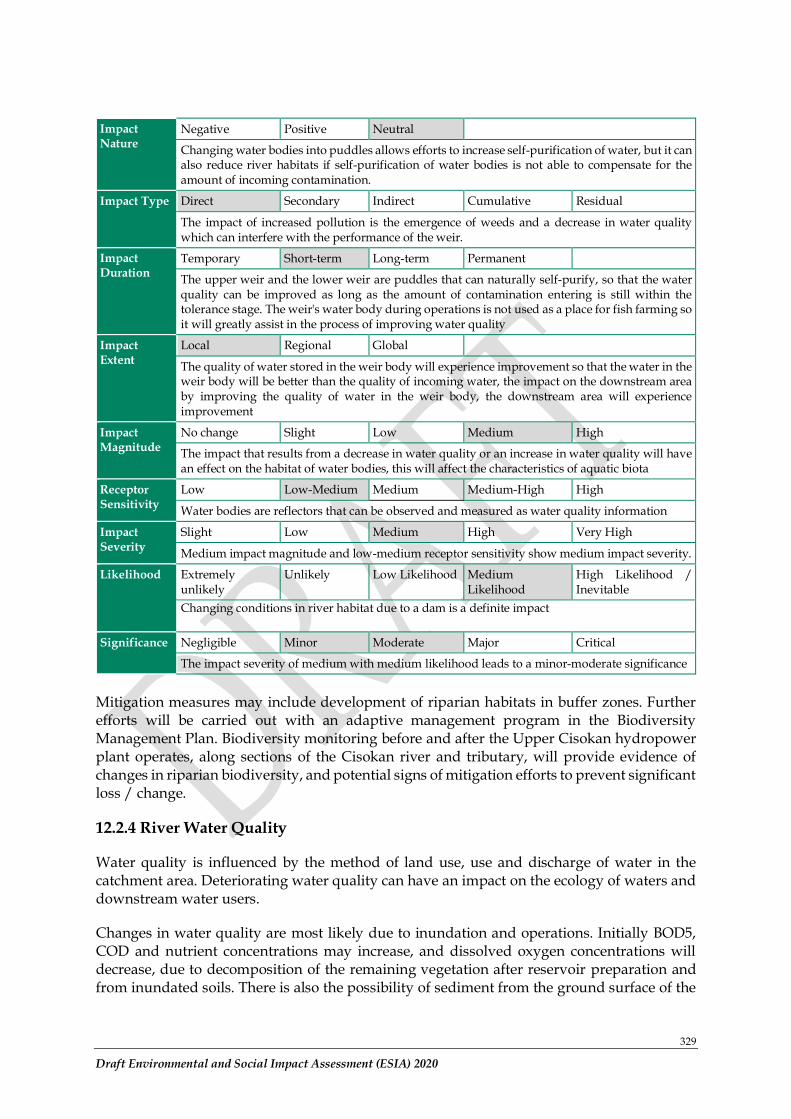
329
Draft Environmental and Social Impact Assessment (ESIA) 2020
Impact Nature
Negative Positive Neutral
Changing water bodies into puddles allows efforts to increase self-purification of water, but it can also reduce river habitats if self-purification of water bodies is not able to compensate for the amount of incoming contamination.
Impact Type Direct Secondary Indirect Cumulative Residual
The impact of increased pollution is the emergence of weeds and a decrease in water quality which can interfere with the performance of the weir.
Impact Duration
Temporary Short-term Long-term Permanent
The upper weir and the lower weir are puddles that can naturally self-purify, so that the water quality can be improved as long as the amount of contamination entering is still within the tolerance stage. The weir's water body during operations is not used as a place for fish farming so it will greatly assist in the process of improving water quality
Impact Extent
Local Regional Global
The quality of water stored in the weir body will experience improvement so that the water in the weir body will be better than the quality of incoming water, the impact on the downstream area by improving the quality of water in the weir body, the downstream area will experience improvement
Impact Magnitude
No change Slight Low Medium High
The impact that results from a decrease in water quality or an increase in water quality will have an effect on the habitat of water bodies, this will affect the characteristics of aquatic biota
Receptor Sensitivity
Low Low-Medium Medium Medium-High High
Water bodies are reflectors that can be observed and measured as water quality information
Impact Severity
Slight Low Medium High Very High
Medium impact magnitude and low-medium receptor sensitivity show medium impact severity.
Likelihood Extremely unlikely
Unlikely Low Likelihood Medium Likelihood
High Likelihood / Inevitable
Changing conditions in river habitat due to a dam is a definite impact
Significance Negligible Minor Moderate Major Critical
The impact severity of medium with medium likelihood leads to a minor-moderate significance
Mitigation measures may include development of riparian habitats in buffer zones. Further efforts will be carried out with an adaptive management program in the Biodiversity Management Plan. Biodiversity monitoring before and after the Upper Cisokan hydropower plant operates, along sections of the Cisokan river and tributary, will provide evidence of changes in riparian biodiversity, and potential signs of mitigation efforts to prevent significant loss / change.
12.2.4 River Water Quality
Water quality is influenced by the method of land use, use and discharge of water in the catchment area. Deteriorating water quality can have an impact on the ecology of waters and downstream water users.
Changes in water quality are most likely due to inundation and operations. Initially BOD5, COD and nutrient concentrations may increase, and dissolved oxygen concentrations will decrease, due to decomposition of the remaining vegetation after reservoir preparation and from inundated soils. There is also the possibility of sediment from the ground surface of the
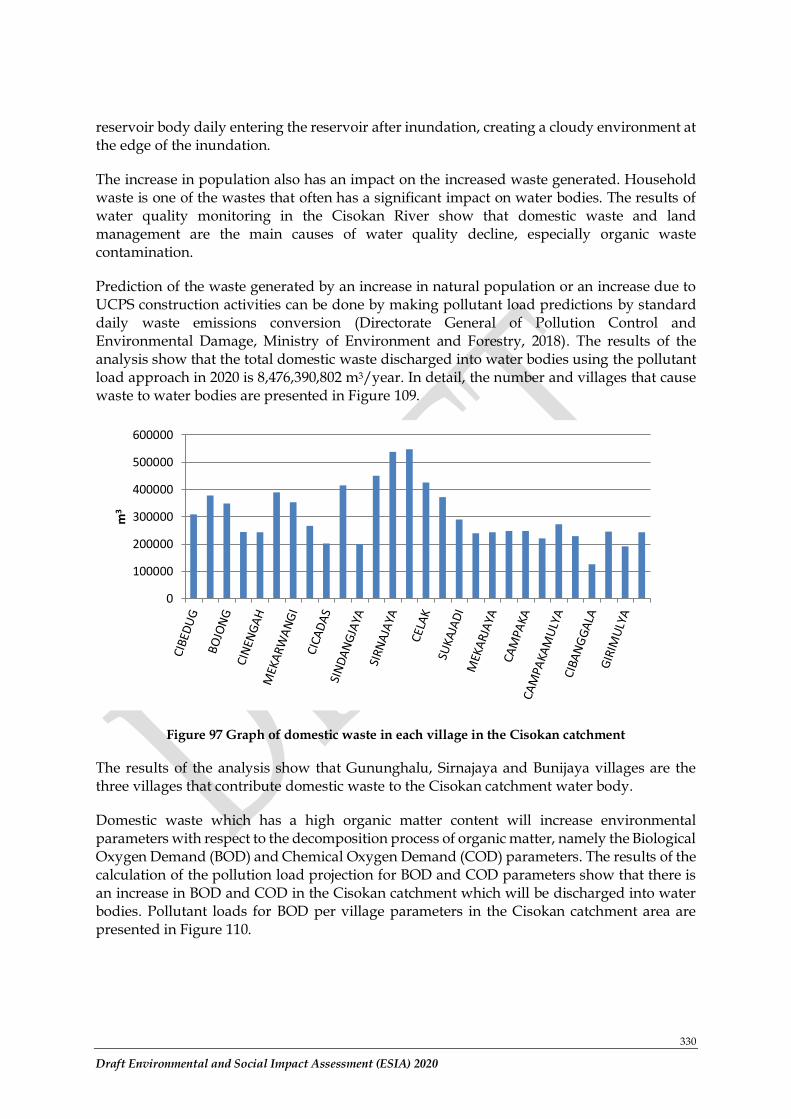
330
Draft Environmental and Social Impact Assessment (ESIA) 2020
reservoir body daily entering the reservoir after inundation, creating a cloudy environment at the edge of the inundation.
The increase in population also has an impact on the increased waste generated. Household waste is one of the wastes that often has a significant impact on water bodies. The results of water quality monitoring in the Cisokan River show that domestic waste and land management are the main causes of water quality decline, especially organic waste contamination.
Prediction of the waste generated by an increase in natural population or an increase due to UCPS construction activities can be done by making pollutant load predictions by standard daily waste emissions conversion (Directorate General of Pollution Control and Environmental Damage, Ministry of Environment and Forestry, 2018). The results of the analysis show that the total domestic waste discharged into water bodies using the pollutant load approach in 2020 is 8,476,390,802 m3/year. In detail, the number and villages that cause waste to water bodies are presented in Figure 109.
Figure 97 Graph of domestic waste in each village in the Cisokan catchment
The results of the analysis show that Gununghalu, Sirnajaya and Bunijaya villages are the three villages that contribute domestic waste to the Cisokan catchment water body.
Domestic waste which has a high organic matter content will increase environmental parameters with respect to the decomposition process of organic matter, namely the Biological Oxygen Demand (BOD) and Chemical Oxygen Demand (COD) parameters. The results of the calculation of the pollution load projection for BOD and COD parameters show that there is an increase in BOD and COD in the Cisokan catchment which will be discharged into water bodies. Pollutant loads for BOD per village parameters in the Cisokan catchment area are presented in Figure 110.
0
100000
200000
300000
400000
500000
600000
m3
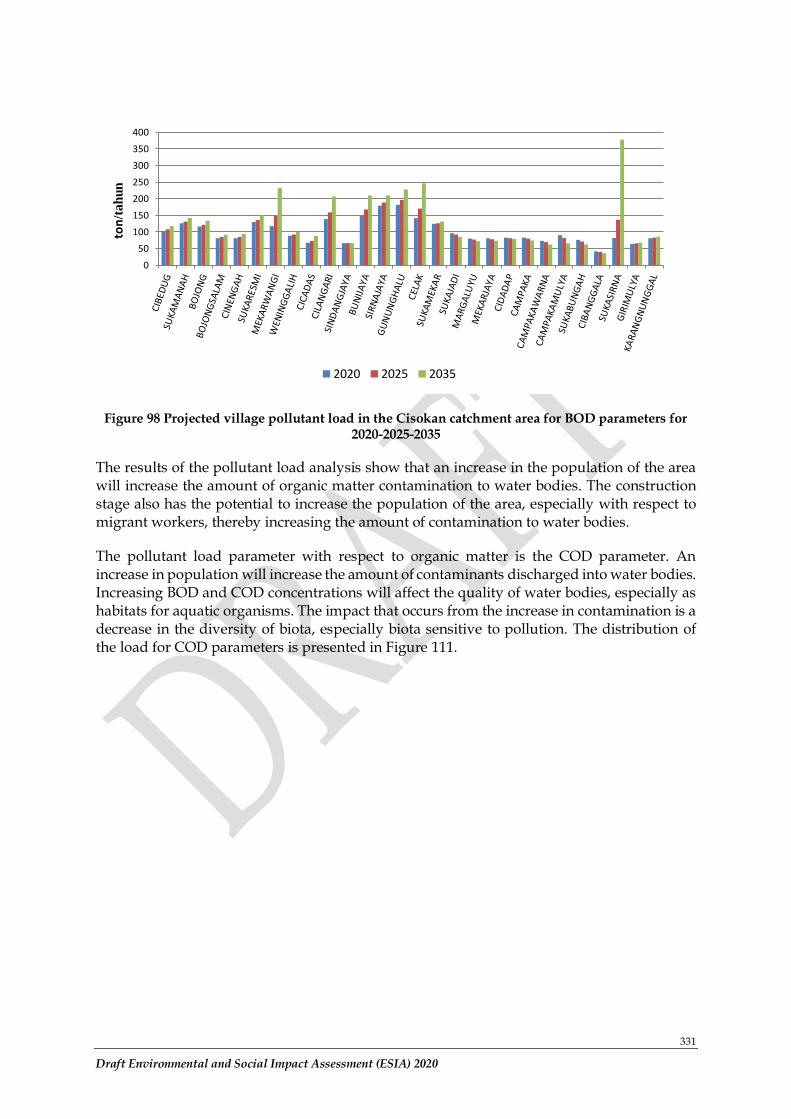
331
Draft Environmental and Social Impact Assessment (ESIA) 2020
Figure 98 Projected village pollutant load in the Cisokan catchment area for BOD parameters for 2020-2025-2035
The results of the pollutant load analysis show that an increase in the population of the area will increase the amount of organic matter contamination to water bodies. The construction stage also has the potential to increase the population of the area, especially with respect to migrant workers, thereby increasing the amount of contamination to water bodies.
The pollutant load parameter with respect to organic matter is the COD parameter. An increase in population will increase the amount of contaminants discharged into water bodies. Increasing BOD and COD concentrations will affect the quality of water bodies, especially as habitats for aquatic organisms. The impact that occurs from the increase in contamination is a decrease in the diversity of biota, especially biota sensitive to pollution. The distribution of the load for COD parameters is presented in Figure 111.
0
50
100
150
200
250
300
350
400
ton
/tah
un
2020 2025 2035
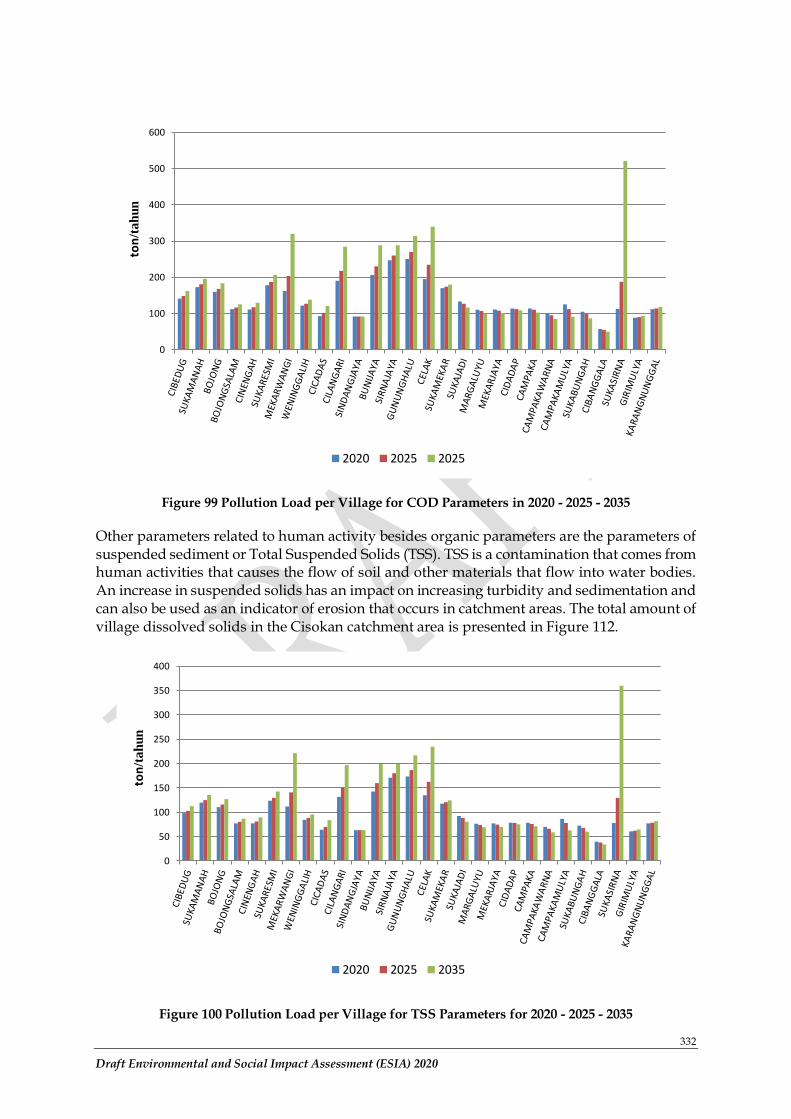
332
Draft Environmental and Social Impact Assessment (ESIA) 2020
Figure 99 Pollution Load per Village for COD Parameters in 2020 - 2025 - 2035
Other parameters related to human activity besides organic parameters are the parameters of suspended sediment or Total Suspended Solids (TSS). TSS is a contamination that comes from human activities that causes the flow of soil and other materials that flow into water bodies. An increase in suspended solids has an impact on increasing turbidity and sedimentation and can also be used as an indicator of erosion that occurs in catchment areas. The total amount of village dissolved solids in the Cisokan catchment area is presented in Figure 112.
Figure 100 Pollution Load per Village for TSS Parameters for 2020 - 2025 - 2035
0
100
200
300
400
500
600to
n/t
ah
un
2020 2025 2025
0
50
100
150
200
250
300
350
400
ton
/ta
hu
n
2020 2025 2035
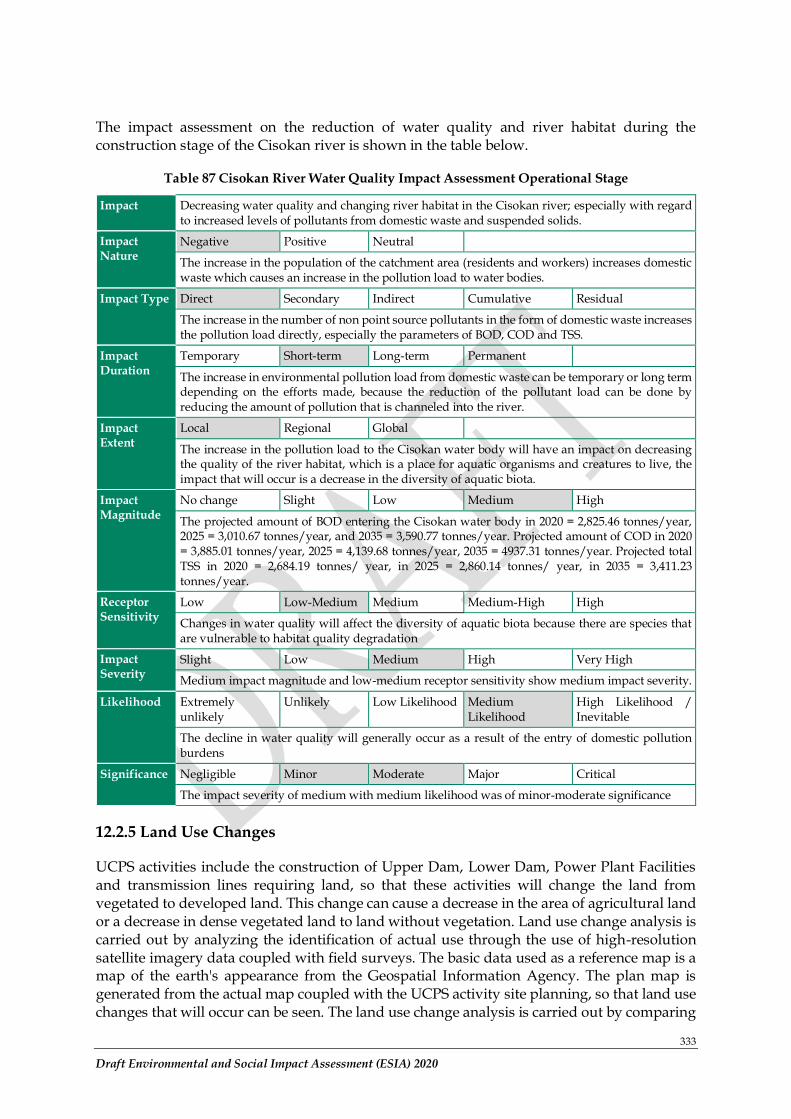
333
Draft Environmental and Social Impact Assessment (ESIA) 2020
The impact assessment on the reduction of water quality and river habitat during the construction stage of the Cisokan river is shown in the table below.
Table 87 Cisokan River Water Quality Impact Assessment Operational Stage
Impact Decreasing water quality and changing river habitat in the Cisokan river; especially with regard to increased levels of pollutants from domestic waste and suspended solids.
Impact Nature
Negative Positive Neutral
The increase in the population of the catchment area (residents and workers) increases domestic waste which causes an increase in the pollution load to water bodies.
Impact Type Direct Secondary Indirect Cumulative Residual
The increase in the number of non point source pollutants in the form of domestic waste increases the pollution load directly, especially the parameters of BOD, COD and TSS.
Impact Duration
Temporary Short-term Long-term Permanent
The increase in environmental pollution load from domestic waste can be temporary or long term depending on the efforts made, because the reduction of the pollutant load can be done by reducing the amount of pollution that is channeled into the river.
Impact Extent
Local Regional Global
The increase in the pollution load to the Cisokan water body will have an impact on decreasing the quality of the river habitat, which is a place for aquatic organisms and creatures to live, the impact that will occur is a decrease in the diversity of aquatic biota.
Impact Magnitude
No change Slight Low Medium High
The projected amount of BOD entering the Cisokan water body in 2020 = 2,825.46 tonnes/year, 2025 = 3,010.67 tonnes/year, and 2035 = 3,590.77 tonnes/year. Projected amount of COD in 2020 = 3,885.01 tonnes/year, 2025 = 4,139.68 tonnes/year, 2035 = 4937.31 tonnes/year. Projected total TSS in 2020 = 2,684.19 tonnes/ year, in 2025 = 2,860.14 tonnes/ year, in 2035 = 3,411.23 tonnes/year.
Receptor Sensitivity
Low Low-Medium Medium Medium-High High
Changes in water quality will affect the diversity of aquatic biota because there are species that are vulnerable to habitat quality degradation
Impact Severity
Slight Low Medium High Very High
Medium impact magnitude and low-medium receptor sensitivity show medium impact severity.
Likelihood Extremely unlikely
Unlikely Low Likelihood Medium Likelihood
High Likelihood / Inevitable
The decline in water quality will generally occur as a result of the entry of domestic pollution burdens
Significance Negligible Minor Moderate Major Critical
The impact severity of medium with medium likelihood was of minor-moderate significance
12.2.5 Land Use Changes
UCPS activities include the construction of Upper Dam, Lower Dam, Power Plant Facilities and transmission lines requiring land, so that these activities will change the land from vegetated to developed land. This change can cause a decrease in the area of agricultural land or a decrease in dense vegetated land to land without vegetation. Land use change analysis is carried out by analyzing the identification of actual use through the use of high-resolution satellite imagery data coupled with field surveys. The basic data used as a reference map is a map of the earth's appearance from the Geospatial Information Agency. The plan map is generated from the actual map coupled with the UCPS activity site planning, so that land use changes that will occur can be seen. The land use change analysis is carried out by comparing
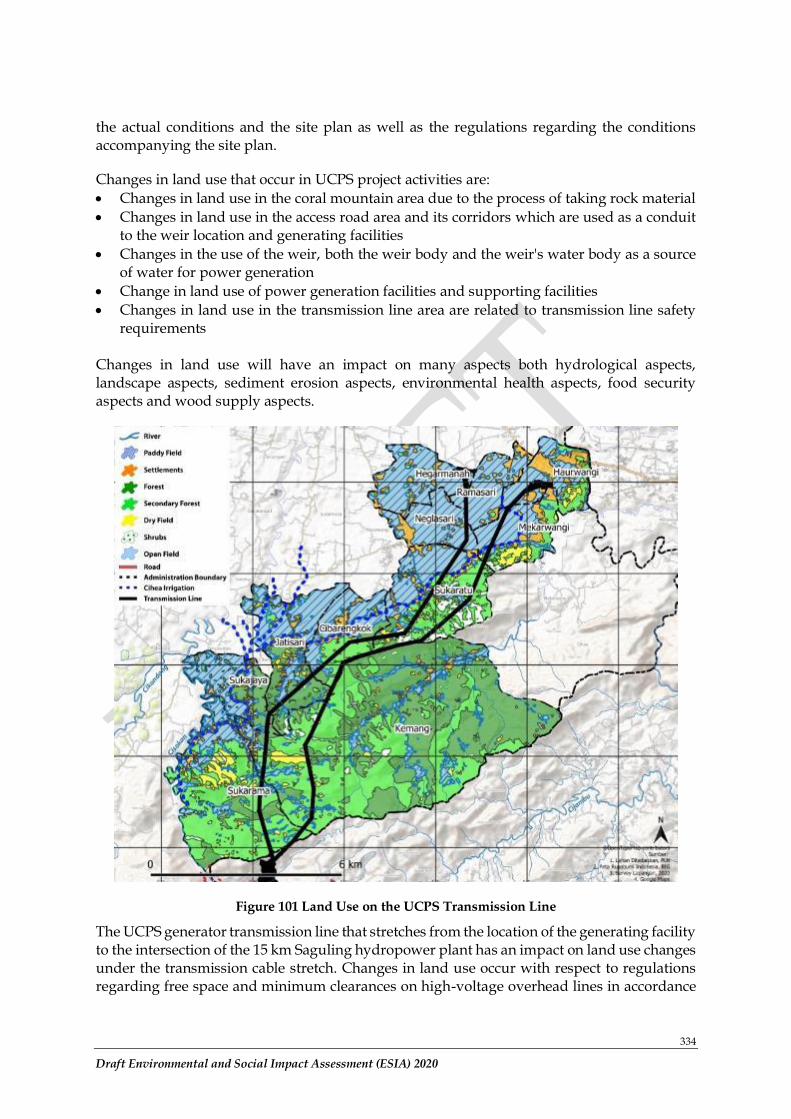
334
Draft Environmental and Social Impact Assessment (ESIA) 2020
the actual conditions and the site plan as well as the regulations regarding the conditions accompanying the site plan.
Changes in land use that occur in UCPS project activities are:
• Changes in land use in the coral mountain area due to the process of taking rock material
• Changes in land use in the access road area and its corridors which are used as a conduit to the weir location and generating facilities
• Changes in the use of the weir, both the weir body and the weir's water body as a source of water for power generation
• Change in land use of power generation facilities and supporting facilities
• Changes in land use in the transmission line area are related to transmission line safety requirements
Changes in land use will have an impact on many aspects both hydrological aspects, landscape aspects, sediment erosion aspects, environmental health aspects, food security aspects and wood supply aspects.
Figure 101 Land Use on the UCPS Transmission Line
The UCPS generator transmission line that stretches from the location of the generating facility to the intersection of the 15 km Saguling hydropower plant has an impact on land use changes under the transmission cable stretch. Changes in land use occur with respect to regulations regarding free space and minimum clearances on high-voltage overhead lines in accordance
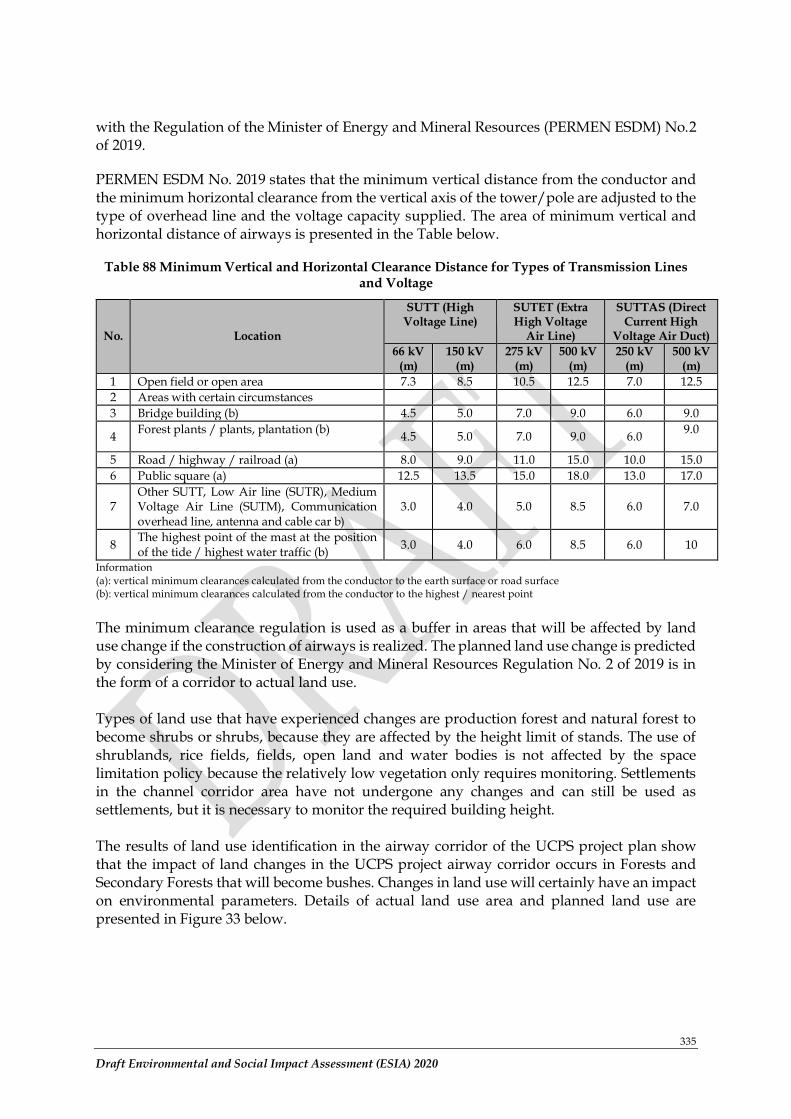
335
Draft Environmental and Social Impact Assessment (ESIA) 2020
with the Regulation of the Minister of Energy and Mineral Resources (PERMEN ESDM) No.2 of 2019.
PERMEN ESDM No. 2019 states that the minimum vertical distance from the conductor and the minimum horizontal clearance from the vertical axis of the tower/pole are adjusted to the type of overhead line and the voltage capacity supplied. The area of minimum vertical and horizontal distance of airways is presented in the Table below.
Table 88 Minimum Vertical and Horizontal Clearance Distance for Types of Transmission Lines and Voltage
No.
Location
SUTT (High Voltage Line)
SUTET (Extra High Voltage
Air Line)
SUTTAS (Direct Current High
Voltage Air Duct) 66 kV
(m) 150 kV
(m) 275 kV
(m) 500 kV
(m) 250 kV
(m) 500 kV
(m) 1 Open field or open area 7.3 8.5 10.5 12.5 7.0 12.5 2 Areas with certain circumstances 3 Bridge building (b) 4.5 5.0 7.0 9.0 6.0 9.0
4 Forest plants / plants, plantation (b) 4.5 5.0 7.0 9.0 6.0 9.0
5 Road / highway / railroad (a) 8.0 9.0 11.0 15.0 10.0 15.0 6 Public square (a) 12.5 13.5 15.0 18.0 13.0 17.0
7 Other SUTT, Low Air line (SUTR), Medium Voltage Air Line (SUTM), Communication overhead line, antenna and cable car b)
3.0 4.0 5.0 8.5 6.0 7.0
8 The highest point of the mast at the position of the tide / highest water traffic (b) 3.0 4.0 6.0 8.5 6.0 10
Information (a): vertical minimum clearances calculated from the conductor to the earth surface or road surface (b): vertical minimum clearances calculated from the conductor to the highest / nearest point The minimum clearance regulation is used as a buffer in areas that will be affected by land use change if the construction of airways is realized. The planned land use change is predicted by considering the Minister of Energy and Mineral Resources Regulation No. 2 of 2019 is in the form of a corridor to actual land use. Types of land use that have experienced changes are production forest and natural forest to become shrubs or shrubs, because they are affected by the height limit of stands. The use of shrublands, rice fields, fields, open land and water bodies is not affected by the space limitation policy because the relatively low vegetation only requires monitoring. Settlements in the channel corridor area have not undergone any changes and can still be used as settlements, but it is necessary to monitor the required building height. The results of land use identification in the airway corridor of the UCPS project plan show that the impact of land changes in the UCPS project airway corridor occurs in Forests and Secondary Forests that will become bushes. Changes in land use will certainly have an impact on environmental parameters. Details of actual land use area and planned land use are presented in Figure 33 below.
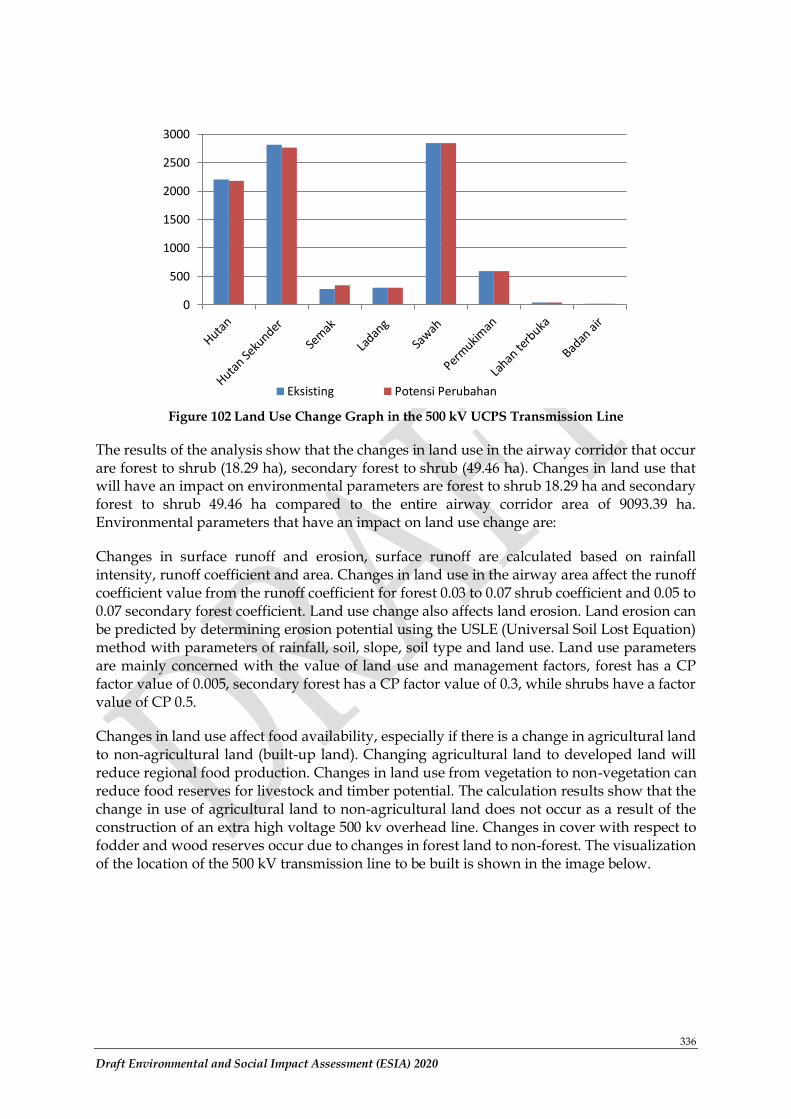
336
Draft Environmental and Social Impact Assessment (ESIA) 2020
Figure 102 Land Use Change Graph in the 500 kV UCPS Transmission Line
The results of the analysis show that the changes in land use in the airway corridor that occur are forest to shrub (18.29 ha), secondary forest to shrub (49.46 ha). Changes in land use that will have an impact on environmental parameters are forest to shrub 18.29 ha and secondary forest to shrub 49.46 ha compared to the entire airway corridor area of 9093.39 ha. Environmental parameters that have an impact on land use change are:
Changes in surface runoff and erosion, surface runoff are calculated based on rainfall intensity, runoff coefficient and area. Changes in land use in the airway area affect the runoff coefficient value from the runoff coefficient for forest 0.03 to 0.07 shrub coefficient and 0.05 to 0.07 secondary forest coefficient. Land use change also affects land erosion. Land erosion can be predicted by determining erosion potential using the USLE (Universal Soil Lost Equation) method with parameters of rainfall, soil, slope, soil type and land use. Land use parameters are mainly concerned with the value of land use and management factors, forest has a CP factor value of 0.005, secondary forest has a CP factor value of 0.3, while shrubs have a factor value of CP 0.5.
Changes in land use affect food availability, especially if there is a change in agricultural land to non-agricultural land (built-up land). Changing agricultural land to developed land will reduce regional food production. Changes in land use from vegetation to non-vegetation can reduce food reserves for livestock and timber potential. The calculation results show that the change in use of agricultural land to non-agricultural land does not occur as a result of the construction of an extra high voltage 500 kv overhead line. Changes in cover with respect to fodder and wood reserves occur due to changes in forest land to non-forest. The visualization of the location of the 500 kV transmission line to be built is shown in the image below.
0
500
1000
1500
2000
2500
3000
Eksisting Potensi Perubahan
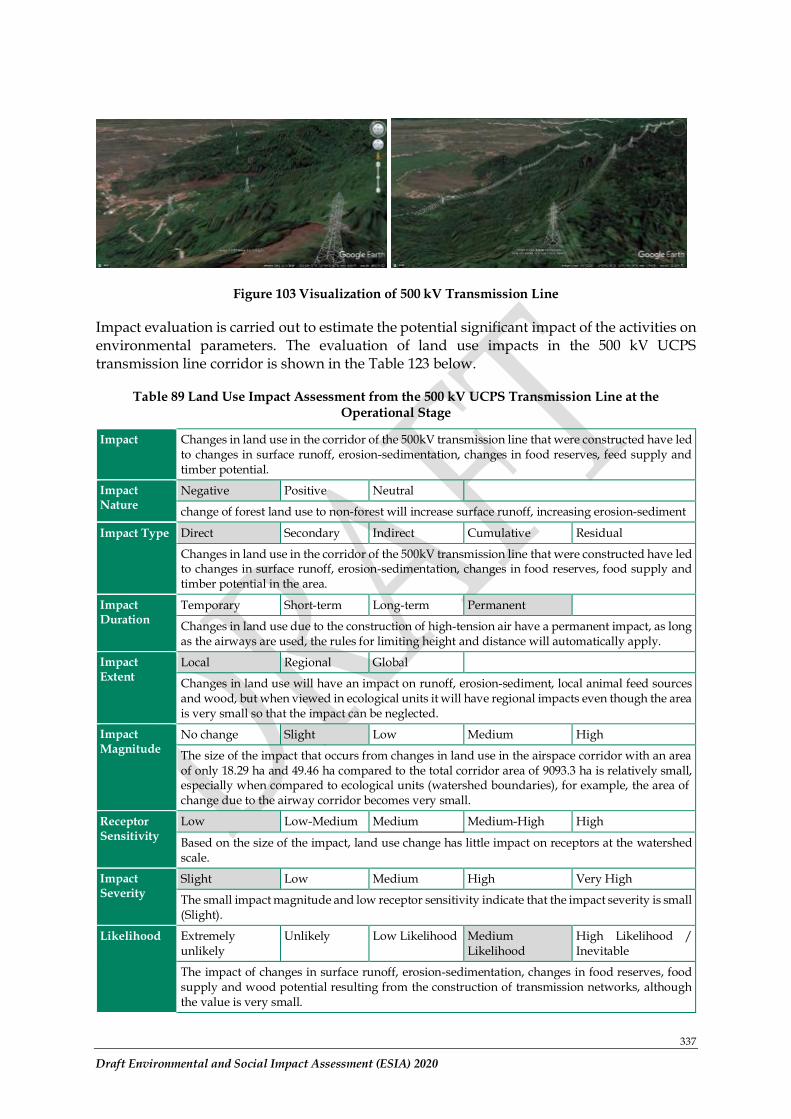
337
Draft Environmental and Social Impact Assessment (ESIA) 2020
Figure 103 Visualization of 500 kV Transmission Line
Impact evaluation is carried out to estimate the potential significant impact of the activities on environmental parameters. The evaluation of land use impacts in the 500 kV UCPS transmission line corridor is shown in the Table 123 below.
Table 89 Land Use Impact Assessment from the 500 kV UCPS Transmission Line at the Operational Stage
Impact Changes in land use in the corridor of the 500kV transmission line that were constructed have led to changes in surface runoff, erosion-sedimentation, changes in food reserves, feed supply and timber potential.
Impact Nature
Negative Positive Neutral
change of forest land use to non-forest will increase surface runoff, increasing erosion-sediment
Impact Type Direct Secondary Indirect Cumulative Residual
Changes in land use in the corridor of the 500kV transmission line that were constructed have led to changes in surface runoff, erosion-sedimentation, changes in food reserves, food supply and timber potential in the area.
Impact Duration
Temporary Short-term Long-term Permanent
Changes in land use due to the construction of high-tension air have a permanent impact, as long as the airways are used, the rules for limiting height and distance will automatically apply.
Impact Extent
Local Regional Global
Changes in land use will have an impact on runoff, erosion-sediment, local animal feed sources and wood, but when viewed in ecological units it will have regional impacts even though the area is very small so that the impact can be neglected.
Impact Magnitude
No change Slight Low Medium High
The size of the impact that occurs from changes in land use in the airspace corridor with an area of only 18.29 ha and 49.46 ha compared to the total corridor area of 9093.3 ha is relatively small, especially when compared to ecological units (watershed boundaries), for example, the area of change due to the airway corridor becomes very small.
Receptor Sensitivity
Low Low-Medium Medium Medium-High High
Based on the size of the impact, land use change has little impact on receptors at the watershed scale.
Impact Severity
Slight Low Medium High Very High
The small impact magnitude and low receptor sensitivity indicate that the impact severity is small (Slight).
Likelihood Extremely unlikely
Unlikely Low Likelihood Medium Likelihood
High Likelihood / Inevitable
The impact of changes in surface runoff, erosion-sedimentation, changes in food reserves, food supply and wood potential resulting from the construction of transmission networks, although the value is very small.
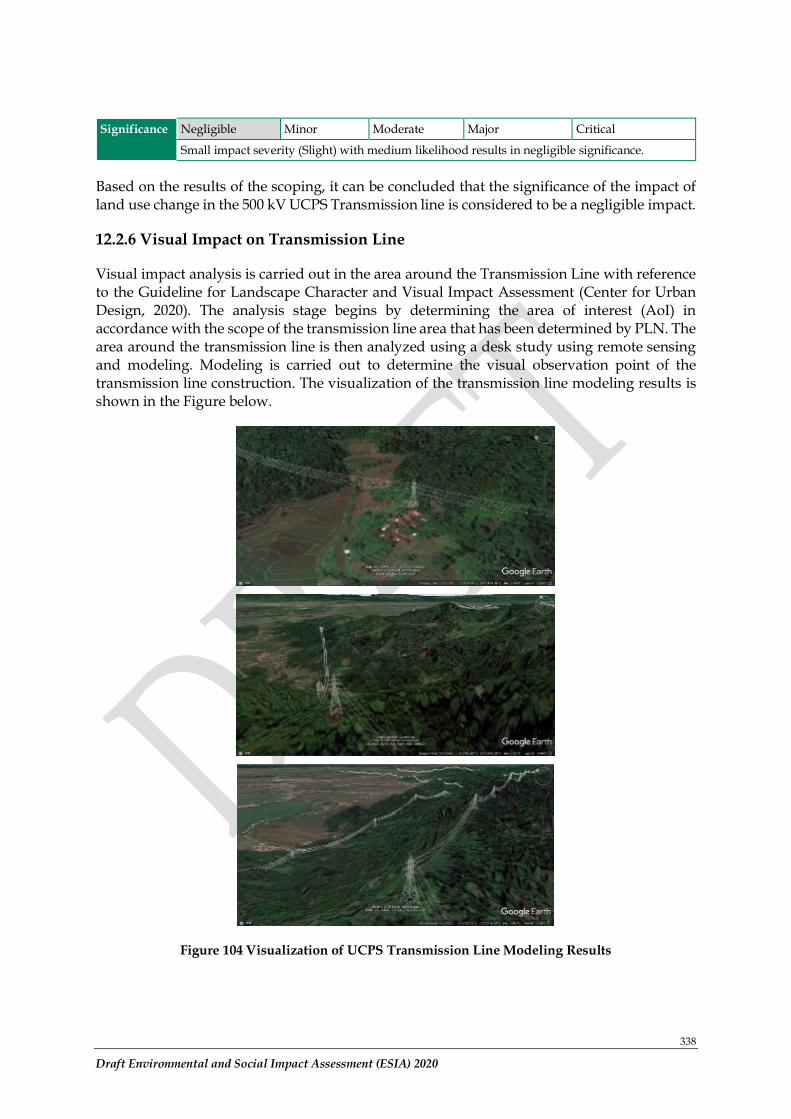
338
Draft Environmental and Social Impact Assessment (ESIA) 2020
Significance Negligible Minor Moderate Major Critical
Small impact severity (Slight) with medium likelihood results in negligible significance.
Based on the results of the scoping, it can be concluded that the significance of the impact of land use change in the 500 kV UCPS Transmission line is considered to be a negligible impact.
12.2.6 Visual Impact on Transmission Line
Visual impact analysis is carried out in the area around the Transmission Line with reference to the Guideline for Landscape Character and Visual Impact Assessment (Center for Urban Design, 2020). The analysis stage begins by determining the area of interest (AoI) in accordance with the scope of the transmission line area that has been determined by PLN. The area around the transmission line is then analyzed using a desk study using remote sensing and modeling. Modeling is carried out to determine the visual observation point of the transmission line construction. The visualization of the transmission line modeling results is shown in the Figure below.
Figure 104 Visualization of UCPS Transmission Line Modeling Results
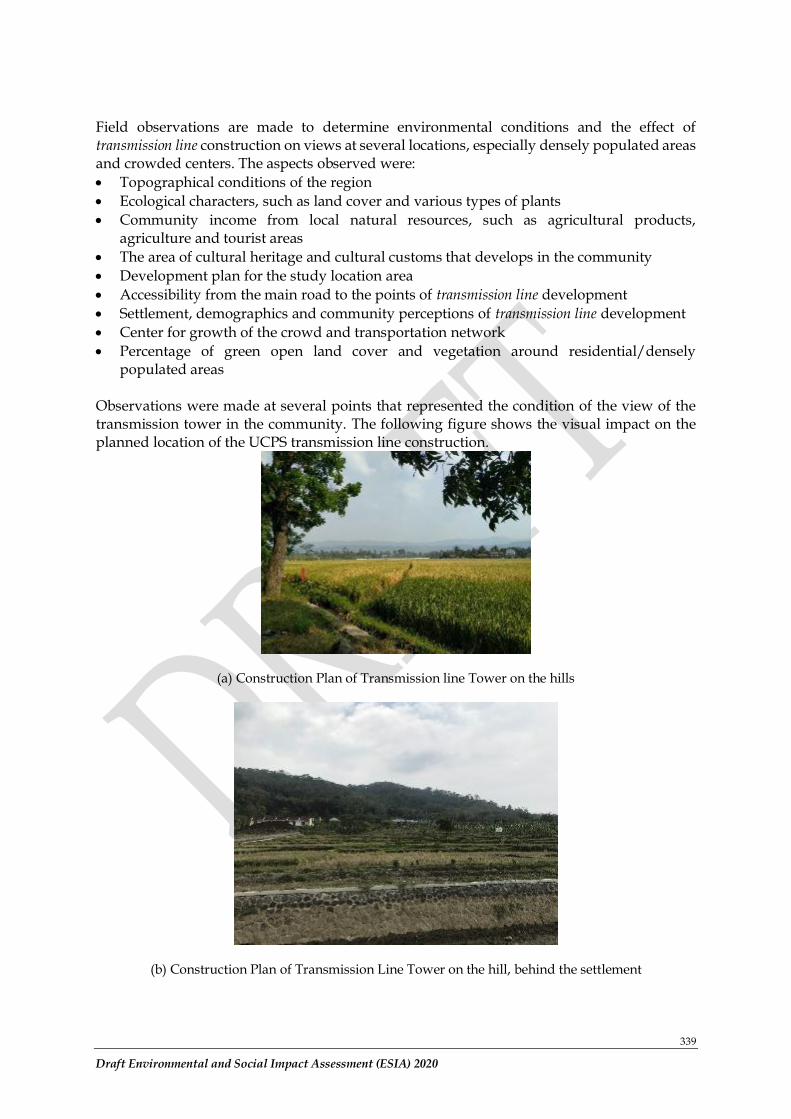
339
Draft Environmental and Social Impact Assessment (ESIA) 2020
Field observations are made to determine environmental conditions and the effect of transmission line construction on views at several locations, especially densely populated areas and crowded centers. The aspects observed were:
• Topographical conditions of the region
• Ecological characters, such as land cover and various types of plants
• Community income from local natural resources, such as agricultural products, agriculture and tourist areas
• The area of cultural heritage and cultural customs that develops in the community
• Development plan for the study location area
• Accessibility from the main road to the points of transmission line development
• Settlement, demographics and community perceptions of transmission line development
• Center for growth of the crowd and transportation network
• Percentage of green open land cover and vegetation around residential/densely populated areas
Observations were made at several points that represented the condition of the view of the transmission tower in the community. The following figure shows the visual impact on the planned location of the UCPS transmission line construction.
(a) Construction Plan of Transmission line Tower on the hills
(b) Construction Plan of Transmission Line Tower on the hill, behind the settlement
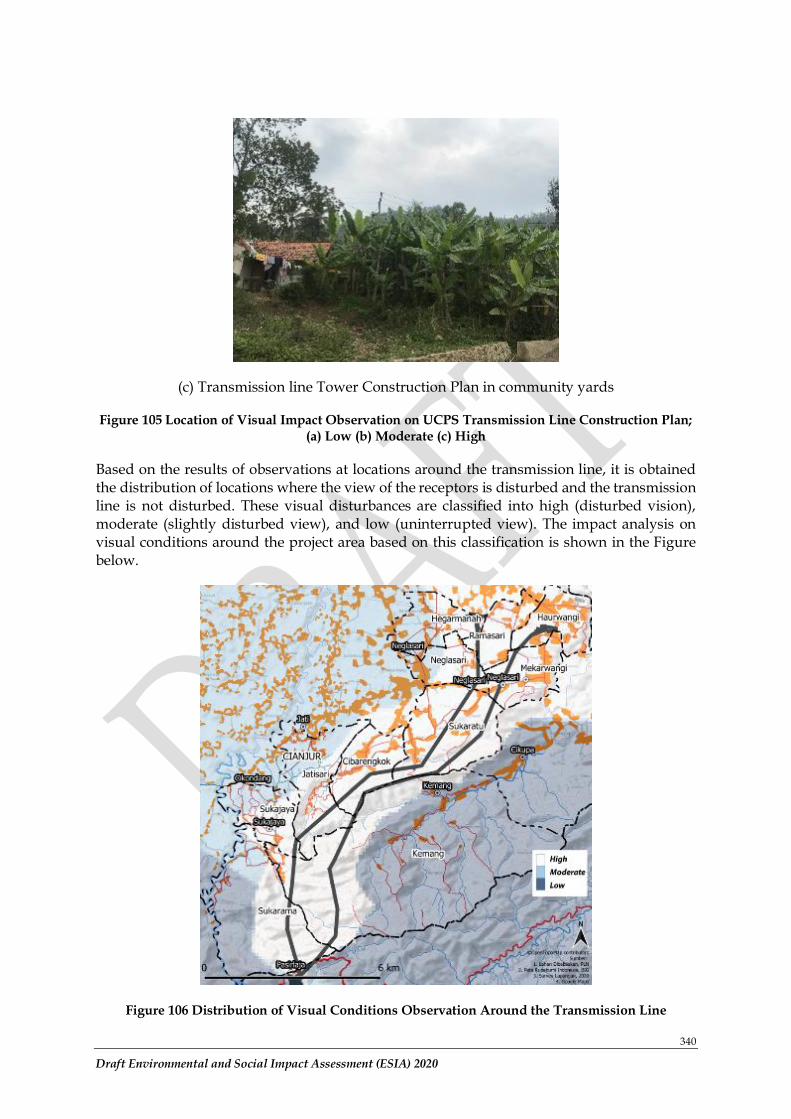
340
Draft Environmental and Social Impact Assessment (ESIA) 2020
(c) Transmission line Tower Construction Plan in community yards
Figure 105 Location of Visual Impact Observation on UCPS Transmission Line Construction Plan; (a) Low (b) Moderate (c) High
Based on the results of observations at locations around the transmission line, it is obtained the distribution of locations where the view of the receptors is disturbed and the transmission line is not disturbed. These visual disturbances are classified into high (disturbed vision), moderate (slightly disturbed view), and low (uninterrupted view). The impact analysis on visual conditions around the project area based on this classification is shown in the Figure below.
Figure 106 Distribution of Visual Conditions Observation Around the Transmission Line
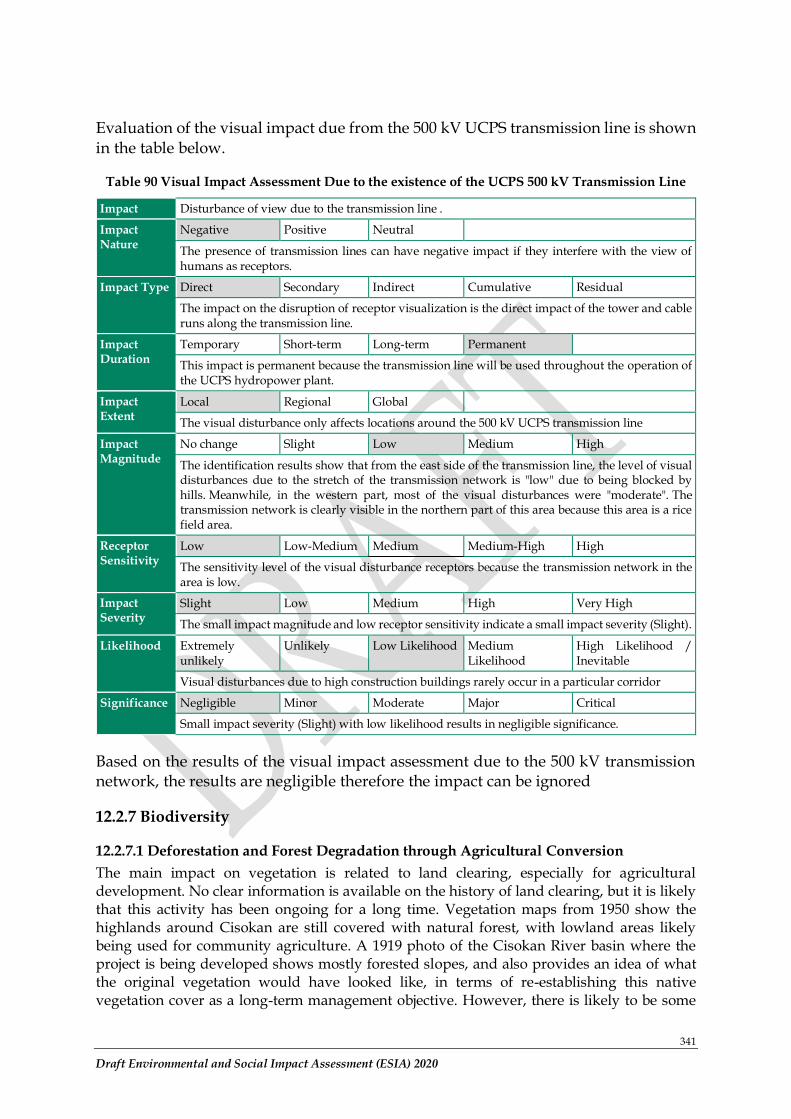
341
Draft Environmental and Social Impact Assessment (ESIA) 2020
Evaluation of the visual impact due from the 500 kV UCPS transmission line is shown in the table below.
Table 90 Visual Impact Assessment Due to the existence of the UCPS 500 kV Transmission Line
Impact Disturbance of view due to the transmission line .
Impact Nature
Negative Positive Neutral
The presence of transmission lines can have negative impact if they interfere with the view of humans as receptors.
Impact Type Direct Secondary Indirect Cumulative Residual
The impact on the disruption of receptor visualization is the direct impact of the tower and cable runs along the transmission line.
Impact Duration
Temporary Short-term Long-term Permanent
This impact is permanent because the transmission line will be used throughout the operation of the UCPS hydropower plant.
Impact Extent
Local Regional Global
The visual disturbance only affects locations around the 500 kV UCPS transmission line
Impact Magnitude
No change Slight Low Medium High
The identification results show that from the east side of the transmission line, the level of visual disturbances due to the stretch of the transmission network is "low" due to being blocked by hills. Meanwhile, in the western part, most of the visual disturbances were "moderate". The transmission network is clearly visible in the northern part of this area because this area is a rice field area.
Receptor Sensitivity
Low Low-Medium Medium Medium-High High
The sensitivity level of the visual disturbance receptors because the transmission network in the area is low.
Impact Severity
Slight Low Medium High Very High
The small impact magnitude and low receptor sensitivity indicate a small impact severity (Slight).
Likelihood Extremely unlikely
Unlikely Low Likelihood Medium Likelihood
High Likelihood / Inevitable
Visual disturbances due to high construction buildings rarely occur in a particular corridor
Significance Negligible Minor Moderate Major Critical
Small impact severity (Slight) with low likelihood results in negligible significance.
Based on the results of the visual impact assessment due to the 500 kV transmission network, the results are negligible therefore the impact can be ignored
12.2.7 Biodiversity
12.2.7.1 Deforestation and Forest Degradation through Agricultural Conversion
The main impact on vegetation is related to land clearing, especially for agricultural development. No clear information is available on the history of land clearing, but it is likely that this activity has been ongoing for a long time. Vegetation maps from 1950 show the highlands around Cisokan are still covered with natural forest, with lowland areas likely being used for community agriculture. A 1919 photo of the Cisokan River basin where the project is being developed shows mostly forested slopes, and also provides an idea of what the original vegetation would have looked like, in terms of re-establishing this native vegetation cover as a long-term management objective. However, there is likely to be some
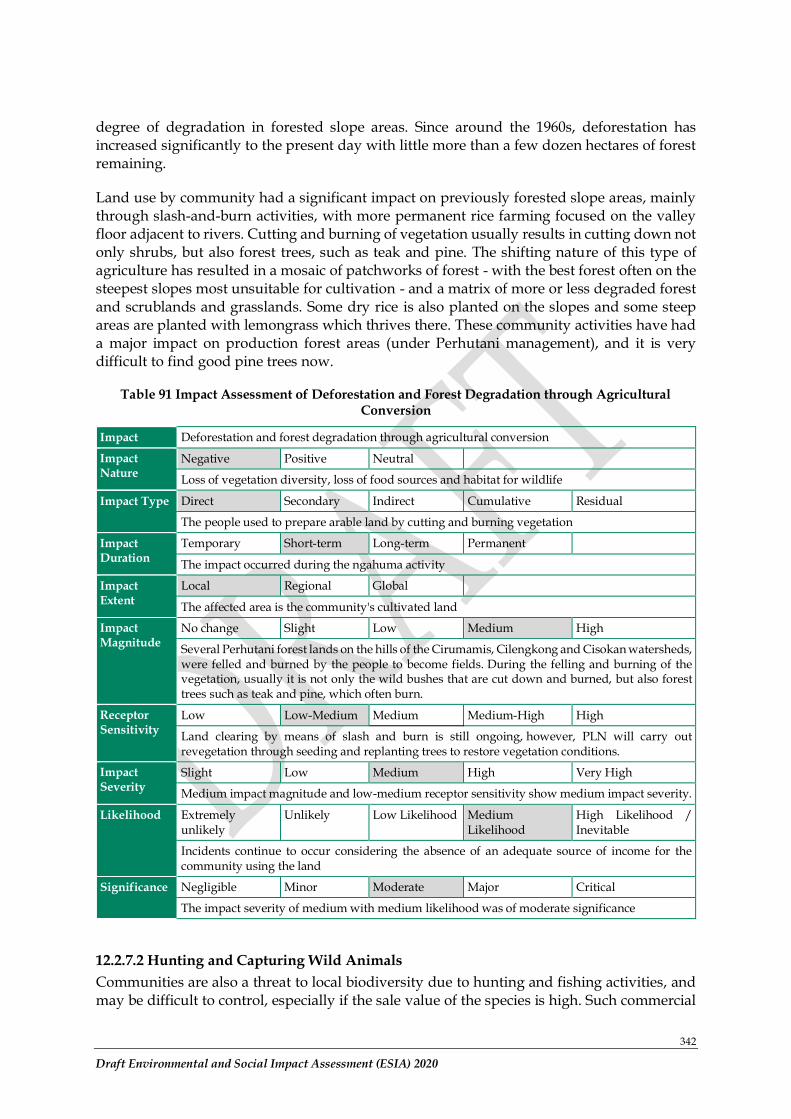
342
Draft Environmental and Social Impact Assessment (ESIA) 2020
degree of degradation in forested slope areas. Since around the 1960s, deforestation has increased significantly to the present day with little more than a few dozen hectares of forest remaining.
Land use by community had a significant impact on previously forested slope areas, mainly through slash-and-burn activities, with more permanent rice farming focused on the valley floor adjacent to rivers. Cutting and burning of vegetation usually results in cutting down not only shrubs, but also forest trees, such as teak and pine. The shifting nature of this type of agriculture has resulted in a mosaic of patchworks of forest - with the best forest often on the steepest slopes most unsuitable for cultivation - and a matrix of more or less degraded forest and scrublands and grasslands. Some dry rice is also planted on the slopes and some steep areas are planted with lemongrass which thrives there. These community activities have had a major impact on production forest areas (under Perhutani management), and it is very difficult to find good pine trees now.
Table 91 Impact Assessment of Deforestation and Forest Degradation through Agricultural Conversion
Impact Deforestation and forest degradation through agricultural conversion
Impact Nature
Negative Positive Neutral
Loss of vegetation diversity, loss of food sources and habitat for wildlife
Impact Type Direct Secondary Indirect Cumulative Residual
The people used to prepare arable land by cutting and burning vegetation
Impact Duration
Temporary Short-term Long-term Permanent
The impact occurred during the ngahuma activity
Impact Extent
Local Regional Global
The affected area is the community's cultivated land
Impact Magnitude
No change Slight Low Medium High
Several Perhutani forest lands on the hills of the Cirumamis, Cilengkong and Cisokan watersheds, were felled and burned by the people to become fields. During the felling and burning of the vegetation, usually it is not only the wild bushes that are cut down and burned, but also forest trees such as teak and pine, which often burn.
Receptor Sensitivity
Low Low-Medium Medium Medium-High High
Land clearing by means of slash and burn is still ongoing, however, PLN will carry out revegetation through seeding and replanting trees to restore vegetation conditions.
Impact Severity
Slight Low Medium High Very High
Medium impact magnitude and low-medium receptor sensitivity show medium impact severity.
Likelihood Extremely unlikely
Unlikely Low Likelihood Medium Likelihood
High Likelihood / Inevitable
Incidents continue to occur considering the absence of an adequate source of income for the community using the land
Significance Negligible Minor Moderate Major Critical
The impact severity of medium with medium likelihood was of moderate significance
12.2.7.2 Hunting and Capturing Wild Animals
Communities are also a threat to local biodiversity due to hunting and fishing activities, and may be difficult to control, especially if the sale value of the species is high. Such commercial
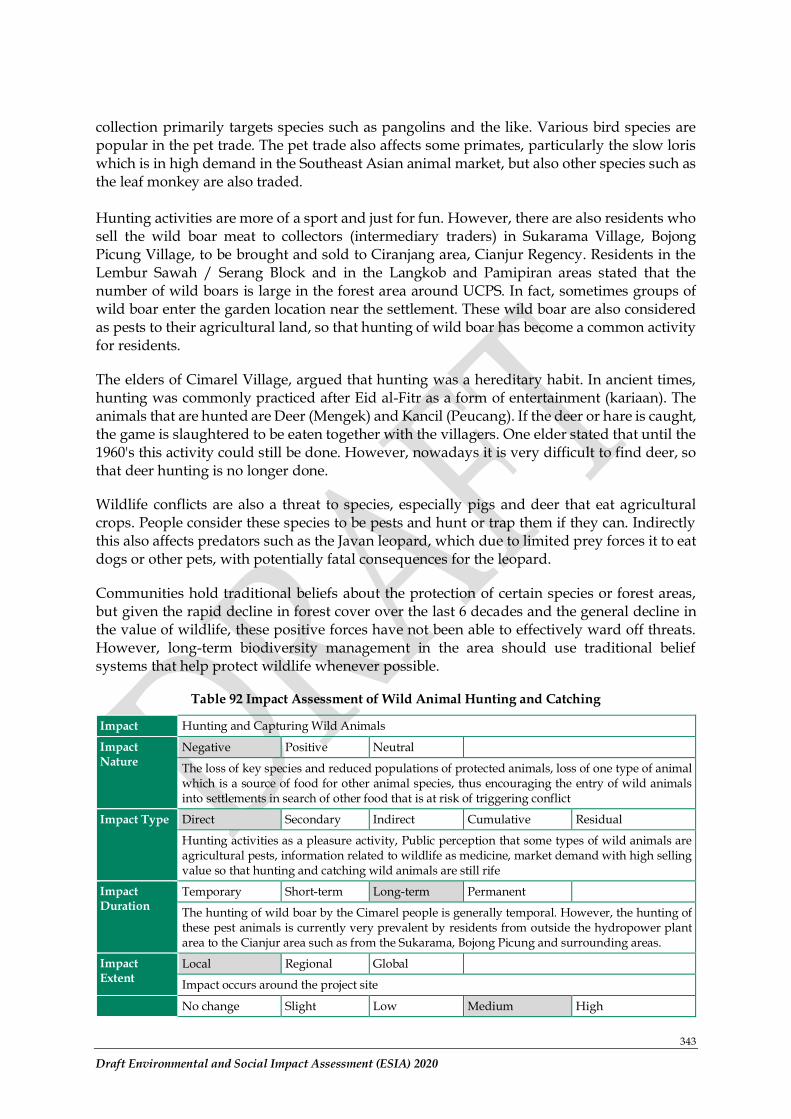
343
Draft Environmental and Social Impact Assessment (ESIA) 2020
collection primarily targets species such as pangolins and the like. Various bird species are popular in the pet trade. The pet trade also affects some primates, particularly the slow loris which is in high demand in the Southeast Asian animal market, but also other species such as the leaf monkey are also traded. Hunting activities are more of a sport and just for fun. However, there are also residents who sell the wild boar meat to collectors (intermediary traders) in Sukarama Village, Bojong Picung Village, to be brought and sold to Ciranjang area, Cianjur Regency. Residents in the Lembur Sawah / Serang Block and in the Langkob and Pamipiran areas stated that the number of wild boars is large in the forest area around UCPS. In fact, sometimes groups of wild boar enter the garden location near the settlement. These wild boar are also considered as pests to their agricultural land, so that hunting of wild boar has become a common activity for residents.
The elders of Cimarel Village, argued that hunting was a hereditary habit. In ancient times, hunting was commonly practiced after Eid al-Fitr as a form of entertainment (kariaan). The animals that are hunted are Deer (Mengek) and Kancil (Peucang). If the deer or hare is caught, the game is slaughtered to be eaten together with the villagers. One elder stated that until the 1960's this activity could still be done. However, nowadays it is very difficult to find deer, so that deer hunting is no longer done.
Wildlife conflicts are also a threat to species, especially pigs and deer that eat agricultural crops. People consider these species to be pests and hunt or trap them if they can. Indirectly this also affects predators such as the Javan leopard, which due to limited prey forces it to eat dogs or other pets, with potentially fatal consequences for the leopard.
Communities hold traditional beliefs about the protection of certain species or forest areas, but given the rapid decline in forest cover over the last 6 decades and the general decline in the value of wildlife, these positive forces have not been able to effectively ward off threats. However, long-term biodiversity management in the area should use traditional belief systems that help protect wildlife whenever possible.
Table 92 Impact Assessment of Wild Animal Hunting and Catching
Impact Hunting and Capturing Wild Animals
Impact Nature
Negative Positive Neutral
The loss of key species and reduced populations of protected animals, loss of one type of animal which is a source of food for other animal species, thus encouraging the entry of wild animals into settlements in search of other food that is at risk of triggering conflict
Impact Type Direct Secondary Indirect Cumulative Residual
Hunting activities as a pleasure activity, Public perception that some types of wild animals are agricultural pests, information related to wildlife as medicine, market demand with high selling value so that hunting and catching wild animals are still rife
Impact Duration
Temporary Short-term Long-term Permanent
The hunting of wild boar by the Cimarel people is generally temporal. However, the hunting of these pest animals is currently very prevalent by residents from outside the hydropower plant area to the Cianjur area such as from the Sukarama, Bojong Picung and surrounding areas.
Impact Extent
Local Regional Global
Impact occurs around the project site
No change Slight Low Medium High
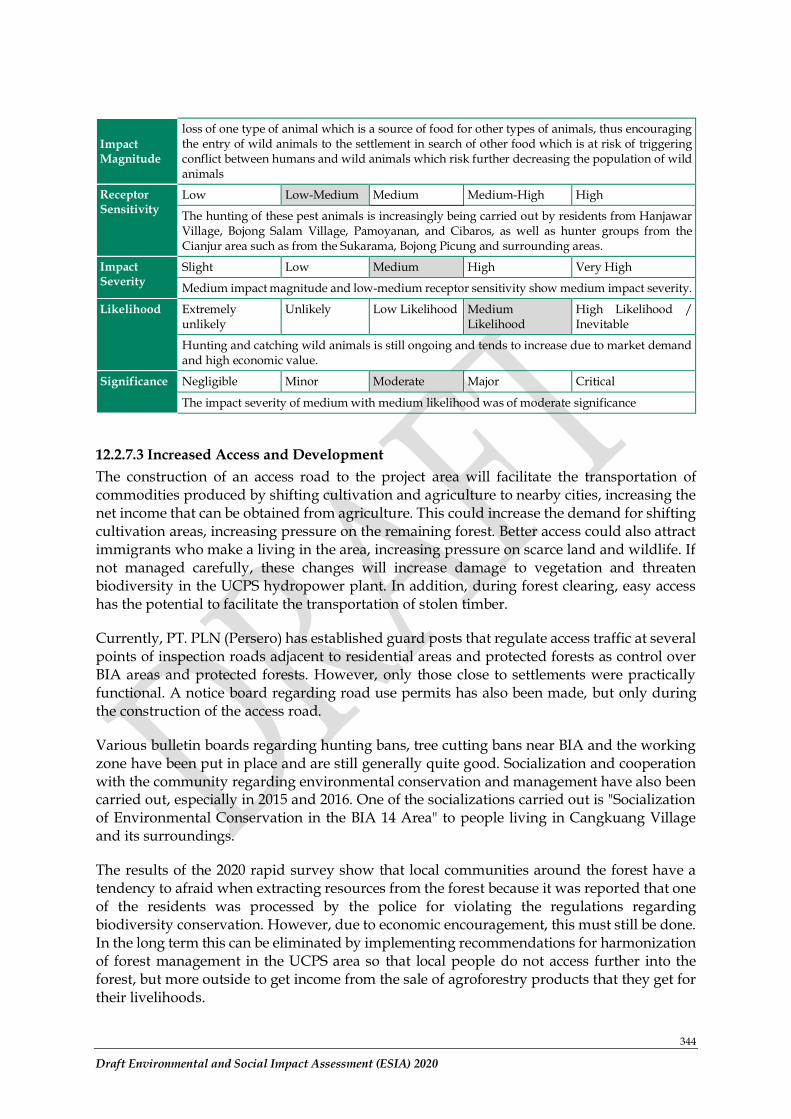
344
Draft Environmental and Social Impact Assessment (ESIA) 2020
Impact Magnitude
loss of one type of animal which is a source of food for other types of animals, thus encouraging the entry of wild animals to the settlement in search of other food which is at risk of triggering conflict between humans and wild animals which risk further decreasing the population of wild animals
Receptor Sensitivity
Low Low-Medium Medium Medium-High High
The hunting of these pest animals is increasingly being carried out by residents from Hanjawar Village, Bojong Salam Village, Pamoyanan, and Cibaros, as well as hunter groups from the Cianjur area such as from the Sukarama, Bojong Picung and surrounding areas.
Impact Severity
Slight Low Medium High Very High
Medium impact magnitude and low-medium receptor sensitivity show medium impact severity.
Likelihood Extremely unlikely
Unlikely Low Likelihood Medium Likelihood
High Likelihood / Inevitable
Hunting and catching wild animals is still ongoing and tends to increase due to market demand and high economic value.
Significance Negligible Minor Moderate Major Critical
The impact severity of medium with medium likelihood was of moderate significance
12.2.7.3 Increased Access and Development
The construction of an access road to the project area will facilitate the transportation of commodities produced by shifting cultivation and agriculture to nearby cities, increasing the net income that can be obtained from agriculture. This could increase the demand for shifting cultivation areas, increasing pressure on the remaining forest. Better access could also attract immigrants who make a living in the area, increasing pressure on scarce land and wildlife. If not managed carefully, these changes will increase damage to vegetation and threaten biodiversity in the UCPS hydropower plant. In addition, during forest clearing, easy access has the potential to facilitate the transportation of stolen timber.
Currently, PT. PLN (Persero) has established guard posts that regulate access traffic at several points of inspection roads adjacent to residential areas and protected forests as control over BIA areas and protected forests. However, only those close to settlements were practically functional. A notice board regarding road use permits has also been made, but only during the construction of the access road.
Various bulletin boards regarding hunting bans, tree cutting bans near BIA and the working zone have been put in place and are still generally quite good. Socialization and cooperation with the community regarding environmental conservation and management have also been carried out, especially in 2015 and 2016. One of the socializations carried out is "Socialization of Environmental Conservation in the BIA 14 Area" to people living in Cangkuang Village and its surroundings.
The results of the 2020 rapid survey show that local communities around the forest have a tendency to afraid when extracting resources from the forest because it was reported that one of the residents was processed by the police for violating the regulations regarding biodiversity conservation. However, due to economic encouragement, this must still be done. In the long term this can be eliminated by implementing recommendations for harmonization of forest management in the UCPS area so that local people do not access further into the forest, but more outside to get income from the sale of agroforestry products that they get for their livelihoods.
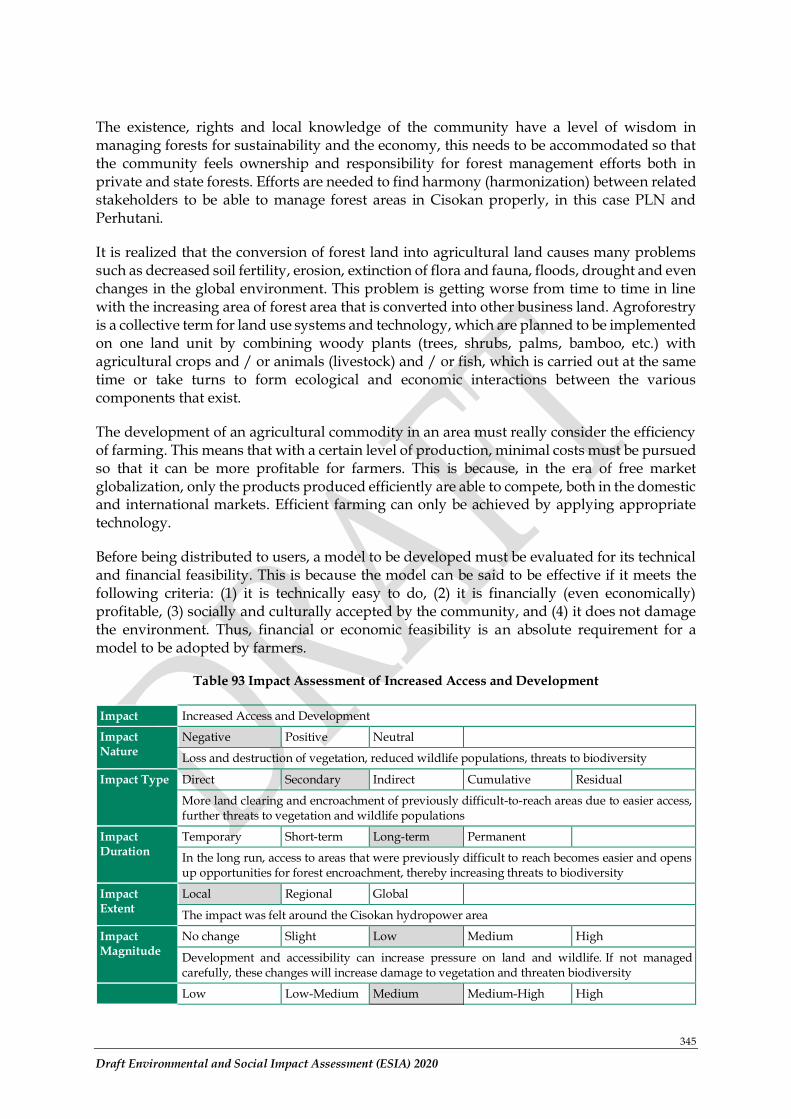
345
Draft Environmental and Social Impact Assessment (ESIA) 2020
The existence, rights and local knowledge of the community have a level of wisdom in managing forests for sustainability and the economy, this needs to be accommodated so that the community feels ownership and responsibility for forest management efforts both in private and state forests. Efforts are needed to find harmony (harmonization) between related stakeholders to be able to manage forest areas in Cisokan properly, in this case PLN and Perhutani.
It is realized that the conversion of forest land into agricultural land causes many problems such as decreased soil fertility, erosion, extinction of flora and fauna, floods, drought and even changes in the global environment. This problem is getting worse from time to time in line with the increasing area of forest area that is converted into other business land. Agroforestry is a collective term for land use systems and technology, which are planned to be implemented on one land unit by combining woody plants (trees, shrubs, palms, bamboo, etc.) with agricultural crops and / or animals (livestock) and / or fish, which is carried out at the same time or take turns to form ecological and economic interactions between the various components that exist.
The development of an agricultural commodity in an area must really consider the efficiency of farming. This means that with a certain level of production, minimal costs must be pursued so that it can be more profitable for farmers. This is because, in the era of free market globalization, only the products produced efficiently are able to compete, both in the domestic and international markets. Efficient farming can only be achieved by applying appropriate technology.
Before being distributed to users, a model to be developed must be evaluated for its technical and financial feasibility. This is because the model can be said to be effective if it meets the following criteria: (1) it is technically easy to do, (2) it is financially (even economically) profitable, (3) socially and culturally accepted by the community, and (4) it does not damage the environment. Thus, financial or economic feasibility is an absolute requirement for a model to be adopted by farmers.
Table 93 Impact Assessment of Increased Access and Development
Impact Increased Access and Development
Impact Nature
Negative Positive Neutral
Loss and destruction of vegetation, reduced wildlife populations, threats to biodiversity
Impact Type Direct Secondary Indirect Cumulative Residual
More land clearing and encroachment of previously difficult-to-reach areas due to easier access, further threats to vegetation and wildlife populations
Impact Duration
Temporary Short-term Long-term Permanent
In the long run, access to areas that were previously difficult to reach becomes easier and opens up opportunities for forest encroachment, thereby increasing threats to biodiversity
Impact Extent
Local Regional Global
The impact was felt around the Cisokan hydropower area
Impact Magnitude
No change Slight Low Medium High
Development and accessibility can increase pressure on land and wildlife. If not managed carefully, these changes will increase damage to vegetation and threaten biodiversity
Low Low-Medium Medium Medium-High High
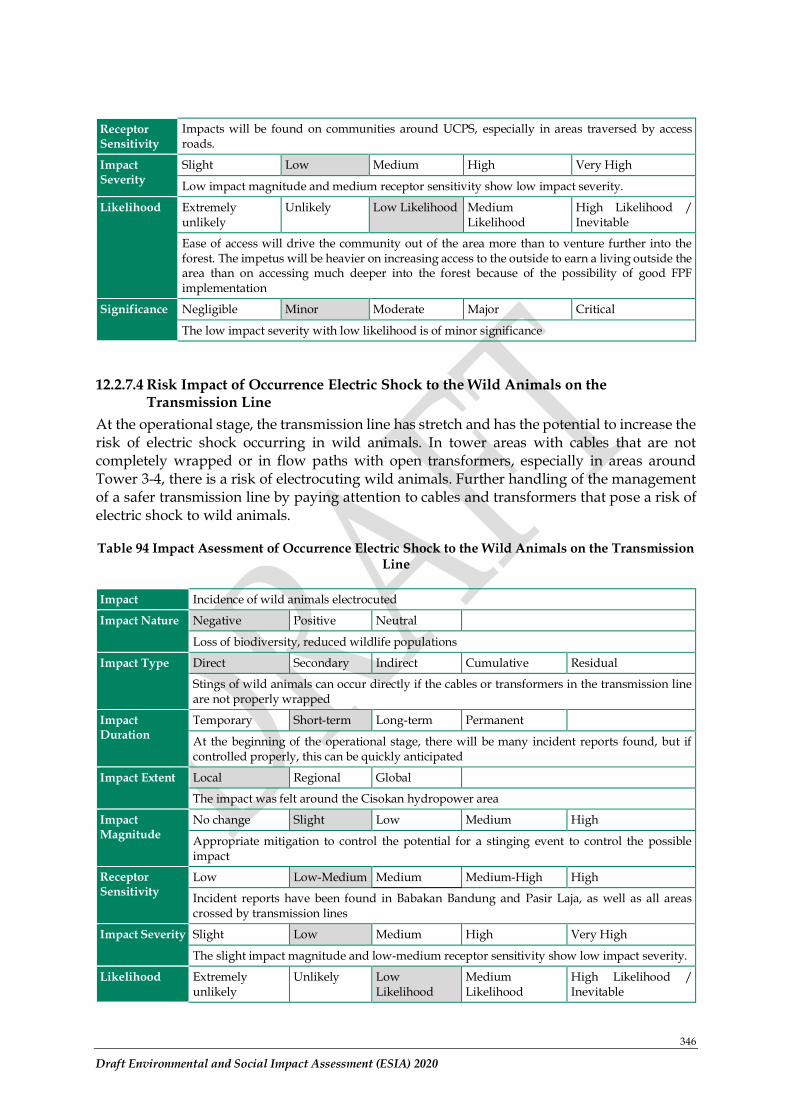
346
Draft Environmental and Social Impact Assessment (ESIA) 2020
Receptor Sensitivity
Impacts will be found on communities around UCPS, especially in areas traversed by access roads.
Impact Severity
Slight Low Medium High Very High
Low impact magnitude and medium receptor sensitivity show low impact severity.
Likelihood Extremely unlikely
Unlikely Low Likelihood Medium Likelihood
High Likelihood / Inevitable
Ease of access will drive the community out of the area more than to venture further into the forest. The impetus will be heavier on increasing access to the outside to earn a living outside the area than on accessing much deeper into the forest because of the possibility of good FPF implementation
Significance Negligible Minor Moderate Major Critical
The low impact severity with low likelihood is of minor significance
12.2.7.4 Risk Impact of Occurrence Electric Shock to the Wild Animals on the Transmission Line
At the operational stage, the transmission line has stretch and has the potential to increase the risk of electric shock occurring in wild animals. In tower areas with cables that are not completely wrapped or in flow paths with open transformers, especially in areas around Tower 3-4, there is a risk of electrocuting wild animals. Further handling of the management of a safer transmission line by paying attention to cables and transformers that pose a risk of electric shock to wild animals.
Table 94 Impact Asessment of Occurrence Electric Shock to the Wild Animals on the Transmission Line
Impact Incidence of wild animals electrocuted
Impact Nature Negative Positive Neutral
Loss of biodiversity, reduced wildlife populations
Impact Type Direct Secondary Indirect Cumulative Residual
Stings of wild animals can occur directly if the cables or transformers in the transmission line are not properly wrapped
Impact Duration
Temporary Short-term Long-term Permanent
At the beginning of the operational stage, there will be many incident reports found, but if controlled properly, this can be quickly anticipated
Impact Extent Local Regional Global
The impact was felt around the Cisokan hydropower area
Impact Magnitude
No change Slight Low Medium High
Appropriate mitigation to control the potential for a stinging event to control the possible impact
Receptor Sensitivity
Low Low-Medium Medium Medium-High High
Incident reports have been found in Babakan Bandung and Pasir Laja, as well as all areas crossed by transmission lines
Impact Severity Slight Low Medium High Very High
The slight impact magnitude and low-medium receptor sensitivity show low impact severity.
Likelihood Extremely unlikely
Unlikely Low Likelihood
Medium Likelihood
High Likelihood / Inevitable
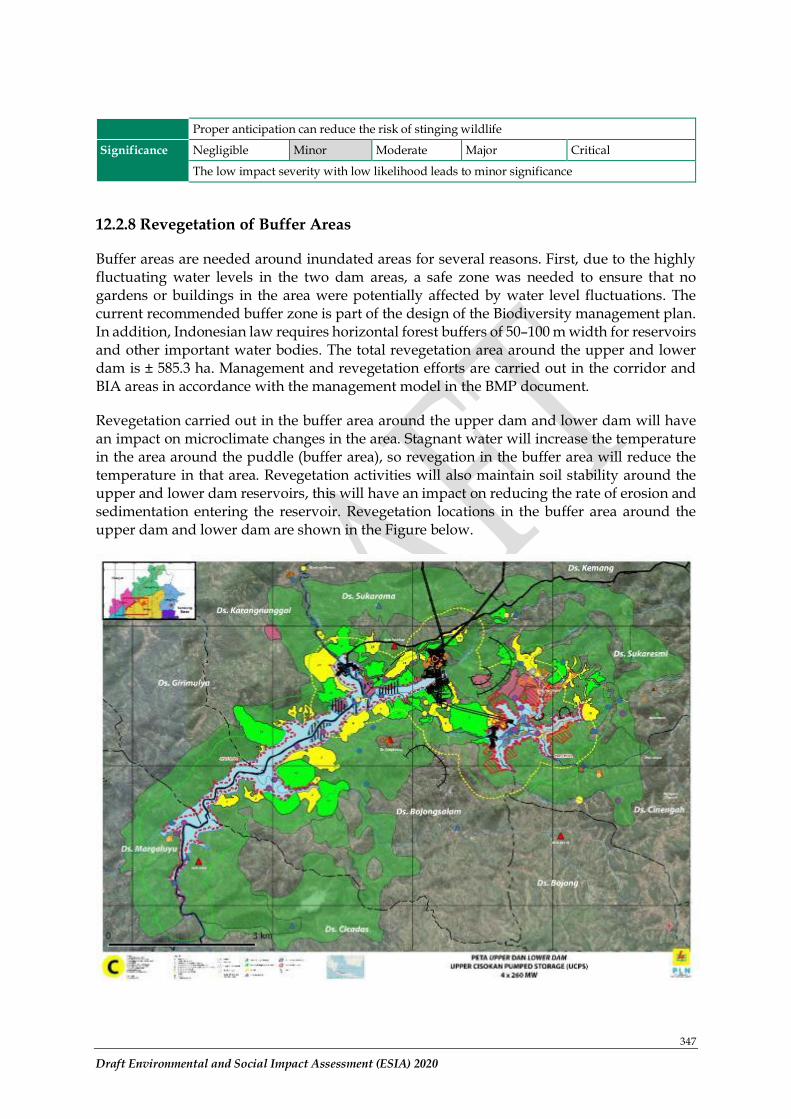
347
Draft Environmental and Social Impact Assessment (ESIA) 2020
Proper anticipation can reduce the risk of stinging wildlife
Significance Negligible Minor Moderate Major Critical
The low impact severity with low likelihood leads to minor significance
12.2.8 Revegetation of Buffer Areas
Buffer areas are needed around inundated areas for several reasons. First, due to the highly fluctuating water levels in the two dam areas, a safe zone was needed to ensure that no gardens or buildings in the area were potentially affected by water level fluctuations. The current recommended buffer zone is part of the design of the Biodiversity management plan. In addition, Indonesian law requires horizontal forest buffers of 50–100 m width for reservoirs and other important water bodies. The total revegetation area around the upper and lower dam is ± 585.3 ha. Management and revegetation efforts are carried out in the corridor and BIA areas in accordance with the management model in the BMP document.
Revegetation carried out in the buffer area around the upper dam and lower dam will have an impact on microclimate changes in the area. Stagnant water will increase the temperature in the area around the puddle (buffer area), so revegation in the buffer area will reduce the temperature in that area. Revegetation activities will also maintain soil stability around the upper and lower dam reservoirs, this will have an impact on reducing the rate of erosion and sedimentation entering the reservoir. Revegetation locations in the buffer area around the upper dam and lower dam are shown in the Figure below.
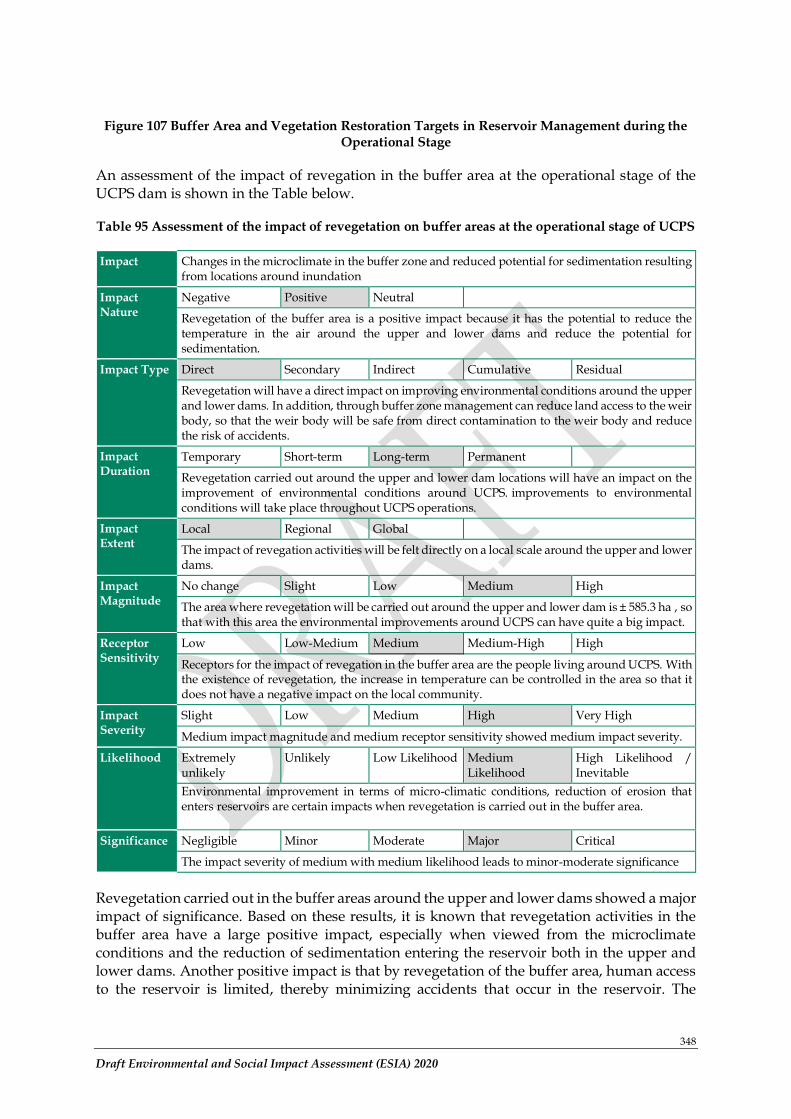
348
Draft Environmental and Social Impact Assessment (ESIA) 2020
Figure 107 Buffer Area and Vegetation Restoration Targets in Reservoir Management during the Operational Stage
An assessment of the impact of revegation in the buffer area at the operational stage of the UCPS dam is shown in the Table below.
Table 95 Assessment of the impact of revegetation on buffer areas at the operational stage of UCPS
Impact Changes in the microclimate in the buffer zone and reduced potential for sedimentation resulting from locations around inundation
Impact Nature
Negative Positive Neutral
Revegetation of the buffer area is a positive impact because it has the potential to reduce the temperature in the air around the upper and lower dams and reduce the potential for sedimentation.
Impact Type Direct Secondary Indirect Cumulative Residual
Revegetation will have a direct impact on improving environmental conditions around the upper and lower dams. In addition, through buffer zone management can reduce land access to the weir body, so that the weir body will be safe from direct contamination to the weir body and reduce the risk of accidents.
Impact Duration
Temporary Short-term Long-term Permanent
Revegetation carried out around the upper and lower dam locations will have an impact on the improvement of environmental conditions around UCPS. improvements to environmental conditions will take place throughout UCPS operations.
Impact Extent
Local Regional Global
The impact of revegation activities will be felt directly on a local scale around the upper and lower dams.
Impact Magnitude
No change Slight Low Medium High
The area where revegetation will be carried out around the upper and lower dam is ± 585.3 ha , so that with this area the environmental improvements around UCPS can have quite a big impact.
Receptor Sensitivity
Low Low-Medium Medium Medium-High High
Receptors for the impact of revegation in the buffer area are the people living around UCPS. With the existence of revegetation, the increase in temperature can be controlled in the area so that it does not have a negative impact on the local community.
Impact Severity
Slight Low Medium High Very High
Medium impact magnitude and medium receptor sensitivity showed medium impact severity.
Likelihood Extremely unlikely
Unlikely Low Likelihood Medium Likelihood
High Likelihood / Inevitable
Environmental improvement in terms of micro-climatic conditions, reduction of erosion that enters reservoirs are certain impacts when revegetation is carried out in the buffer area.
Significance Negligible Minor Moderate Major Critical
The impact severity of medium with medium likelihood leads to minor-moderate significance
Revegetation carried out in the buffer areas around the upper and lower dams showed a major impact of significance. Based on these results, it is known that revegetation activities in the buffer area have a large positive impact, especially when viewed from the microclimate conditions and the reduction of sedimentation entering the reservoir both in the upper and lower dams. Another positive impact is that by revegetation of the buffer area, human access to the reservoir is limited, thereby minimizing accidents that occur in the reservoir. The
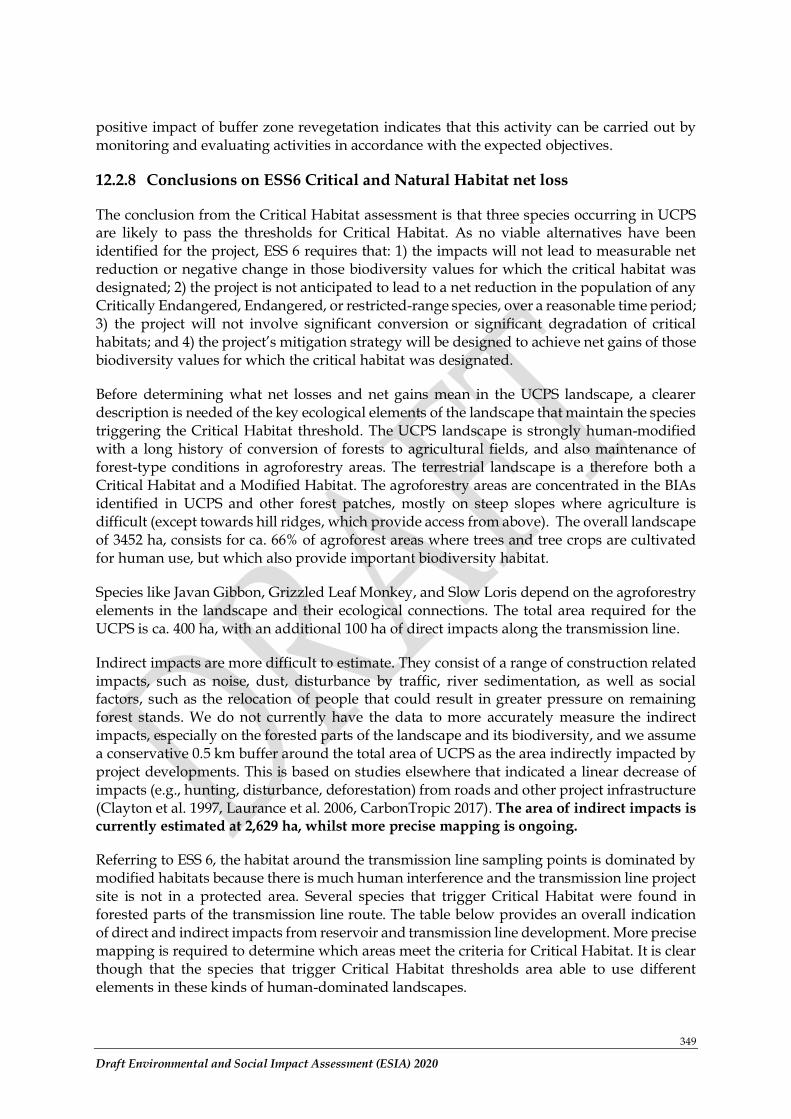
349
Draft Environmental and Social Impact Assessment (ESIA) 2020
positive impact of buffer zone revegetation indicates that this activity can be carried out by monitoring and evaluating activities in accordance with the expected objectives.
12.2.8 Conclusions on ESS6 Critical and Natural Habitat net loss
The conclusion from the Critical Habitat assessment is that three species occurring in UCPS are likely to pass the thresholds for Critical Habitat. As no viable alternatives have been identified for the project, ESS 6 requires that: 1) the impacts will not lead to measurable net reduction or negative change in those biodiversity values for which the critical habitat was designated; 2) the project is not anticipated to lead to a net reduction in the population of any Critically Endangered, Endangered, or restricted-range species, over a reasonable time period; 3) the project will not involve significant conversion or significant degradation of critical habitats; and 4) the project’s mitigation strategy will be designed to achieve net gains of those biodiversity values for which the critical habitat was designated.
Before determining what net losses and net gains mean in the UCPS landscape, a clearer description is needed of the key ecological elements of the landscape that maintain the species triggering the Critical Habitat threshold. The UCPS landscape is strongly human-modified with a long history of conversion of forests to agricultural fields, and also maintenance of forest-type conditions in agroforestry areas. The terrestrial landscape is a therefore both a Critical Habitat and a Modified Habitat. The agroforestry areas are concentrated in the BIAs identified in UCPS and other forest patches, mostly on steep slopes where agriculture is difficult (except towards hill ridges, which provide access from above). The overall landscape of 3452 ha, consists for ca. 66% of agroforest areas where trees and tree crops are cultivated for human use, but which also provide important biodiversity habitat.
Species like Javan Gibbon, Grizzled Leaf Monkey, and Slow Loris depend on the agroforestry elements in the landscape and their ecological connections. The total area required for the UCPS is ca. 400 ha, with an additional 100 ha of direct impacts along the transmission line.
Indirect impacts are more difficult to estimate. They consist of a range of construction related impacts, such as noise, dust, disturbance by traffic, river sedimentation, as well as social factors, such as the relocation of people that could result in greater pressure on remaining forest stands. We do not currently have the data to more accurately measure the indirect impacts, especially on the forested parts of the landscape and its biodiversity, and we assume a conservative 0.5 km buffer around the total area of UCPS as the area indirectly impacted by project developments. This is based on studies elsewhere that indicated a linear decrease of impacts (e.g., hunting, disturbance, deforestation) from roads and other project infrastructure (Clayton et al. 1997, Laurance et al. 2006, CarbonTropic 2017). The area of indirect impacts is currently estimated at 2,629 ha, whilst more precise mapping is ongoing.
Referring to ESS 6, the habitat around the transmission line sampling points is dominated by modified habitats because there is much human interference and the transmission line project site is not in a protected area. Several species that trigger Critical Habitat were found in forested parts of the transmission line route. The table below provides an overall indication of direct and indirect impacts from reservoir and transmission line development. More precise mapping is required to determine which areas meet the criteria for Critical Habitat. It is clear though that the species that trigger Critical Habitat thresholds area able to use different elements in these kinds of human-dominated landscapes.
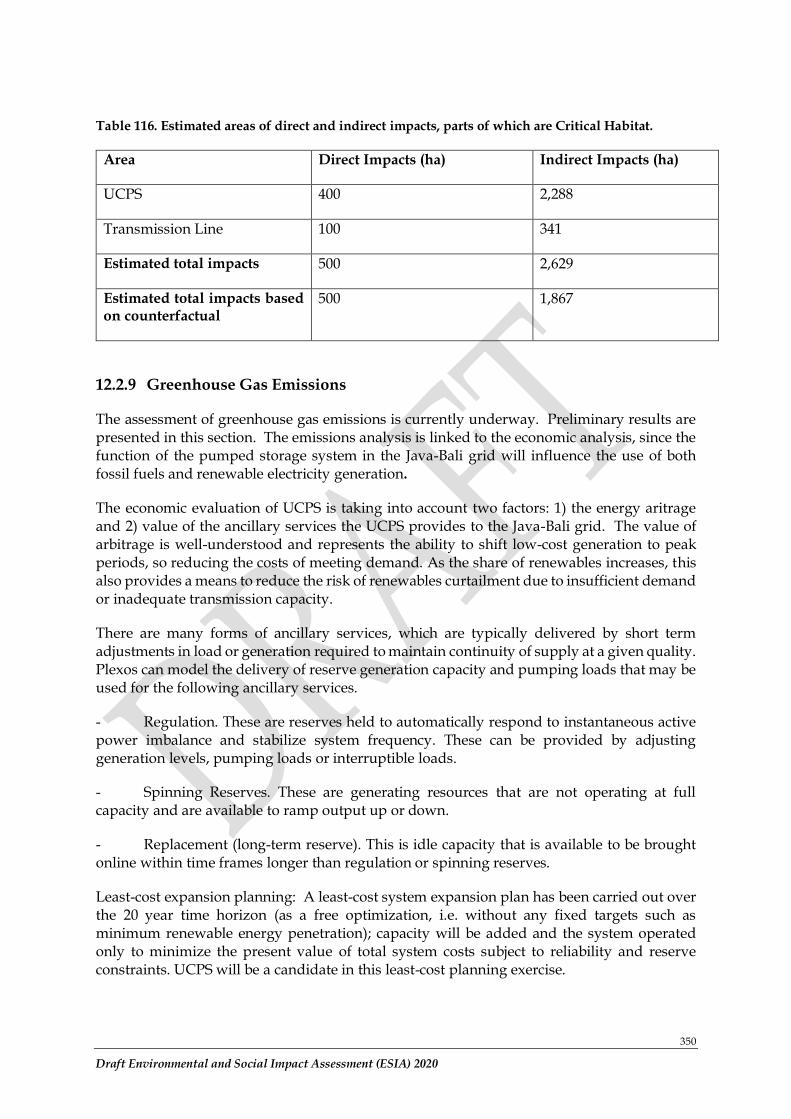
350
Draft Environmental and Social Impact Assessment (ESIA) 2020
Table 116. Estimated areas of direct and indirect impacts, parts of which are Critical Habitat.
Area Direct Impacts (ha) Indirect Impacts (ha)
UCPS 400 2,288
Transmission Line 100 341
Estimated total impacts 500 2,629
Estimated total impacts based on counterfactual
500 1,867
12.2.9 Greenhouse Gas Emissions
The assessment of greenhouse gas emissions is currently underway. Preliminary results are presented in this section. The emissions analysis is linked to the economic analysis, since the function of the pumped storage system in the Java-Bali grid will influence the use of both fossil fuels and renewable electricity generation.
The economic evaluation of UCPS is taking into account two factors: 1) the energy aritrage and 2) value of the ancillary services the UCPS provides to the Java-Bali grid. The value of arbitrage is well-understood and represents the ability to shift low-cost generation to peak periods, so reducing the costs of meeting demand. As the share of renewables increases, this also provides a means to reduce the risk of renewables curtailment due to insufficient demand or inadequate transmission capacity.
There are many forms of ancillary services, which are typically delivered by short term adjustments in load or generation required to maintain continuity of supply at a given quality. Plexos can model the delivery of reserve generation capacity and pumping loads that may be used for the following ancillary services.
- Regulation. These are reserves held to automatically respond to instantaneous active power imbalance and stabilize system frequency. These can be provided by adjusting generation levels, pumping loads or interruptible loads.
- Spinning Reserves. These are generating resources that are not operating at full capacity and are available to ramp output up or down.
- Replacement (long-term reserve). This is idle capacity that is available to be brought online within time frames longer than regulation or spinning reserves.
Least-cost expansion planning: A least-cost system expansion plan has been carried out over the 20 year time horizon (as a free optimization, i.e. without any fixed targets such as minimum renewable energy penetration); capacity will be added and the system operated only to minimize the present value of total system costs subject to reliability and reserve constraints. UCPS will be a candidate in this least-cost planning exercise.
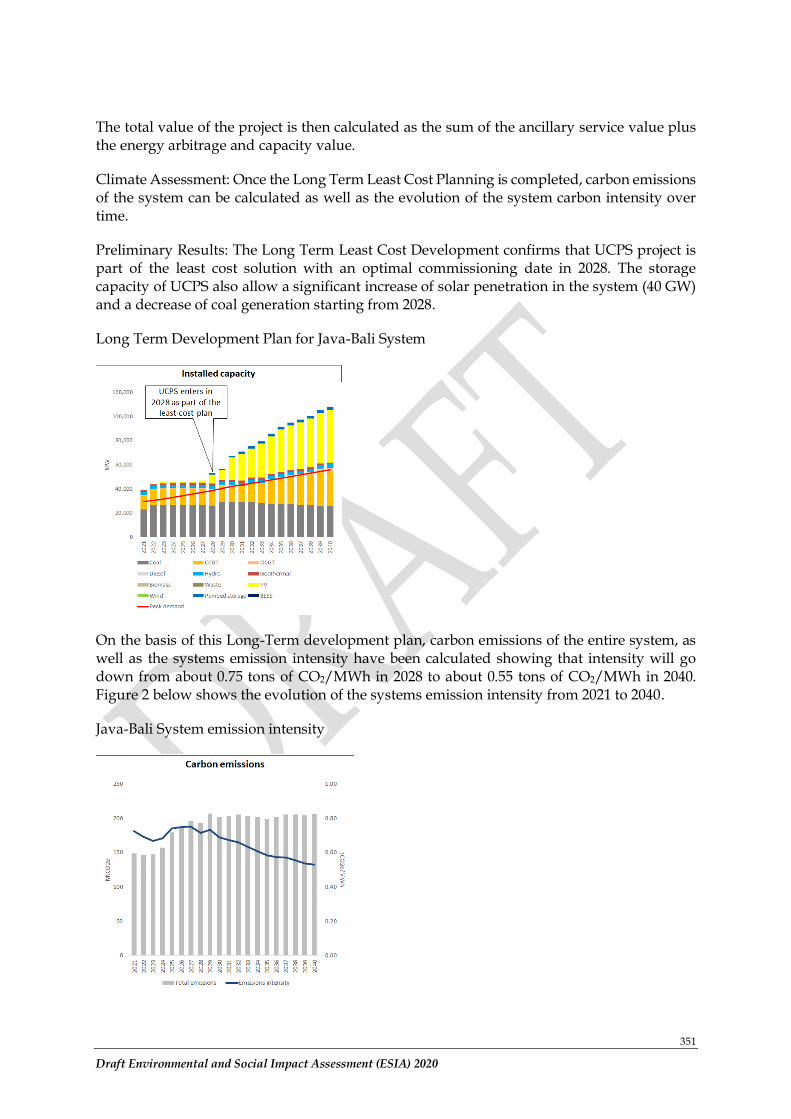
351
Draft Environmental and Social Impact Assessment (ESIA) 2020
The total value of the project is then calculated as the sum of the ancillary service value plus the energy arbitrage and capacity value.
Climate Assessment: Once the Long Term Least Cost Planning is completed, carbon emissions of the system can be calculated as well as the evolution of the system carbon intensity over time.
Preliminary Results: The Long Term Least Cost Development confirms that UCPS project is part of the least cost solution with an optimal commissioning date in 2028. The storage capacity of UCPS also allow a significant increase of solar penetration in the system (40 GW) and a decrease of coal generation starting from 2028.
Long Term Development Plan for Java-Bali System
On the basis of this Long-Term development plan, carbon emissions of the entire system, as well as the systems emission intensity have been calculated showing that intensity will go down from about 0.75 tons of CO2/MWh in 2028 to about 0.55 tons of CO2/MWh in 2040. Figure 2 below shows the evolution of the systems emission intensity from 2021 to 2040.
Java-Bali System emission intensity
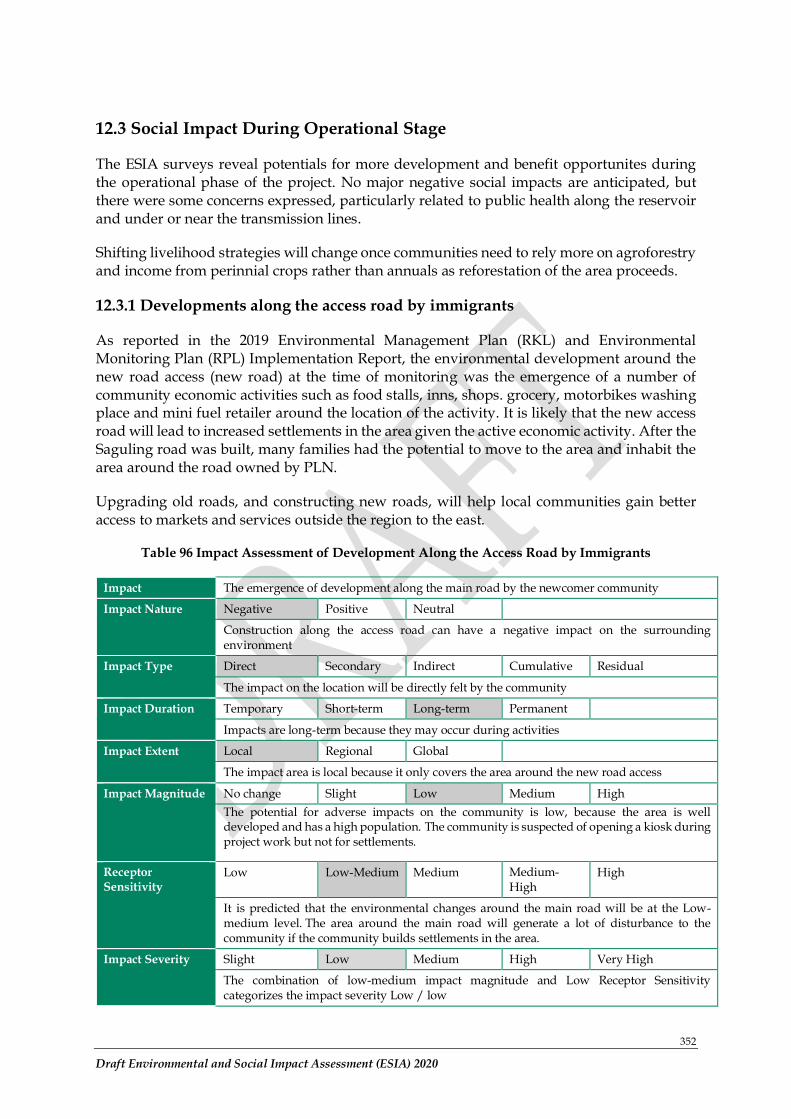
352
Draft Environmental and Social Impact Assessment (ESIA) 2020
12.3 Social Impact During Operational Stage
The ESIA surveys reveal potentials for more development and benefit opportunites during the operational phase of the project. No major negative social impacts are anticipated, but there were some concerns expressed, particularly related to public health along the reservoir and under or near the transmission lines.
Shifting livelihood strategies will change once communities need to rely more on agroforestry and income from perinnial crops rather than annuals as reforestation of the area proceeds.
12.3.1 Developments along the access road by immigrants
As reported in the 2019 Environmental Management Plan (RKL) and Environmental Monitoring Plan (RPL) Implementation Report, the environmental development around the new road access (new road) at the time of monitoring was the emergence of a number of community economic activities such as food stalls, inns, shops. grocery, motorbikes washing place and mini fuel retailer around the location of the activity. It is likely that the new access road will lead to increased settlements in the area given the active economic activity. After the Saguling road was built, many families had the potential to move to the area and inhabit the area around the road owned by PLN.
Upgrading old roads, and constructing new roads, will help local communities gain better access to markets and services outside the region to the east.
Table 96 Impact Assessment of Development Along the Access Road by Immigrants
Impact The emergence of development along the main road by the newcomer community
Impact Nature Negative Positive Neutral
Construction along the access road can have a negative impact on the surrounding environment
Impact Type Direct Secondary Indirect Cumulative Residual
The impact on the location will be directly felt by the community
Impact Duration Temporary Short-term Long-term Permanent
Impacts are long-term because they may occur during activities
Impact Extent Local Regional Global
The impact area is local because it only covers the area around the new road access
Impact Magnitude No change Slight Low Medium High The potential for adverse impacts on the community is low, because the area is well developed and has a high population. The community is suspected of opening a kiosk during project work but not for settlements.
Receptor Sensitivity
Low Low-Medium Medium Medium-High
High
It is predicted that the environmental changes around the main road will be at the Low-medium level. The area around the main road will generate a lot of disturbance to the community if the community builds settlements in the area.
Impact Severity Slight Low Medium High Very High
The combination of low-medium impact magnitude and Low Receptor Sensitivity categorizes the impact severity Low / low
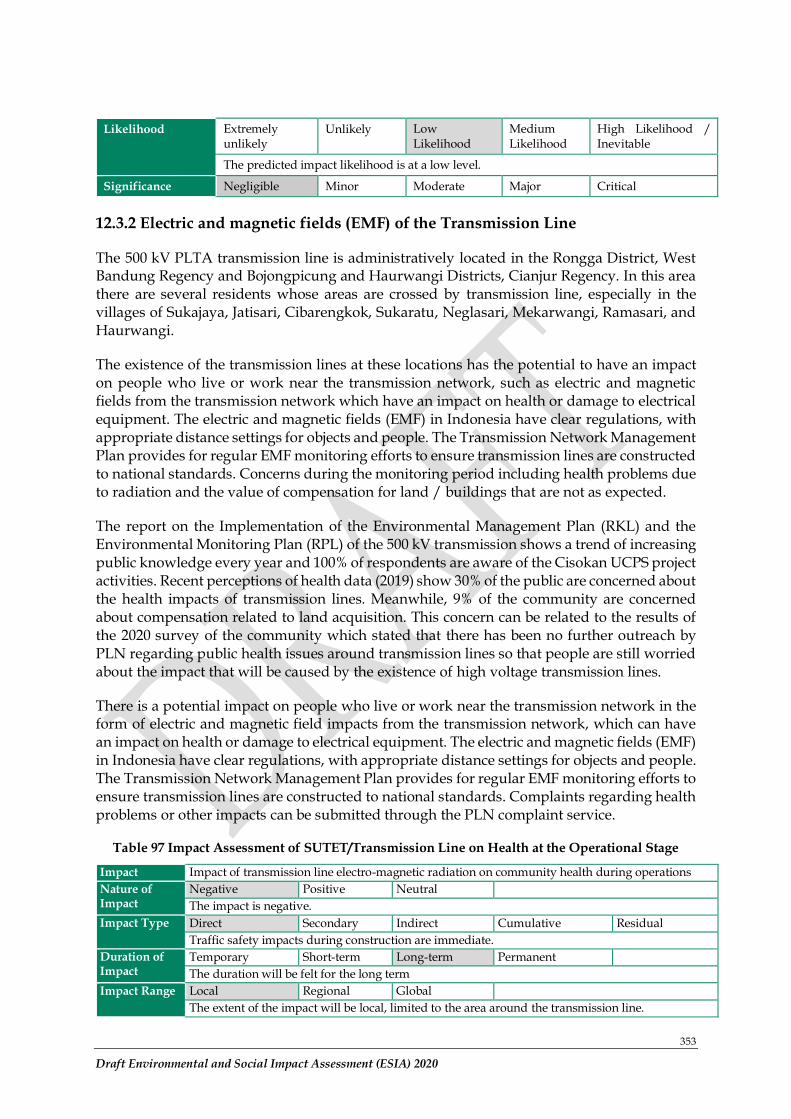
353
Draft Environmental and Social Impact Assessment (ESIA) 2020
Likelihood Extremely unlikely
Unlikely Low Likelihood
Medium Likelihood
High Likelihood / Inevitable
The predicted impact likelihood is at a low level.
Significance Negligible Minor Moderate Major Critical
12.3.2 Electric and magnetic fields (EMF) of the Transmission Line
The 500 kV PLTA transmission line is administratively located in the Rongga District, West Bandung Regency and Bojongpicung and Haurwangi Districts, Cianjur Regency. In this area there are several residents whose areas are crossed by transmission line, especially in the villages of Sukajaya, Jatisari, Cibarengkok, Sukaratu, Neglasari, Mekarwangi, Ramasari, and Haurwangi.
The existence of the transmission lines at these locations has the potential to have an impact on people who live or work near the transmission network, such as electric and magnetic fields from the transmission network which have an impact on health or damage to electrical equipment. The electric and magnetic fields (EMF) in Indonesia have clear regulations, with appropriate distance settings for objects and people. The Transmission Network Management Plan provides for regular EMF monitoring efforts to ensure transmission lines are constructed to national standards. Concerns during the monitoring period including health problems due to radiation and the value of compensation for land / buildings that are not as expected.
The report on the Implementation of the Environmental Management Plan (RKL) and the Environmental Monitoring Plan (RPL) of the 500 kV transmission shows a trend of increasing public knowledge every year and 100% of respondents are aware of the Cisokan UCPS project activities. Recent perceptions of health data (2019) show 30% of the public are concerned about the health impacts of transmission lines. Meanwhile, 9% of the community are concerned about compensation related to land acquisition. This concern can be related to the results of the 2020 survey of the community which stated that there has been no further outreach by PLN regarding public health issues around transmission lines so that people are still worried about the impact that will be caused by the existence of high voltage transmission lines.
There is a potential impact on people who live or work near the transmission network in the form of electric and magnetic field impacts from the transmission network, which can have an impact on health or damage to electrical equipment. The electric and magnetic fields (EMF) in Indonesia have clear regulations, with appropriate distance settings for objects and people. The Transmission Network Management Plan provides for regular EMF monitoring efforts to ensure transmission lines are constructed to national standards. Complaints regarding health problems or other impacts can be submitted through the PLN complaint service.
Table 97 Impact Assessment of SUTET/Transmission Line on Health at the Operational Stage
Impact Impact of transmission line electro-magnetic radiation on community health during operations
Nature of Impact
Negative Positive Neutral
The impact is negative.
Impact Type Direct Secondary Indirect Cumulative Residual
Traffic safety impacts during construction are immediate.
Duration of Impact
Temporary Short-term Long-term Permanent
The duration will be felt for the long term
Impact Range Local Regional Global
The extent of the impact will be local, limited to the area around the transmission line.
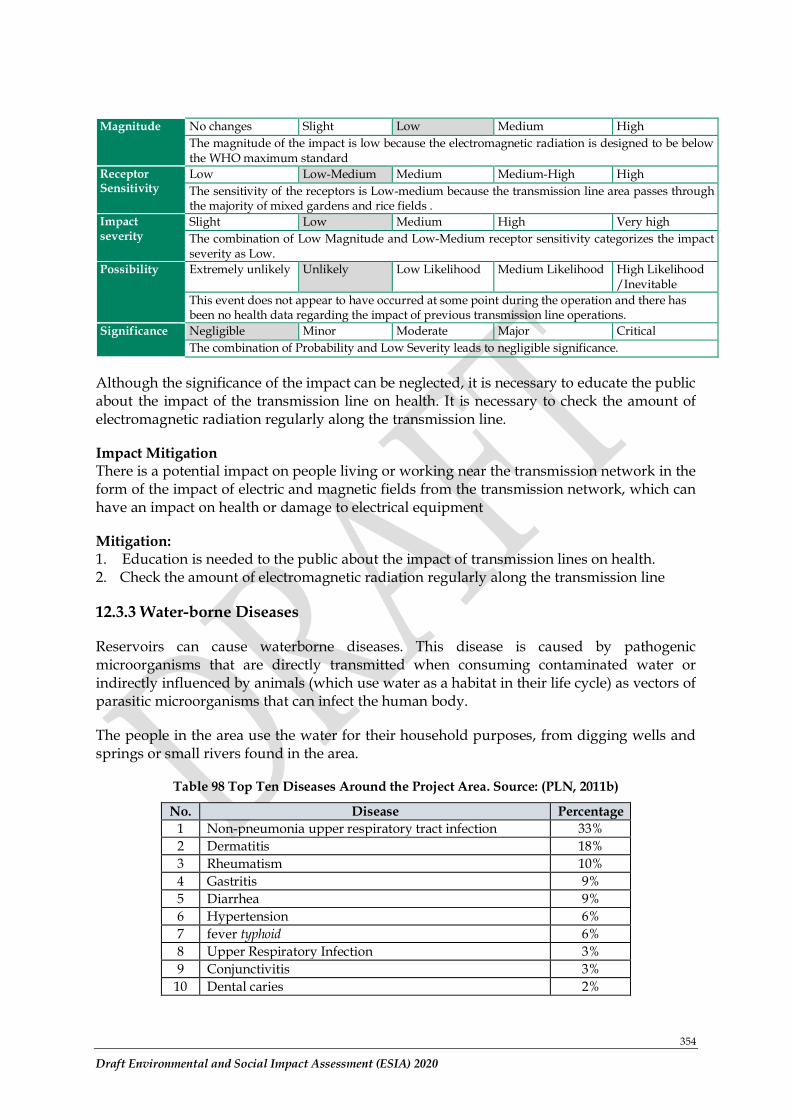
354
Draft Environmental and Social Impact Assessment (ESIA) 2020
Magnitude No changes Slight Low Medium High
The magnitude of the impact is low because the electromagnetic radiation is designed to be below the WHO maximum standard
Receptor Sensitivity
Low Low-Medium Medium Medium-High High
The sensitivity of the receptors is Low-medium because the transmission line area passes through the majority of mixed gardens and rice fields .
Impact severity
Slight Low Medium High Very high
The combination of Low Magnitude and Low-Medium receptor sensitivity categorizes the impact severity as Low.
Possibility Extremely unlikely Unlikely Low Likelihood Medium Likelihood High Likelihood /Inevitable
This event does not appear to have occurred at some point during the operation and there has been no health data regarding the impact of previous transmission line operations.
Significance Negligible Minor Moderate Major Critical
The combination of Probability and Low Severity leads to negligible significance.
Although the significance of the impact can be neglected, it is necessary to educate the public about the impact of the transmission line on health. It is necessary to check the amount of electromagnetic radiation regularly along the transmission line.
Impact Mitigation There is a potential impact on people living or working near the transmission network in the form of the impact of electric and magnetic fields from the transmission network, which can have an impact on health or damage to electrical equipment
Mitigation: 1. Education is needed to the public about the impact of transmission lines on health. 2. Check the amount of electromagnetic radiation regularly along the transmission line
12.3.3 Water-borne Diseases
Reservoirs can cause waterborne diseases. This disease is caused by pathogenic microorganisms that are directly transmitted when consuming contaminated water or indirectly influenced by animals (which use water as a habitat in their life cycle) as vectors of parasitic microorganisms that can infect the human body.
The people in the area use the water for their household purposes, from digging wells and springs or small rivers found in the area.
Table 98 Top Ten Diseases Around the Project Area. Source: (PLN, 2011b)
No. Disease Percentage
1 Non-pneumonia upper respiratory tract infection 33%
2 Dermatitis 18%
3 Rheumatism 10%
4 Gastritis 9%
5 Diarrhea 9%
6 Hypertension 6%
7 fever typhoid 6%
8 Upper Respiratory Infection 3%
9 Conjunctivitis 3%
10 Dental caries 2%
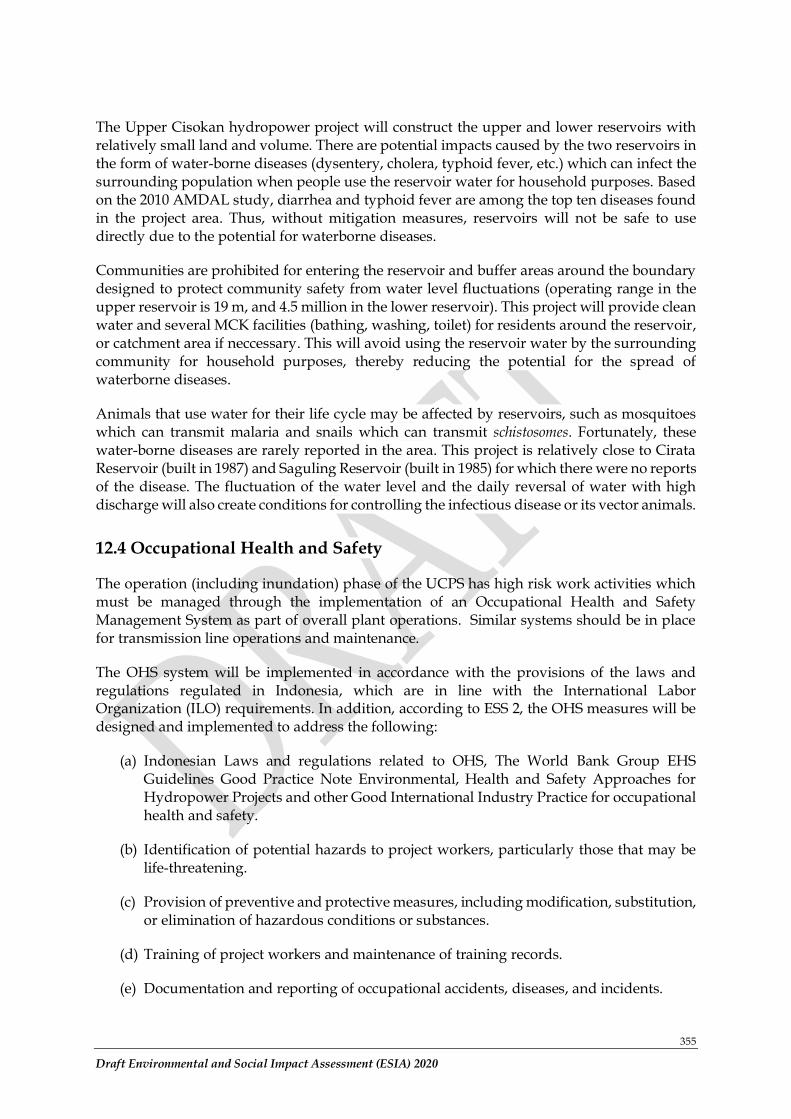
355
Draft Environmental and Social Impact Assessment (ESIA) 2020
The Upper Cisokan hydropower project will construct the upper and lower reservoirs with relatively small land and volume. There are potential impacts caused by the two reservoirs in the form of water-borne diseases (dysentery, cholera, typhoid fever, etc.) which can infect the surrounding population when people use the reservoir water for household purposes. Based on the 2010 AMDAL study, diarrhea and typhoid fever are among the top ten diseases found in the project area. Thus, without mitigation measures, reservoirs will not be safe to use directly due to the potential for waterborne diseases.
Communities are prohibited for entering the reservoir and buffer areas around the boundary designed to protect community safety from water level fluctuations (operating range in the upper reservoir is 19 m, and 4.5 million in the lower reservoir). This project will provide clean water and several MCK facilities (bathing, washing, toilet) for residents around the reservoir, or catchment area if neccessary. This will avoid using the reservoir water by the surrounding community for household purposes, thereby reducing the potential for the spread of waterborne diseases.
Animals that use water for their life cycle may be affected by reservoirs, such as mosquitoes which can transmit malaria and snails which can transmit schistosomes. Fortunately, these water-borne diseases are rarely reported in the area. This project is relatively close to Cirata Reservoir (built in 1987) and Saguling Reservoir (built in 1985) for which there were no reports of the disease. The fluctuation of the water level and the daily reversal of water with high discharge will also create conditions for controlling the infectious disease or its vector animals.
12.4 Occupational Health and Safety
The operation (including inundation) phase of the UCPS has high risk work activities which must be managed through the implementation of an Occupational Health and Safety Management System as part of overall plant operations. Similar systems should be in place for transmission line operations and maintenance.
The OHS system will be implemented in accordance with the provisions of the laws and regulations regulated in Indonesia, which are in line with the International Labor Organization (ILO) requirements. In addition, according to ESS 2, the OHS measures will be designed and implemented to address the following:
(a) Indonesian Laws and regulations related to OHS, The World Bank Group EHS Guidelines Good Practice Note Environmental, Health and Safety Approaches for Hydropower Projects and other Good International Industry Practice for occupational health and safety.
(b) Identification of potential hazards to project workers, particularly those that may be life-threatening.
(c) Provision of preventive and protective measures, including modification, substitution, or elimination of hazardous conditions or substances.
(d) Training of project workers and maintenance of training records.
(e) Documentation and reporting of occupational accidents, diseases, and incidents.
356
Draft Environmental and Social Impact Assessment (ESIA) 2020
(f) Emergency prevention and preparedness and response arrangements to emergency situations, including coordination with the with the Emergency Preparedness and Response measures established under ESS 4.
(g) Remedies for adverse impacts such as occupational injuries, deaths, disability, and disease. Such remedies should take into account, as applicable, the wage level and age of the project worker, the degree of adverse impact, and the number and age of dependents concerned.
The most significant Occupational Health and Safety (OHS) hazards associated with hydropower projects occur during the inundation and operational phase include activities with carry an extremely high risk for workers. These activities carry an elevated risk of injury or fatality if not managed adequately, these activities are:
• Vehicle incidents driving to, from and around the site.
• Working in confined spaces.
• Working underground.
• Working with electricity / electrical hazards.
• Exposure to noise.
• EMF exposure.
• Working at heights (transmission line, dam areas).
• Working near water (including during periods of drawdown or filling).
• Exposure to natural disasters and emergency events.
The Hierarchy of Controls pyramid will form the foundation by which safety risks and hazards are managed and controlled. The most effective measure is elimination/substitution, followed by engineering controls, administrative and work practice controls and finally PPE as the least effective at the bottom.
The controls are discussed below:
• Elimination/substitution. The best way to deal with a safety hazard is to eliminate it altogether by preventing exposure to the hazard before it even occurs. In substitution, one seeks to permanently reduce the risk by substituting a less hazardous material or reduction of system energy. These are process design solutions that require a permanent change to how a job is performed.
• Engineering controls. Change the structure of the work area to reduce exposure using safety devices or barriers. An example would be to place a high fence around a dangerous location to prevent access.
• Administrative and work practice controls. Implement procedures that require workers to do things to reduce their exposure to a risk. A lockout/tagout program is an example of an administrative control. Set expectations that workers will engage in safe work practices. Another example is the use of warning signs, sirens and alarms.
• Personal protective equipment (PPE). Make sure employees wear the proper protective clothing, gloves and eyeglasses for the job. Examples are safety goggles, respirators, fall protection and hearing protection.
Mitigation
357
Draft Environmental and Social Impact Assessment (ESIA) 2020
All contractors are required to ensure that the health, safety, and environmental (HSE) risks are identified for their direct employees and sub-contractors. Each Contractor will develop an Occupational Health and Safety Plan that will cover all of the above hazards and risks to safeguard the health and safety of, in particular, the local workers who are likely to be less experienced in this area.
The OHS Plan should be based on applicable Indonesian Laws and Regulations, Good Practice Note Environmental, Health and Safety Approaches for Hydropower Projects, World Bank Group EHS Guidelines as well ESS 2 and will cover the following:
• Clearly delineate the scope of their control and responsibilities for worker health and safety, in terms of location(s) on site and activities within their control.
• The Contractor will prioritize worker health and safety standards such as preparing SOPs for each type of activity, conducting regular health and safety training and briefings (in the local languages) before the implementation of the activities and compulsory use of personal protective equipment (PPE).
• The Contractors and Supervision Engineers must have sufficient staff and resources to manage health and safety, including qualified and trained staff, staff with adequate managerial authority to control hazards and risks, suitable budgets, appropriate equipment, controls and PPE and access to all Project areas to assess and supervise healthy and safe work practices.
• Worker standards to be aligned with national requirements and ESS2 requirements for health and safety during inundation and operations, along with inductions, training refreshers and inspections. Each individual will be personally assessed for competency and only allowed to work in areas where they have the required competency. On the job training and tracking of competency will be a continuous part of supervision of staff.
• Specific measures will be necessary to maintain staff health and wellbeing while working and being accommodated on site, including access to clean drinking water, clean and effective sanitation, avoiding overcrowding, adequate and clean food, recreation, health services, effective and appropriate PPE and other matters.
• The Contractors will develop and widely communicate and enforce its “Golden Health and Safety Rules” and create a safety culture.
• Strict Occupational Health and Safety requirements will be embedded in the Bid Documents Contractor’s contract as per the World Bank Standard Procurement Documents, to ensure risk management, occupational injuries, worker rights, deaths, disability and diseases are managed as per the ESMP, ESS2 and GIIP.
• The Supervision Engineer and Contractor will undertake their own daily audits with H&S inspectors responsible for monitoring behaviours and correcting where required.
• Should non-compliance repeatedly occur a zero-tolerance approach will be adopted by PLN and enforced on the Contractor by the Supervision Engineer.
• Detailed records of near misses and incidents must be kept and used for continuous improvement purposes.
• Each Contractor will establish and implement a Worker Grievance Mechanism that will be accessible for all workers and sub-contractors to report issues (a confidential option should be provided). When complaints are submitted, the Contractor will undertake an immediate investigation. The Supervision Engineer will oversee the Grievance Mechanism and support the resolution where required.Emergency response and incident management procedures with prevention and early warning
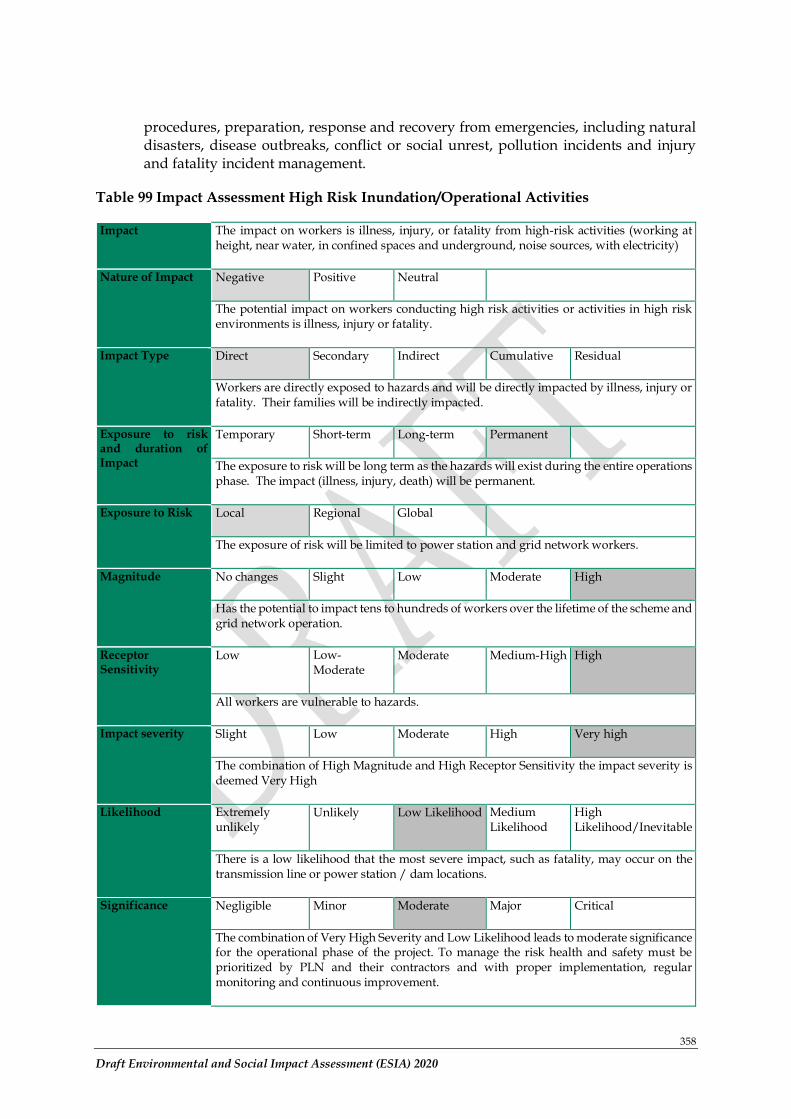
358
Draft Environmental and Social Impact Assessment (ESIA) 2020
procedures, preparation, response and recovery from emergencies, including natural disasters, disease outbreaks, conflict or social unrest, pollution incidents and injury and fatality incident management.
Table 99 Impact Assessment High Risk Inundation/Operational Activities
Impact The impact on workers is illness, injury, or fatality from high-risk activities (working at height, near water, in confined spaces and underground, noise sources, with electricity)
Nature of Impact
Negative Positive Neutral
The potential impact on workers conducting high risk activities or activities in high risk environments is illness, injury or fatality.
Impact Type
Direct Secondary Indirect Cumulative Residual
Workers are directly exposed to hazards and will be directly impacted by illness, injury or fatality. Their families will be indirectly impacted.
Exposure to risk and duration of Impact
Temporary Short-term Long-term Permanent
The exposure to risk will be long term as the hazards will exist during the entire operations phase. The impact (illness, injury, death) will be permanent.
Exposure to Risk
Local Regional Global
The exposure of risk will be limited to power station and grid network workers.
Magnitude
No changes Slight Low Moderate High
Has the potential to impact tens to hundreds of workers over the lifetime of the scheme and grid network operation.
Receptor Sensitivity
Low Low-Moderate
Moderate Medium-High High
All workers are vulnerable to hazards.
Impact severity
Slight Low Moderate High Very high
The combination of High Magnitude and High Receptor Sensitivity the impact severity is deemed Very High
Likelihood
Extremely unlikely
Unlikely Low Likelihood Medium Likelihood
High Likelihood/Inevitable
There is a low likelihood that the most severe impact, such as fatality, may occur on the transmission line or power station / dam locations.
Significance
Negligible Minor Moderate Major Critical
The combination of Very High Severity and Low Likelihood leads to moderate significance for the operational phase of the project. To manage the risk health and safety must be prioritized by PLN and their contractors and with proper implementation, regular monitoring and continuous improvement.
359
Draft Environmental and Social Impact Assessment (ESIA) 2020
12.5 Dam Safety
The safety of the dam and associated structures, as well as the workers and the downstream communities, is a critical part of the design process, construction and operational procedures. As discussed in Section 4.1, the detailed design, bid documents, prequalification of bidders and the selection of the contractor have been supervised by Project Review Panel made up of dam and geotechnical experts, during the period of 2012 to 2017. At the time, the retention and use of the panel was compliant with the World Banksafeguards policy OP.37 Safety of Dams. The panel signed off on the updated design, bid documents and the prequalification of the Contractor for Lot1a Upper and Lower Dams and Lot 1b Waterways, Power House, Switchyard and Buildings. PLN propose to engage a new panel for the updated UCPS project and they will be employed in a similar manner to assist in the supervision of construction, reservoir filling and commissioning and the start of operations and will be involved in the review of dam safety documents. The Panel of Experts will be established by PLN in an acceptable manner to the Bank by the project effective date.
Dam structures and outlets have been designed to the International Commission on Large Dams (ICOLD) siezmic standards. Dam structures and spillways have been designed to the 1/10,000 year flood return interval, as per the ICOLD standards, and the Indonesian government regulation regarding planned flood design discharge for dam structures, power generation and similar uses, based on SNI No. 2415:2016. Bottom outlets are designed to release water in a controlled manner quickly in cases where the dam structures are at risk of failure.
PLN has prepared: 1) Construction Supervision and Quality Assurance Plan, ii) Instrumentation Plan, iii) Prelminary Operation and Maintenance Plan, and iv) Broad Framework for Emergency Preparedness Plan. The CSQAP has been prepared as TOR for the construction Supervision Engineer and further detailed plans have been prepared by the consultant and contractor. Instrumentation plan has been prepared as part of bidding documents. Whilst the preliminary O&M Plan and broad framework have been prapred, the full-fledged O&M Plan and EPP will be prepared by PLN and submitted to the Bank and Panel of Experts not less than 6 and 12 motnhs prior to the initiation of the first reservoir filling.
12.6 Cumulative Impact
The project is located in a rural area with agriculture and production forest where no major projects are being carried out in the vicinity of the watershed. Settlements are found in the area within the project area. There are no main roads in the area, several paved roads or simple roads are found across the countryside. The distance from Bandung city (3 million inhabitants) is about 60 km, Cimahi city (0.5 million inhabitants) 50 km and Cianjur city (2 million residents) about 40 km and the distance from the Tanjung Priok port is about 200 km.
This project is located on the Cisokan river which is a tributary of the Citarum river where there is a Hydro Power Plant (PLTA) that is already operating. From the upstream hydropower Saguling (completed 1985) and then the Cirata hydropower (completed in 1987 located in the middle) and hydropower Jatiluhur (completed in 1962 downstream). The
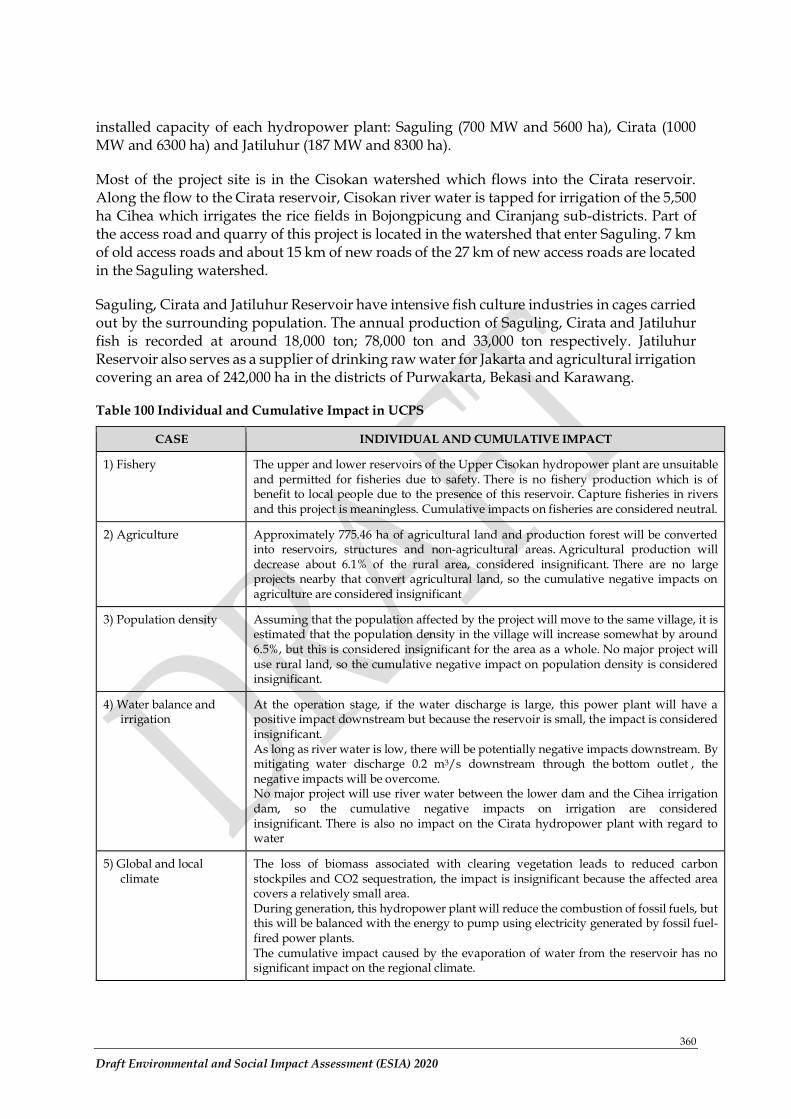
360
Draft Environmental and Social Impact Assessment (ESIA) 2020
installed capacity of each hydropower plant: Saguling (700 MW and 5600 ha), Cirata (1000 MW and 6300 ha) and Jatiluhur (187 MW and 8300 ha).
Most of the project site is in the Cisokan watershed which flows into the Cirata reservoir. Along the flow to the Cirata reservoir, Cisokan river water is tapped for irrigation of the 5,500 ha Cihea which irrigates the rice fields in Bojongpicung and Ciranjang sub-districts. Part of the access road and quarry of this project is located in the watershed that enter Saguling. 7 km of old access roads and about 15 km of new roads of the 27 km of new access roads are located in the Saguling watershed.
Saguling, Cirata and Jatiluhur Reservoir have intensive fish culture industries in cages carried out by the surrounding population. The annual production of Saguling, Cirata and Jatiluhur fish is recorded at around 18,000 ton; 78,000 ton and 33,000 ton respectively. Jatiluhur Reservoir also serves as a supplier of drinking raw water for Jakarta and agricultural irrigation covering an area of 242,000 ha in the districts of Purwakarta, Bekasi and Karawang.
Table 100 Individual and Cumulative Impact in UCPS
CASE INDIVIDUAL AND CUMULATIVE IMPACT
1) Fishery The upper and lower reservoirs of the Upper Cisokan hydropower plant are unsuitable and permitted for fisheries due to safety. There is no fishery production which is of benefit to local people due to the presence of this reservoir. Capture fisheries in rivers and this project is meaningless. Cumulative impacts on fisheries are considered neutral.
2) Agriculture Approximately 775.46 ha of agricultural land and production forest will be converted into reservoirs, structures and non-agricultural areas. Agricultural production will decrease about 6.1% of the rural area, considered insignificant. There are no large projects nearby that convert agricultural land, so the cumulative negative impacts on agriculture are considered insignificant
3) Population density Assuming that the population affected by the project will move to the same village, it is estimated that the population density in the village will increase somewhat by around 6.5%, but this is considered insignificant for the area as a whole. No major project will use rural land, so the cumulative negative impact on population density is considered insignificant.
4) Water balance and irrigation
At the operation stage, if the water discharge is large, this power plant will have a positive impact downstream but because the reservoir is small, the impact is considered insignificant. As long as river water is low, there will be potentially negative impacts downstream. By mitigating water discharge 0.2 m3/s downstream through the bottom outlet , the negative impacts will be overcome. No major project will use river water between the lower dam and the Cihea irrigation dam, so the cumulative negative impacts on irrigation are considered insignificant. There is also no impact on the Cirata hydropower plant with regard to water
5) Global and local climate
The loss of biomass associated with clearing vegetation leads to reduced carbon stockpiles and CO2 sequestration, the impact is insignificant because the affected area covers a relatively small area. During generation, this hydropower plant will reduce the combustion of fossil fuels, but this will be balanced with the energy to pump using electricity generated by fossil fuel-fired power plants. The cumulative impact caused by the evaporation of water from the reservoir has no significant impact on the regional climate.
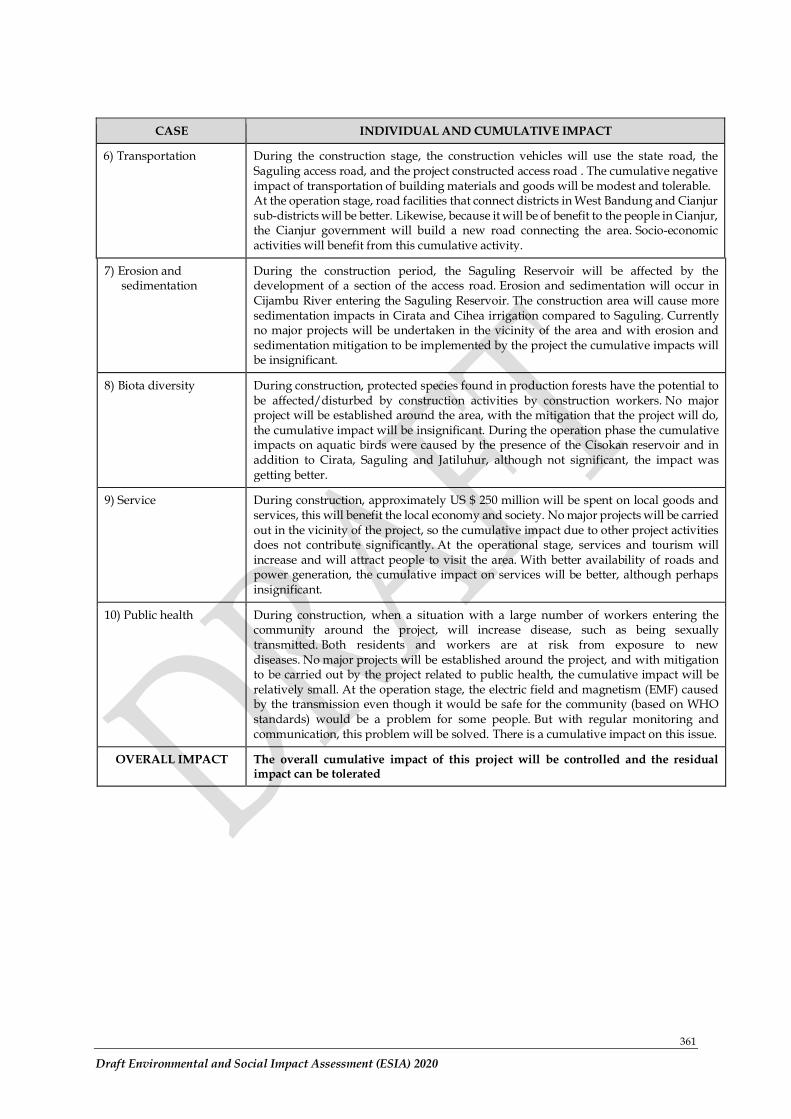
361
Draft Environmental and Social Impact Assessment (ESIA) 2020
CASE INDIVIDUAL AND CUMULATIVE IMPACT
6) Transportation During the construction stage, the construction vehicles will use the state road, the Saguling access road, and the project constructed access road . The cumulative negative impact of transportation of building materials and goods will be modest and tolerable. At the operation stage, road facilities that connect districts in West Bandung and Cianjur sub-districts will be better. Likewise, because it will be of benefit to the people in Cianjur, the Cianjur government will build a new road connecting the area. Socio-economic activities will benefit from this cumulative activity.
7) Erosion and
sedimentation During the construction period, the Saguling Reservoir will be affected by the development of a section of the access road. Erosion and sedimentation will occur in Cijambu River entering the Saguling Reservoir. The construction area will cause more sedimentation impacts in Cirata and Cihea irrigation compared to Saguling. Currently no major projects will be undertaken in the vicinity of the area and with erosion and sedimentation mitigation to be implemented by the project the cumulative impacts will be insignificant.
8) Biota diversity During construction, protected species found in production forests have the potential to
be affected/disturbed by construction activities by construction workers. No major project will be established around the area, with the mitigation that the project will do, the cumulative impact will be insignificant. During the operation phase the cumulative impacts on aquatic birds were caused by the presence of the Cisokan reservoir and in addition to Cirata, Saguling and Jatiluhur, although not significant, the impact was getting better.
9) Service During construction, approximately US $ 250 million will be spent on local goods and
services, this will benefit the local economy and society. No major projects will be carried out in the vicinity of the project, so the cumulative impact due to other project activities does not contribute significantly. At the operational stage, services and tourism will increase and will attract people to visit the area. With better availability of roads and power generation, the cumulative impact on services will be better, although perhaps insignificant.
10) Public health During construction, when a situation with a large number of workers entering the
community around the project, will increase disease, such as being sexually transmitted. Both residents and workers are at risk from exposure to new diseases. No major projects will be established around the project, and with mitigation to be carried out by the project related to public health, the cumulative impact will be relatively small. At the operation stage, the electric field and magnetism (EMF) caused by the transmission even though it would be safe for the community (based on WHO standards) would be a problem for some people. But with regular monitoring and communication, this problem will be solved. There is a cumulative impact on this issue.
OVERALL IMPACT The overall cumulative impact of this project will be controlled and the residual
impact can be tolerated
362
Draft Environmental and Social Impact Assessment (ESIA) 2020
CHAPTER 13. ENVIRONMENTAL AND SOCIAL MANAGEMENT PLAN
13.1 General
The Environmental and Social Management Plan (ESMP) for the Upper Cisokan
Hydroelectric Power Plant is the main tool for managing and mitigating impacts during the construction, inundation and operation of the Upper Cisokan Hydroelectric Power Plant and
supporting infrastructure such as access roads and transmission networks.
This section discusses management or mitigation efforts that can be carried out to minimize and prevent impacts that have been identified in the ESIA document in Chapter 10 (Construction Stage), Chapter 11 (Impoundment Stage) and Chapter 12 (Operational Stage).
Mitigation suggested in this section is detailed in the ESMP document (Environmental and Social Management Plan). There are a number of sub-plans to deliver specific environmental
and social management activities. The ESMP document will at least have details regarding the
following:
• Roles and responsibilities of parties involved in the project.
• Important environmental and social risks
• Mitigation, management and monitoring for all parts during the activity phase of the Upper Cisokan hydropower plant.
• Report responsibilities and methods
• ESMP updating process
The ESMP document will be made separate from this ESIA document. In addition, the LARAP
and SCMP (which includes the SEP, LMP, GRM, GAP, and GBVAP) will provided concrete guidance on mitigating specific risks identified during the project cycle.
13.2 Impact Mitigation Framework (Environmental and Social Management Plan)
Mitigation efforts are based on the results of an assessment (evaluation) of the impact of each parameter in environmental and social aspects. Significant impact results determine whether an impact needs to be mitigated or not. Mitigation is carried out for parameters that have moderate, major, and critical significance impact.
13.3 Environmental and Social Management Mitigation Construction Stage
13.3.1 River Habitat and Water Quality
Decreasing water quality and changing river habitats in the Cirumamis, Cirendeu and Cisokan rivers; especially with regard to increased levels of pollutants from domestic waste and suspended solids by domestic waste and erosion of land clearing.
Mitigation: 1. Reducing the discharge of sediment-laden water into water bodies directly without
treatment at the quarry, upper dam construction sites and lower dam construction sites.
363
Draft Environmental and Social Impact Assessment (ESIA) 2020
2. Reducing the disposal of domestic waste from unprocessed worker activities to the Cisokan, Cirumamis, and Cireundeu rivers.
3. Activities of clearing and clearing land are carried out systematically by observing the working principles in accordance with the established SOP.
4. Socialization of the domestic waste management program to the community by piloting domestic waste management, especially building communal or single toilets.
13.3.2 Erosion and Sedimentation
The decline in air quality is due to rock mining activities in the Gunungkarang quarry, andesite mining and construction activities of upper weirs, lower weirs and other facilities.
Mitigation:
1. Management of controls to reduce, capture and keep soil erosion to a minimum. 2. Diverts the river flow from the work area within the river, and minimizes the amount of
work in the river channel. 3. Do not intentionally dump material into waterways. 4. Promptly restore work-affected areas with suitable vegetation planting. 5. If possible, keep riparian vegetation close to water as a holding zone to help capture
sediment before it enters the water body.
13.3.3 Air Quality
Decreased air quality due to rock mining activities in Gunungkarang quarry, andesite mining and construction activities of upper weirs, lower weirs and other facilities
Mitigation:
1. Set a schedule for mining activities, vehicle mobilization, and land clearing activities. 2. Using tools, machines, and vehicles that are still roadworthy. 3. Closure of transport trucks to avoid spilled material along the road. 4. Perform regular watering on roads that will be traversed by material transportation from
the quarry to the activity location, especially roads near residential areas. 5. Concrete collection plants and dusty equipment should be located as far away from the
settlement as possible.
13.3.4 Noise
Increased noise at the site 1) Gunungkarang quarry due to mining, crushing and use of heavy vehicles, 2) along the main road from the quarry to the main construction site, 3) construction activities of the upper weir, lower weirs and other supporting facilities, 4) mobilization activities tools and materials in the construction of a SUTET 500 kV transmission line tower.
Mitigation:
1. Using a dampening barrier in the quarry environment of Gunungkarang 2. To socialize activities to the community 3. Turn off vehicles and equipment when not in use 4. Set the number and schedule of use of vehicles and heavy equipment. 5. Set the time for activities at locations close to the receptors, such as settlements, access
roads, and public infrastructure.
364
Draft Environmental and Social Impact Assessment (ESIA) 2020
13.3.5 Vibration
Increased noise at the site 1) Gunung karang quarry due to mining, crushing and use of heavy vehicles, 2) along the main road from the quarry to the main construction site, 3) construction activities of the upper weir, lower weirs and other supporting facilities, 4) mobilization activities tools and materials in the construction of a SUTET 500 kV transmission line tower.
Mitigation:
1. Carry out blasting activities at the Gunungkarang quarry in accordance with the established SOP.
2. Carry out the socialization of the affected communities 3. Set the operating time of all machines and vehicles that generate vibrations. 4. Use of a list of complaints and procedures for dealing with problems as they arise.
13.3.6 Biodiversity impacts from dam and access road
Detailed mitigation measures are presented in the BMP Action Plan 2020 document which was prepared as an update of the 2015 BMP Action Plan, showing that there are several mitigations that need to be carried out at the construction stage, including: 1. Reducing Fragmentation and Loss of Habitat
- BIA boundary marking is not only on the map but also needs to be made boundary markers at the BIA location.
- Extending the MoU and PKS between Perum Perhutani and PT. PLN (Persero) - The planting plan in Working Zone 2 and 3 is adjusted to the aim of improving the
quality of wildlife habitat and community proposals to meet the needs of life. - Implementation of land clearing SOP12 during the required work at BIA must be carried
out if there is still land clearing. - Repairs and maintenance are needed for features that will be used by wildlife, such as
tunnels and animal crossing bridges that have been built. - Perennial planting still needs to be done at landslide points along the access road,
including replanting at Km 13 to 22 if it is still needed - Planting trees for use by the people who live in the resettlements area - Shrubs and native trees planted for stabilization on steep slopes adjacent to roads
between km 22 and km 25. - Stabilize landfills, dam sides and around the main building by replanting - The management of UPK nurseries to meet demand (type, quantity, quality) of roads
and construction sites needs to be continued - Contractor landscape plan to be consistent with BMP still needs to be implemented.
2. Access Control - Establish guard posts on access roads and road checks near residential areas, such as in
Cipateungteung and Datarmala, as well as near protected forest areas such as Gowek, Japarana, and Curug Walet forests.
- Supervision of road inspections, protection of BIA and working zones from hunting, logging, etc. in cooperation with local land owners
- Maintain signs prohibiting unauthorized use of the road - Install and maintain signs for prohibiting hunting, trapping, and other activities that can
endanger protected wildlife, especially near BIA and the working zone - Community consultation on conservation, risk of encroachment, and overexploitation
of forest resources. 3. Fire Management
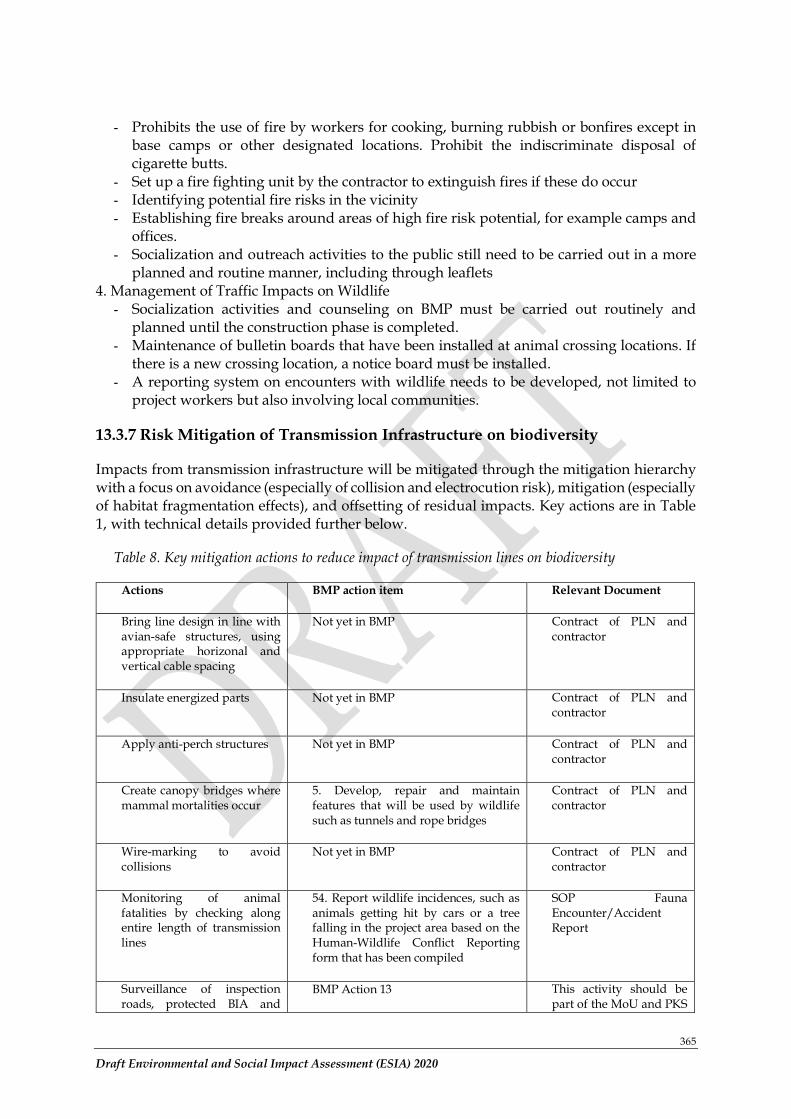
365
Draft Environmental and Social Impact Assessment (ESIA) 2020
- Prohibits the use of fire by workers for cooking, burning rubbish or bonfires except in base camps or other designated locations. Prohibit the indiscriminate disposal of cigarette butts.
- Set up a fire fighting unit by the contractor to extinguish fires if these do occur - Identifying potential fire risks in the vicinity - Establishing fire breaks around areas of high fire risk potential, for example camps and
offices. - Socialization and outreach activities to the public still need to be carried out in a more
planned and routine manner, including through leaflets 4. Management of Traffic Impacts on Wildlife
- Socialization activities and counseling on BMP must be carried out routinely and planned until the construction phase is completed.
- Maintenance of bulletin boards that have been installed at animal crossing locations. If there is a new crossing location, a notice board must be installed.
- A reporting system on encounters with wildlife needs to be developed, not limited to project workers but also involving local communities.
13.3.7 Risk Mitigation of Transmission Infrastructure on biodiversity
Impacts from transmission infrastructure will be mitigated through the mitigation hierarchy with a focus on avoidance (especially of collision and electrocution risk), mitigation (especially of habitat fragmentation effects), and offsetting of residual impacts. Key actions are in Table 1, with technical details provided further below.
Table 8. Key mitigation actions to reduce impact of transmission lines on biodiversity
Actions BMP action item Relevant Document
Bring line design in line with avian-safe structures, using appropriate horizonal and vertical cable spacing
Not yet in BMP Contract of PLN and contractor
Insulate energized parts Not yet in BMP Contract of PLN and contractor
Apply anti-perch structures Not yet in BMP Contract of PLN and contractor
Create canopy bridges where mammal mortalities occur
5. Develop, repair and maintain features that will be used by wildlife such as tunnels and rope bridges
Contract of PLN and contractor
Wire-marking to avoid collisions
Not yet in BMP Contract of PLN and contractor
Monitoring of animal fatalities by checking along entire length of transmission lines
54. Report wildlife incidences, such as animals getting hit by cars or a tree falling in the project area based on the Human-Wildlife Conflict Reporting form that has been compiled
SOP Fauna Encounter/Accident Report
Surveillance of inspection roads, protected BIA and
BMP Action 13 This activity should be part of the MoU and PKS
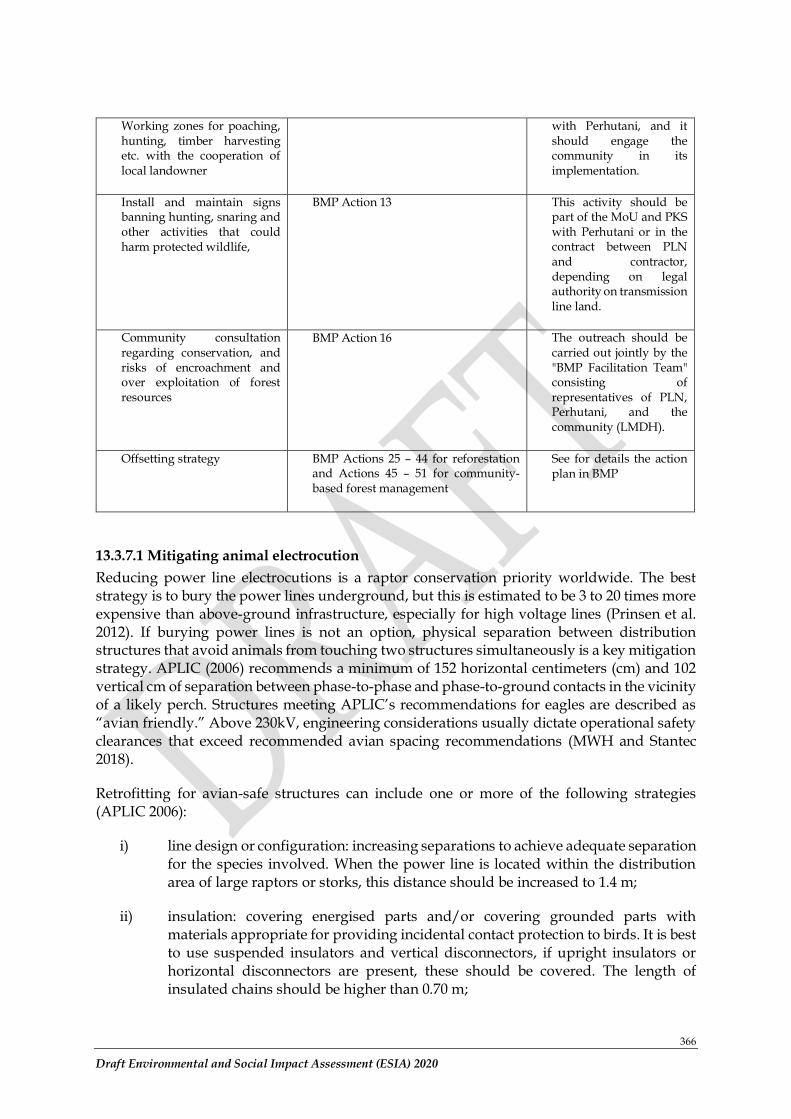
366
Draft Environmental and Social Impact Assessment (ESIA) 2020
Working zones for poaching, hunting, timber harvesting etc. with the cooperation of local landowner
with Perhutani, and it should engage the community in its implementation.
Install and maintain signs banning hunting, snaring and other activities that could harm protected wildlife,
BMP Action 13 This activity should be part of the MoU and PKS with Perhutani or in the contract between PLN and contractor, depending on legal authority on transmission line land.
Community consultation regarding conservation, and risks of encroachment and over exploitation of forest resources
BMP Action 16 The outreach should be carried out jointly by the "BMP Facilitation Team" consisting of representatives of PLN, Perhutani, and the community (LMDH).
Offsetting strategy BMP Actions 25 – 44 for reforestation and Actions 45 – 51 for community-based forest management
See for details the action plan in BMP
13.3.7.1 Mitigating animal electrocution
Reducing power line electrocutions is a raptor conservation priority worldwide. The best strategy is to bury the power lines underground, but this is estimated to be 3 to 20 times more expensive than above-ground infrastructure, especially for high voltage lines (Prinsen et al. 2012). If burying power lines is not an option, physical separation between distribution structures that avoid animals from touching two structures simultaneously is a key mitigation strategy. APLIC (2006) recommends a minimum of 152 horizontal centimeters (cm) and 102 vertical cm of separation between phase-to-phase and phase-to-ground contacts in the vicinity of a likely perch. Structures meeting APLIC’s recommendations for eagles are described as “avian friendly.” Above 230kV, engineering considerations usually dictate operational safety clearances that exceed recommended avian spacing recommendations (MWH and Stantec 2018).
Retrofitting for avian-safe structures can include one or more of the following strategies (APLIC 2006):
i) line design or configuration: increasing separations to achieve adequate separation for the species involved. When the power line is located within the distribution area of large raptors or storks, this distance should be increased to 1.4 m;
ii) insulation: covering energised parts and/or covering grounded parts with materials appropriate for providing incidental contact protection to birds. It is best to use suspended insulators and vertical disconnectors, if upright insulators or horizontal disconnectors are present, these should be covered. The length of insulated chains should be higher than 0.70 m;
367
Draft Environmental and Social Impact Assessment (ESIA) 2020
iii) applying perch management techniques.
Avian electrocution risk is lower for transmission structures than distribution poles because engineering requirements necessitate larger clearances (APLIC 2006). For transmission lines, APLIC (2006) recommends an additional 0.5 cm of separation for each additional 1kV over 60kV. Transmission line ratings reflect the phase-to-phase voltage differential; the phase-to-ground voltage differential is smaller. The phase-to-ground voltage can be calculated by dividing the line voltage by the square root of three (1.732), and should be used to determine the appropriate phase-to-ground clearance for transmission lines (MWH and Stantec 2018).
An additional key mitigation measure to prevent primate electrocution is permanent insulation of the wires (Lokschin et al. 2007). While this requires additional investment from the power company, it avoids expensive power outages when animal electrocution causes short-circuits. The following structures require different insulation measures (Prinsen et al. 2012):
• Terminal structures - All terminal structures should be constructed with sufficient insulation on jumper wires and surge arrestors;
• Strain structures (where jumpers are used) - At least two jumper wires should be suspended below the cross-arm, and the third jumper insulated. Alternatively all jumpers should be insulated;
• Take-off structures - Switches should be designed so that perching by birds on switch gear is unlikely, and/or all dangerous components are insulated. Switch gear should preferably be mounted below the cross-arm. Alternatively, insulated perch sites are installed way above the switch gear over the whole length;
• Intermediate structures with horizontal configuration of lines - Large enough to accommodate the wingspan (or ‘wrist-to-wrist’) of the largest perching bird species in the country if all three phases are above the cross-arm. Alternatively, two outer conductors should be suspended below cross-arm.
• Intermediate structures with vertical or ‘delta’ configuration of lines - Large enough to accommodate the ‘tip-of-toe to tip-of-beak or outstretched wing’ or ‘head-to-foot’ dimension of largest species present (leopard).
Anti-perch devises can be useful to prevent birds from perching and potentially getting electrocuted, but they need to be carefully positioned and shaped so that they do not force birds to perch even closer to energized parts. Alternatively, if many birds are attracted to the nesting opportunities provided by transmission towers, and removal of such nests is costly, the provision of artificial nests has shown to be a cost-effective way to reduce natural nests in Japan (natural nests decay quickly and can cause short circuits) (Shimbun 2017).
Furthermore, maintenance of natural canopy bridges, and the preparation of artificial canopy bridges over the roads and over or under electric power supply lines could further minimize mortality of primates and other arboreal mammals in forest patches (Lokschin et al. 2007, Al-Razi et al. 2019). This requires regular patrolling of transmission line routes to look for electrocuted animals and determine whether alternative crossing structures such as canopy bridges could guide animals away from transmission infrastructure. Community monitoring
368
Draft Environmental and Social Impact Assessment (ESIA) 2020
along powerlines further helps identify electrocution hotspots, so that mitigation measures (e.g., arboreal bridges) can be spatially targeted (Lokschin et al. 2007).
13.3.7.2 Mitigation of bird collision
Although different bird species fly at different heights above the ground, there is general consensus that the lower power line cables are to the ground, the better for preventing bird collision. There is also consensus that less vertical separation of cables is preferred as it poses less of an ‘obstacle’ for birds to collide with (Figure 2). Horizontal separation of conductors is therefore preferred (Prinsen et al. 2012).
The most frequently used measure is wire-marking, which alerts birds to the presence of power lines and provides them with more time to avoid the collision (Janss 2000). Since the assumption is that birds collide with overhead cables because they cannot see them, fitting the cables with devices to make them more visible to birds in flight has become the preferred mitigation option worldwide. Besides thickening, coating or colouring the often least visible thin ground wires, a wide range of potential ‘line marking’ devices has evolved over the years, including: spheres, swinging plates, spiral vibration dampers, strips, bird flappers, aerial marker spheres, ribbons, tapes, flags, fishing floats, aviation balls and crossed bands. There is generally a lack of quality evaluative research of the effectiveness of these devices at the international level, the evidence to date suggests generally positive results (Prinsen et al. 2012). Jenkins et al. (2010) conclude that, barring some notable exceptions, “any sufficiently large form of marker (which thickens the appearance of the line at that point by at least 20 cm, over a length of at least 10-20 cm), placed with sufficient regularity (at least every 5-10 m) on either the ground wires (preferably) or the conductors, is likely to lower general collision rates by 50-80%”. Barrientos et al. (2011), reviewing 21 wire-marking studies, similarly conclude that wire marking reduced bird mortality by 55-94%.
13.3.7.3 Mitigating habitat loss and fragmentation from transmission line
The key mitigation strategies to compensate the direct and indirect impacts to Critical Habitats are to:
1. Provide mitigation strategies that reduce impacts from forest fragmentation, unauthorized and illegal land clearing away from the road, and illegal hunting.
2. Offset the areas directly and indirectly affected by transmission line infrastructure to ensure net gain for the habitat of Critically Endangered species, following ESS6.
Where the transmission line passes through Perhutani land, the collaboration between PLN and Perhutani through the renewed PKS should ensure that Perhutani as the legal authority for these forest areas implements actions that prevent illegal logging and hunting, including the placement of sign post, patrolling of forest edges and areas, community outreach, and law enforcement.
5. Where Critical Habitat is lost, this will be offset through the landscape-level reforestation program in the UCPS landscape, under the working agreement (PKS) between PLN and Perhutani for reforestation in working zones 1, 2, 3 and 4.
13.3.8 Access to water sources in Quarry Gunungkarang
The loss of water sources in the Gunungkarang quarry due to andesite mining activities.
369
Draft Environmental and Social Impact Assessment (ESIA) 2020
Mitigation:
Provision of clean water through drilling wells or other communal water supply models (embung) for the communities around the Gunungkarang quarry.
13.3.9 Process and Impact of Resettlement
The impact arising from the resettlement process and supporting facilities at Kp. Cangkuang, Bojongsalam Village, Jolok Block, Cicadas Village, Kp. Pasirlaja Sukaresmi Village, Santik Block, Bojongsalam Village and Pasirjegud Kp. Tapos Sukaresmi Village.
The LARAP Implementation Review (2021) found that post-resettlement housing conditions, it was found that 66% of the households that had relocated already owned their residential land. The results of the pre-and post-resettlement condition assessment survey show that households have increased the area of residential land and building area indicates better living conditions, especially for respondents affected by inundation who have moved. Most PAPs have larger buildings than before resettlement. The PAPs have also benefited from the construction of new roads, and livelihood restoration/economic recovery program has improved and livelihood opportunities.
Mitigation:
Monitoring and evaluating whether the construction process at the resettlement site is in accordance with the plan. The project will look to improve LARAP management finalize PAP relocation and rehabilitation, improve stakeholder engagement (especially for women), establish the GRM, and complete its commitments towards improving community infrastructure. Further details are provided in the LARAP IR.
13.3.10 Livelihood Change
There was a slight shift in the livelihood for a number of residents during construction activities.
Mitigation: 1. Involving local workers in project implementation especially for affected communities. 2. Use of cooperatives and monitoring so that they can run well
13.3.11 Risk of Labor from Outside the Project Area (Labor Influx)
Workers from outside the project area such as contract workers will come to the project area so that it can have an impact on the community, especially in community social activities during the construction process. The table below summarizes the key labor risk and mitigation measures covered in the LMP. Further details on gender impacts from labor influx and mitigation measures can be found in the GAP and GBVAP in the SCMP.
Mitigation: 1. Control over worker behavior 2. Implement camp management for workers 3. Develop a workforce recruitment system starting from the number of labor requirements,
the required criteria, the transparency of the admissions pathway and the form of employee acceptance tests.
Key Labor Risk Assessment and Mitigation Measures
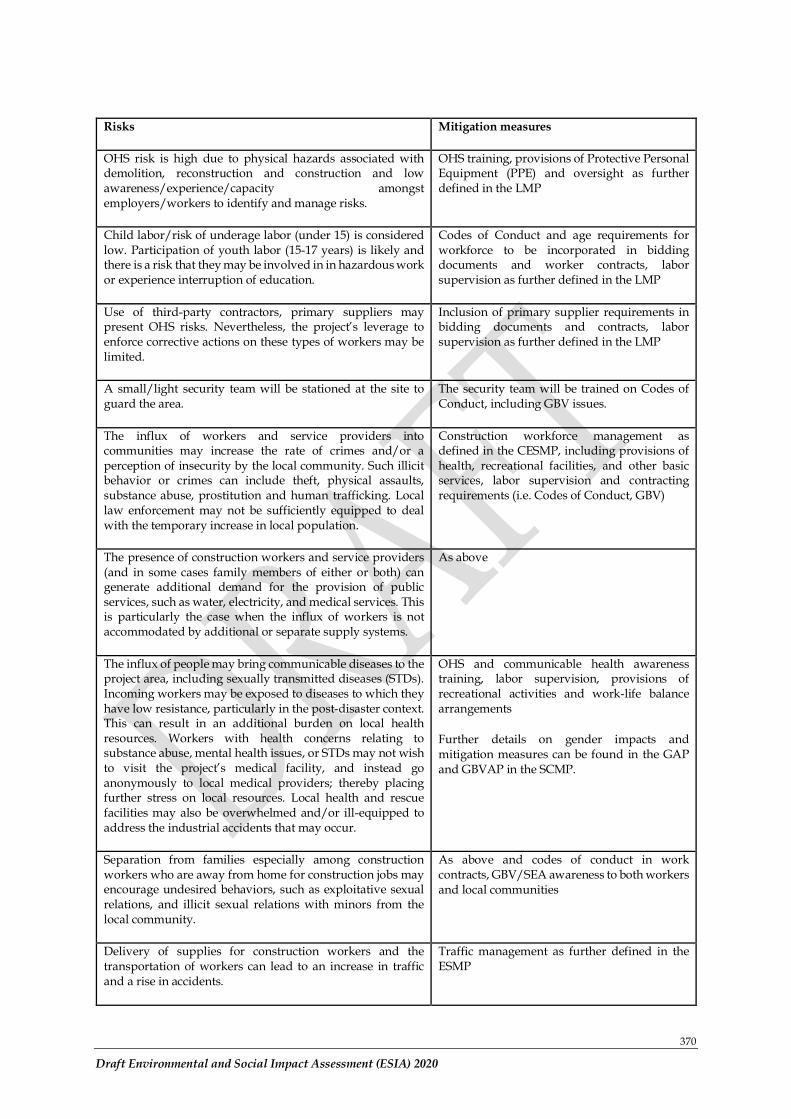
370
Draft Environmental and Social Impact Assessment (ESIA) 2020
Risks Mitigation measures
OHS risk is high due to physical hazards associated with demolition, reconstruction and construction and low awareness/experience/capacity amongst employers/workers to identify and manage risks.
OHS training, provisions of Protective Personal Equipment (PPE) and oversight as further defined in the LMP
Child labor/risk of underage labor (under 15) is considered low. Participation of youth labor (15-17 years) is likely and there is a risk that they may be involved in in hazardous work or experience interruption of education.
Codes of Conduct and age requirements for workforce to be incorporated in bidding documents and worker contracts, labor supervision as further defined in the LMP
Use of third-party contractors, primary suppliers may present OHS risks. Nevertheless, the project’s leverage to enforce corrective actions on these types of workers may be limited.
Inclusion of primary supplier requirements in bidding documents and contracts, labor supervision as further defined in the LMP
A small/light security team will be stationed at the site to guard the area.
The security team will be trained on Codes of Conduct, including GBV issues.
The influx of workers and service providers into communities may increase the rate of crimes and/or a perception of insecurity by the local community. Such illicit behavior or crimes can include theft, physical assaults, substance abuse, prostitution and human trafficking. Local law enforcement may not be sufficiently equipped to deal with the temporary increase in local population.
Construction workforce management as defined in the CESMP, including provisions of health, recreational facilities, and other basic services, labor supervision and contracting requirements (i.e. Codes of Conduct, GBV)
The presence of construction workers and service providers (and in some cases family members of either or both) can generate additional demand for the provision of public services, such as water, electricity, and medical services. This is particularly the case when the influx of workers is not accommodated by additional or separate supply systems.
As above
The influx of people may bring communicable diseases to the project area, including sexually transmitted diseases (STDs). Incoming workers may be exposed to diseases to which they have low resistance, particularly in the post-disaster context. This can result in an additional burden on local health resources. Workers with health concerns relating to substance abuse, mental health issues, or STDs may not wish to visit the project’s medical facility, and instead go anonymously to local medical providers; thereby placing further stress on local resources. Local health and rescue facilities may also be overwhelmed and/or ill-equipped to address the industrial accidents that may occur.
OHS and communicable health awareness training, labor supervision, provisions of recreational activities and work-life balance arrangements
Further details on gender impacts and mitigation measures can be found in the GAP and GBVAP in the SCMP.
Separation from families especially among construction workers who are away from home for construction jobs may encourage undesired behaviors, such as exploitative sexual relations, and illicit sexual relations with minors from the local community.
As above and codes of conduct in work contracts, GBV/SEA awareness to both workers and local communities
Delivery of supplies for construction workers and the transportation of workers can lead to an increase in traffic and a rise in accidents.
Traffic management as further defined in the ESMP
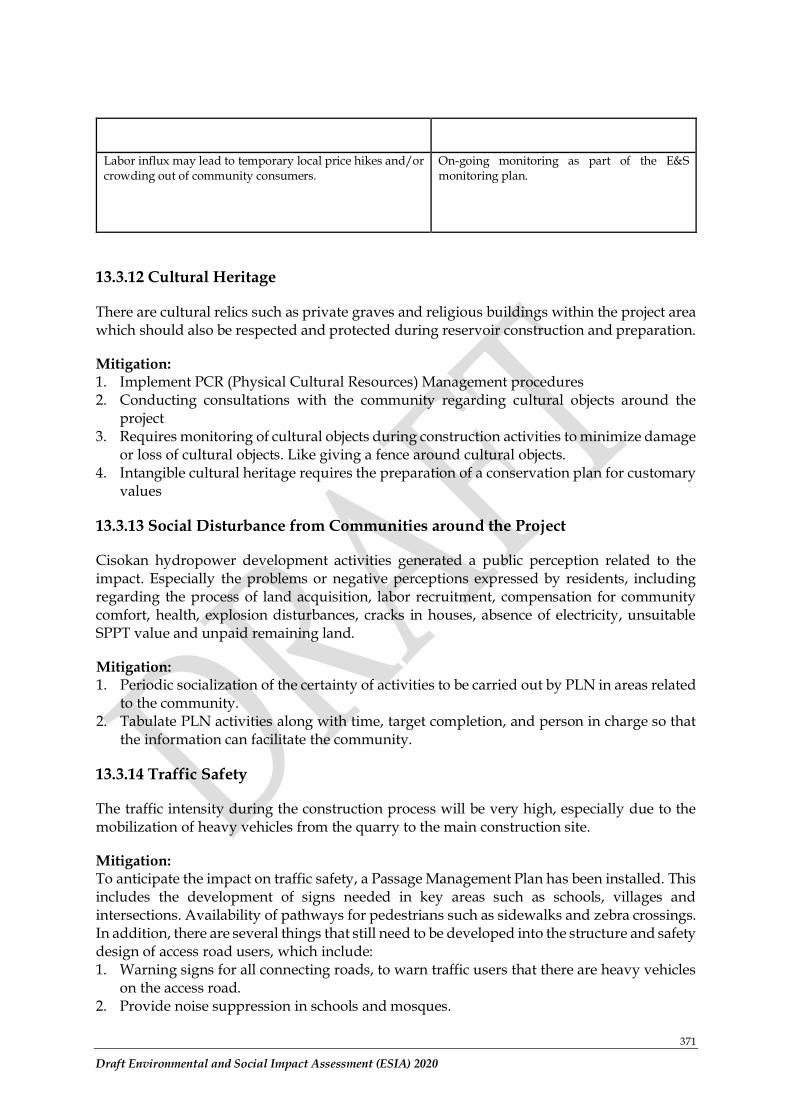
371
Draft Environmental and Social Impact Assessment (ESIA) 2020
Labor influx may lead to temporary local price hikes and/or crowding out of community consumers.
On-going monitoring as part of the E&S monitoring plan.
13.3.12 Cultural Heritage
There are cultural relics such as private graves and religious buildings within the project area which should also be respected and protected during reservoir construction and preparation.
Mitigation: 1. Implement PCR (Physical Cultural Resources) Management procedures 2. Conducting consultations with the community regarding cultural objects around the
project 3. Requires monitoring of cultural objects during construction activities to minimize damage
or loss of cultural objects. Like giving a fence around cultural objects. 4. Intangible cultural heritage requires the preparation of a conservation plan for customary
values
13.3.13 Social Disturbance from Communities around the Project
Cisokan hydropower development activities generated a public perception related to the impact. Especially the problems or negative perceptions expressed by residents, including regarding the process of land acquisition, labor recruitment, compensation for community comfort, health, explosion disturbances, cracks in houses, absence of electricity, unsuitable SPPT value and unpaid remaining land.
Mitigation: 1. Periodic socialization of the certainty of activities to be carried out by PLN in areas related
to the community. 2. Tabulate PLN activities along with time, target completion, and person in charge so that
the information can facilitate the community.
13.3.14 Traffic Safety
The traffic intensity during the construction process will be very high, especially due to the mobilization of heavy vehicles from the quarry to the main construction site.
Mitigation: To anticipate the impact on traffic safety, a Passage Management Plan has been installed. This includes the development of signs needed in key areas such as schools, villages and intersections. Availability of pathways for pedestrians such as sidewalks and zebra crossings. In addition, there are several things that still need to be developed into the structure and safety design of access road users, which include: 1. Warning signs for all connecting roads, to warn traffic users that there are heavy vehicles
on the access road. 2. Provide noise suppression in schools and mosques.
372
Draft Environmental and Social Impact Assessment (ESIA) 2020
3. Ensure adequate road turns for heavy vehicles and increase visibility at turns and intersections by installing mirrors.
Traffic management will be a major part of the Construction Management Plan and the Workers' Barracks / Basecamp. Heavy vehicle traffic cannot be reduced, but still manageable. Management options include: 1. Limit construction vehicle traffic during the hours that children travel to and from school,
and provide traffic management to direct traffic during these hours. 2. Prohibit heavy vehicle traffic after dark. 3. Very large / heavy vehicles require an escort vehicle. 4. Signs for access roads and displays safety signs along these roads at fixed intervals. 5. Outreach programs for students and the community. 6. To inform the public about regular traffic movements. 7. Driver outreach program. 8. Carry out the recording of complaints and plans for their implementation.
Consideration of road design, heavy traffic restrictions and management, and extension programs, which will contribute to safer roads, minimizing potential risks to road users.
13.3.15 Work at Height Accident
In order to reduce the impact of work accidents on jobs at high locations, several things must be considered.
Mitigation: 1. The use of personal protective equipment and work equipment must meet the safety
standards for working at a height. 2. Check / supervise the completeness of the equipment before working at a height. The detailed environmental and social management and monitoring plans during the construction and phase will be documented in the ESMP document.
13.4 Environmental and Social Management Mitigation Inundation Stage
13.4.1 Changes in River Habitat, and Biodiversity
Changes in river habitat and biodiversity due to damming of river flow.
Mitigation:
1. Change in flow rates from bottom outlets periodically to reflect naturally fluctuating river flows, and to delay the start of filling until new watercourses or rainy season floods have passed, this gives the fish time to start the breeding process.
2. Avoid 'flat lining' of the Cisokan River flow by constant minimum flow flow, the upper dam bottom valve which will be regulated periodically (for at least 10-14 days, and if possible along with new flows or floods), to increase discharge to maximum capacity 0.96 m3/s outlet for periods lasting at least two days. This will "flush" the river, and minimize the risk of drying out the riparian habitat or the formation of algae growth. This water will
373
Draft Environmental and Social Impact Assessment (ESIA) 2020
be collected in the lower reservoir so that there is no reduction of water in the Pumped Storage system by this flow regulation.
3. Open the bottom outlet of the lower reservoir periodically (at least 10 - 14 days and if possible in conjunction with new flows or flooding) to increase discharge to a maximum outlet capacity of 13 m3 / s, during a period lasting at least one day, to 'refresh' river.
4. Monitoring the quality of water, fish and river habitats will be carried out before filling and during filling to determine the impact and changes to the residual flow rate if needed.
5. Flow management, water quality monitoring and habitat during inundation will be documented in the detailed Operational Environmental Management Plan. With these efforts, the potential impacts on river biodiversity can be minimized.
13.4.2 Erosion and Sedimentation in Upper Dam and Lower Dam
Erosion and Sedimentation in Upper Dam and Lower Dam resulting from inundation processes.
Mitigation: Clearing the soil surface and strengthening receding land with vegetation in the inundated area before the inundation process is carried out.
13.4.3 Downstream Users of the Cisokan River
The potential for reduced water flow flowing to downstream users from the lower dam.
Mitigation: the inundation process is carried out in accordance with the established SOP
13.4.4 Community Connectivity (Bridge Access)
The bridge that passes through the lower reservoir (near the jolok block resettlement and gunung batu), if the connecting bridge between the jolok block resettlement to the margaluyu village (Cianjur Regency) is submerged, the community only has an access road to Rongga District so that access to Cianjur Regency takes a longer distance
Mitigation: Construction of alternative road access or replacement bridges
13.5 Environmental and Social Management Mitigation Operational Stage
13.5.1 River Habitat
Changes in river habitats in the upper dam inundation areas increase the quality of water bodies due to the self-purification process, thereby increasing the quality of the habitat for aquatic biota.
Mitigation: Implementation of the adaptive management program in the Biodiversity Management Plan and monitoring of biodiversity before and after the Upper Cisokan hydropower plant operates, along sections of the Cisokan river and tributaries.
374
Draft Environmental and Social Impact Assessment (ESIA) 2020
13.5.2 Revegetation in The Buffer Area
Changes in the microclimate in the buffer zone and a reduction in the potential for sedimentation resulting from the area around inundation
Mitigation: Monitoring and evaluating the implementation of buffer zone revegetation activities in accordance with the expected objectives
13.5.3 Hydrology, River Flow Discharge, and Water Availability for UCPS Downstream Users
Changes in discharge patterns and flood frequency in the downstream UCPS area
Mitigation: 1. Ensure procedures for the implementation of consultations with downstream users
regarding changes in flow to downstream areas are carried out. 2. Coordinating with the Cisokan Weir Manager (Cisuru Weir) to regulate the water
discharge that will be used for UCPS operations and the water needs of the Cihea irrigation area, especially at minimum discharge.
3. Monitor the upstream discharge of the Upper Cisokan Hydroelectric Power Plant (on the Cirumamis and Cisokan Rivers) and the water levels in both reservoirs continuously. Monitoring stations should be installed as quickly as possible to keep data records as long as possible.
4. Use daily water flow monitoring data to adjust the operation of bottom outlet valves on both dams so that the outflow equals the inflow, minus the water that is stored to replace evaporated water.
5. Use water for the lower reservoir to the top of the upper reservoir during times of low flow, to ensure that the natural flow regime (where inlet discharge equals outflow) is maintained by flowing downstream to the upper dam at all times.
6. Provides a minimum flow from the lower dam of 0.2m3 / s, to an alternative flow corresponding to the river ecosystem and flow regime defined from the new monitoring station.
7. Survey of low-flow conditions of the Cirumamis and Cisokan Rivers, to understand the potential impact of biodiversity on further reduction of wetlands during the dry season. Consider monitoring results to set the minimum future flow.
8. Operate emergency flood procedures to minimize downstream risks. 9. Providing education to downstream users regarding the potential for reducing the
amount of flood flow, flood emergency procedures, and regarding low flow conditions.
13.5.4 Erosion and Sedimentation
The increase in the amount of sedimentation in the UCPS reservoir is due to the potential for erosion in the reservoir area and erosion that comes from changes in land use in the Cisokan watershed.
Mitigation: 1. Monitoring locations that are identified as landslide zones and unstable slopes in the
reservoir area. If possible, it is necessary to strengthen the vulnerable zone.
375
Draft Environmental and Social Impact Assessment (ESIA) 2020
2. Measuring the amount of sedimentation in the two UCPS reservoirs periodically as a material to carry out mitigation actions during operations.
3. Revegetating the predefined buffer zones.
13.5.5 River Water Quality
Decreasing water quality and changing river habitat in the Cisokan river; especially with respect to increased levels of contaminants from domestic waste and suspended solids.
Mitigation: 1. Clearing of vegetation, removing pollutants and other reservoir preparation activities 2. Stabilization of potential landslides prior to inundation to minimize sediment contribution 3. Replant secondary forest in greenbelt areas, reducing the potential and impact of
discharges from settlements and agriculture along the coast of each reservoir. 4. Constant inflow and outflow of water through both reservoirs, reducing water quality
problems associated with stagnant water. 5. Prohibition of fishing activities in the reservoir, eliminating nutrients due to leftover fish
feed so that water quality problems get better. 6. The daily displacement of water from the upper and lower reservoirs will lead to aeration
of water, reduce storage time and prevent oxygen and temperature stratification in both reservoirs.
7. Regulations regarding sanitation, reducing (at least in the short term) the human population in the watershed and reducing the use of rivers for toilets result in reduced waste of fecal coliforms, E coli and metals such as zinc and copper.
13.5.6 Land Use Changes in Transmission Line 500 kV
Changes in land use in the corridor of the 500kV Transmission line that were constructed have led to changes in surface runoff, erosion-sedimentation, changes in food reserves, feed supply and timber potential.
Mitigation: Changes in land use in the corridor of the 500kV SUTET line that were constructed have led to changes in surface runoff, erosion-sedimentation, changes in food reserves, feed supply and timber potential.
13.5.7 Impact of Transmission Line on Public Perception
The public is worried about the impact that will be caused by the existence of the Sutet and the cable network between the routes.
Mitigation: Conducting intensive outreach to the public regarding the extent of the impact caused by the Transmission Line
13.5.8 Electric and Magnetic Fields (EMF) of the Transmission Line
There is a potential impact on people living or working near the transmission network in the form of the impact of electric and magnetic fields from the transmission network, which can have an impact on health or damage to electrical equipment
376
Draft Environmental and Social Impact Assessment (ESIA) 2020
Mitigation: 1. Education is needed to the public about the impact of transmission lines on health.
2. Check the amount of electromagnetic radiation regularly along the transmission line.
13.5.9 Biodiversity Mitigation
PT. PLN has prepared a biodiversity management plan, the Biodiversity Management Plan (BMP), to manage the direct and indirect impacts of the Cisokan hydropower project on the condition of biodiversity and for the maintenance of project-affected areas. Integrated management of biodiversity in areas known as Restoration Areas which include 15 Biodiversity Important Areas (BIAs), six corridors and buffer zones. The establishment of a restoration area will have an impact on the livelihoods of the local population due to restricted access. Therefore, an agreement must be made as a 'middle way' to compromise biodiversity conservation efforts with controlled access for local people to support their livelihoods.
The BMP document provides practical guidance in several ways including reducing threats to biodiversity, managing identified risks, involving communities and stakeholders, organizing related institutions that aim to manage restoration areas collaboratively, and to support pro-actively the development of knowledge about conservation of biodiversity.
The objectives of the BMP are as follows: a. To protect and enhance the remaining forest communities (both in terms of habitat and
wildlife) so as to form an independent ecosystem. b. To protect and increase the population of endangered and endangered species so that they
can survive and be independent. c. To take into account ongoing threats to biodiversity conservation emanating from
communities and village development in the selection and implementation of conservation strategies.
d. To form a common understanding among stakeholders and local communities about the value of biodiversity and the threats that accompany it.
e. To provide controlled access for local people to use resources sustainably in certain restoration areas based on a precautionary approach.
Based on the BMP Action Plan, there are five aspects that need to be considered by PT PLN, and each of these aspects has several programs that need to be carried out by PT PLN in collaboration with related stakeholders. a. The direct impacts associated with the construction process will be reduced and managed
by: • Defining Biodiversity Important Areas (BIAs), corridors and buffer areas as restoration
areas either within or adjacent to the project site, and reducing disturbance to these areas.
• Protect the restoration area from poaching and illegal extraction. • Perform reforestation of disturbed areas in the project site and restoration areas. • Educating local communities about biodiversity conservation initiatives begins by
forming a common understanding between stakeholders and local communities about the value of biodiversity and the threats that accompany it.
b. Afforestation and forest management will be carried out by: • Revegetating the restoration area using suitable plant species as recommended in the
BMP Action Plan.
377
Draft Environmental and Social Impact Assessment (ESIA) 2020
• Ensuring the availability of sufficient plants, including the suitability of species / varieties in the nursery managed by the local community.
• Build agroforestry systems for local income • Protect remaining wildlife habitats through habitat improvement and species
enrichment, including improving ecological connectivity between forest patches and other ecosystem functions.
• Protect forest areas from various encroachment, illegal logging, and illegal hunting. • Develop mechanisms and designs to incorporate the benefits that people get from
forest management. c. Wildlife management will be carried out by:
• Ensure that wildlife with the status of rare, endangered and other protected animals can survive and / or can increase their population size by reducing direct or indirect threats through prevention and mitigation of habitat destruction, preventing disturbance and death of wild animals, and poaching.
• Prevent (reduce) conflicts between humans and wildlife due to the use of shared resources (food sources) and predation of livestock owned by local residents by wildlife.
d. Stakeholder participation will be carried out and managed by: • Increase knowledge, awareness, and participation of local stakeholders in the
management of Cisokan Hulu, including biodiversity conservation activities. • Improve coordination and cooperation between PLN internal and between PLN,
Perhutani, the local government, and local communities related to ICM. • Harmonize the activities of the various parties (PLN, Perhutani, and local
communities) taking place in project-affected areas to optimize the protection of wildlife and their habitats as well as the livelihoods of local residents.
• Seek political support with the aim of obtaining funding and resources which can then be allocated to finance the management of Upper Cisokan.
e. Community participation will be carried out and managed by: • Involve the local community to ensure that they can be fully involved in the
management planning of Upper Cisokan and benefit from the development of the area.
• Integrate the BMP into resettlement planning and highlight potential opportunities for resettlement areas to contribute to reforestation efforts and to achieve more successful and sustainable livelihood restoration programs.
• Ensure that any livelihoods negatively impacted by BMP activities will be handled by the World Bank under the World Bank safeguard policies OP4.12 Involuntary Resettlement (World Bank Safeguard Policy OP4.12 Involuntary Resettlement).
• Increase activities that can generate income for local communities in accordance with the conservation of biodiversity in the restoration area and management of Cisokan Hulu in general.
Increase the sustainability of land use managed by Perum Perhutani through sustainable land cultivation by local communities. Based on the results of the review and gap analysis on the implementation of the BMP action plan, general recommendations for improving the implementation of the BMP action plan in the future are as follows: 1. Implementation of the BMP action plan needs to be carried out based on a priority scale
according to the pre-construction, construction and operational phases.
378
Draft Environmental and Social Impact Assessment (ESIA) 2020
2. Extension (and revision if necessary) the MoU between PT. PLN (Persero) and Perum Perhutani need to be carried out immediately so that revegetation activities in working zones 1, 2, and 3 can be carried out in accordance with the BMP action plan.
3. It is necessary to strengthen institutions and governance that are responsible for implementing the BMP action plan and the necessary resources.
4. Planning for revegetation programs along with targets (number of seeds needed, successful growth, types of plants, location of planting) needs to be made more systematically with more attention to recommendations (updated) BMP action plan.
5. Revegetation and reforestation programs need to be structured in a more planned and systematic manner starting from nurseries and seedlings maintenance, planting and maintenance in the field, monitoring and evaluation of planting activities. The community is empowered as a provider of seeds, apart from planting and maintaining plants.
6. Community empowerment in monitoring activities against the emergence of disturbances in reforestation and revegetation areas as well as in efforts to prevent and control forest and land fires.
7. It is necessary to establish a reporting system in case of incidents involving wild animals (traffic accidents, exposure to electricity, poaching) and encounters with wild animals.
8. It is necessary to develop the principle of benefits for the local community in relation to the existence of working zones 1, 2 and 3 with the principle of sustainable use of local natural resources. For example, through the development of agroforestry systems.
9. It is necessary to evaluate the placement and design of artificial corridor features / infrastructure, particularly rope bridges.
10. It is necessary to conduct socialization and counseling with BBKSDA periodically in order to protect the existence of endangered and protected wild animals along with law enforcement for those involved in hunting and / or trafficking of rare and protected wild animals illegally.
11. Increasing the capacity of work units with adequate resources that specifically manage water catchment areas and restoration areas.
12. The formation of a multistakeholder coordinating body needs to be initiated at the relevant Ministry level (BUMN, KLHK, ESDM) to coordinate the handling of various problems that occur whose scope is outside the authority of PT. PLN (Persero) and Perum Perhutani.
13. Build cross-sectoral collaborative networks in order to find alternative sources of funding for environmental management (biodiversity conservation, community capacity building, and local economic development) in the UCPS Hydroelectric Area.
14. Awareness, education, and information programs need to be structured in a planned, systematic and routine manner. For this reason, the work unit that is specifically responsible for implementing the program needs to be re-established within PT. PLN (Persero).
15. The BMP action plan needs to be firmly integrated into the resettlement plan document. 16. The community economic recovery program, especially those affected by the construction
of the UCPS hydropower plant, needs to be carried out in a planned manner with measurable targets. The priority of local economic development is directed at developing production systems based on local natural resources, such as agroforestry and natural tourism. Sources of funding other than outside PT. PLN (Persero) needs to be explored, including through the CSR (Corporate Social Responsibility) scheme of companies located in the administrative area of West Bandung Regency, Cianjur Regency and West Java Province.
379
Draft Environmental and Social Impact Assessment (ESIA) 2020
CHAPTER 14. CONCLUSION The Upper Cisokan hydropower project is designed to meet the peak load needs of the Java-Bali grid electricity system. The construction of this hydropower plant has a number of advantages to the Java-Bali network, including:
• Reduced dependence on expensive petroleum to meet demand during peak loads.
• Ability to use base load energy efficiently, during low loads.
• Providing assistance in controlling the load frequency of Cirata hydropower; so that it can be operated more efficiently.
• Provides a backup that can be operated immediately in the event of a failure of one of the generators or disruption of the transmission line.
Several ANDAL and EIA studies have been completed since project commencement. The ESIA report has compiled the results of the ANDAL, EIA studies and several technical studies completed in 2009, 2011, 2013 to 2019. An integrated Environmental Management Plan has been planned to manage mitigation efforts during the construction, inundation and operation phases of the Upper Cisokan Hydroelectric Power Plant. LARAP will discuss specific social impacts related to resettlement and compensation. It is considered that if these measures can be implemented then the negative impacts of the project can be minimized. The measures outlined in the ES IA, ESMP, BMP and LARAP ensure that development can be implemented and provide benefits to the Java-Bali power network. The project has also prepared the SCMP (includes the SEP, LMP, GRM, GAP, and GBVAP), which provided concrete guidance on mitigating stakeholder engagement, labour and gender risks during the project cycle.
Conclusion The following Upper Cisokan Hydroelectric Power Plant can be made, by looking at the Upper Cisokan hydropower design, environmental sensitivity, the needs of the surrounding community and the predicted impacts and mitigation efforts.
14.1 Resettlement
There will be inundation or control over an area of approximately ±310.14 Ha, which will include housing, settlements, graves, productive land, agriculture, fish ponds and other small businesses. Approximately 1,549 households were affected by the project. The resettlement process or other social impact or compensation issues will be managed through the Land Acquisition and Resettlement Plan (LARAP).
14.2 Socio-Economic Benefits and Development Impact on Society
Construction of the UCPS project, which includes the reservoir, its associated transmission line, and access roads, will have a transformative impact on the local community. Socio-economic benefits include cheaper peak load-bearing electricity and other efficiencies to the Java-Bali network, construction of new roads and bridges that will facilitate access to remote hamlets and villages; and local economic benefits during the construction stage (availability of jobs and service activities).
380
Draft Environmental and Social Impact Assessment (ESIA) 2020
During construction activities, 1,500 workers will enter the project work area which can have an impact on the lives of rural communities in the activity location and its surroundings. Local communities will benefit from direct project-related jobs and indirect supporting services/business opportunities catering to the workforce. The project has outlined various plans to manage the social impacts including gender gaps, worker behavior, and associated risks in the SCMP. Other initiatives by the project include livelihood support and improving local community infrastructure.
The project will also seek to mitigate gender risks (including GBV) and address gender gaps in the community through improving stakeholder outreach, engaging local women’s groups to raise awareness and participation for project economic empowerment programs, including livelihood/business training, and various GBV awareness and training initiatives.
Other aspects such as indigenous peoples (ESS7) is not triggered, and social impacts on downstream users is minimal throughout the construction cycle with insignificant impact on irrigation and fishing. Procedures for the implementation of consultations with downstream users regarding changes in flow to downstream areas will be carried out. Overall, the project will result in more reliable flow pattern an improved water quality.
14.3 Biodiversity Impacts
Protected species and remaining natural forest are at risk of being threatened due to construction activities and changes to surrounding land use. Further information required regarding habitat availability, home ranges and sustainability of forests and populations of protected species and a Biodiversity Management Plan will be followed to find the best management options based on the results of further investigations. The goal of green belt restoration is to provide additional habitat for threatened species.
14.4 Environmental Impacts in Rivers Downstream of the Dam
During construction, sediment discharge will result in poor water quality and flow patterns. This will continue during the construction period, and may result in sedimentation and/or reduced clarity of river water. Erosion, sediment management systems, and workbeds control and other discharge controls will prevent potential impacts as far as is practicable and will be described in ESMP.
During inundation, the hydrological conditions of the Cirumamis and Cisokan Rivers will be temporarily affected, during the process of collecting water to fill the reservoir. Based on the estimated average conditions, and looking at the minimum discharge flow, the Upper Cisokan Hydroelectric Power Plant will fill the reservoir in ±92 days. Minimum flow will be released from both dams to maintain ecosystem flow. To minimize potential impacts on downstream river users, filling will be carried out during the rainy season.
During operation, there should only be minor changes in the hydrological state downstream of the two dams, because the Upper Cisokan Pumped Storage Hydroelectric Power Plant does not have the capacity to store water or reduce the existing flow. The flow that enters the Cisokan hydropower reservoir will be immediately flowed out as much as the incoming discharge, to maintain the active storage this hydropower needs. This will be part of a standard operating procedure, which is to use bottom valves and spillways to discharge
381
Draft Environmental and Social Impact Assessment (ESIA) 2020
water. There will be a slight reduction in peak flooding, and there will be refreshment of the river with water flow during the dry season. During the low discharge period, a minimum discharge of 0.5 m2/s will be flowed from each dam, which will have an impact on the hydropower losing water storage until the time of incoming water discharge is higher.
Changes in erosion and sediment patterns are predicted to occur downstream of the Cisokan River during operations, due to reduced sediment loads. There are some alternative of energy dissipator in dam construction to minimizing the riverbank erosion.
14.5 Security and Reservoir Management
The tides of the upper reservoir when operating fluctuate daily as high as 19 m and the lower reservoir fluctuates as high as 4.5 m. With these fluctuations, the reservoir is not safe for use by the community, or for commercial businesses such as aquaculture. People are prohibited from entering the reservoir and greenbelt areas to protect their safety from drowning. Warning alarms will be issued prior to generation or pumping, to warn of changes in reservoir water levels. The greenbelt will be restored with local vegetation to provide habitat for wild animals and will not be allowed for settlement or for agricultural activities.
382
Draft Environmental and Social Impact Assessment (ESIA) 2020
CLOSING
This is the Final Report of the Environmental and Social Impact Analysis for the 2020 UCPS 1,040 MW Hydroelectric Power Plant Project. Hopefully this report can provide a complete and comprehensive picture of environmental and social conditions to facilitate planning and impact analysis during the construction and operation of the hydropower plant.
Jatinangor, November 2020
Faculty of Agroindustrial Technology– UNPAD
(Dr. Ir. Edy Suryadi, MT.)
Dean
383
Draft Environmental and Social Impact Assessment (ESIA) 2020
REFERENCE
Aiama, D., S. Edwards, G. Bos, J. Ekstrom, L. Krueger, F. Quétier, C. Savy, B. Semroc, M. Sneary, and L. Bennun. 2015. No Net Loss and Net Positive Impact Approaches for Biodiversity. Exploring the potential application of these approaches in the commercial agriculture and forestry sectors. IUCN, Gland, Switzerland.
Al-Razi, H., M. Maria, and S. B. Muzaffar. 2019. Mortality of primates due to roads and power lines in two forest patches in Bangladesh. Zoologia (Curitiba) 36.
APLIC. 2006. Reducing avian collisions with power lines: the state of the art in 2016. Avian Power Line Interaction Committee. Edison Electric Institute and APLIC, Washington, DC.
Arifah, A. (2016). Reklasifikasi Iklim Jawa Barat. Institut Pertanian Bogor.
Artikel: Pemkab Bandung Barat Harus Waspadai Dampak Sosial PLTA Cisokan. https://www.pikiran-rakyat.com/bandung-raya/pr-01252698/pemkab-bandung-barat-harus-waspadai-dampak-sosial-plta-cisokan
Bank Dirrective: Addressing Risks and Impacts on Disadvantaged or Vulnerable Individuals or Groups, World Bank.2016. http://documents1.worldbank.org/curated/en/748451469107442841/pdf/107175-BR-R2016-0145-IDA-R2016-0198-Box396279B-PUBLIC.pdf
Barrientos, R., J. C. Alonso, C. Ponce, and C. PalacÍn. 2011. Meta-Analysis of the Effectiveness of Marked Wire in Reducing Avian Collisions with Power Lines. Conservation Biology 25:893-903.
Barstow, M. 2018. Pterocarpus indicus. The IUCN Red List of Threatened Species 2018: e.T33241A2835450. https://dx.doi.org/10.2305/IUCN.UK.2018-2.RLTS.T33241A2835450.en. Downloaded on 21 January 2021.
BirdLife International. 2016. Pernis ptilorhynchus. The IUCN Red List of Threatened Species 2016: e.T22694995A93483912. https://dx.doi.org/10.2305/IUCN.UK.2016-3.RLTS.T22694995A93483912.en. Downloaded on 21 January 2021.
BirdLife International. 2020. Geokichla interpres. The IUCN Red List of Threatened Species 2020: e.T22733677A175952053. https://dx.doi.org/10.2305/IUCN.UK.2020-3.RLTS.T22733677A175952053.en. Downloaded on 22 January 2021.
CarbonTropic. 2017. Matenggeng Pumped Storage Hydroelectric Plant (MPSHP) Project: A Preliminary Ecological Assessment. February 2017. CarbonTropic, the World Bank and PLN, Jakarta, Indonesia.
CarbonTropic. 2017. Matenggeng Pumped Storage Hydroelectric Plant (MPSHP) Project: A Preliminary Ecological Assessment. February 2017. CarbonTropic, the World Bank and PLN, Jakarta, Indonesia.
384
Draft Environmental and Social Impact Assessment (ESIA) 2020
Catatan tahunan kekerasan terhadap perempuan. 2020. https://komnasperempuan.go.id/pengumuman-detail/siaran-pers-dan-lembar-fakta-komnas-perempuan-cata
Center for Environment and Sustainability Science Directorate Of Innovation And Corporate-UNPAD, 2020. Review and Update Study of Biodiversity Monitoring Plan (BMP) Upper Cisokan Pumped Storage Hydro-Electrical Power, PT. PLN (Persero) UIP, Central Java I
Central Bureau of Statistics, 2019. District in Figures, Bandung Barat Regency
Central Bureau of Statistics, 2019. District in Figures, Cianjur Regency
Challender, D., D. H. A. Willcox, E. Panjang, N. Lim, H. Nash, S. Heinrich, and J. Chong. 2019. Manis javanica. The IUCN Red List of Threatened Species 2019: e.T12763A123584856. https://dx.doi.org/10.2305/IUCN.UK.2019-3.RLTS.T12763A123584856.en. Downloaded on 20 January 2021.
Clayton, L., M. Keeling, and E. J. Milner-Gulland. 1997. Bringing home the bacon: a spatial model of wild pig hunting in Sulawesi, Indonesia. Ecological Applications 7:642-652.
Clayton, L., M. Keeling, and E. J. Milner-Gulland. 1997. Bringing home the bacon: a spatial model of wild pig hunting in Sulawesi, Indonesia. Ecological Applications 7:642-652.
Costanza R, et al. 1997. The value of the world’s ecosystem services and natural capital. Nature 387:253–260.
Costanza R, et al. 2011. Valuing ecological systems and services. F1000 biology reports 3:14-14.
de Groot R, et al. 2012. Global estimates of the value of ecosystems and their services in monetary units. Ecosystem Services 1:50-61.
Department Of Communication, Informatics And Statistics. 2018. Data Basis For Development Of West Bandung Regency 2018. West Bandung Regency Government
Diamond, J. M., K. D. Bishop, and S. Van Balen. 1987. Bird Survival in an Isolated Javan Woodland: Island or Mirror? Conservation Biology 1:132-142.
Directorate General of Pollution Control and Environmental Damage, Ministry of Environment and Forestry, (2018).
Eccleston, D. T., and R. E. Harness. 2018. Raptor Electrocutions and Power Line Collisions.in J. Sarasola, J. Grande, and J. Negro, editors. Birds of Prey. Springer, Cham, Switzerland.
Faculty of Agricultural Industrial Engineering-UNPAD, 2017. Final Report of the Independent Monitoring Agency (IMA) Upper Cisokan Pumped Storage Hydro-Electrical Power, PT. PLN (Persero) UIP, Central Java I.
385
Draft Environmental and Social Impact Assessment (ESIA) 2020
Faculty of Agricultural Industrial Technology -UNPAD, 2020. Review of Land Acquisition and Resettlement Action Plan (LARAP) Implementation Upper Cisokan Pumped Storage Hydro-Electrical Power, PT. PLN (Persero) UIP, Central Java I.
Faculty of Agricultural Industrial Technology-UNPAD. 2016. Final Report Middle Term Report Upper Cisokan Pumped Storage Hydro-Electrical Power, PT. PLN (Persero) UIP, Central Java I.
Fritts, T. H. 2002. Economic costs of electrical system instability and power outages caused by snakes on the Island of Guam. International Biodeterioration & Biodegradation 49:93-100.
Gender Risk Assesment Tool, IDB.2020. https://www.idbinvest.org/en/publications/gender-risk-assessment-tool
Good Practice Note on GBV in Major Civil Work, Environmental &Social Framework for IPF operation, World Bank: Second edition.2020. http://pubdocs.worldbank.org/en/741681582580194727/ESF-Good-Practice-Note-on-GBV-in-Major-Civil-Works-v2.pdf
Grassman Jr, L. I., M. E. Tewes, and N. J. Silvy. 2005. Ranging, habitat use and activity patterns of binturong Arctictis binturong and yellow-throated marten Martes flavigula in north-central Thailand. Wildlife Biology 11:49-57.
Hakim, L., O. S. Abdoellah, Parikesit, and S. Withaningsih. 2020. Impact of agricultural crop type and hunting on bird communities of two villages in Bandung, West Java, Indonesia Biodiversitas 21:57-66.
Hernawati R, Nurhaman U, Busson F, Suryobroto B, Hanner R, Keith P, Wowor D, Hubert N. 2020. Exploring community assembly among Javanese and Balinese freshwater shrimps (Atyidae, Palaemonidae) through DNA barcodes. Hydrobiologia 847:647-663.
Hunink, J. E., Conteras, S., & Droogers, S. (2015). Hydrological pre-feasibility assessment for the Romuku hydropower plant Central Sulawesi, Indonesia [Report Future Water 141]. Hydropower Evolutions.
Hunting, K. 2002. A roadmap for PIER research on avian collisions with power lines in California. Technical report P500-02-071F. California Energy Commission, Sacramento, CA.
Husodo, T., P. Febrianto, E. N. Megantara, S. S. Shanida, and M. P. Pujianto. 2019. Diversity of mammals in forest patches of Cisokan, Cianjur, West Java, Indonesia. Biodiversitas 20:1281-1288.
Interdev, 2019. Final Report on Social Programs and Stakeholder Mapping of the UCPS 4x260 MW Hydroelectric Power Plant Project in West Bandung Regency, PT. PLN (Persero) UIP, Central Java I.
Interdev, 2019. Final Report on Social Programs and Stakeholder Mapping of the UCPS 4x260 MW Hydroelectric Power Plant Project in Cianjur Regency, PT. PLN (Persero) UIP, Central Java I.
386
Draft Environmental and Social Impact Assessment (ESIA) 2020
Janss, G. F. E. 2000. Avian mortality from power lines: a morphologic approach of a species-specific mortality. Biological Conservation 95:353-359.
Jenkins, A. R., J. Smallie, and M. Diamond. 2010. Avian collisions with power lines: a global review of causes and mitigation, with a South African perspective. Bird Conservation International 20:263-278.
Jepson P, Ladle RJ. 2009. Governing bird-keeping in Java and Bali: evidence from a household survey. Oryx 43:364-374.
Katsis, L., P. M. K. Cunneyworth, K. M. E. Turner, and A. Presotto. 2018. Spatial Patterns of Primate Electrocutions in Diani, Kenya. International Journal of Primatology 39:493-510.
KBA Standards and Appeals Committee. 2019. Guidelines for using a Global Standard for the Identification of Key Biodiversity Areas. Version 1.0. Prepared by the KBA Standards and Appeals Committee of the IUCN Species Survival Commission and IUCN World Commission on Protected Areas. IUCN, Gland, Switzerland.
Kolnegari, M., A. T. Qashqaei, M. Hazrati, A. A. Basiri, M. M. Tork Abad, and M. Ferrer. 2018. Rare cases of carnivore mortality due to electric power distribution lines in Iran. Zoology and Ecology 28:418-420.
Laurance, W. F., B. M. Croes, L. Tchignoumba, S. A. Lahm, A. Alonso, M. E. Lee, P. Campbell, and C. Ondzeano. 2006. Impacts of roads and hunting on central African rainforest mammals. Conservation Biology 20:1251-1261.
Laurance, W. F., B. M. Croes, L. Tchignoumba, S. A. Lahm, A. Alonso, M. E. Lee, P. Campbell, and C. Ondzeano. 2006. Impacts of roads and hunting on central African rainforest mammals. Conservation Biology 20:1251-1261.
Lavigne F, Gunnell Y. 2006. Land cover change and abrupt environmental impacts on Javan volcanoes, Indonesia: a long-term perspective on recent events. Regional Environmental Change 6:86-100.
LIPI. 2011. Laporan Survei I Studi Tematik Flora dan Fauna Di Wilayah Proyek PLTA “Upper Cisokan Pumped Storage” Jawa Barat.
LIPI. 2012a. Laporan Survei II Studi Tematik Flora dan Fauna Di Wilayah Proyek PLTA “Upper Cisokan Pumped Storage” Jawa Barat.
LIPI. 2012b. Laporan Akhir Studi Tematik Flora dan Fauna Di Wilayah Proyek PLTA “Upper Cisokan Pumped Storage” Jawa Barat.
Lokschin, L. X., C. P. Rodrigo, J. N. Hallal Cabral, and G. Buss. 2007. Power Lines and Howler Monkey Conservation in Porto Alegre, Rio Grande do Sul, Brazil. Neotropical Primates 14:76-80, 75.
387
Draft Environmental and Social Impact Assessment (ESIA) 2020
Louys J, Meijaard E. 2010. Palaeoecology of Southeast Asian megafauna-bearing sites from the Pleistocene and a review of environmental changes in the region. Journal of Biogeography 37:1432–1449.
LPPM Unpad. 2011. Laporan Akhir LARAP (Rencana Pelaksanaan Pengadaan Tanah dan Pemukiman Kembali). Upper Cisokan Pumped Storage Sub Proyek: Jalan Hantar dan Quarry. Final Report March 2011
LPPM Unpad. 2011. Laporan Akhir LARAP (Rencana Pelaksanaan Pengadaan Tanah dan Pemukiman Kembali). Upper Cisokan Pumped Storage Sub Proyek: Upper dan Lower Reservoir. Final Report March 2011
LPPM Unpad. 2011. Laporan Akhir LARAP (Rencana Pelaksanaan Pengadaan Tanah dan Pemukiman Kembali). Upper Cisokan Pumped Storage Sub Proyek: Tapak Tower dan SUTET. Final Report March 2011
Mardiastuti, A., Y. A. Mulyani, M. Hasan, and A. Kaban. 2019. Is forest remnants able to support bird community? Case in tropical lowland forest of West Java, Indonesia. IOP Conference Series: Earth and Environmental Science 399:012034.
Mehra, R. dan S. Esim. 1998. What Gender Analysis Can Contribute to Irrigation Research and Practice in Developing Countries: Some Issues. Dalam Douglas Merrey and Shirish Baviskar (eds). Gender Analysis and Reform of Irrigation Management: Concepts, Casess and Gaps in Knowledge. IWMI
Meijaard E, Achdiawan R. 2011. Where Have All the Geckos Gone? http://www.thejakartaglobe.com/archive/where-have-all-the-geckos-gone/443645/. The Jakarta Post 28 May, 2011.
Meijaard, E. 2014. A review of historical habitat and threats of Small-clawed Otter on Java. IUCN Otter Specialist Group Bulletin 31:40-43.
Millenium Ecosystem Assessment. 2005. Ecosystems and Human Well-Being: Current Status and Trends: Findings of the Condition and Trends Working Group. Press I, Washington.
Mittermeier RA, Gil PR, Hoffman M, Pilgrim J, Brooks T, Mittermeier CG, Lamoreux J, da Fonseca GAB 2004. Hotspots Revisited. Earth's Biologically Richest and Most Endangered Terrestrial Ecoregions. The University of Chicago Press, Chicago, USA. Mittermeier RA, Mittermeier CG 1998. Megadiversity: Earth's biologically wealthiest nations. CEMEX.
Munandar Sulaeman dan Siti Homzah. 2010. Kekerasan terhadap Perempuan. Bandung: Refika Aditama.
MWH and Stantec. 2018. Baseline Information Report Volume 4. Avifauna.
Nakabayashi, M., and A. H. Ahmad. 2018. Short-term movements and strong dependence on figs of binturongs (Arctictis binturong) in Bornean rainforests. European Journal of Wildlife Research 64:66.
388
Draft Environmental and Social Impact Assessment (ESIA) 2020
Nijman, V and KAI Nektaris. 2014. Taboos, traditions and trade in slow lorises in Sundanese communities in southern Java. Endangered Species Research, Vol. 25: 79–88.
Nijman, V. 2020. Hylobates moloch. The IUCN Red List of Threatened Species 2020: e.T10550A17966495. https://dx.doi.org/10.2305/IUCN.UK.2020-2.RLTS.T10550A17966495.en. Downloaded on 20 January 2021.
Nijman, V., and A. Setiawan. 2020. Presbytis comata. The IUCN Red List of Threatened Species 2020: e.T18125A17955175. https://dx.doi.org/10.2305/IUCN.UK.2020-2.RLTS.T18125A17955175.en. Downloaded on 20 January 2021.
Nijman, V., F. Germi, and S. B. van Balen. 2006. Relative status of two species of migrant sparrowhawks on Java and Bali, Indonesia. Emu - Austral Ornithology 106:157-162.
Pannekoek, A. J. (1949). Garis Besar Geomorfologi Pulau Jawa.
Perum Perhutani Divre Jabar dan Banten. 2017. Laporan Hasil Monitoring Rehabilitasi tanaman Kerjasama Perum Perhutani Divre Jabar dan Banten Denfan PT. PLN (Persero) Unit Induk Pembangunan Jawa Bagian Tengah (JBT I). Departemen PSDA PIA. Bandung.
Perum Perhutani Divre Jabar dan Banten. 2018. LAPORAN PRA (Participatory Rural Apraisal) Areal Terdampak Pembangunan PLTA Upper Cisokan Pumped Storage (UCPS) Desa Margaluyu Kecamatan Campaka
PJT II. (2019). Neraca Ketersediaan Air Sungai Cisokan. Divisi Pengelolaan SDA & SDL Perum Jasa Tirta II.
PLN Enjiniring/Nippon Koei/Newjec Inc./Indokoei International/Wiratman. (2019a). Dam Design Review Report: December 2019.
PLN Enjiniring/Nippon Koei/Newjec Inc./Indokoei International/Wiratman. (2019b). Hydrology Review Report.
PLN Enjiniring/Nippon Koei/Newjec Inc./Indokoei International/Wiratman. (2019c). Seismology Review Report: December 2019.
PLN Enjiniring/Nippon Koei/Newjec Inc./Indokoei International/Wiratman. (2019d). Summary of Design Review Report: December 2019.
PLN, Newjec Inc. (1995). Feasibilty Study for The Upper Cisokan Pumped Storage Hydroelectric Power Development Project in The Republic Indonesia.
PLN. (1998). Environmental Impact Analysis of Upper Cisokan (Pumped Storage) HEPP West Java. Final Report.
PLN. (2007). Analisis Dampak Lingkungan (AMDAL)—PLTA Cisokan Hulu (Pumped Storage).
389
Draft Environmental and Social Impact Assessment (ESIA) 2020
PLN. (2011a). Enivronmental Impact Assessment (EIA)—Analisis Dampak Lingkungan Gabungan.
PLN. (2011b). Revisi Andal PLTA Upper Cisokan Pumped Storage Kapasitas 4x260 MW Provinsi Jawa Barat (Jalan Hantar, Quarry, Pemanfaatan Fly Ash).
PLN. (2012a). Laporan Pelaksanaan RKL-RPL PLTA UCPS Semester I tahun 2012.
PLN. (2012b). Laporan Pelaksanaan RKL-RPL PLTA UCPS Semester II tahun 2012.
PLN. (2013a). Laporan Pelaksanaan RKL-RPL PLTA UCPS Semester I tahun 2013.
PLN. (2013b). Laporan Pelaksanaan RKL-RPL PLTA UCPS Semester II tahun 2013.
PLN. (2014a). Laporan Pelaksanaan RKL-RPL PLTA UCPS Semester I tahun 2014 (p. 157).
PLN. (2014b). Laporan Pelaksanaan RKL-RPL PLTA UCPS Semester II tahun 2014.
PLN. (2015a). Laporan Pelaksanaan RKL-RPL PLTA UCPS Semester I tahun 2015.
PLN. (2015b). Laporan Pelaksanaan RKL-RPL PLTA UCPS Semester II tahun 2015.
PLN. (2016a). Laporan Pelaksanaan RKL-RPL PLTA UCPS Semester I tahun 2016.
PLN. (2016b). Laporan Pelaksanaan RKL-RPL PLTA UCPS Semester II tahun 2016.
PLN. (2017a). Laporan Pelaksanaan RKL-RPL PLTA UCPS Semester I tahun 2017.
PLN. (2017b). Laporan Pelaksanaan RKL-RPL PLTA UCPS Semester II tahun 2017.
PLN. (2018a). Laporan Pelaksanaan RKL-RPL PLTA UCPS Semester I tahun 2018.
PLN. (2018b). Laporan Pelaksanaan RKL-RPL PLTA UCPS Semester II tahun 2018.
PLN. (2019a). Laporan Monitoring Implementasi RKL-RPL SUTET 500 KV PLTA Cisokan Hulu.
PLN. (2019b). Laporan Pelaksanaan RKL-RPL PLTA UCPS Semester I tahun 2019.
PLN. (2019c). Laporan Pelaksanaan RKL-RPL PLTA UCPS Semester II tahun 2019.
PLN. (2019d). Social and Stakeholder Mapping PLN UCPS.
PLN. (2020). Statistik PLN 2019.
PLN/FTIP Unpad. (2016). Monitoring & Evaluation Hydro-Electrical Power Upper Cisokan Pumped Storage—Middle Term Report.
390
Draft Environmental and Social Impact Assessment (ESIA) 2020
PLN/Newjec Inc. (2002). Upper Cisokan Pumped Storage Hydroelectric Power Plant Project. Detailed Design. Part I to Part VIII.
PLN/Newjec Inc. (2007a). Supplement of Environmental Management Plan (RKL) and Environmental Monitoring Plan (RPL). 500kV Transmission Line Development for Upper Cisokan Pumped Storage Hydroelectric Power Plant (UCPS) Bandung Regency and Cianjur Regency West Java Province.
PLN/Newjec Inc. (2007b). Supplementary Study of Upper Cisokan Pumped Storage Hydroelectric Power Plant Project. Volumes 1-6.
PLN/PT. Geotrav Bhuana. (2013). Laporan Akhir Studi Pengelolaan Daerah Aliran Sungai (Watershed Management) Cisokan Hulu untuk Menunjang PLTA Upper Cisokan Pumped Storage.
Policy Brief: gender and hydropower; Women’s right in development discourse. https://www.csds-chula.org/publications/2017/10/2/gender-and-hydropower-womens-rights-in-the-development-discourse
PPSDAL LPPM Unpad. 2014. Standard Operational Procedures (SOP) Penanganan Konflik Manusia - Satwa Liar Dan Protokol Penanganan Satwa Liar. Studi Biodiversity Management Plan
PPSDAL Unpad. 2014. Biodiversity Management Plan (BMP) PLTA Upper Cisokan Pumped Storage (UCPS). Laporan Final Agustus 2014.
PPSDAL Unpad. 2014. Standard Operational Procedures (SOP) Land Clearing Procedure. Studi Biodiversity Management Plan
PPSDAL Unpad. 2017. Laporan Akhir Jasa Konsultasi Implementasi BMP – Monitoring Spesies, PLTA Upper Cisokan Pumped Storage (UCPS) 2016 – 2017.
Prasetyo LB, Wijaya CI, Setiawan Y. 2013. Spatial Model Approach for Deforestation: Case Study in Java Island, Indonesia. Pages 1901-1912. Geographic Information Systems: Concepts, Methodologies, Tools, and Applications. IGI Global.
Prinsen, H. A. M., J. J. Smallie, G. C. Boere, and N. Píres, editors. 2012. Guidelines on How to Avoid or Mitigate Impact of Electricity Power Grids on Migratory Birds in the African-Eurasian Region. AEWA Conservation Guidelines No. 14, CMS Technical Series No. 29, AEWA Technical Series No. 50, CMS Raptors MOU Technical Series No. 3, Bonn, Germany.
PT. Gamma Epsilon. 2018. Monitoring Implementasi EMP dan RKL-RPL Pembangunan SUTET 500 KV dan PLTA UCPS.
PT. Kwarsa Hexagon. 2015. Laporan Tahunan (Periode Oktober 2014-September 2015) Tim Pemantau (Independent Monitoring Agency) PLTA Upper Cisokan.
PT. LAPI ITB. 2015. 3rd Monthly Report on Work of the Grievance Task Force for Upper Cisokan Pumped Storage Hydropower Unit. PT. PLN (Persero) UIP VI
391
Draft Environmental and Social Impact Assessment (ESIA) 2020
PT. PLN (Persero) dan Perum Perhutani. 2015. Perjanjian Kerjasama Antara Perum Perhutani Dengan Pt Pln (Persero) Unit Induk Pembangunan VI Tentang Pelaksanaan Peningkatan Fungsi Konservasi Kawasan Hutan Dl Daerah Tangkapan Air Sekitar Pembangkit Listrik Tenaga Air Upper Cisokan Pumped Storage 4 X 260 MW (PLTA UCPS).
PT. PLN (Persero) UIP JBT I. 2016. Laporan Program CSR 2016 Proyek PLTA Cisokan 4x260 MW.
PT. PLN (Persero). 2011. Upper Cisokan Pumped Storage Hydropower (1040MW) (EMP) Environment Management Plan. Laporan Final Maret 2011.
PT. PLN (Persero). 2011. Upper Cisokan Pumped Storage Hydropower (1040MW) (EIA) Environmental Impact Assessment Analisis Dampak Lingkungan Gabungan. Laporan Final April 2011.
PT. PLN (Persero). 2014. Integrated Catchment Management (ICM) Upper Cisokan Catchment Area.
PT. PLN Persero UIP JBT I. 2015. Biodiversity Management Plan Upper Cisokan Pumped Storage Achieving Biodiversity Conservation through Integrated Catchment Management. Laporan Final Version September 2015.
Rahmat, A. (2009). UCPSS Biodiversity. Upper Cisokan Pumped Storage Power Project (UCPSS) Additional Environmental Studies 2009.
Rahmat, A. 2009. UCPSS Biodiversity Survey. Upper Cisokan Pumped Power Project (UCPSS). Additional Environmental Studies 2009.
Ram, C., G. Sharma, and L. Rajpurohit. 2015. Mortality and threats to Hanuman langurs (Semnopithecus entellus entellus) in and around Jodhpur (Rajasthan). Indian Forester 141:1042–1045.
Ranny, Rastati. 2019. https://pmb.lipi.go.id/perempuan-dan-desa-sudahkah-merdeka/
Rosa H, Kandel S, L. D 2003. Compensation for Environmental Services and Rural Communities: Lessons from the Americas and Key Issues for Stregthening Community Strategies Prisma, San Salvador.
Sapač, K., Medved, A., Rusjan, S., & Bezak, N. (2019). Investigation of Low- and High-Flow Characteristics of Karst Catchments under Climate Change. Water, 11(5), 925. https://doi.org/10.3390/w11050925
Scoones, I. 1998. Sustainable rural livelihood: A Framework for Analysis. IDS Working Paper No.72. Institute of Development Studies, University of Sussex. Brighton.
Shimbun, C. 2017. Chubu Electric uses artificial nests so crows don't build their own on power towers. https://www.japantimes.co.jp/news/2017/05/22/national/chubu-electric-uses-artificial-nests-crows-dont-build-power-towers/.
392
Draft Environmental and Social Impact Assessment (ESIA) 2020
Stuart, B., G. Wogan, L. Grismer, M. Auliya, R. F. Inger, R. Lilley, T. Chan-Ard, N. Thy, T. Q. Nguyen, C. Srinivasulu, and D. Jelić. 20112. Ophiophagus hannah. The IUCN Red List of Threatened Species 2012: e.T177540A1491874. https://dx.doi.org/10.2305/IUCN.UK.2012-1.RLTS.T177540A1491874.en. Downloaded on 21 January 2021.
Surat Izin Penggunaan Sumber Daya Air, (2014).
Sutrisno, H., T. Partomihardjo, T. Triono, A. Sadeli, M. Irham, S. Wihantoro, I. Sidik, R. K. Hadiaty, Y. S. Fitriana, F. Rifai, A. Marakamah, M. Wahyudin, A. Supriyatna, Sarifudin, Kurnianingsih, and J. Nurdin. 2012. Final Report. A study on the flora and fauna in the project area of HEPP "Upper Cisokan Pumped Storage" West Java. Research Center for Biology, Indonesian Institute of Sciences, Bogor, Indonesia.
Toolkit for integrating GBV prevention and response into USAID Energy and Infrastructure Projects, USAID.2015. https://www.climateinvestmentfunds.org/sites/default/files/usaid_gbv_ei_toolkit.pdf
Whitten T, Soeriaatmadja RE, Afiff SA 1996. The ecology of Java and Bali. Periplus Editions, Singapore. Whitten T, van Dijk PP, Curran L, Meijaard E, Supriatna J, Ellis S. 2004. Sundaland in Mittermeier RA, Gil PR, Hoffmann M, Pilgrim J, Brooks T, Mittermeier CG, Lamoreux J, and da Fonseca GAB, editors. Hotspots revisited: Another look at Earth's richest and most endangered terrestrial ecoregions. Cemex, Mexico.
World Meteorological Organization, World Meteorological Organization, & Organisation Météorologique Mondiale. (2008). Manual on low-flow estimation and prediction: Operational hydrology report no. 50. WMO.
Wulan TR. 2007. Pengetahuan dan kekuasaan: Penguatan remitan sosial sebagai strategi pemberdayaan buruh migran perempuan Indonesia. Warta Demografi. 37
Zeller, Manfred ; Sharma, Manohar P. ; Ahmed, Akhter U. ; Rashid, Shahidur, 2001. Group Based Financial Institutions For The Rural Poor In Bangladesh: An Institutional- And Household-Level Analysis, International Food Policy Research Institute Washington,D.C.
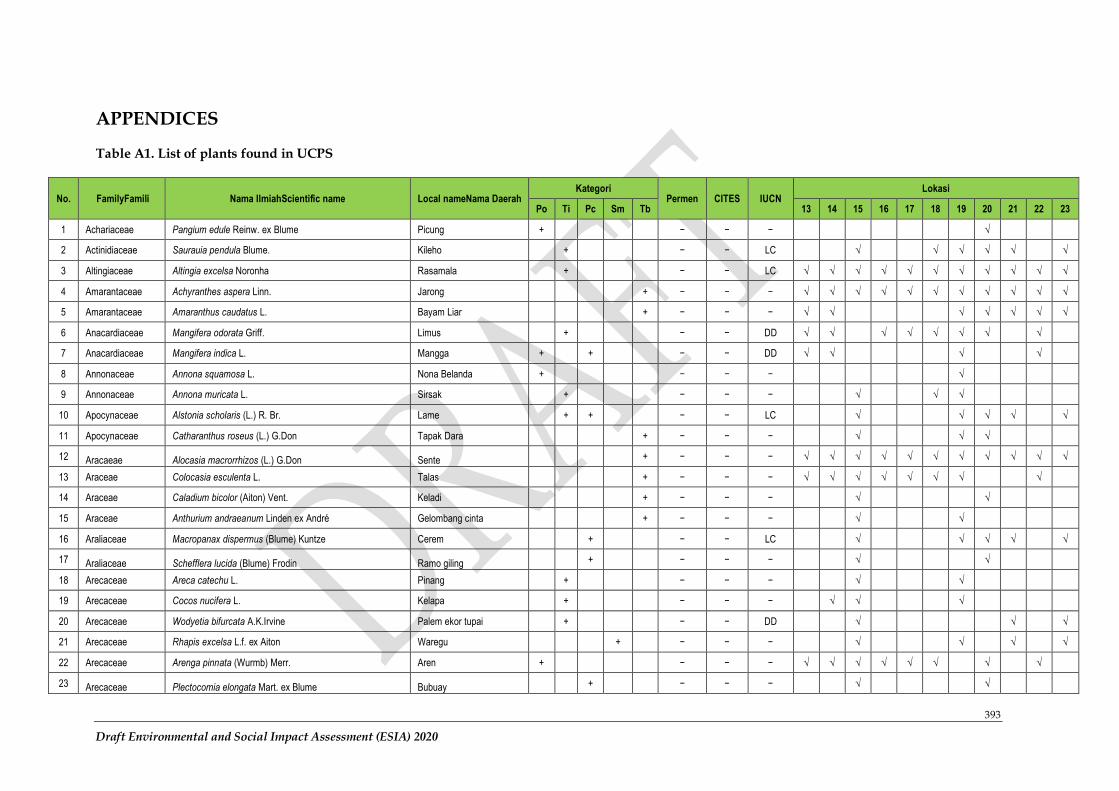
393
Draft Environmental and Social Impact Assessment (ESIA) 2020
APPENDICES
Table A1. List of plants found in UCPS
No. FamilyFamili Nama IlmiahScientific name Local nameNama Daerah Kategori
Permen CITES IUCN Lokasi
Po Ti Pc Sm Tb 13 14 15 16 17 18 19 20 21 22 23
1 Achariaceae Pangium edule Reinw. ex Blume Picung + − − − √
2 Actinidiaceae Saurauia pendula Blume. Kileho + − − LC √ √ √ √ √ √
3 Altingiaceae Altingia excelsa Noronha Rasamala + − − LC √ √ √ √ √ √ √ √ √ √ √
4 Amarantaceae Achyranthes aspera Linn. Jarong + − − − √ √ √ √ √ √ √ √ √ √ √
5 Amarantaceae Amaranthus caudatus L. Bayam Liar + − − − √ √ √ √ √ √ √
6 Anacardiaceae Mangifera odorata Griff. Limus + − − DD √ √ √ √ √ √ √ √
7 Anacardiaceae Mangifera indica L. Mangga + + − − DD √ √ √ √
8 Annonaceae Annona squamosa L. Nona Belanda + − − − √
9 Annonaceae Annona muricata L. Sirsak + − − − √ √ √
10 Apocynaceae Alstonia scholaris (L.) R. Br. Lame + + − − LC √ √ √ √ √
11 Apocynaceae Catharanthus roseus (L.) G.Don Tapak Dara + − − − √ √ √
12 Aracaeae Alocasia macrorrhizos (L.) G.Don Sente + − − − √ √ √ √ √ √ √ √ √ √ √
13 Araceae Colocasia esculenta L. Talas + − − − √ √ √ √ √ √ √ √
14 Araceae Caladium bicolor (Aiton) Vent. Keladi + − − − √ √
15 Araceae Anthurium andraeanum Linden ex André Gelombang cinta + − − − √ √
16 Araliaceae Macropanax dispermus (Blume) Kuntze Cerem + − − LC √ √ √ √ √
17 Araliaceae Schefflera lucida (Blume) Frodin Ramo giling + − − − √ √
18 Arecaceae Areca catechu L. Pinang + − − − √ √
19 Arecaceae Cocos nucifera L. Kelapa + − − − √ √ √
20 Arecaceae Wodyetia bifurcata A.K.Irvine Palem ekor tupai + − − DD √ √ √
21 Arecaceae Rhapis excelsa L.f. ex Aiton Waregu + − − − √ √ √ √
22 Arecaceae Arenga pinnata (Wurmb) Merr. Aren + − − − √ √ √ √ √ √ √ √
23 Arecaceae Plectocomia elongata Mart. ex Blume Bubuay + − − − √ √
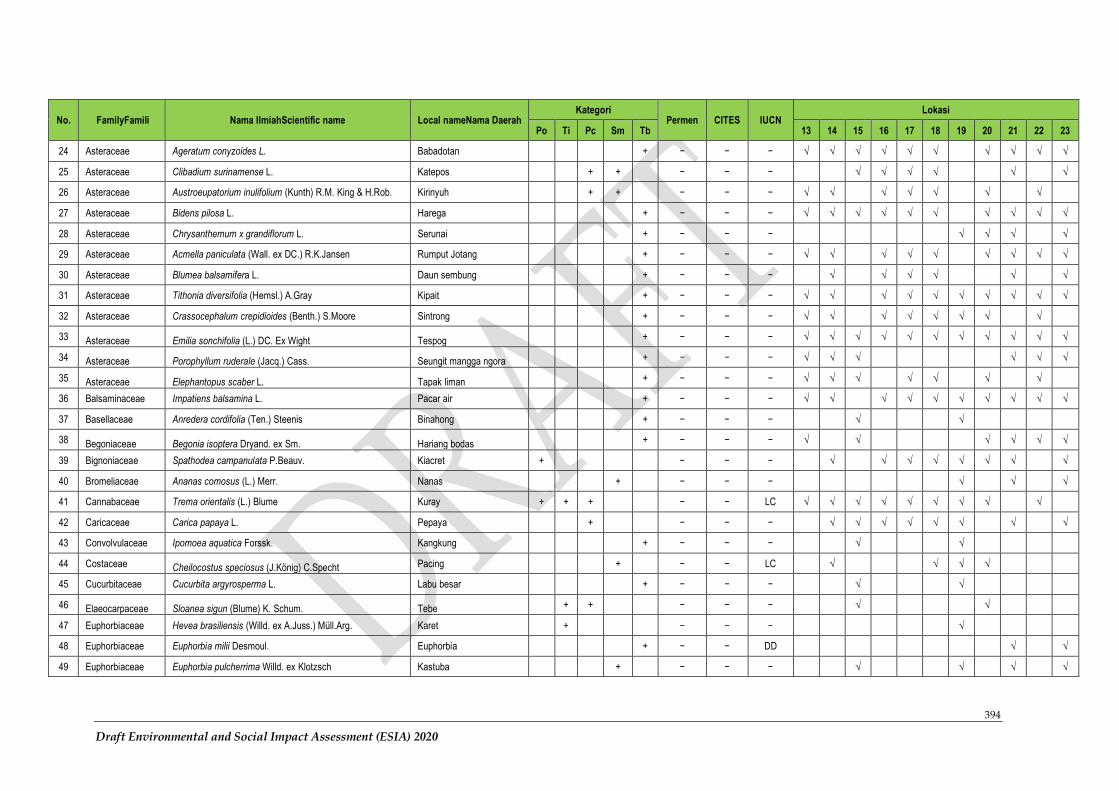
394
Draft Environmental and Social Impact Assessment (ESIA) 2020
No. FamilyFamili Nama IlmiahScientific name Local nameNama Daerah Kategori
Permen CITES IUCN Lokasi
Po Ti Pc Sm Tb 13 14 15 16 17 18 19 20 21 22 23
24 Asteraceae Ageratum conyzoides L. Babadotan + − − − √ √ √ √ √ √ √ √ √ √
25 Asteraceae Clibadium surinamense L. Katepos + + − − − √ √ √ √ √ √
26 Asteraceae Austroeupatorium inulifolium (Kunth) R.M. King & H.Rob. Kirinyuh + + − − − √ √ √ √ √ √ √
27 Asteraceae Bidens pilosa L. Harega + − − − √ √ √ √ √ √ √ √ √ √
28 Asteraceae Chrysanthemum x grandiflorum L. Serunai + − − − √ √ √ √
29 Asteraceae Acmella paniculata (Wall. ex DC.) R.K.Jansen Rumput Jotang + − − − √ √ √ √ √ √ √ √ √
30 Asteraceae Blumea balsamifera L. Daun sembung + − − − √ √ √ √ √ √
31 Asteraceae Tithonia diversifolia (Hemsl.) A.Gray Kipait + − − − √ √ √ √ √ √ √ √ √ √
32 Asteraceae Crassocephalum crepidioides (Benth.) S.Moore Sintrong + − − − √ √ √ √ √ √ √ √
33 Asteraceae Emilia sonchifolia (L.) DC. Ex Wight Tespog + − − − √ √ √ √ √ √ √ √ √ √ √
34 Asteraceae Porophyllum ruderale (Jacq.) Cass. Seungit mangga ngora + − − − √ √ √ √ √ √
35 Asteraceae Elephantopus scaber L. Tapak liman + − − − √ √ √ √ √ √ √
36 Balsaminaceae Impatiens balsamina L. Pacar air + − − − √ √ √ √ √ √ √ √ √ √
37 Basellaceae Anredera cordifolia (Ten.) Steenis Binahong + − − − √ √
38 Begoniaceae Begonia isoptera Dryand. ex Sm. Hariang bodas + − − − √ √ √ √ √ √
39 Bignoniaceae Spathodea campanulata P.Beauv. Kiacret + − − − √ √ √ √ √ √ √ √
40 Bromeliaceae Ananas comosus (L.) Merr. Nanas + − − − √ √ √
41 Cannabaceae Trema orientalis (L.) Blume Kuray + + + − − LC √ √ √ √ √ √ √ √ √
42 Caricaceae Carica papaya L. Pepaya + − − − √ √ √ √ √ √ √ √
43 Convolvulaceae Ipomoea aquatica Forssk. Kangkung + − − − √ √
44 Costaceae Cheilocostus speciosus (J.König) C.Specht Pacing + − − LC √ √ √ √
45 Cucurbitaceae Cucurbita argyrosperma L. Labu besar + − − − √ √
46 Elaeocarpaceae Sloanea sigun (Blume) K. Schum. Tebe + + − − − √ √
47 Euphorbiaceae Hevea brasiliensis (Willd. ex A.Juss.) Müll.Arg. Karet + − − − √
48 Euphorbiaceae Euphorbia milii Desmoul. Euphorbia + − − DD √ √
49 Euphorbiaceae Euphorbia pulcherrima Willd. ex Klotzsch Kastuba + − − − √ √ √ √
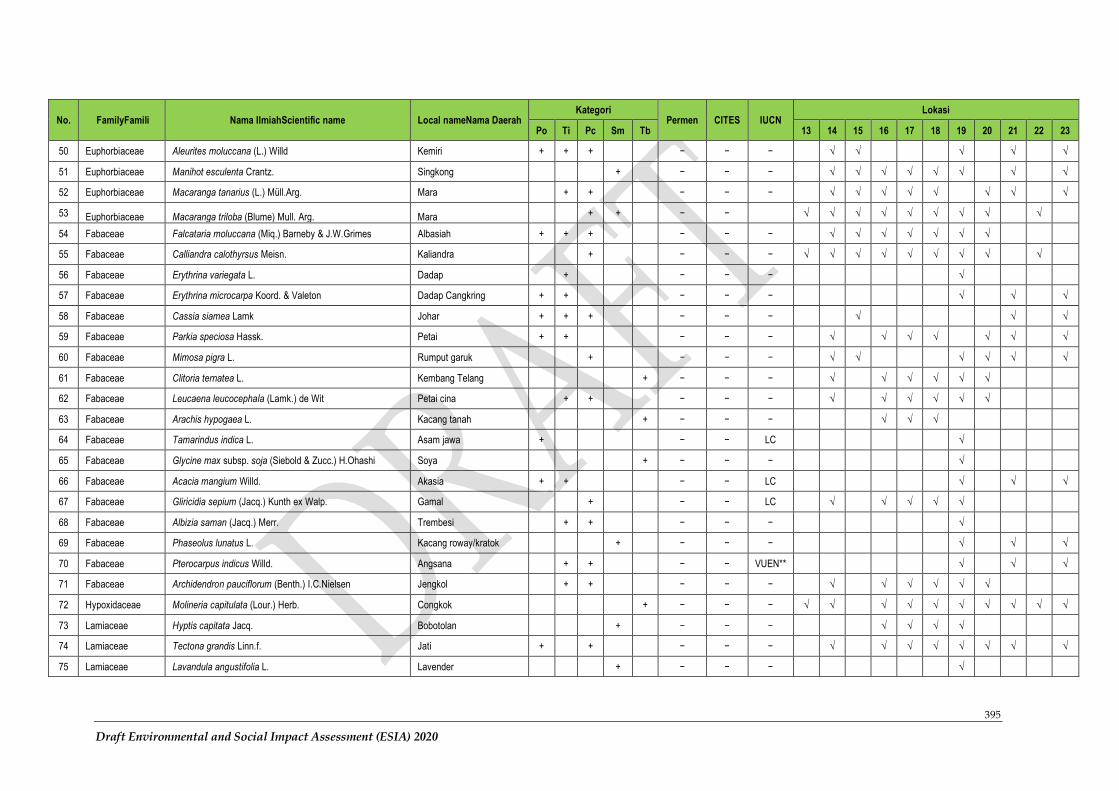
395
Draft Environmental and Social Impact Assessment (ESIA) 2020
No. FamilyFamili Nama IlmiahScientific name Local nameNama Daerah Kategori
Permen CITES IUCN Lokasi
Po Ti Pc Sm Tb 13 14 15 16 17 18 19 20 21 22 23
50 Euphorbiaceae Aleurites moluccana (L.) Willd Kemiri + + + − − − √ √ √ √ √
51 Euphorbiaceae Manihot esculenta Crantz. Singkong + − − − √ √ √ √ √ √ √ √
52 Euphorbiaceae Macaranga tanarius (L.) Müll.Arg. Mara + + − − − √ √ √ √ √ √ √ √
53 Euphorbiaceae Macaranga triloba (Blume) Mull. Arg. Mara + + − − √ √ √ √ √ √ √ √ √
54 Fabaceae Falcataria moluccana (Miq.) Barneby & J.W.Grimes Albasiah + + + − − − √ √ √ √ √ √ √
55 Fabaceae Calliandra calothyrsus Meisn. Kaliandra + − − − √ √ √ √ √ √ √ √ √
56 Fabaceae Erythrina variegata L. Dadap + − − − √
57 Fabaceae Erythrina microcarpa Koord. & Valeton Dadap Cangkring + + − − − √ √ √
58 Fabaceae Cassia siamea Lamk Johar + + + − − − √ √ √
59 Fabaceae Parkia speciosa Hassk. Petai + + − − − √ √ √ √ √ √ √
60 Fabaceae Mimosa pigra L. Rumput garuk + − − − √ √ √ √ √ √
61 Fabaceae Clitoria ternatea L. Kembang Telang + − − − √ √ √ √ √ √
62 Fabaceae Leucaena leucocephala (Lamk.) de Wit Petai cina + + − − − √ √ √ √ √ √
63 Fabaceae Arachis hypogaea L. Kacang tanah + − − − √ √ √
64 Fabaceae Tamarindus indica L. Asam jawa + − − LC √
65 Fabaceae Glycine max subsp. soja (Siebold & Zucc.) H.Ohashi Soya + − − − √
66 Fabaceae Acacia mangium Willd. Akasia + + − − LC √ √ √
67 Fabaceae Gliricidia sepium (Jacq.) Kunth ex Walp. Gamal + − − LC √ √ √ √ √
68 Fabaceae Albizia saman (Jacq.) Merr. Trembesi + + − − − √
69 Fabaceae Phaseolus lunatus L. Kacang roway/kratok + − − − √ √ √
70 Fabaceae Pterocarpus indicus Willd. Angsana + + − − VUEN** √ √ √
71 Fabaceae Archidendron pauciflorum (Benth.) I.C.Nielsen Jengkol + + − − − √ √ √ √ √ √
72 Hypoxidaceae Molineria capitulata (Lour.) Herb. Congkok + − − − √ √ √ √ √ √ √ √ √ √
73 Lamiaceae Hyptis capitata Jacq. Bobotolan + − − − √ √ √ √
74 Lamiaceae Tectona grandis Linn.f. Jati + + − − − √ √ √ √ √ √ √ √
75 Lamiaceae Lavandula angustifolia L. Lavender + − − − √
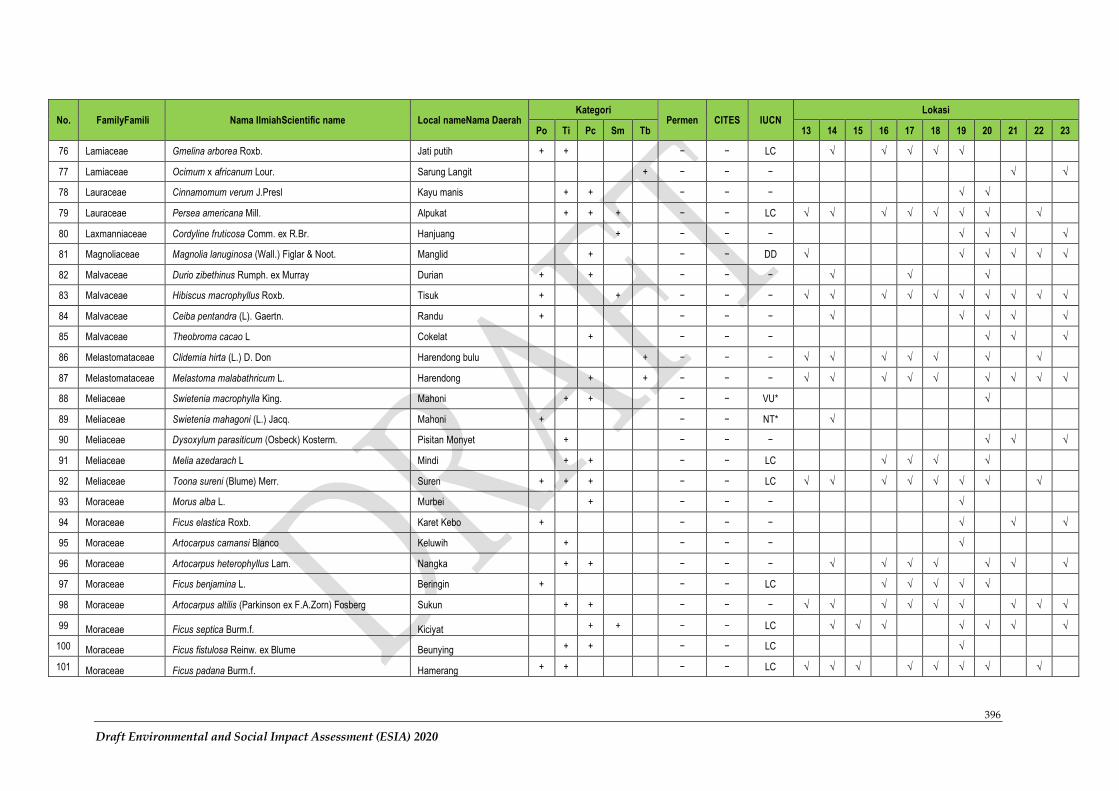
396
Draft Environmental and Social Impact Assessment (ESIA) 2020
No. FamilyFamili Nama IlmiahScientific name Local nameNama Daerah Kategori
Permen CITES IUCN Lokasi
Po Ti Pc Sm Tb 13 14 15 16 17 18 19 20 21 22 23
76 Lamiaceae Gmelina arborea Roxb. Jati putih + + − − LC √ √ √ √ √
77 Lamiaceae Ocimum x africanum Lour. Sarung Langit + − − − √ √
78 Lauraceae Cinnamomum verum J.Presl Kayu manis + + − − − √ √
79 Lauraceae Persea americana Mill. Alpukat + + + − − LC √ √ √ √ √ √ √ √
80 Laxmanniaceae Cordyline fruticosa Comm. ex R.Br. Hanjuang + − − − √ √ √ √
81 Magnoliaceae Magnolia lanuginosa (Wall.) Figlar & Noot. Manglid + − − DD √ √ √ √ √ √
82 Malvaceae Durio zibethinus Rumph. ex Murray Durian + + − − − √ √ √
83 Malvaceae Hibiscus macrophyllus Roxb. Tisuk + + − − − √ √ √ √ √ √ √ √ √ √
84 Malvaceae Ceiba pentandra (L). Gaertn. Randu + − − − √ √ √ √ √
85 Malvaceae Theobroma cacao L Cokelat + − − − √ √ √
86 Melastomataceae Clidemia hirta (L.) D. Don Harendong bulu + − − − √ √ √ √ √ √ √
87 Melastomataceae Melastoma malabathricum L. Harendong + + − − − √ √ √ √ √ √ √ √ √
88 Meliaceae Swietenia macrophylla King. Mahoni + + − − VU* √
89 Meliaceae Swietenia mahagoni (L.) Jacq. Mahoni + − − NT* √
90 Meliaceae Dysoxylum parasiticum (Osbeck) Kosterm. Pisitan Monyet + − − − √ √ √
91 Meliaceae Melia azedarach L Mindi + + − − LC √ √ √ √
92 Meliaceae Toona sureni (Blume) Merr. Suren + + + − − LC √ √ √ √ √ √ √ √
93 Moraceae Morus alba L. Murbei + − − − √
94 Moraceae Ficus elastica Roxb. Karet Kebo + − − − √ √ √
95 Moraceae Artocarpus camansi Blanco Keluwih + − − − √
96 Moraceae Artocarpus heterophyllus Lam. Nangka + + − − − √ √ √ √ √ √ √
97 Moraceae Ficus benjamina L. Beringin + − − LC √ √ √ √ √
98 Moraceae Artocarpus altilis (Parkinson ex F.A.Zorn) Fosberg Sukun + + − − − √ √ √ √ √ √ √ √ √
99 Moraceae Ficus septica Burm.f. Kiciyat + + − − LC √ √ √ √ √ √ √
100 Moraceae Ficus fistulosa Reinw. ex Blume Beunying + + − − LC √
101 Moraceae Ficus padana Burm.f. Hamerang + + − − LC √ √ √ √ √ √ √ √
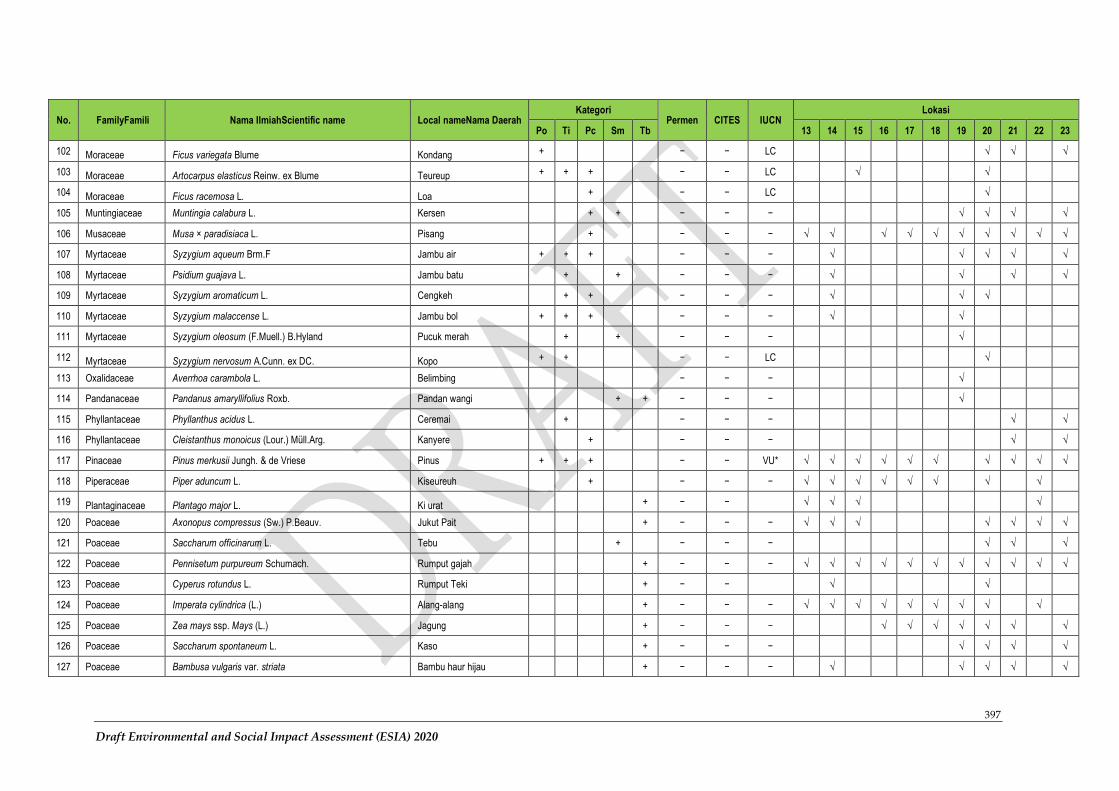
397
Draft Environmental and Social Impact Assessment (ESIA) 2020
No. FamilyFamili Nama IlmiahScientific name Local nameNama Daerah Kategori
Permen CITES IUCN Lokasi
Po Ti Pc Sm Tb 13 14 15 16 17 18 19 20 21 22 23
102 Moraceae Ficus variegata Blume Kondang + − − LC √ √ √
103 Moraceae Artocarpus elasticus Reinw. ex Blume Teureup + + + − − LC √ √
104 Moraceae Ficus racemosa L. Loa + − − LC √
105 Muntingiaceae Muntingia calabura L. Kersen + + − − − √ √ √ √
106 Musaceae Musa × paradisiaca L. Pisang + − − − √ √ √ √ √ √ √ √ √ √
107 Myrtaceae Syzygium aqueum Brm.F Jambu air + + + − − − √ √ √ √ √
108 Myrtaceae Psidium guajava L. Jambu batu + + − − − √ √ √ √
109 Myrtaceae Syzygium aromaticum L. Cengkeh + + − − − √ √ √
110 Myrtaceae Syzygium malaccense L. Jambu bol + + + − − − √ √
111 Myrtaceae Syzygium oleosum (F.Muell.) B.Hyland Pucuk merah + + − − − √
112 Myrtaceae Syzygium nervosum A.Cunn. ex DC. Kopo + + − − LC √
113 Oxalidaceae Averrhoa carambola L. Belimbing − − − √
114 Pandanaceae Pandanus amaryllifolius Roxb. Pandan wangi + + − − − √
115 Phyllantaceae Phyllanthus acidus L. Ceremai + − − − √ √
116 Phyllantaceae Cleistanthus monoicus (Lour.) Müll.Arg. Kanyere + − − − √ √
117 Pinaceae Pinus merkusii Jungh. & de Vriese Pinus + + + − − VU* √ √ √ √ √ √ √ √ √ √
118 Piperaceae Piper aduncum L. Kiseureuh + − − − √ √ √ √ √ √ √ √
119 Plantaginaceae Plantago major L. Ki urat + − − √ √ √ √
120 Poaceae Axonopus compressus (Sw.) P.Beauv. Jukut Pait + − − − √ √ √ √ √ √ √
121 Poaceae Saccharum officinarum L. Tebu + − − − √ √ √
122 Poaceae Pennisetum purpureum Schumach. Rumput gajah + − − − √ √ √ √ √ √ √ √ √ √ √
123 Poaceae Cyperus rotundus L. Rumput Teki + − − √ √
124 Poaceae Imperata cylindrica (L.) Alang-alang + − − − √ √ √ √ √ √ √ √ √
125 Poaceae Zea mays ssp. Mays (L.) Jagung + − − − √ √ √ √ √ √ √
126 Poaceae Saccharum spontaneum L. Kaso + − − − √ √ √ √
127 Poaceae Bambusa vulgaris var. striata Bambu haur hijau + − − − √ √ √ √ √
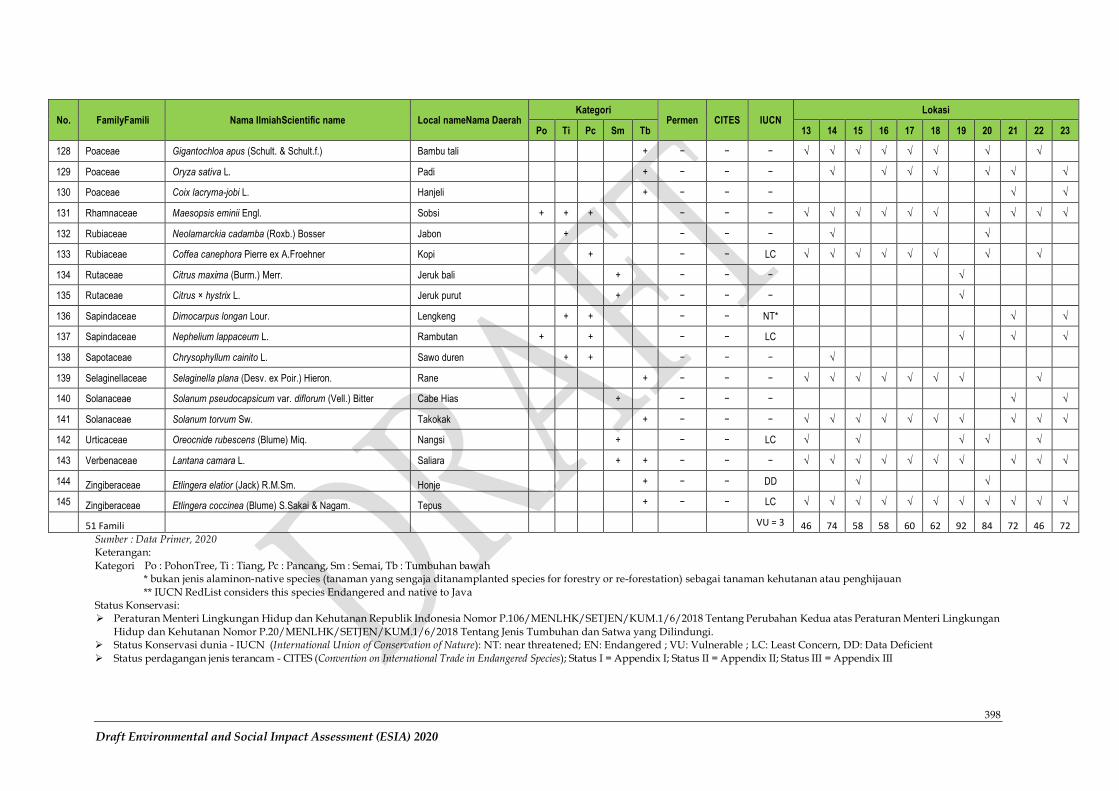
398
Draft Environmental and Social Impact Assessment (ESIA) 2020
No. FamilyFamili Nama IlmiahScientific name Local nameNama Daerah Kategori
Permen CITES IUCN Lokasi
Po Ti Pc Sm Tb 13 14 15 16 17 18 19 20 21 22 23
128 Poaceae Gigantochloa apus (Schult. & Schult.f.) Bambu tali + − − − √ √ √ √ √ √ √ √
129 Poaceae Oryza sativa L. Padi + − − − √ √ √ √ √ √ √
130 Poaceae Coix lacryma-jobi L. Hanjeli + − − − √ √
131 Rhamnaceae Maesopsis eminii Engl. Sobsi + + + − − − √ √ √ √ √ √ √ √ √ √
132 Rubiaceae Neolamarckia cadamba (Roxb.) Bosser Jabon + − − − √ √
133 Rubiaceae Coffea canephora Pierre ex A.Froehner Kopi + − − LC √ √ √ √ √ √ √ √
134 Rutaceae Citrus maxima (Burm.) Merr. Jeruk bali + − − − √
135 Rutaceae Citrus × hystrix L. Jeruk purut + − − − √
136 Sapindaceae Dimocarpus longan Lour. Lengkeng + + − − NT* √ √
137 Sapindaceae Nephelium lappaceum L. Rambutan + + − − LC √ √ √
138 Sapotaceae Chrysophyllum cainito L. Sawo duren + + − − − √
139 Selaginellaceae Selaginella plana (Desv. ex Poir.) Hieron. Rane + − − − √ √ √ √ √ √ √ √
140 Solanaceae Solanum pseudocapsicum var. diflorum (Vell.) Bitter Cabe Hias + − − − √ √
141 Solanaceae Solanum torvum Sw. Takokak + − − − √ √ √ √ √ √ √ √ √ √
142 Urticaceae Oreocnide rubescens (Blume) Miq. Nangsi + − − LC √ √ √ √ √
143 Verbenaceae Lantana camara L. Saliara + + − − − √ √ √ √ √ √ √ √ √ √
144 Zingiberaceae Etlingera elatior (Jack) R.M.Sm. Honje + − − DD √ √
145 Zingiberaceae Etlingera coccinea (Blume) S.Sakai & Nagam. Tepus + − − LC √ √ √ √ √ √ √ √ √ √ √
51 Famili VU = 3 46 74 58 58 60 62 92 84 72 46 72
Sumber : Data Primer, 2020 Keterangan:
Kategori Po : PohonTree, Ti : Tiang, Pc : Pancang, Sm : Semai, Tb : Tumbuhan bawah * bukan jenis alaminon-native species (tanaman yang sengaja ditanamplanted species for forestry or re-forestation) sebagai tanaman kehutanan atau penghijauan
** IUCN RedList considers this species Endangered and native to Java Status Konservasi: ➢ Peraturan Menteri Lingkungan Hidup dan Kehutanan Republik Indonesia Nomor P.106/MENLHK/SETJEN/KUM.1/6/2018 Tentang Perubahan Kedua atas Peraturan Menteri Lingkungan
Hidup dan Kehutanan Nomor P.20/MENLHK/SETJEN/KUM.1/6/2018 Tentang Jenis Tumbuhan dan Satwa yang Dilindungi. ➢ Status Konservasi dunia - IUCN (International Union of Conservation of Nature): NT: near threatened; EN: Endangered ; VU: Vulnerable ; LC: Least Concern, DD: Data Deficient
➢ Status perdagangan jenis terancam - CITES (Convention on International Trade in Endangered Species); Status I = Appendix I; Status II = Appendix II; Status III = Appendix III
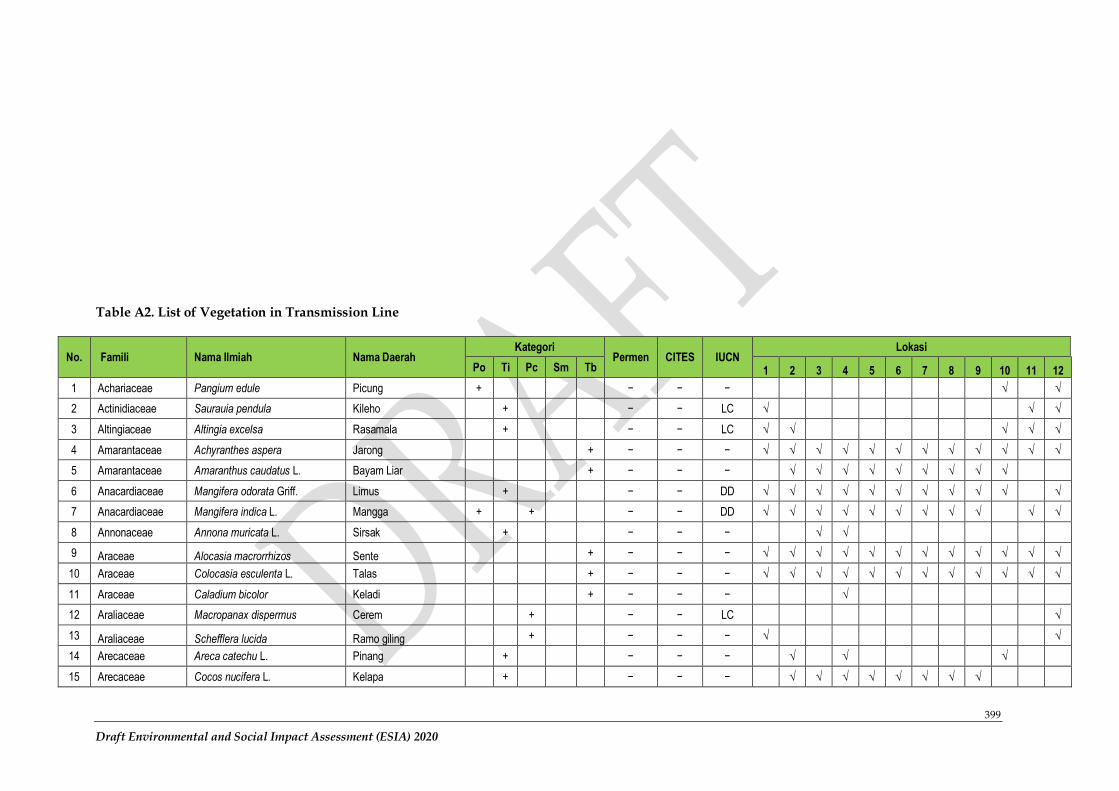
399
Draft Environmental and Social Impact Assessment (ESIA) 2020
Table A2. List of Vegetation in Transmission Line
No. Famili Nama Ilmiah Nama Daerah Kategori
Permen CITES IUCN Lokasi
Po Ti Pc Sm Tb 1 2 3 4 5 6 7 8 9 10 11 12
1 Achariaceae Pangium edule Picung + − − − √ √
2 Actinidiaceae Saurauia pendula Kileho + − − LC √ √ √
3 Altingiaceae Altingia excelsa Rasamala + − − LC √ √ √ √ √
4 Amarantaceae Achyranthes aspera Jarong + − − − √ √ √ √ √ √ √ √ √ √ √ √
5 Amarantaceae Amaranthus caudatus L. Bayam Liar + − − − √ √ √ √ √ √ √ √ √
6 Anacardiaceae Mangifera odorata Griff. Limus + − − DD √ √ √ √ √ √ √ √ √ √ √
7 Anacardiaceae Mangifera indica L. Mangga + + − − DD √ √ √ √ √ √ √ √ √ √ √
8 Annonaceae Annona muricata L. Sirsak + − − − √ √
9 Araceae Alocasia macrorrhizos Sente + − − − √ √ √ √ √ √ √ √ √ √ √ √
10 Araceae Colocasia esculenta L. Talas + − − − √ √ √ √ √ √ √ √ √ √ √ √
11 Araceae Caladium bicolor Keladi + − − − √
12 Araliaceae Macropanax dispermus Cerem + − − LC √
13 Araliaceae Schefflera lucida Ramo giling + − − − √ √
14 Arecaceae Areca catechu L. Pinang + − − − √ √ √
15 Arecaceae Cocos nucifera L. Kelapa + − − − √ √ √ √ √ √ √ √
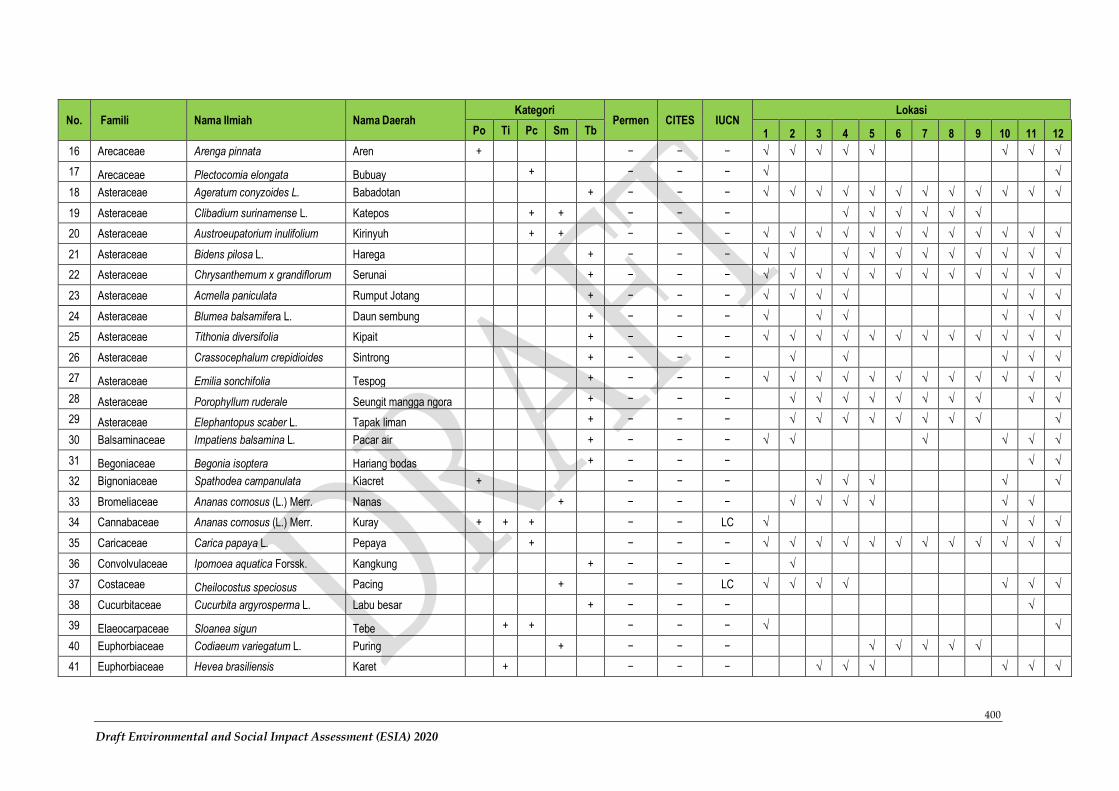
400
Draft Environmental and Social Impact Assessment (ESIA) 2020
No. Famili Nama Ilmiah Nama Daerah Kategori
Permen CITES IUCN Lokasi
Po Ti Pc Sm Tb 1 2 3 4 5 6 7 8 9 10 11 12
16 Arecaceae Arenga pinnata Aren + − − − √ √ √ √ √ √ √ √
17 Arecaceae Plectocomia elongata Bubuay + − − − √ √
18 Asteraceae Ageratum conyzoides L. Babadotan + − − − √ √ √ √ √ √ √ √ √ √ √ √
19 Asteraceae Clibadium surinamense L. Katepos + + − − − √ √ √ √ √ √
20 Asteraceae Austroeupatorium inulifolium Kirinyuh + + − − − √ √ √ √ √ √ √ √ √ √ √ √
21 Asteraceae Bidens pilosa L. Harega + − − − √ √ √ √ √ √ √ √ √ √ √
22 Asteraceae Chrysanthemum x grandiflorum Serunai + − − − √ √ √ √ √ √ √ √ √ √ √ √
23 Asteraceae Acmella paniculata Rumput Jotang + − − − √ √ √ √ √ √ √
24 Asteraceae Blumea balsamifera L. Daun sembung + − − − √ √ √ √ √ √
25 Asteraceae Tithonia diversifolia Kipait + − − − √ √ √ √ √ √ √ √ √ √ √ √
26 Asteraceae Crassocephalum crepidioides Sintrong + − − − √ √ √ √ √
27 Asteraceae Emilia sonchifolia Tespog + − − − √ √ √ √ √ √ √ √ √ √ √ √
28 Asteraceae Porophyllum ruderale Seungit mangga ngora + − − − √ √ √ √ √ √ √ √ √ √
29 Asteraceae Elephantopus scaber L. Tapak liman + − − − √ √ √ √ √ √ √ √ √
30 Balsaminaceae Impatiens balsamina L. Pacar air + − − − √ √ √ √ √ √
31 Begoniaceae Begonia isoptera Hariang bodas + − − − √ √
32 Bignoniaceae Spathodea campanulata Kiacret + − − − √ √ √ √ √
33 Bromeliaceae Ananas comosus (L.) Merr. Nanas + − − − √ √ √ √ √ √
34 Cannabaceae Ananas comosus (L.) Merr. Kuray + + + − − LC √ √ √ √
35 Caricaceae Carica papaya L. Pepaya + − − − √ √ √ √ √ √ √ √ √ √ √ √
36 Convolvulaceae Ipomoea aquatica Forssk. Kangkung + − − − √
37 Costaceae Cheilocostus speciosus Pacing + − − LC √ √ √ √ √ √ √
38 Cucurbitaceae Cucurbita argyrosperma L. Labu besar + − − − √
39 Elaeocarpaceae Sloanea sigun Tebe + + − − − √ √
40 Euphorbiaceae Codiaeum variegatum L. Puring + − − − √ √ √ √ √
41 Euphorbiaceae Hevea brasiliensis Karet + − − − √ √ √ √ √ √
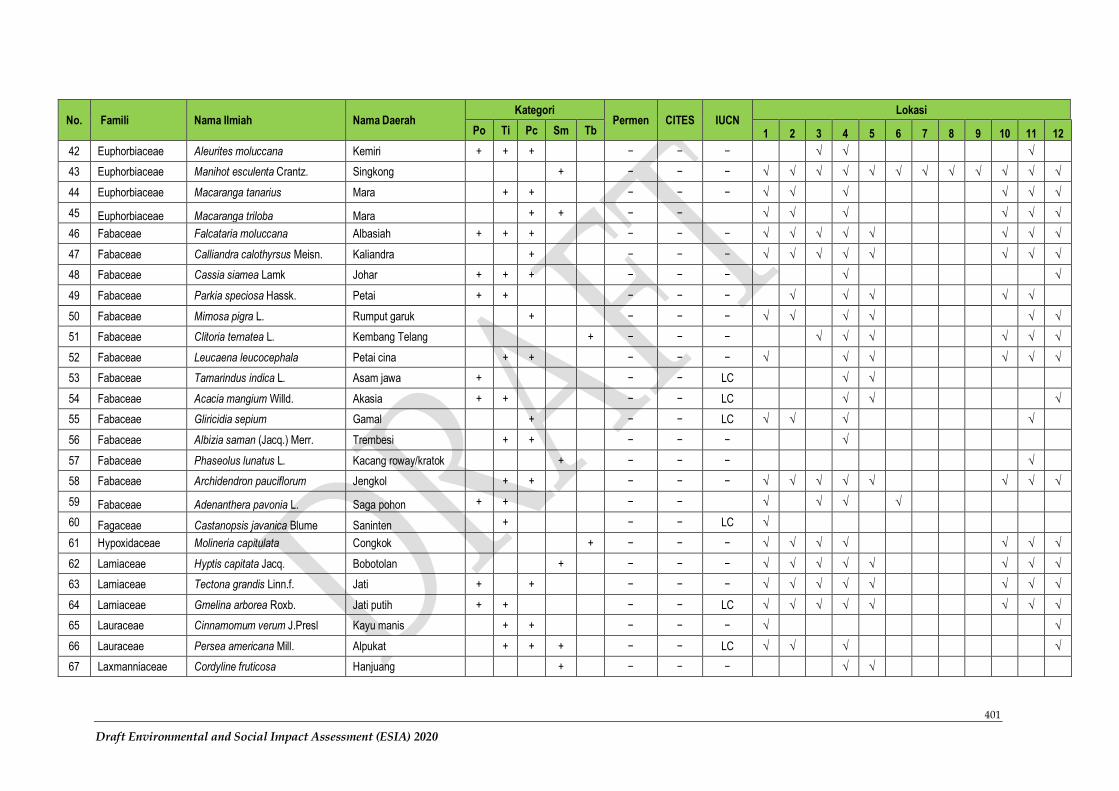
401
Draft Environmental and Social Impact Assessment (ESIA) 2020
No. Famili Nama Ilmiah Nama Daerah Kategori
Permen CITES IUCN Lokasi
Po Ti Pc Sm Tb 1 2 3 4 5 6 7 8 9 10 11 12
42 Euphorbiaceae Aleurites moluccana Kemiri + + + − − − √ √ √
43 Euphorbiaceae Manihot esculenta Crantz. Singkong + − − − √ √ √ √ √ √ √ √ √ √ √ √
44 Euphorbiaceae Macaranga tanarius Mara + + − − − √ √ √ √ √ √
45 Euphorbiaceae Macaranga triloba Mara + + − − √ √ √ √ √ √
46 Fabaceae Falcataria moluccana Albasiah + + + − − − √ √ √ √ √ √ √ √
47 Fabaceae Calliandra calothyrsus Meisn. Kaliandra + − − − √ √ √ √ √ √ √ √
48 Fabaceae Cassia siamea Lamk Johar + + + − − − √ √
49 Fabaceae Parkia speciosa Hassk. Petai + + − − − √ √ √ √ √
50 Fabaceae Mimosa pigra L. Rumput garuk + − − − √ √ √ √ √ √
51 Fabaceae Clitoria ternatea L. Kembang Telang + − − − √ √ √ √ √ √
52 Fabaceae Leucaena leucocephala Petai cina + + − − − √ √ √ √ √ √
53 Fabaceae Tamarindus indica L. Asam jawa + − − LC √ √
54 Fabaceae Acacia mangium Willd. Akasia + + − − LC √ √ √
55 Fabaceae Gliricidia sepium Gamal + − − LC √ √ √ √
56 Fabaceae Albizia saman (Jacq.) Merr. Trembesi + + − − − √
57 Fabaceae Phaseolus lunatus L. Kacang roway/kratok + − − − √
58 Fabaceae Archidendron pauciflorum Jengkol + + − − − √ √ √ √ √ √ √ √
59 Fabaceae Adenanthera pavonia L. Saga pohon + + − − √ √ √ √
60 Fagaceae Castanopsis javanica Blume Saninten + − − LC √
61 Hypoxidaceae Molineria capitulata Congkok + − − − √ √ √ √ √ √ √
62 Lamiaceae Hyptis capitata Jacq. Bobotolan + − − − √ √ √ √ √ √ √ √
63 Lamiaceae Tectona grandis Linn.f. Jati + + − − − √ √ √ √ √ √ √ √
64 Lamiaceae Gmelina arborea Roxb. Jati putih + + − − LC √ √ √ √ √ √ √ √
65 Lauraceae Cinnamomum verum J.Presl Kayu manis + + − − − √ √
66 Lauraceae Persea americana Mill. Alpukat + + + − − LC √ √ √ √
67 Laxmanniaceae Cordyline fruticosa Hanjuang + − − − √ √
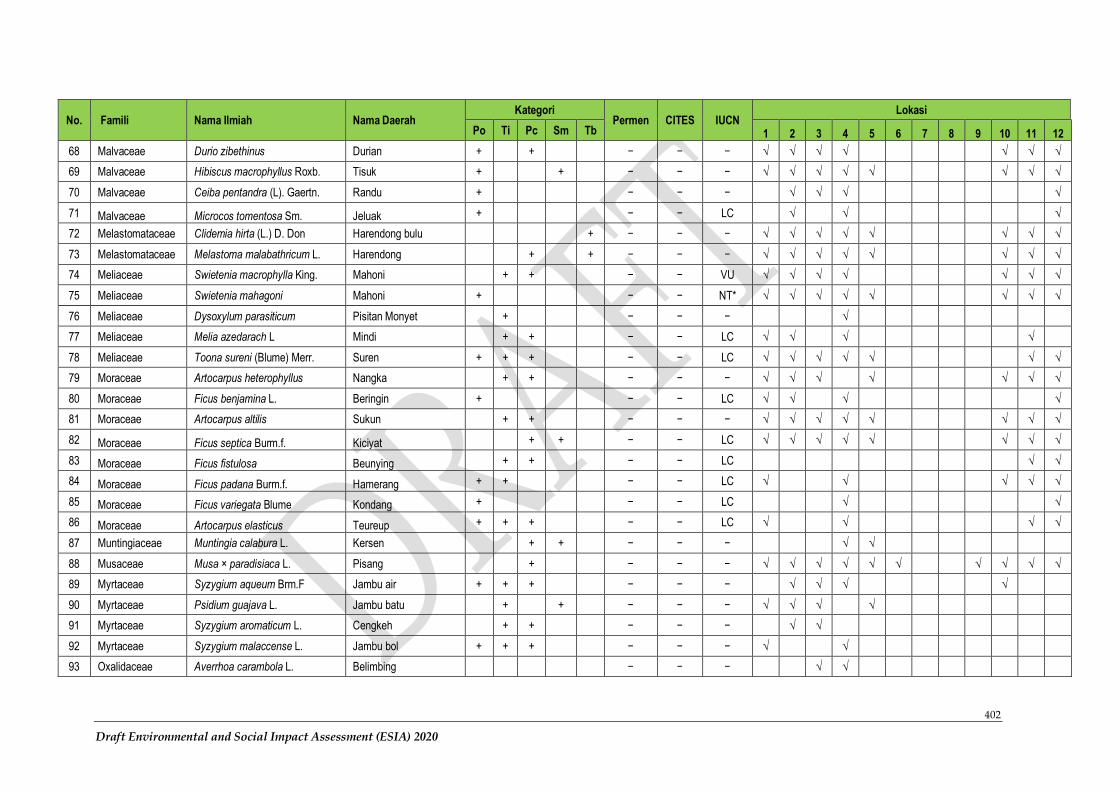
402
Draft Environmental and Social Impact Assessment (ESIA) 2020
No. Famili Nama Ilmiah Nama Daerah Kategori
Permen CITES IUCN Lokasi
Po Ti Pc Sm Tb 1 2 3 4 5 6 7 8 9 10 11 12
68 Malvaceae Durio zibethinus Durian + + − − − √ √ √ √ √ √ √
69 Malvaceae Hibiscus macrophyllus Roxb. Tisuk + + − − − √ √ √ √ √ √ √ √
70 Malvaceae Ceiba pentandra (L). Gaertn. Randu + − − − √ √ √ √
71 Malvaceae Microcos tomentosa Sm. Jeluak + − − LC √ √ √
72 Melastomataceae Clidemia hirta (L.) D. Don Harendong bulu + − − − √ √ √ √ √ √ √ √
73 Melastomataceae Melastoma malabathricum L. Harendong + + − − − √ √ √ √ √ √ √ √
74 Meliaceae Swietenia macrophylla King. Mahoni + + − − VU √ √ √ √ √ √ √
75 Meliaceae Swietenia mahagoni Mahoni + − − NT* √ √ √ √ √ √ √ √
76 Meliaceae Dysoxylum parasiticum Pisitan Monyet + − − − √
77 Meliaceae Melia azedarach L Mindi + + − − LC √ √ √ √
78 Meliaceae Toona sureni (Blume) Merr. Suren + + + − − LC √ √ √ √ √ √ √
79 Moraceae Artocarpus heterophyllus Nangka + + − − − √ √ √ √ √ √ √
80 Moraceae Ficus benjamina L. Beringin + − − LC √ √ √ √
81 Moraceae Artocarpus altilis Sukun + + − − − √ √ √ √ √ √ √ √
82 Moraceae Ficus septica Burm.f. Kiciyat + + − − LC √ √ √ √ √ √ √ √
83 Moraceae Ficus fistulosa Beunying + + − − LC √ √
84 Moraceae Ficus padana Burm.f. Hamerang + + − − LC √ √ √ √ √
85 Moraceae Ficus variegata Blume Kondang + − − LC √ √
86 Moraceae Artocarpus elasticus Teureup + + + − − LC √ √ √ √
87 Muntingiaceae Muntingia calabura L. Kersen + + − − − √ √
88 Musaceae Musa × paradisiaca L. Pisang + − − − √ √ √ √ √ √ √ √ √ √
89 Myrtaceae Syzygium aqueum Brm.F Jambu air + + + − − − √ √ √ √
90 Myrtaceae Psidium guajava L. Jambu batu + + − − − √ √ √ √
91 Myrtaceae Syzygium aromaticum L. Cengkeh + + − − − √ √
92 Myrtaceae Syzygium malaccense L. Jambu bol + + + − − − √ √
93 Oxalidaceae Averrhoa carambola L. Belimbing − − − √ √
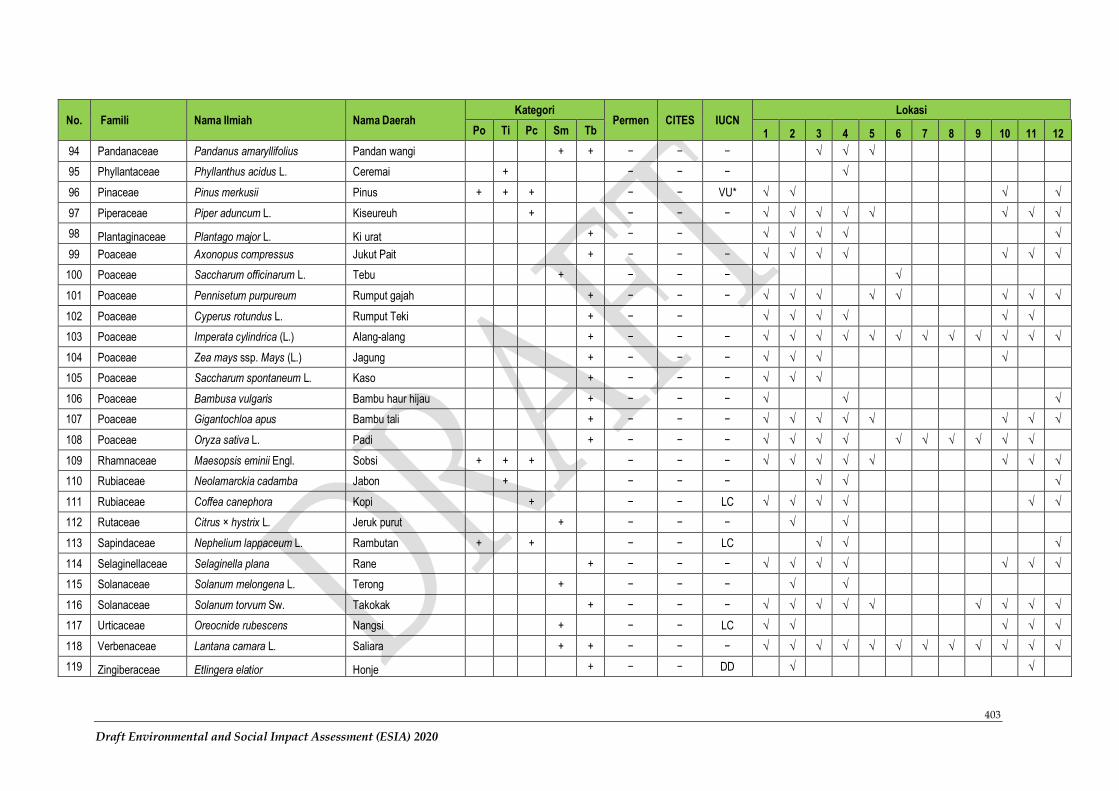
403
Draft Environmental and Social Impact Assessment (ESIA) 2020
No. Famili Nama Ilmiah Nama Daerah Kategori
Permen CITES IUCN Lokasi
Po Ti Pc Sm Tb 1 2 3 4 5 6 7 8 9 10 11 12
94 Pandanaceae Pandanus amaryllifolius Pandan wangi + + − − − √ √ √
95 Phyllantaceae Phyllanthus acidus L. Ceremai + − − − √
96 Pinaceae Pinus merkusii Pinus + + + − − VU* √ √ √ √
97 Piperaceae Piper aduncum L. Kiseureuh + − − − √ √ √ √ √ √ √ √
98 Plantaginaceae Plantago major L. Ki urat + − − √ √ √ √ √
99 Poaceae Axonopus compressus Jukut Pait + − − − √ √ √ √ √ √ √
100 Poaceae Saccharum officinarum L. Tebu + − − − √
101 Poaceae Pennisetum purpureum Rumput gajah + − − − √ √ √ √ √ √ √ √
102 Poaceae Cyperus rotundus L. Rumput Teki + − − √ √ √ √ √ √
103 Poaceae Imperata cylindrica (L.) Alang-alang + − − − √ √ √ √ √ √ √ √ √ √ √ √
104 Poaceae Zea mays ssp. Mays (L.) Jagung + − − − √ √ √ √
105 Poaceae Saccharum spontaneum L. Kaso + − − − √ √ √
106 Poaceae Bambusa vulgaris Bambu haur hijau + − − − √ √ √
107 Poaceae Gigantochloa apus Bambu tali + − − − √ √ √ √ √ √ √ √
108 Poaceae Oryza sativa L. Padi + − − − √ √ √ √ √ √ √ √ √ √
109 Rhamnaceae Maesopsis eminii Engl. Sobsi + + + − − − √ √ √ √ √ √ √ √
110 Rubiaceae Neolamarckia cadamba Jabon + − − − √ √ √
111 Rubiaceae Coffea canephora Kopi + − − LC √ √ √ √ √ √
112 Rutaceae Citrus × hystrix L. Jeruk purut + − − − √ √
113 Sapindaceae Nephelium lappaceum L. Rambutan + + − − LC √ √ √
114 Selaginellaceae Selaginella plana Rane + − − − √ √ √ √ √ √ √
115 Solanaceae Solanum melongena L. Terong + − − − √ √
116 Solanaceae Solanum torvum Sw. Takokak + − − − √ √ √ √ √ √ √ √ √
117 Urticaceae Oreocnide rubescens Nangsi + − − LC √ √ √ √ √
118 Verbenaceae Lantana camara L. Saliara + + − − − √ √ √ √ √ √ √ √ √ √ √ √
119 Zingiberaceae Etlingera elatior Honje + − − DD √ √
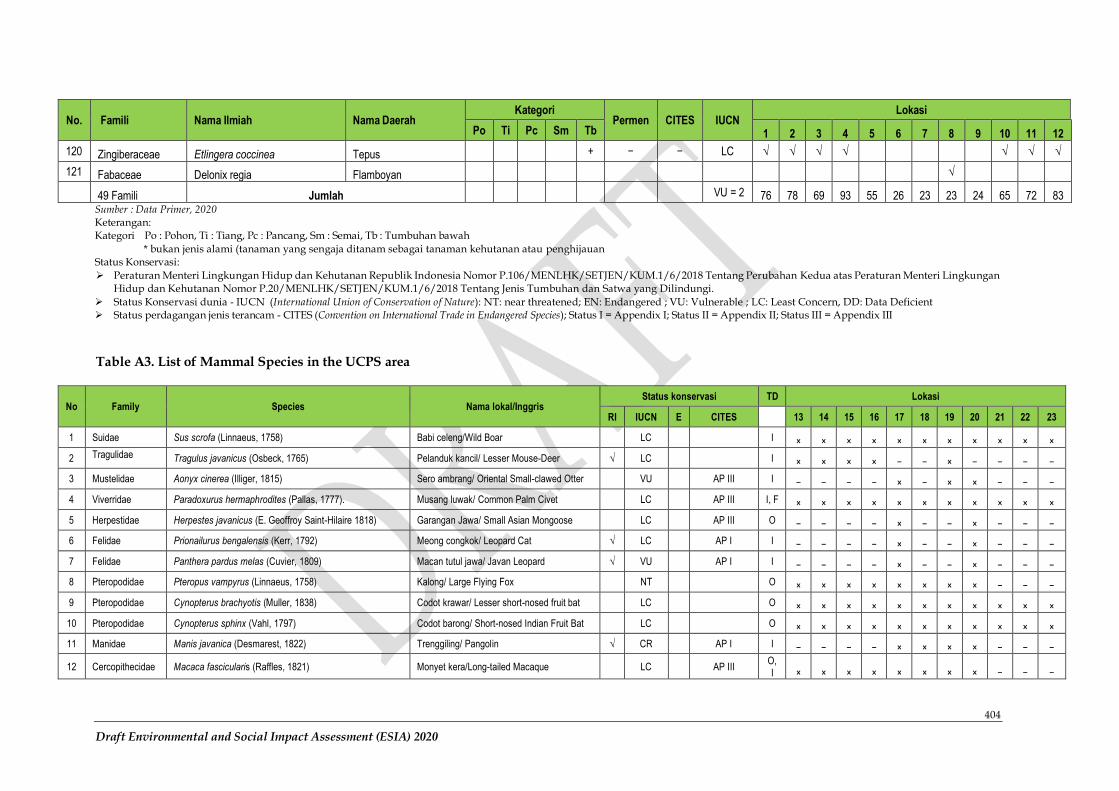
404
Draft Environmental and Social Impact Assessment (ESIA) 2020
No. Famili Nama Ilmiah Nama Daerah Kategori
Permen CITES IUCN Lokasi
Po Ti Pc Sm Tb 1 2 3 4 5 6 7 8 9 10 11 12
120 Zingiberaceae Etlingera coccinea Tepus + − − LC √ √ √ √ √ √ √
121 Fabaceae Delonix regia Flamboyan √
49 Famili Jumlah VU = 2 76 78 69 93 55 26 23 23 24 65 72 83 Sumber : Data Primer, 2020 Keterangan: Kategori Po : Pohon, Ti : Tiang, Pc : Pancang, Sm : Semai, Tb : Tumbuhan bawah
* bukan jenis alami (tanaman yang sengaja ditanam sebagai tanaman kehutanan atau penghijauan Status Konservasi:
➢ Peraturan Menteri Lingkungan Hidup dan Kehutanan Republik Indonesia Nomor P.106/MENLHK/SETJEN/KUM.1/6/2018 Tentang Perubahan Kedua atas Peraturan Menteri Lingkungan Hidup dan Kehutanan Nomor P.20/MENLHK/SETJEN/KUM.1/6/2018 Tentang Jenis Tumbuhan dan Satwa yang Dilindungi.
➢ Status Konservasi dunia - IUCN (International Union of Conservation of Nature): NT: near threatened; EN: Endangered ; VU: Vulnerable ; LC: Least Concern, DD: Data Deficient ➢ Status perdagangan jenis terancam - CITES (Convention on International Trade in Endangered Species); Status I = Appendix I; Status II = Appendix II; Status III = Appendix III
Table A3. List of Mammal Species in the UCPS area
No Family Species Nama lokal/Inggris Status konservasi TD Lokasi
RI IUCN E CITES 13 14 15 16 17 18 19 20 21 22 23
1 Suidae Sus scrofa (Linnaeus, 1758) Babi celeng/Wild Boar LC I × × × × × × × × × × ×
2 Tragulidae Tragulus javanicus (Osbeck, 1765) Pelanduk kancil/ Lesser Mouse-Deer √ LC I × × × × − − × − − − −
3 Mustelidae Aonyx cinerea (Illiger, 1815) Sero ambrang/ Oriental Small-clawed Otter VU AP III I − − − − × − × × − − −
4 Viverridae Paradoxurus hermaphrodites (Pallas, 1777). Musang luwak/ Common Palm Civet LC AP III I, F × × × × × × × × × × ×
5 Herpestidae Herpestes javanicus (E. Geoffroy Saint-Hilaire 1818) Garangan Jawa/ Small Asian Mongoose LC AP III O − − − − × − − × − − −
6 Felidae Prionailurus bengalensis (Kerr, 1792) Meong congkok/ Leopard Cat √ LC AP I I − − − − × − − × − − −
7 Felidae Panthera pardus melas (Cuvier, 1809) Macan tutul jawa/ Javan Leopard √ VU AP I I − − − − × − − × − − −
8 Pteropodidae Pteropus vampyrus (Linnaeus, 1758) Kalong/ Large Flying Fox NT O × × × × × × × × − − −
9 Pteropodidae Cynopterus brachyotis (Muller, 1838) Codot krawar/ Lesser short-nosed fruit bat LC O × × × × × × × × × × ×
10 Pteropodidae Cynopterus sphinx (Vahl, 1797) Codot barong/ Short-nosed Indian Fruit Bat LC O × × × × × × × × × × ×
11 Manidae Manis javanica (Desmarest, 1822) Trenggiling/ Pangolin √ CR AP I I − − − − × × × × − − −
12 Cercopithecidae Macaca fascicularis (Raffles, 1821) Monyet kera/Long-tailed Macaque LC AP III O, I × × × × × × × × − − −
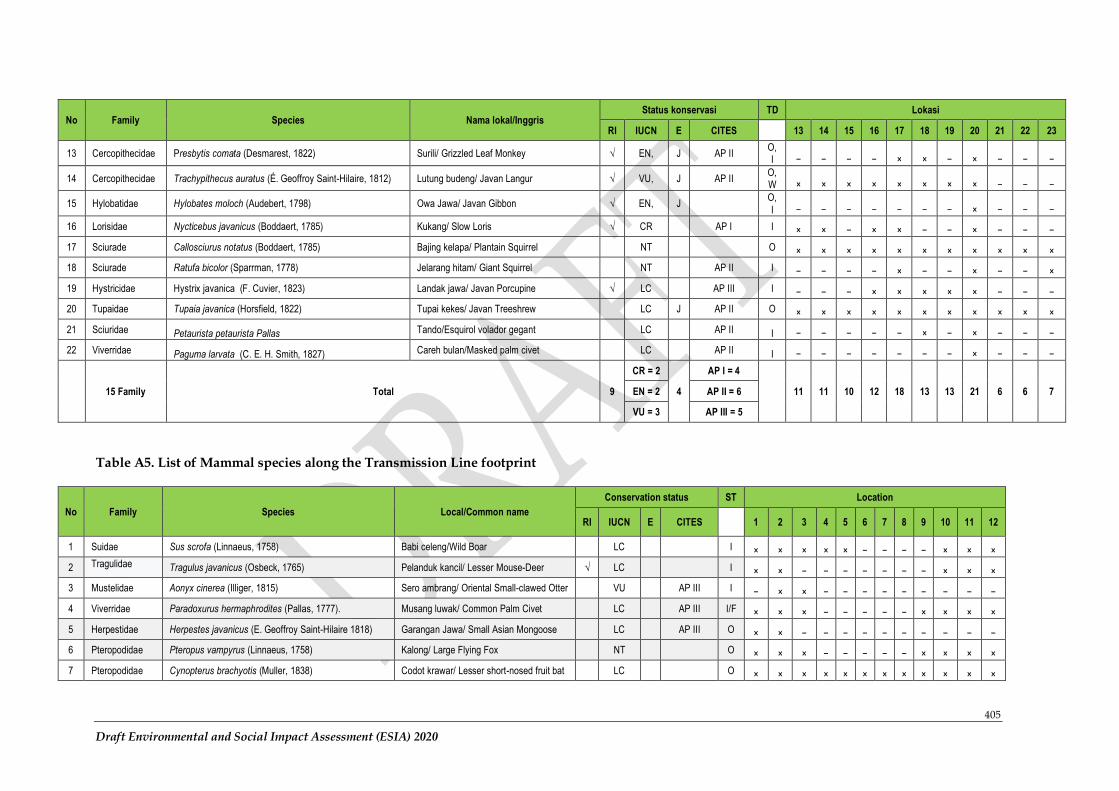
405
Draft Environmental and Social Impact Assessment (ESIA) 2020
No Family Species Nama lokal/Inggris Status konservasi TD Lokasi
RI IUCN E CITES 13 14 15 16 17 18 19 20 21 22 23
13 Cercopithecidae Presbytis comata (Desmarest, 1822) Surili/ Grizzled Leaf Monkey √ EN, J AP II O, I − − − − × × − × − − −
14 Cercopithecidae Trachypithecus auratus (É. Geoffroy Saint-Hilaire, 1812) Lutung budeng/ Javan Langur √ VU, J AP II O, W × × × × × × × × − − −
15 Hylobatidae Hylobates moloch (Audebert, 1798) Owa Jawa/ Javan Gibbon √ EN, J O,
I − − − − − − − × − − −
16 Lorisidae Nycticebus javanicus (Boddaert, 1785) Kukang/ Slow Loris √ CR AP I I × × − × × − − × − − −
17 Sciurade Callosciurus notatus (Boddaert, 1785) Bajing kelapa/ Plantain Squirrel NT O × × × × × × × × × × ×
18 Sciurade Ratufa bicolor (Sparrman, 1778) Jelarang hitam/ Giant Squirrel NT AP II I − − − − × − − × − − ×
19 Hystricidae Hystrix javanica (F. Cuvier, 1823) Landak jawa/ Javan Porcupine √ LC AP III I − − − × × × × × − − −
20 Tupaidae Tupaia javanica (Horsfield, 1822) Tupai kekes/ Javan Treeshrew LC J AP II O × × × × × × × × × × ×
21 Sciuridae Petaurista petaurista Pallas Tando/Esquirol volador gegant LC AP II I − − − − − × − × − − −
22 Viverridae Paguma larvata (C. E. H. Smith, 1827) Careh bulan/Masked palm civet LC AP II I − − − − − − − × − − −
15 Family Total 9
CR = 2
4
AP I = 4
11 11 10 12 18 13 13 21 6 6 7 EN = 2 AP II = 6
VU = 3 AP III = 5
Table A5. List of Mammal species along the Transmission Line footprint
No Family Species Local/Common name
Conservation status ST Location
RI IUCN E CITES
1 2 3 4 5 6 7 8 9 10 11 12
1 Suidae Sus scrofa (Linnaeus, 1758) Babi celeng/Wild Boar LC I × × × × × − − − − × × ×
2 Tragulidae Tragulus javanicus (Osbeck, 1765) Pelanduk kancil/ Lesser Mouse-Deer √ LC I × × − − − − − − − × × ×
3 Mustelidae Aonyx cinerea (Illiger, 1815) Sero ambrang/ Oriental Small-clawed Otter VU AP III I − × × − − − − − − − − −
4 Viverridae Paradoxurus hermaphrodites (Pallas, 1777). Musang luwak/ Common Palm Civet LC AP III I/F × × × − − − − − × × × ×
5 Herpestidae Herpestes javanicus (E. Geoffroy Saint-Hilaire 1818) Garangan Jawa/ Small Asian Mongoose LC AP III O × × − − − − − − − − − −
6 Pteropodidae Pteropus vampyrus (Linnaeus, 1758) Kalong/ Large Flying Fox NT O × × × − − − − − × × × ×
7 Pteropodidae Cynopterus brachyotis (Muller, 1838) Codot krawar/ Lesser short-nosed fruit bat LC O × × × × × × × × × × × ×
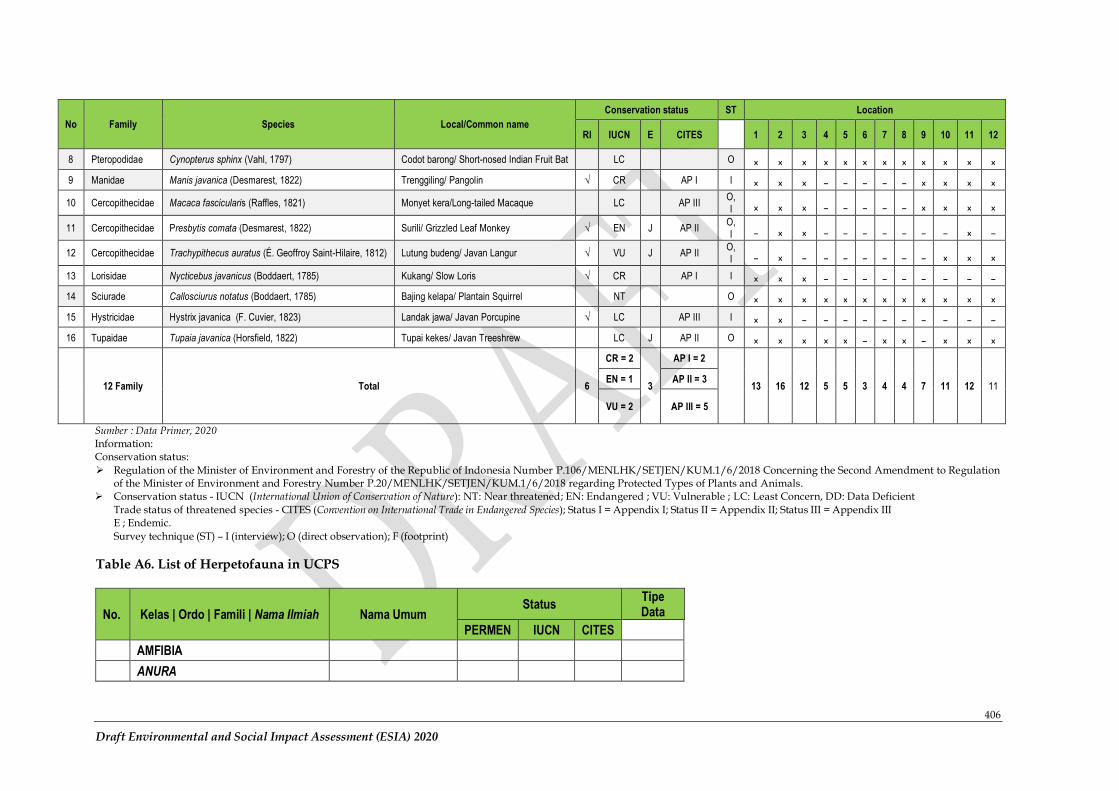
406
Draft Environmental and Social Impact Assessment (ESIA) 2020
No Family Species Local/Common name
Conservation status ST Location
RI IUCN E CITES
1 2 3 4 5 6 7 8 9 10 11 12
8 Pteropodidae Cynopterus sphinx (Vahl, 1797) Codot barong/ Short-nosed Indian Fruit Bat LC O × × × × × × × × × × × ×
9 Manidae Manis javanica (Desmarest, 1822) Trenggiling/ Pangolin √ CR AP I I × × × − − − − − × × × ×
10 Cercopithecidae Macaca fascicularis (Raffles, 1821) Monyet kera/Long-tailed Macaque LC AP III O, I × × × − − − − − × × × ×
11 Cercopithecidae Presbytis comata (Desmarest, 1822) Surili/ Grizzled Leaf Monkey √ EN J AP II O, I − × × − − − − − − − × −
12 Cercopithecidae Trachypithecus auratus (É. Geoffroy Saint-Hilaire, 1812) Lutung budeng/ Javan Langur √ VU J AP II O, I − × − − − − − − − × × ×
13 Lorisidae Nycticebus javanicus (Boddaert, 1785) Kukang/ Slow Loris √ CR AP I I × × × − − − − − − − − −
14 Sciurade Callosciurus notatus (Boddaert, 1785) Bajing kelapa/ Plantain Squirrel NT O × × × × × × × × × × × ×
15 Hystricidae Hystrix javanica (F. Cuvier, 1823) Landak jawa/ Javan Porcupine √ LC AP III I × × − − − − − − − − − −
16 Tupaidae Tupaia javanica (Horsfield, 1822) Tupai kekes/ Javan Treeshrew LC J AP II O × × × × × − × × − × × ×
12 Family Total 6
CR = 2
3
AP I = 2
13 16 12 5 5 3 4 4 7 11 12 11 EN = 1 AP II = 3
VU = 2 AP III = 5
Sumber : Data Primer, 2020 Information: Conservation status:
➢ Regulation of the Minister of Environment and Forestry of the Republic of Indonesia Number P.106/MENLHK/SETJEN/KUM.1/6/2018 Concerning the Second Amendment to Regulation of the Minister of Environment and Forestry Number P.20/MENLHK/SETJEN/KUM.1/6/2018 regarding Protected Types of Plants and Animals.
➢ Conservation status - IUCN (International Union of Conservation of Nature): NT: Near threatened; EN: Endangered ; VU: Vulnerable ; LC: Least Concern, DD: Data Deficient
Trade status of threatened species - CITES (Convention on International Trade in Endangered Species); Status I = Appendix I; Status II = Appendix II; Status III = Appendix III E ; Endemic.
Survey technique (ST) – I (interview); O (direct observation); F (footprint)
Table A6. List of Herpetofauna in UCPS
No. Kelas | Ordo | Famili | Nama Ilmiah Nama Umum Status
Tipe Data
PERMEN IUCN CITES
AMFIBIA
ANURA
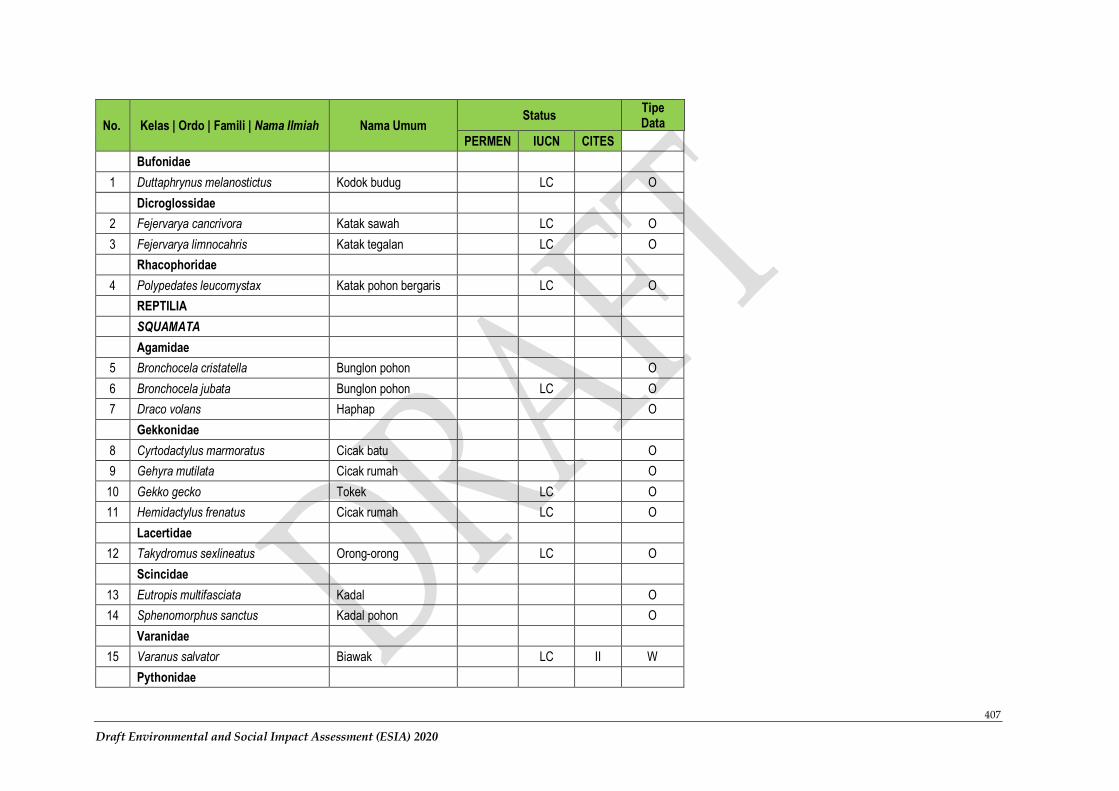
407
Draft Environmental and Social Impact Assessment (ESIA) 2020
No. Kelas | Ordo | Famili | Nama Ilmiah Nama Umum Status
Tipe Data
PERMEN IUCN CITES
Bufonidae
1 Duttaphrynus melanostictus Kodok budug LC O
Dicroglossidae
2 Fejervarya cancrivora Katak sawah LC O
3 Fejervarya limnocahris Katak tegalan LC O
Rhacophoridae
4 Polypedates leucomystax Katak pohon bergaris LC O
REPTILIA
SQUAMATA
Agamidae
5 Bronchocela cristatella Bunglon pohon O
6 Bronchocela jubata Bunglon pohon LC O
7 Draco volans Haphap O
Gekkonidae
8 Cyrtodactylus marmoratus Cicak batu O
9 Gehyra mutilata Cicak rumah O
10 Gekko gecko Tokek LC O
11 Hemidactylus frenatus Cicak rumah LC O
Lacertidae
12 Takydromus sexlineatus Orong-orong LC O
Scincidae
13 Eutropis multifasciata Kadal O
14 Sphenomorphus sanctus Kadal pohon O
Varanidae
15 Varanus salvator Biawak LC II W
Pythonidae
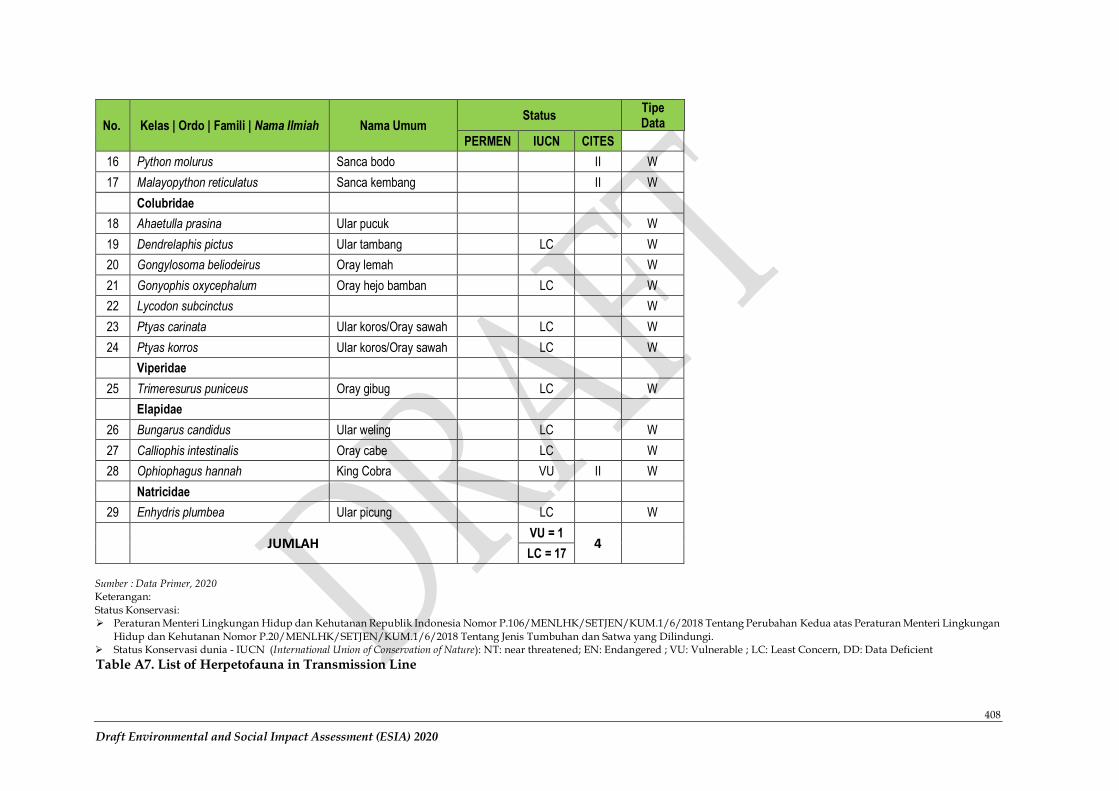
408
Draft Environmental and Social Impact Assessment (ESIA) 2020
No. Kelas | Ordo | Famili | Nama Ilmiah Nama Umum Status
Tipe Data
PERMEN IUCN CITES
16 Python molurus Sanca bodo II W
17 Malayopython reticulatus Sanca kembang II W
Colubridae
18 Ahaetulla prasina Ular pucuk W
19 Dendrelaphis pictus Ular tambang LC W
20 Gongylosoma beliodeirus Oray lemah W
21 Gonyophis oxycephalum Oray hejo bamban LC W
22 Lycodon subcinctus W
23 Ptyas carinata Ular koros/Oray sawah LC W
24 Ptyas korros Ular koros/Oray sawah LC W
Viperidae
25 Trimeresurus puniceus Oray gibug LC W
Elapidae
26 Bungarus candidus Ular weling LC W
27 Calliophis intestinalis Oray cabe LC W
28 Ophiophagus hannah King Cobra VU II W
Natricidae
29 Enhydris plumbea Ular picung LC W
JUMLAH
VU = 1 4
LC = 17
Sumber : Data Primer, 2020 Keterangan:
Status Konservasi: ➢ Peraturan Menteri Lingkungan Hidup dan Kehutanan Republik Indonesia Nomor P.106/MENLHK/SETJEN/KUM.1/6/2018 Tentang Perubahan Kedua atas Peraturan Menteri Lingkungan
Hidup dan Kehutanan Nomor P.20/MENLHK/SETJEN/KUM.1/6/2018 Tentang Jenis Tumbuhan dan Satwa yang Dilindungi. ➢ Status Konservasi dunia - IUCN (International Union of Conservation of Nature): NT: near threatened; EN: Endangered ; VU: Vulnerable ; LC: Least Concern, DD: Data Deficient
Table A7. List of Herpetofauna in Transmission Line
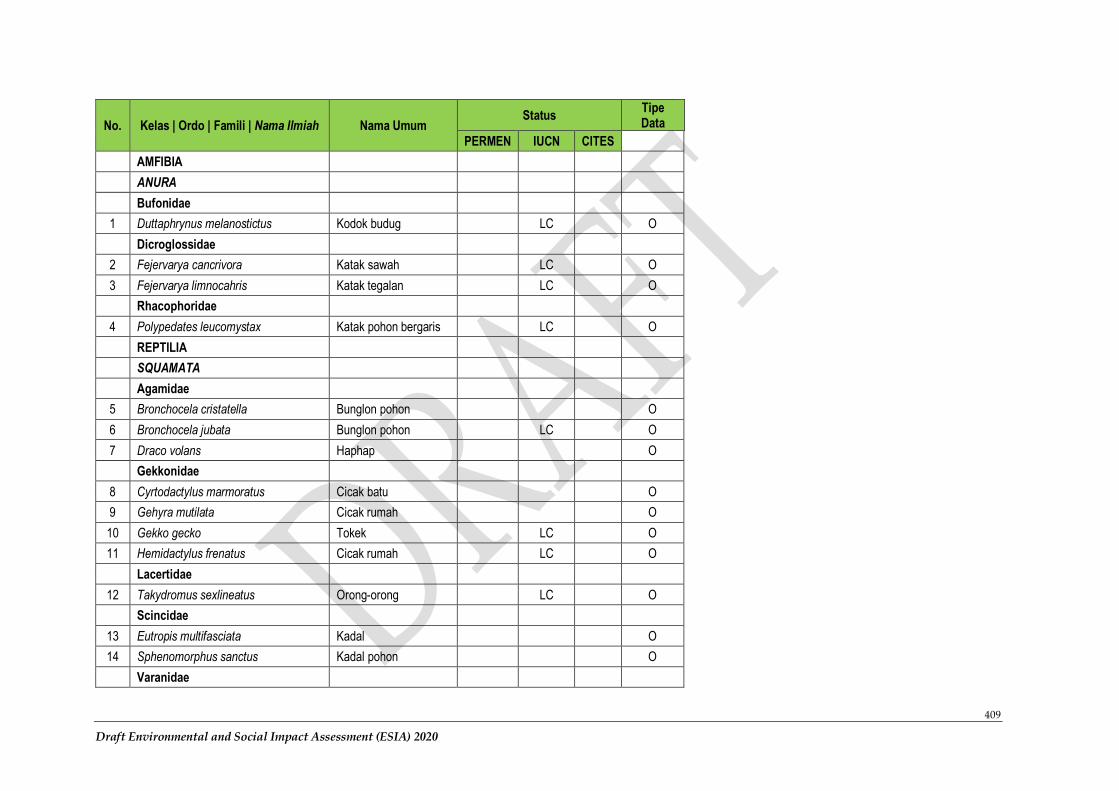
409
Draft Environmental and Social Impact Assessment (ESIA) 2020
No. Kelas | Ordo | Famili | Nama Ilmiah Nama Umum Status
Tipe Data
PERMEN IUCN CITES
AMFIBIA
ANURA
Bufonidae
1 Duttaphrynus melanostictus Kodok budug LC O
Dicroglossidae
2 Fejervarya cancrivora Katak sawah LC O
3 Fejervarya limnocahris Katak tegalan LC O
Rhacophoridae
4 Polypedates leucomystax Katak pohon bergaris LC O
REPTILIA
SQUAMATA
Agamidae
5 Bronchocela cristatella Bunglon pohon O
6 Bronchocela jubata Bunglon pohon LC O
7 Draco volans Haphap O
Gekkonidae
8 Cyrtodactylus marmoratus Cicak batu O
9 Gehyra mutilata Cicak rumah O
10 Gekko gecko Tokek LC O
11 Hemidactylus frenatus Cicak rumah LC O
Lacertidae
12 Takydromus sexlineatus Orong-orong LC O
Scincidae
13 Eutropis multifasciata Kadal O
14 Sphenomorphus sanctus Kadal pohon O
Varanidae
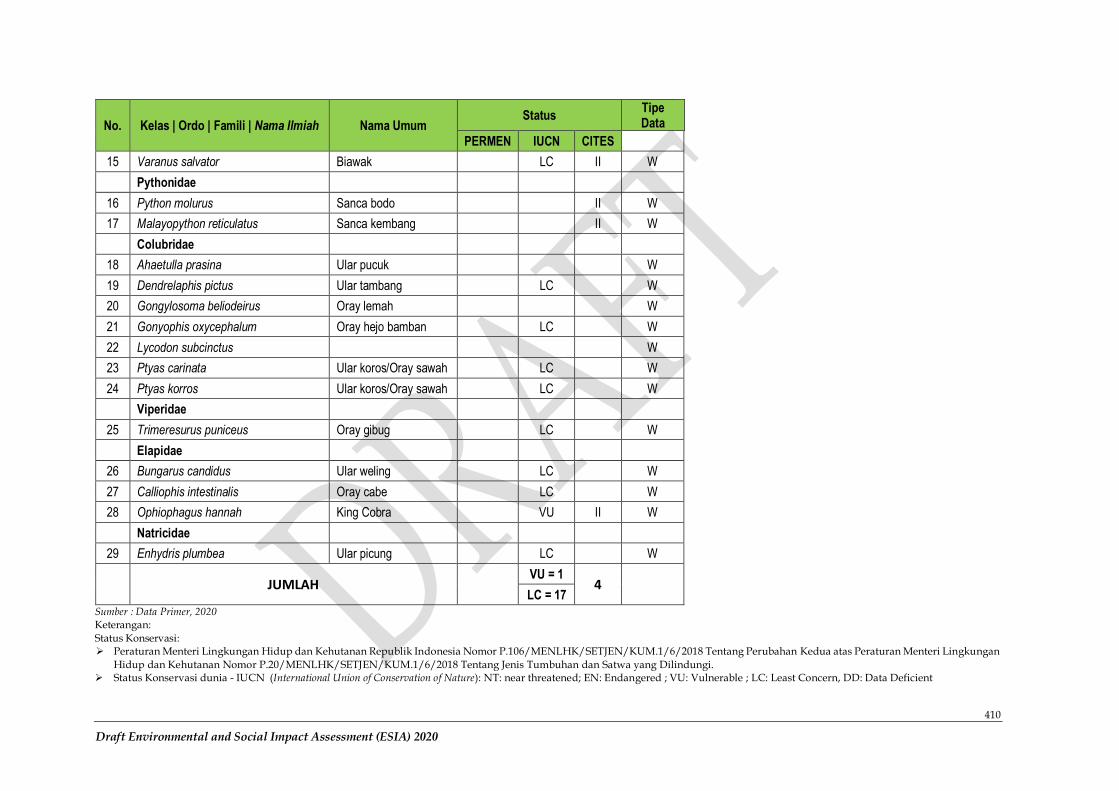
410
Draft Environmental and Social Impact Assessment (ESIA) 2020
No. Kelas | Ordo | Famili | Nama Ilmiah Nama Umum Status
Tipe Data
PERMEN IUCN CITES
15 Varanus salvator Biawak LC II W
Pythonidae
16 Python molurus Sanca bodo II W
17 Malayopython reticulatus Sanca kembang II W
Colubridae
18 Ahaetulla prasina Ular pucuk W
19 Dendrelaphis pictus Ular tambang LC W
20 Gongylosoma beliodeirus Oray lemah W
21 Gonyophis oxycephalum Oray hejo bamban LC W
22 Lycodon subcinctus W
23 Ptyas carinata Ular koros/Oray sawah LC W
24 Ptyas korros Ular koros/Oray sawah LC W
Viperidae
25 Trimeresurus puniceus Oray gibug LC W
Elapidae
26 Bungarus candidus Ular weling LC W
27 Calliophis intestinalis Oray cabe LC W
28 Ophiophagus hannah King Cobra VU II W
Natricidae
29 Enhydris plumbea Ular picung LC W
JUMLAH
VU = 1 4
LC = 17 Sumber : Data Primer, 2020 Keterangan:
Status Konservasi: ➢ Peraturan Menteri Lingkungan Hidup dan Kehutanan Republik Indonesia Nomor P.106/MENLHK/SETJEN/KUM.1/6/2018 Tentang Perubahan Kedua atas Peraturan Menteri Lingkungan
Hidup dan Kehutanan Nomor P.20/MENLHK/SETJEN/KUM.1/6/2018 Tentang Jenis Tumbuhan dan Satwa yang Dilindungi. ➢ Status Konservasi dunia - IUCN (International Union of Conservation of Nature): NT: near threatened; EN: Endangered ; VU: Vulnerable ; LC: Least Concern, DD: Data Deficient
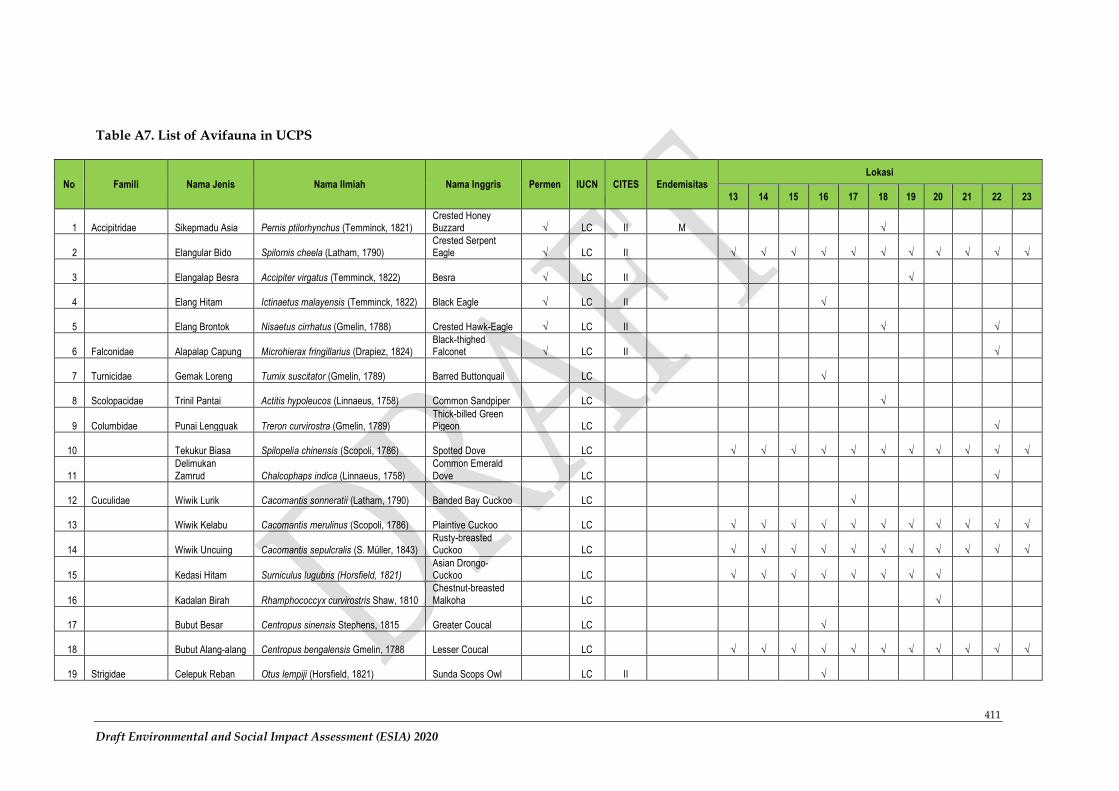
411
Draft Environmental and Social Impact Assessment (ESIA) 2020
Table A7. List of Avifauna in UCPS
No Famili Nama Jenis Nama Ilmiah Nama Inggris Permen IUCN CITES Endemisitas Lokasi
13 14 15 16 17 18 19 20 21 22 23
1 Accipitridae Sikepmadu Asia Pernis ptilorhynchus (Temminck, 1821) Crested Honey Buzzard √ LC II M √
2 Elangular Bido Spilornis cheela (Latham, 1790) Crested Serpent Eagle √ LC II √ √ √ √ √ √ √ √ √ √ √
3 Elangalap Besra Accipiter virgatus (Temminck, 1822) Besra √ LC II √
4 Elang Hitam Ictinaetus malayensis (Temminck, 1822) Black Eagle √ LC II √
5 Elang Brontok Nisaetus cirrhatus (Gmelin, 1788) Crested Hawk-Eagle √ LC II √ √
6 Falconidae Alapalap Capung Microhierax fringillarius (Drapiez, 1824) Black-thighed Falconet √ LC II √
7 Turnicidae Gemak Loreng Turnix suscitator (Gmelin, 1789) Barred Buttonquail LC √
8 Scolopacidae Trinil Pantai Actitis hypoleucos (Linnaeus, 1758) Common Sandpiper LC √
9 Columbidae Punai Lengguak Treron curvirostra (Gmelin, 1789) Thick-billed Green Pigeon LC √
10 Tekukur Biasa Spilopelia chinensis (Scopoli, 1786) Spotted Dove LC √ √ √ √ √ √ √ √ √ √ √
11
Delimukan
Zamrud Chalcophaps indica (Linnaeus, 1758)
Common Emerald
Dove LC √
12 Cuculidae Wiwik Lurik Cacomantis sonneratii (Latham, 1790) Banded Bay Cuckoo LC √
13 Wiwik Kelabu Cacomantis merulinus (Scopoli, 1786) Plaintive Cuckoo LC √ √ √ √ √ √ √ √ √ √ √
14 Wiwik Uncuing Cacomantis sepulcralis (S. Müller, 1843) Rusty-breasted Cuckoo LC √ √ √ √ √ √ √ √ √ √ √
15 Kedasi Hitam Surniculus lugubris (Horsfield, 1821) Asian Drongo-Cuckoo LC √ √ √ √ √ √ √ √
16 Kadalan Birah Rhamphococcyx curvirostris Shaw, 1810
Chestnut-breasted
Malkoha LC √
17 Bubut Besar Centropus sinensis Stephens, 1815 Greater Coucal LC √
18 Bubut Alang-alang Centropus bengalensis Gmelin, 1788 Lesser Coucal LC √ √ √ √ √ √ √ √ √ √ √
19 Strigidae Celepuk Reban Otus lempiji (Horsfield, 1821) Sunda Scops Owl LC II √
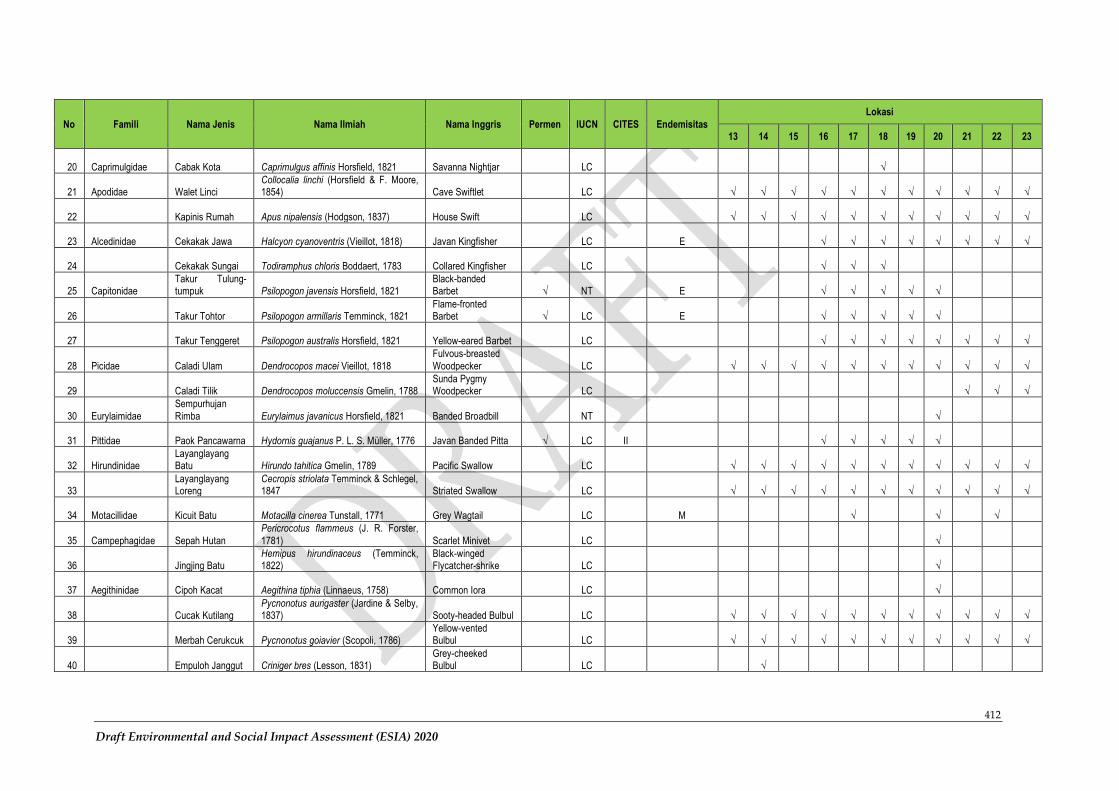
412
Draft Environmental and Social Impact Assessment (ESIA) 2020
No Famili Nama Jenis Nama Ilmiah Nama Inggris Permen IUCN CITES Endemisitas
Lokasi
13 14 15 16 17 18 19 20 21 22 23
20 Caprimulgidae Cabak Kota Caprimulgus affinis Horsfield, 1821 Savanna Nightjar LC √
21 Apodidae Walet Linci Collocalia linchi (Horsfield & F. Moore, 1854) Cave Swiftlet LC √ √ √ √ √ √ √ √ √ √ √
22 Kapinis Rumah Apus nipalensis (Hodgson, 1837) House Swift LC √ √ √ √ √ √ √ √ √ √ √
23 Alcedinidae Cekakak Jawa Halcyon cyanoventris (Vieillot, 1818) Javan Kingfisher LC E √ √ √ √ √ √ √ √
24 Cekakak Sungai Todiramphus chloris Boddaert, 1783 Collared Kingfisher LC √ √ √
25 Capitonidae Takur Tulung-tumpuk Psilopogon javensis Horsfield, 1821
Black-banded Barbet √ NT E √ √ √ √ √
26 Takur Tohtor Psilopogon armillaris Temminck, 1821 Flame-fronted Barbet √ LC E √ √ √ √ √
27 Takur Tenggeret Psilopogon australis Horsfield, 1821 Yellow-eared Barbet LC √ √ √ √ √ √ √ √
28 Picidae Caladi Ulam Dendrocopos macei Vieillot, 1818
Fulvous-breasted
Woodpecker LC √ √ √ √ √ √ √ √ √ √ √
29 Caladi Tilik Dendrocopos moluccensis Gmelin, 1788 Sunda Pygmy Woodpecker LC √ √ √
30 Eurylaimidae
Sempurhujan
Rimba Eurylaimus javanicus Horsfield, 1821 Banded Broadbill NT √
31 Pittidae Paok Pancawarna Hydornis guajanus P. L. S. Müller, 1776 Javan Banded Pitta √ LC II √ √ √ √ √
32 Hirundinidae Layanglayang Batu Hirundo tahitica Gmelin, 1789 Pacific Swallow LC √ √ √ √ √ √ √ √ √ √ √
33 Layanglayang Loreng
Cecropis striolata Temminck & Schlegel, 1847 Striated Swallow LC √ √ √ √ √ √ √ √ √ √ √
34 Motacillidae Kicuit Batu Motacilla cinerea Tunstall, 1771 Grey Wagtail LC M √ √ √
35 Campephagidae Sepah Hutan
Pericrocotus flammeus (J. R. Forster,
1781) Scarlet Minivet LC √
36 Jingjing Batu Hemipus hirundinaceus (Temminck, 1822)
Black-winged Flycatcher-shrike LC √
37 Aegithinidae Cipoh Kacat Aegithina tiphia (Linnaeus, 1758) Common Iora LC √
38 Cucak Kutilang Pycnonotus aurigaster (Jardine & Selby, 1837) Sooty-headed Bulbul LC √ √ √ √ √ √ √ √ √ √ √
39 Merbah Cerukcuk Pycnonotus goiavier (Scopoli, 1786) Yellow-vented Bulbul LC √ √ √ √ √ √ √ √ √ √ √
40 Empuloh Janggut Criniger bres (Lesson, 1831) Grey-cheeked Bulbul LC √
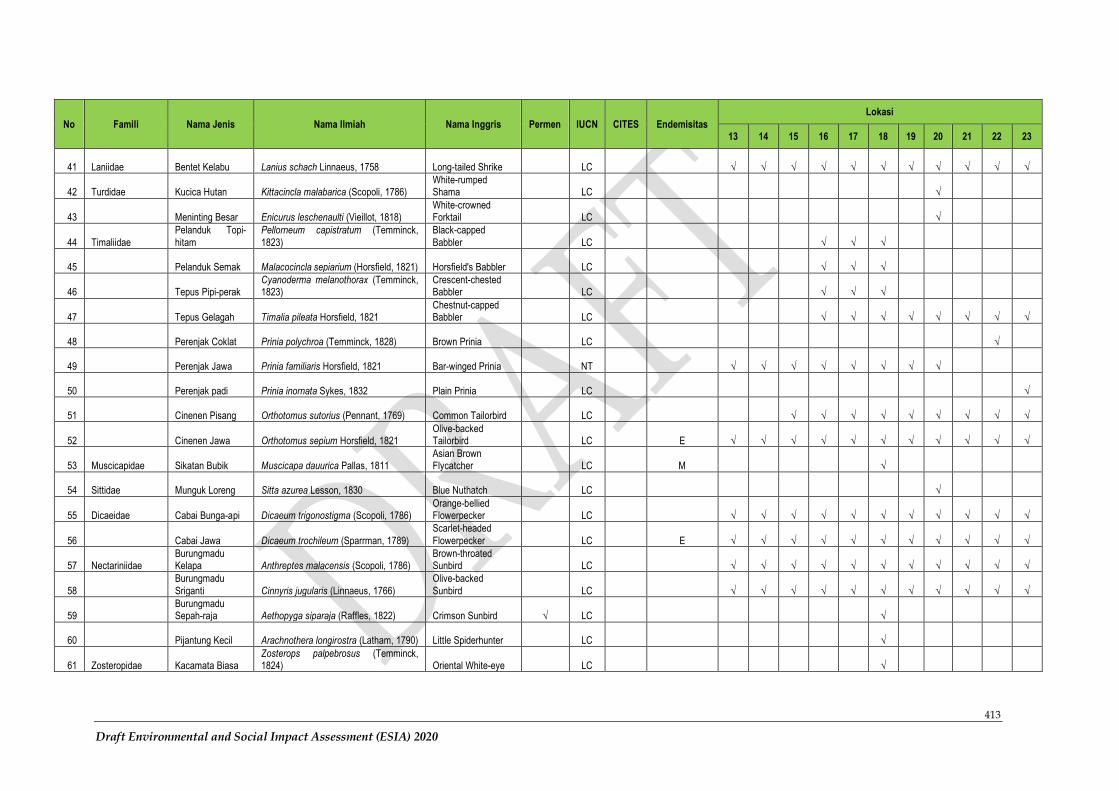
413
Draft Environmental and Social Impact Assessment (ESIA) 2020
No Famili Nama Jenis Nama Ilmiah Nama Inggris Permen IUCN CITES Endemisitas
Lokasi
13 14 15 16 17 18 19 20 21 22 23
41 Laniidae Bentet Kelabu Lanius schach Linnaeus, 1758 Long-tailed Shrike LC √ √ √ √ √ √ √ √ √ √ √
42 Turdidae Kucica Hutan Kittacincla malabarica (Scopoli, 1786) White-rumped Shama LC √
43 Meninting Besar Enicurus leschenaulti (Vieillot, 1818) White-crowned Forktail LC √
44 Timaliidae
Pelanduk Topi-
hitam
Pellorneum capistratum (Temminck,
1823)
Black-capped
Babbler LC √ √ √
45 Pelanduk Semak Malacocincla sepiarium (Horsfield, 1821) Horsfield's Babbler LC √ √ √
46 Tepus Pipi-perak Cyanoderma melanothorax (Temminck, 1823)
Crescent-chested Babbler LC √ √ √
47 Tepus Gelagah Timalia pileata Horsfield, 1821 Chestnut-capped Babbler LC √ √ √ √ √ √ √ √
48 Perenjak Coklat Prinia polychroa (Temminck, 1828) Brown Prinia LC √
49 Perenjak Jawa Prinia familiaris Horsfield, 1821 Bar-winged Prinia NT √ √ √ √ √ √ √ √
50 Perenjak padi Prinia inornata Sykes, 1832 Plain Prinia LC √
51 Cinenen Pisang Orthotomus sutorius (Pennant, 1769) Common Tailorbird LC √ √ √ √ √ √ √ √ √
52 Cinenen Jawa Orthotomus sepium Horsfield, 1821 Olive-backed Tailorbird LC E √ √ √ √ √ √ √ √ √ √ √
53 Muscicapidae Sikatan Bubik Muscicapa dauurica Pallas, 1811 Asian Brown Flycatcher LC M √
54 Sittidae Munguk Loreng Sitta azurea Lesson, 1830 Blue Nuthatch LC √
55 Dicaeidae Cabai Bunga-api Dicaeum trigonostigma (Scopoli, 1786) Orange-bellied Flowerpecker LC √ √ √ √ √ √ √ √ √ √ √
56 Cabai Jawa Dicaeum trochileum (Sparrman, 1789)
Scarlet-headed
Flowerpecker LC E √ √ √ √ √ √ √ √ √ √ √
57 Nectariniidae Burungmadu Kelapa Anthreptes malacensis (Scopoli, 1786)
Brown-throated Sunbird LC √ √ √ √ √ √ √ √ √ √ √
58
Burungmadu
Sriganti Cinnyris jugularis (Linnaeus, 1766)
Olive-backed
Sunbird LC √ √ √ √ √ √ √ √ √ √ √
59 Burungmadu Sepah-raja Aethopyga siparaja (Raffles, 1822) Crimson Sunbird √ LC √
60 Pijantung Kecil Arachnothera longirostra (Latham, 1790) Little Spiderhunter LC √
61 Zosteropidae Kacamata Biasa Zosterops palpebrosus (Temminck, 1824) Oriental White-eye LC √
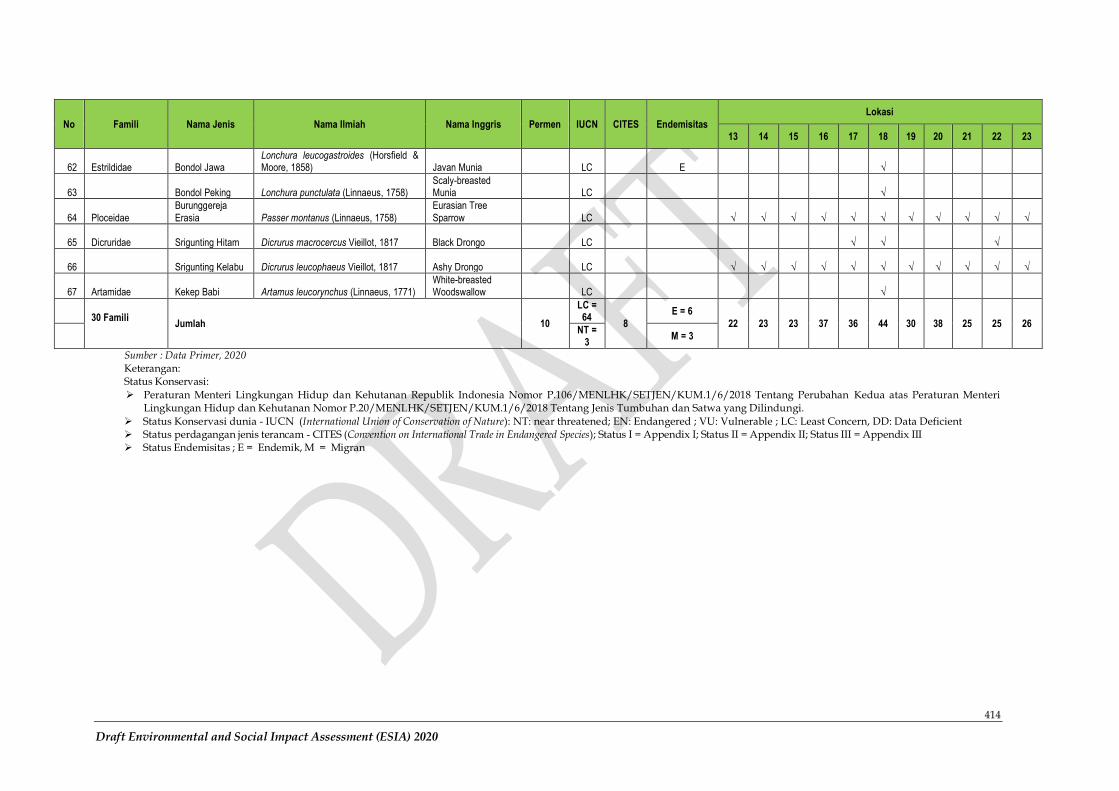
414
Draft Environmental and Social Impact Assessment (ESIA) 2020
No Famili Nama Jenis Nama Ilmiah Nama Inggris Permen IUCN CITES Endemisitas
Lokasi
13 14 15 16 17 18 19 20 21 22 23
62 Estrildidae Bondol Jawa Lonchura leucogastroides (Horsfield & Moore, 1858) Javan Munia LC E √
63 Bondol Peking Lonchura punctulata (Linnaeus, 1758) Scaly-breasted Munia LC √
64 Ploceidae
Burunggereja
Erasia Passer montanus (Linnaeus, 1758)
Eurasian Tree
Sparrow LC √ √ √ √ √ √ √ √ √ √ √
65 Dicruridae Srigunting Hitam Dicrurus macrocercus Vieillot, 1817 Black Drongo LC √ √ √
66 Srigunting Kelabu Dicrurus leucophaeus Vieillot, 1817 Ashy Drongo LC √ √ √ √ √ √ √ √ √ √ √
67 Artamidae Kekep Babi Artamus leucorynchus (Linnaeus, 1771) White-breasted Woodswallow LC √
30 Famili
Jumlah 10
LC = 64
8
E = 6
22 23 23 37 36 44 30 38 25 25 26
NT =
3 M = 3
Sumber : Data Primer, 2020 Keterangan: Status Konservasi:
➢ Peraturan Menteri Lingkungan Hidup dan Kehutanan Republik Indonesia Nomor P.106/MENLHK/SETJEN/KUM.1/6/2018 Tentang Perubahan Kedua atas Peraturan Menteri Lingkungan Hidup dan Kehutanan Nomor P.20/MENLHK/SETJEN/KUM.1/6/2018 Tentang Jenis Tumbuhan dan Satwa yang Dilindungi.
➢ Status Konservasi dunia - IUCN (International Union of Conservation of Nature): NT: near threatened; EN: Endangered ; VU: Vulnerable ; LC: Least Concern, DD: Data Deficient ➢ Status perdagangan jenis terancam - CITES (Convention on International Trade in Endangered Species); Status I = Appendix I; Status II = Appendix II; Status III = Appendix III ➢ Status Endemisitas ; E = Endemik, M = Migran
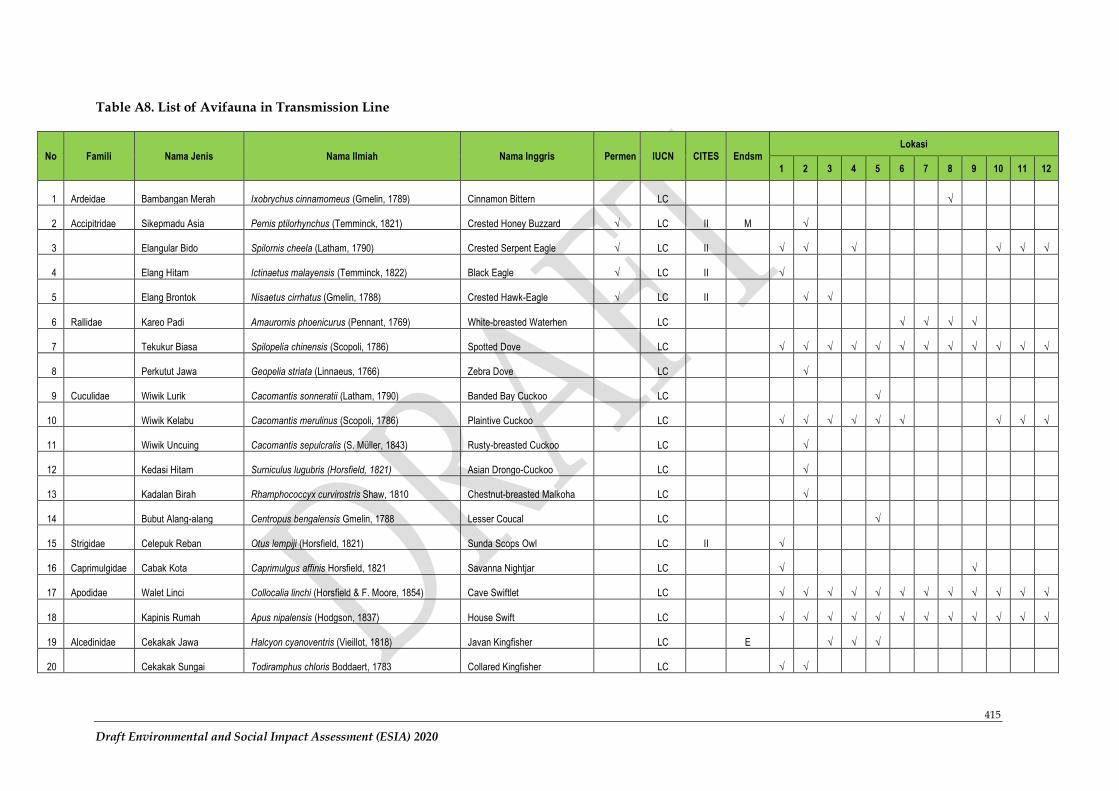
415
Draft Environmental and Social Impact Assessment (ESIA) 2020
Table A8. List of Avifauna in Transmission Line
No Famili Nama Jenis Nama Ilmiah Nama Inggris Permen IUCN CITES Endsm Lokasi
1 2 3 4 5 6 7 8 9 10 11 12
1 Ardeidae Bambangan Merah Ixobrychus cinnamomeus (Gmelin, 1789) Cinnamon Bittern LC √
2 Accipitridae Sikepmadu Asia Pernis ptilorhynchus (Temminck, 1821) Crested Honey Buzzard √ LC II M √
3 Elangular Bido Spilornis cheela (Latham, 1790) Crested Serpent Eagle √ LC II √ √ √ √ √ √
4 Elang Hitam Ictinaetus malayensis (Temminck, 1822) Black Eagle √ LC II √
5 Elang Brontok Nisaetus cirrhatus (Gmelin, 1788) Crested Hawk-Eagle √ LC II √ √
6 Rallidae Kareo Padi Amaurornis phoenicurus (Pennant, 1769) White-breasted Waterhen LC √ √ √ √
7 Tekukur Biasa Spilopelia chinensis (Scopoli, 1786) Spotted Dove LC √ √ √ √ √ √ √ √ √ √ √ √
8 Perkutut Jawa Geopelia striata (Linnaeus, 1766) Zebra Dove LC √
9 Cuculidae Wiwik Lurik Cacomantis sonneratii (Latham, 1790) Banded Bay Cuckoo LC √
10 Wiwik Kelabu Cacomantis merulinus (Scopoli, 1786) Plaintive Cuckoo LC √ √ √ √ √ √ √ √ √
11 Wiwik Uncuing Cacomantis sepulcralis (S. Müller, 1843) Rusty-breasted Cuckoo LC √
12 Kedasi Hitam Surniculus lugubris (Horsfield, 1821) Asian Drongo-Cuckoo LC √
13 Kadalan Birah Rhamphococcyx curvirostris Shaw, 1810 Chestnut-breasted Malkoha LC √
14 Bubut Alang-alang Centropus bengalensis Gmelin, 1788 Lesser Coucal LC √
15 Strigidae Celepuk Reban Otus lempiji (Horsfield, 1821) Sunda Scops Owl LC II √
16 Caprimulgidae Cabak Kota Caprimulgus affinis Horsfield, 1821 Savanna Nightjar LC √ √
17 Apodidae Walet Linci Collocalia linchi (Horsfield & F. Moore, 1854) Cave Swiftlet LC √ √ √ √ √ √ √ √ √ √ √ √
18 Kapinis Rumah Apus nipalensis (Hodgson, 1837) House Swift LC √ √ √ √ √ √ √ √ √ √ √ √
19 Alcedinidae Cekakak Jawa Halcyon cyanoventris (Vieillot, 1818) Javan Kingfisher LC E √ √ √
20 Cekakak Sungai Todiramphus chloris Boddaert, 1783 Collared Kingfisher LC √ √
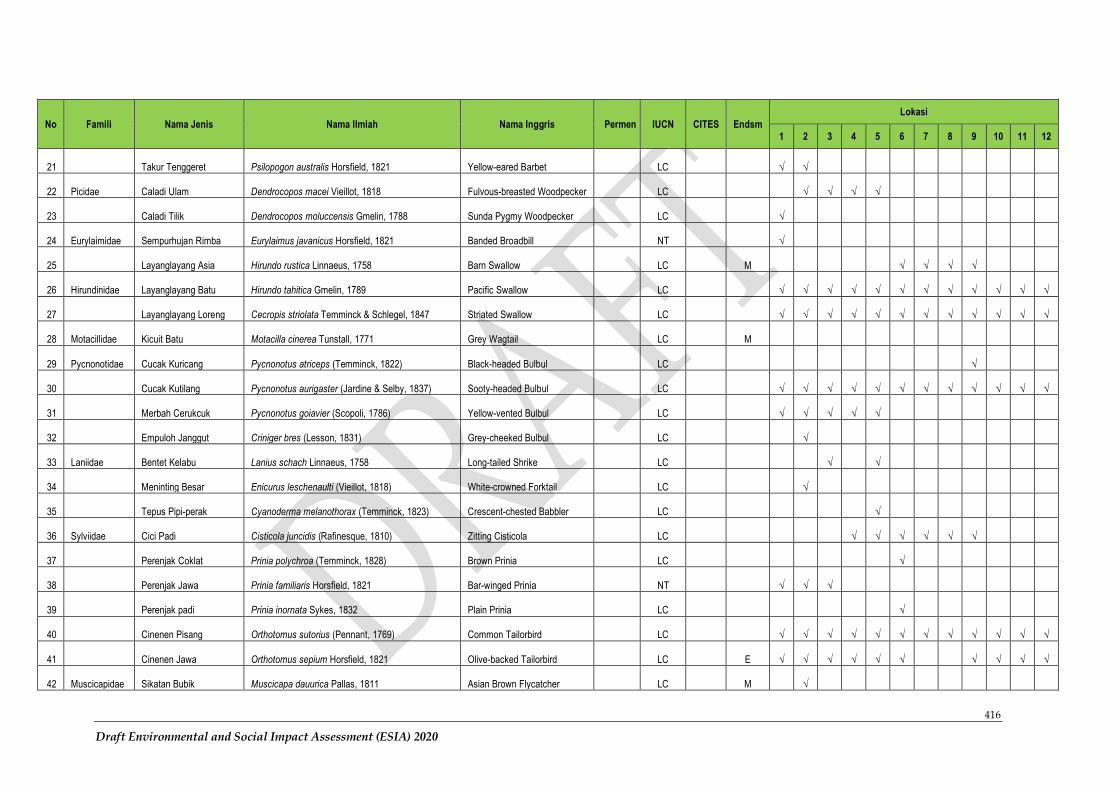
416
Draft Environmental and Social Impact Assessment (ESIA) 2020
No Famili Nama Jenis Nama Ilmiah Nama Inggris Permen IUCN CITES Endsm
Lokasi
1 2 3 4 5 6 7 8 9 10 11 12
21 Takur Tenggeret Psilopogon australis Horsfield, 1821 Yellow-eared Barbet LC √ √
22 Picidae Caladi Ulam Dendrocopos macei Vieillot, 1818 Fulvous-breasted Woodpecker LC √ √ √ √
23 Caladi Tilik Dendrocopos moluccensis Gmelin, 1788 Sunda Pygmy Woodpecker LC √
24 Eurylaimidae Sempurhujan Rimba Eurylaimus javanicus Horsfield, 1821 Banded Broadbill NT √
25 Layanglayang Asia Hirundo rustica Linnaeus, 1758 Barn Swallow LC M √ √ √ √
26 Hirundinidae Layanglayang Batu Hirundo tahitica Gmelin, 1789 Pacific Swallow LC √ √ √ √ √ √ √ √ √ √ √ √
27 Layanglayang Loreng Cecropis striolata Temminck & Schlegel, 1847 Striated Swallow LC √ √ √ √ √ √ √ √ √ √ √ √
28 Motacillidae Kicuit Batu Motacilla cinerea Tunstall, 1771 Grey Wagtail LC M
29 Pycnonotidae Cucak Kuricang Pycnonotus atriceps (Temminck, 1822) Black-headed Bulbul LC √
30 Cucak Kutilang Pycnonotus aurigaster (Jardine & Selby, 1837) Sooty-headed Bulbul LC √ √ √ √ √ √ √ √ √ √ √ √
31 Merbah Cerukcuk Pycnonotus goiavier (Scopoli, 1786) Yellow-vented Bulbul LC √ √ √ √ √
32 Empuloh Janggut Criniger bres (Lesson, 1831) Grey-cheeked Bulbul LC √
33 Laniidae Bentet Kelabu Lanius schach Linnaeus, 1758 Long-tailed Shrike LC √ √
34 Meninting Besar Enicurus leschenaulti (Vieillot, 1818) White-crowned Forktail LC √
35 Tepus Pipi-perak Cyanoderma melanothorax (Temminck, 1823) Crescent-chested Babbler LC √
36 Sylviidae Cici Padi Cisticola juncidis (Rafinesque, 1810) Zitting Cisticola LC √ √ √ √ √ √
37 Perenjak Coklat Prinia polychroa (Temminck, 1828) Brown Prinia LC √
38 Perenjak Jawa Prinia familiaris Horsfield, 1821 Bar-winged Prinia NT √ √ √
39 Perenjak padi Prinia inornata Sykes, 1832 Plain Prinia LC √
40 Cinenen Pisang Orthotomus sutorius (Pennant, 1769) Common Tailorbird LC √ √ √ √ √ √ √ √ √ √ √ √
41 Cinenen Jawa Orthotomus sepium Horsfield, 1821 Olive-backed Tailorbird LC E √ √ √ √ √ √ √ √ √ √
42 Muscicapidae Sikatan Bubik Muscicapa dauurica Pallas, 1811 Asian Brown Flycatcher LC M √
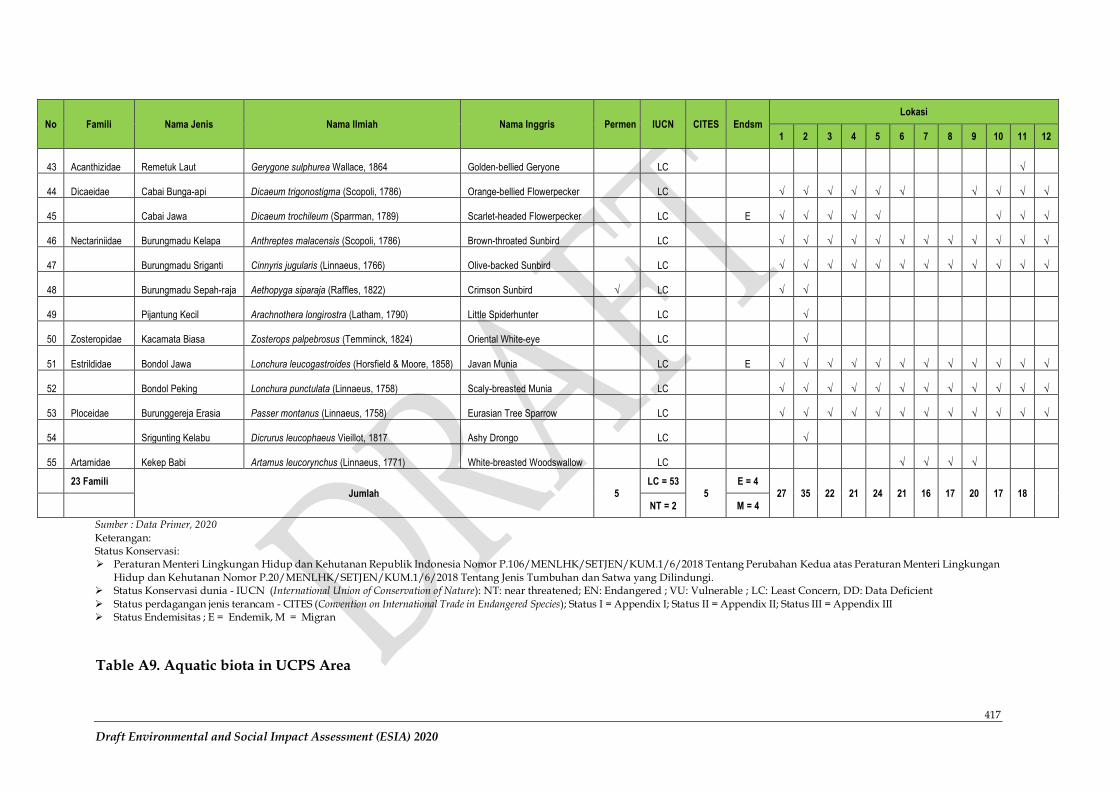
417
Draft Environmental and Social Impact Assessment (ESIA) 2020
No Famili Nama Jenis Nama Ilmiah Nama Inggris Permen IUCN CITES Endsm
Lokasi
1 2 3 4 5 6 7 8 9 10 11 12
43 Acanthizidae Remetuk Laut Gerygone sulphurea Wallace, 1864 Golden-bellied Geryone LC √
44 Dicaeidae Cabai Bunga-api Dicaeum trigonostigma (Scopoli, 1786) Orange-bellied Flowerpecker LC √ √ √ √ √ √ √ √ √ √
45 Cabai Jawa Dicaeum trochileum (Sparrman, 1789) Scarlet-headed Flowerpecker LC E √ √ √ √ √ √ √ √
46 Nectariniidae Burungmadu Kelapa Anthreptes malacensis (Scopoli, 1786) Brown-throated Sunbird LC √ √ √ √ √ √ √ √ √ √ √ √
47 Burungmadu Sriganti Cinnyris jugularis (Linnaeus, 1766) Olive-backed Sunbird LC √ √ √ √ √ √ √ √ √ √ √ √
48 Burungmadu Sepah-raja Aethopyga siparaja (Raffles, 1822) Crimson Sunbird √ LC √ √
49 Pijantung Kecil Arachnothera longirostra (Latham, 1790) Little Spiderhunter LC √
50 Zosteropidae Kacamata Biasa Zosterops palpebrosus (Temminck, 1824) Oriental White-eye LC √
51 Estrildidae Bondol Jawa Lonchura leucogastroides (Horsfield & Moore, 1858) Javan Munia LC E √ √ √ √ √ √ √ √ √ √ √ √
52 Bondol Peking Lonchura punctulata (Linnaeus, 1758) Scaly-breasted Munia LC √ √ √ √ √ √ √ √ √ √ √ √
53 Ploceidae Burunggereja Erasia Passer montanus (Linnaeus, 1758) Eurasian Tree Sparrow LC √ √ √ √ √ √ √ √ √ √ √ √
54 Srigunting Kelabu Dicrurus leucophaeus Vieillot, 1817 Ashy Drongo LC √
55 Artamidae Kekep Babi Artamus leucorynchus (Linnaeus, 1771) White-breasted Woodswallow LC √ √ √ √
23 Famili Jumlah 5
LC = 53 5
E = 4 27 35 22 21 24 21 16 17 20 17 18 17
NT = 2 M = 4
Sumber : Data Primer, 2020
Keterangan: Status Konservasi: ➢ Peraturan Menteri Lingkungan Hidup dan Kehutanan Republik Indonesia Nomor P.106/MENLHK/SETJEN/KUM.1/6/2018 Tentang Perubahan Kedua atas Peraturan Menteri Lingkungan
Hidup dan Kehutanan Nomor P.20/MENLHK/SETJEN/KUM.1/6/2018 Tentang Jenis Tumbuhan dan Satwa yang Dilindungi. ➢ Status Konservasi dunia - IUCN (International Union of Conservation of Nature): NT: near threatened; EN: Endangered ; VU: Vulnerable ; LC: Least Concern, DD: Data Deficient
➢ Status perdagangan jenis terancam - CITES (Convention on International Trade in Endangered Species); Status I = Appendix I; Status II = Appendix II; Status III = Appendix III ➢ Status Endemisitas ; E = Endemik, M = Migran
Table A9. Aquatic biota in UCPS Area
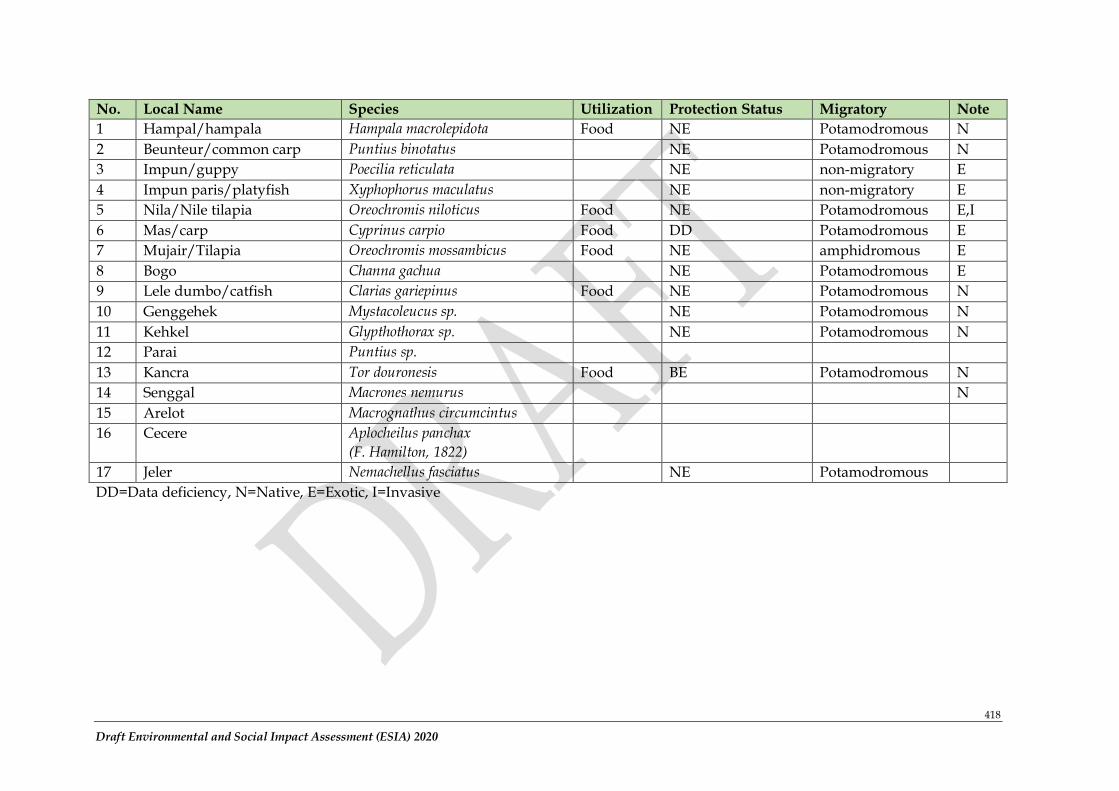
418
Draft Environmental and Social Impact Assessment (ESIA) 2020
No. Local Name Species Utilization Protection Status Migratory Note
1 Hampal/hampala Hampala macrolepidota Food NE Potamodromous N
2 Beunteur/common carp Puntius binotatus NE Potamodromous N
3 Impun/guppy Poecilia reticulata NE non-migratory E
4 Impun paris/platyfish Xyphophorus maculatus NE non-migratory E
5 Nila/Nile tilapia Oreochromis niloticus Food NE Potamodromous E,I
6 Mas/carp Cyprinus carpio Food DD Potamodromous E
7 Mujair/Tilapia Oreochromis mossambicus Food NE amphidromous E
8 Bogo Channa gachua NE Potamodromous E
9 Lele dumbo/catfish Clarias gariepinus Food NE Potamodromous N
10 Genggehek Mystacoleucus sp. NE Potamodromous N
11 Kehkel Glypthothorax sp. NE Potamodromous N
12 Parai Puntius sp.
13 Kancra Tor douronesis Food BE Potamodromous N
14 Senggal Macrones nemurus N
15 Arelot Macrognathus circumcintus
16 Cecere Aplocheilus panchax
(F. Hamilton, 1822)
17 Jeler Nemachellus fasciatus NE Potamodromous
DD=Data deficiency, N=Native, E=Exotic, I=Invasive

419
Draft Environmental and Social Impact Assessment (ESIA) 2020
Related Documents