Preliminary Assessment of Research Aircraft Observations for Potential Use in the Study of Boundary Layer, Stratocumulus Icing Ben C. Bernstein Research Applications Laboratory National Center for Atmospheric Research [email protected] 26 September 2007

Welcome message from author
This document is posted to help you gain knowledge. Please leave a comment to let me know what you think about it! Share it to your friends and learn new things together.
Transcript
Preliminary Assessment of Research Aircraft Observations for Potential Use in the Study of
Boundary Layer, Stratocumulus Icing
Ben C. Bernstein Research Applications Laboratory
National Center for Atmospheric Research [email protected]
26 September 2007
Introduction This report describes candidate cases for a modeling study of stratocumulus icing events. More than 40 cases were initially examined, covering flight seasons from 1997 to 2005, and using four aircraft carrying research quality observational instrumentation, including water content probes and particle imaging. Some of the datasets need to be verified for quality. Overall, six primary cases appear to have the best potential for study, while numerous other cases remain as possibilities, but their value may be confounded by one or more issues with either the data and/or the weather situation (e.g. corruption of the clear-cut nature of the case because of the presence of precipitation nearby). Among the six cases that appear to have the best potential, the top four cases are described in detail in the next section. These were chosen because the aircraft data have at least gone through preliminary examination for quality. These cases were sampled by the NASA-Glenn Twin Otter and two certification aircraft. They occurred on 30 January 1998, 12 February 1998 (Twin Otter), 5 April 2003 and 19 January 2005 (certification aircraft). All of these icing events occurred over the states of Ohio and Indiana. The fifth and sixth cases were sampled by the University of North Dakota Citation, whose data is only now becoming available. Thus, an in-depth description of those cases will wait until the UND data at least get an initial inspection. A brief description of these two cases and the secondary tier cases is given in the section that follows the section on the primary cases. The two UND cases occurred over New York State on 16 February 2005 (with some potential for analysis of two additional cases on the 17 and 18 February, as well) and over Maine on 12 April 2004.
PRIMARY CASES Case #1 – January 30, 1998
Aircraft: NASA-Glenn Twin Otter Flight times: 1310-1430 UTC Data formats: MSExcel, SEA M200 Probes include: OAP 2D-Grey, FSSP, CSIRO LWC, Rosemount ice detector Best icing period: Most of the flight was very good. Icing altitudes: 2400-5800 ft MSL Temperature and LWC: -11oC; 0.6-0.8 gm-3 near the cloud tops FSSP MVDs: 10-18 microns, concentrations were ~250 cm-3. Location: Akron-Canton, Youngstown and Cleveland, Ohio.
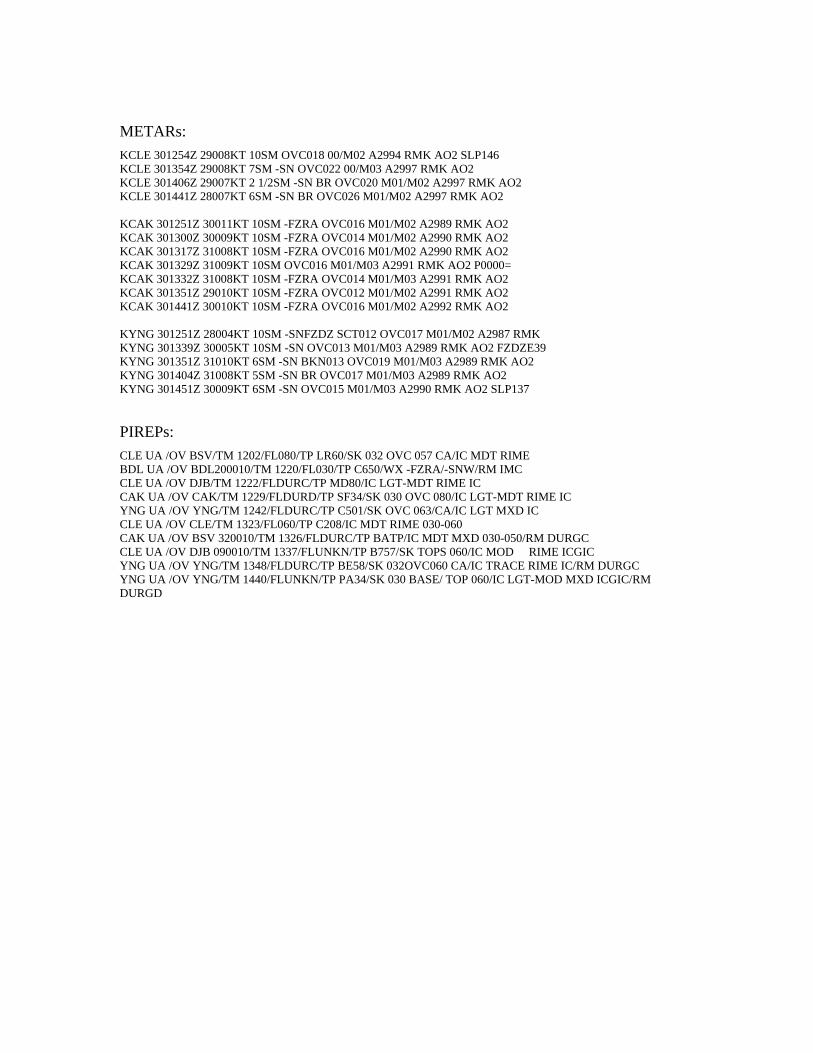
Synoptic Conditions: Post cold frontal, with the cold front located well to the east of the flight area, along the Pennsylvania-New Jersey border. A stationary front was located to the north, along the north shore of Lake Erie. Thermodynamic structure: Boundary layer rooted instability with a 2oC inversion just above cloud top and dry air above. Clouds and precipitation: The clouds were stratocumulus in character. Visibilities were typically 10 statute miles during the event, indicative of the very light nature of the precipitation below cloud base. Radar echoes were mostly on the order of 10 dBZ or less and were most clearly observed near Cleveland. This may be attributable to the shallow nature of the precipitation layer and beam geometry. METARs indicated that light precipitation was also evident at Akron-Canton and Youngstown (FZDZ [sometimes misreported as FZRA] and SN). PIREPs: The PIREPs were primarily moderate and light in severity across Ohio and surrounding states, though there were a few trace reports and one severe report. Description of observations made in flight: On this day, one flight was made into a cloud layer that was dominated by small drops, with some very light freezing drizzle (FZDZ) on the small end of the FZDZ size spectrum. The clouds were mixed with a small amount of snow, as well. The LWC was ~0.8 gm-3 at T= –11oC near the cloud top at ~5800 ft MSL over Akron-Canton (KCAK). Mixed conditions were observed on descent through the clouds there, and some FZDZ was found within and below cloud bases, which were at ~2700 ft MSL. LWCs decreased essentially linearly toward cloud base over KCAK. A similar profile of LWC was found during a missed approach and flight through cloud top at Youngstown (KYNG). FZDZ and ice crystals were much less evident, but still present there. Another sounding was made on final approach into Cleveland, where slightly lower water contents and more crystals were present.
METARs: KCLE 301254Z 29008KT 10SM OVC018 00/M02 A2994 RMK AO2 SLP146 KCLE 301354Z 29008KT 7SM -SN OVC022 00/M03 A2997 RMK AO2 KCLE 301406Z 29007KT 2 1/2SM -SN BR OVC020 M01/M02 A2997 RMK AO2 KCLE 301441Z 28007KT 6SM -SN BR OVC026 M01/M02 A2997 RMK AO2 KCAK 301251Z 30011KT 10SM -FZRA OVC016 M01/M02 A2989 RMK AO2 KCAK 301300Z 30009KT 10SM -FZRA OVC014 M01/M02 A2990 RMK AO2 KCAK 301317Z 31008KT 10SM -FZRA OVC016 M01/M02 A2990 RMK AO2 KCAK 301329Z 31009KT 10SM OVC016 M01/M03 A2991 RMK AO2 P0000= KCAK 301332Z 31008KT 10SM -FZRA OVC014 M01/M03 A2991 RMK AO2 KCAK 301351Z 29010KT 10SM -FZRA OVC012 M01/M02 A2991 RMK AO2 KCAK 301441Z 30010KT 10SM -FZRA OVC016 M01/M02 A2992 RMK AO2 KYNG 301251Z 28004KT 10SM -SNFZDZ SCT012 OVC017 M01/M02 A2987 RMK KYNG 301339Z 30005KT 10SM -SN OVC013 M01/M03 A2989 RMK AO2 FZDZE39 KYNG 301351Z 31010KT 6SM -SN BKN013 OVC019 M01/M03 A2989 RMK AO2 KYNG 301404Z 31008KT 5SM -SN BR OVC017 M01/M03 A2989 RMK AO2 KYNG 301451Z 30009KT 6SM -SN OVC015 M01/M03 A2990 RMK AO2 SLP137
PIREPs: CLE UA /OV BSV/TM 1202/FL080/TP LR60/SK 032 OVC 057 CA/IC MDT RIME BDL UA /OV BDL200010/TM 1220/FL030/TP C650/WX -FZRA/-SNW/RM IMC CLE UA /OV DJB/TM 1222/FLDURC/TP MD80/IC LGT-MDT RIME IC CAK UA /OV CAK/TM 1229/FLDURD/TP SF34/SK 030 OVC 080/IC LGT-MDT RIME IC YNG UA /OV YNG/TM 1242/FLDURC/TP C501/SK OVC 063/CA/IC LGT MXD IC CLE UA /OV CLE/TM 1323/FL060/TP C208/IC MDT RIME 030-060 CAK UA /OV BSV 320010/TM 1326/FLDURC/TP BATP/IC MDT MXD 030-050/RM DURGC CLE UA /OV DJB 090010/TM 1337/FLUNKN/TP B757/SK TOPS 060/IC MOD RIME ICGIC YNG UA /OV YNG/TM 1348/FLDURC/TP BE58/SK 032OVC060 CA/IC TRACE RIME IC/RM DURGC YNG UA /OV YNG/TM 1440/FLUNKN/TP PA34/SK 030 BASE/ TOP 060/IC LGT-MOD MXD ICGIC/RM DURGD
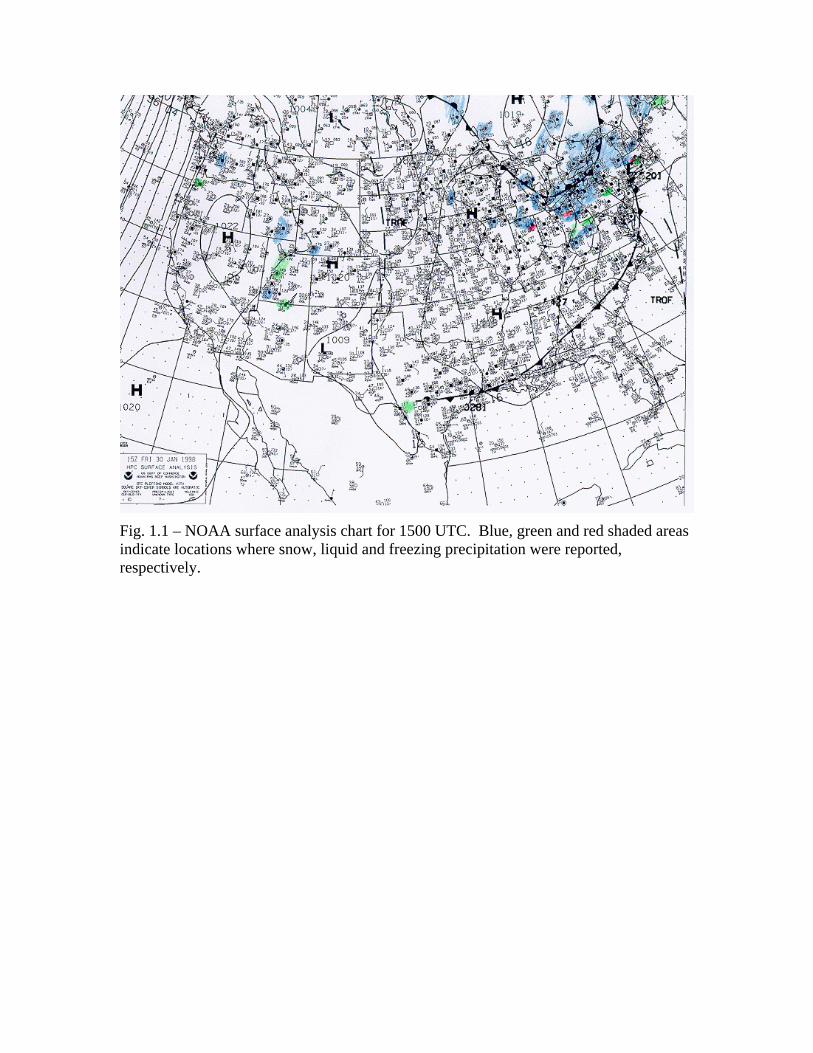
Fig. 1.1 – NOAA surface analysis chart for 1500 UTC. Blue, green and red shaded areas indicate locations where snow, liquid and freezing precipitation were reported, respectively.
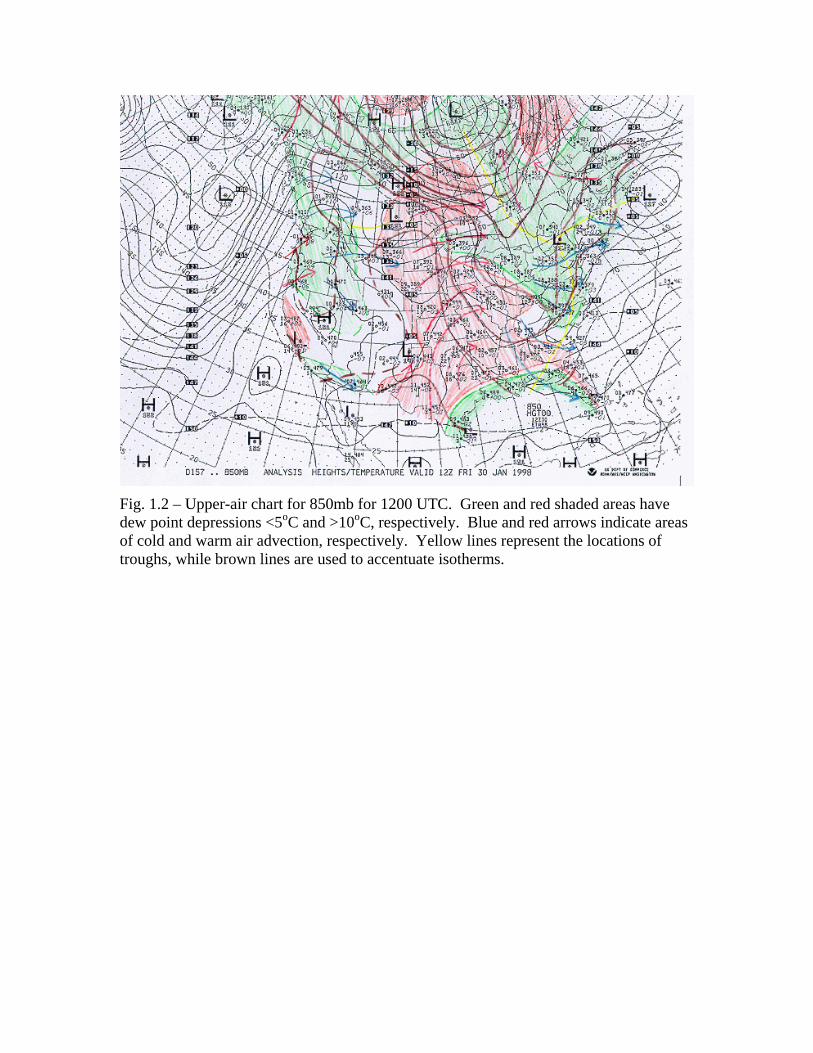
Fig. 1.2 – Upper-air chart for 850mb for 1200 UTC. Green and red shaded areas have dew point depressions <5oC and >10oC, respectively. Blue and red arrows indicate areas of cold and warm air advection, respectively. Yellow lines represent the locations of troughs, while brown lines are used to accentuate isotherms.
Fig. 1.3 – Same as 1.2, but for 700mb.
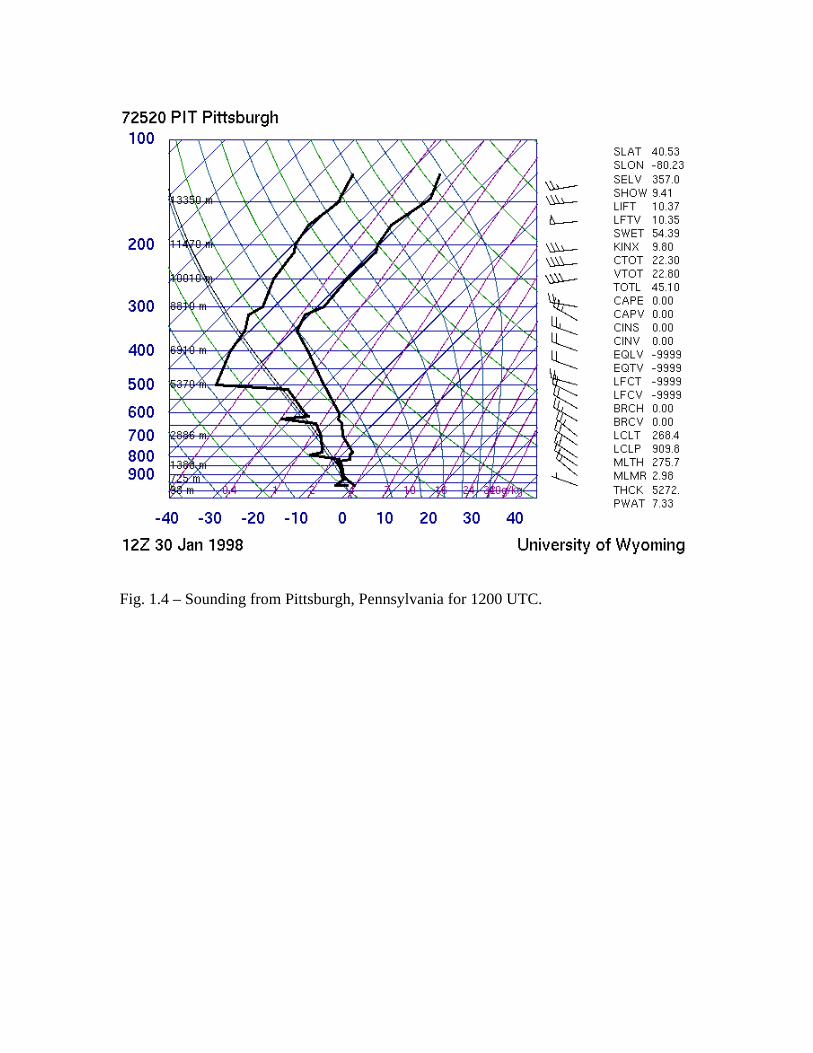
Fig. 1.4 – Sounding from Pittsburgh, Pennsylvania for 1200 UTC.
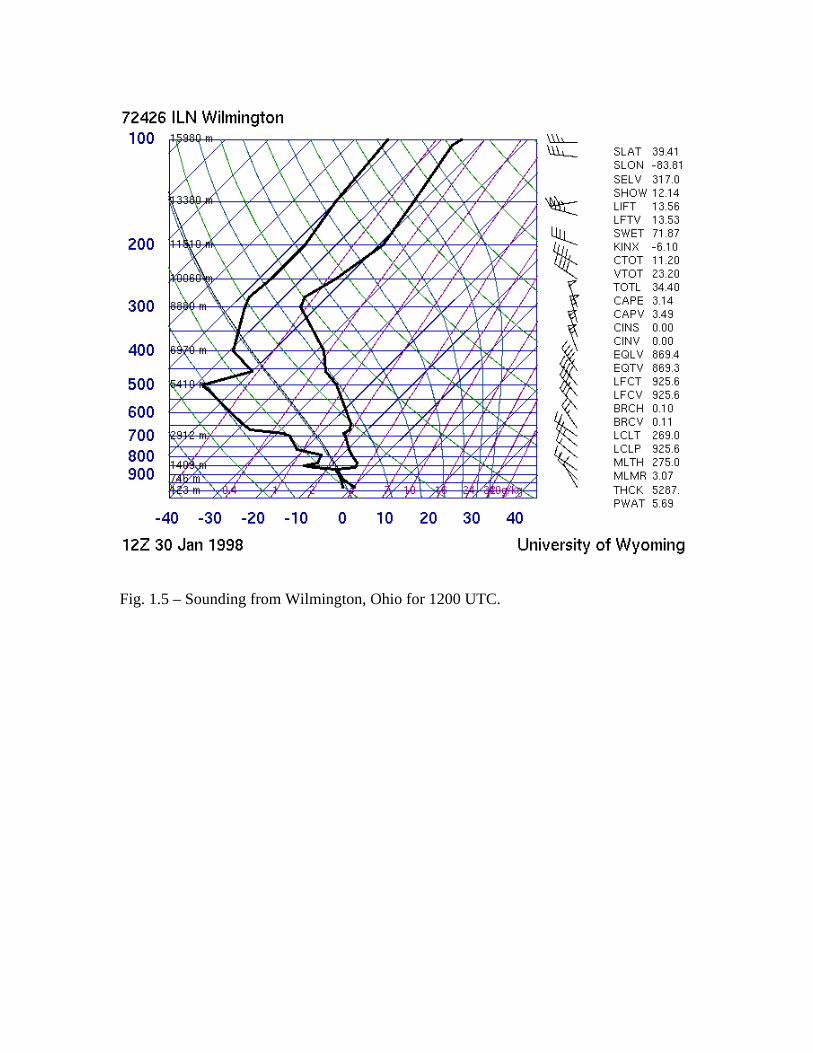
Fig. 1.5 – Sounding from Wilmington, Ohio for 1200 UTC.

Fig. 1.6 – Sounding from Detroit, Michigan for 1200 UTC.

Fig. 1.6 – National-scale visible satellite image for 1415 UTC.
Fig. 1.7 – National-scale infrared image for 1415 UTC.
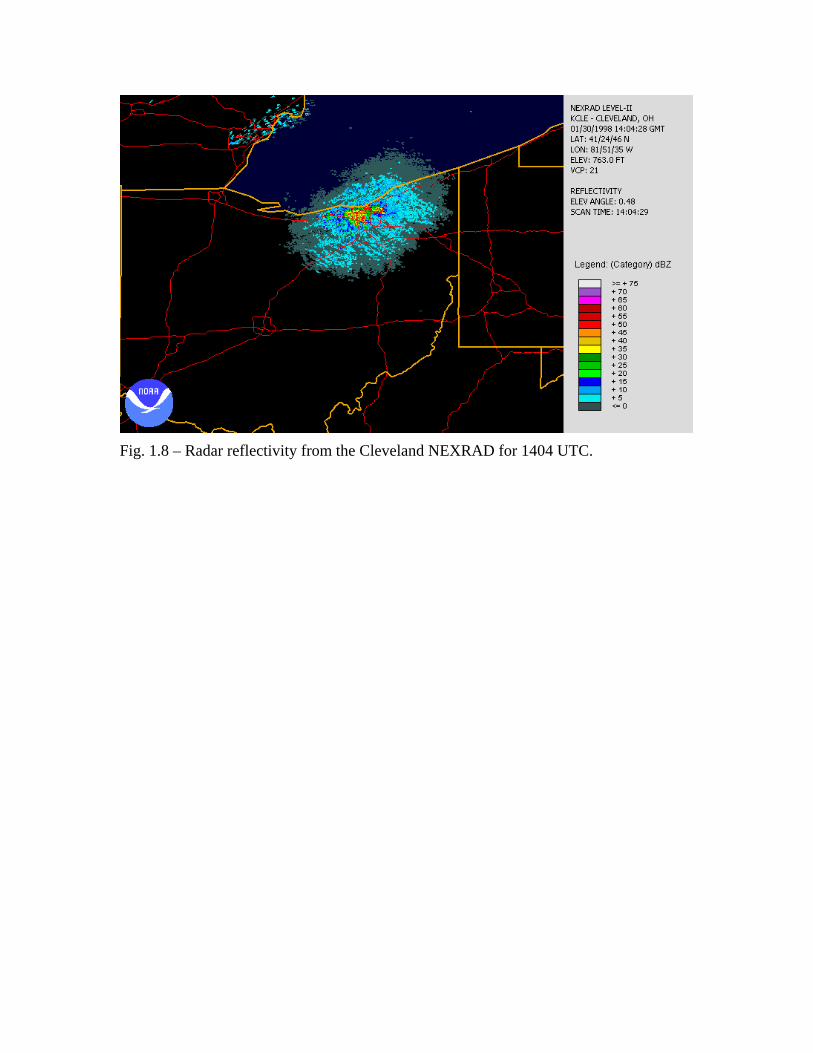
Fig. 1.8 – Radar reflectivity from the Cleveland NEXRAD for 1404 UTC.

Case #2 – February 12, 1998 Aircraft: NASA Twin Otter Flight times: 1559-2002 UTC Data formats: Text, MSExcel, SEA M200 Probes include: OAP 2D-Grey, FSSP, CSIRO LWC, Rosemount ice detector Best icing period: Off and on throughout the two flights. Altitudes: 2000-5000 ft MSL Temperature and LWC: -6 to -8oC; up to 0.55 gm-3 in places FSSP MVDs: 10-15 microns Location: Over Cleveland and Selfridge Air Force Base, Michigan (north of Detroit). Synoptic Conditions: Post trough/cold frontal, with the main low-pressure center over Lake Ontario and the local, secondary trough/cold front just to the southeast of flight area, while the main cold front was along and just east of the East Coast. Thermodynamic structure: Boundary layer rooted instability with a deep isothermal (and in some places, a slightly more stable) layer above in area of primary icing encounter. Clouds and precipitation: The clouds were stratocumulus in character. They were mostly solid around the area of the primary icing encounter. Widespread precipitation moved eastward out of the area before the icing encounters, leaving only overcast skies behind. Bases were typically on the order of 4000 feet MSL. PIREPs: The PIREPs mostly indicated between light icing and moderate icing across Ohio and Michigan. See text PIREPs below. Description of observations made in flight: Two flights were made on this day into fairly shallow clouds comprised of mostly small droplets. During the first flight, small-drop clouds were sampled during ascent from Cleveland and they contained LWC up to 0.5 gm-3. The cloud bases and tops were near 2400 and 4000 ft MSL, respectively, and cloud top temperature (CTT) was –6oC. Broken clouds with variable tops and depths were present over and to the north of Lake Erie. More solid, but still shallow, clouds were sampled along the southern shore of Lake Huron. The cloud bases and tops were slightly higher (4000 and 4900 ft MSL, respectively), cloud tops were slightly colder (CTT = -7oC), and fairly steady, and lower values of LWC were present (0.1-0.3 gm-3). A few ice crystals were observed to the north of Lake Erie. During the second flight, similar conditions were observed near Toledo. The primary differences were that the clouds were slightly deeper, that they had slightly colder cloud tops (CTT = -8oC), and higher LWCs (up to 0.5 gm-3) along the southern shore of Lake Erie. A few ice crystals and possibly a few freezing drizzle drops were found along the northwestern shore of the lake, to the north of Toledo.
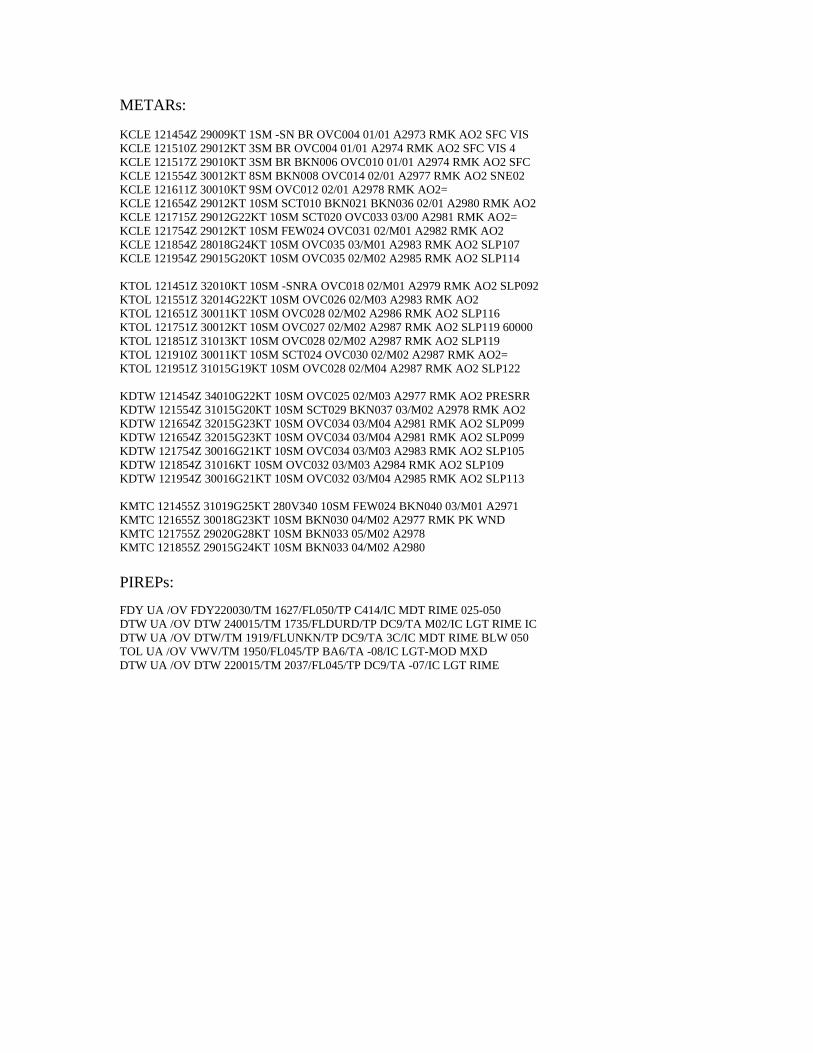
METARs: KCLE 121454Z 29009KT 1SM -SN BR OVC004 01/01 A2973 RMK AO2 SFC VIS KCLE 121510Z 29012KT 3SM BR OVC004 01/01 A2974 RMK AO2 SFC VIS 4 KCLE 121517Z 29010KT 3SM BR BKN006 OVC010 01/01 A2974 RMK AO2 SFC KCLE 121554Z 30012KT 8SM BKN008 OVC014 02/01 A2977 RMK AO2 SNE02 KCLE 121611Z 30010KT 9SM OVC012 02/01 A2978 RMK AO2= KCLE 121654Z 29012KT 10SM SCT010 BKN021 BKN036 02/01 A2980 RMK AO2 KCLE 121715Z 29012G22KT 10SM SCT020 OVC033 03/00 A2981 RMK AO2= KCLE 121754Z 29012KT 10SM FEW024 OVC031 02/M01 A2982 RMK AO2 KCLE 121854Z 28018G24KT 10SM OVC035 03/M01 A2983 RMK AO2 SLP107 KCLE 121954Z 29015G20KT 10SM OVC035 02/M02 A2985 RMK AO2 SLP114 KTOL 121451Z 32010KT 10SM -SNRA OVC018 02/M01 A2979 RMK AO2 SLP092 KTOL 121551Z 32014G22KT 10SM OVC026 02/M03 A2983 RMK AO2 KTOL 121651Z 30011KT 10SM OVC028 02/M02 A2986 RMK AO2 SLP116 KTOL 121751Z 30012KT 10SM OVC027 02/M02 A2987 RMK AO2 SLP119 60000 KTOL 121851Z 31013KT 10SM OVC028 02/M02 A2987 RMK AO2 SLP119 KTOL 121910Z 30011KT 10SM SCT024 OVC030 02/M02 A2987 RMK AO2= KTOL 121951Z 31015G19KT 10SM OVC028 02/M04 A2987 RMK AO2 SLP122 KDTW 121454Z 34010G22KT 10SM OVC025 02/M03 A2977 RMK AO2 PRESRR KDTW 121554Z 31015G20KT 10SM SCT029 BKN037 03/M02 A2978 RMK AO2 KDTW 121654Z 32015G23KT 10SM OVC034 03/M04 A2981 RMK AO2 SLP099 KDTW 121654Z 32015G23KT 10SM OVC034 03/M04 A2981 RMK AO2 SLP099 KDTW 121754Z 30016G21KT 10SM OVC034 03/M03 A2983 RMK AO2 SLP105 KDTW 121854Z 31016KT 10SM OVC032 03/M03 A2984 RMK AO2 SLP109 KDTW 121954Z 30016G21KT 10SM OVC032 03/M04 A2985 RMK AO2 SLP113 KMTC 121455Z 31019G25KT 280V340 10SM FEW024 BKN040 03/M01 A2971 KMTC 121655Z 30018G23KT 10SM BKN030 04/M02 A2977 RMK PK WND KMTC 121755Z 29020G28KT 10SM BKN033 05/M02 A2978 KMTC 121855Z 29015G24KT 10SM BKN033 04/M02 A2980 PIREPs: FDY UA /OV FDY220030/TM 1627/FL050/TP C414/IC MDT RIME 025-050 DTW UA /OV DTW 240015/TM 1735/FLDURD/TP DC9/TA M02/IC LGT RIME IC DTW UA /OV DTW/TM 1919/FLUNKN/TP DC9/TA 3C/IC MDT RIME BLW 050 TOL UA /OV VWV/TM 1950/FL045/TP BA6/TA -08/IC LGT-MOD MXD DTW UA /OV DTW 220015/TM 2037/FL045/TP DC9/TA -07/IC LGT RIME
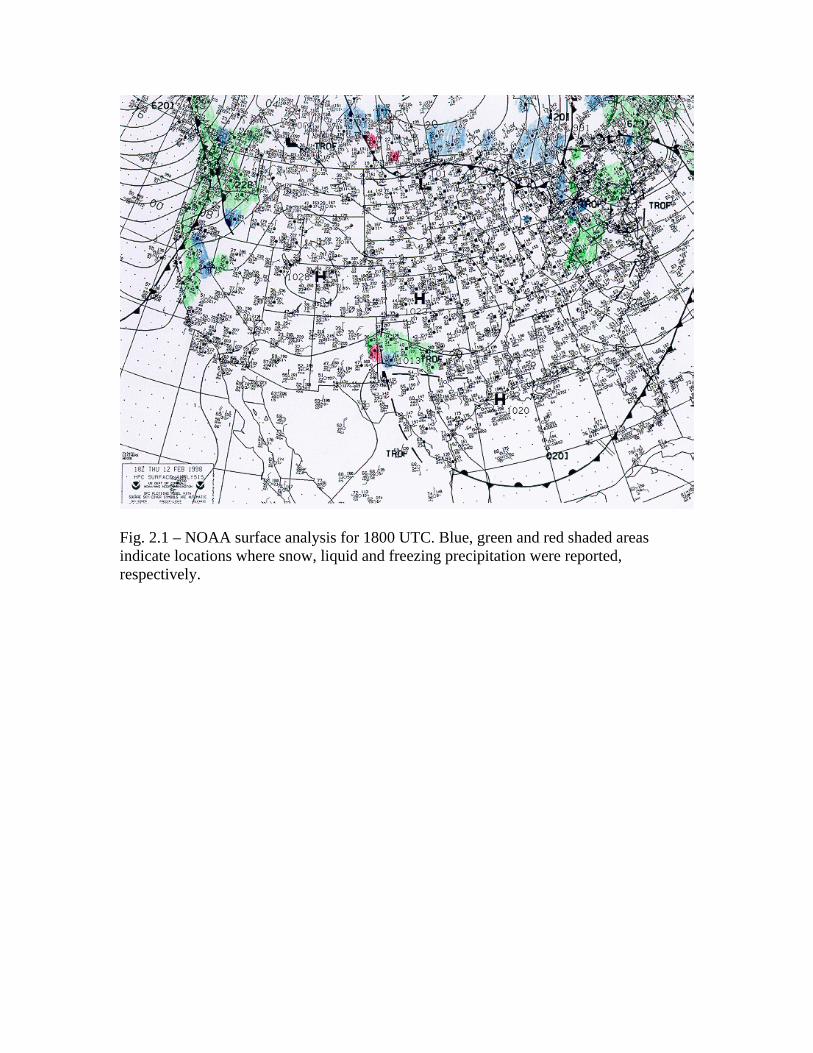
Fig. 2.1 – NOAA surface analysis for 1800 UTC. Blue, green and red shaded areas indicate locations where snow, liquid and freezing precipitation were reported, respectively.
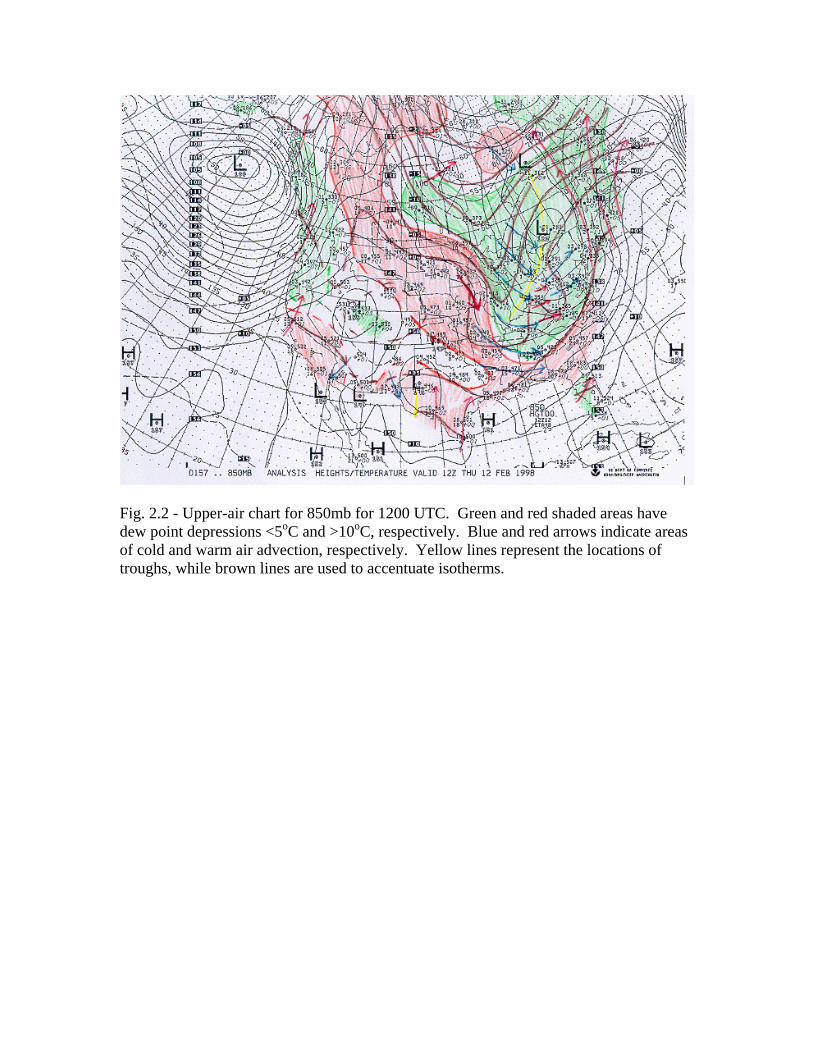
Fig. 2.2 - Upper-air chart for 850mb for 1200 UTC. Green and red shaded areas have dew point depressions <5oC and >10oC, respectively. Blue and red arrows indicate areas of cold and warm air advection, respectively. Yellow lines represent the locations of troughs, while brown lines are used to accentuate isotherms.
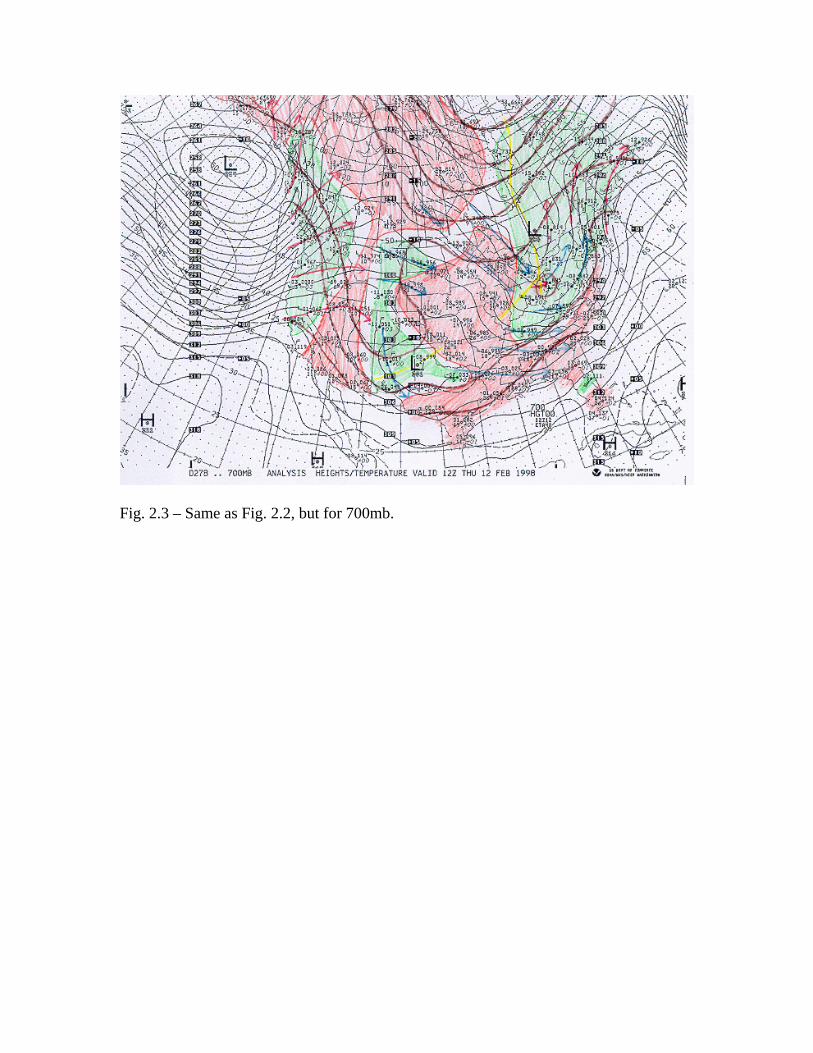
Fig. 2.3 – Same as Fig. 2.2, but for 700mb.
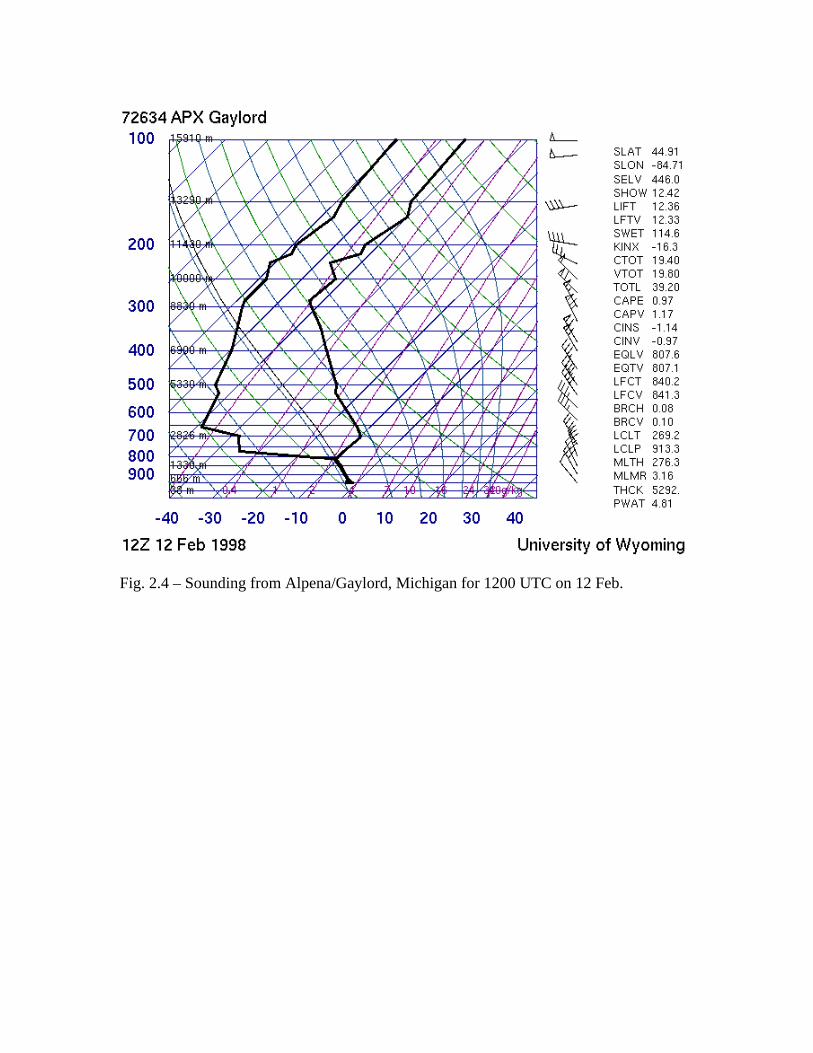
Fig. 2.4 – Sounding from Alpena/Gaylord, Michigan for 1200 UTC on 12 Feb.
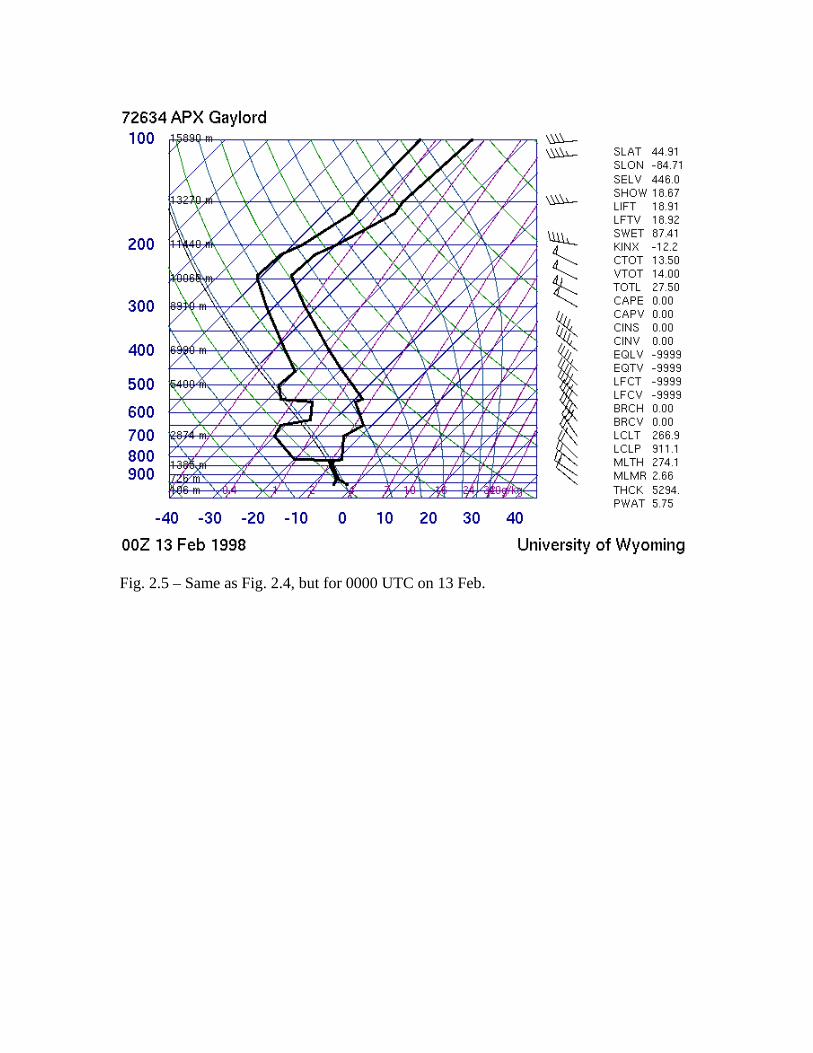
Fig. 2.5 – Same as Fig. 2.4, but for 0000 UTC on 13 Feb.
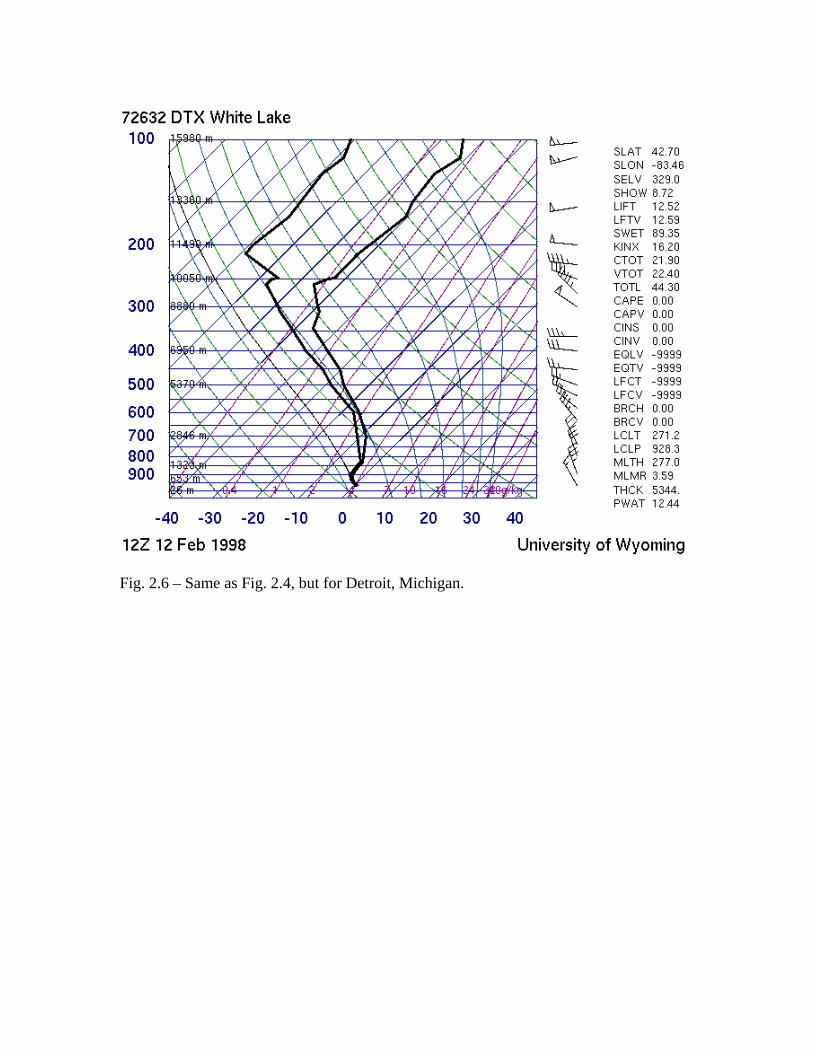
Fig. 2.6 – Same as Fig. 2.4, but for Detroit, Michigan.
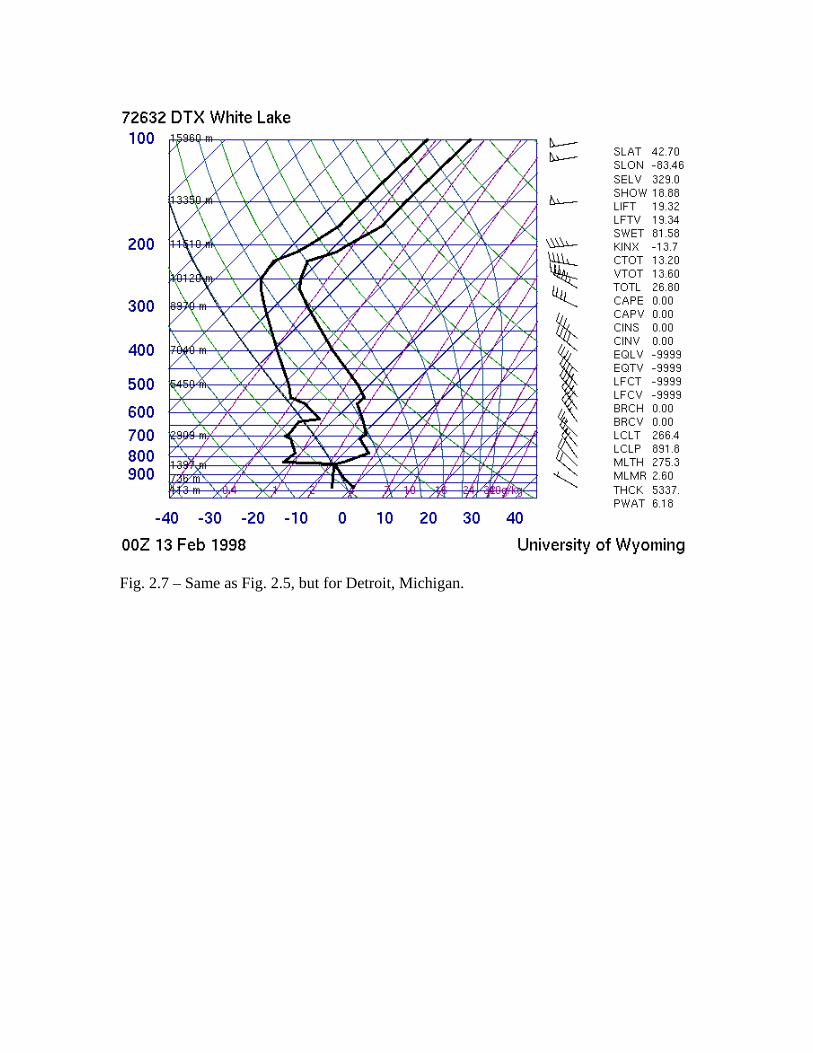
Fig. 2.7 – Same as Fig. 2.5, but for Detroit, Michigan.
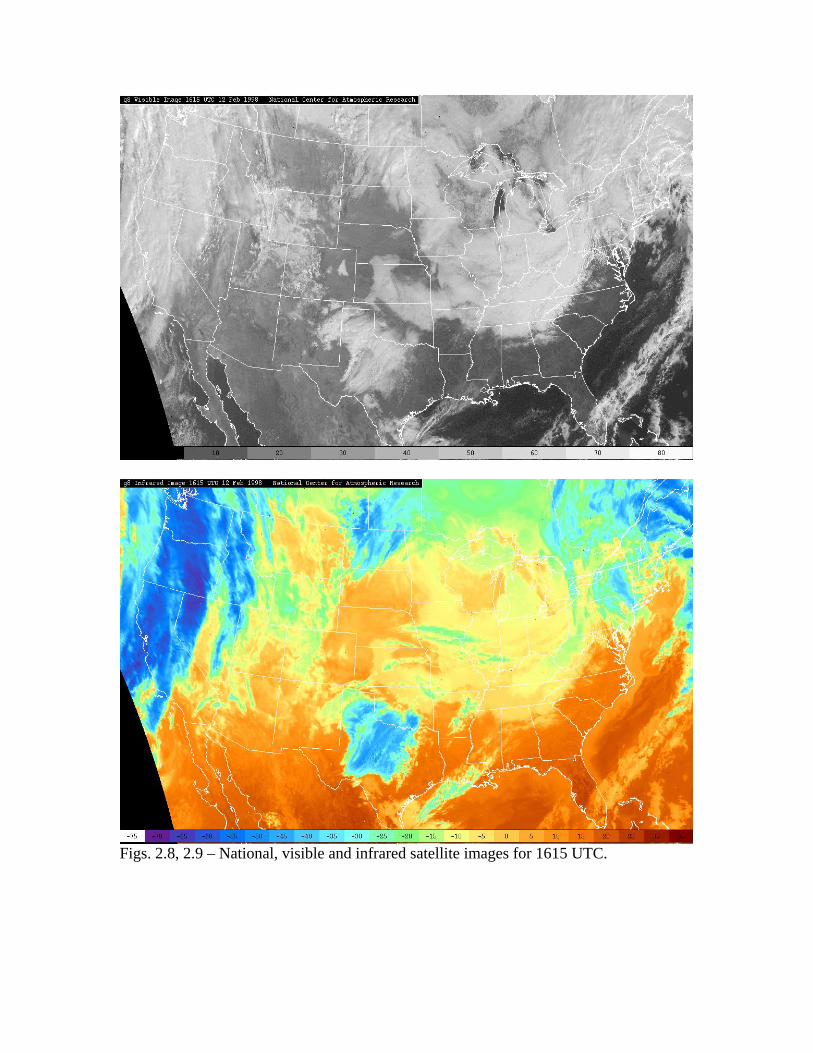
Figs. 2.8, 2.9 – National, visible and infrared satellite images for 1615 UTC.
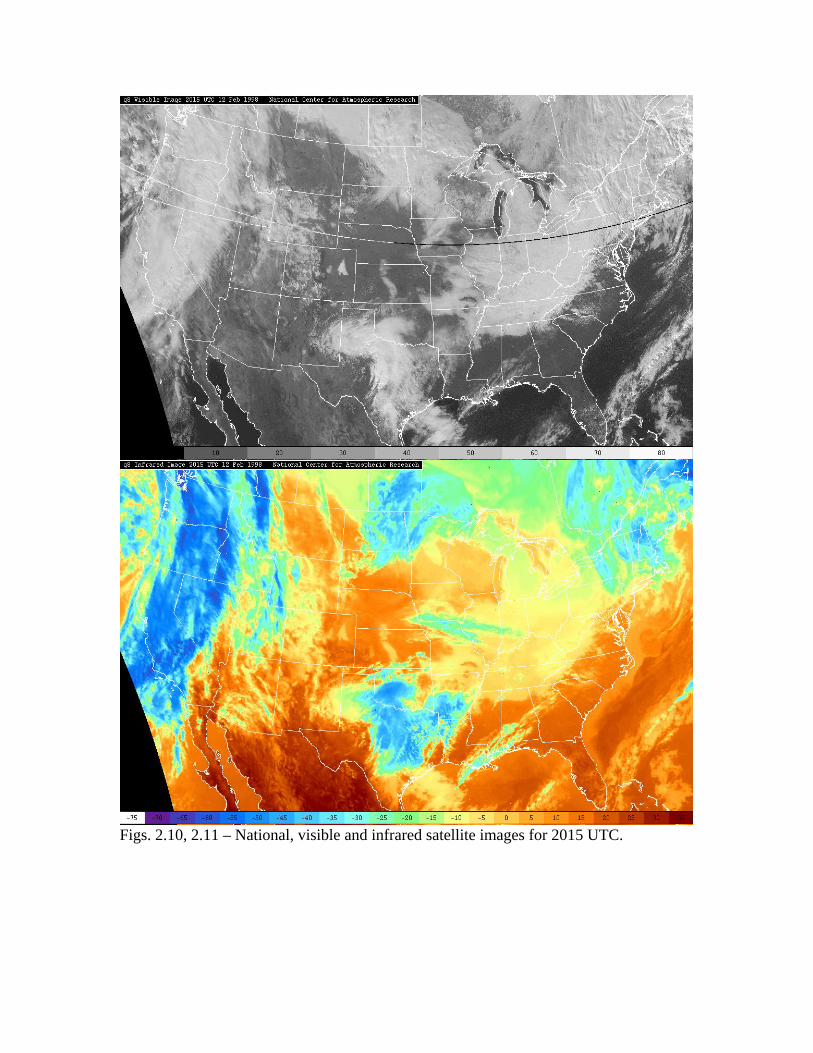
Figs. 2.10, 2.11 – National, visible and infrared satellite images for 2015 UTC.

Figs. 2.12, 2.13 – Radar reflectivity images from Detroit for 1617 and 1716 UTC.
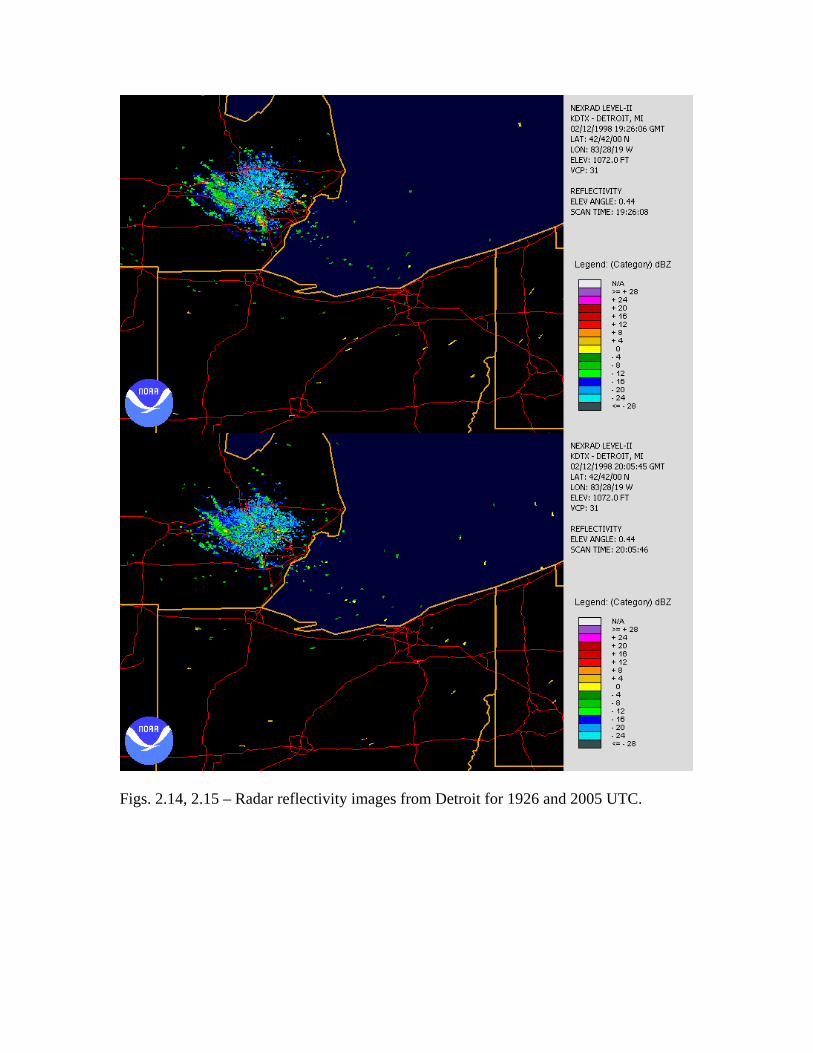
Figs. 2.14, 2.15 – Radar reflectivity images from Detroit for 1926 and 2005 UTC.
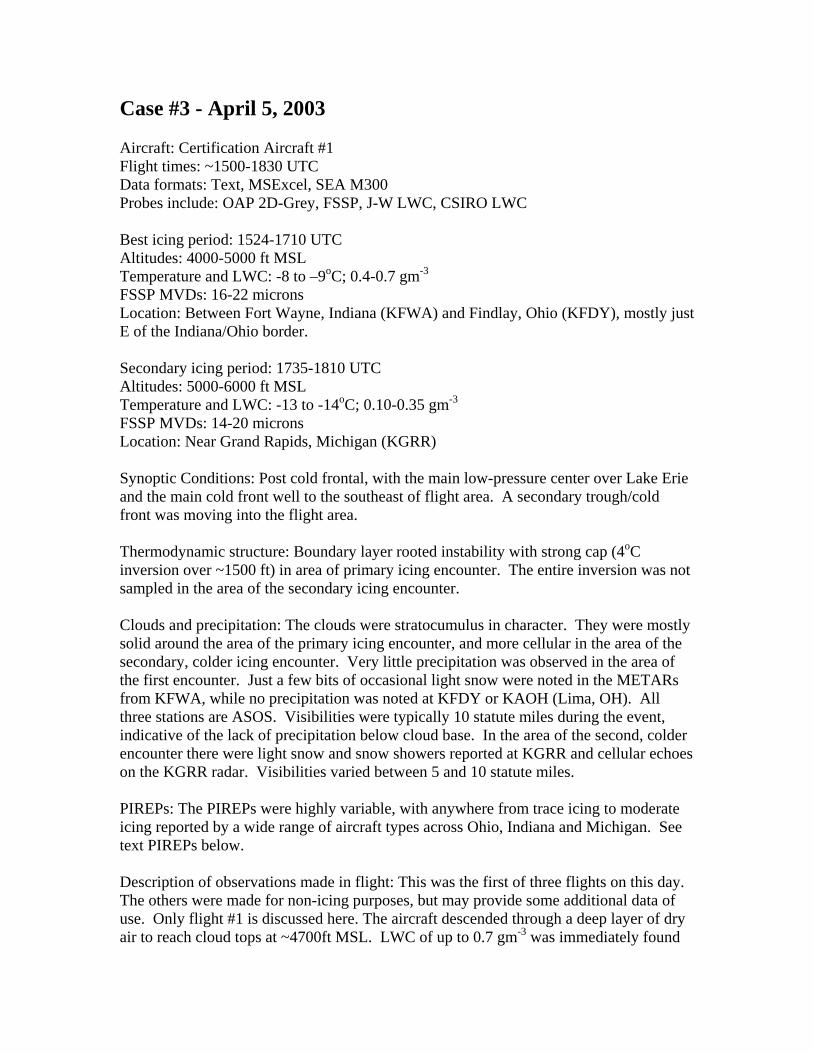
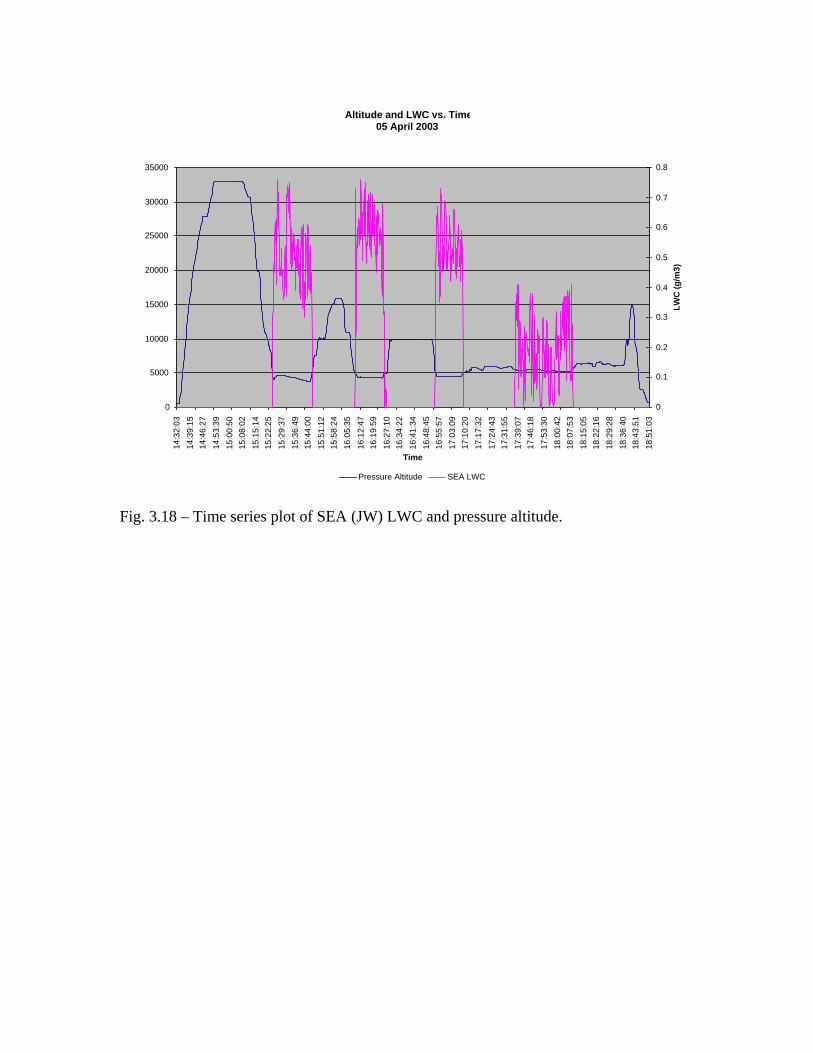
Case #3 - April 5, 2003 Aircraft: Certification Aircraft #1 Flight times: ~1500-1830 UTC Data formats: Text, MSExcel, SEA M300 Probes include: OAP 2D-Grey, FSSP, J-W LWC, CSIRO LWC Best icing period: 1524-1710 UTC Altitudes: 4000-5000 ft MSL Temperature and LWC: -8 to –9oC; 0.4-0.7 gm-3 FSSP MVDs: 16-22 microns Location: Between Fort Wayne, Indiana (KFWA) and Findlay, Ohio (KFDY), mostly just E of the Indiana/Ohio border. Secondary icing period: 1735-1810 UTC Altitudes: 5000-6000 ft MSL Temperature and LWC: -13 to -14oC; 0.10-0.35 gm-3 FSSP MVDs: 14-20 microns Location: Near Grand Rapids, Michigan (KGRR) Synoptic Conditions: Post cold frontal, with the main low-pressure center over Lake Erie and the main cold front well to the southeast of flight area. A secondary trough/cold front was moving into the flight area. Thermodynamic structure: Boundary layer rooted instability with strong cap (4oC inversion over ~1500 ft) in area of primary icing encounter. The entire inversion was not sampled in the area of the secondary icing encounter. Clouds and precipitation: The clouds were stratocumulus in character. They were mostly solid around the area of the primary icing encounter, and more cellular in the area of the secondary, colder icing encounter. Very little precipitation was observed in the area of the first encounter. Just a few bits of occasional light snow were noted in the METARs from KFWA, while no precipitation was noted at KFDY or KAOH (Lima, OH). All three stations are ASOS. Visibilities were typically 10 statute miles during the event, indicative of the lack of precipitation below cloud base. In the area of the second, colder encounter there were light snow and snow showers reported at KGRR and cellular echoes on the KGRR radar. Visibilities varied between 5 and 10 statute miles. PIREPs: The PIREPs were highly variable, with anywhere from trace icing to moderate icing reported by a wide range of aircraft types across Ohio, Indiana and Michigan. See text PIREPs below. Description of observations made in flight: This was the first of three flights on this day. The others were made for non-icing purposes, but may provide some additional data of use. Only flight #1 is discussed here. The aircraft descended through a deep layer of dry air to reach cloud tops at ~4700ft MSL. LWC of up to 0.7 gm-3 was immediately found
at temperatures of -8 to –9oC. The LWC varied between 0.35 and 0.75 gm-3, depending on location and altitude but were primarily in the 0.45-0.60 gm-3 range. Ice accreted at a rapid pace. The aircraft was primarily interested in the conditions near cloud top, so a complete profile of the cloud was not performed. Altitudes as low as 3750 ft were reached, and the temperature was –6.5oC at that level. Cloud bases varied between ~2000 and 3500 ft MSL around the area, but most appeared to be closer to 2000-2500 ft MSL around the primary area of icing. There was a strong inversion of about 4oC just above the cloud top. After completing a total of three ~20 minute encounters in these conditions, the aircraft flew northwest to land at Grand Rapids, Michigan, located further to the northwest behind the cold front, and also on the northwest side of a secondary cold front (or trough). Conditions were significantly colder (-14oC) and LWCs of 0.10-0.35 gm-3 were observed in and around the tops of cellular stratocumulus that were resulting in snow showers at the surface. 2-D probe imagery will need to be inspected for these icing encounters to determine the presence, phase and amount of large particles that may have been present.
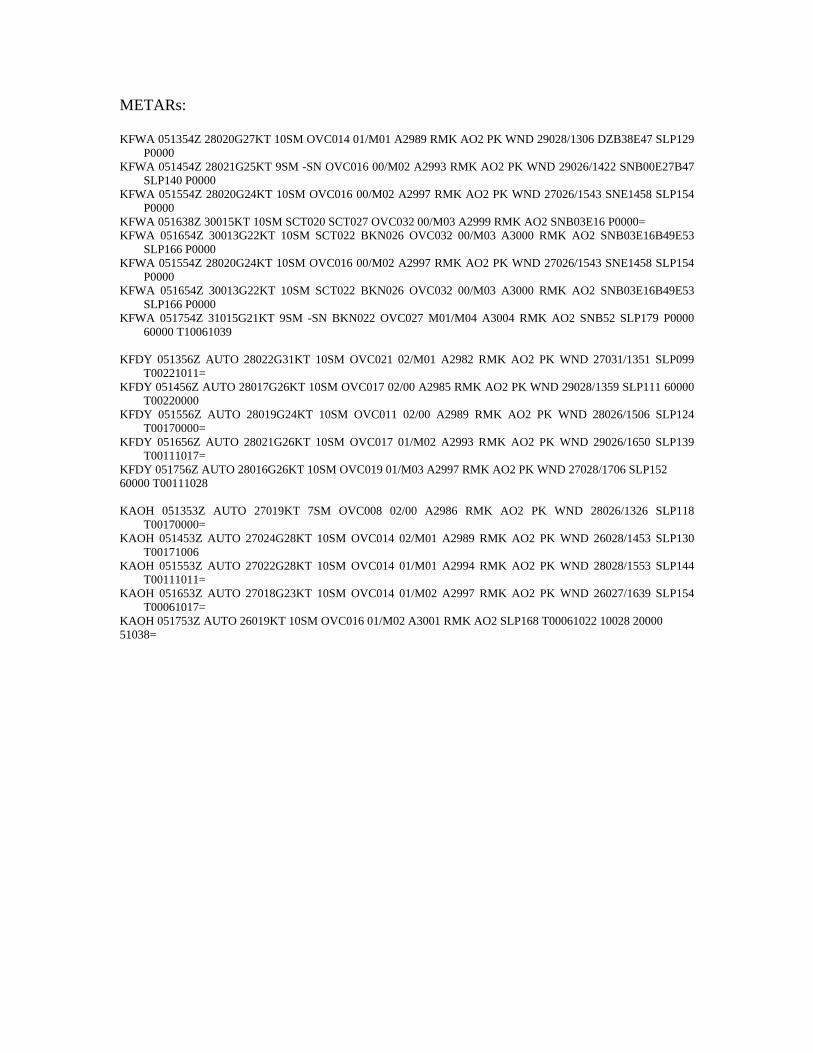
METARs: KFWA 051354Z 28020G27KT 10SM OVC014 01/M01 A2989 RMK AO2 PK WND 29028/1306 DZB38E47 SLP129
P0000 KFWA 051454Z 28021G25KT 9SM -SN OVC016 00/M02 A2993 RMK AO2 PK WND 29026/1422 SNB00E27B47
SLP140 P0000 KFWA 051554Z 28020G24KT 10SM OVC016 00/M02 A2997 RMK AO2 PK WND 27026/1543 SNE1458 SLP154
P0000 KFWA 051638Z 30015KT 10SM SCT020 SCT027 OVC032 00/M03 A2999 RMK AO2 SNB03E16 P0000= KFWA 051654Z 30013G22KT 10SM SCT022 BKN026 OVC032 00/M03 A3000 RMK AO2 SNB03E16B49E53
SLP166 P0000 KFWA 051554Z 28020G24KT 10SM OVC016 00/M02 A2997 RMK AO2 PK WND 27026/1543 SNE1458 SLP154
P0000 KFWA 051654Z 30013G22KT 10SM SCT022 BKN026 OVC032 00/M03 A3000 RMK AO2 SNB03E16B49E53
SLP166 P0000 KFWA 051754Z 31015G21KT 9SM -SN BKN022 OVC027 M01/M04 A3004 RMK AO2 SNB52 SLP179 P0000
60000 T10061039 KFDY 051356Z AUTO 28022G31KT 10SM OVC021 02/M01 A2982 RMK AO2 PK WND 27031/1351 SLP099
T00221011= KFDY 051456Z AUTO 28017G26KT 10SM OVC017 02/00 A2985 RMK AO2 PK WND 29028/1359 SLP111 60000
T00220000 KFDY 051556Z AUTO 28019G24KT 10SM OVC011 02/00 A2989 RMK AO2 PK WND 28026/1506 SLP124
T00170000= KFDY 051656Z AUTO 28021G26KT 10SM OVC017 01/M02 A2993 RMK AO2 PK WND 29026/1650 SLP139
T00111017= KFDY 051756Z AUTO 28016G26KT 10SM OVC019 01/M03 A2997 RMK AO2 PK WND 27028/1706 SLP152 60000 T00111028 KAOH 051353Z AUTO 27019KT 7SM OVC008 02/00 A2986 RMK AO2 PK WND 28026/1326 SLP118
T00170000= KAOH 051453Z AUTO 27024G28KT 10SM OVC014 02/M01 A2989 RMK AO2 PK WND 26028/1453 SLP130
T00171006 KAOH 051553Z AUTO 27022G28KT 10SM OVC014 01/M01 A2994 RMK AO2 PK WND 28028/1553 SLP144
T00111011= KAOH 051653Z AUTO 27018G23KT 10SM OVC014 01/M02 A2997 RMK AO2 PK WND 26027/1639 SLP154
T00061017= KAOH 051753Z AUTO 26019KT 10SM OVC016 01/M02 A3001 RMK AO2 SLP168 T00061022 10028 20000 51038=
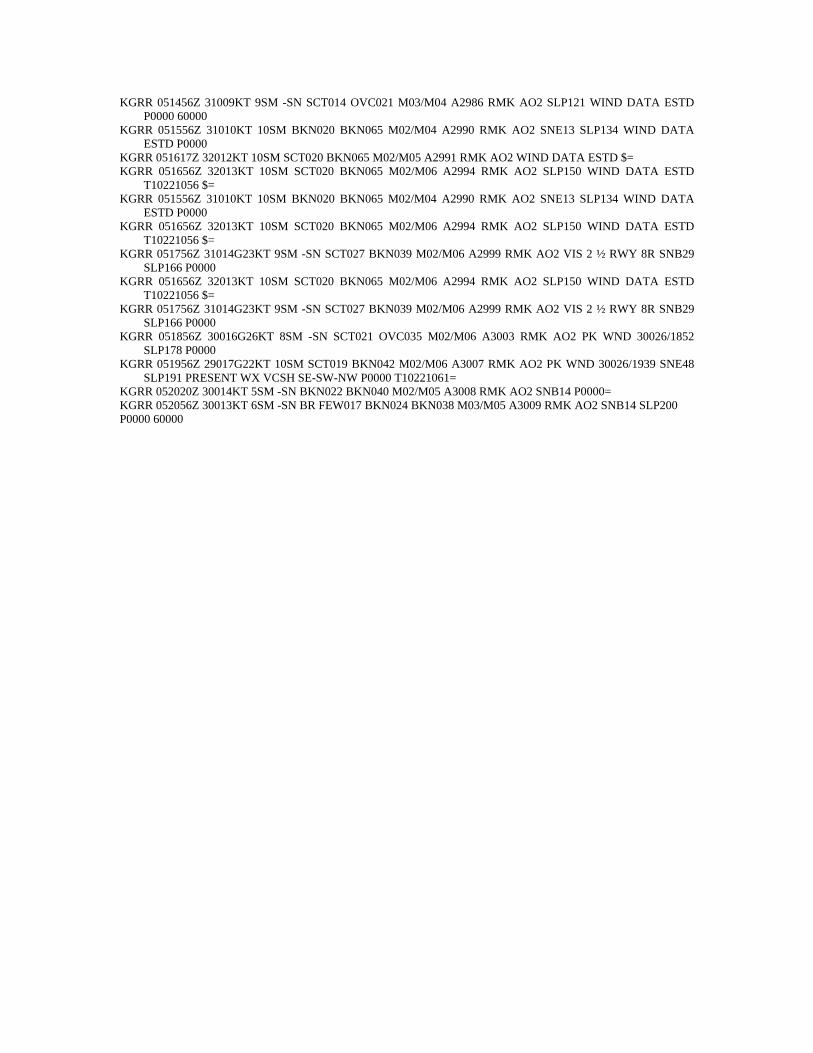
KGRR 051456Z 31009KT 9SM -SN SCT014 OVC021 M03/M04 A2986 RMK AO2 SLP121 WIND DATA ESTD P0000 60000
KGRR 051556Z 31010KT 10SM BKN020 BKN065 M02/M04 A2990 RMK AO2 SNE13 SLP134 WIND DATA ESTD P0000
KGRR 051617Z 32012KT 10SM SCT020 BKN065 M02/M05 A2991 RMK AO2 WIND DATA ESTD $= KGRR 051656Z 32013KT 10SM SCT020 BKN065 M02/M06 A2994 RMK AO2 SLP150 WIND DATA ESTD
T10221056 $= KGRR 051556Z 31010KT 10SM BKN020 BKN065 M02/M04 A2990 RMK AO2 SNE13 SLP134 WIND DATA
ESTD P0000 KGRR 051656Z 32013KT 10SM SCT020 BKN065 M02/M06 A2994 RMK AO2 SLP150 WIND DATA ESTD
T10221056 $= KGRR 051756Z 31014G23KT 9SM -SN SCT027 BKN039 M02/M06 A2999 RMK AO2 VIS 2 ½ RWY 8R SNB29
SLP166 P0000 KGRR 051656Z 32013KT 10SM SCT020 BKN065 M02/M06 A2994 RMK AO2 SLP150 WIND DATA ESTD
T10221056 $= KGRR 051756Z 31014G23KT 9SM -SN SCT027 BKN039 M02/M06 A2999 RMK AO2 VIS 2 ½ RWY 8R SNB29
SLP166 P0000 KGRR 051856Z 30016G26KT 8SM -SN SCT021 OVC035 M02/M06 A3003 RMK AO2 PK WND 30026/1852
SLP178 P0000 KGRR 051956Z 29017G22KT 10SM SCT019 BKN042 M02/M06 A3007 RMK AO2 PK WND 30026/1939 SNE48
SLP191 PRESENT WX VCSH SE-SW-NW P0000 T10221061= KGRR 052020Z 30014KT 5SM -SN BKN022 BKN040 M02/M05 A3008 RMK AO2 SNB14 P0000= KGRR 052056Z 30013KT 6SM -SN BR FEW017 BKN024 BKN038 M03/M05 A3009 RMK AO2 SNB14 SLP200 P0000 60000
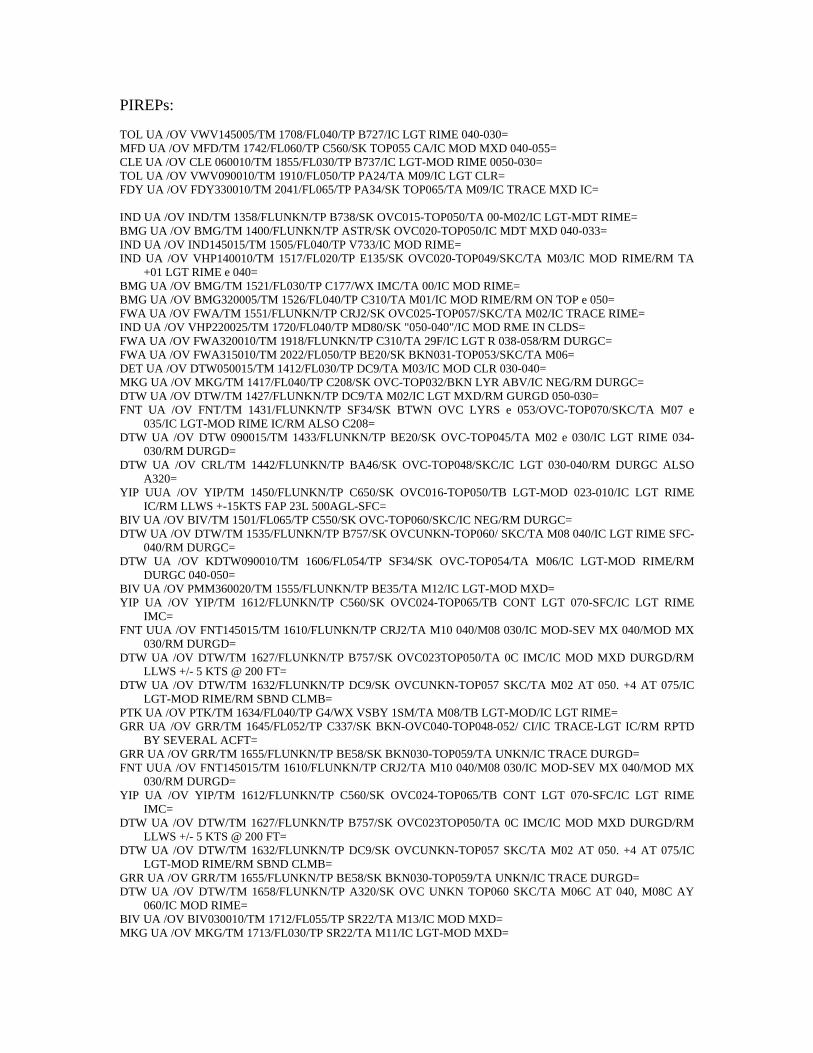
PIREPs: TOL UA /OV VWV145005/TM 1708/FL040/TP B727/IC LGT RIME 040-030= MFD UA /OV MFD/TM 1742/FL060/TP C560/SK TOP055 CA/IC MOD MXD 040-055= CLE UA /OV CLE 060010/TM 1855/FL030/TP B737/IC LGT-MOD RIME 0050-030= TOL UA /OV VWV090010/TM 1910/FL050/TP PA24/TA M09/IC LGT CLR= FDY UA /OV FDY330010/TM 2041/FL065/TP PA34/SK TOP065/TA M09/IC TRACE MXD IC= IND UA /OV IND/TM 1358/FLUNKN/TP B738/SK OVC015-TOP050/TA 00-M02/IC LGT-MDT RIME= BMG UA /OV BMG/TM 1400/FLUNKN/TP ASTR/SK OVC020-TOP050/IC MDT MXD 040-033= IND UA /OV IND145015/TM 1505/FL040/TP V733/IC MOD RIME= IND UA /OV VHP140010/TM 1517/FL020/TP E135/SK OVC020-TOP049/SKC/TA M03/IC MOD RIME/RM TA
+01 LGT RIME e 040= BMG UA /OV BMG/TM 1521/FL030/TP C177/WX IMC/TA 00/IC MOD RIME= BMG UA /OV BMG320005/TM 1526/FL040/TP C310/TA M01/IC MOD RIME/RM ON TOP e 050= FWA UA /OV FWA/TM 1551/FLUNKN/TP CRJ2/SK OVC025-TOP057/SKC/TA M02/IC TRACE RIME= IND UA /OV VHP220025/TM 1720/FL040/TP MD80/SK "050-040"/IC MOD RME IN CLDS= FWA UA /OV FWA320010/TM 1918/FLUNKN/TP C310/TA 29F/IC LGT R 038-058/RM DURGC= FWA UA /OV FWA315010/TM 2022/FL050/TP BE20/SK BKN031-TOP053/SKC/TA M06= DET UA /OV DTW050015/TM 1412/FL030/TP DC9/TA M03/IC MOD CLR 030-040= MKG UA /OV MKG/TM 1417/FL040/TP C208/SK OVC-TOP032/BKN LYR ABV/IC NEG/RM DURGC= DTW UA /OV DTW/TM 1427/FLUNKN/TP DC9/TA M02/IC LGT MXD/RM GURGD 050-030= FNT UA /OV FNT/TM 1431/FLUNKN/TP SF34/SK BTWN OVC LYRS e 053/OVC-TOP070/SKC/TA M07 e
035/IC LGT-MOD RIME IC/RM ALSO C208= DTW UA /OV DTW 090015/TM 1433/FLUNKN/TP BE20/SK OVC-TOP045/TA M02 e 030/IC LGT RIME 034-
030/RM DURGD= DTW UA /OV CRL/TM 1442/FLUNKN/TP BA46/SK OVC-TOP048/SKC/IC LGT 030-040/RM DURGC ALSO
A320= YIP UUA /OV YIP/TM 1450/FLUNKN/TP C650/SK OVC016-TOP050/TB LGT-MOD 023-010/IC LGT RIME
IC/RM LLWS +-15KTS FAP 23L 500AGL-SFC= BIV UA /OV BIV/TM 1501/FL065/TP C550/SK OVC-TOP060/SKC/IC NEG/RM DURGC= DTW UA /OV DTW/TM 1535/FLUNKN/TP B757/SK OVCUNKN-TOP060/ SKC/TA M08 040/IC LGT RIME SFC-
040/RM DURGC= DTW UA /OV KDTW090010/TM 1606/FL054/TP SF34/SK OVC-TOP054/TA M06/IC LGT-MOD RIME/RM
DURGC 040-050= BIV UA /OV PMM360020/TM 1555/FLUNKN/TP BE35/TA M12/IC LGT-MOD MXD= YIP UA /OV YIP/TM 1612/FLUNKN/TP C560/SK OVC024-TOP065/TB CONT LGT 070-SFC/IC LGT RIME
IMC= FNT UUA /OV FNT145015/TM 1610/FLUNKN/TP CRJ2/TA M10 040/M08 030/IC MOD-SEV MX 040/MOD MX
030/RM DURGD= DTW UA /OV DTW/TM 1627/FLUNKN/TP B757/SK OVC023TOP050/TA 0C IMC/IC MOD MXD DURGD/RM
LLWS +/- 5 KTS @ 200 FT= DTW UA /OV DTW/TM 1632/FLUNKN/TP DC9/SK OVCUNKN-TOP057 SKC/TA M02 AT 050. +4 AT 075/IC
LGT-MOD RIME/RM SBND CLMB= PTK UA /OV PTK/TM 1634/FL040/TP G4/WX VSBY 1SM/TA M08/TB LGT-MOD/IC LGT RIME= GRR UA /OV GRR/TM 1645/FL052/TP C337/SK BKN-OVC040-TOP048-052/ CI/IC TRACE-LGT IC/RM RPTD
BY SEVERAL ACFT= GRR UA /OV GRR/TM 1655/FLUNKN/TP BE58/SK BKN030-TOP059/TA UNKN/IC TRACE DURGD= FNT UUA /OV FNT145015/TM 1610/FLUNKN/TP CRJ2/TA M10 040/M08 030/IC MOD-SEV MX 040/MOD MX
030/RM DURGD= YIP UA /OV YIP/TM 1612/FLUNKN/TP C560/SK OVC024-TOP065/TB CONT LGT 070-SFC/IC LGT RIME
IMC= DTW UA /OV DTW/TM 1627/FLUNKN/TP B757/SK OVC023TOP050/TA 0C IMC/IC MOD MXD DURGD/RM
LLWS +/- 5 KTS @ 200 FT= DTW UA /OV DTW/TM 1632/FLUNKN/TP DC9/SK OVCUNKN-TOP057 SKC/TA M02 AT 050. +4 AT 075/IC
LGT-MOD RIME/RM SBND CLMB= GRR UA /OV GRR/TM 1655/FLUNKN/TP BE58/SK BKN030-TOP059/TA UNKN/IC TRACE DURGD= DTW UA /OV DTW/TM 1658/FLUNKN/TP A320/SK OVC UNKN TOP060 SKC/TA M06C AT 040, M08C AY
060/IC MOD RIME= BIV UA /OV BIV030010/TM 1712/FL055/TP SR22/TA M13/IC MOD MXD= MKG UA /OV MKG/TM 1713/FL030/TP SR22/TA M11/IC LGT-MOD MXD=
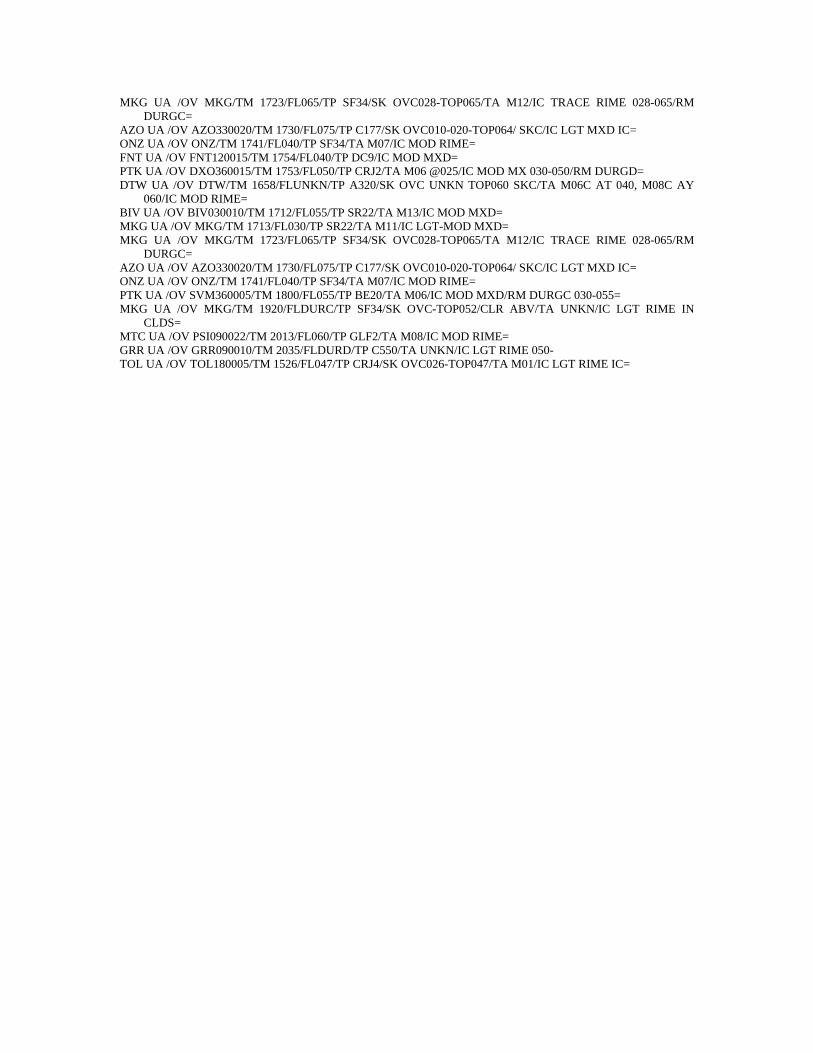
MKG UA /OV MKG/TM 1723/FL065/TP SF34/SK OVC028-TOP065/TA M12/IC TRACE RIME 028-065/RM DURGC=
AZO UA /OV AZO330020/TM 1730/FL075/TP C177/SK OVC010-020-TOP064/ SKC/IC LGT MXD IC= ONZ UA /OV ONZ/TM 1741/FL040/TP SF34/TA M07/IC MOD RIME= FNT UA /OV FNT120015/TM 1754/FL040/TP DC9/IC MOD MXD= PTK UA /OV DXO360015/TM 1753/FL050/TP CRJ2/TA M06 @025/IC MOD MX 030-050/RM DURGD= DTW UA /OV DTW/TM 1658/FLUNKN/TP A320/SK OVC UNKN TOP060 SKC/TA M06C AT 040, M08C AY
060/IC MOD RIME= BIV UA /OV BIV030010/TM 1712/FL055/TP SR22/TA M13/IC MOD MXD= MKG UA /OV MKG/TM 1713/FL030/TP SR22/TA M11/IC LGT-MOD MXD= MKG UA /OV MKG/TM 1723/FL065/TP SF34/SK OVC028-TOP065/TA M12/IC TRACE RIME 028-065/RM
DURGC= AZO UA /OV AZO330020/TM 1730/FL075/TP C177/SK OVC010-020-TOP064/ SKC/IC LGT MXD IC= ONZ UA /OV ONZ/TM 1741/FL040/TP SF34/TA M07/IC MOD RIME= PTK UA /OV SVM360005/TM 1800/FL055/TP BE20/TA M06/IC MOD MXD/RM DURGC 030-055= MKG UA /OV MKG/TM 1920/FLDURC/TP SF34/SK OVC-TOP052/CLR ABV/TA UNKN/IC LGT RIME IN
CLDS= MTC UA /OV PSI090022/TM 2013/FL060/TP GLF2/TA M08/IC MOD RIME= GRR UA /OV GRR090010/TM 2035/FLDURD/TP C550/TA UNKN/IC LGT RIME 050- TOL UA /OV TOL180005/TM 1526/FL047/TP CRJ4/SK OVC026-TOP047/TA M01/IC LGT RIME IC=
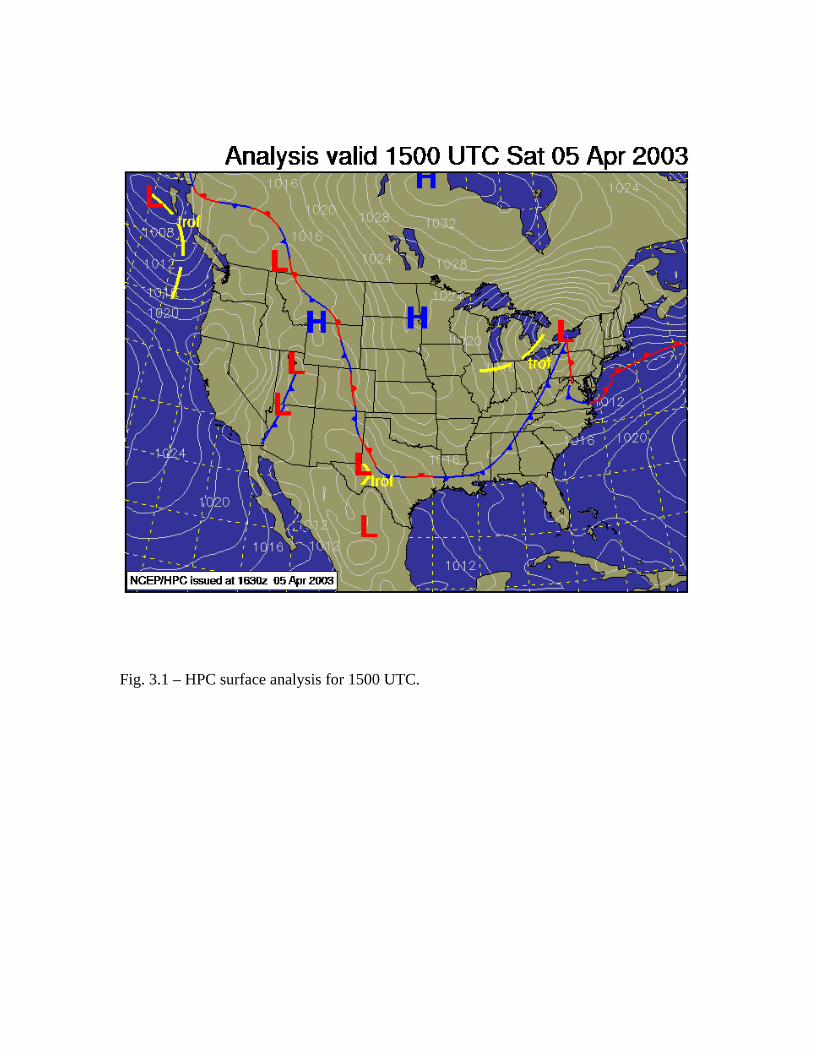
Fig. 3.1 – HPC surface analysis for 1500 UTC.
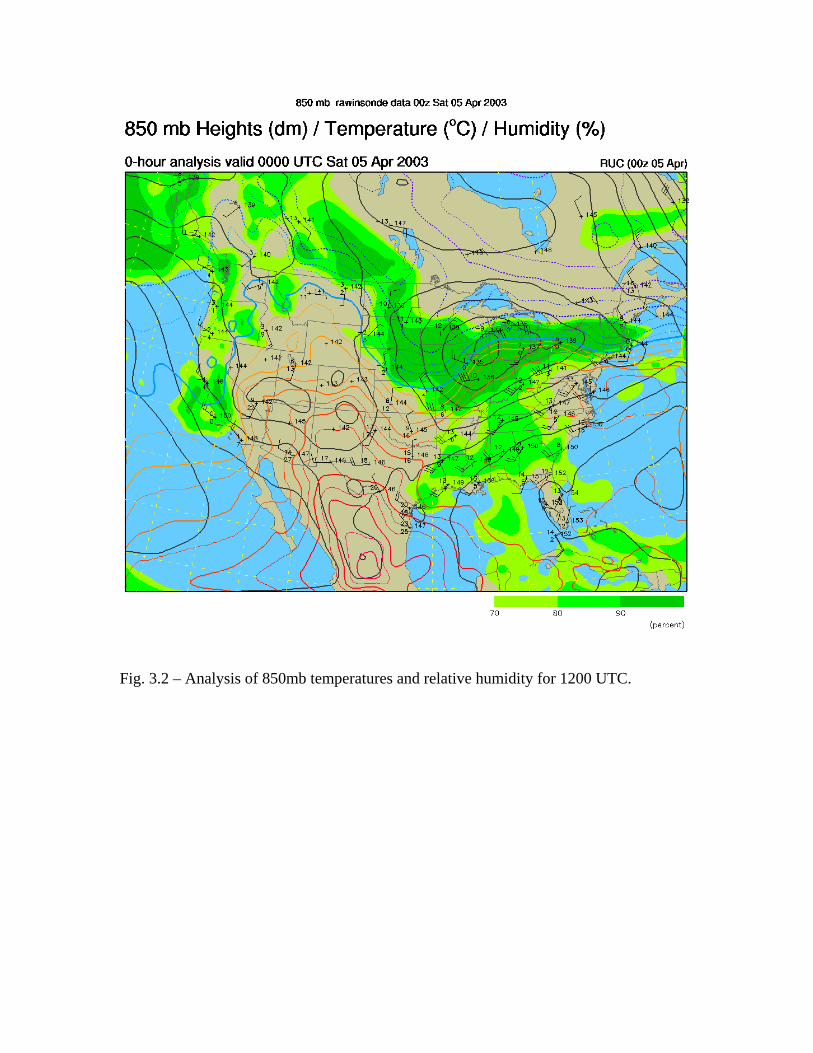
Fig. 3.2 – Analysis of 850mb temperatures and relative humidity for 1200 UTC.
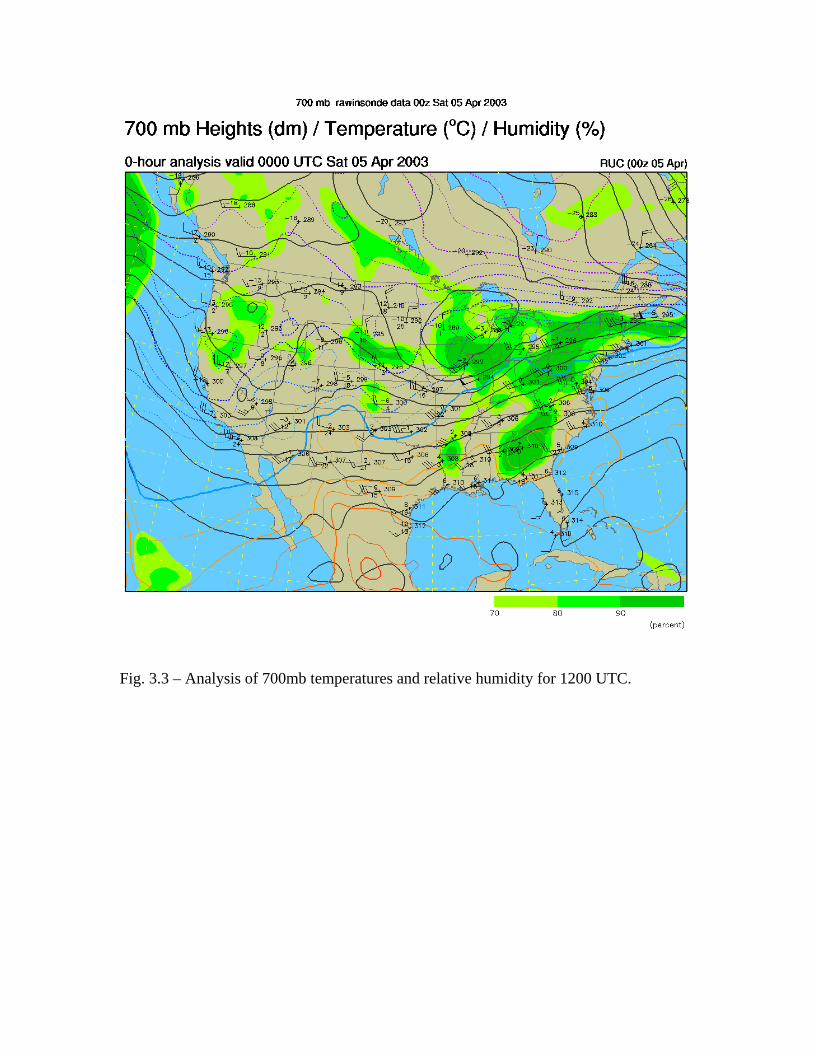
Fig. 3.3 – Analysis of 700mb temperatures and relative humidity for 1200 UTC.
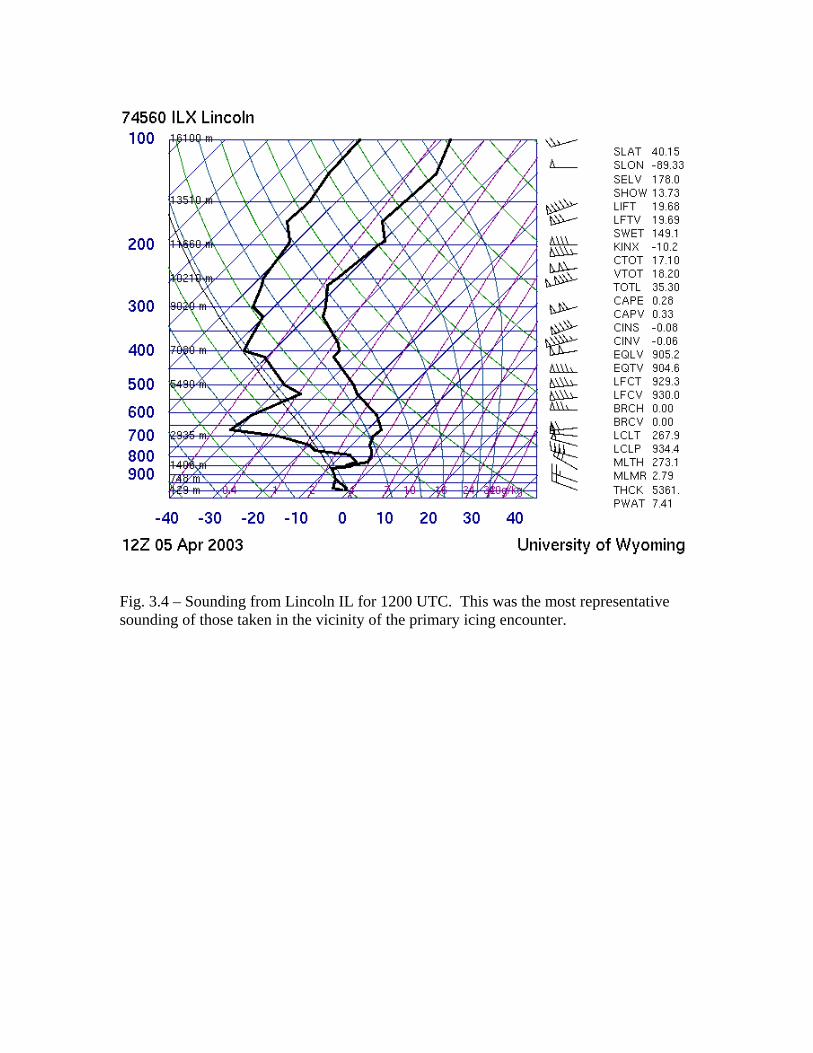
Fig. 3.4 – Sounding from Lincoln IL for 1200 UTC. This was the most representative sounding of those taken in the vicinity of the primary icing encounter.
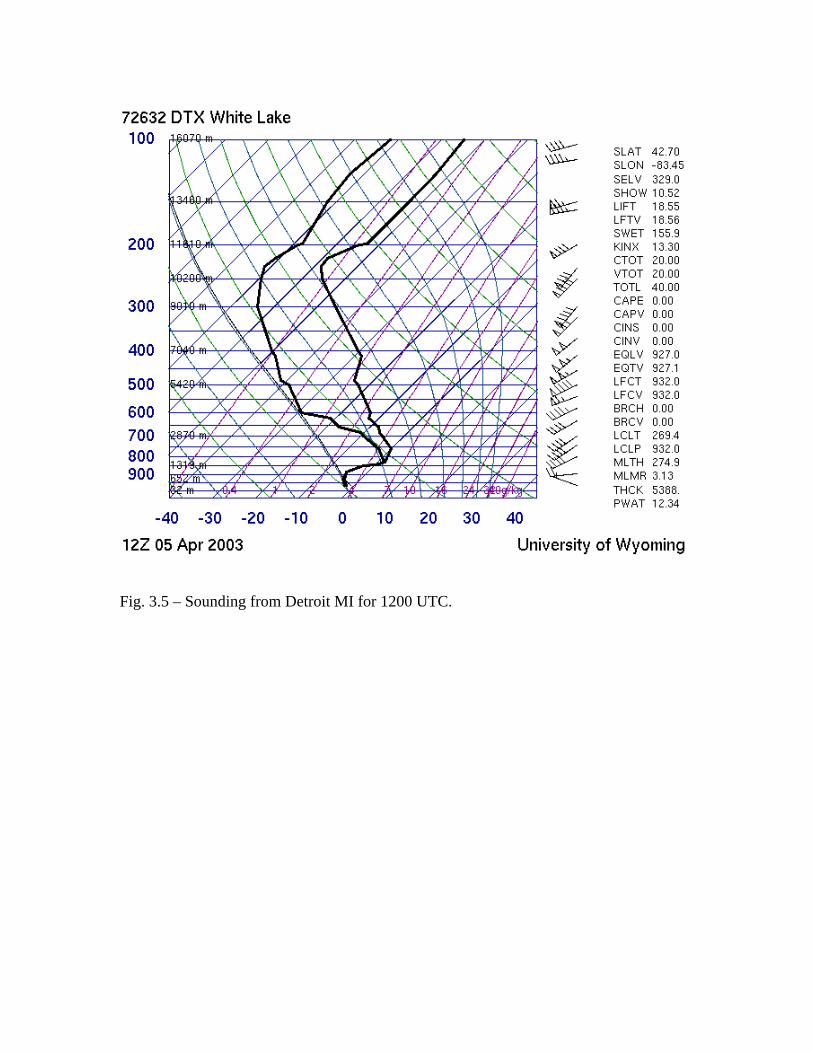
Fig. 3.5 – Sounding from Detroit MI for 1200 UTC.
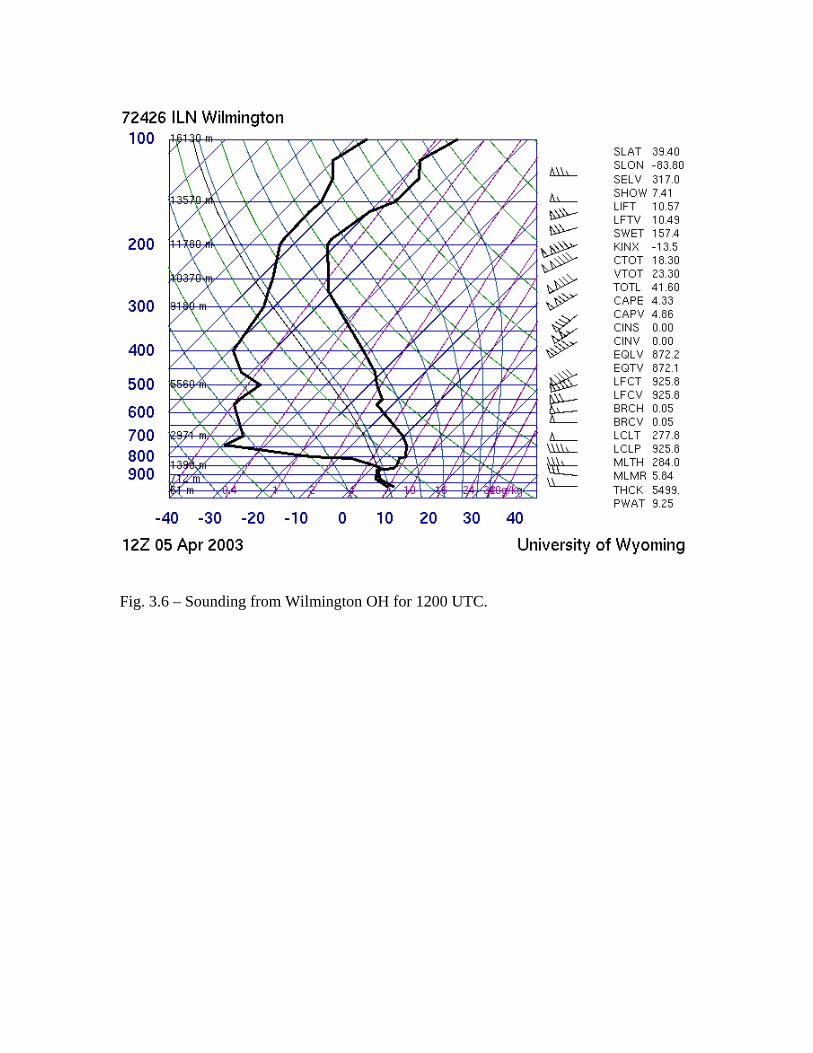
Fig. 3.6 – Sounding from Wilmington OH for 1200 UTC.
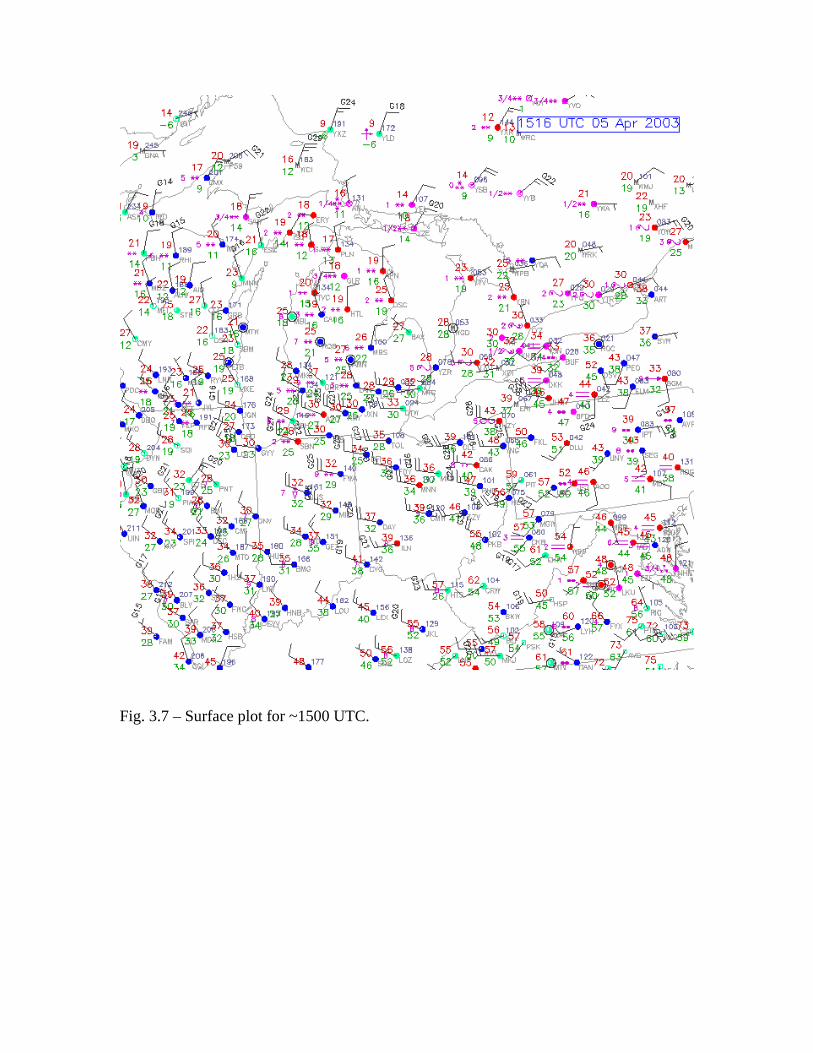
Fig. 3.7 – Surface plot for ~1500 UTC.
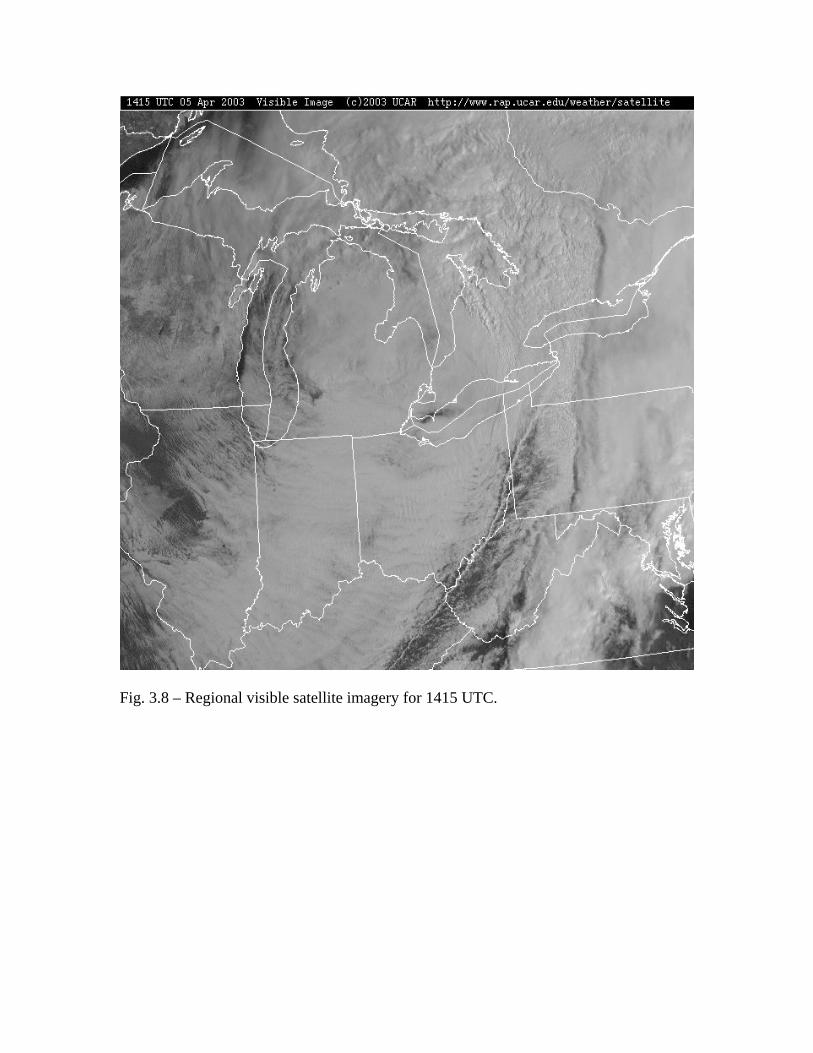
Fig. 3.8 – Regional visible satellite imagery for 1415 UTC.
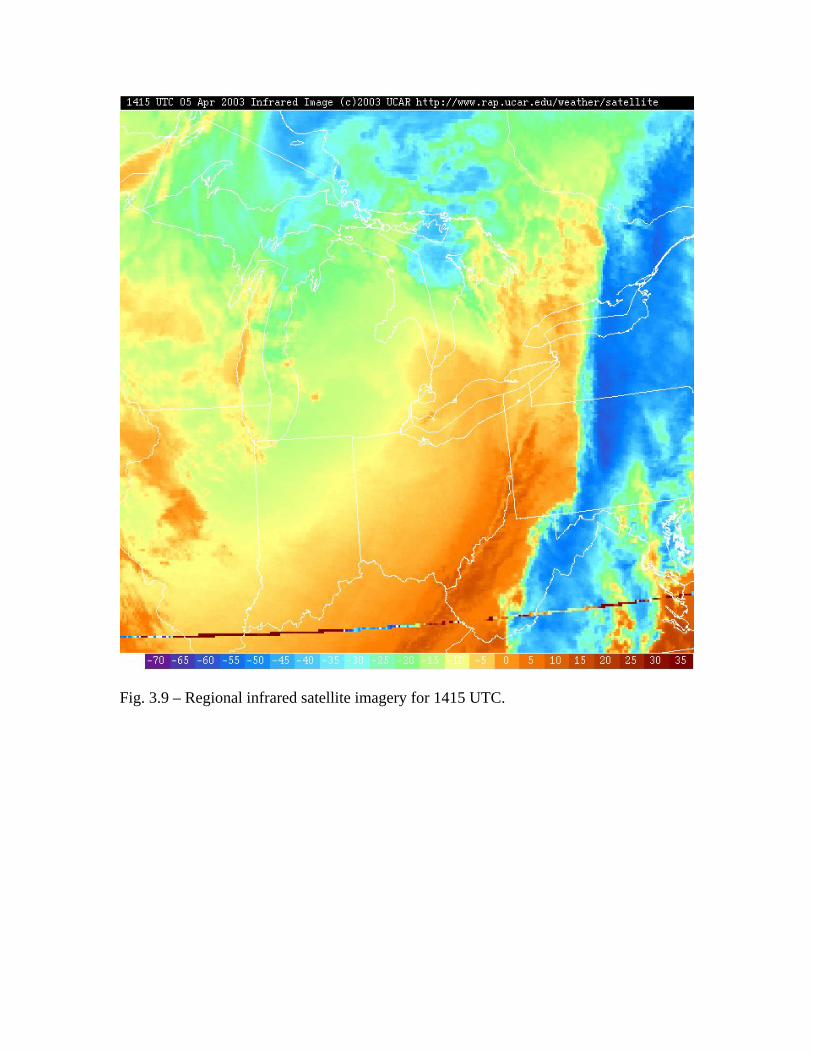
Fig. 3.9 – Regional infrared satellite imagery for 1415 UTC.
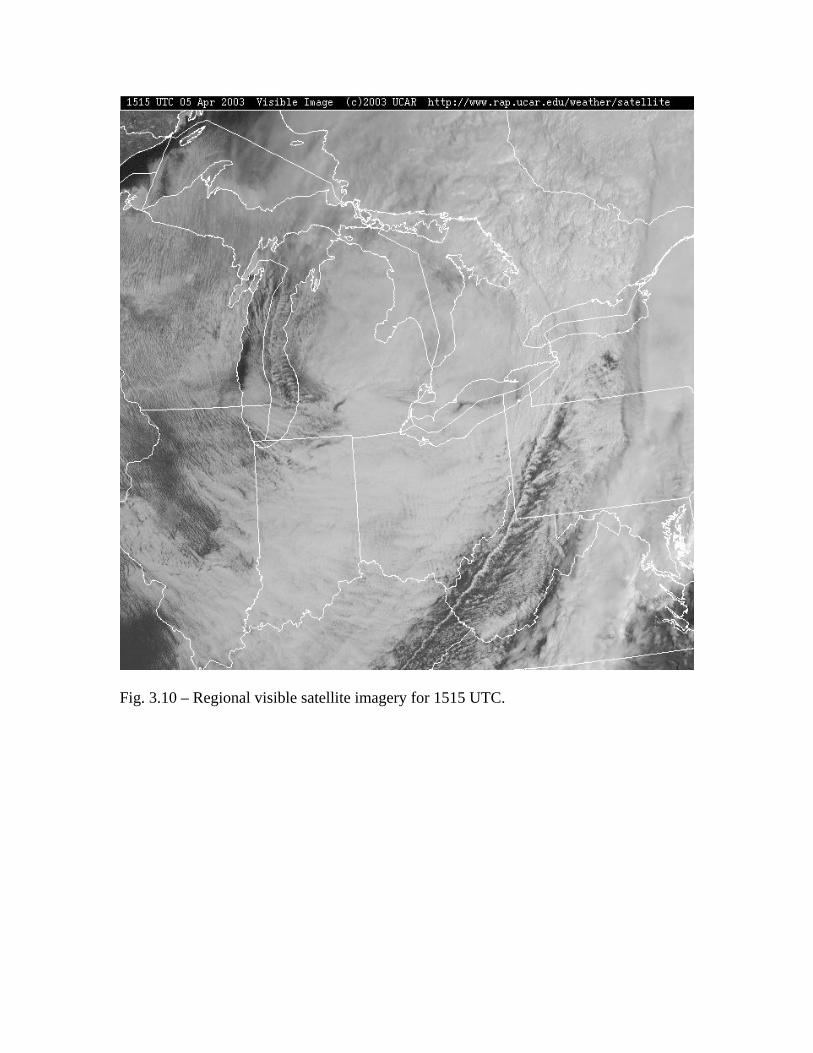
Fig. 3.10 – Regional visible satellite imagery for 1515 UTC.
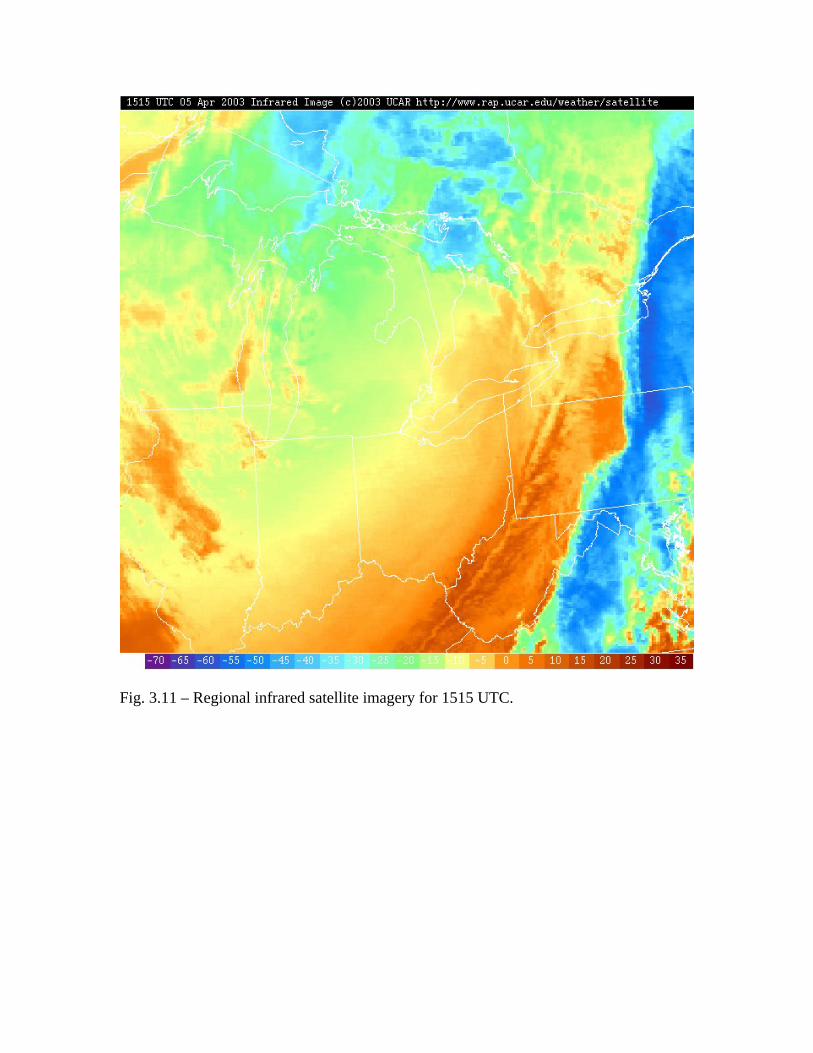
Fig. 3.11 – Regional infrared satellite imagery for 1515 UTC.
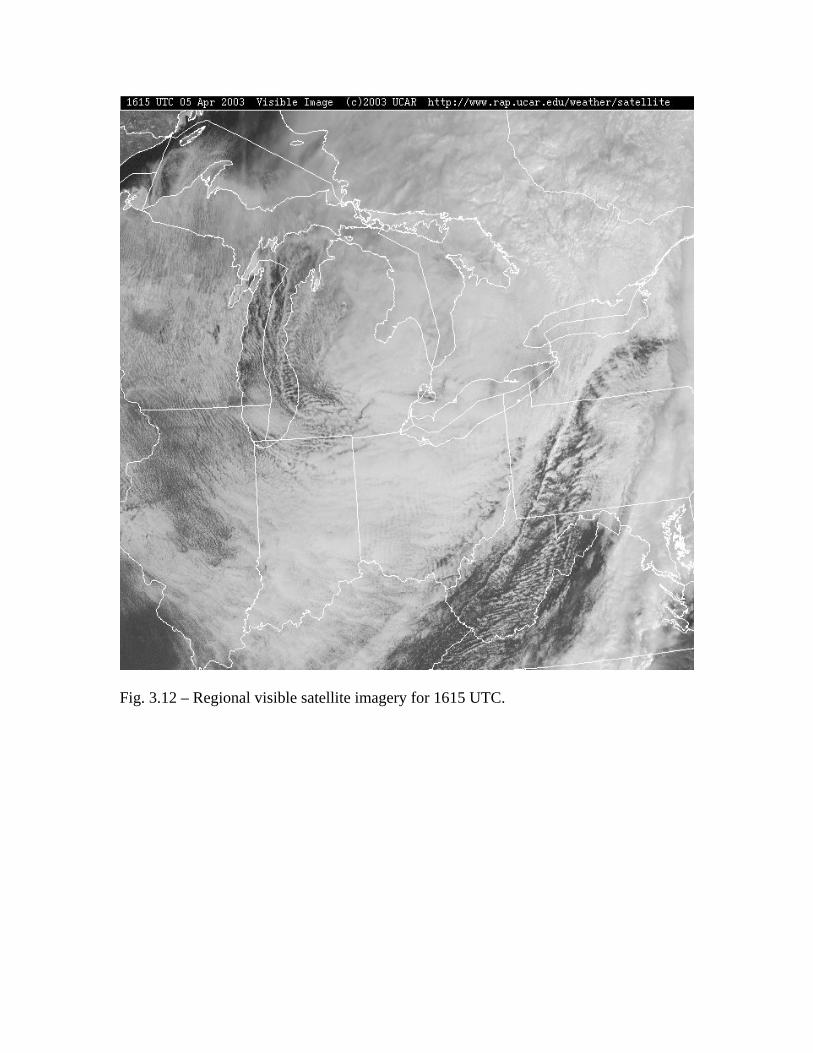
Fig. 3.12 – Regional visible satellite imagery for 1615 UTC.
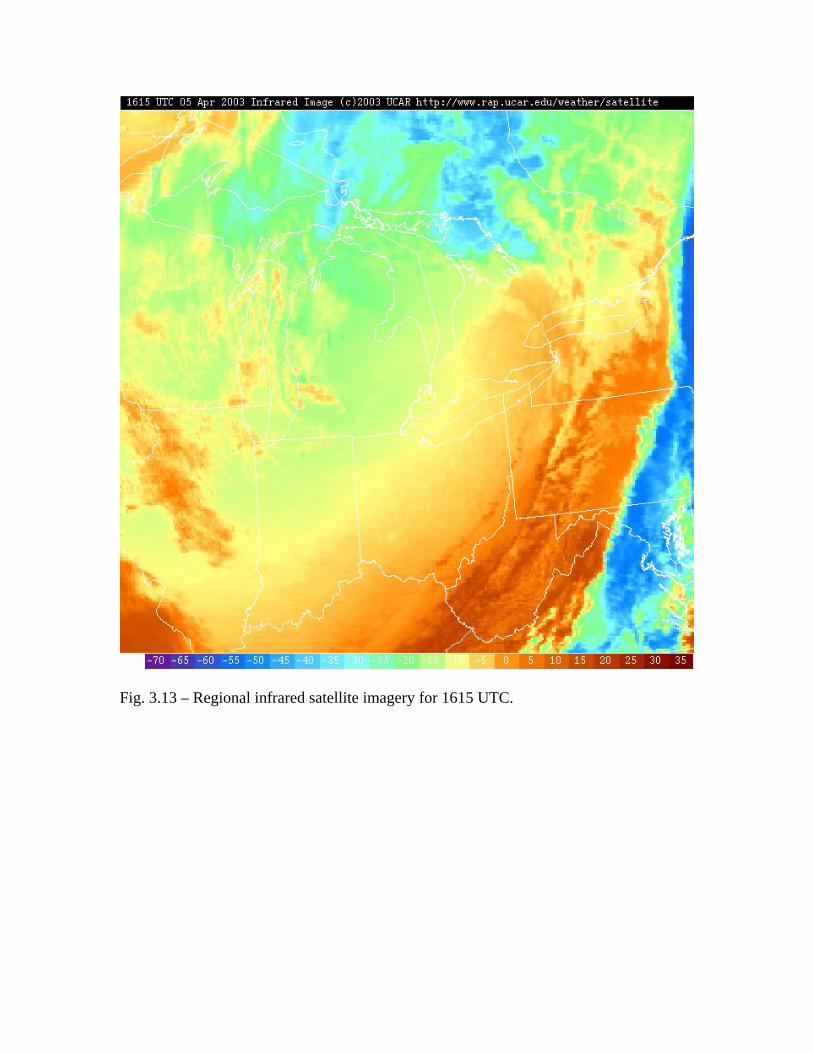
Fig. 3.13 – Regional infrared satellite imagery for 1615 UTC.
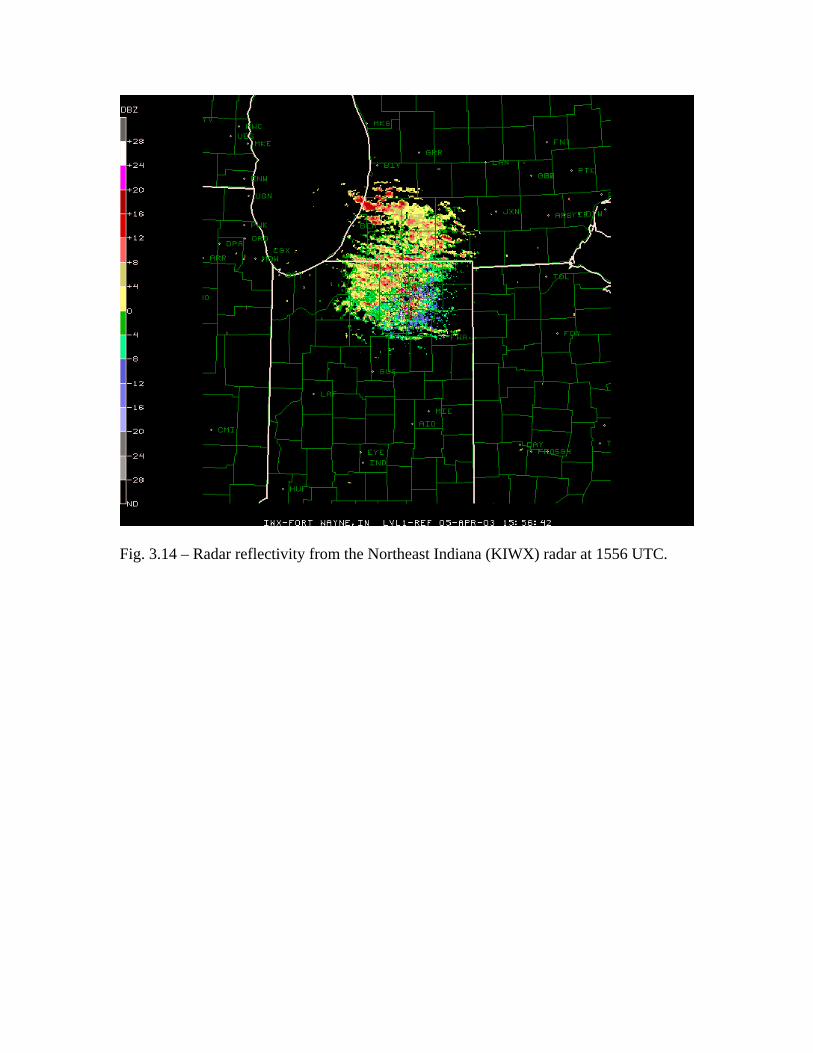
Fig. 3.14 – Radar reflectivity from the Northeast Indiana (KIWX) radar at 1556 UTC.
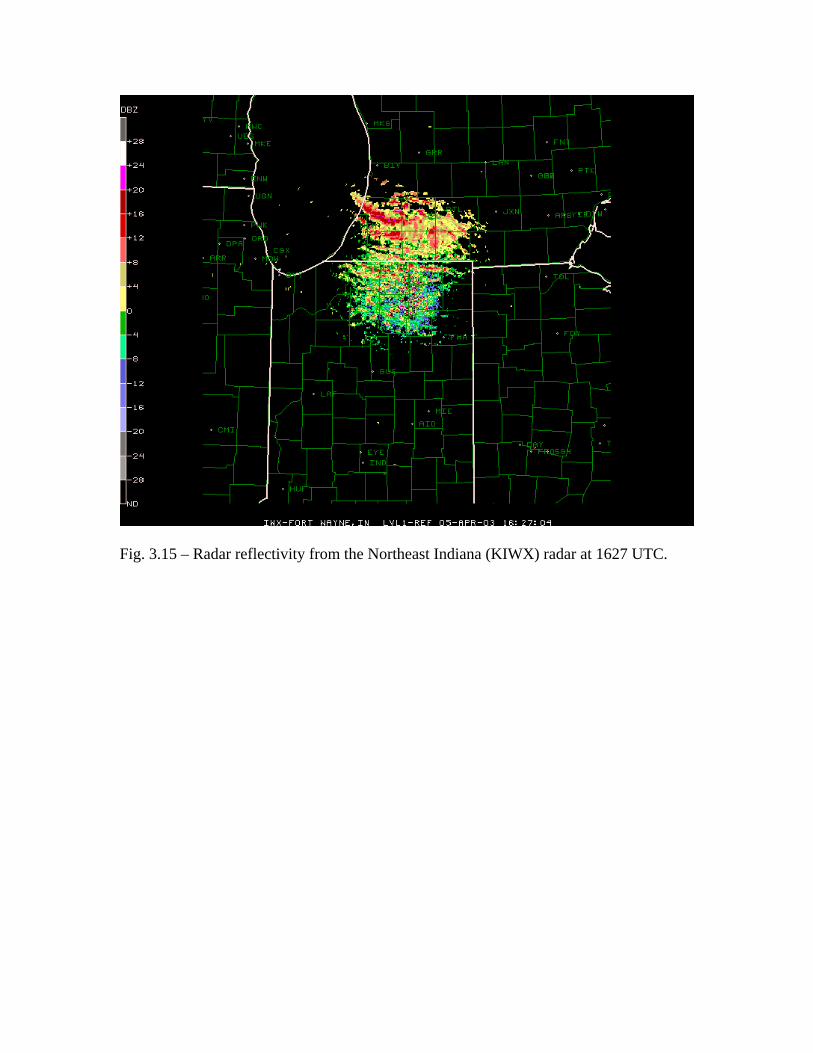
Fig. 3.15 – Radar reflectivity from the Northeast Indiana (KIWX) radar at 1627 UTC.
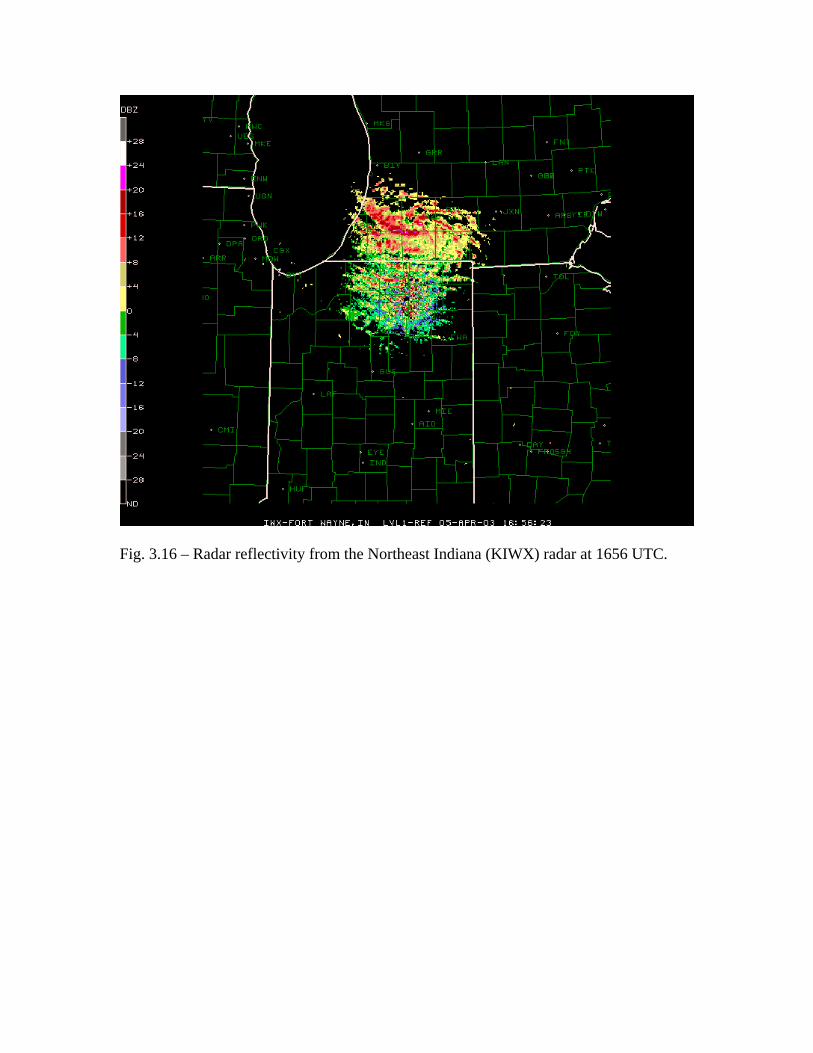
Fig. 3.16 – Radar reflectivity from the Northeast Indiana (KIWX) radar at 1656 UTC.
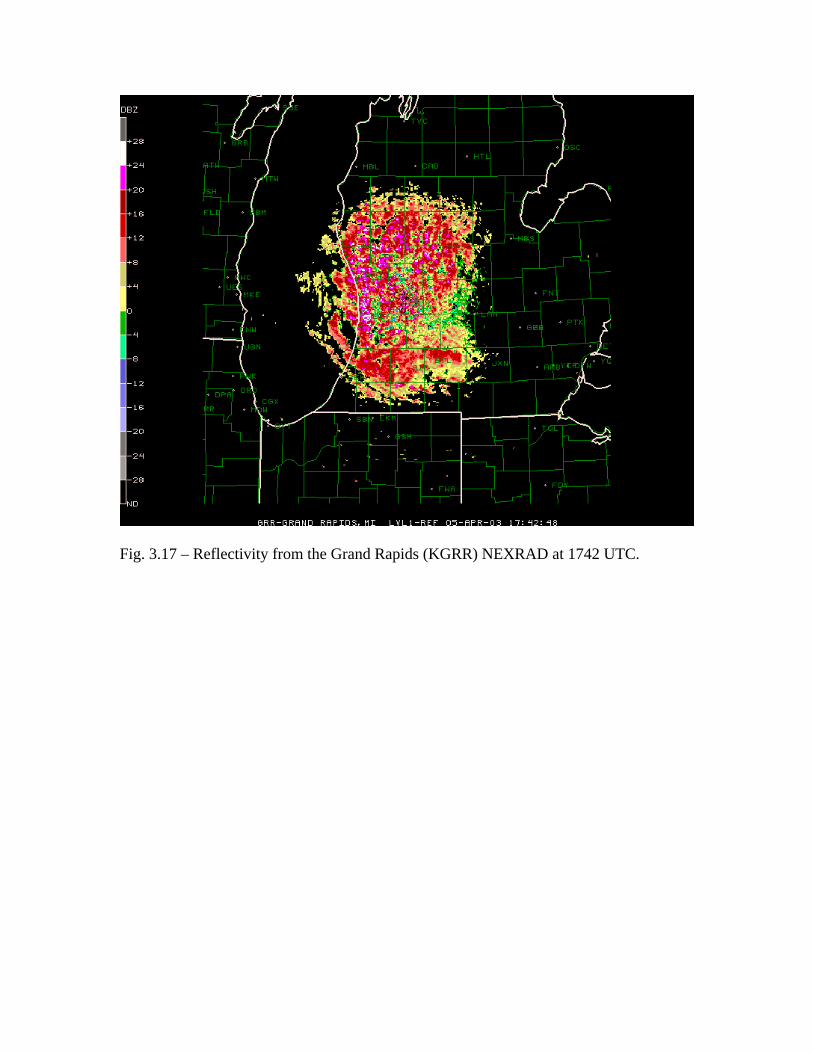
Fig. 3.17 – Reflectivity from the Grand Rapids (KGRR) NEXRAD at 1742 UTC.
Altitude and LWC vs. Time05 April 2003
0
5000
10000
15000
20000
25000
30000
3500014
:32:
0314
:39:
1514
:46:
2714
:53:
3915
:00:
5015
:08:
0215
:15:
1415
:22:
2515
:29:
3715
:36:
4915
:44:
0015
:51:
1215
:58:
2416
:05:
3516
:12:
4716
:19:
5916
:27:
1016
:34:
2216
:41:
3416
:48:
4516
:55:
5717
:03:
0917
:10:
2017
:17:
3217
:24:
4317
:31:
5517
:39:
0717
:46:
1817
:53:
3018
:00:
4218
:07:
5318
:15:
0518
:22:
1618
:29:
2818
:36:
4018
:43:
5118
:51:
03
Time
0
0.1
0.2
0.3
0.4
0.5
0.6
0.7
0.8
LWC
(g/m
3)
Pressure Altitude SEA LWC
Fig. 3.18 – Time series plot of SEA (JW) LWC and pressure altitude.
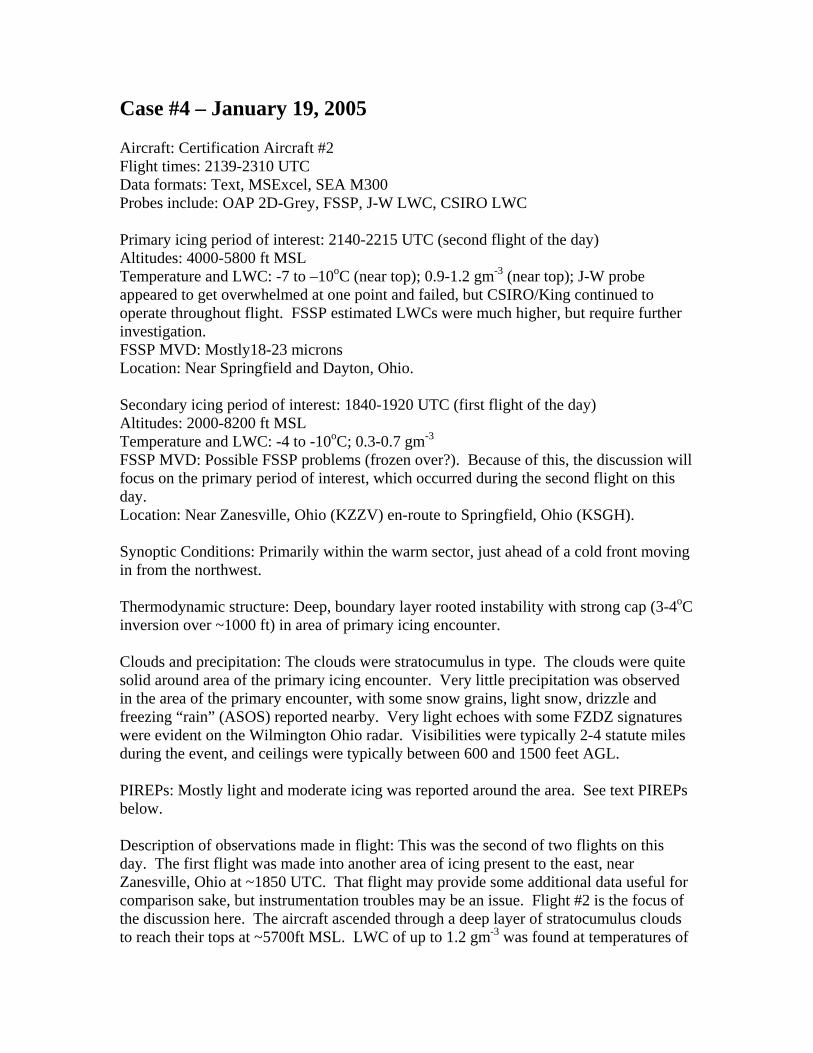
Case #4 – January 19, 2005 Aircraft: Certification Aircraft #2 Flight times: 2139-2310 UTC Data formats: Text, MSExcel, SEA M300 Probes include: OAP 2D-Grey, FSSP, J-W LWC, CSIRO LWC Primary icing period of interest: 2140-2215 UTC (second flight of the day) Altitudes: 4000-5800 ft MSL Temperature and LWC: -7 to –10oC (near top); 0.9-1.2 gm-3 (near top); J-W probe appeared to get overwhelmed at one point and failed, but CSIRO/King continued to operate throughout flight. FSSP estimated LWCs were much higher, but require further investigation. FSSP MVD: Mostly18-23 microns Location: Near Springfield and Dayton, Ohio. Secondary icing period of interest: 1840-1920 UTC (first flight of the day) Altitudes: 2000-8200 ft MSL Temperature and LWC: -4 to -10oC; 0.3-0.7 gm-3 FSSP MVD: Possible FSSP problems (frozen over?). Because of this, the discussion will focus on the primary period of interest, which occurred during the second flight on this day. Location: Near Zanesville, Ohio (KZZV) en-route to Springfield, Ohio (KSGH). Synoptic Conditions: Primarily within the warm sector, just ahead of a cold front moving in from the northwest. Thermodynamic structure: Deep, boundary layer rooted instability with strong cap (3-4oC inversion over ~1000 ft) in area of primary icing encounter. Clouds and precipitation: The clouds were stratocumulus in type. The clouds were quite solid around area of the primary icing encounter. Very little precipitation was observed in the area of the primary encounter, with some snow grains, light snow, drizzle and freezing “rain” (ASOS) reported nearby. Very light echoes with some FZDZ signatures were evident on the Wilmington Ohio radar. Visibilities were typically 2-4 statute miles during the event, and ceilings were typically between 600 and 1500 feet AGL. PIREPs: Mostly light and moderate icing was reported around the area. See text PIREPs below. Description of observations made in flight: This was the second of two flights on this day. The first flight was made into another area of icing present to the east, near Zanesville, Ohio at ~1850 UTC. That flight may provide some additional data useful for comparison sake, but instrumentation troubles may be an issue. Flight #2 is the focus of the discussion here. The aircraft ascended through a deep layer of stratocumulus clouds to reach their tops at ~5700ft MSL. LWC of up to 1.2 gm-3 was found at temperatures of
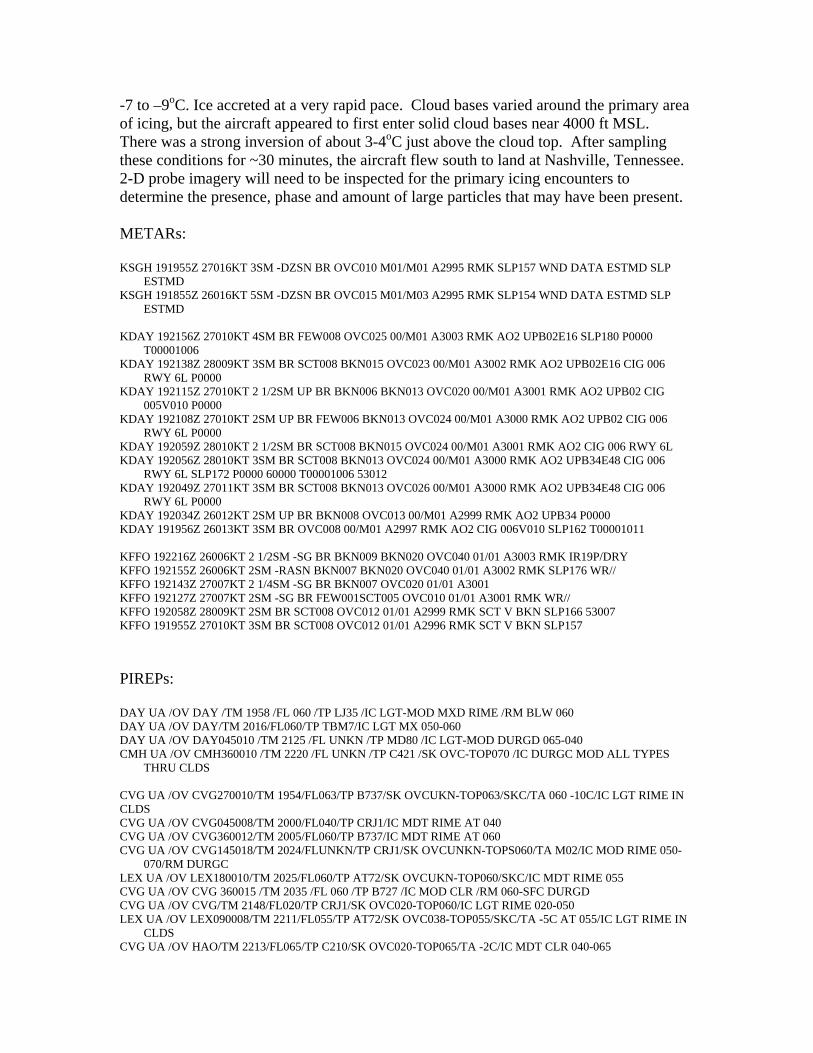
-7 to –9oC. Ice accreted at a very rapid pace. Cloud bases varied around the primary area of icing, but the aircraft appeared to first enter solid cloud bases near 4000 ft MSL. There was a strong inversion of about 3-4oC just above the cloud top. After sampling these conditions for ~30 minutes, the aircraft flew south to land at Nashville, Tennessee. 2-D probe imagery will need to be inspected for the primary icing encounters to determine the presence, phase and amount of large particles that may have been present. METARs: KSGH 191955Z 27016KT 3SM -DZSN BR OVC010 M01/M01 A2995 RMK SLP157 WND DATA ESTMD SLP
ESTMD KSGH 191855Z 26016KT 5SM -DZSN BR OVC015 M01/M03 A2995 RMK SLP154 WND DATA ESTMD SLP
ESTMD KDAY 192156Z 27010KT 4SM BR FEW008 OVC025 00/M01 A3003 RMK AO2 UPB02E16 SLP180 P0000
T00001006 KDAY 192138Z 28009KT 3SM BR SCT008 BKN015 OVC023 00/M01 A3002 RMK AO2 UPB02E16 CIG 006
RWY 6L P0000 KDAY 192115Z 27010KT 2 1/2SM UP BR BKN006 BKN013 OVC020 00/M01 A3001 RMK AO2 UPB02 CIG
005V010 P0000 KDAY 192108Z 27010KT 2SM UP BR FEW006 BKN013 OVC024 00/M01 A3000 RMK AO2 UPB02 CIG 006
RWY 6L P0000 KDAY 192059Z 28010KT 2 1/2SM BR SCT008 BKN015 OVC024 00/M01 A3001 RMK AO2 CIG 006 RWY 6L KDAY 192056Z 28010KT 3SM BR SCT008 BKN013 OVC024 00/M01 A3000 RMK AO2 UPB34E48 CIG 006
RWY 6L SLP172 P0000 60000 T00001006 53012 KDAY 192049Z 27011KT 3SM BR SCT008 BKN013 OVC026 00/M01 A3000 RMK AO2 UPB34E48 CIG 006
RWY 6L P0000 KDAY 192034Z 26012KT 2SM UP BR BKN008 OVC013 00/M01 A2999 RMK AO2 UPB34 P0000 KDAY 191956Z 26013KT 3SM BR OVC008 00/M01 A2997 RMK AO2 CIG 006V010 SLP162 T00001011 KFFO 192216Z 26006KT 2 1/2SM -SG BR BKN009 BKN020 OVC040 01/01 A3003 RMK IR19P/DRY KFFO 192155Z 26006KT 2SM -RASN BKN007 BKN020 OVC040 01/01 A3002 RMK SLP176 WR// KFFO 192143Z 27007KT 2 1/4SM -SG BR BKN007 OVC020 01/01 A3001 KFFO 192127Z 27007KT 2SM -SG BR FEW001SCT005 OVC010 01/01 A3001 RMK WR// KFFO 192058Z 28009KT 2SM BR SCT008 OVC012 01/01 A2999 RMK SCT V BKN SLP166 53007 KFFO 191955Z 27010KT 3SM BR SCT008 OVC012 01/01 A2996 RMK SCT V BKN SLP157 PIREPs: DAY UA /OV DAY /TM 1958 /FL 060 /TP LJ35 /IC LGT-MOD MXD RIME /RM BLW 060 DAY UA /OV DAY/TM 2016/FL060/TP TBM7/IC LGT MX 050-060 DAY UA /OV DAY045010 /TM 2125 /FL UNKN /TP MD80 /IC LGT-MOD DURGD 065-040 CMH UA /OV CMH360010 /TM 2220 /FL UNKN /TP C421 /SK OVC-TOP070 /IC DURGC MOD ALL TYPES
THRU CLDS CVG UA /OV CVG270010/TM 1954/FL063/TP B737/SK OVCUKN-TOP063/SKC/TA 060 -10C/IC LGT RIME IN CLDS CVG UA /OV CVG045008/TM 2000/FL040/TP CRJ1/IC MDT RIME AT 040 CVG UA /OV CVG360012/TM 2005/FL060/TP B737/IC MDT RIME AT 060 CVG UA /OV CVG145018/TM 2024/FLUNKN/TP CRJ1/SK OVCUNKN-TOPS060/TA M02/IC MOD RIME 050-
070/RM DURGC LEX UA /OV LEX180010/TM 2025/FL060/TP AT72/SK OVCUKN-TOP060/SKC/IC MDT RIME 055 CVG UA /OV CVG 360015 /TM 2035 /FL 060 /TP B727 /IC MOD CLR /RM 060-SFC DURGD CVG UA /OV CVG/TM 2148/FL020/TP CRJ1/SK OVC020-TOP060/IC LGT RIME 020-050 LEX UA /OV LEX090008/TM 2211/FL055/TP AT72/SK OVC038-TOP055/SKC/TA -5C AT 055/IC LGT RIME IN
CLDS CVG UA /OV HAO/TM 2213/FL065/TP C210/SK OVC020-TOP065/TA -2C/IC MDT CLR 040-065
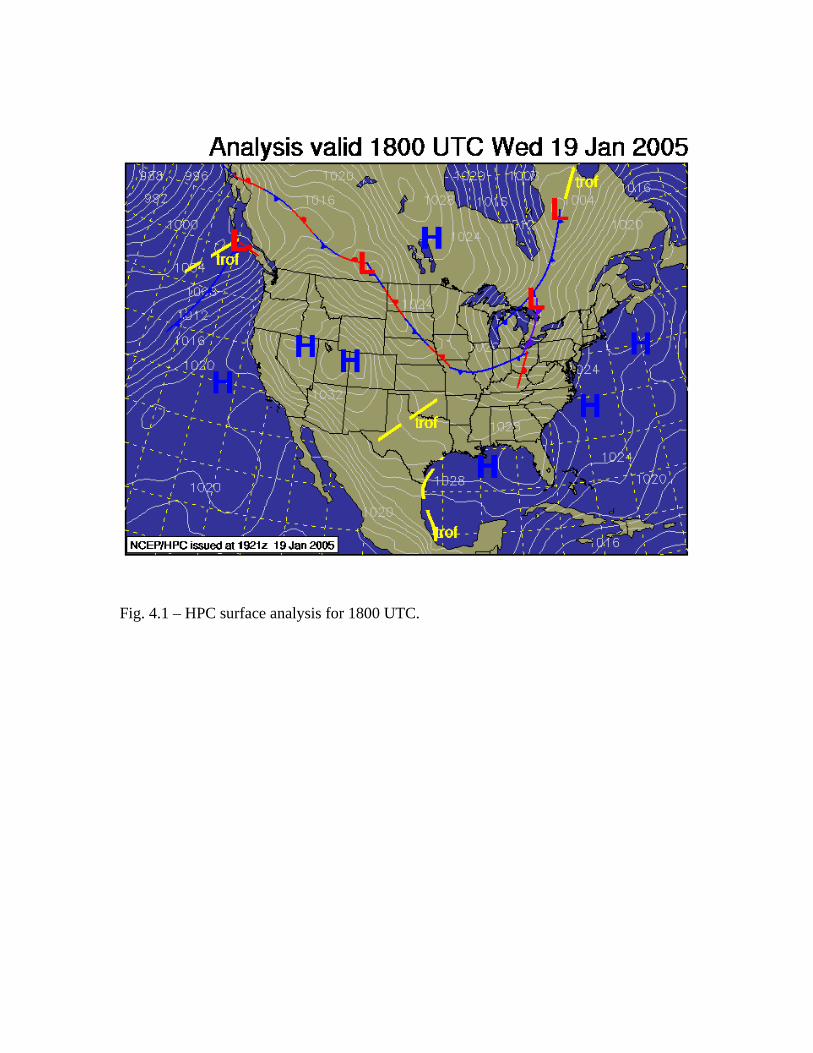
Fig. 4.1 – HPC surface analysis for 1800 UTC.
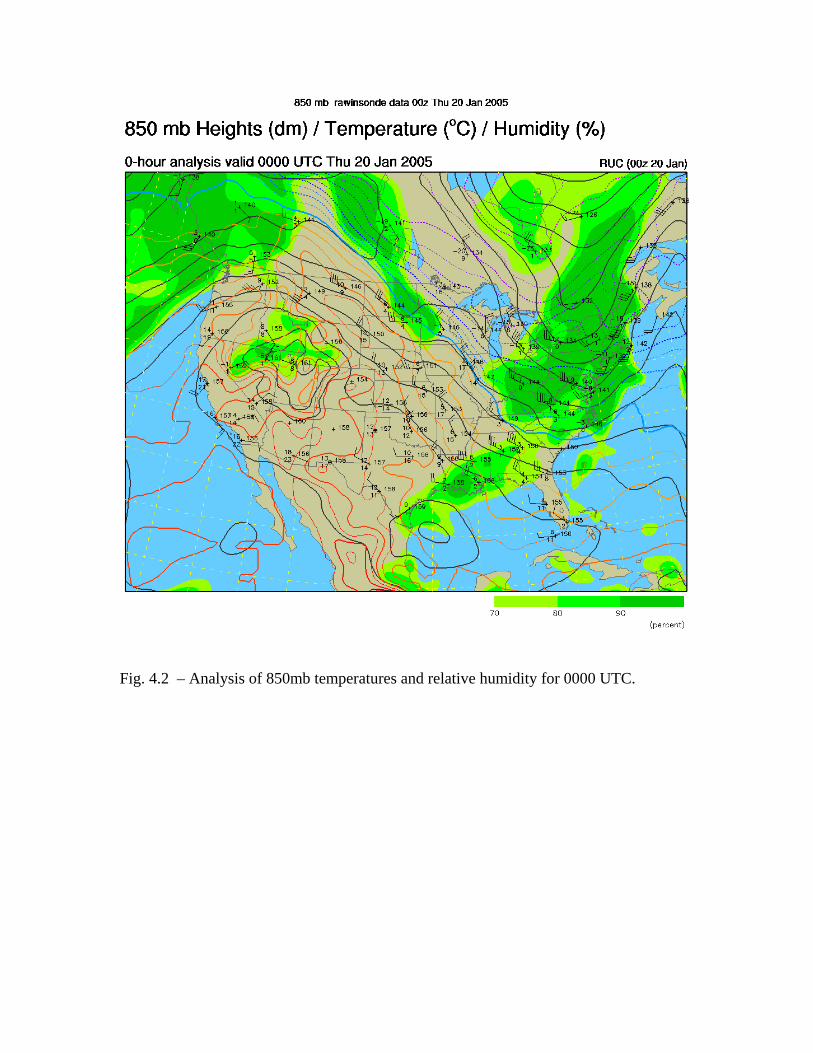
Fig. 4.2 – Analysis of 850mb temperatures and relative humidity for 0000 UTC.
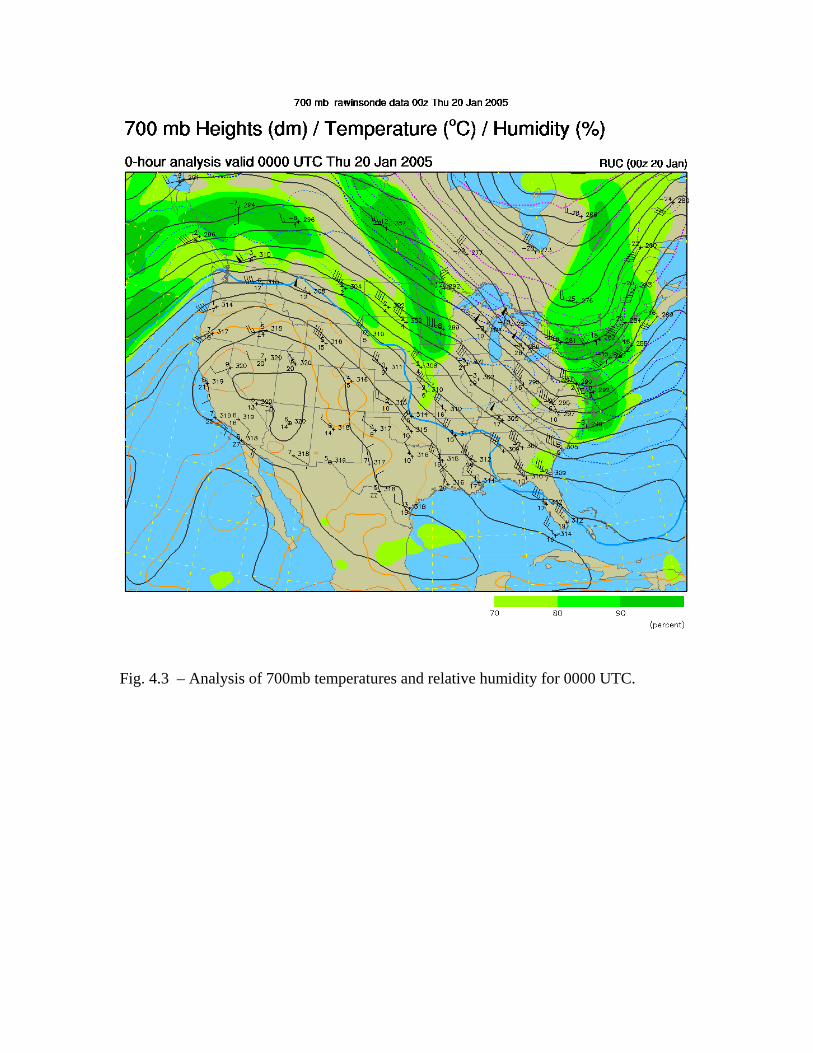
Fig. 4.3 – Analysis of 700mb temperatures and relative humidity for 0000 UTC.

Fig. 4.4 – Sounding from Wilmington, Ohio for 0000 UTC.
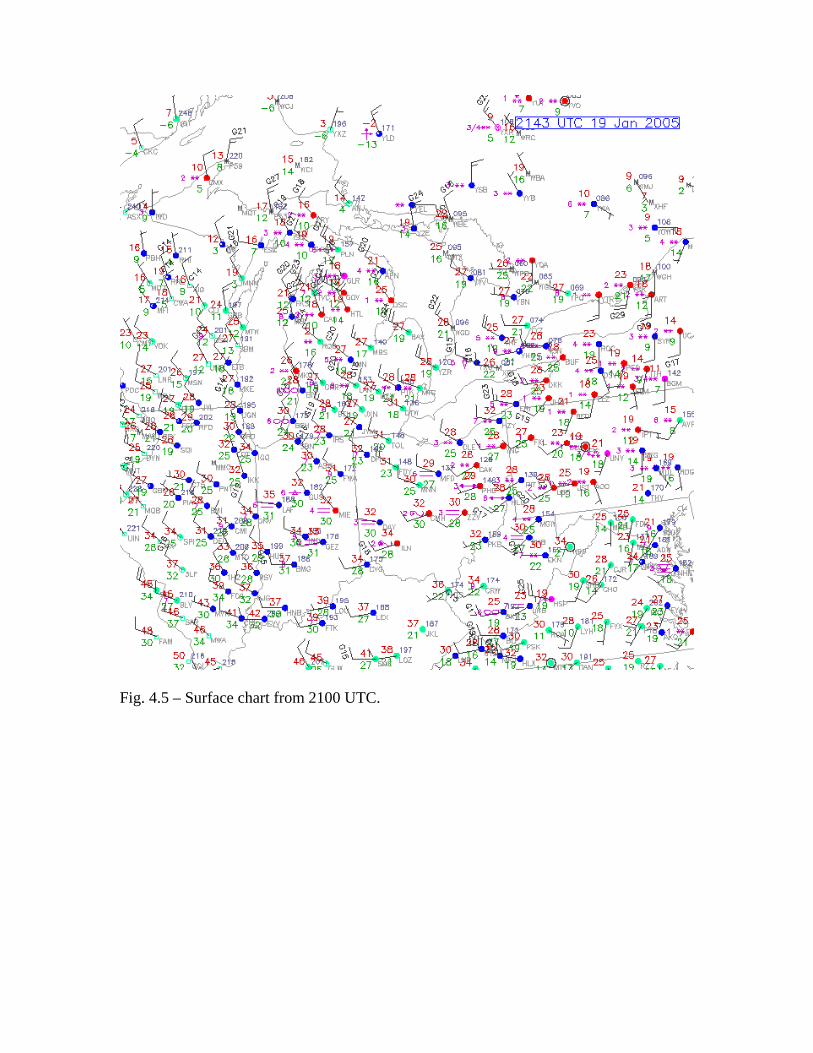
Fig. 4.5 – Surface chart from 2100 UTC.
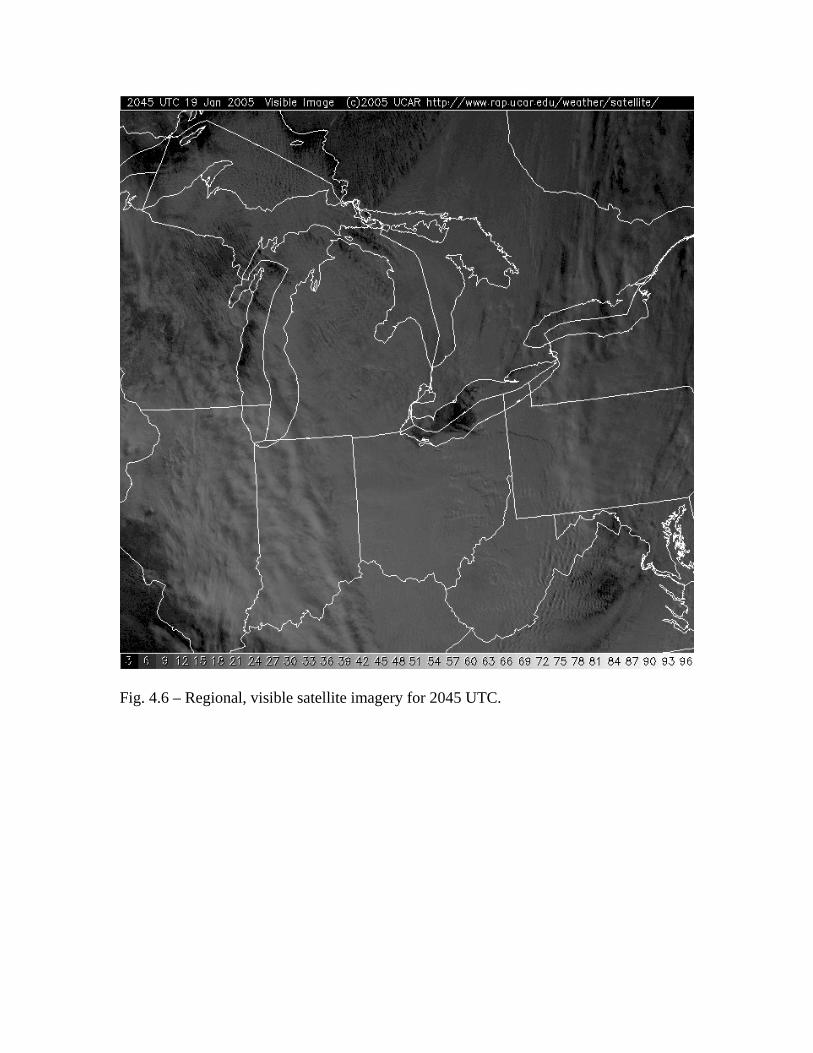
Fig. 4.6 – Regional, visible satellite imagery for 2045 UTC.
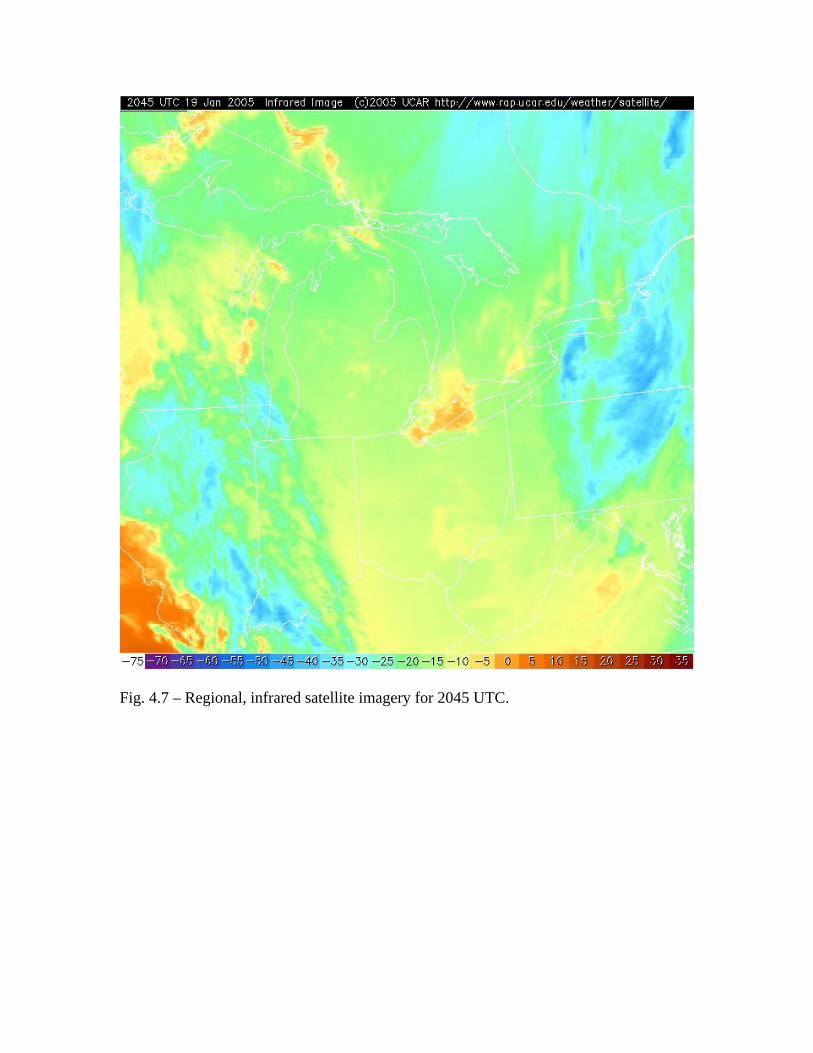
Fig. 4.7 – Regional, infrared satellite imagery for 2045 UTC.
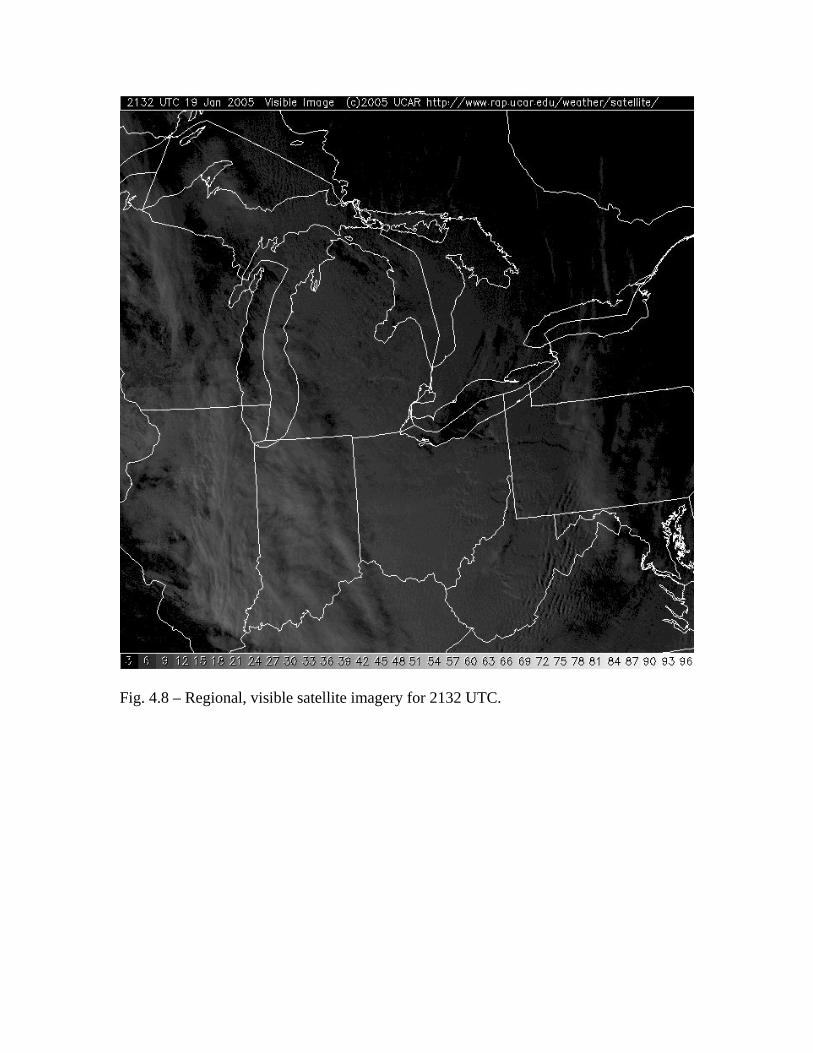
Fig. 4.8 – Regional, visible satellite imagery for 2132 UTC.
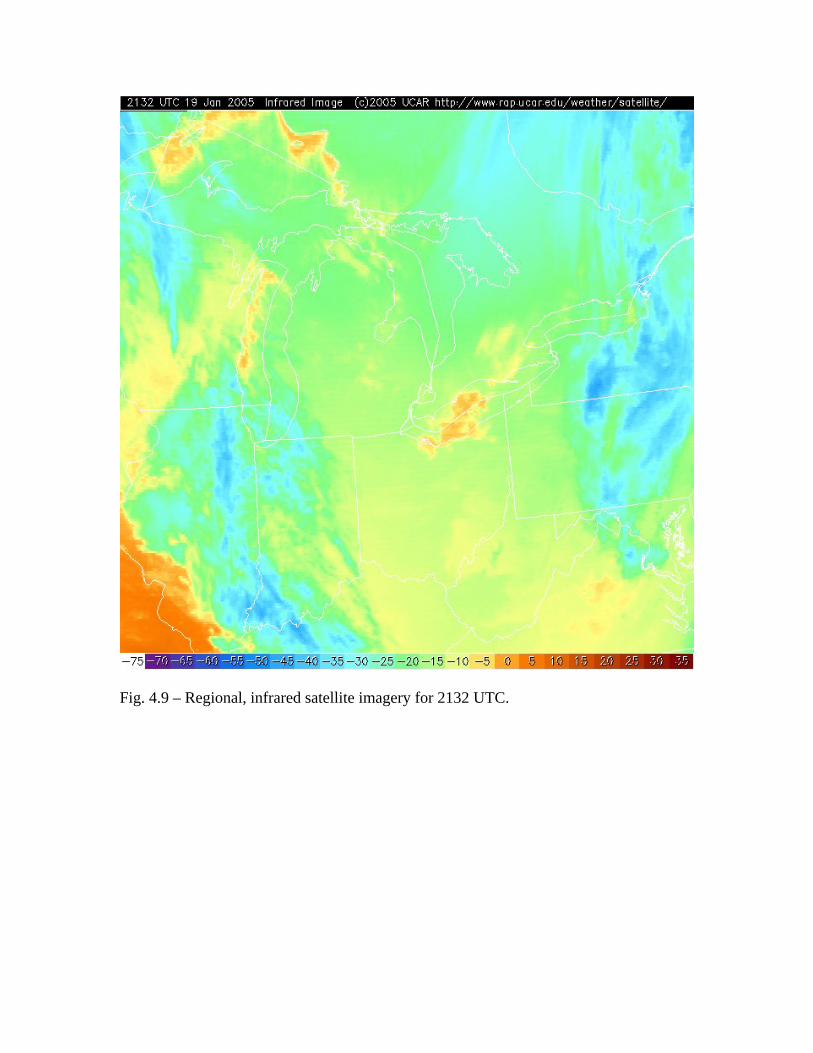
Fig. 4.9 – Regional, infrared satellite imagery for 2132 UTC.
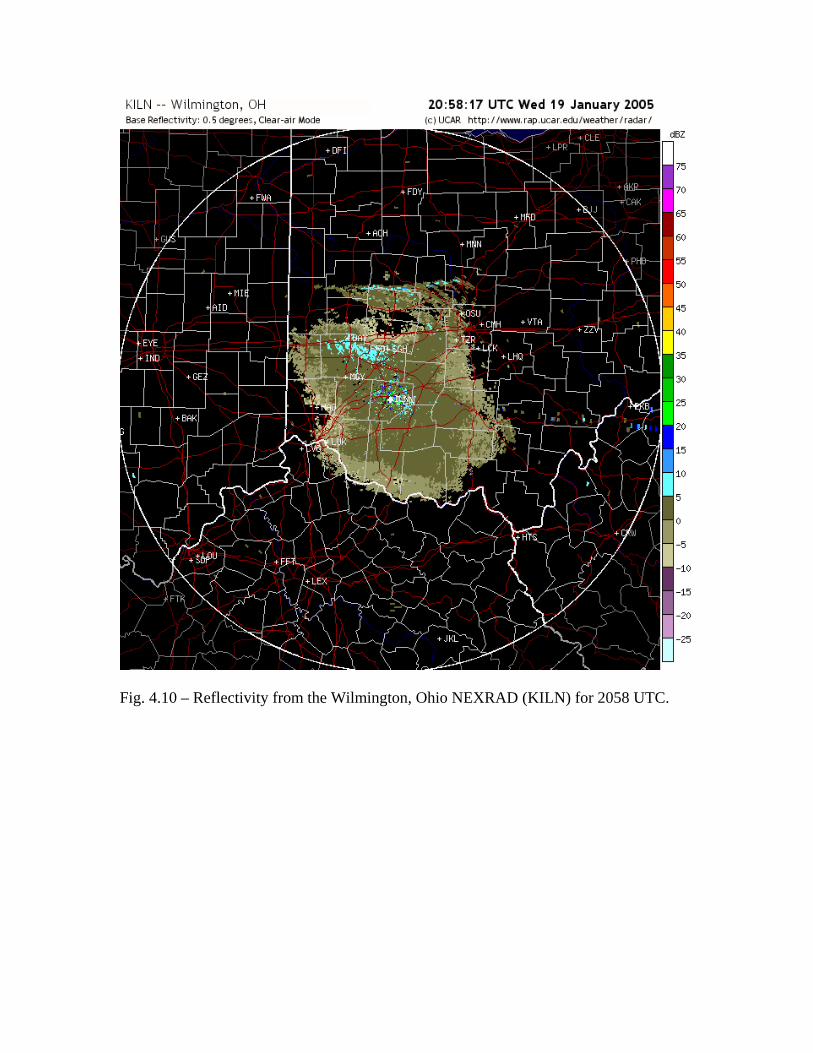
Fig. 4.10 – Reflectivity from the Wilmington, Ohio NEXRAD (KILN) for 2058 UTC.
Two additional primary cases April 12, 2004 featured an unstable boundary layer with mostly clear skies in the morning, but borderline moisture available for stratocumulus to develop with diurnal heating. That's exactly what occurred and LWCs of 0.4-0.7 gm-3 were observed at –15oC at 5500-6500' in the afternoon. The clouds were kind of broken, but it was a nice case of diurnal influence and getting such icing at relatively cool temps. Also, this case occurred over Maine, rather than over the Great Lakes region, proving some variety.
February 16, 2005 featured stratocumulus clouds in the wake of a strong cold front that passed through New York State. Liquid water contents were between 0.2 and 0.6 gm-3, but were somewhat erratic. Temperatures were around –9oC. Strong cold advection continued over the region over the following two days, causing continued instability in a rapidly cooling environment, and resulting cellular stratocumulus clouds with a thin layer of SLW at the top and snow showers beneath. Over the next two days, icing was observed at the top of colder stratocumulus clouds that were producing light-to-moderate snow showers. The LWC was observed at approximately -18oC and -22oC on the second and third day, respectively.
Secondary cases that have potential, but also some issues November 30, 2003 – The NASA Twin Otter flew into two different cloud situations, going from shallow boundary layer clouds at CYKZ (Toronto Buttonville) with small drops to an SLD situation at CYOW (Ottawa). At CYKZ, the layer was 600 feet deep, was dominated by small drops and had LWC=0.12 gm-3, FSSP=300-400 cm-3, MVD=8 microns, and T=-3oC. At CYOW, the layer was 3000 ft deep, was dominated by SLD and had LWC=0.65 gm-3, FSSP=110-160, MVD=22 microns, T=-11oC, and CBT=-6oC (CBT = cloud base temperature). An isothermal layer was present below the cloud base at CYOW, but not at CYKZ. At CYKZ, there was ONE snowflake found in the 2D probe imagery, otherwise it didn't trigger at all (as it shouldn’t in a small-drop situation). All of the FSSP activity over CYKZ was in the smallest 5 bins or so, while at YOW, the SLD were up to 300 microns in size. Synoptically, there was a developing warm front to the southwest.
March 20, 1997 – The NASA Twin Otter flew into a nice, single-layer cloud that was dominated by supercooled liquid water. The layer had temperatures down to -7oC, and contained some in-focus FZDZ. The only question about this case is whether or not it’s a boundary layer stratocumulus situation, because it may have a stable layer below. The 1200 UTC sounding from Detroit had this stable layer, but the sounding may not have been representative of the situation in the location of the flight.
January 24, 2001 – The NASA Twin Otter flew into stratocumulus with LWC up to 0.6 gm-3, FSSP concentrations of 230-250 cm-3, FSSP MVDs of 12 microns, and a temperature of -8oC. This was a 1100 ft deep, single layer cloud with no inversion below, and a 5oC inversion above. The lapse rate was ~5oC/2.4kft. The flight was made over KLPR (Lorain County, Ohio) to the east of a cold front and northwest of a weak trough, possibly within the warm sector, though there was cold air advection. There were lots of small drops, but some drop sizes reached 150 microns. A few crystals were present here
and there, but not many. Cloud base temperature was -3oC and the layer was 1100 ft deep.
February 21, 2002 – The NASA Twin Otter sampled deep stratocumulus clouds with LWC up to 0.8 gm-3, FSSP concentrations of 270-305 cm-3, FSSP MVDs near 19 microns, and cloud top and base temperatures of –9oC and -1oC, respectively. This single cloud layer was 3700 ft deep. It had some SLD up to 75-100 microns in diameter, mixed with a lot of small drops, and some occasional crystals.
January 27, 2004 – The NASA Twin Otter made two flights into stratocumulus clouds around an occluded front. The first flight had LWC of 0.9-1.3 gm-3 near cloud top, with FSSP concentrations of 120-320 cm-3, MVD=21 microns. The conditions were fairly consistent within this 4000 ft deep single layer cloud. Temperatures were near -5oC. The lapse rate was somewhat stable during the initial climb out of Cleveland (1oC/1000ft), where there was cold air advection and lots of SLD. The maximum LWC and the largest drops were observed 500 ft BELOW cloud top, with smaller drops and lower LWC found closer to the tops. During the second flight, the Twin Otter flew to the east to catch up to the west side of some showers along the occluded front. Upon climb out of Cleveland for the 2nd flight, the lapse rate was moist adiabatic, but the stability beneath the aircraft at the site where the high LWC and SLD were observed is unknown. Some ice crystals were noted during the climb out of Cleveland. The LWC had peaks to 0.7 gm-3, but mostly 0.45 gm-3 was observed near the cloud tops at -13oC. There was a nice, steady increase in the LWC from the cloud base (5000 ft) to cloud top (6000 ft). Temperatures increased toward the east as the Twin Otter approached the occluded front near KERI (Erie, PA).
March 6, 2004 – The NASA Twin Otter sampled a post-cold frontal, stratocumulus layer with cloud top temperatures near -4oC. The LWC was greater than 0.3 gm-3 most of the time, and exceeded 0.5 gm-3 for long periods, occasionally peaking at up to 0.7 gm-3. FSSP concentrations were near 300 cm-3. The clouds were dominated by small drops, but there were a few brief periods with SLD up to 300 microns when the LWC peaked. The cloud tops were smooth, and featured a 4oC inversion. The Twin Otter noted MOD CLR icing, with significant horn accretions. There was some noise noted in the 2D probe data before and after the flight. During the flight, the Nevzorov probe froze up due to exposure to high LWC, and the FSSP had a large ice accretion on it. This case featured a significant difference in the SLD production (or lack thereof), which was nicely tied to variability in the LWC.
Other cases with potential for stratocumulus analysis, but which may have some more significant issues: February 19, 1998 (Twin Otter) – The first flight was a mess, but the second flight had an all water deck with DZ and warm FZDZ within and below a cloud deck that extended from 1700 ft to variable tops between 4900 and 6000 ft. Cloud top temperatures were near -1oC. Is this case too warm to be useful? Is this a GOOD thing, for the sake of eliminating ice crystal issues and really getting at small drop versus large drop in an uncontaminated environment? LWC was up to 0.8 gm-3 at 4000 ft at one point. This is well below the 4900-6000 ft cloud top heights that were noted in the text summary for the case. Soundings from KPIT, KDTW and KILN all featured some significant inversions (at 850-875mb at KPIT, 875-900 mb at KDTX, 840-880 mb at KILN with beautiful 00Z/20th stratocumulus look to it and CTT of -3oC). Some patchy radar echoes were around.
February 24, 1998 (Twin Otter) – This was a small-scale event with a N-S oriented band of precipitation, with the best icing on east side and weaker icing on west side. Precipitation and some icing were present within the band. The KPIT sounding hinted at the possibility of stratocumulus. LWC up to 0.4 gm-3 or so with FZDZ was found at -6oC along the leading (east) edge of the band. Waviness in the LWC on order of 0.2 gm-3 was noted, but I’m not sure what to make of it. The initial climb out of KCLE was in an 800 ft deep cloud that had LWC up to 0.3 gm-3at -3oC. This may have only been a local, low altitude stratocumulus layer that’s probably not worth pursuing.
January 22, 1997 (Twin Otter) – A cold front passes by, as does an area of precipitation, then the situation changes to stratocumulus. Though this case has potential, there were no satellite pictures in my archive. If satellite imagery could be recovered for this case, it might prove useful.
March 6, 1997 (Twin Otter) – Things were very unstable behind a cold front. A series of lake effect snow bands were present, with glaciated conditions within the bands and small drop clouds with up to 0.5 gm-3 in between. There was no satellite imagery in my archive.
March 11, 1997 (Twin Otter) – This case had an unstable layer behind another cold front, with precipitation moving out to the southeast. Three flights were made on this day, with the first into an area surrounding precipitation, and the second and third flights made into small drop and borderline FZDZ well behind the area of precipitation. LWCs were typically on the order of 0.3-0.4 gm-3, but occasionally peaked at 0.5 gm-3. Temperatures were between -3 and -6oC. There was very consistent LWC 0.3-0.4 gm-3 in the second flight at 4000ft, -3oC, with cloud tops 500 ft above. There was good cold air advection in this case.
March 14, 1997 (Twin Otter) – A strong cold front was approaching from the west, moving across Indiana. Fairly consistent LWC of 0.3-0.5 gm-3 was observed at -6oC between KTOL (Toledo) and KFWA (Fort Wayne IN) above 3900 ft, with the LWC gradually decreasing toward cloud base at 3900 ft (tops ~4800 ft). The cloud top featured a 5oC inversion. Some brief pockets of out-of-focus, larger drops, bordering on FZDZ sizes were observed at times. Cloud base cooled rapidly to -9oC by the start of the second flight (out of KFWA) with a mix of SN and maybe a little FZDZ on takeoff. Mixed
conditions were observed above with LWC up to 0.2-0.4 gm-3. More SLW-dominated conditions were found to the east, between KDTW (Detroit) and KCLE (Cleveland), with steady 0.2-0.4 gm-3, and a bit of snow at -6 to -11oC.
March 28, 2003 (Certification aircraft #1) – This case was a nice stratocumulus event over Iowa, but the cloud tops were all at T>-7oC, so this resulted in no icing for this jet aircraft. Still, the clouds were dominated by supercooled liquid water. Some instrumentation problems were noted for this case.
March 31, 2003 (Certification aircraft #1) - This case featured stratocumulus off the East Coast. The aircraft could only pop briefly into the tops of these clouds, where they did find supercooled liquid water, but air traffic control wouldn't let them stay in it.
February 12, 2005 (UND Citation) – This was a two-layer situation near KITH (Ithaca, New York). Supercooled liquid water was observed in a decent sized area of warm clouds with large areas of colder, snowy clouds to its east. It may be difficult to capture such features. There was a pretty significant gradient in cloud top temperatures across New York State.
February 15, 2005 (UND Citation) – This was a case of rather unstable, capped upslope clouds located within the warm sector. The clouds were rather warm for icing (-3oC) and were found at low altitudes.
Related Documents