Prefatory Note The attached document represents the most complete and accurate version available based on original copies culled from the files of the FOMC Secretariat at the Board of Governors of the Federal Reserve System. This electronic document was created through a comprehensive digitization process which included identifying the best- preserved paper copies, scanning those copies, 1 and then making the scanned versions text-searchable. 2 Though a stringent quality assurance process was employed, some imperfections may remain. Please note that some material may have been redacted from this document if that material was received on a confidential basis. Redacted material is indicated by occasional gaps in the text or by gray boxes around non-text content. All redacted passages are exempt from disclosure under applicable provisions of the Freedom of Information Act. 1 In some cases, original copies needed to be photocopied before being scanned into electronic format. All scanned images were deskewed (to remove the effects of printer- and scanner-introduced tilting) and lightly cleaned (to remove dark spots caused by staple holes, hole punches, and other blemishes caused after initial printing). 2 A two-step process was used. An advanced optical character recognition computer program (OCR) first created electronic text from the document image. Where the OCR results were inconclusive, staff checked and corrected the text as necessary. Please note that the numbers and text in charts and tables were not reliably recognized by the OCR process and were not checked or corrected by staff. Content last modified 6/05/2009.

Welcome message from author
This document is posted to help you gain knowledge. Please leave a comment to let me know what you think about it! Share it to your friends and learn new things together.
Transcript

Prefatory Note The attached document represents the most complete and accurate version available based on original copies culled from the files of the FOMC Secretariat at the Board of Governors of the Federal Reserve System. This electronic document was created through a comprehensive digitization process which included identifying the best-preserved paper copies, scanning those copies,1
and then making the scanned versions text-searchable.2
Though a stringent quality assurance process was employed, some imperfections may remain. Please note that some material may have been redacted from this document if that material was received on a confidential basis. Redacted material is indicated by occasional gaps in the text or by gray boxes around non-text content. All redacted passages are exempt from disclosure under applicable provisions of the Freedom of Information Act. 1 In some cases, original copies needed to be photocopied before being scanned into electronic format. All scanned images were deskewed (to remove the effects of printer- and scanner-introduced tilting) and lightly cleaned (to remove dark spots caused by staple holes, hole punches, and other blemishes caused after initial printing). 2 A two-step process was used. An advanced optical character recognition computer program (OCR) first created electronic text from the document image. Where the OCR results were inconclusive, staff checked and corrected the text as necessary. Please note that the numbers and text in charts and tables were not reliably recognized by the OCR process and were not checked or corrected by staff.
Content last modified 6/05/2009.
CONFIDENTIAL (FR)
CURRENT ECONOMIC AND FINANCIAL CONDITIONS
By the StaffBoard of Governors
of the Federal Reserve SystemApril 1, 1970
TABLE OF CONTENTS
Page No,Section
SUMMARY AND OUTLOOK I
Outlook for Economic Activity . . . . . . . . . . . .. - 1Outlook for Resource Use and Prices . . . . . . . . . ... . 3Prospective Financial Developments . . . . , ... .. .. - 4Balance of Payments Outlook . . . . . . . . . . . . . . . . - 7
THE ECONOMIC PICTURE IN DETAIL:
Domestic Nonfinancial Scene II-
Gross national product . . . . . . . . . . . . . . . . - 1Industrial production .... . . . . .... . . 8Retail sales . . . . . .. , . . . . . .. - 9Michigan survey of consumer demand . . . . . . . . . . -10Orders and shipments . . . . . . . . . . . . . .. , . . -12Inventories . . . . . . . . . . . . . . . . ....... -13Cyclical indicators . . . . . . . . . . . . . . . . ... -15Construction and real estate . . . . . . . . . . . . -17Labor market . . . . . . . . . . . . . . . . . . . . . . -19Industrial relations ..... . . ... . . . . . . -.23Wholesale prices. .... . . . . . . . .. . . . .. -24Consumer prices. .. . .. . . . . . . . . . . -26Farm production outlook ..... . . . . . . . . ... -.28
Domestic Financial Situation III-
Flow of funds . . . . . . . . . . . . . . . . . . . . . - 1Bank credit . . . . . . . . . . . . . . . . . . . . - 3Monetary aggregates . . .. . . . . . . . . . . . . . - 6Nonbank depositary intermediaries . . . . . . . . . . . - 9Life insurance companies. . , . . , . . . . . . . . . . -11Mortgage market . . . . . . . . . . . . . . . . . . . . -13Corporate and municipal securities markets. . . . . . -16Government securities market. .. . . . . . . . . . . -20Other short-term credit markets . . . . . . . . . . . -24Federal finance . . . . . . . . . . . . . . . . . . . . -26
International Developments IV-
U.S. balance of payments. . . . . . . . . . . . . . .. . - 1Foreign trade . . . . . . . . . . . . . . . .... .... . - 3Foreign exchange markets. . . . . . . . . . . . . . . . - 6Euro-dollar market. ... .. . . . . . . . . . . . . - 8Price developments in major industrial nations. . . . . -10
APPENDIX A
The Changing Composition of Public Bond Offerings . . . . A - 1

I - 1
SUMMARY AND OUTLOOK
Outlook for economic activity
Recent economic information continues to indicate a slowing
of gains in current dollar GNP in the first quarter, and a decline in
real GNP at about a 1.5 per cent annual rate seems likely for that period.
However, consumer expenditures appear to have been somewhat larger and
inventory accumulation much less than previously projected. Such a
change in composition of the GNP increase would imply that the inven-
tory adjustment has been taking place more rapidly than had been
anticipated. While it is unclear how much further the inventory ad-
justment may go, a further sharp slowing in the rate of stock building
now seems less likely than before. This assumes, of course, that final
sales will be sustained at fairly high levels.
With less down-drag from declining inventory investment,
prospects are for a larger increase in current dollar GNP in the second
quarter than earlier anticipated; and we now expect real GNP to show
a small rise. With production better sustained than earlier expected,
more disposable income should be generated, supporting a somewhat
greater rise in consumer spending. Further, in addition to the large
supplements to disposable income earlier incorporated in the projection,
there is now a strong likelihood of a retroactive pay increase in April
for postal workers.

I- 2
Most other aspects of the economic outlook for the very near-
term are not much changed. Business fixed investment is expected to
continue rising. On the other hand, reductions in housing activity are
still expected to dampen gains in overall activity this quarter. In-
creases in State and local government expenditures also seem likely to
remain relatively moderate, while Federal government purchases are
expected to continue to decline in line with projected Budget reductions
in defense expenditures.
Looking to the latter half of the year, we are now projecting
a somewhat faster pick-up in GNP growth than previously expected. The
most important consideration in this revised second half projection is
the assumption we are now making that there will be a pay raise for
Federal civilian and military employees effective July 1. This may
add nearly $3 billion (at an annual rate) to Federal purchases (and
to GNP) in the third quarter, and would also tend to strengthen
consumer spending. In addition, as a result of the recent Commerce-SEC
survey, we are projecting a small further rise in capital spending after
mid-year. Total spending for fixed investment for the year as a whole
is still estimated at 8 per cent above last year, but substantially under the
Commerce-SEC survey findings because of anticipated shortfalls in
current business plans.
As a result of these revisions, GNP in current dollars is
expected to rise at about $17 billion per quarter in the second half
of the year. Real GNP may grow at a 2-1/2 to 3 per cent, annual rate,

I - 3
on average. This would still be below the economy's long-run potential,
and- is consistent with some further updrift in unemployment in the
latter part of the year.
Outlook for resource use and prices
Despite some strengthening in the economic outlook, a further
easing is in prospect in the rate of utilization of manpower and in-
dustrial resources. Industrial production is estimated to have been
down further in the first quarter, and the utilization rate in manu-
facturing was appreciably lower. Industrial production is now pro-
jected to change relatively little in the course of the second quarter
and to advance moderately in the second half of the year, but the
utilization rate in manufacturing is expected to level out after mid-
year a little below 80 per cent of capacity.
State insured unemployment and new unemployment claims have
risen much more slowly in recent weeks than earlier but with the labor
force continuing to grow, we continue to expect a further increase in
the unemployment rate in the months ahead. The rise is now expected
to be a little less than in our previous projection since we are now
envisaging more of an increase in total nonfarm employment. Wage
settlements are still expected to be sizable, with, as we have noted
in recent greenbooks, many more workers covered by expiring major
contracts this year than last.

I-4
We continue to project some moderation of price pressures
over the remainder of the year. (However, the anticipated Federal pay
increase would have its impact on the GNP deflator in the third quarter
of 1970 rather than in the first quarter of next year.) The increase
in wholesale prices of industrial commodities from January to March
was smaller and advances were less widespread than earlier. In the
strategic metals sector, demand and supply of nonferrous metals
now appear in better balance. But prices of producers' equipment
have continued to increase fairly rapidly. We expect a slowing of the
rise in consumer prices from the 6 per cent of the past year. Critical
to this expectation is the fact that prospective food supplies suggest
food prices may level off over the months ahead, in contrast to the
8 per cent increase of the past year.
Prospective financial developments
Recent evidence suggests that a recovery of time deposit
flows to banks is now underway, at a time when business demands for
bank funds are showing some signs of weakeneing. The pick-up of de-
posit flows began in consumer-type accounts shortly after rate ceilings
were raised in late January, but the subsequent sharp decline of short-
term market rates has provided further impetus to this change and has
generated some renewed growth of large CD's as well. Given the
present course of policy and the expected net repayment of nearly $9
billion of Federal debt in the April-June period, short-term rates are
likely to decline further on balance over the second quarter. To the
I-5
extent that short-term rates do show further declines, large CD's at
banks can be expected to expand further, and other time and savings
deposits should continue to rise, although a sizable part of this
expected deposit expansion may be used to reduce bank reliance on
high cost funds borrowed from commercial paper and Euro-dollar markets.
Bankers generally report that business interest in bank
loans is being fairly well maintained, but estimates for all banks for
March show a decline in such lending, even after allowance for loans
sold. While to some extent this change may reflect loan repayments
from recent heavy business borrowing in capital markets, the weaker
demands probably also reflect the further general slowing of economic
activity, in particular the considerably slower growth of inventories.
During the second quarter, these influences are likely to
continue to have a moderating effect on business demands for bank credit.
With growth of deposit funds at the same time tending to expand, the
outlook is thus for some further lifting of pressures on bank posi-
tions. This should lead to some rebuilding of bank liquidity positions
and to a gradual relaxation of lending policies, as may have been
presaged by the recent reduction in the prime rate.
Capital markets. Banks have already shown renewed interest
in acquiring municipal securities. But to date this interest has
centered chiefly in relatively short maturities, with acquisitions
of longer term issues reportedly confined mainly to speculative
positions of dealer banks. While dealer inventory building and the

I-6
beginning of bank acquisitions have already contributed to large
municipal yield declines, this has not led to any significant step-up
in the volume of new offerings. Nevertheless, in view of the heavy
backlog of municipal financing needs that went unsatisfied last year,
any pronounced further increase in bank acquisitions could encourage
expanded offerings and tend to limit the extent of future yield declines.
In the corporate bond market a heavy volume of new issues is
already scheduled for offering in April. Although the May calendar is
also large, this is due mainly to the $1.6 billion AT&T offering. In
late April, the Treasury will announce a refunding of issues maturing
in mid-May, about $5 billion of which are held by the public. If
market conditions warrant, this operation could also include a pre-
refunding of other near-dated Treasury maturities. Thus, during the
second quarter, as in March, large security offerings will be working
towards inhibiting interest rate declines in intermediate- and long-
term sectors of the market.
Mortgage markets. While there has been some improvement in
savings inflows to nonbank thrift institutions, the strenghtening has
thus far been modest at best and could continue to be limited by the
attraction of new corporate security issues--particularly the AT&T
offering which is expressly designed to appeal to small investors.
Despite the recent FHLB attempts to discourage repayments of S&L advances,
a significant share of new inflows could be directed to repayment of
I - 7
borrowing. As yet there has been no evidence of a pick-up in new
mortgage commitments. However, a relatively favorable experience in
the current reinvestment period could provide thrift institutions with
some reassurance as to future deposit inflows and thus lead to a
revival of mortgage commitment activity.
Balance of payments outlook
Developments abroad in recent months strongly support the
view that 1970 will be a relatively good year for the current account
of the U.S. balance of payments and a relatively poor year for the
capital account, including Euro-dollar flows. U.S. exports in January-
February were better than we anticipated a month ago and fully up to
earlier expectations. Repayments of Euro-dollar borrowings by U.S.
banks have continued.
One of the most striking features of recent developments
abroad has been the widespread acceleration of wage increases,
accompanied in some countries--though not all--by steeper advances
in wholesale and consumer price averages than had occurred for several
years. The overall strength of aggregate demand in Europe and Japan,
still being fed by unsatisfied demands for capital equipment to
enlarge capacity and cut labor costs, is being supported increasingly
by the rapid growth in money income.
Another notable feature of the recent scene is the general
absence of downward movements in interest rates in European national
I-8
markets during the past two months of declinesin U.S. and Euro-dollar
rates. On the continent, rates have risen in Germany, Italy, and some
other countries. After the half-point cut in the Bank of England's
rate about four weeks ago, sterling money market rates in London are
now below their 1969 peaks on an uncovered basis but are at all-time
highs after deducting the cost (now greatly reduced) of cover back
into dollars. Canadian rates have declined a little--but considerably
less than ours.
The shift toward deficit this year in the U.S. balance of
payments measured by official settlements, which is of course associated
with the changes occurring in interest rate relationships, has not
generated unwanted foreign official reserve holdings of dollars up to
now, nor has it given rise to concern in foreign exchange markets.
Major reasons for these results are the concentration of recent foreign
gains of net reserves in Britain and the attrition during 1968 and 1969
of official reserve holdings of dollars in other major countries.
March 31, 1970
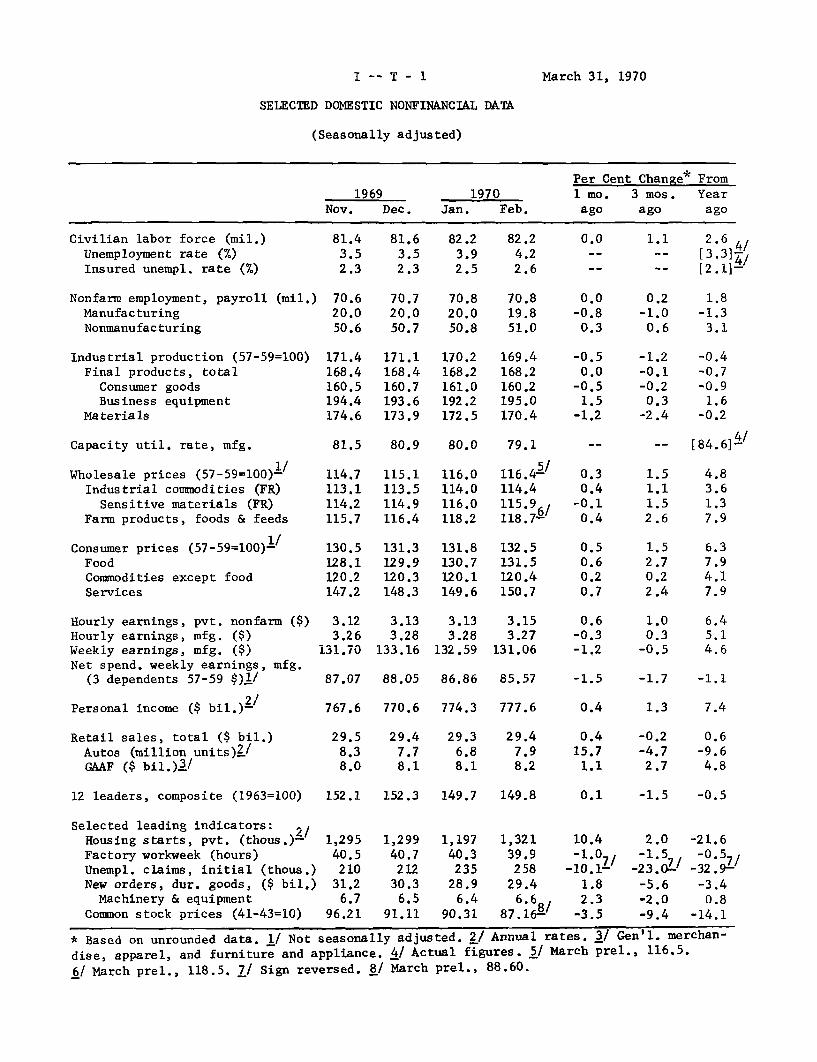
SELECTED DOMESTIC NONFINANCIAL DATA
(Seasonally adjusted)
Per Cent Change* From
1969 1970 1 mo. 3 mos. Year
Nov. Dec. Jan. Feb. ago ago ago
Civilian labor force (mil.)Unemployment rate (%)
Insured unempl. rate (%)
Nonfarm employment, payroll (mil.)
Manufacturing
Nonmanufacturing
Industrial production (57-59=100)
Final products, total
Consumer goods
Business equipment
Materials
Capacity util. rate, mfg.
Wholesale prices (57-59=100)L/
Industrial commodities (FR)
Sensitive materials (FR)
Farm products, foods & feeds
Consumer prices (57-59=100)-
FoodCommodities except food
Services
Hourly earnings, pvt. nonfarm ($)Hourly earnings, mfg. ($)Weekly earnings, mfg. ($)Net spend, weekly earnings, mfg.
(3 dependents 57-59 $)!/
2/Personal income ($ bil.)-
Retail sales, total ($ bil.)Autos (million units)2/GAAF ($ bil.)2/
81.43.52.3
70.620.050.6
171.4168.4160.5194.4174.6
81.63.52.3
70.720.050.7
171.1168.4160.7193.6173.9
82.23.92.5
70.820.050.8
170.2168.2161.0192.2172.5
82.24.22.6
70.819.851.0
169.4168.2160.2195.0170.4
81.5 80.9 80.0 79.1
114.7113.1114.2115.7
130.5128.1120.2147.2
3.123.26
131.70
115.1113.5114.9116.4
131.3129.9120.3148.3
3.133.28
133.16
116.0114.0116.0118.2
131.8130.7120.1149.6
3.133.28
132.59
116.45/114.4115.9118.7--'
132.5131.5120.4150.7
3.153.27
131.06
87.07 88.05 86.86 85.57
767.6 770.6 774.3 777.6
29.58.38.0
29.47.78.1
29.36.88.1
29.47.98.2
0.0
0.0-0.8
0.3
-0.50.0
-0.51.5-1.2
1.1 2.6•-4/
-- [3.3]--- [2.1]-
0.2-1.0
0.6
-1.2-0.1-0.2
0.3-2.4
1.8-1.33.1
-0.4-0.7-0.91.6-0.2
-- -- [84.6]
0.30.4-0.10.4
0.6-0.3-1,2
1.52.70.22.4
1.00.3
-0.5
-1.5 -1.7 -1.1
1.3 7.4
0.415.7
1.1
-0.2-4.72.7
0.6-9.6
4.8
12 leaders, composite (1963=100) 152.1 152.3 149.7 149.8 0.1 -1.5 -0.5
Selected leading indicators: 2/Housing starts, pvt. (thous.)-Factory workweek (hours)Unempl. claims, initial (thous.)New orders, dur. goods, ($ bil.)Machinery & equipment
Common stock prices (41-43=10)
1,29540.5210
31.26.7
96.21
1,29940.7212
30.36.5
91.11
1,19740.3235
28.96.4
90.31
1,32139.9258
29.46.6
87.16 /-
10.4-1.07
-10.1-1.82.3
-3.5
2.0-1.5
-23.0'--5.6-2.0-9.4
* Based on unrounded data. 1/ Not seasonally adjusted. 2/ Annual rates. 3/ Gen'l. merchan-
dise, apparel, and furniture and appliance. 4/ Actual figures. 5/ March prel., 116.5.
6/ March prel., 118.5. 7/ Sign reversed. 8/ March prel., 88.60.
-21.6-0.5 /
-32.9--3.40.8
-14.1
I -- T - 1
I -- T - 2
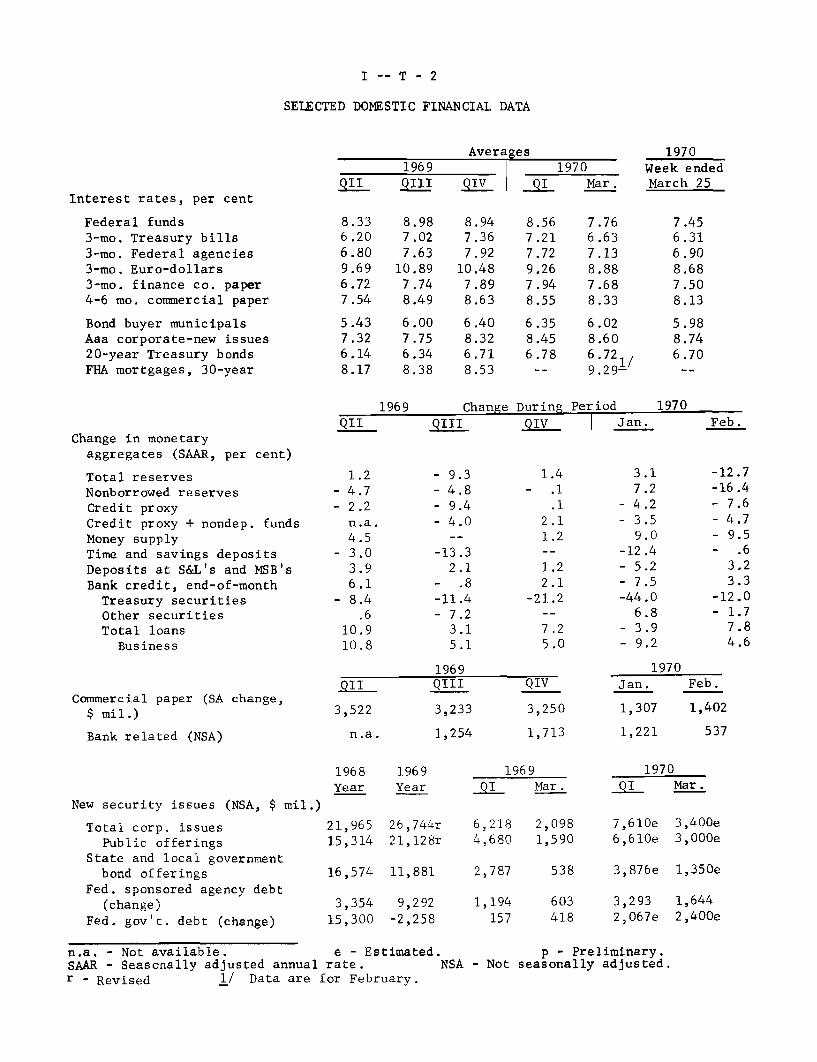
SELECTED DOMESTIC FINANCIAL DATA
Averages1969 1970
QII QIII QIV QI Mar.Interest rates, per cent
Federal funds3-mo. Treasury bills3-mo. Federal agencies3-mo. Euro-dollars3-mo. finance co. paper4-6 mo. commercial paper
Bond buyer municipalsAaa corporate-new issues20-year Treasury bondsFHA mortgages, 30-year
8.336.206.809.696.727.54
5.437.326.148.17
8.987.027.63
10.897.748.49
6.007.756.348.38
8.947.367.92
10.487.898.63
6.408.326.718.53
8.567.217.729.267.948.55
6.358.456.78
7.766.637.138.887.688.33
6.028.606.729.29-
1970Week endedMarch 25
7.456.316.908.687.508.13
5.988.746.70
1969
Change in monetary
aggregates (SAAR, per cent)
Total reservesNonborrowed reservesCredit proxyCredit proxy + nondep. fundsMoney supplyTime and savings depositsDeposits at S&L's and MSB'sBank credit, end-of-monthTreasury securitiesOther securitiesTotal loans
Business
Commercial paper (SA change,$ mil.)
Bank related (NSA)
QII]QII
1.2- 4.7- 2.2n.a.4.5
- 3.03.96.1
- 8.4.6
10.910.8
QI1
3,522
n.a.
1968 1969Year Year
New security issues (NSA, $ mil.)
Total corp. issuesPublic offerings
State and local governmentbond offerings
Fed. sponsored agency debt(change)
Fed. gov't. debt (change)
Change During Period
S QIV I Jan.
- 9.3- 4.8- 9.4- 4.0
-13.32.1
- .8
-11.4- 7.2
3.15.1
1969QIII
3,233
1,254
1.4- .1
.12.11.2
1.22.1
-21.2
7.25.0
QIV
3,250
1,713
1969QI Mar.
21,965 26,744r 6,218 2,098
15,314 21,128r 4,680 1,590
16,574 11,881
3,354 9,29215,300 -2,258
2,787
1,194157
538
603418
3.17.2
- 4.2- 3.5
9.0-12.4- 5.2- 7.5-44.0
6.8- 3.9- 9.2
1970Feb.
-12.7-16.4- 7.6- 4.7- 9.5- .6
3.23.3
-12.0- 1.7
7.84.6
n.a. - Not available, e - Estimated. p - Preliminary.SAAR - Seasonally adjusted annual rate. NSA - Not seasonally adjusted.r - Revised 1/ Data are for February.
1970Jan. Feb.
1,307 1,402
1,221 537
1970QI Mar.
7,610e 3,400e6,610e 3,000e
3,876e 1,350e
3,293 1,6442,067e 2,400e
I -- T - 3
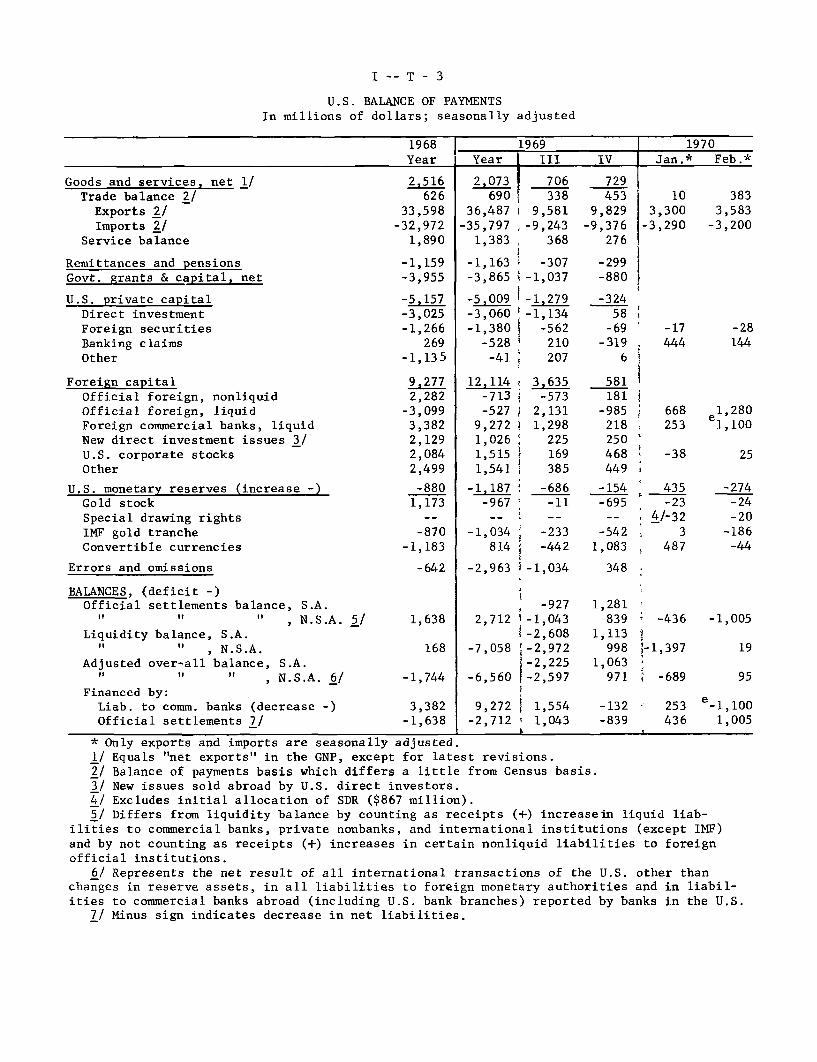
U.S. BALANCE OF PAYMENTSIn millions of dollars; seasonally adjusted
1968 1969Year Year III
Goods and services, net 1/
Trade balance 2/
Exports 2/
Imports 2/
Service balance
Remittances and pensions
Govt. grants & capital, net
U.S. private capital
Direct investment
Foreign securities
Banking claims
Other
Foreign capital
Official foreign, nonliquid
Official foreign, liquid
Foreign commercial banks, liquid
New direct investment issues 3/
U.S. corporate stocks
Other
U.S. monetary reserves (increase -)
Gold stock
Special drawing rights
IMF gold tranche
Convertible currencies
Errors and omissions
BALANCES, (deficit -)Official settlements balance, S.A.
" " " , N.S.A. 5/Liquidity balance, S.A.
" " , N.S.A.
Adjusted over-all balance, S.A." " " , N.S.A. 6/
Financed by:
Liab. to comm. banks (decrease -)
Official settlements 7/
2 516626
33,598
-32,972
1,890
-1,159
-3,955
-5 157-3,025
-1,266
269
-1,135
92772,282
-3,099
3,3822,129
2,084
2,499
-880
1,173
-870
-1,183
-642
1,638
168
-1,744
3,382-1,638
1970Jan.* Feb.*
383
3,583-3,200
-28144
2 073 706
690 33836,487 I 9,58135,797 -9,2431,383 368
-1,163 -307
-3,865 -1,037
-5.009 1-1,279-3,060 -1,134
-1,380 -562
-528 210
-41 207
12 114 i 3,635-713 -573-527 2,131
9,272 i 1,298
1,026 225
1,515 169
1,541 385
-1,187 -686-967 -11
-1,034 -233
814 -442
-2,963 i-1,034
-9272,712 -1,043
1-2,608-7,058 -2,972
-2,225-6,560 -2,597
9,272 1,554-2,712 1,043
IV
729
453
9,829
-9,376276
-299
-880
-324
58
-69-319
6
581181
-985
218
250
468
449
-154
-695
-542
1,083
348
1,281
839
1,113998
1,063
971
-132 253 e-1,100-839 436 1,005
* Only exports and imports are seasonally adjusted.
1/ Equals "net exports" in the GNP, except for latest revisions.
2/ Balance of payments basis which differs a little from Census basis.
3/ New issues sold abroad by U.S. direct investors.
4/ Excludes initial allocation of SDR ($867 million).
5/ Differs from liquidity balance by counting as receipts (+) increasein liquid liab-
ilities to commercial banks, private nonbanks, and international institutions (except IMF)
and by not counting as receipts (+) increases in certain nonliquid liabilities to foreign
official institutions.
6/ Represents the net result of all international transactions of the U.S. other thanchanges in reserve assets, in all liabilities to foreign monetary authorities and in liabil-
ities to commercial banks abroad (including U.S. bank branches) reported by banks in the U.S.7/ Minus sign indicates decrease in net liabilities.
103,300
-3, 2 9 0
-17444
668253
-38
435-23
4/-32
3
487
-436
-1,397
-689
25
-274-24-20
-186
-44
-1,005
19
1,2801,100

II - 1
THE ECONOMIC PICTURE IN DETAIL
Domestic Nonfinancial Scene
Gross national product. Economic activity continued to
slacken in the first quarter. We currently estimate that GNP rose
only about $6-1/2 billion in current dollars, and in real terms
declined 1.5 per cent, about as we have recently been projecting.
However, the composition of the GNP change appears to have been signif-
icantly different--growth of final sales was somewhat less than had
been anticipated, while inventory investment declined much more
sharply.
Federal purchases and residential construction are likely to
continue to weaken in the second quarter. But consumer demand is
expected to show greater strength--reflecting the large growth antici-
pated in personal income--and total final sales are expected to rise
slightly more than in the first quarter. Moreover, with recent
indications that substantial inventory adjustments already had occurred
in the past several months, we are now projecting only a slight further
decline in the rate of accumulation. As a result, GNP is now expected
to increase by about $11-1/2 billion in the second quarter. In real
terms GNP would show a slight increase instead of continuing to decline
slightly, as had earlier seemed likely.

II - 2
PROJECTED CHANGES IN GNP AND RELATED ITEMS, 1970February Chart Show and Current Projection
First QuarterChart
CurrentShow rojPro Proj.
Second QuarterChart Cha CurrentShowPro. Proj.Proi.
GNP ($ billion) 6.9 6.5 9.0 11.6
Final sales ($ billion) 9.2 11.0 11.5 12.3Personal consumption ($ billion) 7.9 9.4 11.5 11.7
Inventory change ($ billion) -2.3 -4.5 -2.5 - .7
Real GNP (per cent) -1.3 -1.5 - .2 .8
GNP deflator (per cent) 4.2 4.2 4.0 4.0
The larger than anticipated growth in consumer expenditures
in the first quarter reflected less weakness in durable goods outlays
than had appeared likely earlier, particularly for cars. However, the
estimated rise in total consumer purchases was no larger than in the
fourth quarter. Outlays for residential construction continued to
decline last quarter, but here also the weakness was a little less than
we had been projecting, in part because of a surprising jump in starts
in February. Private housing starts are now estimated to average about
1.2 million units for the quarter, about 100,000 more than we had pro-
jected a month ago. The fourth quarter average was 1.33 million.
Moreover, average construction costs per unit built apparently have
been rising somewhat faster than expected.
Among other elements of final demand, Federal defense
purchases in the first quarter are estimated to have declined about as
expected, and growth of State and local spending apparently continued

II - 3
to be limited by high interest rates and generally tight credit
conditions. Business capital spending, however, apparently continued
to increase. The recent (February) Commerce-SEC plant and equipment
survey projected an upward revision in spending plans to an increase
of 10-1/2 per cent for 1970 as a whole. But the new survey also indi-
cated a more modest rate of growth in the first half of this year than
indicated by the preceding survey, and an acceleration of spending in
the second half. Based on these survey results, and available produc-
tion and shipments data, we have cut back the estimated first quarter
increase in business fixed investment by about $1 billion.
While final sales apparently rose only a little less in the
first quarter than in the fourth, the rate of inventory investment is
estimated to have been cut sharply. The book value of business inven-
tories dropped by almost $7 billion in January. Most of the decline
occurred in trade, mainly in durables at retail, and particularly in
autos, but manufacturing inventories also rose considerably less than
in other recent months. But it seems unlikely that total business
inventories continued to decline for the first quarter as a whole.
Indeed, the book value of manufacturing inventories rose sharply in
February.
Our projections assume that there will be no further sharp
reductions in the rate of inventory accumulation and that growth in real
GNP will probably resume in the second quarter. Although some further
easing is likely in employment and, possibly, hours of work, personal
income is expected to show a rise of $17 billion in the second quarter

II - 4
with more than two-fifths of this increase reflecting increased Social
Security benefits. Also, there is now the likelihood of a retroactive
pay raise for postal workers in April, which we have assumed would be
about 6 per cent and total about $400 million, annual rate.
With disposable income growth larger, consumption also is
expected to rise somewhat more rapidly than in the first quarter. For
the remaining categories of GNP spending, our second quarter projections
have not been changed materially.
A major change in our expectations for the third quarter is
the addition of a midyear pay raise for all Federal classified employees
plus the military. Our changed assumption recognizes pressures arising
from the postal strike and the probability that Congress will now pass
a pay bill for all employees. A pay raise of about 6 per cent would
add directly nearly $3 billion annual rate to Federal purchases and to
GNP in the third quarter, and--along with the elimination of the
surcharge--would lend considerable support to consumer goods sales.
Also, we still expect residential construction activity and State and
local government spending to begin responding to easier monetary and
credit policies in the second half of 1970. On the other hand, we con-
tinue to anticipate that Federal outlays for defense, exclusive of the
assumed pay increase, will decline for the remainder of the year in
line with Budget estimates.
As a result of the recent Commerce-SEC survey, we now are
projecting increases in capital spending through the remainder of the
year. The acceleration in spending implied by the surveyseems to us

CONFIDENTIAL - FR
GROSS NATIONAL PRODUCT AND RELATED ITEMS(Quarterly figures are seasonally adjusted. Expenditures and income
figures are billions of dollars, with quarterly figures at annual rates.)
1969 19701970 Projected
1968 1969 Proj. II III IV I II* III* IV
Gross National ProductFinal sales
PrivateExcluding net exports
Personal consumption expendituresDurable goodsNondurable goodsServices
Gross private domestic investmentResidential constructionBusiness fixed investmentChange in business inventories
Nonfarm
Net exports of goods and services
Gov't. purchases of goods & servicesFederal
DefenseOther
State & local
Gross national product inconstant (1958) dollars
GNP implicit deflator (1958 = 100)
Personal incomeWages and salaries
Disposable incomePersonal saving
Saving rate (per cent)
Corporate profits before tax
Federal government receipts andexpenditures (N.I.A. basis)
ReceiptsExpendituresSurplus or deficit (-)
Total labor force (millions)Armed forcesCivilian labor forceUnemployment rate (per cent)
Nonfarm payroll employment (millions)Manufacturing
Industrial production (1957-59=100)Capacity utilization, manufacturing
(per cent)
Housing starts, private (millions A.R.)
Sales new domestic autos (millions,A.R.)
865.7858.4658.1655.6
536.683.3
230.6222.8
126.330.288.8
7.37.4
932.1924.1709.5707.4
576.089.8
243.6242.6
139.432.299.2
8.07.8
980.2977.1755.4751.7
616.091.5
260.7263.8
138.728.7
106.93.13.0
924.8917.9705.0703.4
572.890.6
242.1240.1
137.432.797.8
6.96.7
942.8932.0715.0712.3
579.889.8
245.1244.9
143.331.4
101.110.710.3
952.2944.5726.2723.5
589.590.4
248.7250.3
141.831.6
102.57.77.4
958.7955.5737.2733.2
598.990.0
253.3255.6
137.530.2
104.13.23.0
970.3967.8748.7744.4
610.691.0
258.5261.1
136.327.3
106.52.52.5
987.1984.1760.5757.6
622.392.0
263.7266.6
138.327.3
108.03.03.0
1004.61001.1
775.1771.5
632.393.0
267.3272.0
142.630.1
109.03.53.5
2.5 2.1 3.7 1.6 2.7 2.7 4.0 4.3 2.9 3.6
200.399.578.021.5
100.7
214.6101.9
79.222.7
112.7
221.898.875.223.7
122.9
212.9100.6
78.522.1
112.3
217.0103.280.322.9
113.8
218.3102.3
79.223.1
116.0
218.3100.1
77.222.9
118.2
219.198.175.023.1
121.0
223.699.175.024.1
124.5
226.098.073,524.5
128.0
707.6 727.5 731.6 726.7 730.6 729.8 727.1 728.6 732.2 738.5122.3 128.1 134.0 127.3 129.0 130.5 131.9 133.2 134.8 136.0
687.9
465.0
590.0
38.4
6.5
747.2509.9629.7
37.66.0
798.8544.6679.7
46.96.9
740.5504.3622.0
33.35.3
756.5516.9639.0
43.16.7
767.4525.0647.5
41.76.4
777.5531.5659.5
44.16.7
794.4538.1674.046.76.9
805.9549.7688.1
49.07.1
817.4559.0697.0
47.66.8
91.1 93.8 85.6 95.4 92.5 91.6 86.0 85.0 85.0 86.5
176.3181.5-5.2
201.5 197.6 202.8 201.3 203.3 196.7 198.7 195.8 199.0192.0 203.6 189.3 193.6 196.7 198.4 205.8 205.0 205.1
9.5 -6.0 13.5 7.7 6.7 -1.7 -7.1 -9.2 -6.1
82.3 84.2 85.9 83.9 84.6 85.0 85.6 85.7 85.9 86.23.5 3.4 3.2 3.5 3.5 3.5 3.3 3.2 3.1 3.1
78.7 80.7 82.7 80.4 81.0 81.5 82.3 82.5 82.8 83.13.6 3.5 4.5 3.5 3.6 3.6 4.2 4.4 4.7 4.9
67.9 70.1 71.0 70.0 70.4 70.6 70.9 70.8 71.0 71.419.8 20.1 19.8 20.1 20.2 20.1 19.9 19.7 19.7 19.8
165.5
84.6
172.8
83.7
1.51 1.46
8.62 8.46
170.3 172.6
78.3 84.5
1.18 1.51
7.73 8.54
174.3 171.9 169.5 169.0
84.2 81.7 79.2 78.2
1.43 1.33 1.22
8.45 8.13 7.41
1.03
7.75
170.2
77.8
1.15
7.75
172.5
77.8
* Assumes pay increase for postal workers in 70-II ($.4 billion with half retroactive for 70-I) and in 70-III ($.2billion) and for Federal civil service employees and military personnel in 70-III (totaling $2.8 billion).
II - 6 April 1, 1970

CONFIDENTIAL - FR II - 7
CHANGES IN GROSS NATIONAL PRODUCTAND RELATED ITEMS
April 1, 1970
1969 1970
1968 1969 1970 Projected
Proj. II III IV I II III IV
------------------------ In Billions of Dollars--------------------------
Gross National Product
Inventory change
Final sales
Private
Excluding net exports
Net exports
Government
GNP in constant (1958) dollars
Final sales
Private
48 1-4.953.045.944.3
1.67.2
33.0 19.9 4.1 3.633.3 19.6 8.4 3.524.9 18.3 12.1 3.9
---------------------- In Per Cent Per Year---------------------------
Gross National ProductFinal sales
Private
Personal consumption expendituresDurable goodsNondurable goodsServices
Gross private domestic investmentResidential constructionBusiness fixed investment
Gov't purchases of goods & servicesFederal
DefenseOther
State & local
GNP in constant (1958) dollarsFinal sales
PrivateGNP implicit deflator
Personal incomeWages and salaries
Disposable income
Corporate profits before tax
Federal government receipts andexpenditures (N.I A. basis)
ReceiptsExpenditures
9.0 7.3
14.1 7 8
72 56
9.1 8 9
8.9 10.4 -0 5
20 8 6 6 -10 9
6 1 11.7 7 8
7.7 4.9 6.710 0 -3.5 2.75.9 5.0 5.98 7 8.0 8 8
6 5 17 2-7 2 -15 9
10 5 13 5
6.4 7.8 7.7 6.4-1.8 4.4 4.4 4.37.4 8.2 8.0 5.58.5 8.6 8.4 8.1
-4.2 -12.12.5 -17.75.5 6.2
7 7 2 410 3 -3.59.2 -5.5
14.5 3.5
5.3 7.7
2.1 -0.403 1.01 0 2.05.6 4.5
8.6 5.810 0 6.310.9 5.3
13.4 3.0 -8.7 0.4 -12.2 -3.9
0.0-8.6
-10.1-3.5
7 6
-3.5-38.4
9.2
1.5-8.0
-11.43.59.5
-1.5 0.80.7 1.22.0 2.242 4.0
5.9 12.40.0 41.05.6 3.7
8.24.10.0
17 311.6
2.01.72.3 2/4.9 -
5.88.68.4
-24.5 -4.6 0.0 7.1
16 7 14.3 -1.9 8.5 -3.0 4.0 -13.0 4.1 -5.8 6.510.8 5.8 6 0 1.7 9 1 6.4 3.5 14.9 -1.6 0.2
Nonfarm payroll employment
Manufacturing
Industrial production
Housing starts, private
Sales new domestic autos
3.0 3 4 1 3 3.3 2.0 1.52 1 1 8 -1 5 1 6 1.8 -3 4
4 7 4 4 -1 4 5 6 3 9 -5.5
16 7 -2.7 -19 3 -48 3 -21.5 -28.8
14.0 -1 9 -8.7 8.4 -4.2 -15.1
1.7 -0.6 1.1 2.3-4.0 -4.0 0.0 2.0
-5.6 -1.2-31.9 -64.8-35.4 18.4
2.8 5.448.8 52.2
0.0 12.9
* Based on deflators calculated to three decimals.1/ Excluding Federal pay increase 4.3 per cent per year.2/ Excluding Federal pay increase 3.8 per cent per year.
3.9 -0.80.6 1.81.4 2.8
-2.7 1.51.2 2.22.8 3.2
3.6 6.33.1 6.03.3 5.9
7.8 4.06.1 5.45.7 6.3
II 8
Industrial production. Industrial production is tentatively
estimated to have declined a little further in March. Total output of
consumer goods, on the basis of sketchy data, apparently changed little.
Production of defense equipment and industrial materials most likely
declined further. The trend in output of business equipment, however,
has been obscured since October by the G.E. strike. If output of
business equipment is maintained and if the readjustments in production
of consumer durable goods are largely over, as seems likely, further
declines in output of industrial materials and in the total index from
the March level would be moderate in the second quarter.
Auto assemblies in March were at an annual rate of 7 million
units, up moderately from February. April schedules initially had been
set at a 7.6 million unit rate, but have been cut back to about a
7 million unit rate, the same as in March. Output of television sets
rose further in the first 3 weeks of March, but trade reports indicate
some cutbacks in production in April as inventories remain high rela-
tive to sales. Other March production data indicate about a 5 per cent
increase in truck output from the reduced February level, a 3 per cent
rise in production of raw steel, and some decline in output of paper
and paperboard.
The decline in industrial production from the July 1969 high
to February 1970 was larger than in the 1966-67 readjustment, but was
considerably smaller than during comparable periods in the recessions
of 1958-59 and 1960-61, as shown in the table. The 1969-70 downturn

II - 14
were erased by increases in subsequent months, a pattern which could be
repeated this year. For the quarter as a whole, therefore, it is likely
that book value growth will be positive--but a fairly large valuation
adjustment can also be expected.
CHANGE IN BOOK VALUE OF BUSINESS INVENTORIESSeasonally adjusted annual rates, billions of dollars
Manufacturing and trade, total
Manufacturing, totalDurableNondurable
Trade, totalWholesaleRetailDurableAutomotiveNonautomotive
Nondurable
1969QIV average
13.5
6.86.1
.7
6.72.64.12.1
.61.52.0
January
-6.9
1.93.4-1.5
-8.8- .6-8.2-6.3-3.9-2.4-1.9
1970February
n.a.
7.73.24.5
n.a.n.a.n.a.n.a.n.a.n.a.n.a.
Manufacturing inventory-sales ratios were unchanged in
February, and the ratio of durable goods inventories to unfilled orders
rose further. The trade inventory-sales ratio dropped back in January
but remained above the level reached in the same month of 1967.
I

II - 15
INVENTORY RATIOS
1967 1969 1970Jan. Feb. Dec. Jan. Feb.
Inventories to sales:Manufacturing & trade, total 1.57 1.59 1.59 1.58 n.a.
Manufacturing, total 1.76 1.77 1.73 1.74 1.74Durable 2.06 2.08 2.10 2.12 2.12Nondurable 1.40 1.40 1.29 1.29 1.29
Trade, total 1.37 1.39 1.42 1.40 n.a.Wholesale 1.20 1.22 1.21 1.20 n.a.Retail 1.49 1.50 1.56 1.54 n.a.
Durable 2.09 2.15 2.22 2,27 n.a.Nondurable 1.20 1.21 1.25 1.23 n.a.
Inventories to unfilled orders,durable manufacturing .653 .663 .733 .746 .757
Cyclical indicators. In February, the preliminary composite
leading indicator was almost unchanged, the coincident composite
declined slightly, and the lagging composite also declined--for the
second month, as it now appears, after a downward revision in January.
The leading composite remains 2.4 per cent below its
September peak; it is the most irregular of the three composites, and
not too much can be made of its leveling off in February. The decline
of 1.0 per cent in the lagging indicator between December and February
is the first decline of more than one month's duration since 1962-63
and the largest percentage decline since 1960-61.

II - 16
COMPOSITE CYCLICAL INDICATORS1963 = 100
12 Leading 5 Coincident 6 LaggingIndicators* Indicators Indicators
1969: September 153.4 172.2 196.0October 153.0 173.1 198.8November 152.1 173.4 198.2December 152.3 173.4 201.4
1970: January 149.7 172.6 200.7February (prel.) 149.8 172.1 199.5
* Trend adjusted.
Among the leading indicators, the workweek, unemployment
claims, contracts and orders for plant and equipment, and common stock
prices had a downward effect on the index, while building permits, new
orders for durable goods, industrial materials prices, and the ratio
of price to unit labor cost rose. Of the coincident indicators,
employment, unemployment, and industrial production moved adversely in
February while personal income rose.
Three of the four monthly lagging indicator components are
available for February; of these, long-term unemployment and labor
cost per unit of output in manufacturing caused the decline, while
commercial and industrial loans outstanding at weekly reporting banks
increased. The January decline was attributable to loans and inven-
tories. The other two components of the lagging composite are quarterly.
Business loan interest rates are not available currently and are assumed
to move with the index components that are available, and plant and
equipment spending in January and February is assumed to increase, in
accordance with the anticipations data.
II - 17
Construction and real estate. Seasonally adjusted private
housing starts, which had declined sharply further in January, re-
versed direction in February and reached an annual rate of 1.32 million
units. The February rise--which occurred despite a one-fifth drop in
permits during January--was mainly in single-family units, but multi-
family starts also turned up. Regionally, only the North Central
states showed a decline in February, and, while this was substantial,
it was more than offset by increases in other regions, particularly
in the Northeast where activity had been notably low.
A factor in the February advance apparently was the already
appreciably reduced starts rate reached in January at a time when
unadjusted starts normally approach a seasonal low for the year. By
contrast, the normal pace for March calls for a very sharp seasonal
expansion in unadjusted starts, and it seems unlikely that more than
part of this was realized given the reduced overall level of mortgage
commitments available to builders and the low average level of permits
so far this year. Even so, housing starts in the first quarter as a
whole may have averaged around 1.2 million, which would be only 8 per
cent under the rate now reported for the fourth quarter of last
year, though nearly 30 per cent below the recent peak in the first
quarter of 1969.

II - 18
PRIVATE HOUSING STARTS AND PERMITS
Starts /
1-family2-or-more family
NortheastNorth CentralSouthWest
Permits
1-family2-or-more family
February 1970(Thousands of
Units)l/
1,321
801520
256255524286
1,147
549598
Per cent change fromJanuary 1970 February 1969
+ 10 - 22
+ 16 - 18+ 3 - 27
+ 50 + 19- 25 - 56
11 - 21
S32 + 24
+ 13 - 22
+ 17 - 20+ 10 - 24
1/ Seasonally adjusted annual rates; preliminary.2/ Apart from starts, mobile home shipments for domestic use in
January--the latest month available--were at a seasonally adjustedannual rate of 378,000, a tenth below the near-peak a year earlier.
Sales of one-family homes by merchant builders early this
year were holding at the moderately improved rate reached last October.
Meanwhile stocks of such homes available for sale dropped to the lowest
level in nearly a year. In the market for existing homes, average
prices of homes involved in transactions remained above year-earlier
levels. However, in January the year-to-year increase amounted to
only 5 per cent, compared with a year-to-year rise of as much as 10
per cent as recently as last autumn, according to the National Associa-
tion of Real Estate Boards.
_ __ ~_ ~
II - 19
In the public construction sector, the Administration on
March 17 announced immediate withdrawal of its request of last
September that both Federally assisted and other construction projects
of State and local governments be curtailed where possible. Termina-
tion of this request, according to Budget Bureau estimates, will
eventually reactivate assisted outlays of $1.5 billion, utilizing
$1.2 billion in Federal funds and $300 million in matching State and
local funds. But mainly because of lag factors, only a small part of
this flow is expected to affect activity--largely highways--during
this calendar year. A related cutback in direct Federal construction
also announced last September and expected to involve about $1.8
billion before scheduled termination this July was not affected by
the recent order. Meanwhile, activation of other State and local
projects deferred in response to the President's request will continue
to depend on the availability of funds, which in recent months has
limited further expansion in this area in any case.
Labor market. Evidence of easing still dominates the labor
market. However, increases in both insured unemployment and initial
claims for unemployment benefits have moderated in recent weeks,
reflecting the end of heavy layoffs in the auto industry. Insured
unemployment has averaged about one-third higher in recent weeks than
during May 1969--the most recent low for insured joblessness. This
increase was of about the same magnitude as that which occurred during
the comparable period of the 1966-67 adjustment.

II - 20
It now appears that the February nonfarm payroll employment
estimate will be revised up by 150,000 to 200,000. (The official re-
vision is not available as of this writing.) The revision was
largely in services and the auto segment of manufacturing. Despite
the revisions, manufacturing employment still shows a decline in
February and the newly released labor turnover data for February (which
relate to the entire month) suggest that manufacturing employment
outside the auto industry may have declined further after the survey
week. The separation rate in manufacturing exceeded the accession
rate by the widest margin since April 1967, as layoffs rose to 16 per
1,000 workers--the highest rate in nearly three years--while new hirings
declined further. Preliminary industry-by-industry data show much
of the February easing to have occurred in the nondurable goods in-
dustries.
Total unemployment probably rose slightly further in March,-
reflecting continued labor force growth and somewhat easier demands for
labor. Thus far, reduced hiring and cyclical layoffs have had their
greatest impact on adult men; their jobless rate had jumped from 1.5
per cent in February 1969 to 2.2 per cent in February 1970. However,
at the end of the school year several million high school and college
students will enter the labor market, and it appears likely that they
1/ Employment and unemployment data from the establishment andhousehold surveys have been delayed by the postal strike.

II - 21
will find the supply of jobs more limited than last year. Thus, the
number of unemployed youngsters seems likely to rise this summer,
sustaining the uptrend of total unemployment.
Earnings. Between January and February, the rise of total
wage and salary income was retarded further by employment and hours
reductions in manufacturing. (Revision of the February employment
figures will likely result in some upward revision of the total
wage and salary figure, but the trend shown in the table should remain
about the same.) Growth continues strong, however, in nonmanufacturing
industries.
AVERAGE MONTHLY CHANGES IN WAGES AND SALARIES(Seasonally adjusted, annual rates in per cent)
Jan. 1969 July 1969 Oct. 1969 Jan. 1970to to to to
_.ily 1969 Oct. 1969 Jan. 1970 Feb. 1970
Total 9.6 7.3 6.0 3.8
Government 11.6 7.2 6.7 5.5Private 9.1 7.4 5.9 3.4
Manufacturing 8.0 5.3 -1.2 -9.0Nonmanufacturing 9.8 8.7 10.4 11.1
Increases in average hourly earnings were also smaller
over the three-month period ending in February than during the pre-
ceding three-month period and a year earlier. In part, the slowing
of hourly earnings growth for rank-and-file workers in private industry

II - 22
reflects developments in manufacturing, where hourly earnings growth
has been reduced by cutbacks of overtime and layoffs in the high-wage
auto and aircraft industries. However, the recent easing also appears
to have extended to such industries as trade and finance.
AVERAGE HOURLY EARNINGS(Seasonally adjusted, annual rates)
Total private
ManufacturingDurable goodsNondurable goods
ConstructionTradeFinance, Ins. & Real Est.
Per cent increase over 3 months ending:Feb. 1969 Nov. 1969 Feb. 1970
5.6 6.8 3.8
4.3 3.5 1.64.2 2.2 1.54.4 5.2 4.2
2.1 10.5 5.76.0 7.3 5.69.5 6.1 3.9
II - 23
Industrial relations. The strike of Post Office employees
was halted on March 25, when the Administration agreed to open discus-
sions on a wage increase as soon as the strikers returned to their
jobs. A House and Senate conference committee on pay bills is now
waiting to consider any agreement reached by the unions and the
Administration. The House bill provides for two pay increases; 5.4 per
cent retroactive to October 1, 1969, for postal workers and 5.7 per
cent effective July 1 for all Federal employees. The Senate bill would
provide pay increases up to 7 per cent for all Federal employees on
July 1. The postal unions have been pressing for a 12 per cent wage
increase, full payment of health benefits, pay-scale differentials
based on local living costs, and amnesty for strikers.
Meanwhile, the F.A.A. aircontroller's slowdown continues to
limit civilian air traffic. Wage levels are an important factor in
this dispute, but there is also a wide disagreement on work loans and
general working conditions.
Congress may be forced to move soon to bring about a settle-
ment between the railroads and shopcraft unions. (Strikes and lockouts
were barred by Congress until April 11.) Three of the shopcraft unions
approved an earlier (December) settlement which was rejected by the
sheet metal workers who feared loss of job-security under a proposed
change in work rules.
The trucking industry and 450,000 members of the Teamsters'
Union whose contract expired March 31 have not yet reached agreement.
Noneconomic issues have reportedly been agreed upon; negotiations on
economic issues are now underway.
II - 24
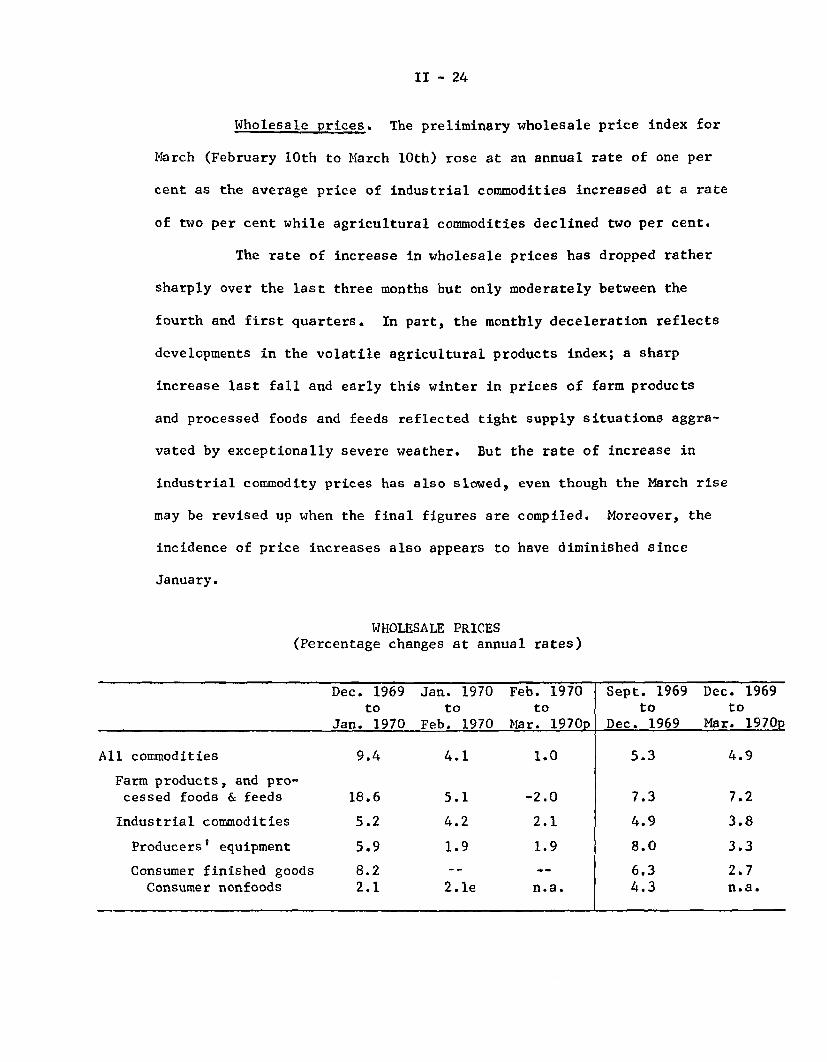
Wholesale prices. The preliminary wholesale price index for
March (February 10th to March 10th) rose at an annual rate of one per
cent as the average price of industrial commodities increased at a rate
of two per cent while agricultural commodities declined two per cent.
The rate of increase in wholesale prices has dropped rather
sharply over the last three months but only moderately between the
fourth and first quarters. In part, the monthly deceleration reflects
developments in the volatile agricultural products index; a sharp
increase last fall and early this winter in prices of farm products
and processed foods and feeds reflected tight supply situations aggra-
vated by exceptionally severe weather. But the rate of increase in
industrial commodity prices has also slowed, even though the March rise
may be revised up when the final figures are compiled. Moreover, the
incidence of price increases also appears to have diminished since
January.
WHOLESALE PRICES(Percentage changes at annual rates)
Dec. 1969 Jan. 1970 Feb. 1970 Sept. 1969 Dec. 1969to to to to to
Jan. 1970 Feb. 1970 Mar. 1970p Dec. 1969 Mar. 1970p
All commodities 9.4 4.1 1.0 5.3 4.9
Farm products, and pro-cessed foods & feeds 18.6 5.1 -2.0 7.3 7.2
Industrial commodities 5.2 4.2 2.1 4.9 3.8
Producers' equipment 5.9 1.9 1.9 8.0 3.3
Consumer finished goods 8.2 -- 6.3 2.7Consumer nonfoods 2.1 2.1e n.a. 4.3 n.a.

II 25
The fastest increase in wholesale prices continues to be in
raw materials, especially durable materials. However, the situation
among metals, which have accounted for a high proportion of the increase
in industrial prices over the past year, has improved. The major non-
ferrous metals now appear in better supply relative to demand and one--
zinc--is now being discounted according to trade reports. But a major
producer has announced an increase of 4 cents a pound in the price of
domestic copper, effective April 1, from 56 to 60 cents.
Although non-ferrous prices rose on average in March, a
large part of the rise was due to the sky-rocketing price of antimony,
supplies of which have been cut off by Red China. Steel mill products
and fabricated metal products continued to rise in March, reflecting
in part cost pressures arising from higher prices of coal, coke, and
scrap iron. Most recently the price of steel scrap has declined.
Producers' equipment price increases have tapered off since
the fourth quarter, the period of seasonal rise. However, since last
September, these have increased at a 5.7 per cent annual rate compared
to 4.0 per cent in 1968-69. Strong domestic and export demands are
helping to sustain the rise in machinery prices.
Consumer durable goods prices are increasing much less
rapidly than producer durables. Over the year, passenger cars and such
consumer durables as appliances have increased about 2 per cent,
furniture about 4 per cent, while home electronic equipment (radios,
TV, etc.) has declined. This experience compares with an increase of
about 4-1/2 per cent for producers' equipment.

II -26
Consumer prices. The consumer price index rose in February
at a seasonally adjusted annual rate of 6 per cent, somewhat less than
in each of the preceding three months, but about the same as the average
monthly increase over the past year. If the 2.4 per cent rise in mort-
gage interest rates over the month is excluded, the total rise would
have been at only a 5 per cent annual rate.
So far, there are few definite signs of a slowing in the
increase in nonfood commodity prices. A leveling off in apparel prices
in January was followed by a rise in February of about 5.5 per cent,
about the same rate as over the last year. Substantial increases for
other nondurables, including household supplies, furnishings and liquor
also took place. The small rise in prices of durable commodities in
February reflected a drop in used car prices which may or may not indi-
cate a significant trend.
The February increase in prices of consumer durables would
have been at a rate of 3.6 per cent if purchases of used cars and
houses were excluded, as in the GNP deflator for consumer durables. On
either basis, durable consumer goods prices have been rising less
rapidly than most other categories of goods for some time, but prices
of household durables rose fairly strongly in February after several
months of slow change. The decline in used car prices last month is of
interest, since last year a strong rise from February through April
accounted for much of the apparent acceleration in consumer durables.
(Used car prices are not adjusted for seasonality.)
A 9 per cent rate of increase in the cost of services in
February was in part due to the sharp rise in mortgage interest rates

II - 27
associated with the increase in the permissible interest ceilings on
Government-underwritten mortgages. (No allowance is made for the
simultaneous decrease in points.) Services less home finance rose 5.6
per cent--about the same rate of increase as in the last half of last
year. A further large increase in home finance costs is expected this
month.
Food prices continued to outstrip those of other commodities,
as prices of all major food categories increased in February. Over the
past year, food prices rose 8 per cent, as much as during the two years
of inflation in food prices between mid-1964 and mid-1966. Meat prices
increased 12 per cent last year, reflecting in large part an increase
in spread between the farm value and the retail value.
CONSUMER PRICES(Percentage changes, seasonally adjusted, annual rates)
Dec. 1968 June 1969 Dec. 1969 Jan. 1970 Feb. 1969to to to to to
June 1969 Dec. 1969 Jan. 1970 Feb. 1970 Feb. 1970
All items 6.3 5.8 7.3 6.3 6.41/Durable commodities- 5.5 3.4 3.2 1.0 3.6
New cars 2.2 2.1 5.8 2.3 2.3
Nondurable commodities 5.6 5.8 3.8 5.6 6.1Food 6.3 7.8 4.6 9.2 7.9Apparel 5.4 5.1 -- 5.6 5.1
Services 7.5 7.0 10.5 8.8 7.9Medical care 9.5 4.4 6.9 9.7 6.6Rent 3.1 4.2 3.0 4.9 3.9Transportation 8.0 8.6 36.4 9.4 10.2Mortgage interest rates 15.3 7.0 2.6 30.9 13.8
Addendum:
Durable products2 4.1 1.7 3.3 3.3 3.0Services less home finance- 5.7 5.6 10.1 5.6 6.1
1/ Includes home purchase as well as new and used cars and household durables.2/ Excludes home purchase and used cars.3/ Excludes mortgage interest, property taxes and insurance.

II - 28
Farm production outlook. Recent surveys of farmers' produc-
tion plans and other data indicate that farm output in 1970 is likely
to be somewhat larger than the record output of 1969. Farmers polled
in early March reported plans to expand acreages of major spring seeded
crops by 3 per cent. Increases reported for feed grains, soybeans, and
cotton were offset in part by cutbacks in spring wheat, rice, tobacco,
and sugar beets. Seeded acreage of winter wheat, the major food grain,
was cut back 11 per cent last fall.
Production prospects for farm foods that are marketed
throughout the year, such as livestock products and fresh vegetables,
suggest that there should be some easing in pressure on retail prices
of these products from the supply side as the year progresses. Pro-
duction of two items in shortest supply this spring, fresh vegetables
and pork, are expected to increase. Expected expansion in vegetables
assumes average weather.
Hog marketings, down sharply since mid-1969, are expected to
pick up this summer and to exceed year-earlier levels by 7 to 8 per
cent toward the end of the year. Fed cattle marketings should exceed
year-earlier levels throughout the year. Numbers of cattle on feed
were up 6 per cent at the first of the year and moderately more cattle
are available for feeding this year than last. Marketings of nonfed
cattle will continue to lag under a year earlier. Expansion in
production of eggs, broilers, and turkeys is in prospect but milk
output is expected to hold stable at year-earlier levels.

II-C 1
ECONOMIC DEVELOPMENTS - UNITED STATESSEASONALLY ADJUSTED, RATIO SCALE
GNP INCREASE
NDUSTRIAL PRODUCTION - I
TOTALFEB 169 4
VF ICONSUMER GOODSFEE 160 2
1968
INDUSTRIAL PRODUCTION - E
BUSINESS EQUIPMENTFEB 195 0
1957-59=100
-200
- 150
1970
1957-59=100
- 200
DEFENSE EQUIPMENTFEB 1537
II 11111 III I 11111 II1968 1970
BILS EMPLOYMENT ESTAB BASIS MILLIONS OF PERSONS
NONAGRICULTURALFEB 70 8
MANUFACTURING
HO
WORKWEEK-MFG.FEB 399
IiJ ii l l I I J l l llI I I l l l I lI
1968
UNEMPLOYMENT RATESARITHMETIC SCALE
TOTAL
SINSURED, FEE 26 . ,
1970
ill I liii Jill Iii III
3/31/70
PER CENT
-4
19701968
1968 1970

ECONOMIC DEVELOPMENTS - UNITED STATESSEASONALLY ADJUSTED, RATIO SCALE
PERSONALFEB 7776 - 750
DISPOSABLE - 650aQT 647 5
-550llittl Ll 1,,,,,,1 ,, l 1
RITHMETIC SCALE
A C SAVING RATE
1968II I
BIL. PRICES AND COSTS
CONSUMER PRICES*FEB 132 5
UNIT LABOR COSTFEB 1179
INDUSTRIAL WHOLESALE *FEB 1144
*NSA
1968 1970
RETAIL SALES
TOTALFEB 294
GAAFFEB 82
1968
AUTOSANNUAL RATEDOMESTIC
1970
PRODUCTIONFEB 65
-28
MILLIONS OF UNITS
1 10
IIIIII I I
S IMPORTSFEB 1 3
j l, ...............
1 9 6 8 1 l 0l lllllll
BUSINESS INVESTMENT
PLANT AND EQUIPMENT OUTLAYSANNUAL RATE
it 81 8 O R
MFG. NEW ORDERS
MACHINERY AND EQUIPMENTFEB 66
NVENTORIES,ARITHMETIC SCALEANNUAL RATE
I I I I I I I I II II I I I I II
1970
NONFARM - CHANGES
GNPOQ 74
I I I I IPERC
ARITHMETIC SCALE
INVENTORY SALES RATIOJAN 158
1968 1970
BIL $
INCOMEFNNUAL RATE
1957-59=100
H-C 2 3/31/70
-1.
1968 1970
III - 1
THE ECONOMIC PICTURE IN DETAIL
Domestic Financial Situation
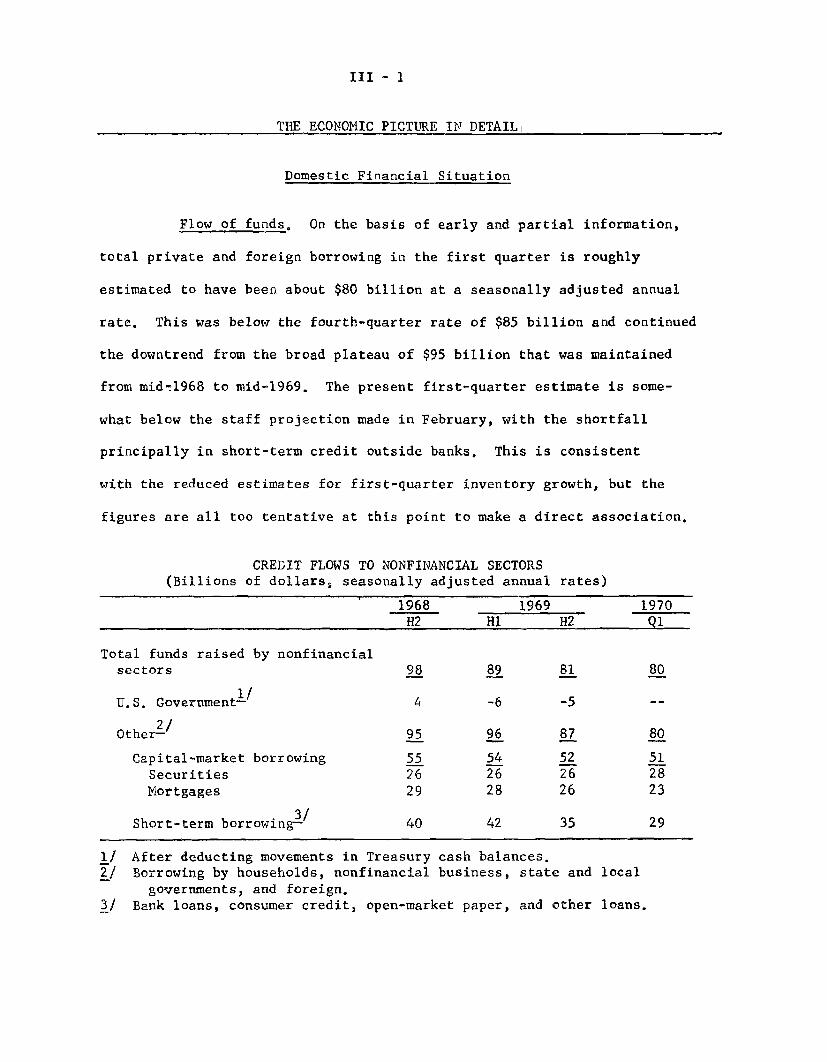
Flow of funds. On the basis of early and partial information,
total private and foreign borrowing in the first quarter is roughly
estimated to have been about $80 billion at a seasonally adjusted annual
rate. This was below the fourth-quarter rate of $85 billion and continued
the downtrend from the broad plateau of $95 billion that was maintained
from mid-1968 to mid-1969. The present first-quarter estimate is some-
what below the staff projection made in February, with the shortfall
principally in short-term credit outside banks. This is consistent
with the reduced estimates for first-quarter inventory growth, but the
figures are all too tentative at this point to make a direct association.
CREDIT FLOWS TO NONFINANCIAL SECTORS(Billions of dollars, seasonally adjusted annual rates)
1968 1969 19701H2 HI H2 Q1
Total funds raised by nonfinancialsectors 98 89 81 80
U.S. Government- / 4 -6 -5
Other-2 / 95 96 87 80
Capital-market borrowing 55 54 52 51Securities 26 26 26 28Mortgages 29 28 26 23
3/Short-term borrowing- 40 42 35 29
1/ After deducting movements in Treasury cash balances.2/ Borrowing by households, nonfinancial business, state and local
governments, and foreign.3/ Bank loans, consumer credit, open-market paper, and other loans.

III - 2
The decrease in borrowing by private sectors since the middle
of last year has been much more moderate in amount and pace than during
the corresponding cyclical periods of 1966, when a first-half rate of
$ 78 billion of borrowing was followed by a second-half trough of $ 52
billion while fixed investment and inventory accumulation were still
rising. In contrast, the drop in borrowing this time has been closely
in line with deceleration of net investment outlays, both for businesses
and for households. The decrease has been sharper in short-term than in
capital-market credit, as is characteristic of tight credit conditions,
but the commercial paper market has provided a substantial cushioning to
the usual effect by supplying funds that flowed through bank affiliates,
finance companies, and directly to nonfinancial corporations at perhaps
an $8 to $10 billion annual rate above the experience of earlier recent
years. Mortgage credit flows have also fallen less steeply than in
1966, when the rate decreased from a $26 billion rate in the first half
to an $18 billion rate in the second. During the current period,
FNMA and FHLB support to housing is at a rate about $5 billion above
the first half of 1969, whereas in the second half of 1966, their
lending was $3-1/2 billion below first-half rates.
Intermediation by FNMA and FHLB's in the mortgage market is
reflected in a $14 billion annual rate of net new agency issues during
the quarter. These issues, together with continued heavy use of com-
mercial paper by bank affiliates, have transformed much of the mortgage
and loan demand of the period into security and commercial paper offerings

III - 3
as seen from the viewpoint of other investors. While it is still too
early to describe the full structure of credit supply in any detaill it
is clear from these offerings and from the high rate of corporate
security flotations that the supply of funds during the quarter has
been mainly in the form of direct purchases of market instruments by
nonfinancial investors. Bond purchases by individuals, in particular,
have undoubtedly been exceeding the record $27 billion rate of the
second half of 1969, with much of the buying in 1- to 5-year maturities.
This form of credit supply is well beyond the range of earlier post-war
experience in both volume and duration, and it puts continuing pressure
on bond prices and interest costs, since borrowers are reaching for
funds that have not been in these markets before in these volumes.
Bank credit. Commercial bank credit, adjusted to include
loan sales to affiliates, increased moderately further in March,
following a relatively strong expansion in February. Present estimates
for the first quarter as a whole indicate a growth in bank credit at
a seasonally adjusted annual rate of 1.8 per cent. This is a slightly
greater rate of increase than in the second half of last year, but it
falls considerably below the pace of advance prevailing through the
first half of 1969.

III - 4
1/COMMERCIAL BANK CREDIT, ADJUSTED TO INCLUDE LOAN SALES-1
(Seasonally adjusted percentage change, at annual rates)
1969 19701st 2ndHalf Half Jan. Feb. Mar.2/ Q 1
3/Total loans & investments- 5.1 1.5 -1.5 6.0 1.8 1.8
U.S. Govt. securities -17.2 -16.0 -44.0 -7.2 2.4 -17.8
Other securities 1.4 -3.6 6.8 0.0 23.7 9.6
3/Total loans /- 11.5 6.4 4.7 9.8 -4.2 3.6
Business loans- 16.1 7.1 12.3 8.9 -5.5 5.6
1/ Last Wednesday of month series.2/ Preliminary estimates. Loan sales are through March 18.3/ Includes outright sales of loans by banks to their own holding companies,
affiliates, subsidiaries, and foreign branches.4/ Includes outright sales of business loans by banks to their own holding
companies, affiliates, subsidiaries, and foreign branches.
The March increase in adjusted bank credit reflected acqussitions
of securities other than U.S. Treasury securities--mainly State and local
issues and Federal Agency issues. Total loans, including loans sold,
declined slightly while holdings of U.S. Treasury securities remained
unchanged. This is the first time since August of last year that holdings
of U.S. Treasury securities did not decline. A significant part of the
rise in "other" security holdings represented acquisitions of inter-
mediate term municipals at dealer banks. Many banks also purchased
municipal (largely short-term) and Federal Agency issues for their own
portfolios in response to increased inflows of time deposits and to
seemingly weaker loan demand.

III - 5
The decline in adjusted loans was largely the result of
comparatively sharp reductions in business loans and loans to finance
companies. Moderate increases were recorded in other major loan
categories with real estate and consumer loan expansion continuing
at the reduced pace prevailing since mid-1969.
The decline in business loans, adjusted to include loan sales
to affiliates, was the first since December 1966. Borrowing was
substantial in a number of industries, particularly in durables
manufacturing. However, there was a contra-seasonal decline in loans
to retail trade, and unusually large loan repayments were made by
public utilities.
Loans to nonbank financial institutions declined for the
third consecutive month in March, probably partly in response to the
diminution in demand for consumer credit. But it seems likely also
that finance companies have opted to utilize alternative sources of
funds. Throughout the month, commercial paper rates were lower than
the cost of financing at commercial banks.
The reduction in the prime rate from 8-1/2 to 8 per cent on
March 25 and 26 was regarded as premature by several large banks. None-
theless, the recent pattern of loan developments supports the change, as
does the quick acceptance of the lower rates by major banks around the
country. Recent declines in market yields favor open market financing
over bank borrowing, and further declines in short-term rates are now
widely anticipated.
III - 6
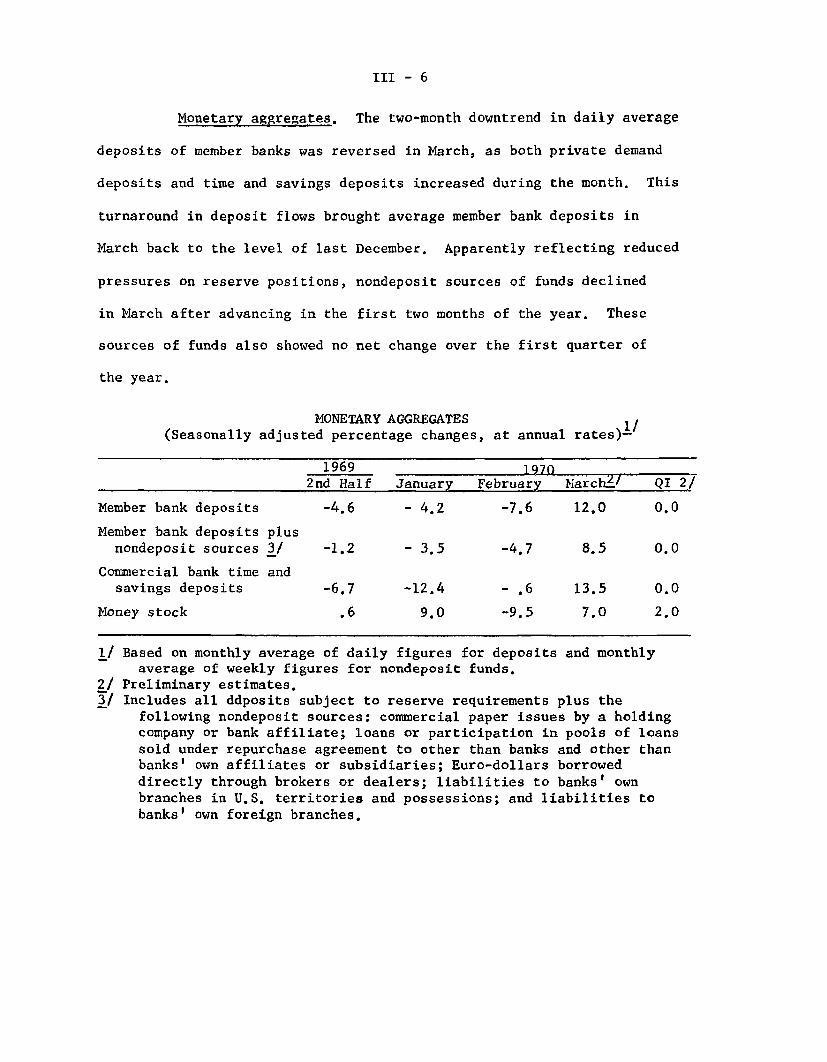
Monetary aggregates. The two-month downtrend in daily average
deposits of member banks was reversed in March, as both private demand
deposits and time and savings deposits increased during the month. This
turnaround in deposit flows brought average member bank deposits in
March back to the level of last December. Apparently reflecting reduced
pressures on reserve positions, nondeposit sources of funds declined
in March after advancing in the first two months of the year. These
sources of funds also showed no net change over the first quarter of
the year.
MONETARY AGGREGATES(Seasonally adjusted percentage changes, at annual rates)-
1969 19702nd Half January February March/ QI 2/
Member bank deposits -4.6 - 4.2 -7.6 12.0 0.0
Member bank deposits plusnondeposit sources 3/ -1.2 - 3.5 -4.7 8.5 0.0
Commercial bank time andsavings deposits -6.7 -12.4 - .6 13.5 0.0
Money stock .6 9.0 -9.5 7.0 2.0
1/ Based on monthly average of daily figures for deposits and monthlyaverage of weekly figures for nondeposit funds.
2/ Preliminary estimates.3/ Includes all ddposits subject to reserve requirements plus the
following nondeposit sources: commercial paper issues by a holdingcompany or bank affiliate; loans or participation in pools of loanssold under repurchase agreement to other than banks and other thanbanks' own affiliates or subsidiaries; Euro-dollars borroweddirectly through brokers or dealers; liabilities to banks' ownbranches in U.S. territories and possessions; and liabilities tobanks' own foreign branches.
III - 7
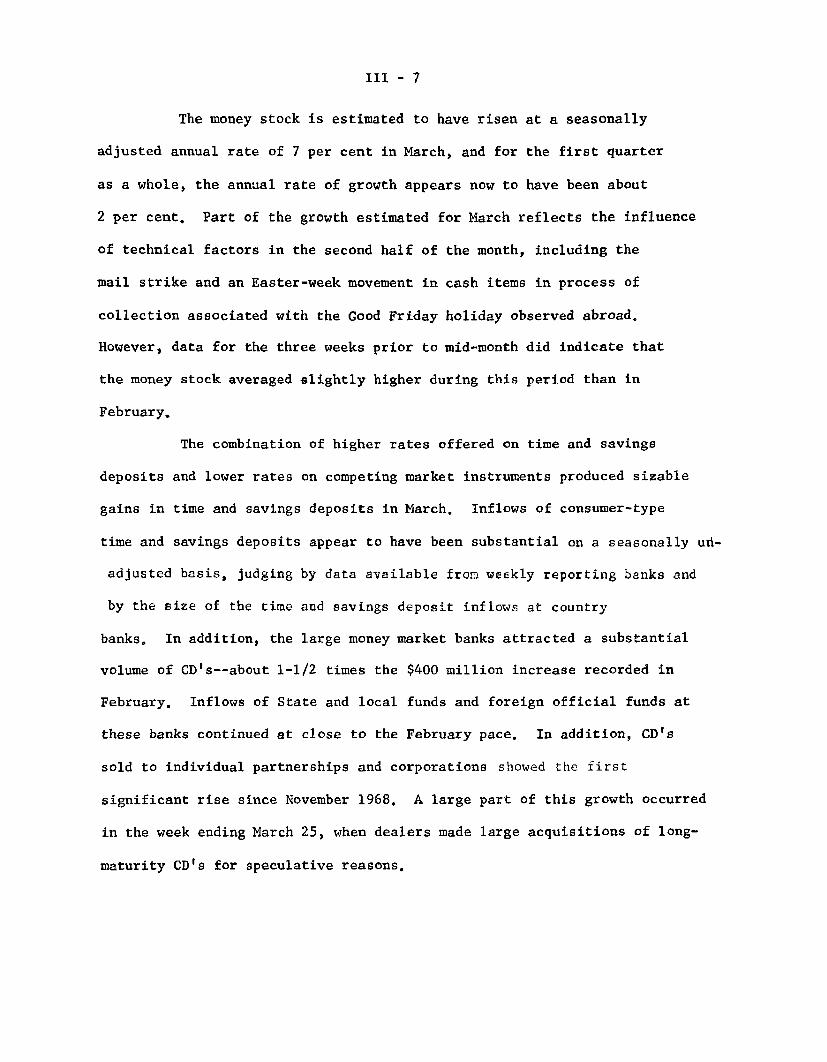
The money stock is estimated to have risen at a seasonally
adjusted annual rate of 7 per cent in March, and for the first quarter
as a whole, the annual rate of growth appears now to have been about
2 per cent. Part of the growth estimated for March reflects the influence
of technical factors in the second half of the month, including the
mail strike and an Easter-week movement in cash items in process of
collection associated with the Good Friday holiday observed abroad.
However, data for the three weeks prior to mid-month did indicate that
the money stock averaged slightly higher during this period than in
February.
The combination of higher rates offered on time and savings
deposits and lower rates on competing market instruments produced sizable
gains in time and savings deposits in March. Inflows of consumer-type
time and savings deposits appear to have been substantial on a seasonally un-
adjusted basis, judging by data available from weekly reporting banks and
by the size of the time and savings deposit inflows at country
banks. In addition, the large money market banks attracted a substantial
volume of CD's--about 1-1/2 times the $400 million increase recorded in
February. Inflows of State and local funds and foreign official funds at
these banks continued at close to the February pace. In addition, CD's
sold to individual partnerships and corporations showed the first
significant rise since November 1968. A large part of this growth occurred
in the week ending March 25, when dealers made large acquisitions of long-
maturity CD's for speculative reasons.
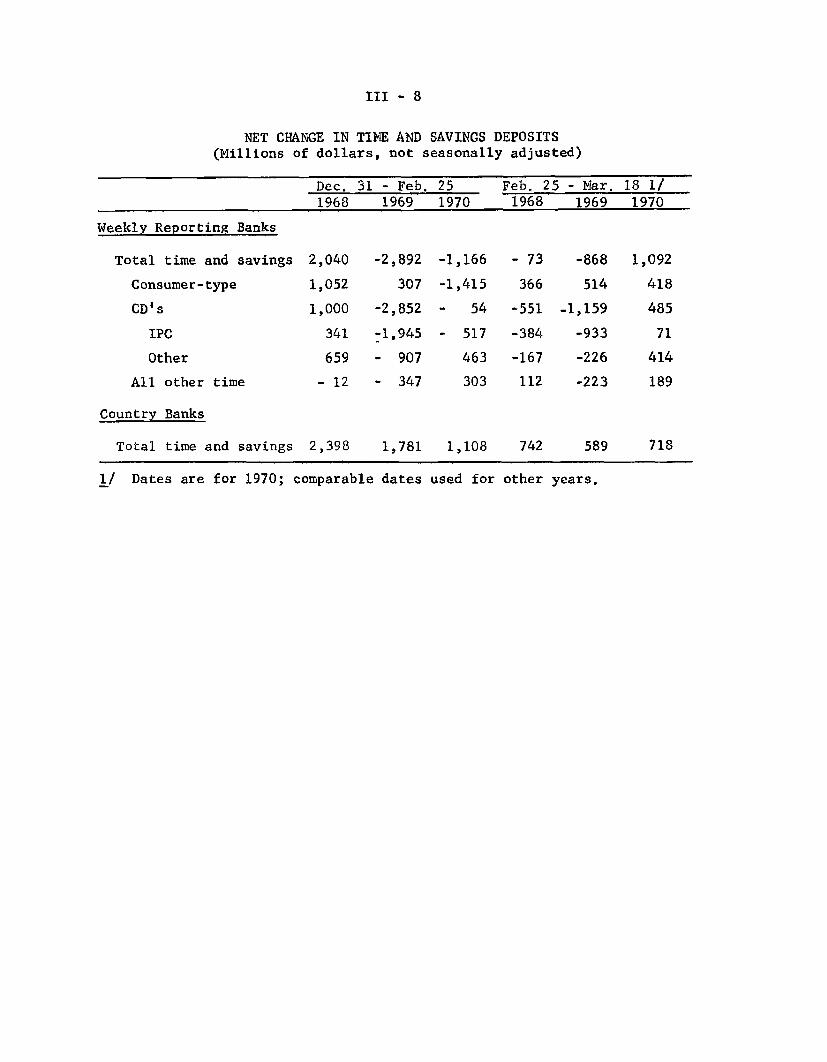
III - 8
NET CHANGE IN TIME AND SAVINGS DEPOSITS(Millions of dollars, not seasonally adjusted)
Dec. 31 - Feb. 25 Feb. 25 - Mar. 18 1/1968 1969 1970 1968 1969 1970
Weekly Reporting Banks
Total time and savings 2,040 -2,892 -1,166 - 73 -868 1,092
Consumer-type 1,052 307 -1,415 366 514 418
CD's 1,000 -2,852 - 54 -551 -1,159 485
IPC 341 -1,945 - 517 -384 -933 71
Other 659 - 907 463 -167 -226 414
All other time - 12 - 347 303 112 -223 189
Country Banks
Total time and savings 2,398 1,781 1,108 742 589 718
1/ Dates are for 1970; comparable dates used for other years.
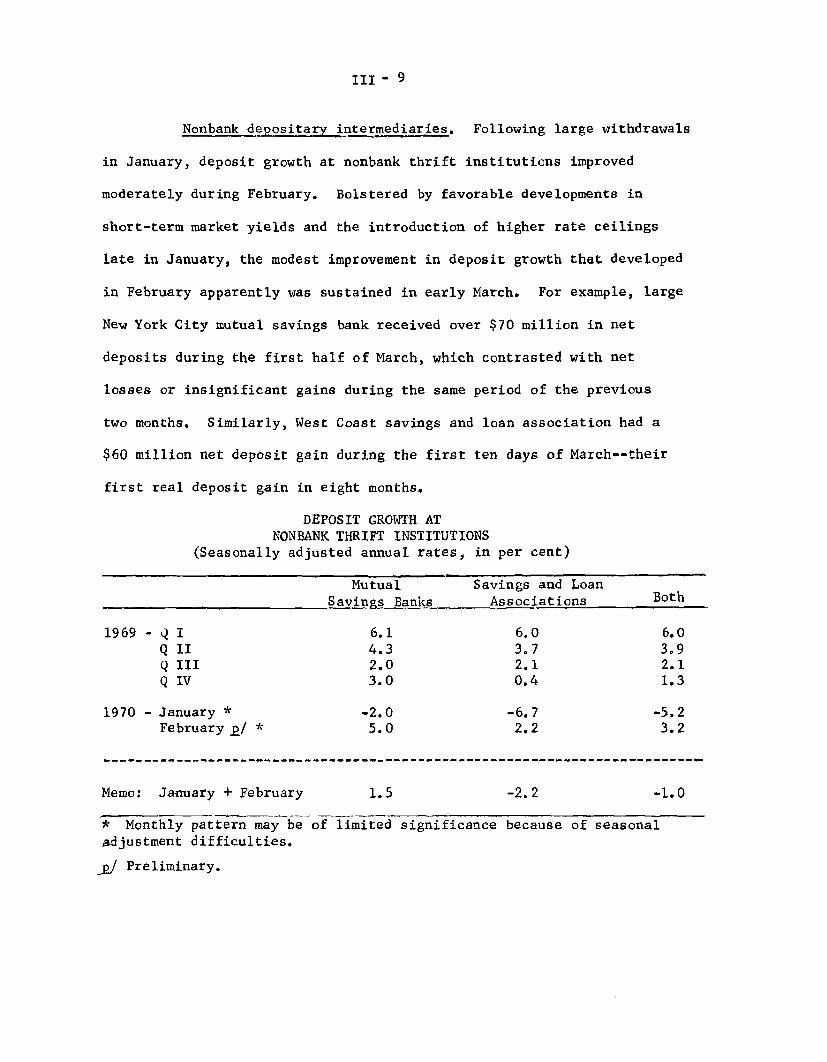
III - 9
Nonbank depositary intermediaries. Following large withdrawals
in January, deposit growth at nonbank thrift institutions improved
moderately during February. Bolstered by favorable developments in
short-term market yields and the introduction of higher rate ceilings
late in January, the modest improvement in deposit growth that developed
in February apparently was sustained in early March. For example, large
New York City mutual savings bank received over $70 million in net
deposits during the first half of March, which contrasted with net
losses or insignificant gains during the same period of the previous
two months. Similarly, West Coast savings and loan association had a
$60 million net deposit gain during the first ten days of March--their
first real deposit gain in eight months.
DEPOSIT GROWTH ATNONBANK THRIFT INSTITUTIONS
(Seasonally adjusted annual rates, in per cent)
Mutual Savings and LoanSavings Banks Associations Both
1969 - I 6.1 6.0 6.0Q II 4.3 3.7 3.9Q III 2.0 2.1 2.1Q IV 3.0 0.4 1.3
1970 - January * -2.0 -6.7 -5.2February g/ * 5.0 2.2 3.2
--------------------------------,,-- --- - - - - - - - - - - - - - - - - -
Memo: January + February 1.5 -2.2 -1.0
* Monthly pattern may be of limited significance because of seasonaladjustment difficulties.
p/ Preliminary.

III- 10
As might have been expected in view of their depleted holdings
of liquid assets and the huge volume of outstanding FHLB advances,
savings and loan associations used a large share of their net inflows in
February to acquire U.S. Treasury issues and to pay down some of their
FHLB advances. Information covering the first three weeks of March in-
dicates that the S&L's have continued these net repayments, at a pace
faster than in the same period of the previous two years. In an effort
to discourage net repayments of advances, the FHLBB has recently limited
the maximum rate charged on advances to 7-3/4 per cent (one District
bank had already been charging 8 per cent), even though its own average
cost of borrowed funds is currently 8.07 per cent. / The FHLBB also
took action to reduce pressure on associations to repay outstanding
advances by increasing from 17.5 per cent to 25 per cent the maximum
allowable percentage of share capital to which expansion advances may
accumulate. This change facilitates conversion of withdrawal advances
(which must be repaid as net deposit inflows occur) into expansion
advances (which may remain outstanding generally for one year).
Savings and loan associations increased their mortgage holdings,
on net, by only a little in February, on a seasonally adjusted basis.
Also, both new and outstanding commitments to acquire new mortgages
were quite modest in February (after seasonal adjustment). Unless the
FHLB is successful in discouraging repayment of advances--by its recent
1/ The difference apparently will be made up by reductions in dividendspaid to S&L's for their deposits with the FHL Banks.
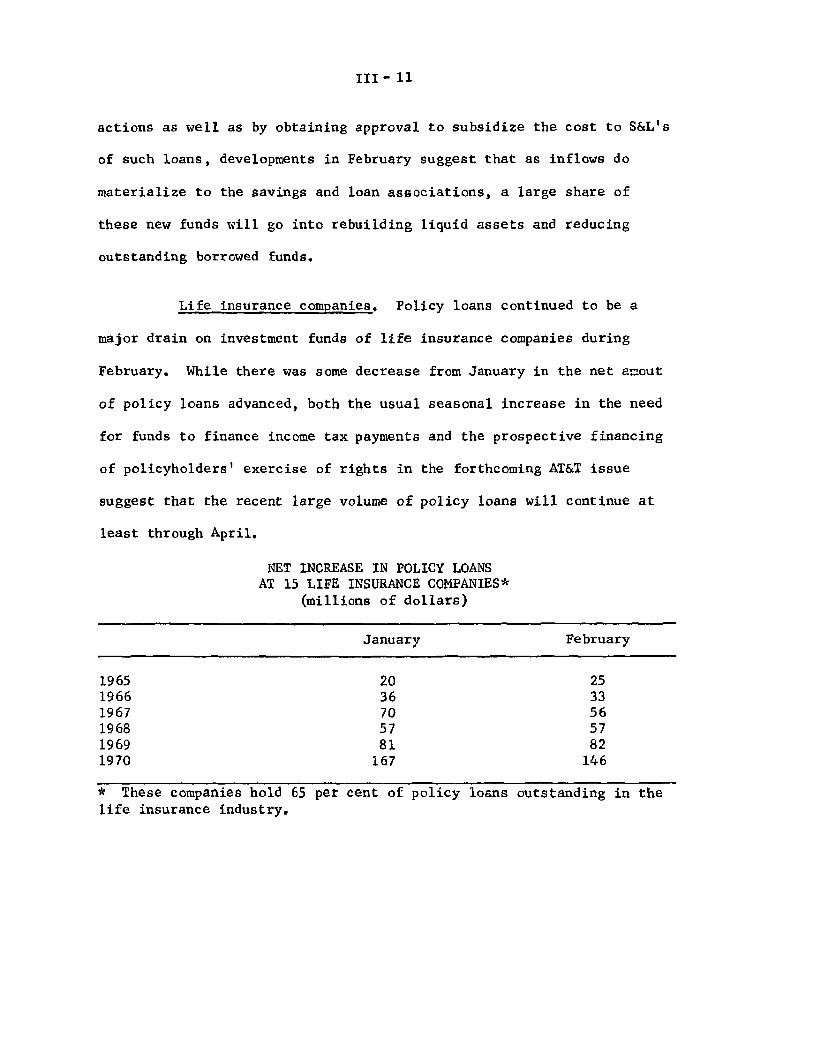
III- 11
actions as well as by obtaining approval to subsidize the cost to S&L's
of such loans, developments in February suggest that as inflows do
materialize to the savings and loan associations, a large share of
these new funds will go into rebuilding liquid assets and reducing
outstanding borrowed funds.
Life insurance companies. Policy loans continued to be a
major drain on investment funds of life insurance companies during
February. While there was some decrease from January in the net amout
of policy loans advanced, both the usual seasonal increase in the need
for funds to finance income tax payments and the prospective financing
of policyholders' exercise of rights in the forthcoming AT&T issue
suggest that the recent large volume of policy loans will continue at
least through April.
NET INCREASE IN POLICY LOANSAT 15 LIFE INSURANCE COMPANIES*
(millions of dollars)
January February
1965 20 251966 36 331967 70 561968 57 571969 81 821970 167 146
* These companies hold 65 per cent of policy loans outstanding in thelife insurance industry.
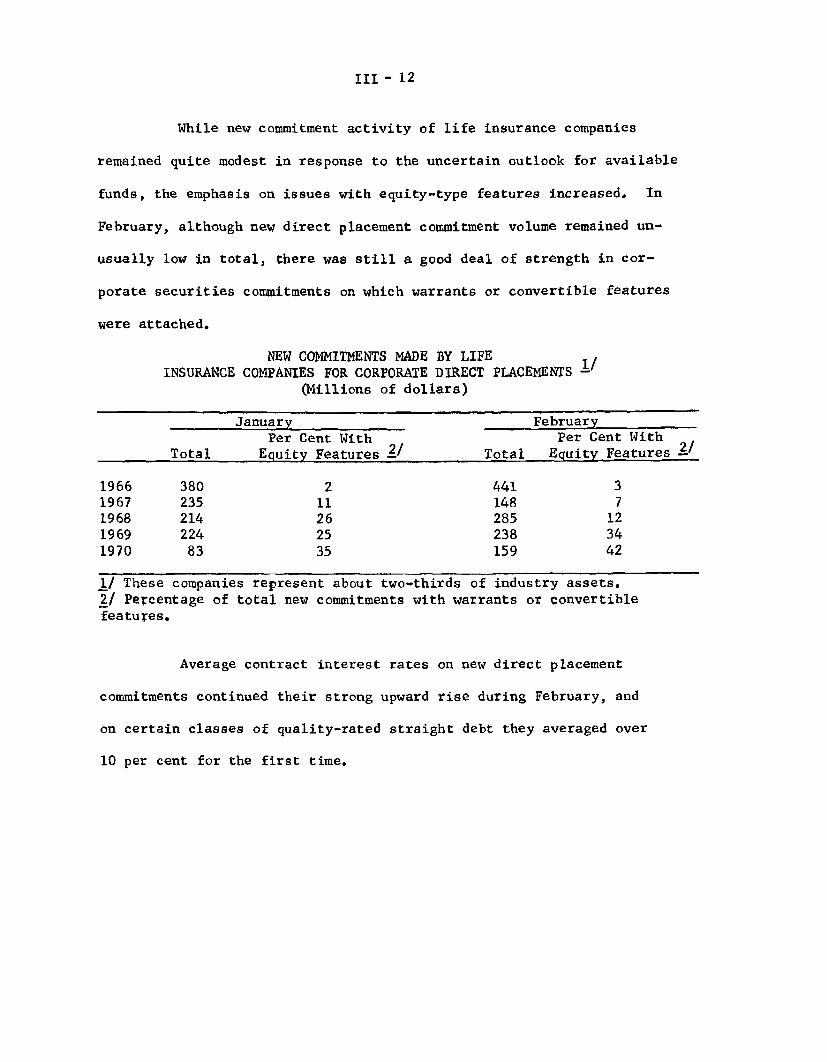
III - 12
While new commitment activity of life insurance companies
remained quite modest in response to the uncertain outlook for available
funds, the emphasis on issues with equity-type features increased. In
February, although new direct placement commitment volume remained un-
usually low in total, there was still a good deal of strength in cor-
porate securities commitments on which warrants or convertible features
were attached.
NEW COMMITMENTS MADE BY LIFEINSURANCE COMPANIES FOR CORPORATE DIRECT PLACEMENTS -1
(Millions of dollars)
January FebruaryPer Cent With Per Cent With
Total Equity Features 2/ Total Equity Features /
1966 380 2 441 31967 235 11 148 71968 214 26 285 121969 224 25 238 341970 83 35 159 42
1/ These companies represent about two-thirds of industry assets.
2/ Percentage of total new commitments with warrants or convertiblefeatures.
Average contract interest rates on new direct placement
commitments continued their strong upward rise during February, and
on certain classes of quality-rated straight debt they averaged over
10 per cent for the first time.

III- 13
AVERAGE YIELDS ON NET COMMITMENTSFOR CORPORATE DIRECT PLACEMENTS
MADE BY LIFE INSURANCE COMPANIES*(Straight debt, issuer corresponds to Baa quality)
Low
High (Per Cent) Average
1966 6.70 5.71 6.161967 7.07 6.38 6.671968 7.81 7.18 7.471969 9.57 7.78 8.66
1970 - January 9.64
February p/ 10.35
* These companies account for about two-thirds of industry assets.
p/ Preliminary.
STRICTLY CONFIDENTIAL
Mortgage market. Even prior to the reduction in the prime
rate in late March, interest of private investors in home mortgages had
been increasing somewhat from depressed levels, judging from fragmentary
FNMA field reports and trade opinion. While these sources suggest
that mortgage flows had not yet picked up very much, more investors seem
to have been feeling out the market or entering into mortgage commit-
ments for delayed takedown. Highlighted by the minor reductions in
mortgage discounts made by several large commercial banks earlier last
month, the belief was apparently growing that mortgage rates in general
had finally topped out. Illustrating the changed attitude were a few
reports that mortgage companies were beginning to take speculative
positions in the market by warehousing some uncommitted loans anticipat-
ing sale later at higher prices.

III - 14
Statistics are not yet available on rates on conventional home
mortgages in March. During February, returns on both conventional and
Government underwritten home mortgages had changed little from their
record levels. Nevertheless, such yileds undoubtedly remained well below
yields available on multi-family and commercial mortgages, which, among
other things, are generally exempt from usury ceilings.
AVERAGE RATES AND YIELDS ON SELECTED NEW-HOME MORTGAGES
Primary market: Secondary market:Conventional loans FHA-insured loans
Yield YieldLevel spread Level spread Discount
(per cent) (basis (per cent) (basis (points)
points) points)
1969LowHigh
OctoberNovemberDecember
1970JanuaryFebruary
7.55 (Jan.)8.35 (Nov., Dec.)
8.308.358.35
-40 (Dec.)69 (Feb.)
413
-40
8.558.55
7.85e (Jan.)8.62 (Dec.)
-13 (Dec.)108 (Feb.)
8.488.488.62
9.25e9.29e
Note: FHA series: Interest rates on conventional first mortgages (excludingadditional fees and charges) are rounded to the nearest 5 basis points. On8-1/2 per cent, FHA loans, a change of 1.0 points in discount is associatedwith a change of 13 to 15 basis points in yield. Gross yield spread isaverage mortgage return, before deducting service fees, minus average yieldon new issues of high grade corporate bonds with 5-year call protection.
e - Estimated.
2.8e(Jan)8.7 (Dec)
7.77.78.7
5.7e6.0e

III- 15
Yields in FNMA's biweekly auction of forward commitments to
purchase FHA and VA loans continued to decline. By the March 23 auction,
yields on 6-month commitments were 22 basis points below the peak in-
dicated 1-1/2 months earlier. Apparently reflecting the improved supply
of mortgage commitments from other sources, demand for FNMA's commit-
ments dropped below levels prevailing early this year and FNMA further
reduced the volume of commitments it accepted.
FNMA AUCTION
Implicit privateAmount of total offers market yield onReceived Accepted 6-month commitments
(Millions of dollars) (Per Cent)
Weekly Auction1968 High $232 (6/3) $ 89 (7/1) 7.71 (6/10)1969 High 410 (6/16) 152 (9/8) 8.87 (12/29)
Bi-weekly Auction1970 High 581 (1/26) 298 (1/26) 9.29 (1/26)
January 26 581 298 9.29February 9 497 295 9.28
24 438 280 9.25March 9 355 276 9.19
23 395 239 9.14
Note: Average secondary market yield after allowance for commitment feeand required purchase and holding of FNMA stock, assuming prepaymentperiod of 15 years for 30-year Government-underwritten mortgages. Yieldsshown are gross, before deduction of 50 basis point fee paid by investorsto servicers. The first auction date was May 6, 1968.

III - 16
Corporate and municipal securities markets. In response to
indications of monetary easing and to the reduction in the prime rate,
corporate bond yields dropped by about 20 basis points and new issues
sold out quickly in the closing days of March. However, much of the
buying appears to have represented dealer willingness to stock their
shelves in the expectation of further price rises. Dealers report that
while institutional purchases had increased after mid-month, their
acquisitions did not accelerate following the prime rate reduction.
Stock market reaction was quite pronounced immediately after the prime
rate cut, with prices moving up toward early March levels, but the
increased demand for stocks was not sustained.
STOCK PRICES AND BOND YIELDS
Bond Yields
New Long-term
Stock Prices 1/ Corporate State andNYSE AMEX Aaa2/ Local bondsa/
1969
Low 49.31 (7/29) 25.02 (7/29) 6.90(1/10) 4.82(2/23)High 59.32 (5/14) 32.91 (1/3) 8.85(12/5) 6.90(12/18)
1970
Week of:March 6 50.04 25.58 8.25 6.00
13 49.02 25.10 8.52 5.9520 48.47 24.60 8.76 6.1827 4/ 50.03 25.02 8.74 5.98
1/ Prices as of the day shown. NYSE is New York Stock Exchange. AMEX isAmerican Stock Exchange.
2/ With call protection (includes same issues with 10-year call protection).3/ Bond Buyer (mixed qualities).4/ Stock prices are as of March 26. The Exchanges were closed on March 27.
III- 17
Even with the reaction to the change in the prime rate, yields
on high-grade corporate bonds at the end of March were still substantially
above beginning-of-the-month levels. Corporate rates had climbed sharply
in the first three weeks of the month, under the pressure of a record
$1.9 billion volume of public bond offerings and the prospects of an un-
usually large forward calendar for at least the. next two months. Demand
for bonds by individuals continued to be an important factor in the
market's ability to absorb this volume without even further upward yield
adjustments.
Stock offerings amounted to almost $1.1 billion in March,
including a $400 million Esso issue for which rights expired that
month. Although it is estimated that monthly private placements are
running well below 1969 levels, total security offerings for March
reached a record total of $3.4 billion about one-half above the 1969
monthly average.

III- 18
CORPORATE SECURITY OFFERING -(Monthly or monthly averages in millions of dollars)
BondsPublic Private
Offerings Placements Stocks Total
1969 1970 1969 1970 1969 1970 1969 1970
Q I 866 1,537e 513 333e 674 700e 2,073 2,537e
March 835 1,900e 509 400e 755 1,100e 2,098 3,400
April 1,268 1,500e 649 300e 830 600e 2,748 2,400e
May 871 2,700e 510 300e 694 700e 2,076 3,700e
April-May Avg.2/ 1,070 2,100e 580 300e 762 650e 2,412 3,050e
1/ Data are gross proceeds.2/ An AT&T bond subscription offer will be made on April 13 and the rights willexpire on May 18. The two-month average distributes the impact of this offering,which is large enough to distort month-to-month changes substantially.e/ Estimated.
While the staff now expects a decline in public bond issues
to about $1.5 billion in April, the volume will remain quite large by
1969 standards and will continue to include a large share of industrial
issues. / Moreover, a $1.6 billion AT&T offering to stockholders will
begin in April, although it will appear in the Board's May statistics
because the rights expire in that month. The staff estimates that
May volume of public bond offerings, including the AT&T issue, will
rise to $2.7 billion as utilities and manufacturing corporations con-
tinue to seek to improve their liquidity position. Perhaps more
1/ For an analysis of the changing composition of public bond offerings,see Appendix A.

III - 19
meaningful in view of the impact of the AT&T offering on the pattern of
monthly volume, the average volume for April and May of public bond
offerings is now expected to exceed the record $1.9 billion for March.
Thus, even with stock issues and private placements expected to return
to about the first quarter averages, total corporate security financing
in both April and May will be approximately $3.0 billion, some 20 per cent
above the large first quarter average.
Yields on municipal securities at the end of March had dropped
back to the level prevailing in the first week of the month, after a
mid-month increase of about 20 basis points, associated with rapidly
growing dealer inventories. New issues of State and local long-term
debt have not increased sharply even though new issue yields declined
about 80 basis points over the first three months of 1970. March
volume was about $1.4 billion, and the staff estimates that the April
level will rise to $1.5 billion as New York City will probably be
returning to the market at that time on its regular three-month borrowing
cycle. It is reported that banks continue to buy heavily in the shorter
range maturities, with longer maturities being acquired by dealers.
Yields on longer-term debt are still high enough to deter many
municipal borrowers who are restrained by interest rate ceilings.
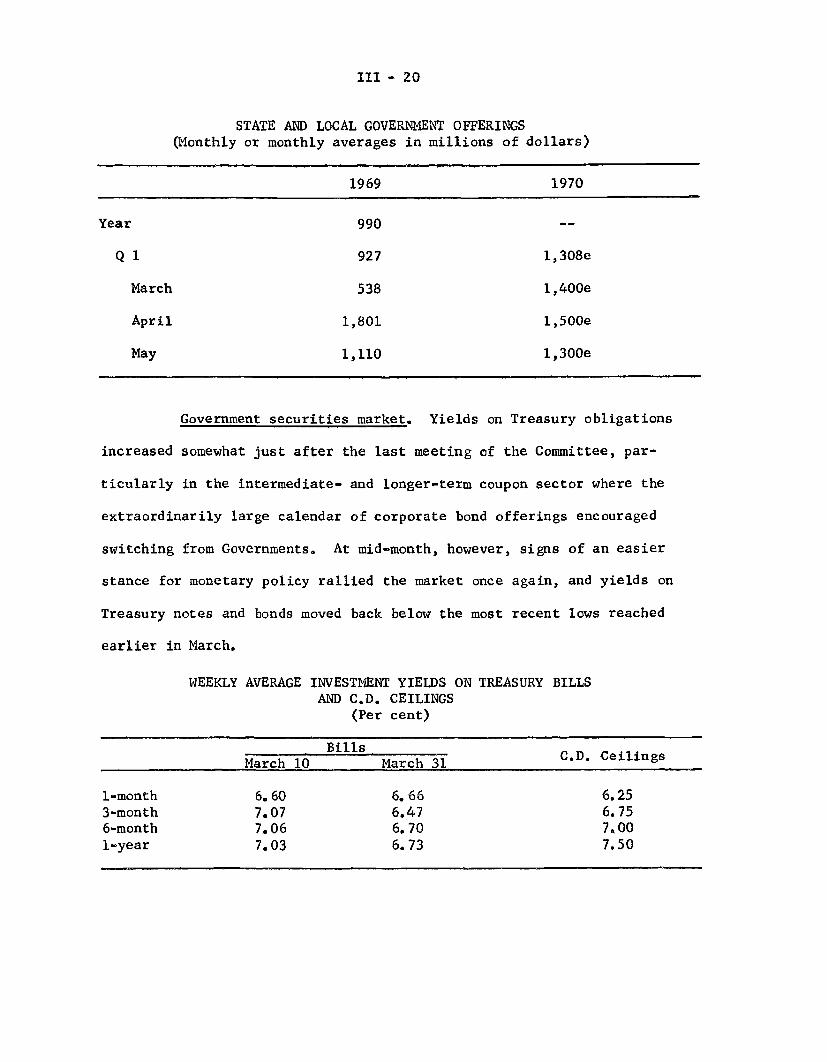
III - 20
STATE AND LOCAL GOVERNMENT OFFERINGS(Monthly or monthly averages in millions of dollars)
1969 1970
Year 990
Q 1 927 1,308e
March 538 1,400e
April 1,801 1,500e
May 1,110 1,300e
Government securities market. Yields on Treasury obligations
increased somewhat just after the last meeting of the Committee, par-
ticularly in the intermediate- and longer-term coupon sector where the
extraordinarily large calendar of corporate bond offerings encouraged
switching from Governments. At mid-month, however, signs of an easier
stance for monetary policy rallied the market once again, and yields on
Treasury notes and bonds moved back below the most recent lows reached
earlier in March.
WEEKLY AVERAGE INVESTMENT YIELDS ON TREASURY BILLSAND C.D. CEILINGS
(Per cent)
Bills
March 10 March 31 C.D. Ceilings
1-month 6.60 6.66 6.253-month 7.07 6.47 6.756-month 7.06 6.70 7,001-year 7.03 6.73 7.50
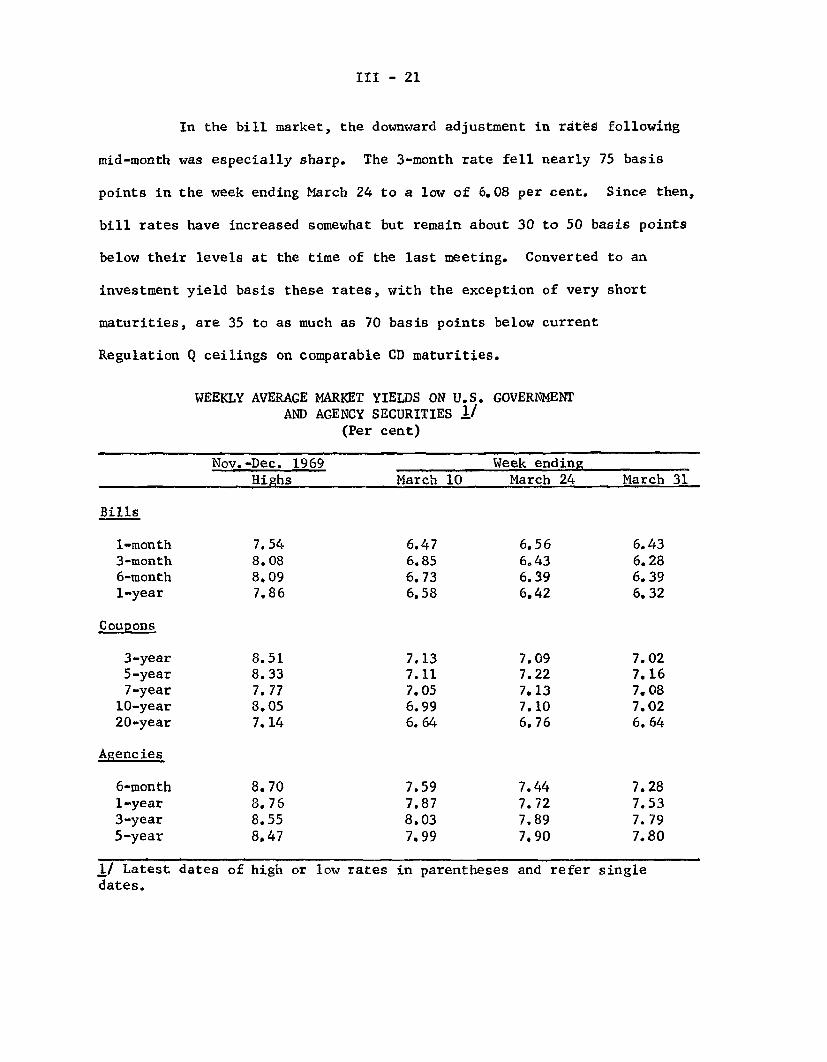
III - 21
In the bill market, the downward adjustment in rates following
mid-month was especially sharp. The 3-month rate fell nearly 75 basis
points in the week ending March 24 to a low of 6.08 per cent. Since then,
bill rates have increased somewhat but remain about 30 to 50 basis points
below their levels at the time of the last meeting. Converted to an
investment yield basis these rates, with the exception of very short
maturities, are 35 to as much as 70 basis points below current
Regulation Q ceilings on comparable CD maturities.
WEEKLY AVERAGE MARKET YIELDS ON U.S.AND AGENCY SECURITIES I/
(Per cent)
GOVERNMENT
Nov.-Dec. 1969 Week endingHighs March 10 March 24 March 31
Bills
1-month 7.54 6.47 6.56 6.433-month 8.08 6.85 6.43 6.286-month 8.09 6.73 6.39 6.391-year 7.86 6.58 6.42 6.32
Coupons
3-year 8.51 7.13 7.09 7.025-year 8.33 7.11 7.22 7.167-year 7.77 7.05 7.13 7.08
10-year 8.05 6.99 7.10 7.0220-year 7.14 6.64 6.76 6.64
Agencies
6-month 8.70 7.59 7.44 7.281-year 8.76 7.87 7.72 7.533-year 8.55 8.03 7.89 7.795-year 8.47 7.99 7.90 7.80
1/ Latest dates of high or low rates in parentheses and refer singledates.

III - 22
On March 19 the Treasury auctioned $1.75 billion of September
Tax Anticipation bills which, given projections of the Treasury's cash
position and the assumption of continued additions to the 6-month and
1-year bill auctions, may be the last Treasury operation to raise new
cash in the current fiscal year. While these bills have been taken into
dealer positions in volume very recently, neither bill or coupon positions
are extraordinarily large by past experience, especially considering that
dealers may have become more willing to position securities in expecta-
tion of further rate declines. In addition to expectations, several
other factors may have added to dealers' willingness to position securities.
First, dealers have generally had little difficulty in moving their
weekly auction awards before the payment date; second, financing costs
in New York have declined by around 60 basis points; and third, a good
part of the dealer financing requirements has been taken up by the
System as part of its reserve supplying operations.
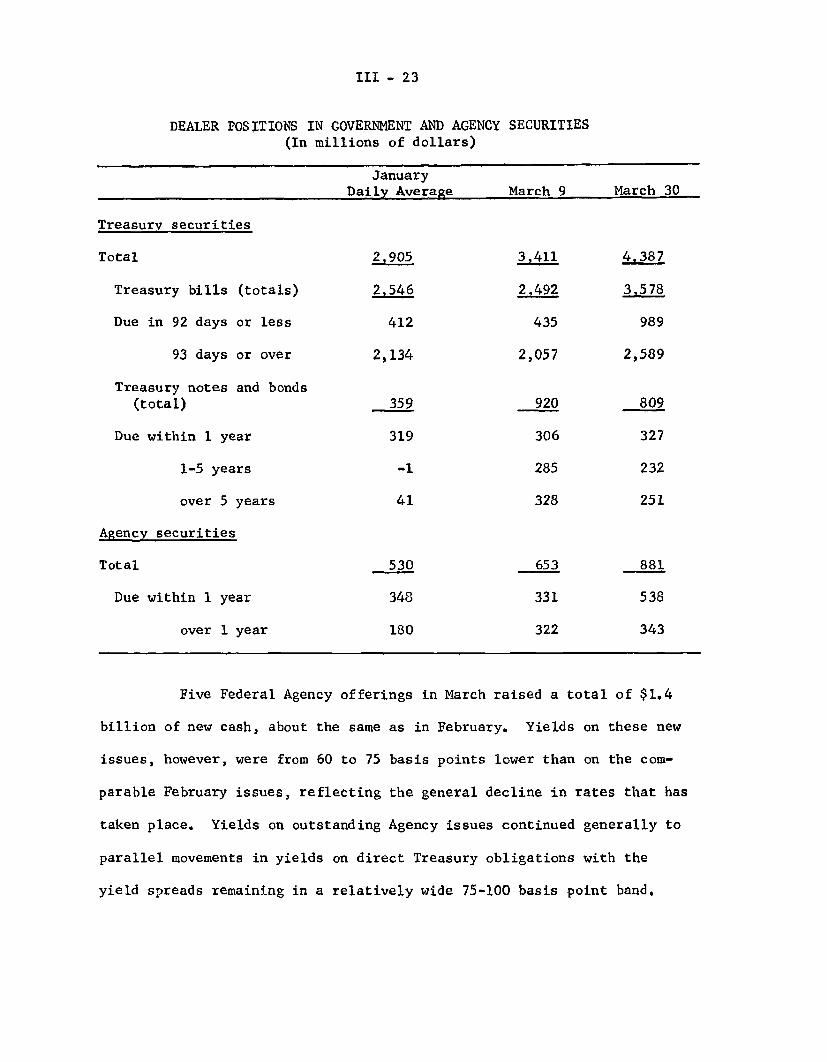
III - 23
DEALER POSITIONS IN GOVERNMENT AND AGENCY SECURITIES(In millions of dollars)
January
Daily Average March 9 March 30
Treasury securities
Total 2,905 3,411 4,387
Treasury bills (totals) 2,546 2.492 3,578
Due in 92 days or less 412 435 989
93 days or over 2,134 2,057 2,589
Treasury notes and bonds(total) 359 920 809
Due within 1 year 319 306 327
1-5 years -1 285 232
over 5 years 41 328 251
Agency securities
Total 530 653 881
Due within 1 year 348 331 538
over 1 year 180 322 343
Five Federal Agency offerings in March raised a total of $1.4
billion of new cash, about the same as in February. Yields on these new
issues, however, were from 60 to 75 basis points lower than on the com-
parable February issues, reflecting the general decline in rates that has
taken place. Yields on outstanding Agency issues continued generally to
parallel movements in yields on direct Treasury obligations with the
yield spreads remaining in a relatively wide 75-100 basis point band.

III - 24
Other short-term credit markets. Along with other rates,
interest rates on private short-term credit market instruments have
decreased significantly during the past month. Bankers' acceptance
rates showed the largest decline--a full percentage point--to
7.13 per cent on all maturities. Commercial paper rates are
generally quoted at 8 per cent on 3-month maturities and 7-1/2 per
cent on 6-month maturities while 1-month finance company paper is
carrying a 7-1/2 per cent rate. Each of these rates, of course, is well
above comparable bill yields and also still somewhat above Regulation
Q ceilings.
SELECTED SHORT-TERM INTEREST RATES(Friday Quotation - Discount Basis)
1969 1970Nov.-Dec. Highs- February 27 March 13 March 26
1-Month
Finance paper
Bankers' acceptancesTreasury bill
3-Month
Commercial paper
Finance paper
Bankers' acceptancesTreasury bill
6-Month
Commercial paper
Finance paper
Bankers' acceptancesTreasury bill
12-month
2/Prime municipals-
Treasury bill
9.009.007.50
9.258.139.008.12
9.258.139.008.10
(12/31)(12/31)(12/31)
(12/31)(12/31)(12/31)(12/30)
(12/31)(12/31)(12/31)(12/30)
6.25 (12/12)7.75 (11/21)
8.388.136.60
8.388.008.136.90
8.257.758.137.00
4.506.66
7.507.756.40
8.257.757.756.76
8,257.757.756.68
4.006.58
7.507.136.50
8.007.637.136.30
7.507.387.136.40
3.806.32
1/ Dates of highs in parentheses; latest date used if high occurred onmore than one date.
2/ Bond yield basis.Source: Salomon Brothers & Hutzler's Bond Market Roundup.
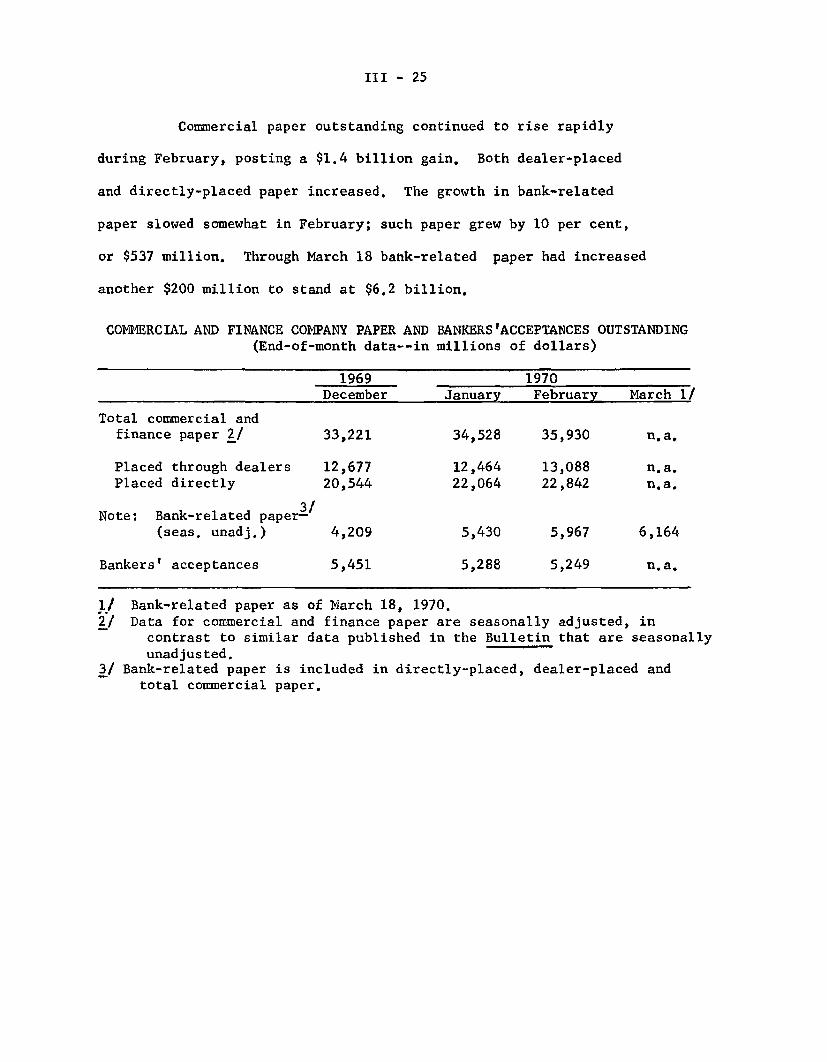
III - 25
Commercial paper outstanding continued to rise rapidly
during February, posting a $1.4 billion gain. Both dealer-placed
and directly-placed paper increased. The growth in bank-related
paper slowed somewhat in February; such paper grew by 10 per cent,
or $537 million. Through March 18 bank-related paper had increased
another $200 million to stand at $6.2 billion.
COMMERCIAL AND FINANCE COMPANY PAPER AND(End-of-month data--in
1969
BANKERS'ACCEPTANCES OUTSTANDINGmillions of dollars)
1970December January February March I/
Total commercial andfinance paper 2/ 33,221 34,528 35,930 n.a.
Placed through dealers 12,677 12,464 13,088 n.a.Placed directly 20,544 22,064 22,842 n.a.
3/Note: Bank-related paper-
(seas. unadj.) 4,209 5,430 5,967 6,164
Bankers' acceptances 5,451 5,288 5,249 n.a.
1/ Bank-related paper as of March 18, 1970.2/ Data for commercial and finance paper are seasonally adjusted, in
contrast to similar data published in the Bulletin that are seasonallyunadjusted.
3/ Bank-related paper is included in directly-placed, dealer-placed andtotal commercial paper.

III -26
Federal finance. The Board staff projection of unified
budget totals, which indicates a $.9 billion deficit is fiscal 1970,
remains unchanged, but some new uncertainties have developed. Corpo-
rate tax receipts in March were below earlier estimates; this could
have been due either to an overstatement of 1969 corporate profits in
the Commerce accounts or to delays in tax collections resulting from
the postal workers' strike. On the expenditures side, the staff
continues to use the Budget Bureau's estimate of current fiscal year
outlays, of $197.9 billion, though pressures for increased outlays have
arisen in several areas including: (1) the recent enactment of a bill
providing about $.1 billion more for veterans benefits than included
in the budget; (2) the fact that sales of certain off-shore oil leases
(a negative expenditure) are running about $.1 billion behind the
budget estimates; and (3) the possibility of a pay raise for postal
workers that is larger than that provided the budget.
The January budget included a 5.4 per cent pay raise for postal
workers, effective retroactively to January 1, 1970, costing about $175
million in the current fiscal year. Since the budget contains $.3
billion for "contingencies" in the current fiscal year, and since HUD
is about $.4 billion behind in projected outlays, some offsets to
the items that are increasing expenditures may be possible. Thus the
estimated outlay total for the current fiscal year still appears
attainable.
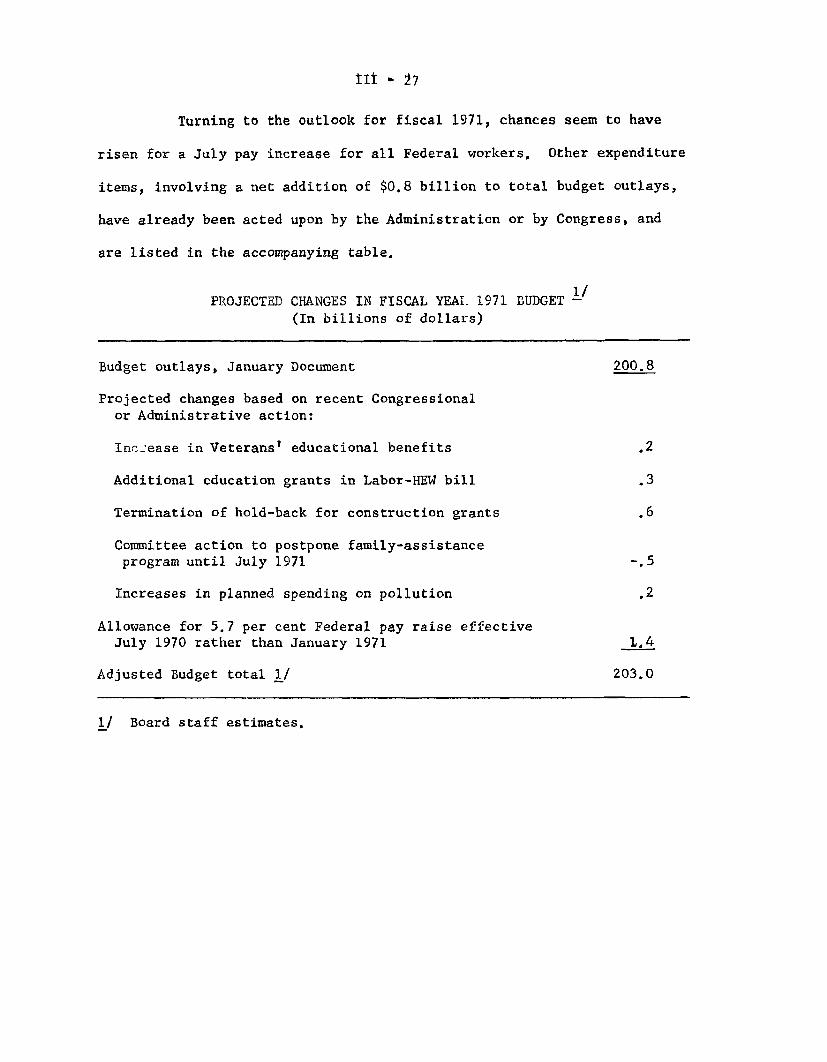
III - 27
Turning to the outlook for fiscal 1971, chances seem to have
risen for a July pay increase for all Federal workers. Other expenditure
items, involving a net addition of $0.8 billion to total budget outlays,
have already been acted upon by the Administration or by Congress, and
are listed in the accompanying table.
PROJECTED CHANGES IN FISCAL YEAR 1971 BUDGET /
(In billions of dollars)
Budget outlays, January Document 200.8
Projected changes based on recent Congressionalor Administrative action:
Increase in Veterans' educational benefits .2
Additional education grants in Labor-HEW bill .3
Termination of hold-back for construction grants .6
Committee action to postpone family-assistanceprogram until July 1971 -.5
Increases in planned spending on pollution ,2
Allowance for 5.7 per cent Federal pay raise effectiveJuly 1970 rather than January 1971 1.4
Adjusted Budget total 1/ 203.0
1/ Board staff estimates.
III - 28
On a NIA basis the staff now projects a $1.4 billion surplus
in the Federal sector in fiscal 1970, followed by a $7.5 billion defi-
cit (at annual rates) during the last half of calendar 1970. The
estimated calendar 1970 deficit is $6.0 billion. The shift toward
deficit during this period appears to be largely the result of low levels
of projected economic growth rather than of discretionary changes in
fiscal policy. The bottom line of the last table in this section shows
the Board's staff estimate of the high employment budget. From the first
to the third quarter of calendar 1970 the high employment budget is now
projected to decline from a surplus of $5.0 to a surplus of $1.4 billion
(thereafter the surplus again increases to $5.0 billion). The $3.6 billion
decline in the high employment surplus compares to a $7.5 billion shift toward
deeper deficit in the projected NIA accounts.1/
The Board staff estimates an end-of-March cash balance of $6.9
billion, and a balance of $7.5 billion at the end of April. While it now
appears that no new financing will be necessary for the remaining months
of the current fiscal year, a continued inflow of corporate tax receipts
at levels below current estimates may alter this outlook.
1/ Conceptually, the high-employment budget measures the NIA surplus(or deficit) that would be obtained if the economy maintained a hypo-thetical level of "high employment." This specified level of employmentmay involve an undesirable rate of inflation, and this consideration makesdifficult both the measurement and interpretation of the high employmentbudget in an inflationary period since the calculated high-employmentsurplus varies substantially with the price assumptions used. TheBoard staff estimates discussed above incorporate as the price assumptionfor the high-employment budget the rate of price increase in theGreenbook GNP projection (presented an Section II) even though thatprojection has a rising unemployment rate. An assumption of greaterinflation in the hypothetical high employment economy would enlargereceipts, and hence the calculated surplus, and thus exaggerate theimplied restraining influence of fiscal policy.

III - 29
PROJECTION OF TREASURY CASH OUTLOOK(In billions of dollars)
March April May June
Borrowing operations
New cash raised
Unspecified new borrowing -- -- -- --
Weekly and monthly bills .8 .7 .3 .2
Tax bills 3.5 -- -- --
Coupon issuesOther (agency, debt repayment, etc.) -1.9 -4.9 - .6 -4.5
Total net borrowing from public 2.4 -4.2 - .3 -4.3
a/Plus: Other net financial sources- 1.0 -1.1 - .9
Plus: Budget surplus or deficit (-) -3,1 5.9 -4.2 8.7
Equals: Change in cash balance .3/ .6 -3.5 3.5
Memoranda: Level of cash balanceend of period 6.9b / 7.5 4.0 7.5
Derivation of budgetsurplus or deficit
Budget receipts 13.7 23.7 13.2 24.4Budget outlays 16.8 17.8 17.4 15.7
a/ Checks issued less checks paid and other accrual items.b/ Actual

FEDERAL BUDGET AND FEDERAL SECTOR IN NATIONAL(In billions of dollars)
INCOME ACCOUNTS
Fiscal 1970 e/Jan. F.R.
Budget Board
Fiscal 1971 d/JanuaryBudget
Calendar Year:
1969 1970 1
s Calendar Quarters1969 I 1970 I/IV I II III IV
Federal Budget
(Quarterly data, unadjusted)Surplus/deficitReceiptsOutlays
Means of financing:Net borrowing from the publicDecrease in cash operating balanceOther 3/
Cash operating balance, end of period
National Income Sector
(Seasonally adjusted annual rate)Surplus/deficit
ReceiptsExpenditures
1.5199.4197.9
-2.6
n.a.
-. 9197.0197.9
1.6 2 /
-1.6.9
7.5
3.6201.7198.1
High employment budget surplus/deficit / n.a.
1.4200.0198.6
6.1
1.6205.4203.8
1.3202.1200.8
-1.2
n.a.
5.3195.6190.3
-4.1- .6
-. 7
-4.4196.6201.0
-5.742.948.5
-3.244,948.1
3.5 5.1 2.1-- 1.3 -1.6
.9 -.8 2.7
5.3 5.3
9.6201.6192.0
n.a.
-6.0197.6203.6
9.5 3.4
10.461.350.9
-8.8
-. 6-1.0
-5.247.752.9
4.21.0--
-6.442.749.'
6.01.2-.8
5.3 6.9 7.5 6.5 5.3
6.7203.3196.7
-1.7196.7198.4
-7.1198.7205.8
-9.2195.8205.0
9.7 5.0 2.0 1.4
-6.1199.0205.1
5.0
e--Projected.n.a,--Not available1/ Estimated by Federal Reserve Board Staff.2/ Excludes effect of reclassification of $1.6 billion of CCC certificates of interest from Budget transactions to
borrowing from the public.3/ Includes such items as deposit fund accounts and clearing accounts.
I _ _ _ _ _ _ _

FINANCIAL DEVELOPMENTS - UNITED STATESBILLIONS OF DOLLARS, SEASONALLY ADJUSTED, RATIO SCALE
BANK RESERVES BANK CREDIT
TOTAL
1968
CREDIT PROXY
1970
DEPOSITS AND ALLNONDEPOSIT SOURCES
DEPOSITS AND FEB 3036
EURO-DOLLARSFEB 296 1
MONEY AND TIME DEPOSITS
MONEY
TIME DEPOSITSFEB 1920
*
SII I I ll
I I I 1111111
I I
ARITHMETIC SCALENSA
BORROWEDFEB 109
EXCESS FEB 23
1970 1968
BUSINESS LOANSFEB 1045
OTHER SECURITIESFEB 708
US GOVT. SECURITIESFEB 49 4
* NEW SERIES
1968 1970
SAVINGS ACCOUNTS
SAVINGS & LOAN ASSN.FEB 1342
MUTUAL SAVINGS BANKSFEB 672
r r ' i f 'lllll"lllllrlllllr
3/31/70fE-C 1
1970

FINANCIAL DEVELOPMENTS - UNITED STATES
NET FUNDS RAISED NONFINANCIALSECTORSSEASONALLY ADJUSTEDANNUAL RATE
LESS FEDERALGOVERNMENTola 85 I
1968 1970
1968 1970
NEW SECURITY ISSUES alCORPORATE
1970MAR 33 1/ 969
1968I I I I I I I
STATE AND LOCAL GOVERNMENT
1970 1968MAR 1 4
1969
MAR. JUNE
SHARES IN FUNDS SUPPLIED
NONBANK FINANCE017 329
v--------a------ uCOMMERCIAL BANKSQB 160
II I I I 50
PRIVATE NONFINANCIALGQ 470 -50
+0
I I I 1 501968 1970
YIELDS LONG-TERM PER CENT
-8
-6
-4
I I I~ I9, 1 I I 11970
STOCK MARKET140 RATIO SCALE
TOTAL12_ CUSTOMER CREDIT
JAN 90
100
COMMON STOCK PRICES- 1941 310 MAR 886
-o10
8 r lI 1i1 11 1 1 : 1
MILLIONSOFSHARIRATIO SCALE VOLUME
N Y.S.E., DAILY AV.
I I 1
SEPT. DEC. 1968 1970
PER CENT
-50
+
HOUSEHOLDS AND BUSINESS
NET FUNDS RAISEDQI746
NET CAPITAL OUTLAYSQIV 76 9
BIL $
3/31/70III-C-2
I
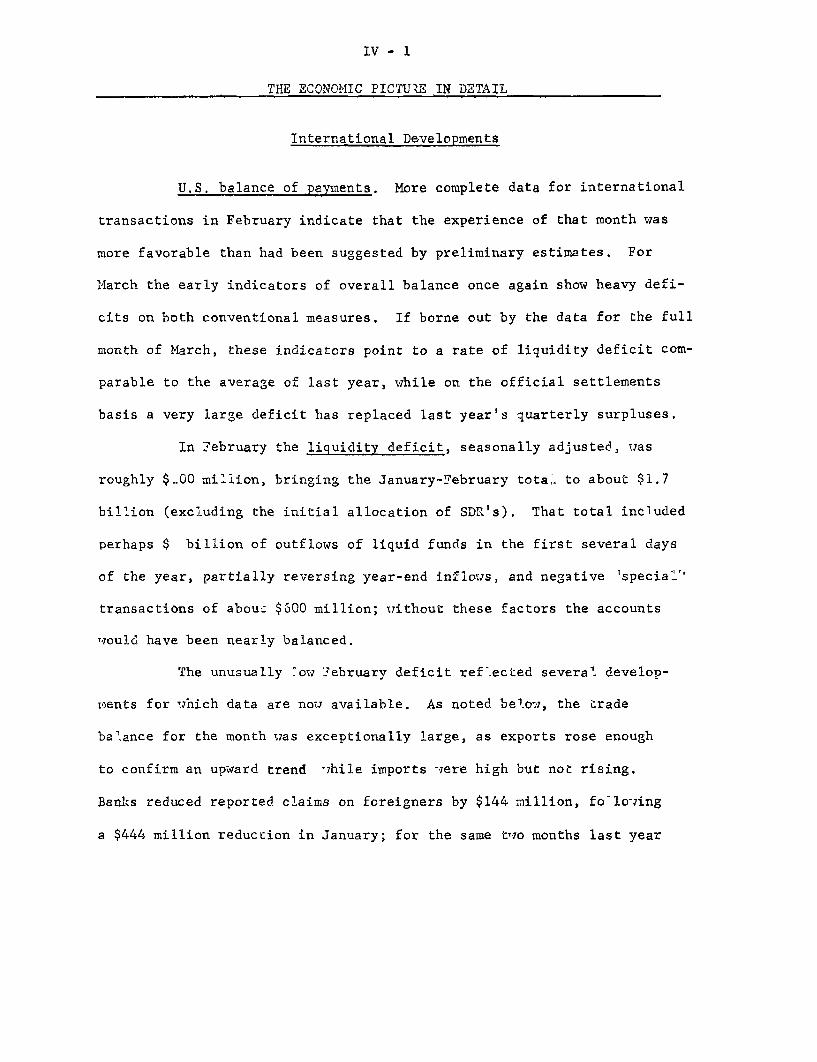
IV - 1
THE ECONOMIC PICTURE IN DETAIL
International Developments
U.S. balance of payments. More complete data for international
transactions in February indicate that the experience of that month was
more favorable than had been suggested by preliminary estimates. For
March the early indicators of overall balance once again show heavy defi-
cits on both conventional measures. If borne out by the data for the full
month of March, these indicators point to a rate of liquidity deficit com-
parable to the average of last year, while on the official settlements
basis a very large deficit has replaced last year's quarterly surpluses.
In February the liquidity deficit, seasonally adjusted, was
roughly $100 million, bringing the January-February total to about $1.7
billion (excluding the initial allocation of SDR's). That total included
perhaps $ billion of outflows of liquid funds in the first several days
of the year, partially reversing year-end inflows, and negative 'special'
transactions of about $600 million; without these factors the accounts
would have been nearly balanced.
The unusually low February deficit reflected several develop-
ments for which data are now available. As noted below, the trade
balance for the month was exceptionally large, as exports rose enough
to confirm an upward trend while imports were high but not rising.
Banks reduced reported claims on foreigners by $144 million, following
a $444 million reduction in January; for the same two months last year

IV - 2
the inflow was $330 million. Foreign transactions in U.S. securities in
February resulted in small net purchases of corporate stocks, reversing
the small net liquidation in January, and there were further sizable pur-
chases of U.S. corporate bonds and issues of U.S. Govt. agency issues.
The inflow to purchase corporate stocks was still much below last year's,
and below the average projected for 1970. Outflows of U.S. capital to
purchase foreign bonds were again comparatively small in February, and
there was also a further net inflow out of foreign corporate stocks.
In March, the early indicators suggest a reversion to a large
deficit on the liquidity basis, though as usual little explanatory infor-
mation is available. One factor may be somewhat larger U.S. purchases
of foreign securities, especially Canadian bonds, and bank-reported
claims on foreigners may have stabilized. It will not be known for
some time whether the errors and omissions item, which was a major factor
in last year's deficit, registered receipts in the early months of the
year -- as in the final quarter of 1969 -- tending to reduce the liquidity
deficit.
On the official settlements basis the deficit for the year
through March 25 has totalled about $3 billion, not seasonally adjusted,
and with seasonal adjustment the deficit would be considerably larger.
A heavy deficit on this basis was registered in February ($1 billion,
not seasonally adjusted) and there appears to have been an even larger
amount in March. These deficits reflect, in addition to the factors
responsible for the liquidity deficit, large reductions in liabilities
IV - 3
of U.S. banks to their foreign branches. Early in January these lia-
bilities rose, reflecting year-end adjustments, but from mid-January
through the 25th of March these liabilities were reduced by over $1.5
billion. Some of this reduction may have been the result of shifts
of foreign official accounts out of Euro-dollars into CD's. This re-
presents a reversal of the buildup of foreign official Euro-dollar
deposits that is believed to have occurred in 1968 and most of 1969.
The total increase in foreign official CD holdings since mid-January
has been about $1 billion. Data presently available do not provide
a basis for estimating how much of this increase came from existing
Euro-dollar accounts rather than representing fresh accruals to for-
eign monetary reserves invested in CD's rather than in U.S. Treasury
bills or other instruments.
U.S. foreign trade. The export surplus, virtually nil in
January, expanded very sharply in February as exports climbed steeply
and imports fell back from the high level of January. For January-
February together the export surplus was nearly $2-1/2 billion at an
annual rate (balance of payments basis), compared with $1.4 and $1.8
billion, respectively, in the third and fourth quarters of 1969.
The strong upturn in February exports should be viewed with
guarded optimism since large monthly variations are not unusual in U.S.
trade movements. It does appear, however, that -- on average -- exports
are tilting up again following a pause toward the end of last year. At
the same time the pace of imports appears to be flatter than for exports,

IV - 4
although the absolute level of imports is still very high. Price ad-
vances for imports are a factor in sustaining the value of imports.
One of the more significant elements in the rise in exports
from January to February was the strong increase in machinery shipments --
the first major advance since August 1969. Part of this better showing
may result from the ending of the G.E. strike, and part from under-
reporting in January and over-reporting in February in the Census Bureau
tabulations of these shipments. In addition, the response in U.S.
machinery exports to the heavy demand abroad is probably being helped
by the leveling off in new domestic orders for business equipment and
the stabilization in the ratio of unfilled orders to shipments.
Exports in January-February were $41.3 billion at an annual
rate (balance of payments basis), about 5 per cent greater than in the
fourth quarter of 1969. The entire increase was in nonagricultural
commodities. Although the sharp pickup in exports of agricultural
products in February arrested the downward drift of the preceding
three months, exports of these commodities in January-February com-
bined were marginally below the high rate of shipments in the fourth
quarter. Soybean exports continued to expand while shipments of
cotton, both commercially and under the P.L. 480 program, also rose
strongly. These were offset by a slump in tobacco exports.
About one-fourth of the increase in exports of nonagricultural
products in January-February was in greater deliveries of commercial
aircraft. Initial deliveries of the Boeing 747 were made in mid-March

IV - 5
and additional deliveries of these planes should serve to support the
value of aircraft exports at a high level in the coming months. Sales
of coal to Japan and of steel to Europe continued to expand. As noted
earlier, shipments of machinery rose very sharply in February, with
much of the increased deliveries going to Europe and Japan. Deliveries
of automotive equipment to Canada in January-February were lower as
automotive production there was reduced further in line with develop-
ments in the U.S. auto market.
By areas, the largest increases in exports from the fourth
quarter to January-February were in shipments to Japan and to conti-
nental Europe, particularly the Common Market countries. Smaller gains
were recorded in exports to Canada, other than in automotive equipment,
and Latin America. There was a moderate decrease in shipments to the
United Kingdom.
Imports in January-February were $38.9 billion at an annual
rate, balance of payments basis, 3-1/2 per cent higher than in the
fourth quarter of 1969. Arrivals of foodstuffs were up further, buoyed
by high coffee prices and greater quantities of meat. Imports of non-
food consumer goods in total were higher, with a further decline in
durable types -- TV, radio, etc. -- more than offset by substantially
increased receipts of apparel and other nondurable items. The advances
in food and nondurable consumer goods imports more than offset fairly
sharp declines in imports of industrial materials (steel, copper, and
paper) and automobiles and parts, the latter reflecting lower shipments

IV - 6
from Canada. Sales of European and Japanese cars have been impressively
strong so far this year, particularly in view of the weakening in total
domestic car sales. The strength in sales of the foreign cars probably
reflects the increased popularity of "compact" and smaller cars. Sales
of such cars were about 15 per cent of total U.S. car sales in the first
two months of the year, compared with less than half that percentage in
the year-earlier period.
Foreign exchange markets. The major developments in foreign
exchange markets during March, as in February, centered on sterling,
the Italian lira and the Canadian dollar. Most foreign exchange rates
responded to the decrease in the U.S. prime rate late in the month by
moving higher against the dollar.
Demand for sterling was strong throughout March and particu-
larly strong early in the month, reflecting very tight financial markets
in Britain at a time of seasonally heavy tax payments. The sterling ex-
change rate also rose in reaction to the prospect of lower interest rates
in the United States. The Bank of England purchased about $750 million
in exchange markets during March, compared with almost $900 million in
February, and again repaid a considerable amount of debt. It retired
all remaining debt under the November 1967 credit package except $225
million of swap debt to the U.S. Treasury. Total outstanding Bank of
England short-term debt to the U.S. Treasury at the end of March is
$435 million, $260 million of which is guaranteed sterling. In ad-
dition, the Bank of England has repaid all but $75 million of the $250

IV - 7
million borrowed from the BIS in early February to finance the repay-
ment of outstanding swap drawings on the System.
Demand for the Canadian dollar was strong throughout most
of March, and with the exchange rate at its upper limit, the Bank of
Canada purchased almost $150 million, compared with $175 million the
previous month. Demand for Canadian currency reflects apparent im-
provement in the current account in the first quarter as well as
substantial conversion of proceeds of bond issues sold in foreign
markets. On March 30 the Bank of Canada removed the quantitative
ceiling it had imposed last summer on swapped deposits, and the
Canadian exchange rate moved below its upper limit for the first
time in three weeks.
Selling pressure on the Italian lira moderated substantially
during March. The Bank of Italy sold only $200 million in the exchange
market, compared withmonthly losses averaging over $500 million in
January and February. Several factors probably account for the recent
favorable development in the Italian exchange situation. Interest rates
have moved up sharply in Italy and are at levels more competitive with
those outside the country. There have been substantial Italian issues
of long-term bonds on the international market, especially for state-
owned Italian enterprises. Italy is moving into a period when its
balance of payments is seasonally less unfavorable than in January
and February; and finally, in the past few days prospects for formation
of a new government have improved although the political situation re-
mains very unstable.
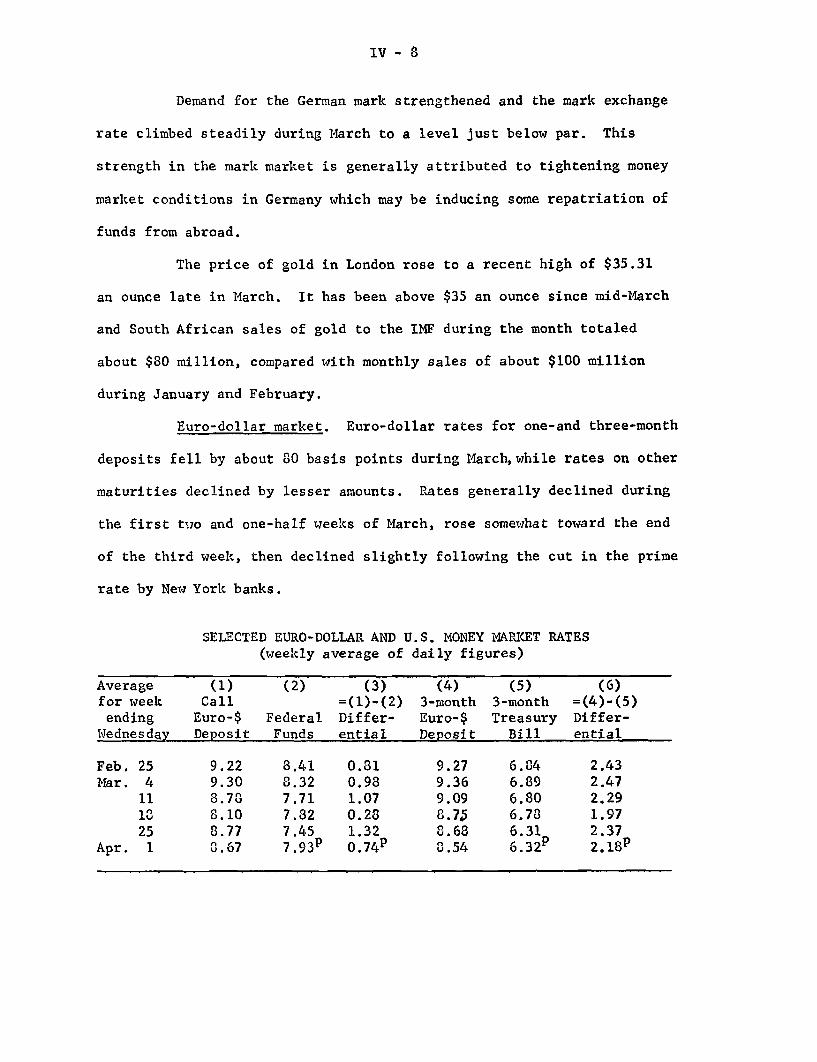
IV - 8
Demand for the German mark strengthened and the mark exchange
rate climbed steadily during March to a level just below par. This
strength in the mark market is generally attributed to tightening money
market conditions in Germany which may be inducing some repatriation of
funds from abroad.
The price of gold in London rose to a recent high of $35.31
an ounce late in March. It has been above $35 an ounce since mid-March
and South African sales of gold to the IMF during the month totaled
about $80 million, compared with monthly sales of about $100 million
during January and February.
Euro-dollar market. Euro-dollar rates for one-and three-month
deposits fell by about 80 basis points during March,while rates on other
maturities declined by lesser amounts. Rates generally declined during
the first two and one-half weeks of March, rose somewhat toward the end
of the third week, then declined slightly following the cut in the prime
rate by New York banks.
Averagefor weekending
Wednesday
Feb. 25Mar. 4
111825
Apr. 1
ED
SELECTED EURO-DOLLAR AND U.S. MONEY MARKET RATES(weekly average of daily figures)
(1) (2) (3) (4) (5)Call =(1)-(2) 3-month 3-month =(uro-$ Federal Differ- Euro-$ Treasury DiJDeposit Funds ential Deposit Bill eni
9.22 8.41 0.81 9.27 6.849.30 8.32 0.98 9.36 6.898.78 7.71 1.07 9.09 6.808.10 7.82 0.28 8.75 6.738.77 7.45 1.32 8.68 6.313.67 7.93 P 0.74P 3.54 6.32 p
(6)4)-(5)Efer-tial
2.432.472.291.972.372.18P
IV - 9
Liabilities of head offices of U.S. banks to their own foreign
branches declined by $1.1 billion from February 25 to March 25, reaching
a level of $12.5 billion. Foreign official time deposits at head offices
of U.S. banks increased by only $365 million during this period. Even
if all of this represents a shift out of Euro-dollars by foreign official
institutions -- which is doubtful -- it is clear that most of the large
decline in liabilities to foreign branches represented a net decline in
demand on the Euro-dollar market by U.S. banks.
During March demands on the Euro-dollar market from other sources
were undoubtedly intensified by the tax-payment squeeze on the sterling
money market and by the tightening of financial markets in Germany and
Italy.
Swiss commercial banks sold $368 million to the BNS
during March in short-term franc-dollar swaps, undertaken for quarter-
end window dressing. The dollar proceeds of these swaps were placed in
the Euro-dollar market by the BNS with little net effect on conditions
in that market.

IV - 10
Price developments in major industrial nations. Since mid-1969,
upward pressures on prices have intensified in all major industrial nations.
Germany, France, Italy, Belgium and Japan have been experiencing
rapidly rising levels of demand and are all undergoing wage and price
increases much above accepted norms. In the United Kingdom, where there
has been only a moderate growth in demand in recent months, wholesale and
consumer prices have risen mainly because of substantial increases in
labor costs. The change in the parity of the French franc in 1969
contributed to a rapid increase in wholesale prices in France, and the
WHOLESALE PRICES, MANUFACTURED GOODSa/(1963 = 100)
Average Per cent clange (annual rate)annual Index Within quarter Dec.'68 Index
increase Dec. 1969 to latest1965-68 1968 Q-1 Q-2 Q-3 Q-4 Dec.'69 month
France-b 0.2 108.9 5.5 8.3 10.3 14.2 9.9 120.3 (Jan.)Belgium 1.3 110.7 4.3 1.8 6.4 11.2 6.1 118.3 (Jan.)ItalyS/ 0.6 106.3 3.2 8.0 7.6 8. 8 / 6.1 e / 112.6 (Oct.)Germany- 1,0 99.1 2.4 2.4 5.2 8.6 4.7 105.8 (Feb.)U.K. 2.2 113.3 3.9 3.5 5.5 4.8 4.5 118.8 (Jan.)
U.S. 2.0 109.8 6.2 3.6 2.5 5.0 4.3 115.7 (Mar.)- /
Japan 0.8 103.5 1.2 3.9 5.0 5.7 4,0 108.2 (Jan.)Canada 2.3 113.2 8.3 3.4 -0.3 2.3 3.3 117.5 (Feb.)Netherlands 2.7 118 -13.6 h 0.0 3.5 7.0 2.61/ 117 (Dec.)
a/ Countries are listed in descending order of price increases betweenDecember 1968 and December 1969.b/ Intermediate goods. c/ Non-agricultural products.d/ Change in October at annual rate. e/ October 1969 over October 1968.f/ Producers' prices of industrial products. g/ Provisional.h/ Distortion due to shift from turnover tax to value-added tax. Before
1969, prices included turnover tax; since, indirect tax has been excluded.i/ January to December 1969 at annual rate.

IV - 11
revaluation of the German mark added to the upward pressure on
wholesale prices in Switzerland, the Netherlands, Belgium and
Austria.
Recent price increases abroad may have prevented a further
weakening in the relative price competitiveness of the United States
during 1969, despite the acceleration in U.S. price increases in the
last quarter of the year.
Wages and prices are likely to continue advancing at a rapid
rate throughout most of 1970 in all the major European countries and
Canada. Large wage settlements in Italy, Germany and the United Kingdom
could result in unit labor costs rising by as much as 7 per cent or more
in those countries.
CONSUMER PRICES, GOODS (EXCEPT FOOD) AND SERVICESa/(1963 = 100)
Average Per cent change (annual rate)annual Index Within quarter Dec. '68 Indexincrease Dec. 1969 to latest1965-68 1968 Q-1 Q-2 Q-3 Q-4 Dec. '69 month
Netherlands 5.3 128.1 23.7/ 3.8 0.3 1.7 7.5 137.3 (Jan.)
U.S. 2.9 114.5 6.9 4.9 5.0 5.8 5.8 123.8 (Feb.)
Japan 4.7 128.5 -1.2 9.0 4.9 8.1 5.3 135.6 (Jan.)France 3.6 122.9 7.5 3.8 4.7 4.7 5.3 130.6 (Feb.)Canada 3.4 119.0 4.6 7.5 2.2 4.1 4.7 125.0 (Feb.)
Italy 3.2 121.8 4.3 1.9 4.5 8.6£/ 4.2d/ 126.9 (Nov.)U.K. 4.1 123.9 3.6 3.2 2.5 6.3 4.0 130.0 (Jan.)Belgium 3.8 122.7 4.7 2.0 3.5 5.1 3.9 128.2 (Feb.)Germany 3.2 117.8 3.7 0.3 1.7 6.0 3.0 122.9 (Feb.)
a/ Countries are listed in descending order of price increases betweenDecember 1968 and December 1969.b/ Introduction of value-added tax. c/ Through month of November only.d/ Price increase between November 1968 and November 1969.
IV - 12
There are as yet no signs of an easing of demand in France and
Belgium, although consumer prices and wages in France are likely to increase
less than they did last year. The Dutch have postponed planned increases
in indirect taxes to January 1971, but strong demand and union wage
pressures are likely to cause continued high rates of price inflation.
Although the trend of very rapid wage increases is expected to continue
in Japan, the Government hopes for a slowing in the pace of price advances.
Cost push pressures are expected to remain strong in Canada.
In Germany, price inflation is now the major economic issue.
The non-food cost-of-living index, which has increased on average by about
3 per cent since 1965, rose at an annual rate of over 6 per cent in the
six months to February. During this period, producers' prices for industrial
products increased at the exceptionally rapid rate of over 9 per cent,
reaching a level more than 6 per cent higher than in February 1969.
Sustained high demand pressing against supply limitations
continues to be a major source of pressure on prices, but cost-push elements
are becoming increasingly important. Actual hourly earnings in the fourth
quarter of 1969 were about 13 per cent higher than a year earlier and
are expected to rise by about 11 per cent this year. Although labor
productivity in industry continues to show remarkable growth despite
the scarcity of skilled labor and a high degree of capacity utilization,
unit labor costs could nevertheless rise by as much as 8 per cent this
year. (Unit labor costs had remained virtually stable from mid-1967
until the last quarter of 1969.) Favorable demand conditions have

IV - 13
encouraged German producers to pass on higher costs through price
increases, while German labor has been seeking large wage increases
to compensate for its relative quiescence during the 1966-67
recession and for current and expected increases in the cost of living.
After the Brandt Government failed to take further fiscal action, the
Bundesbank increased its discount rate on March 6 by an unusually large
1-1/2 percentage points to a post-war high of 7-1/2 per cent in an effort
to align the discount rate more closely with market rates and to underline
its determination to counter inflationary expectations.
After the revaluation of the mark last October, German exporters
could have lowered the mark prices of their products to mitigate the impact
of the parity change on their price competitiveness in foreign markets.
German export prices, however, rose 1.7 per cent in terms of marks between
October and January, reflecting in part strong cost pressures in such
important export sectors as capital goods and the continuing high foreign
demand for German products. On the import side, the mark prices of foreign
goods increased by about 2 per cent between October and February, after
a decline of slightly over 3 per cent in October as a result of revaluation.
Although recent movements in new orders--particularly foreign--
could point to a leveling off of Germany's economic boom, continued large
industrial order backlogs and the underlying strength of consumer demand
indicate that German productive capacity should be reasonably fully
utilized for some time to come. The German cost of living is likely to
increase this year by considerably more than in any year since 1966, despite
decreases in the costs of foods and raw materials resulting from revaluation.
IV - 14
Further dampening measures are nevertheless not very probable, and the
German authorities appear determined to avoid a repetition of the recession
of 1966-67.
Upward pressures on prices intensified somewhat in the United
Kingdom during the second half of 1969. Prices of wholesale manufactures
and consumer goods rose at an annual rate of 4 to 5 per cent. The major
cause has been substantial increases in labor costs, which will continue
this year. Higher indirect taxes also contributed to the 1969 increase
in consumer prices.
Average earnings in manufacturing rose about 9 per cent in 1969.
This rise was apparently not connected with any marked increase in the
demand for labor. The seasonally adjusted unemployment rate actually
increased slightly during this period. A possible explanation is a
combination of aggressive union bargaining and the Government's reluctance
to enforce its incomes policy--some of the largest settlements concluded
in the latter months of 1969 were in the public sector. The Government
has indicated that it will offer little resistance to large wage settlements
this year,as national parliamentary elections approach. In the second
half of 1969, wage settlements (together with wage drift) produced
increases in average earnings at all per cent annual rate. This trend
is likely to continue this year. A sharp increase in unit labor costs
will result, as productivity is expected to increase by only about
3 per cent.

IV - 15
Whether or not there is a considerable lag before the effects
of this wage explosion are felt on prices, British efforts to maintain
recent balance of payments gains will be adversely affected. If domestic
prices lag behind wages, real income will rise rapidly, diverting resources
from the export sector to consumption. If export prices keep up with
wages, British exports will become less competitive. Between December 1968
and the end of last year, export prices in sterling rose about 5 per cent,
a somewhat lower rate than prevailed in the 12 months immediately following
the devaluation of the pound in November 1967.
In 1969, price increases accelerated in France, particularly
at the wholesale level. There are as yet no indications that inflationary
pressures will moderate significantly this year.
The pull of rapidly growing demand has been the major influence
on French prices. The investment sector has been consistently strong
and exports have risen markedly since the devaluation of the franc last
August. Consumer demand moderated slightly towards the end of the year,
partly because of installment credit restrictions in effect since last
autumn. Higher prices for imported goods resulting from devaluation
contributed substantially to the large increase in wholesale prices, but
their impact on retail prices has so far been slight. Franc prices
of imports have risen by roughly 14 per cent since devaluation, more
than the parity change, which suggests that foreign suppliers have increased
the foreign currency prices of their products in France. Wage rates
IV - 16
increased 9 per cent in 1959, and, since automatic escalator clauses are
becoming increasingly common in new wage settlements, are likely to
continue to rise rapidly. However, productivity has been rising rapidly,
perhaps as a result of the very high rate of fixed investment in industry,
and the rise in unit labor costs has been held to moderate proportions.
The French authorities made strenuous efforts to keep the
increase in retail prices below 6 per cent in 1969, resorting to such
measures as a temporary price freeze after devaluation and postponement
until January of price increases by nationalized industries. Prices in
the private sector have also been regulated by a system of voluntary
controls. Although prices of goods and services in both the public and
private sectors rose in January, the authorities sought to mitigate the
impact on the retail price index by reducing substantially the rate of
the value-added tax on processed foods, which have a sizable weight in
the index. Price increases were nevertheless unexpectedly sharp in
January and February, with consumer prices rising nearly 1-1/2 per cent
in two months.
The French Government estimates that consumer prices will rise
by 5.4 per cent (annual rate) in the first half of this year. This rate
is expected to slacken to 3.4 per cent in the July-December period. This
slackening is based upon an expected slowdown in the rate of economic
growth, which has yet to be signaled by available indicators. Furthermore,
unemployment is very high in France by historical standards,despite the

IV - 17
large number of unfilled job vacancies, and further price increases
could provoke a recurrence of social unrest. Thus, the authorities
will clearly not be able to hold the 1970 rise in retail prices to the
Government's target of 4 per cent.
In Italy, demand pressures have caused the rate of price
inflation to accelerate in recent months, most markedly at the wholesale
level. The overall increase in prices in 1970 is likely to be considerably
higher than in 1969, as the large wage increases granted in the November
and December labor settlements will be heavily concentrated in the current
year. The GNP deflator may rise 5 or 6 per cent this year, nearly double
the 1969 rate of increase.
Wholesale prices, which began to rise rapidly early last year,
have increased at a sharply accelerated rate since last October. The
increase in the general index from October to January was at an annual
rate of 13 per cent and in January the index was nearly 8 per cent higher
than a year earlier. Price increases in 1969 were largest in the metals
sector--for example, 25 per cent for steel products. Consumer prices have
risen at a less pronounced rate. The overall consumer price index was
4.3 per cent higher in December than a year earlier, compared with a
1 per cent increase in the year to December 1968.
The widespread labor unrest that plagued Italy last autumn
resulted in wage settlements that are expected to raise average hourly
wage rates in industry by 16 per cent in 1970. Although overall

IV - 18
productivity is projected to increase very substantially--by 7 per cent--
industrial unit labor costs are likely to rise by much more than the
estimated 2-1/2 to 3 per cent rise in 1969.
Strong price pressures persist in the Netherlands. The cost-
of-living index rose 7.5 per cent in 1969, the largest annual increase
since 1951. During the first two months of this year, it increased an
additional 1.2 per cent. Important factors have been the move from a
turnover to a value-added system of indirect taxation at the beginning
of 1969, a high level of domestic and foreign demand, and continuing
large increases in wages. An increase in consumer prices of more than
6 per cent in the first 4 months of 1969 led to the imposition of a
price freeze from April to September.
Demand and cost pressures are likely to remain intense the rest
of this year. An increase in the value-added tax rates has been postponed
until January 1971, and the authorities hope to keep the rise in consumer
prices to no more than the 4 per cent projected by the Central Planning
Bureau. Tight credit and budgetary policies, as well as selective price
controls, are being used to contain the price increases, but the major
problem is to keep the increasingly militant labor unions from gaining
wage increases larger than the Government deems suitable.
A strong, broadly based expansion in Belgium has caused an
acceleration in the rates of increase of both wholesale and retail prices
since the middle of last year. The rise in wholesale prices of manufactures
IV - 19
was particularly sharp for machinery, other finished metal manufactures
and finished chemical products. Demand pressures are expected to remain
strong in 1970 and the GNP deflator is projected to rise at the 1969 rate
of about 4 per cent.
During the fourth quarter of 1969, wholesale prices of imported
goods in Switzerland increased by about 3-1/2 per cent, while the overall
index rose by 2 per cent. The rise in consumer prices, on the other
hand, continues to be quite moderate, as seen in the 2.3 per cent year-to-
year increase in January. Domestic demand is strong, and consumer prices
are likely to rise faster this year.
Since early 1959,Japan has been experiencing some of the strongest
upward price pressures in years, with no signs of abatement. The primary
factors behind this price rise have been strong domestic and foreign demand
pressing against capacity, increased labor costs in low productivity
sectors of the economy, and increased costs of imports. The largest
wholesale price increases have been for nonferrous metals, steel, and
foodstuffs. Both export and import prices rose at sharply accelerated
rates during 1969, with the terms of trade moving slightly in Japan's
favor. The Bank of Japan raised its basic discount rate last September,
and since then has been acting to restrain what it considers to be an
excessive pace of increase in domestic demand. However, bank credit
has thus far been allowed to continue rising quite rapidly.
In Canada it is not yet clear whether there has been any slowing
in the rate of price increase. The GNP deflator rose by only a 2 per cent
annual rate in the fourth quarter compared with 4.8 per cent in the

IV - 20
third quarter. The consumer price index (excluding food) rose at a
substantially slower pace than in the preceding three months. The
wholesale price index for manufactured goods, however, increased at an
accelerated rate in the three months ending in February. Unit labor
costs rose by an average 6.4 per cent in 1939, with average wages per
person employed in the private non-farm sector of the economy up by 6.9 per
cent while labor productivity increased by a mere 0.5 per cent.
The authorities have recently supplemented their restrictive
aggregate demand policies with "voluntary" guidelines on prices, and
consumer credit controls proposed in the Budget should become effective
soon. The Government is forecasting a rise in the GNP deflator for
1970 of just under 4 per cent, not much improvement from 1969's 4.3 per
cent increase. Continued strong upward pressures on prices are likely
to result from wage increases far in excess of the growth of labor
productivity.

I-C-1 4/28/70
U.S. AND INTERNATIONAL ECONOMIC DEVELOPMENTSBILLIONS OF DOLLARS
1968 1970 1968 1'
INTERNATL RESERVES EECCOUNTRIES INTERNATL RESERVES OTHERCOUNTRIES
NET OFFICIAL NET OFFICIAL PLUS BANKS NET OFFICIAL NET OFFICIAL PLUS BANKS
I TOTAL I I
ITALYQ143
BENELUX '
QI 53FRANCEQI29
I I I1 '1 1 I1968 1970
JS MERCHANDISE TRADEBALANCE OF PAYMENTS BASISANNUAL RATES SEASONALLY ADJUSTED3MO MOV AV(121)1969 DATA AFFECTED BY PORT STRIKES
1968
S1970 DATA INCLUDES SDR'S
BENELUXQI 44
FRANCE\QI 15
I I I 1 11968 1970
1970
LESS DEVELOPEDCOUNTRIESQI162
OTHER DEVELOPEDCOUNTRIES01I103
SWITZERLAND SWITZER
QI41 QI52
CANADA CANADiJAPAN QI34QI41 I JAPAN
1968 1970
U S. BANKS' FOREIGN CLAIMSSEASONALLY ADJUSTED
A
LAND
O19 44
1968 1970
INCREASEOX 319
rEAI\,/ DECREASE V
S.4
i ____1 iI I .81968 1970
-1.8
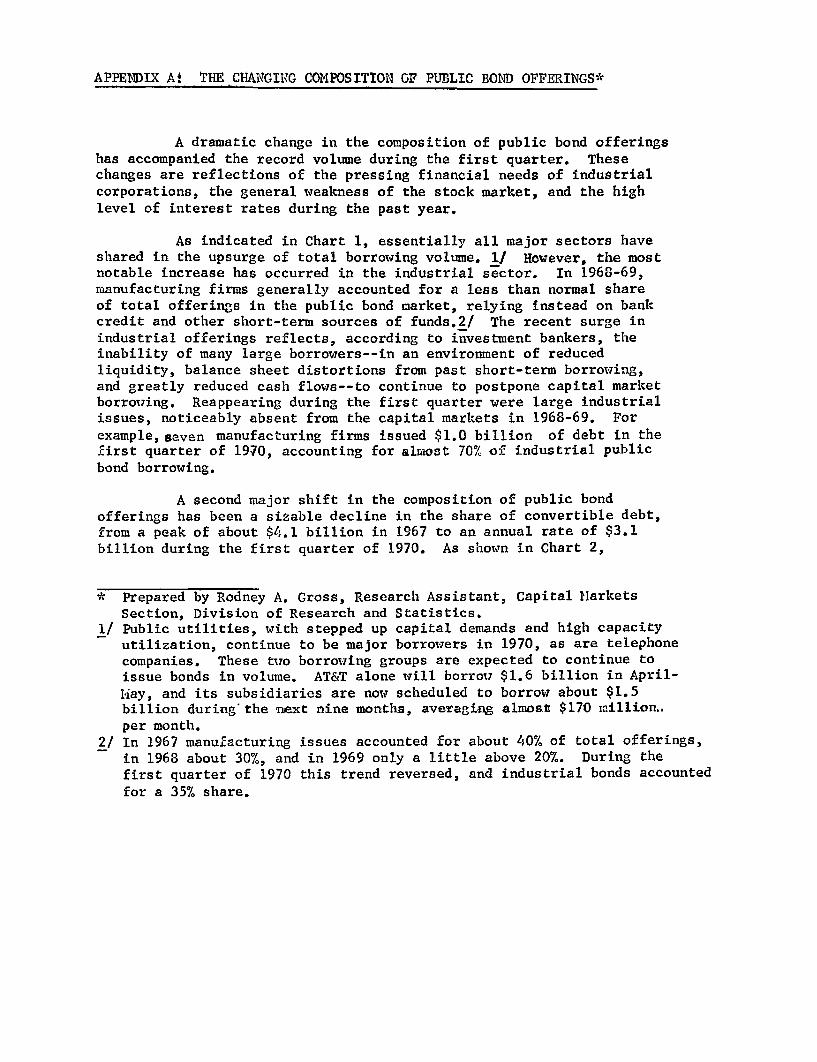
APPENDIX A: THE CHANGING COMPOSITION OF PUBLIC BOND OFFERINGS*
A dramatic change in the composition of public bond offeringshas accompanied the record volume during the first quarter. Thesechanges are reflections of the pressing financial needs of industrialcorporations, the general weakness of the stock market, and the highlevel of interest rates during the past year.
As indicated in Chart 1, essentially all major sectors haveshared in the upsurge of total borrowing volume. 1/ However, the mostnotable increase has occurred in the industrial sector. In 1968-69,manufacturing firms generally accounted for a less than normal shareof total offerings in the public bond market, relying instead on bankcredit and other short-term sources of funds.2/ The recent surge inindustrial offerings reflects, according to investment bankers, theinability of many large borrowers--in an environment of reducedliquidity, balance sheet distortions from past short-term borrowing,and greatly reduced cash flows--to continue to postpone capital marketborrowing. Reappearing during the first quarter were large industrialissues, noticeably absent from the capital markets in 1968-69. For
example, seven manufacturing firms issued $1.0 billion of debt in thefirst quarter of 1970, accounting for almost 70% of industrial public
bond borrowing.
A second major shift in the composition of public bondofferings has been a sizable decline in the share of convertible debt,from a peak of about $4.1 billion in 1967 to an annual rate of $3.1
billion during the first quarter of 1970. As shown in Chart 2,
* Prepared by Rodney A. Gross, Research Assistant, Capital MarketsSection, Division of Research and Statistics.
1/ Public utilities, with stepped up capital demands and high capacityutilization, continue to be major borrowers in 1970, as are telephonecompanies. These two borrowing groups are expected to continue to
issue bonds in volume. AT&T alone will borrow $1.6 billion in April-
May, and its subsidiaries are now scheduled to borrow about $1.5billion during the next nine months, averaging almost $170 million..per month.
2/ In 1967 manufacturing issues accounted for about 40% of total offerings,in 1968 about 30%, and in 1969 only a little above 20%. During the
first quarter of 1970 this trend reversed, and industrial bonds accounted
for a 35% share.

A-2CHART 1
PUBLIC OFFERINGS OF CORPORATE BONDS*(Quarterly totals, Billions of Dollars)
Manufacturing
-Convertible
-Non-convertible
01
1967
1967
1968
1968
1969
1969
1970
1970
1
Communication
0 I I I 1 , i i , , I 1 , I1967 1968 1969 1970
1Financial and Real Estate
I , , I i I , I ,, I I I .1967 1968 1969 1970
* These amounts represent approximately 90% of the dollar volume reportedby the SEC during this period. The balance is primarily composed of smallissues in sectors other than public utilities and communications.

A-3
Chart 2
Convertible Public Bond Offerings
Per Cent (As per cent of total)Per Cent
30 30
20 20
10 10
0 0Q le
1967 1968 1969 1970

A-4
convertible debt as a per cent of total publicly offered corporatedebt has declined markedly. 1/ The decline coincides fairly wellwith average stock price levels, and is probably attributable largelyto developments in that market. In addition to stock market develop-ments, however, the sharp percentage decline results from the largescale of corporate straight debt financing in recent months.
Finally, a significant share of total offerings in the firstquarter--issued in about equal proportions by manufacturing, publicutility and financial firms--have maturities of 3-7 years.
Table 1
INTERMEDIATE-TERM PUBLIC BOND OFFERINGS(Millions of dollars and per cent of total)
Intermediate-termDebt
As % of total publiclyoffered debt
1969
QI 25 ,9
490 14,4
11.8
7.1
14,8668
offered in volume in 1969, such intermediate-term debt was issuedannual rate of about $2.5 billion in the first quarter of 1970.shorter term offerings have proven to be attractive instruments
1/ The decline is even more notable in the industrial sector, where theshare declined to about 10% in 1970 from around 45% in 1969 and 30%in 1967-68.
Q II
Q IIIQ IV
1970
QI
Firstat anThese

A-5
for individual, as well as institutional, investors during the stockmarket decline, as they have normally been offered at a slight yieldpremium over longer-term investments. And choosing this financingoption effectively reduces potential interest cost to the borrower aswell. While most carry no-call-prior-to-maturity provisions, someinclude an option--exercisable by the investor--to have the bond maturebefore the certificate maturity, or accept a lower-than-coupon yieldfrom that date to maturity. This effectively reduces the borrower riskof being locked into high costs over the long-term and/or callinglonger-term bonds at high prices in 5 years (assuming lower futureinterest rates, of course).
Although corporate bond yields declined early this year,the substantial volume of current and prospective new issues led to areversal of bond yields in March. However, the recent yield increasewas probably restrained somewhat by the compositional change in bondofferings, as the characteristics of industrial and intermediate-termissues generated some increase in investor interest. Industrial bonds,relative to comparably-rated utility bonds, tend to carry lower yieldsbecause of their longer call protection--10 years as compared with 5-years on utilities. In addition, individual industrial firms tend tobe infrequent issuers of straight debt, in contrast to the heavyissuance by individual utilities. Bond portfolio managers, therefore,have relatively limited opportunities to acquire new debt of selectedindustrial firms and as a result, the debt issues of such firms arepriced somewhat higher. Finally, the substitution of intermediate-termofferings for longer-term issues has served to reduce pressure on long-term markets.
Related Documents


![Arthur Schopenhauer - Thule Italia Schopenhauer, Religion.pdf · Religion by Arthur Schopenhauer [Translated by T. Bailey Saunders, M.A.] Table of Contents Prefatory Note Religion.](https://static.cupdf.com/doc/110x72/5c62d26c09d3f277208b8e43/arthur-schopenhauer-thule-schopenhauer-religionpdf-religion-by-arthur-schopenhauer.jpg)


