Prefatory Note The attached document represents the most complete and accurate version available based on original copies culled from the files of the FOMC Secretariat at the Board of Governors of the Federal Reserve System. This electronic document was created through a comprehensive digitization process which included identifying the best- preserved paper copies, scanning those copies, 1 and then making the scanned versions text-searchable. 2 Though a stringent quality assurance process was employed, some imperfections may remain. Please note that some material may have been redacted from this document if that material was received on a confidential basis. Redacted material is indicated by occasional gaps in the text or by gray boxes around non-text content. All redacted passages are exempt from disclosure under applicable provisions of the Freedom of Information Act. 1 In some cases, original copies needed to be photocopied before being scanned into electronic format. All scanned images were deskewed (to remove the effects of printer- and scanner-introduced tilting) and lightly cleaned (to remove dark spots caused by staple holes, hole punches, and other blemishes caused after initial printing). 2 A two-step process was used. An advanced optical character recognition computer program (OCR) first created electronic text from the document image. Where the OCR results were inconclusive, staff checked and corrected the text as necessary. Please note that the numbers and text in charts and tables were not reliably recognized by the OCR process and were not checked or corrected by staff. Content last modified 6/05/2009.

Welcome message from author
This document is posted to help you gain knowledge. Please leave a comment to let me know what you think about it! Share it to your friends and learn new things together.
Transcript
Prefatory Note The attached document represents the most complete and accurate version available based on original copies culled from the files of the FOMC Secretariat at the Board of Governors of the Federal Reserve System. This electronic document was created through a comprehensive digitization process which included identifying the best-preserved paper copies, scanning those copies,1
and then making the scanned versions text-searchable.2
Though a stringent quality assurance process was employed, some imperfections may remain. Please note that some material may have been redacted from this document if that material was received on a confidential basis. Redacted material is indicated by occasional gaps in the text or by gray boxes around non-text content. All redacted passages are exempt from disclosure under applicable provisions of the Freedom of Information Act. 1 In some cases, original copies needed to be photocopied before being scanned into electronic format. All scanned images were deskewed (to remove the effects of printer- and scanner-introduced tilting) and lightly cleaned (to remove dark spots caused by staple holes, hole punches, and other blemishes caused after initial printing). 2 A two-step process was used. An advanced optical character recognition computer program (OCR) first created electronic text from the document image. Where the OCR results were inconclusive, staff checked and corrected the text as necessary. Please note that the numbers and text in charts and tables were not reliably recognized by the OCR process and were not checked or corrected by staff.
Content last modified 6/05/2009.

CONFIDENTIAL (FR)
CURRENT ECONOMICand
FINANCIAL CONDITIONS
Prepared for the
Federal Open Market Committee
By the Staff
BOARD OF GOVERNORS
OF THE FEDERAL RESERVE SYSTEM June 14, 1967

CONFIDENTIAL (FR)
CURRENT ECONOMIC AND FINANCIAL CONDITIONS
By the StaffBoard of Governors
of the Federal Reserve SystemJune 14, 1967

I- 1
SUMMARY AND OUTLOOK
Outlook for economic activity
Real growth in GNP is resuming after a slight decline in
the first quarter. The second quarter rise is now expected to be
somewhat larger than previously indicated. The third quarter should
show substantial improvement, with real growth at a rate of between
4 and 5 per cent, as the drag on aggregate expansion from the current
inventory adjustment abates.
The small increase in inventories in April suggests that the
over-all adjustment is proceeding about as anticipated, with additions
to total business inventories estimated at zero in the current quarter.
With inventory change small and growth in final sales projected to
continue strong, production and employment should start increasing
during the third quarter.
Final demands have remained strong in the second quarter and
are expected to maintain this pace of growth in the third quarter. The
government sector continues to provide important economic stimulus, with
defense spending continuing above Budget levels.
In the private sector, expenditures for consumer goods have
gained momentum recently. Automobile sales have increased from the low
first quarter level and nondurable goods sales showed gains in both
April and May. Meanwhile, outlays for services maintain their strong
upward trend. Consumption is increasing faster than disposable income
currently, and the savings rate is beginning to drift down from the high
first quarter rate.
I-2
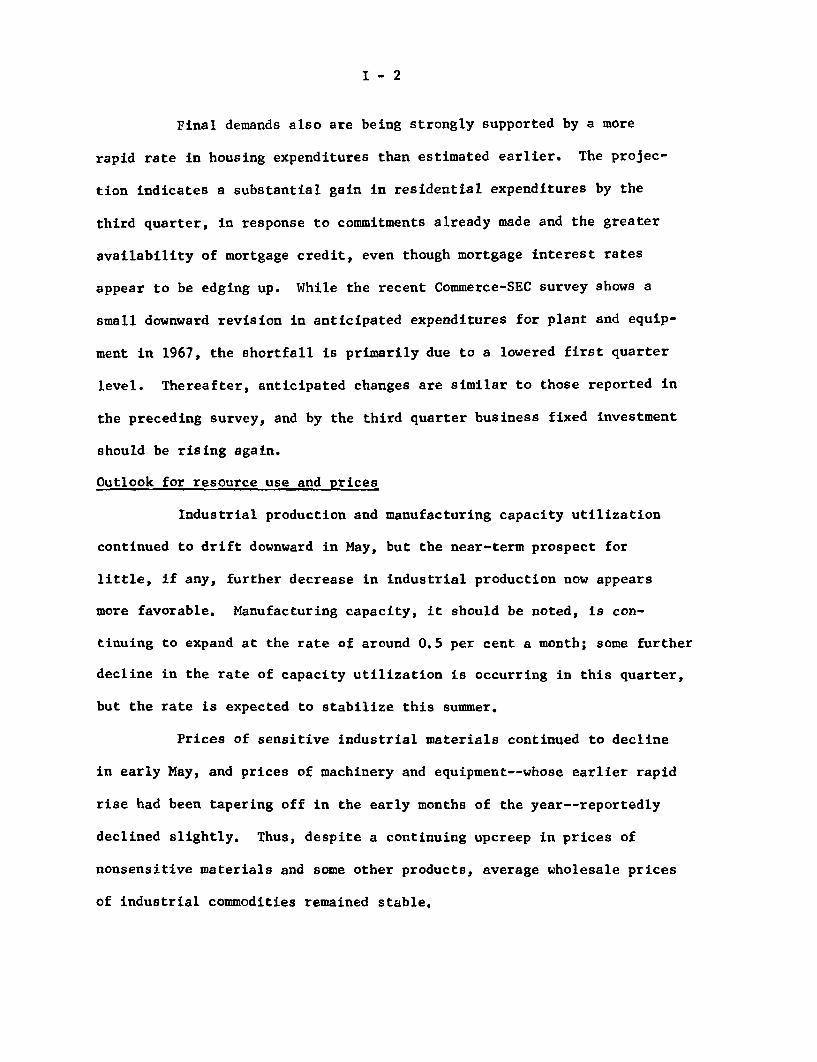
Final demands also are being strongly supported by a more
rapid rate in housing expenditures than estimated earlier. The projec-
tion indicates a substantial gain in residential expenditures by the
third quarter, in response to commitments already made and the greater
availability of mortgage credit, even though mortgage interest rates
appear to be edging up. While the recent Commerce-SEC survey shows a
small downward revision in anticipated expenditures for plant and equip-
ment in 1967, the shortfall is primarily due to a lowered first quarter
level. Thereafter, anticipated changes are similar to those reported in
the preceding survey, and by the third quarter business fixed investment
should be rising again.
Outlook for resource use and prices
Industrial production and manufacturing capacity utilization
continued to drift downward in May, but the near-term prospect for
little, if any, further decrease in industrial production now appears
more favorable. Manufacturing capacity, it should be noted, is con-
tinuing to expand at the rate of around 0.5 per cent a month; some further
decline in the rate of capacity utilization is occurring in this quarter,
but the rate is expected to stabilize this summer.
Prices of sensitive industrial materials continued to decline
in early May, and prices of machinery and equipment--whose earlier rapid
rise had been tapering off in the early months of the year--reportedly
declined slightly. Thus, despite a continuing upcreep in prices of
nonsensitive materials and some other products, average wholesale prices
of industrial commodities remained stable,

1-3
A renewed upward move in average prices of industrial commodities
may be in prospect. Since mid-May, prices of basic industrial
materials generally have moved up moderately. Given the present outlook
for improved domestic demands and the near-term supply uncertainties
because of the Mid-East situation and pending wage negotiations, prices
of sensitive industrial materials may have ended their decline. The Mid-
East situation may have a special impact on prices of crude and refined
petroleum.
Prices of farm products showed an abrupt upturn in May when
hog marketings fell sharply from the exceptionally high winter and early
spring level, and beef production rose less than seasonally. Last
month's reversal of earlier pronounced livestock price weakness was an
early warning signal of the expected strengthening in prices of live-
stock and products through the summer and autumn. While crop prospects
continue favorable, average wholesale prices of farm products and
processed foods may be expected to rise further from the early May
level. Reversal of the earlier large decline in retail food prices
(at grocery stores) is expected to lead to larger gains in the consumer
price index.
Outlook for banking
Bank credit expansion in June will be buoyed by tax borrowing,
but the increase for the month,on average, is not likely to be unusually
large. Tax payments in June are projected to be somewhat higher than
last year, but are heavily funded with tax bills, CD's, and other money
market instruments. Business loans, after declining in May are expected
to increase in June by a relatively modest amount, while loans to finance
companies are expected to bulge as paper dated around the tax period
matures.
I-4
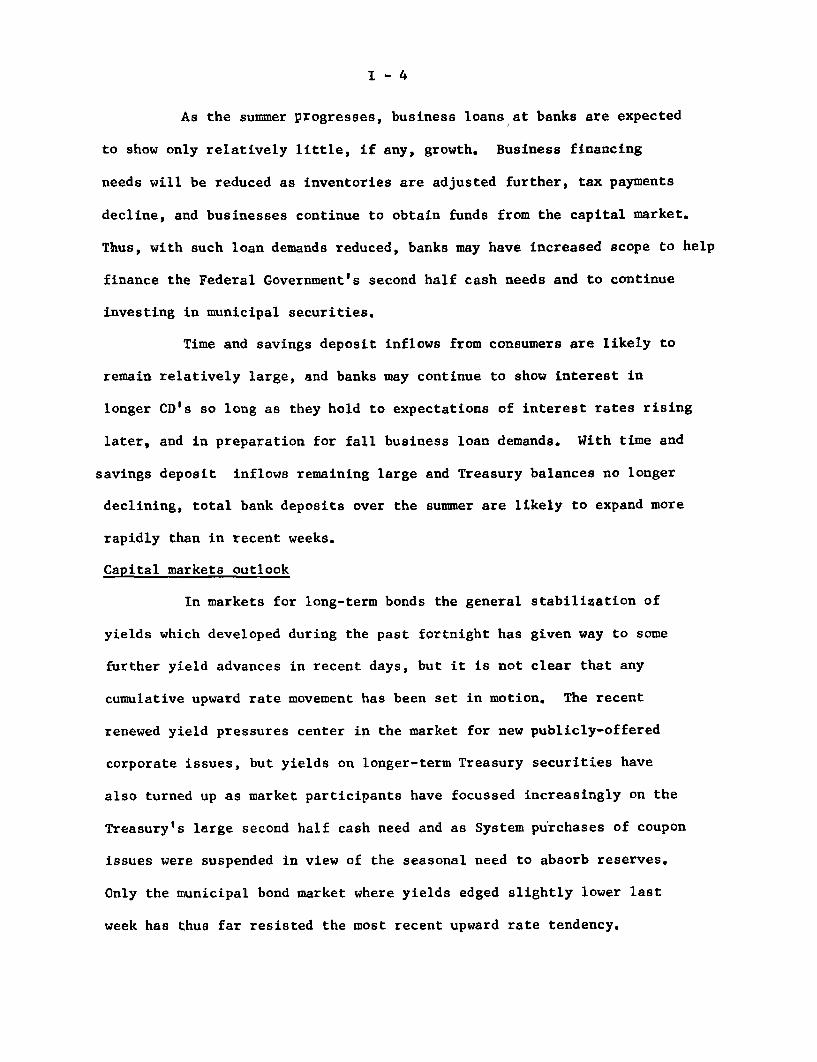
As the summer progresses, business loans at banks are expected
to show only relatively little, if any, growth. Business financing
needs will be reduced as inventories are adjusted further, tax payments
decline, and businesses continue to obtain funds from the capital market.
Thus, with such loan demands reduced, banks may have increased scope to help
finance the Federal Government's second half cash needs and to continue
investing in municipal securities.
Time and savings deposit inflows from consumers are likely to
remain relatively large, and banks may continue to show interest in
longer CD's so long as they hold to expectations of interest rates rising
later, and in preparation for fall business loan demands. With time and
savings deposit inflows remaining large and Treasury balances no longer
declining, total bank deposits over the summer are likely to expand more
rapidly than in recent weeks.
Capital markets outlook
In markets for long-term bonds the general stabilization of
yields which developed during the past fortnight has given way to some
further yield advances in recent days, but it is not clear that any
cumulative upward rate movement has been set in motion. The recent
renewed yield pressures center in the market for new publicly-offered
corporate issues, but yields on longer-term Treasury securities have
also turned up as market participants have focussed increasingly on the
Treasury's large second half cash need and as System purchases of coupon
issues were suspended in view of the seasonal need to absorb reserves.
Only the municipal bond market where yields edged slightly lower last
week has thus far resisted the most recent upward rate tendency.

I - 5
Further upward pressures on intermediateland long-term rates
would come chiefly from the Treasury's financing activity and the heavy
immediate and forward calendar of new publicly-offered corporate bonds.
While postponements and cut-backs in the size of offerings reduced
the volume of corporate issues offered 1i May, these reductions have
been swamped by further additions to the calendar for June and beyond.
It remains to be seen whether the recent strengthening of the
municipal bond market represents more than a temporary investor interest
and an improved technical position stemming from the reduced overhang
of unsold securities. Ready placement of last week's offerings occurred
in large measure because banks became more active buyers of longer
maturities, presumably due to the recent sluggishness of business
and other loan demands and the high after-tax yields available on
municipal securities.
In secondary markets for home mortgages, where both yields
changes and the availability of yield data lag those in bond markets,
yields turned up slightly in May, following five consecutive months of
decline. This reversal of trend apparently reflected both the
immediate attractiveness of rising returns on corporate bonds to
diversified institutional lenders and the prevailing market consensus
that general credit conditions would create still higher interest rates
later in the year.
During May, the share of savings inflows thrift institutions
were allocating to mortgages remained low. This was more a reflection
of the low levels of starts and transfers of existing properties and
the consequent dearth of immediately available mortgages, however,
I-6
than of any basic shortage in the availability of mortgage funds.
It is likely that inflows of savings to these institutions will
continue sizeable over the period immediately ahead. The yield
spread between rates offered by savings institutions and rates on
competitive short-term paper still remains favorable to the institu-
tions, even though market rates have risen somewhat recently,
International developments
Fuller information on trade in the first four months of 1967
cautions against any great hopes that trade developments may produce
substantial improvement of the over-all balance of payments in coming
months. Imports were held up in January-April by growing consumer goods
imports, and sugar purchases were temporarily large; it is disappointing
that these and other increases were not offset by greater declines
than actually occurred in imports of steel, wool, aluminum, and some
other materials. On the export aide, the remarkably big jump in exports
this year is partly related to increased A.I.D. and P.L. 480 grants and
credits.
It now appears that the persistence of a very large liquidity
deficit before special transactions in the first quarter was not due to
enlarged unrecorded outflows nor, as some people had feared, to abnormal
direct investment outflows to avoid anticipated tightening of restrictions.
Besides the Government grant and loan transactions just mentioned,
unfavorable factors included a large further increase in U.S. military
expenditures abroad, a drop in receipts of investment income from abroad,

1-7
and a pickup in U.S. private purchases of foreign securities. There is
no early prospect of improvement in the Government accounts, and
outflows of U.S. private capital are likely to continue near recent
levels.
A development tending to hold down the deficit on the official
reserve transactions bases, which had been extremely large in the first
four months of the year, has been the cessation of U.S. bank repayments
to the Euro-dollar market since the end of April.
Cyclical demand developments abroad do not yet show clear
signs of change, either toward recovery in Germany and Britain or slow-
down in Italy and Japan. In financial markets de-escalation of interest
rates seems, for the time being at least, to have run its course. German
long-term rates remain around 6-3/4 per cent. In Britain, new balances
of payments worries have adversely affected bond prices. Canadian
interest rate developments have resembled ours, except that short-
term rates as well as long-term rose in May.

June 13, 1967
SELECTED DOMESTIC NONFINANCIAL DATA
(Seasonally adjusted)
Civilian labor force (mil.)Unemployment (mil.)Unemployment (per cent)
Nonfarm employment, payroll (mil.)ManufacturingOther industrialNonindustrial
Industrial production (57-59=100)Final productsMaterials
Wholesale prices (57-59=100)1/Industrial commoditiesSensitive materialsFarm products, foods and feeds
Consumer prices (57-59=100)1/Commodities except foodFoodServices
Hourly earnings, mfg. ($)Weekly earnings, mfg. ($)
Personal income ($bil.)2/
Latest
Period LatestPeriod
May'67 76.2S 2.9
" 3.8
Apr'67I
",
65.419.18.0
38.3
155.9156.5155.4
105.3105.1100.7103.4
115.3108.4113.7126.6
May'67 2.79" 112.28
Apr'67 614.1
Corporate profits before tax ($bil.)2/QI'67 77.3
Retail sales, total ($ bil.)Autos (million units)2/GAF ($ bil.)
Selected leading indicators:Housing starts, pvt. (thous.)2/Factory workweek (hours)New orders, dur. goods ($ bil.)New orders, nonel. mach. ($ bil.)Common stock prices (1941-43=10)
Inventories, book val. ($ bil.)
Gross national product ($ bil.)2/Real GNP ($ bil., 1958 prices)2/
May'6711
if
Apr'67May'67Apr'67
May'67May'67
26.17.56.3
1,17140.322.33.5
92.59
AmountPreced'gPeriod
76.2.83.7
65.519.28.1
38.2
156.4156.5155.9
105.7105.1101.3104.6
115.0107.8114.2126.3
2.80112.90
612.7
81.8
25.97.66.4
1,16140.522.13.4
90.96
YearAgo75.12.93.9
63.519.08.0
36.5
153.9152.9154.5
105.5103.9106.4108.7
112.5106.0114.0121.1
2.69111.49
570.5
82.7
24.57.35.8
1,50241.524.23.5
86.78
Per cent changeYear 2 Yrs.Ago* Ago*1.4 2.60.1 -14.4
3.0 8.40.7 7.00.2 2.64.8 10.4
1.3 10.62.4 12.20.6 9.1
-0.21.2
-5.4-4.9
2.52.3
-0.34.5
3.53.2-0.93.2
5.53.26.07.9
3.7 7.30.7 4.9
7.6
-6.5
6.53.38.4
-22.0-2.9-7.7-2.2
6.7
Apr'67 137.2 137.1 124.7 10.0
QI'67 763.7 759.3 721.2 5.9" 656.7 657.2 640.5 2.5
17.5
3.8
11.8-7.418.1
-24.5-2.21.3
11.43.7
19.9
15.69.4
* Based on unrounded data. 1/ Not seasonally adjusted 2/ Annual rates.
I
I -- T - 1

June 13, 1967
SELECTED DOMESTIC FINANCIAL DATA
Week ended Four-Week Last six monthsJune 9 Average High Low
Money Market 1/ (N.S.A.)Federal funds rate (per cent) 3.83 3.93 6.00 2.50U.S. Treas. bills, 3-mo., yield (per cent) 3.41 3.48 5.19 3.46Net free reserves 2/ (mil. $) 284 274 284 -268Member bank borrowings 2/ (mil. $) 77 88 647 50
Security Markets (N.S.A.)Market yields 1/ (per cent)
5-year U.S. Treas. bonds 4.78 4.77 5.25 4.3820-year U.S. Treas. bonds 4.87 4.90 4.98 4.44Corporate new bond issues, Aaa 5.71 5.71 5.73 5.11Corporate seasoned bonds, Aaa 5.37 5.24 5.39 4.99Municipal seasoned bonds, Aaa 3.76 3.77 3.78 3.25FHA home mortgages, 30-year 3/ 6.29 6.29 6.77 6.29
Common stocks S&P composite index 4/Prices, closing (1941-43=10) 90.51 91.03 94.44 80.38Dividend yield (per cent) 3.22 3.22 3.65 3.12
N.S.A. -- not seasonally adjusted.I/ Average of daily figures. 2/ Averages3/ Latest figure indicated is for month ofprices.
for statement week ending -June 7, 1967April. 4/ Data are for weekly closing
I -- T - 2
June 12, 1967,
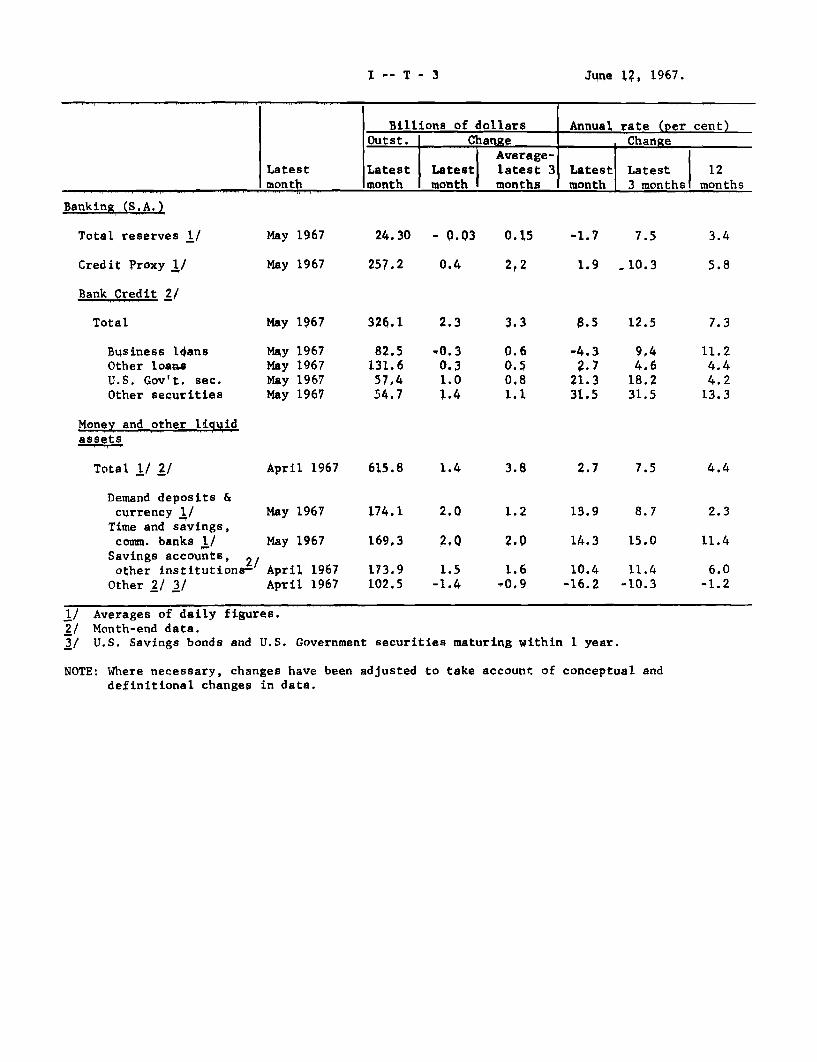
Billions of dollars Annual rate (per cent)Outst. Change Change
Average-Latest Latest Latest latest 3 Latest Latest 12month mmonth onth months month 3 months months
Banking (S.A.)
Total reserves 1/
Credit Proxy 1/
Bank Credit 2/
Total
Business 14ansOther loaiaU.S. Gov't. sec.Other securities
Money and other liquidassets
Total ./ 1/
Demand deposits ¤cy 1/Time and savings,comm. banks 1/Savings accounts, 2/other institutions-Other 2/ 3/
May 1967
May 1967
May 1967
May 1967May 1967May 1967May 1967
April 1967
May 1967
May 1967
April 1967April 1967
24,30
257.2
326.1
82.5131.6
57.454.7
- 0.03
0.4
2.3
-0.30.31.01.4
615.8 1.4
174.1
169,3
173,9102.5
2.0
2,0
1.5-1.4
1/ Averages of daily figures.2/ Month-end data.3/ U.S. Savings bonds and U.S. Government securities maturing within 1 year.
NOTE: Where necessary, changes have been adjusted to take account of conceptual anddefinitional changes in data.
0.15
2,2
3.3
0.60.50.81.1
3.8
1.2
2.0
1.6-0,9
-1.7
1.9
8.5
-4.32.7
21.331,5
2.7
13.9
14.3
10.4-16.2
7.5
.10.3
12.5
9,44.6
18.231.5
7.5
8.7
15.0
11.4-10.3
3.4
5.8
7.3
11.24.44.2
13.3
4,4
2.3
11.4
6.0-1.2

I - T- 4
U.S. BALANCE(In millions
OF PAYMENTSof dollars)
1967 1967 1 9 6 6 1966
Apr. Mar. QI QIV QIII QII QI Year(billions)
Seasonally adjusted
Current account balance
Trade balanceExportsImports
4052,630
-2,225
3552,540
-2,185
1,078
1,0017,690
-6,689
838
7227,402
-6,680
873 1,108 1,273 4.1
8027,382
-6,580
9567,181
-6,225
1,1787,203
-6,025
3.729.2
-25.5
Services, etc., net 77 116 71 152
Capital account balance
Govt. grants & capital 2/U.S. private direct investmentU.S. priv. long-term portfolioU.S. priv. short-termForeign nonliquid
-1,416 -1,028 -1,315 -1,032
-1,205-695-154-157
795
-724-922
69-231
780
-759-900-5-27376
-988-1,006
-69-60
1,091
Errors and omissions -206 -229 277 -198 -233 -0.4
Balances, with and without seasonal adjustment (- = deficit)
Liquidity bal., S.A.Seasonal componentBalance, N.S.A.
OfficialSeasonalBalance,
settlementscomponentN.S.A. 3/
-544301
-336 -224 -243
bal. S.A., -1,822543
-622 -538 -1,279
Memo items:Monetary reserves
(decrease -)Gold purchases or
sales (-)
51 -143 -1,027 6 -82
50 23 -51 -121 -173 -
-68 -424 -0.6
-209 -68 -0.6
Balance of payments basis which differs a little from Census basis.Net of loan repayments.Differs from liquidity balance by counting as receipts (+) increasesliabilities to commercial banks, private nonbanks, and international(except IMF) and by not counting as receipts (+) increase in certainliabilities to foreign official institutions.
in liquidinstitutionsnonliquid
95 0.4
-1,691
-975-634-252
-95265
-5.1
-3.4-3.5-0.3-0.4
2.5
-419-47
-466
-18-180-198
-165-530-695
861-456405
-122-27
-149
-175-210-385
-651604-47
-443846403
-1.4
-1.4
0.2
0.2
II - 1
THE ECONOMIC PICTURE IN DETAIL
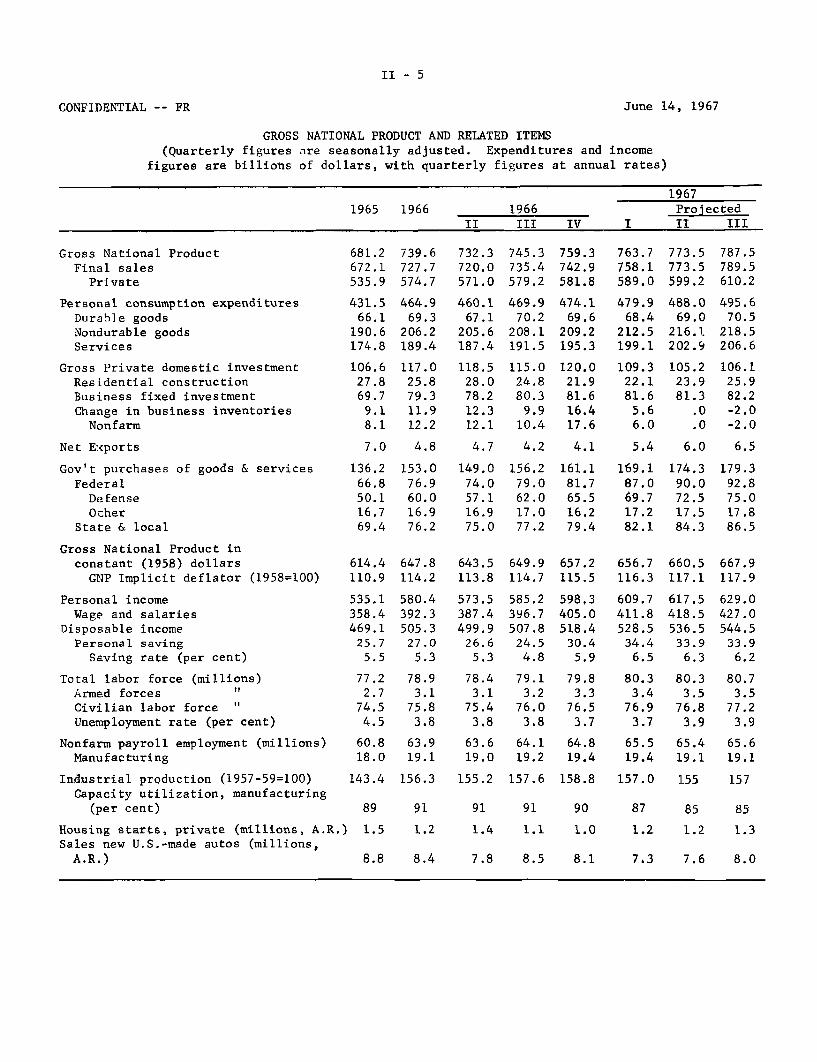
Gross national product. Gross national product is expected to
advance by $10 and $14 billion, respectively, in the second and third
quarters, after a gain of only $4.5 billion in the first quarter.
With the GNP defaltor continuing to rise at the first quarter annual
rate of 2.8 per cent, real growth in output would increase to 2.3 per
cent in the second quarter and 4.5 per cent in the third quarter.
This expected acceleration in aggregate expansion reflects
continued strong growth in final sales, with a diminishing drag from
the adjustment of business inventories. Thus, final sales are projected
as growing a little more rapidly in this and the next quarters, but the
slowing in inventory purchases, which cut almost $11 billion from the
first quarter advance is expected to offset only about $2 billion of
the rise in final sales by the third quarter.
The contribution by the public sector of about $5 billion to
final sales in each quarter will be smaller than in the first quarter,
Defense expenditures are projected to increase by only $2.8 billion in
the second quarter and $2.5 billion in the third, following a rise
of over $4 billion in the first quarter. Larger gains in private
final sales, however, would offset the smaller increases in defense
expenditures. Upward revised April and the higher May retail sales
data suggest larger consumer expenditures than were previously
predicted, and gains of approximately $8 billion in consumption, are
now projected for the second and third quarters, compared with a rise

II - 2
of less than $6 billion in the first quarter. Nondurables sales are
expected to show further strength, and durable goods outlays would
also rise, principally reflecting moderately expanding auto sales.
The indicated growth in consumption outpaces the rise in
disposable income, and the saving rate would drift down from the very high
first quarter rate. Nevertheless, the savings rate at 6.2 per cent
in the third quarter would still be high by historical standards,
Residential construction expenditures also are expected to
provide a somewhat larger contribution to final demands than earlier
estimates indicated. An increase of nearly $2 billion dollars in out-
lays is now anticipated in this and the next quarter, as housing starts
rise to a rate of 1.3 million in the third quarter. These increases
reflect, in part, the greater availability of mortgage money. In
addition, the steady increase in building permits, the substantial
increase in mortgage commitments by major lender groups, and declines
in vacancies lend further support to the expectation of continued but
moderate advances in residential construction expenditures throughout
this year.
Our estimates of business fixed investment are consistent
with the recent Commerce-SEC quarterly survey of business intentions
and show a rise in expenditures in the third quarter. The projected
outlays for all of 1967 have been revised downward by one per cent
from the preceeding survey taken in January, but all the decline was
reported in expenditures for the first quarter. Thus, while the level

II - 3
for the year has been lowered, the pattern of expanding investment
in the third and fourth quarters remains the same. The Commerce-SEC
survey was conducted in April and May, when manufacturing capacity
utilization had declined to 86 per cent and first quarter profits
had fallen 5.5 per cent, and before the investment tax credit was
reinstated. Higher spending plans under these conditions suggest
the strong underlying optimistic expectations of businessmen.
Our estimates include defense expenditures above the levels
projected in the Budget, and small increases in other Federal purchases
in the second and third quarters. Further steady gains in consumer
services, net exports, and State and local government outlays are in
line with the previous projection and provide important impetus to
continued economic expansion.
The small net addition to business inventories in April
indicates that the adjustment is progressing in a generally satis-
factory manner, although inventories continue to be excessive and
still rising in some durable goods manufacturing industries. The
rate of inventory accumulation, as measured by book value, has now
declined from the December 1966 rate of over $20 billion to a $1 billion
annual rate in April. For this quarter as a whole no net change in
business stocks is expected--with further liquidation of trade inven-
tories offsetting any additional accumulation in manufacturers' stocks.
Some moderate over-all liquidation is likely in the next quarter as
automobile stocks are drawn down due to anticipatory buying by consumers
seeking to avoid any risk of a possible strike,

II - 4
The stock-sales ratio for all business has remained relatively
stable since January. Substantial adjustments at the distributors' level
have brought their stocks about into line with sales, but the stock-sales
ratio for manufacturers has climbed to the very high level of 1.82, The
major increase in manufacturers' inventories, relative to sales, has
occurred in defense goods; these may not pose the same problems of
potential liquidation as would inventories destined for private consumption,
so that major adjustments do not seem likely in this area. Liquidation
of inventories in other durable industries may still retard production
in some industries until increasing shipments siphon off the surplus
stocks. However, the value of all new orders received by manufacturers
has increased in each successive month since January, and machinery and
equipment orders have shown no decline since February, following earlier
weakness. This together with evidence of sustained strong growth in
final sales would seem to foreshadow a turnaround in manufacturing ship-
ments and production.
II - 5
CONFIDENTIAL -- FR June 14, 1967
GROSS NATIONAL PRODUCT AND RELATED ITEMS(Quarterly figures are seasonally adjusted. Expenditures and income
figures are billions of dollars, with quarterly figures at annual rates)
1967
1965 1966 1966 Projected
II III IV I II III
Gross National Product
Final sales
Private
Personal consumption expenditures
Durable goods
Nondurable goods
Services
Gross Private domestic investment
Residential construction
Business fixed investment
Change in business inventories
Nonfarm
Net Exports
Gov't purchases of goods & services
FederalDefense
Ocher
State & local
Gross National Product in
constant (1958) dollars
GNP Implicit deflator (1958=100)
Personal income
Wage and salaries
Disposable income
Personal saving
Saving rate (per cent)
Total labor force (millions)
Armed forces "Civilian labor force "
Unemployment rate (per cent)
Nonfarm payroll employment (millions)
Manufacturing
Industrial production (1957-59=100)
Capacity utilization, manufacturing
(per cent)
681.2672.1
535.9
431.5
66.1190.6174.8
106.627.869.7
9.1
8.1
739.6727.7
574.7
464.969.3
206.2
189.4
117.0
25.8
79.3
11.912.2
732.3
720.0
571.0
460.1
67.1
205.6
187.4
118.5
28.0
78.2
12.3
12.1
745.3
735.4
579.2
469.970.2
208.1191.5
115.0
24.880.39.9
10.4
759.3742.9581.8
474.169.6
209.2195.3
120.021.981.616.417.6
763.7758.1589.0
479.968.4
212.5199.1
109.322.181.65.66.0
773.5
773.5
599.2
488.0
69.0216.1202.9
105.223.981.3
.0
.0
787.5
789.5610.2
495.6
70.5
218.5206.6
106.1
25.9
82.2
-2.0-2.0
7.0 4.8 4.7 4.2 4.1 5.4 6.0 6.5
136.2
66.850.116.7
69.4
153.0
76.960.016.976.2
149.0
74.057.116.975.0
156.279.062.017.077.2
161.1
81.765.516.279.4
169.187.069.717.282.1
174.3
90.072.517.584.3
179.392.875.017.886.5
614.4 647.8 643.5 649.9 657.2 656.7 660.5 667.9
110.9 114.2 113.8 114.7 115.5 116.3 117.1 117.9
535.1
358.4469.1
25.7
5.5
77.22.7
74.54.5
580.4392.3505.3
27.05.3
78.93.1
75.83.8
573.5387.4
499.926.65.3
78.43.1
75.43.8
585.2396.7
507.824.54.8
79.13.2
76.03.8
598,3405.0518.4
30.45.9
79.83.3
76.53.7
609.7411.8528.5
34.46.5
80.33.4
76.93.7
617.5418.5536.5
33.96.3
80.33.5
76.83.9
629.0427.0544.5
33.96.2
80.73.5
77.23.9
60.8 63.9 63.6 64.1 64.8 65.5 65.4 65.6
18.0 19.1 19.0 19.2 19.4 19.4 19.1 19.1
143.4 156.3 155.2 157.6 158.8 157.0 155 157
89 91 91 91 90 87 85 85
Housing starts, private (millions, A.R.) 1.5
Sales new U.S.-made autos (millions,A.R.) 8.8
1.4 1.1 1.0 1.2 1.2 1.3
7.8 8.5 8.1 7.3 7.6 8.0

II - 5a
CONFIDENTIAL -- FR June 14, 1967
CHANGES IN GROSS NATIONAL PRODUCTAND RELATED
(Quarterly changes areITEMSat annual rates)
19671965 1966 1966 Projected
II III IV I II III
(Billions of Dollars)
Gross National productFinal sales
Private
GNP in constant (1958) dollarsFinal sales
Private
Gross National ProductFinal sales
Pr Lvate
Personal consumption expendituresDurable goodsNondurable goodsServices
Gross private domestic investmentResidential constructionBusiness fixed investment
Gov't purchases of goods & servicesFederal
DefenseOther
State 4 local
GNP in constant (1958) dollarsFinal sales
PrivateGNP Implicit deflator
Personal incomeWage and salaries
Disposable income
Nonfarm payroll employmentManufacturing
Industrial productionHousing starts, privateSales new U.S.-made autos
49.545.137.8
34.430.227.4
58.455.638.8
33.431.122.0
7.8 8,67.2 8.37.6 7.2
7.511.3
6.57,2
14.60.7
14.8
5.72.50.29.98.9
5.95.25.91.8
7. 74.88.28.4
9.8- 7.2
13.8
12.315.119.81.29.8
5.45.14.53.0
7.9 8.57.4 9.57.4 7.7
4.2 5.14.4 5.8
8.4- 3.4
15.0
9.0-18.9- 4.4
11. 17.73.7
13.015.48.2
14.07.52.6
3.0 6.4 7.3- 0.1 8.9 1.2- 2.2 4.4 - 2.2
(Per Cent)
6.2 7.1 7,54.3 8.6 4.12.6 5.7 1.8
3.9-18.2
7.38.7
14.0- 8.4
6.2
11.011.718.3
-11.510.4
1.9- 0.1- 1.7
4.3
8.518.5
4.98.7
-11.8-45.710.7
19.327.034.3
2.411.7
4.05.63,43.2
3,6- 3.42.17.9
17.4-46.8
6.5
12.513.722.6
-18.811.4
4.50.7
- 1.72.8
6.3 8.2 9.07.8 9.6 8.43.9 6.3 8.3
4.9 3.3 4.06.9 3.5 4.0
7.9-39.5-62.8
6.2-81.3
33.6
3.0-39.3-15.8
4.415.2
7.2
9.815.410, 2
14.016.011.0
- 0.5 3.8 7.49.5 9.5 9.44.2 6.3 6.4
2.3 5.1 7.28.2 8.1 8.34.9 6.9 7.3
4.9- 6.9
6.37.8
-35.73.70.0
19.925.925.624.713.6
- 0.35.93.32.8
6.73.56.87.6
-15, 032 6-1.5
12.313.816.17,0
10. 7
2.35.84.92.8
6.28.74,47.3
3,433.5
4.4
11.512.413.86.9
10.4
4,55.74.92.8
7.6 5.1 7.46.7 6.5 8.17.8 6.1 6,0
4.3 -0.6 1.20.0 -6.2 0.0
- 4.580.0
-39.5
- 5.10.0
16.4
5.233.321.1
- -- ~--- - - --
II - 6
Industrial production. Industrial production in May is
estimated to have declined about one-half point from the April figure
of 156.0 per cent. At this level, the May index is only slightly above
a year earlier and 2.2 per cent below the peak last December. The May
decline was centered mainly in industrial materials, as output of
consumer goods and equipment apparently changed little.
Auto assemblies in May were at the April annual rate of 7.7
million units. June production schedules have been raised above earlier
postings, but the increase from May is about in line with the usual
industry practice prior to the model-changeover period. Output of
television sets rose from the April low, but was still 25 per cent below
last December's peak. The May increase was due in part to the introduction
of new models by some manufacturers. Manufacturers' stocks of TV
continued to rise and price cuts were announced on a number of the new
color models. Available data indicate that output of household
appliances was changed little from the reduced April rate. .Production
of defense equipment and commercial aircraft rose further. Output of
commercial equipment was unchanged but that of industrial equipment
declined again.
Among materials, production of steel ingots changed little,
but declines appear to have occurred in textiles, paper, and in some
chemical products. Output of rubber products declined further as the
strike in the tire industry, which began on April 21, continued through
May.
II - 7
The December-May decline in the total index was entirely in
the manufacturing sector, as output at mines and utilities changed little
during this period. Within manufacturing, production of durable goods
declined more than that of nondurable goods, and, with defense
equipment continuing to rise, the production decline was centered
in non-defense industries. The production decline occurred in the
context of declining shipments (through April the decline in shipments
exceeded the decrease in output) and continued increases in inventories
and in stock-sales ratios.
Retail sales. Retail sales in May rose .5 per cent from the
upward revised April figures, according to the "advance" figures, and
were 6.5 per cent above the reduced year ago level. Estimates for April
now indicates a rise of .7 per cent instead of the small deciine shown
by the "advance" estimates a month ago. Sales at durable goods stores
in May were little changed from April, although sales at furniture
and appliance stores continued the downtrend prevailing since the beginning
of the year.
At nondurable goods stores, sales rose one per cent in May,
about the same as in April, and all outlets except general merchandise
stores shared in the rise. An increase of 1.3 per cent in sales at food
stores apparently reflected, in part, higher food prices. In April
and May, sales at nondurable goods stores, as a whole, averaged 2 per
cent higher than in the first quarter of the year.

II - 8
Auto markets. Domestic deliveries of new cars in the month
of May were at a seasonally adjusted annual rate of 7.5 million units.
This was about the same as the April rate, and 3 per cent above a year
ago. In the first 10 days of June, sales were moderately above early
June a year ago, suggesting a significant rise in sales this month--
possibly approaching the 8.3 million annual rate of June 1966.
The stock of new cars at the end of May was 1.43 million units
unchanged from April 30, but 15 per cent below a year earlier. At the
May selling rate, the stock represented a 50 days' supply, a level
reported by the industry to be reasonable at this point in the model
year.
Prices of used cars sold at auction (seasonally adjusted) declined
in May, following an irregular upward movement in the preceding five
months. Used car prices in the first five months of 1967 averaged 2
per cent below the corresponding period a year earlier.
Consumer credit. The rate of expansion in consumer instalment
credit slackened again in April, following a slight upturn in March.
However, the slowdown in outstandings was more a reflection of changes
in repayments than changes in extensions. Indeed, new credit extensions
advanced in April, but repayments on old debt rose by an even larger
margin. The rise in extensions--to which all major types of instalment
credit contributed--amounted to almost $100 million, the largest monthly
rise since last November,

II - 9
CONSUMER INSTALMENT CREDIT(Millions of dollars, seasonally adjusted)
NetPeriod Extensions Repayments Increases
1966 - October 6,522 6,142 380November 6,657 6,213 444December 6,433 6,112 321
1967 - January 6,501 6,221 280February 6,497 6,281 216March 6,510 6,246 264
April 6,606 6,393 213
The net increase in outstanding credit in April was less than
half that of a year earlier and the smallest monthly increase since
January 1962. Auto credit actually declined $18 million, the second
time this year that the change has been negative. Repair and modern-
ization credit also declined in April, but this merely continued a
pattern of small declines that has presisted since last summer,
The decline in auto and home improvement credit were more
than offset by advances in the personal loan aid other consumer goods
categories. The latter category has continued to show up rather
strongly in recent months, owing largely to increased credit card
activity at banks and elsewhere, But personal loan volume is still
sluggish by most past standards and particularly in light of continued
strong demand for services. Apparently more and more consumers are
using credit cards for travelling and vacation purposes, whereas
formerly they would have used personal cash loans.

II - 10
From all indications, tax borrowing by consumers was not an
important factor in the credit picture this April, This probably was
due largely to the graduated-withholding procedures instituted last
year, but the ability of consumers to avoid borrowing for tax purposes
has been enhanced in recent months by an improved liquidity position
and by increases in discretionary income.
Construction activity. Value of all new construction put in
place edged up in May, according to confidential advance projections from
the Census Bureau. This development was associated with a 2 per cent
downward revision in the initial projection for April, however, and raised
the possibility that total construction outlays in the second quarter as
a whole might at best change little from the moderately improved $73.1
billion annual rate reached in the first quarter of the year.
While private residential construction by May had advanced a
tenth from its low at the end of 1966, the advance so far this srping
has not been sufficiently large to offset a recent fairly sharp reduction
in the level of outlays for private nonresidential structures. Although
the private nonresidential rate was estimated to have changed little in
May, it followed a 4 per cent downward revision for April as activity
on industrial plants continued to fluctuate below earlier peaks and
outlays for commercial structures remained in decline, Public construction
activity, which apparently was also overstated initially for April, was
at a record high in May.

II - 11
NEW CONSTRUCTION PUT IN PLACE(Confidential FR)
May 1967 Per cent change($billions)i/ from_
April 19671May 1966
Total 72,9 + 1 - 4
Private 48.0 + 1 - 8
Residential 22.6 + 1 -17Nonresidential 25.4 + 1
Public 24.9 +2 +4
1/ Seasonally adjusted annual rates; preliminary. Data forthe most recent month (May) made available under a confi-dential arrangement with the Census Bureau. Under nocircumstances should any public reference be made to them.
Data on actual starts and permit activity for May are not yet
available. Some moderate increase in the seasonally adjusted annual rate
of starts from the 1.16 - 1.17 million plateau which has prevailed since
February seems likely. However, the rate may fall short of the 1.30
million level reached in January, and the second quarter average as a
whole will probably not be appreciably changed from the low, though
improved, first quarter average.
Indications are that builder plans for new housing units as well
as buyer demands for both new and existing homes had been inhibited, in
part, by expectations of further declines in mortgage rates over the
near term. Thus, the sudden turn in interest rate expectations which
has developed in recent weeks introduces a new and different cross-wind
in the currently sensitive mortgage market.
II - 12
Nevertheless, prospects for a further rise in starts through
the third quarter, to an average somewhat in excess of a 1.3 million
rate, still seem reasonably good, This Judgment as based on the momentum
builders had already begun to achieve this spring and on some improvement
in the level of forward commitments this year. Moreover, the under-
building which has prevailed since early 1966 may soon bring actual
shortages to localities in some areas--notably the North Central states
and the South, with continuing upward pressure on prices of the available
housing stock. Consequently, so long as funds remain available, higher
yields required by lenders should tend to moderate rather than disrupt
the pace of the advance initially projected for the remainder of the
year.
Buseteas. iventories, Business inventory accumulation dropped
sharply to a very low level in April, as a spurt in the book value of
manufacturing inventories was mostly offset by a pronounced decline in
trade inventories. March trade inventory figures were revised upward
(at wholesale only), to show little change for the month instead of
appreciable liquidation, and this results in some upward revision in
the rate of business inventory accumulation indicated for the first
quarter.
At manufacturers, inventories increased over $600 million in
April, almost double the March rise and about the same as the first
quarter monthly average. The April rise reflected mainly larger
accumulation in durable goods industries"particularly iron and steel,
construction materials and some other materials and semi-fabricated

II - 13
lines--and was associated with a drop in shipments to the lowest level
since January 1966--with the result that the stock-sales ratio for all
durable goods combined rose to the highest level since the spring of
1958. Inventory accumulation by nondurable goods producers in April
continued at about the first quarter rate, and stock-sales ratios
continued to run moderately above year-earlier levels.
The book value of trade inventories declined by over $500
million in April, with wholesalers showing an abrupt shift to sizeable
liquidation from moderate accumulation in the first quarter (and very
large accumulation in the fourth) and with retailers continuing the
liquidation that began in January. Inventories at retail stores selling
durable goods--particularly auto dealers--continued downward in April,
and durable wholesalers also reported some liquidation, but the feature
of April developments was a sizeable drop in wholesale and retail stocks
of nondurable goods following continued though moderate expansion in these
stocks during the first quarter. The large April decline in inventories
accompanied a noticeable pick-up in sales by nondurable trade concerns,
From December through April, trade inventories declined almost
$800 million, or 1 1/2 per cent--with nearly $600 million of the decline
in durable goods--and the trade stock-sales ratio declined appreciably
from the relatively high end-of-the-year level of 1.36. At 1.33 in
April, the trade stock-sales ratio had moved back fairly close to the
130-131 average range prevailing during most of the period from 1962
to 1966.

II - 14
As noted, the stock-sales ratio for durable manufacturing
industries was at an unusually high level in April, and the need for
further inventory adjustment appears to be concentrated mainly in that
sector. Attitudes of the producers themselves toward the amount of
adjustment in prospect were recorded in the Commerce quarterly survey
conducted in May. According to this survey, durable goods producers
anticipate a sizeable further reduction in the rate of their inventory
accumulation from the first to second quarters. But they then anticipate
a rise in the rate of inventory accumulation in the third quarter--back
almost to the first quarter rate. These inventory anticipations are
associated with optimistic projections of sales: a 1 1/2 per cent rise
from the first to second quarters (quite strong in view of the fact that
April sales were down 2 1/2 per cent from the first quarter average) and
a further increase of 3 1/2 per cent from the second to the third
quarters. The combination of these inventory and sales expectations
would reverse the April bulge in the durable goods stock-sales ratio
but would leave it at the end of September close to the high first
quarter level.
The forecasting record of this survey was very poor from mid-
1965 through 1966, when the developing high rates of inventory accumulation
were consistently and grossly underestimated. In the first quarter
this year, however, the survey correctly anticipated the large decline
in the rate of accumulation that actually occurred. The sequence of
inventory and sales developments now envisaged by durable goods producers

II - 15
for the second and third quarters are clearly based on a very optimistic
interpretation of the business outlook and reflect an unusual willingness
to keep total inventories much higher relative to sales than during most
earlier years of this expansion period. In part this may reflect the
anticipation of continuing inventory accumulation at a sizeable pace
in defense industries and perhaps also some pick-up in stock building
in machinery and equipment industries (where the rate of accumulation
has slowed markedly since the third quarter last year)--both sectors in
which stock-sales ratios tend to average well above those for other
durable industries. The survey findings should be viewed with skepticism,
but they provide support for the view that the bulk of the over-all
business inventory adjustment is over.
Plant and equipment expenditures. Business fixed capital
spending in 1967 will total $62.4 billion, 2.9 per cent more than such
spending last year, according to the Commerce-SEC survey of business
plans taken in late April and May, This small gain would follow the
unusually large increases in 1966, 1965, and 1964, 16.7, 15,7, and 14.5
per cent, respectively. The gain now indicated for this year is one
percentage point less than was being planned three months earlier. The
downward revision in spending plans for this year largely reflects a
7.3 per cent annual rate of decline in actual expenditures in the first
quarter, instead of the 1.3 per cent decline being planned in late
January and February. Total nonfarm plant and equipment outlays,
according to the latest survey, will decline slightly further in the
current quarter and then rise moderately in the last half of the year.

II - 16
The second quarter decline is somewhat less and the rise in the last
half of the year a bit more than the January-February survey had
indicated. Fixed capital spending in the last half of the year is now
indicated to be only $125 million (.7 per cent) less than was planned
earlier this year.
CHANGES IN PLANT AND EQUIPMENT EXPENDITURES,ALL INDUSTRIES
(Per cent, annual rates)
Period January-February April-MaySurvey Survey
1966 to 1967 3.9 2.9
1966-IV to '67-I - 1.3 - 7.3
1967-I to '67-II - 2.2 - .6
1967-11 to '67-III -- 8.1
1967-111 to 67-IV -- 5.1
1967-I&II Quarter Average 3.4 5.2to 1967-III&IV Average
The downward revision in earlier plans for this year's fixed
capital spending occurred principally in the nonrail transportation,
commercial, and communications industries. Within manufacturing, producers
of durable goods now plan to spend less for new plant and equipment than
they indicated in January and February, and nondurable goods producers
plan to spend more. However, producers of transportation equipment
including motor vehicles and parts, have increased their fixed invest-
ment plans and producers of food and beverages and of textiles have
lowered their earlier plans. Railroads have increased spending plans
II - 17
slightly from last winter, but these higher outlays will still be
substantially less than spent last year. Producers of motor vehicles
and parts, stone, clay, and glass, and textiles also plan smaller
outlays than made last year.
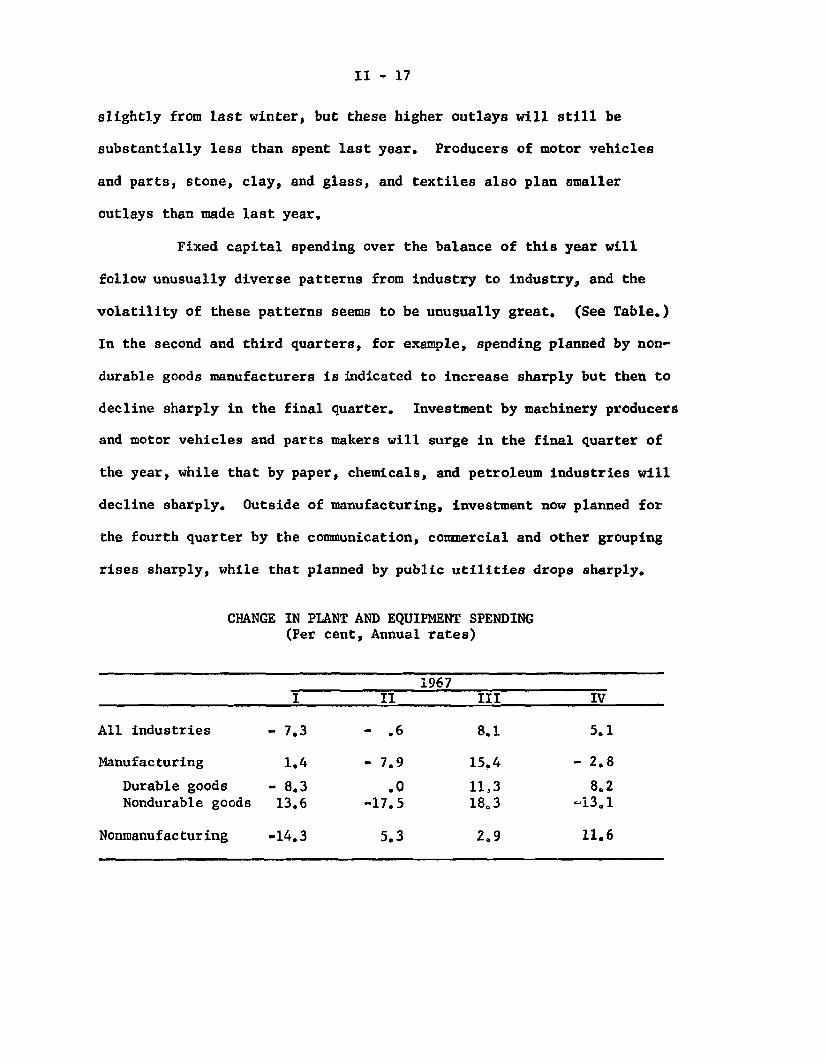
Fixed capital spending over the balance of this year will
follow unusually diverse patterns from industry to industry, and the
volatility of these patterns seems to be unusually great. (See Table.)
In the second and third quarters, for example, spending planned by non-
durable goods manufacturers is indicated to increase sharply but then to
decline sharply in the final quarter. Investment by machinery producers
and motor vehicles and parts makers will surge in the final quarter of
the year, while that by paper, chemicals, and petroleum industries will
decline sharply. Outside of manufacturing, investment now planned for
the fourth quarter by the communication, commercial and other grouping
rises sharply, while that planned by public utilities drops sharply.
CHANGE IN PLANT AND EQUIPMENT SPENDING(Per cent, Annual rates)
1967I II III IV
All industries - 7.3 - .6 8.1 5.1
Manufacturing 1,4 - 7.9 15,4 - 2.8
Durable goods - 8.3 .0 11,3 8.2Nondurable goods 13.6 -17.5 18.3 -13.1
Nonmanufacturing -14.3 5.3 2.9 11.6

II - 18
Nanufactuers' unexpected funds on plant and equipment projects
already underway at the end of March were slightly higher than three
months earlier and 3 per cent higher than a year earlier. New invest-
ment projects initiated by public utilities in the first three months
of this year were up nearly 50 per cent from a year earlier and the carry-
over of public utilities at the end of March was up sharply from both
three months and a year earlier.
Labor market. Renewed growth in employment and the labor force
can be expected in June with the entrance into the labor market of large
numbers of young persons. Most of the 2 million new young workers entering
the labor force should find jobs in private service and in government sectors
where demand for labor continues strong. Special efforts by communities
and business to provide summer job opportunities for young persons are
also being made this year as in previous years. Some temporary rise in
unemployment may occur and will mainly reflect the search for permanent
jobs by college and high school graduates who may take longer to find
the kind of job most suited to their training and experience.
Employment changes in May continued to reflect a pattern of some
weakness in the labor market. Total nonagricultural employment dipped
for the second month in a row and manufacturing employment experienced the
fourth consecutive month of decline. However, there were some signs that
the dip in employment may have been leveling off; the decline in factory
jobs in May was smaller than in previous months and the weekly figures on
unemployment insurance claims suggested that fewer layoffs were occurring
toward the end of May and in early June, Moreover, the labor market

II - 19
continued to remain remarkably tight in the face of several months of
easing employment. The unemployment rate in May was 3.8 per cent, up
only one-tenth over the month, and still one of the lowest rates in
a dozen years,
Total nonfarm employment was downby 44,000 in May, and
165,000 from its March 1967 peak. But the decline in May was much
more moderate than had occurred in the previous month. Employment
declines in durable goods manufacturing industries in May were generally
smaller than in recent months and were concentrated in the primary and
fabricated metals industries. In transportation equipment, employment
rose as auto production increased from its April level. In fact,
aside from the reduction of 47,000 in the rubber industry, where workers
of three big companies were on strike, employment in most manufacturing
industries, durable and nondurable, was relatively unchanged over the
month.
Other than in government and the private services, employment
in the nonmanufacturing sectors of the economy has shown little buoyancy
in the past several months. Employment in transportation and public
utilities has shown no employment increase at all since January; this
is not unusual in a period of employment slack for this cycle-sensitive
industry, whose employment changes are tied closely to those of manu-
facturing, But the relative lack of employment growth has also been
apparent in trade and construction. Trade has provided little upward
momentum to employment so far this year. A large rise in seasonlly adjusted
II - 20
trade employment in April was virtually eliminated after a re-examination
and revision of the seasonal factors for the Easter period. Trade
employment showed little change in May, and remained only slightly
above the January level,
Construction employment was reduced substantially further in
May, and after three months of decline, it was some 200,000 below
February, and a quarter million below its peak in March 1966. Part
of the 100,000 decline this May reflected the unusually cold and wet
spring in many parts of the country; in part, the seasonally adjusted
dip reflected the relatively large number of small strikes that accompany
increased collective bargaining at this time of year.
Unemployment, The remarkable stability of the overall
unemployment rate continued in May despite the lack of growth of
employment; the 3.8 per cent rate in May was about the same as a year
earlier, when economic activity was expanding at a very rapid rate. The
decline in demand for manpower in the past several months has resulted
in a reduction in the labor force instead of a rise in overall unemploy-
ment. Seasonally adjusted, total employment contracted by almost one
million between January and May, and the civilian labor force dipped
by nearly an equal amount.
Although unemployment as a whole has not reflected the employ-
ment slowdown, it has been apparent in a rise in the unemployment rate
among the more vulnerable groups of the working population. Thus, the
unemployment rate has risen between January and May for nonwhite workers

II - 21
(from 6.6 to 7.8 per cent), and for blue collar workers (from 4.2 to
4.6 per cent), especially at the least skilled level, most affected
by the reduction in factory jobs. Unemployment in manufacturing has
risen from 3.3 to 3.9 per cent during this period.
MAJOR UNEMPLOYMENT INDICATORS
Unemployment rates, Seasonally adjustedJanuary 1967 May 1967
Total 3.7 3.8
Men, 20 years and over 2.2 2,4
Women, 20 years and over 4.3 3,9
Both sexes, 16-19 years 11.0 13.1
White-collar workers 2,1 1.9
Blue-collar workers 4.2 4.6
Service workers 4.6 4.1
Construction 7.5 7.8
Manufacturing 3.3 3.9
Finance and service 3.9 3.5
Curtailed employment has also been reflected in unemployment
insurance claims, which continue to run about 300,000 higher than
last year at this time. But there has been a tapering off in initial
claims for unemployment compensation in late May and early June. These
now average about 20 per cent above a year earlier; initial claims had
been running 35 to 40 per cent above year-earlier levels during most
of March and April.

II - 22
Wages and collective bargaining. Upward pressure on wages
has continued quite strong in the second quarter. The settlement reached
in late May between 450,000 members of the teamsters union and the trucking
industry provided for about a 5.5 per cent annual increase in wage and
fringe benefits. In major contract settlements reached in the first
quarter, annual costs of wage and fringe packages were already higher
than in 1966--nearly 5 per cent compared with 4-1/2 per cent. Some of
the construction settlements so far this year are providing adjustments
even larger than those negotiated in 1965 and 1966.
AVERAGE HOURLY EARNINGSPercentage Changes from Year Ago
April-MayI Q-'66 I Q-'67 1967
Private nonfarm 3.7 4.4 3.9
Manufacturing 3.5 4,1 3.7
Durable goods 3.3 3.5 3.3Nondurable goods 3.0 5.0 4.7
Construction 3.8 5.0 4.5
Although negotiated wage increases and fringe benefits received
have been higher than last year, a slower rate of increase in average
hourly earnings has become increasingly evident in recent months. In
private non-farm establishments, average hourly earnings were 4.4 per
cent higher in the first quarter than a year earlier; by April and May
the gain was less than 4 per cent. The slowdown has been evident in both
manufacturing and construction. In manufacturing it reflected in part
the reduction in overtime hours at premium pay and smaller gains in those
industries whose wages are tied to cost-of-living escalators. Unit labor
costs in manufacturing continued to rise in May and are considerably higher
than a year earlier.
II - 23
Prices. Prices of farm products spurted in May, following a
sharp decline over the preceding 7 months, and the total wholesale price
index moved up 0.5 per cent to 105.8 per cent of the 1957-59 average,
according to the BLS preliminary estimate. Prices of industrial commodi-
ties meanwhile remained stable for the third consecutive month, at a level
1.2 per cent above May 1966. In April, the consumer price index rose
somewhat more than in the winter and early spring.
The abrupt reversal in May of the earlier, protracted decline
in prices of farm products reflected mainly a dramatic turnabout in hog
and pork prices accompanying an unexpectedly sharp drop in marketings.
Prices of beef cattle also moved up, but moderately. A sizable seasonal
decline in pork production is usual for May, (continuing to mid-year),
but this year's decline far exceeded usual seasonal expectations, amount-
ing to over 8-per cent on a seasonally adjusted basis. Seasonally adjusted
beef production declined 3 per cent, and total output of red meat and
poultry was down 5 per cent from the high April level though still 5 per
cent above May a year ago.
The pricing date for the BLS wholesale Price Index has been
shifted, beginning with January 1967, to the Tuesday (or Monday for
some farm products) of the week in which the 13th of the month falls.
(Formerly it was the week containing the 15th.) The pricing date for
the May index thus fell quite early in the month--the 8th or 9th. By
that date prices of hogs were up about a fourth from April, but by the
end of the third week of May, when pork production actually fell somewhat

II - 24
below a year earlier (Jan.-April production was about 20 per cent above
the very low level in the corresponding 1966 period ), hog prices had
advanced nearly 15 per cent further. In late May and early June, pork
production showed an appreciable margin over a year earlier again, and
hog prices receded considerably. The June wholesale price index (with
the pricing date the 12th and 13th) will thus incorporate only a moderate
further gain in prices of hogs and pork--and a small further increase
in beef cattle prices.
In May, partly offsetting the upturn in prices for hogs and
cattle, prices declined substantially for commercial vegetables; and
cotton, eggs, and manufactured animal feeds also decreased.
Sustained stability in wholesale industrial prices in early
May (as indicated by the BLS preliminary estimate) appears to have
reflected the continuing balance of price declines for sensitive indus-
trial materials--notably hides, nonferrous metals, and some textile
materials--and a further upcreep in prices of the so-called sluggish
materials and also price increases for some finished industrial products.
Increases were recorded in last month's estimate for chemicals, gasoline,
some apparel items and commercial furniture, but for the first time in
22 months, prices of machinery and equipment reportedly declined slightly.
Since mid-May average prices of basic industrial materials
have increased somewhat, with moderate gains in copper, scrap, hides,
and rubber, which have declined very sharply since mid-1966, and slight
increases for tin and wool tops. Whether the earlier substantial down-
ward adjustment in prices of sensitive industrial materials is indeed
II - 25
over depends in part on uncertainties about the domestic and world supply
situation (exacerbated currently by the Middle East situation and, for
copper, in part by the forthcoming domestic wage negotiations) and in
part on the outlook for domestic demands--which most observers think
will strengthen later in the year--and for foreign demands, which still
appear a little uncertain. Despite an apparent ebbing of the Mid-East
crisis, there is great uncertainty about the continuing availability of
petroleum from that region. A pick-up in European demand for U.S. petro-
leum is thus possible, with an accompanying rise in prices.
With average prices of industrial commodities stable since
February, the rise in the first 5 months of the year amounted to only
0.4 per cent--or an annual rate of 1 per cent. In the 5 preceding months
(July to Dec. 1966), these prices (as measured by the special FR index)
showed even less rise--an annual rate of only 0.2 per cent. The small
increases over these two recent 5-month periods contrast with increases
at rates of 3.1 per cent from February to July 1966 and of 2.4 per cent
from September 1965 to February 1966. Table I below shows the changes
in this index (and also the total wholesale price index and foods and
foodstuffs) over these successive periods, together with major sub-group-
ings which account for the movement in the total. Of special significance
over the past 5 and 10 months has been the drop in prices of sensitive
industrial materials. Also, in the first 5 months of this year, the
rise in prices of producers' equipment slowed abruptly from the rapid
rate of expansion during the last 10 months of 1966, resulting in an
appreciable slackening in the rate of increase in average prices of indus-
trial products.

TABLE I
WHOLESALE PRICES-F.R. GROUPINGS OF BLS INDEXES(Per cent changes, at S.A.A.R.)
Successive n Fo U
5-month periods:
Sept. 1965 to Feb. 1966 5.5 15.3
Feb. to July 1966 2.2 .5
July to Dec. 1966 -1.2 -5.3
Dec. 1966 to May 1967 - .2 -4.3
1/ May 1967 figures partly estimated.
2.4 2.6 3.6 2.4 1.9 2.4 1.4 .5 2.4
3.1 3.6 4.1 3.1 2.6 3.4 2.2 1.2 2.4
0.2 -1.4 -11.0 1.9 2.4 4.8 1.7 2.6 1.2
1.0 .7 - 2.2 1.7 1.4 1.2 1.7 -- 2.2
TABLE II
CONSUMER PRICES(Per cent changes, at S.A.A.R.)
Food Commodities less food SSuccessive All At Away Nondurables Durable S e r v i c e
6-month periods: Items Total t Away Total Nondurables Durable Totalp I home from home Total lAparellOther Totals
Oct. 1965 to April 1966 3.8 7.8 9.0 4.0 1.4 1.8 1.4 2.0 0.4 4.0
April to Oct. 1966 3.6 2.8 2.0 6.0 3.0 3.4 5.2 2.6 2.4 5.0
Oct. 1966 to April 1967 1.4 -3.2 -5.2 5.0 1.4 2.8 2.8 2.6 -0.2 4.0

II - 27
The consumer price index rose more rapidly in April than in
the preceding 5 months--despite a further drop in food prices. The step-
up reflected mainly a sizable spurt in average prices of non-food commodi-
ties (in part seasonal): apparel and house furnishings and supplies
continued to rise, and gasoline prices increased sharply--as did prices
of used cars. Lower prices were reported for new cars and appliances.
As a result of a recent increase in wholesale prices announced by a major
producer, retail prices of appliances might now be rising, but in June
some of the new color-TV lines are reportedly coming on the market at
lower prices. Used car prices at auction appear to have declined in
May. Assuming, however, that retail prices of non-food commodities will
continue to trend upward--reportedly under the influence of higher pro-
duction and marketing costs as well as demand influences--and that
service prices will, of course, continue to rise, the rise in the CPI
may well be augmented beginning in May by renewed expansion in food
prices at grocery stores--as a result of the recent and anticipated
further strengthening in prices of foodstuffs at wholesale.
Table II shows that declining food prices (at home, not at
restaurants) contributed significantly to the marked slowing of the rise
in the CPI over the 6-month period from last October to April--just as
earlier and particularly from October 1965 to April 1966, sharply rising
food prices had helped boost expansion in the CPI.

II - 28
Exports of farm products, July 1966-March 1967. Exports of
farm commodities were maintained at close to year earlier levels in the
first nine months of the fiscal year. The aggregate value was up 3 per
cent because of higher prices since physical volume was down 3 per cent
from a year earlier, as shown in the table. Volume of shipments of
wheat, feed grains except sorghum grain, oilseeds and products, and
dairy and poultry products were less than a year earlier. Commodities
shipped in larger volume than a year ago were cotton, tobacco, hides,
rice, dried edible beans and peas, and some minor food items. Pre-
liminary data show that exports of grains continued to sag in April
while tobacco and cotton maintained margins above a year earlier*
VALUE OF EXPORTS OF FARM PRODUCTS, JULY-MARCH, 1966-67Percentage changes in value, quantity and prices
compared with a year earlier
Food grains and prep.
Feed grains and prep.
Oilseeds and products
Cotton and linters
Tobacco
Animal products
Fruits and vegetables
Other
TOTAL
Value(In millionsof dollars)
1,299
936
935
429
429
525
366
258
5,179
Percentage changed from ayear earlier
Derived
Value QIuantity prices
7 - 4 11
-8 -12 5
2 -8 11
34 38 -3
29 22 5
-11 -11
-2 -3 5
3 -3 63 -3 6
I

II - 29
A somewhat larger proportion of sales was for dollars than a
year earlier reflecting a shift in the mix of commbdities toward those
typically sold for dollars, a pick-up in commercial wheat sales at the
expense of food-aid sales, and the expanded volume of short-term credit
sales financed by the Commodity Credit Corporation. Sales for dollars
were 5 per cent larger than a year earlier and accounted for 80 per cent
of the total value of farm exports as compared with 78 per cent in the
corresponding period a year earlier. Government-financed exports-were
4 per cent less than a year earlier. Smaller nondollar exports reflected
reduced availabilities of wheat and dairy products for export under
food-aid but these reductions were largely aompensated for by expanded
program exports of feed grains and rice and an increase of 50 per cent
in cotton moving under P L 480 financing. The redirection of Food for
Peace policy since last November to emphasize self-help and the develop-
ment of cash markets in the undeveloped countries is also a factor in
the shift from nondollar to dollar sales.
U. S. farm commodities moved into world trade at higher prices
than a year earlier with the exception of cotton, as shown in the table.
New legislation governing cotton provides for holding market prices of
cotton for domestic use and export in line with world prices and for
stabilizing growers' incomes by means of compensatory payments. Cotton
exports are, running well above a year earlier and a 5-million bale
export is in prospect for the year ending on August i, Wheat and flour
shipments of 582 million bushels in the July-March period were 6 per
cent less than a year earlier reflecting a decline in commercial sales
since December in the face of increasing competition and the excercise

II - 30
of more stringent controls on food-aid shipments throughout the year,
Although exports to India of 113 million bushels of wheat were 45 per
cent below a year earlier, India was still our biggest customer. Feed
grains felt the effects of larger crope in importing and exporting
countries and higher U. S. prices relative to world prices. Tobacco
exports were larger because of expanding consumption abroad and the
mandatory United Nation sanctions against Rhodesian tobacco. The big
increase in rice exports was almost all in food-aid io the Ear East,

nI-c-1
ECONOMIC DEVELOPMENTS - UNITED STATESSEASONALLY ADJUSTED
6/13/67
EMPLOYMENT AND INEMPLOYMENTMILLIONS OF PERSONS ESTAB BASISNONAGRICULTURAL EMPLOYMENT TOTAL RATIO SCALE_ - 4-- -- - --MAY 654
WORKWEEK AND LABOR COST IN MFG.HOURS I AVERAGE WEEKLY HOURS '..""RATIO SCALE
MAY 403
PRODUCTION WORKERS
1961 1963 1965 1967
WHOLESALE
L\ APR 1051
INDUSTRIAL COMMODITIES \
APR 1007
r- - SENSITIVE" ' INDUSTRIAL
MATERIALS
195759100 TOTAL UNIT LABOR COST APR 1RATIO SCALE 1049
ALL EMPLOYEES
ALL EMPLOYEES
1961 1963 1965 1967

I-C-2
ECONOMIC DEVELOPMENTS - UNITED STATESSEASONALLY ADJUSTED
6/13/67
BILLIONS OF DOLLARS ANNUAL RATES I I 1 70
RATIO SCALEQm 6 0
60NEW PLANT ANDEQUIPMENT-EXPENDITURES-- 50
(coM -S E C)
40
PER CENT 12GNP FIXED INVESTMENT IAS SHARE OF GNP 1io7 -
--- --- 10
lilii Iill~ll.. .- .1961 1963 1965 1967
INSTALMENT CREDITBILLIONS OF DOLLARS RATIO SCALE I
l ll"" 90
ANNUAL RATES APR 793---- 80
-APR 76 77 0
EXTENSIONS /i-t- ill -I1-I I- U-- II .6 01v VREPAYMENTS
--- 50
40
NET CHANGE IN OUTSTANDING 12
1961
-I F IMACHINERY ANDEQUIPMENT
^ ^ - ^" / < A
AP 45
APR 33
A -
DEFENSE PRODUCTS
1963 1965 1967
1961 1963 1965
BUSINESS INVESTMENT
1967

III - 1
DOMESTIC FINANCIAL SITUATION
Bank credit. Banking developments in recent weeks have
continued to be dominated by a reduction in loan demands and by
temporary special factors which have tended to moderate the rate of
growth of bank credit. Tax payments, after having been greatly
increased by accelerated schedules earlier in the year, were consider-
ably smaller in May. Not only did these lower payments--along with the
more modest pace of inventory accumulation--reduce the bank credit
demands of businesses, but they also permitted a greater proportion of
cash inflows of businesses--from the capital market and other sources--
to be used to repay bank loans. Moreover, with Federal expenditures
rising, reduced tax inflows led to a sharp reduction in Treasury
balances at commercial banks. And with business firms repaying bank
loans and adding to their interest-bearing assets, not all of the reduc-
tion in Treasury deposits reappeared as private demand balances, so that,
net, the deposit inflow to banks in recent weeks has been much smaller
than in earlier months.
As a result of these developments, member bank credit, on a
daily average basis (the credit proxy), during May is estimated to have
expanded at only about a 2.0 per cent seasonally adjusted annual rate.
From month-end to month-end, the credit proxy declined at an almost
3 per cent rate. On the other hand, the all commercial bank end-of-
month series shows about the same rate of growth as in April--about 8.5
per cent. It is possible that the smaller nonmember banks have
III - 2
experienced somewhat better deposit inflows than the larger member banks.
But the main explanation for the difference is that the all commercial
bank end-of-month series--calculated from last Wednesday-to-last Wednesday
of the month--probably was inflated by the fact that the last Wednesday
of May was also the final day of the month. Turn of the month develop-
ments increasedbank credit sharply for a day or two and these pressures
were fully reflected in the end-of-month series in May.
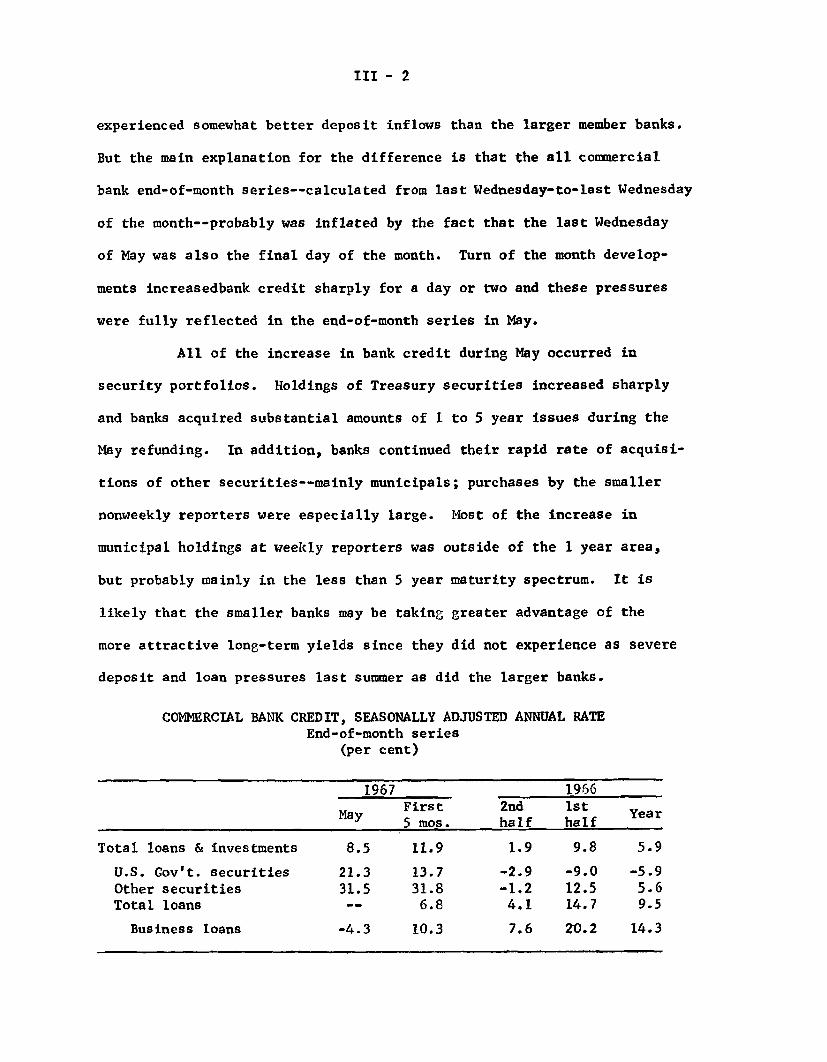
All of the increase in bank credit during May occurred in
security portfolios. Holdings of Treasury securities increased sharply
and banks acquired substantial amounts of 1 to 5 year issues during the
May refunding. In addition, banks continued their rapid rate of acquisi-
tions of other securities--mainly municipals; purchases by the smaller
nonweekly reporters were especially large. Most of the increase in
municipal holdings at weekly reporters was outside of the 1 year area,
but probably mainly in the less than 5 year maturity spectrum. It is
likely that the smaller banks may be taking greater advantage of the
more attractive long-term yields since they did not experience as severe
deposit and loan pressures last summer as did the larger banks.
COMMERCIAL BANK CREDIT, SEASONALLY ADJUSTED ANNUAL RATEEnd-of-month series
(per cent)
1967 1966y First 2nd 1st
May Year5 mos. half half Y
Total loans & investments 8.5 11.9 1.9 9.8 5.9
U.S. Gov't. securities 21.3 13.7 -2,9 -9.0 -5.9Other securities 31.5 31.8 -1.2 12.5 5.6Total loans -- 6.8 4.1 14.7 9.5
Business loans -4.3 10.3 7.6 20.2 14.3
III - 3
While bank security purchases increased dharply in May--with
some lengthening of maturities--there was no change in total loans and
a moderate decline in business loans at all commercial banks--the latter
centered at the large weekly reporting banks. Even machinery, and
chemical and rubber manufacturers, whose loans had been strong earlier,
have shown weak borrowing patterns recently; in addition, loans to
textile firms and retailers have shown less than normal strength with
the weakness in borrowing by retail firms, it is thought, reflecting
reduced financing demands of automobile dealers. Loan demands of
fabricated metals and miscellaneous durable goods manufacturers--
industries affected by defense outlays--continue to show strength.
Construction loans have shown modest expansion, continuing the trend
that began this spring.
Nonbusiness loans also declined in May. Security loans fell
as Government dealer positions were lightened, and finance company loans
continued to be repaid, most probably from funds obtained in the commer-
cial paper market.
Bank deposits. Seasonally adjusted daily average member bank
deposits expanded by only $400 million in May. This small total deposit
growth, however, was due entirely to the sharp decline in Treasury
balances, a decline only partially offset by other deposit inflows.
Private demand balances, which had declined in April as tax
payments were accelerated, expanded sharply in May as Treasury balances
were drawn down. As a result, the money stock expanded at over a
III - 4
13 per cent annual rate in May. The increase in private demand balances,
however, was less than the decline in Treasury balances, since the public
used some of its demand balances to repay loans and acquire interest-
bearing assets.
The April-May fluctuation in private demand deposits obscures
somewhat the underlying trend of growth in the money stock. However,
the average growth rate over April-May at 4.5 per cent was still some-
what below the first quarter rate of 5.9 per cent. While the money
stock has increased fairly rapidly thus far this year, turnover of
demand deposits has remained about the same as in the last half of 1966.
Inflows of time and savings deposits continued at a relatively
rapid 15 per cent rate in May, not very different from the 17 per cent
average of the preceding four months. As can be seen in the next table,
at weekly reporting banks the sum of passbook savings and time deposits
other than CD's continued to expand more rapidly than last year, when
funds from banks and other financial institutions were being attracted
into market securities. In addition, weekly reporting banks in May
stepped up their CD issuance, increasing their outstandings by almost
$500 million after April run-offs of over $700 million. Preparation
for June CD maturities, tax period loan demands, sharp declines in
Treasury balances, and perhaps increasing expectation of higher rates
later this year, contributed to bank efforts to increase outstanding
CD's.

III - 5
TIME AND SAVINGS DEPOSIT INFLOWS, WEEKLY REPORTING BANKSLATE APRIL TO EARLY MAY 1/
(Millions of dollars, not seasonally adjusted)
1967 1966 1965
Total time and savings deposits +1,397 +882 +915
Negotiable CD's + 495 +245 +327
Other time2/ + 487 +921 +199
Savings + 415 -284 +389
2/Memo: Other time- plus savings + 902 +637 +588
1/ Five weeks ended May 31, 1967, June 1, 1966, and June 2, 1965.2/ Other than large negotiable CD's.
In May, these efforts were reflected in a 25 to 50 basis
point increase in CD offering rates, with the largest increases posted
for over 180-day paper. Early in June, additional scattered rate
increases of 12 to 25 basis points were made on longer CD's--to posted
levels as high as 5 per cent. With yields on competing paper declining
throughout May, the negotiable CD became a relatively much more attrac-
tive instrument than it had been in March and April, although not as
attractive as in 1965 and the first half of 1966. For example, newly
offered 3 to 6 month CD's yielded about the same return as finance
company paper in early June, while in April they yielded 35 to 40 basis
points less. Relative to dealer placed commercial paper, the yield gap
narrowed from 65 basis points in April to 25 basis points early in June.
Moreover, with the continued decline in 90-day Treasury bill yields, the
spread in favor of comparable maturity CD's rose to almost 90 basis points.
III - 6
Efforts to lengthen the maturity of CD'slsold during May by
raising offering rates and other sales efforts were successful at banks
in New York City and Chicago but not elsewhere. At banks in both cities,
preliminary information indicates that the average maturity of May sales
was the longest since January, a time when banks were aggressive bidders
for CD's, and depositors were interested in obtaining longer-term yield
commitments. At banks in Chicago, CD's with maturities of 6 months or
more rose to one-fourth of May sales and in New York they accounted for
one-fifth of sales. At other weekly reporters, average maturity of sales
declined somewhat.
Corporate and municipal bond markets. After advancing
steeply from early April to early June, yields on corporate bonds have
stabilized recently and those on municipal bonds have edged lower.
Recent issues of new municipal bonds have been well received reflecting
the reappearance of demand for longer maturities from commercial banks
and fire and casualty companies. But the reception of recent new cor-
porate issues has been mixed, and with the near-term calendar of such
offerings remaining very heavy, the recent tendency toward stability in
this market is still precarious.
Several factors seem to account for the early June halt to
the general bond yield advance. Perhaps most important was the growing
belief among market participants that the steep April-May yield increases
had already discounted a large part of possible future credit develop-
ments. This view was reinforced by new economic data which apparently

III - 7
were interpreted by some as evidence that the expected 1967 recovery
would be more belated than the earlier market consensus seemed to imply.
At the same time reports from Washington of the impending Federal deficit
led some market participants who had virtually dismissed the possibility
of a tax increase in the current Congress to question whether such action
might not be taken after all. Finally, Federal Reserve purchases of
Treasury coupon issues helped to reinforce the more fundamental forces
that were already tending to moderate interest rate expectations.
BOND YIELDS(Weekly averages, per cent per annum)
Corporate AaaNew Seasoned State and local Government
With call Without call Moody's Bond buyer'sprotection protection Aaa (mixed qualities)
19651/
End of July- 2/ 4.58 -- 4.48 3.16 3.25Early December 4.79 - 4.60 3.37 3.50
1966
Late summer high 5.98* -- 5.44 4.04 4.24
Weeks ending:3/February 3- -- 5.21 5.02 3.25 3.40
March 31 5.21* -- 5.12 3.46 3.54
May 12 5.58* 5.79 5.19 3.65 3.88May 26 5.68* 6.12** 5.35 3.78 3.96June 9 5.70* 5.76 5.37 3.76 3.90
1/ Week prior to President's announcement of increased U.S. involvement inVietnam.
2/ Week preceding Federal Reserve discount rate increase.3/ 1967 low.* Some issues included carry 10-year call protection.** Unrepresentative.

III - 8
During May when bond yields were still rising, a sizable
number of scheduled issues in both the corporate and municipal markets
were postponed. Altogether seven corporate issues aggregating $360
million were postponed (or reduced in size), and 22 municipal issues
totaling $225 million were postponed. Although May volume was somewhat
less than estimated earlier because of the postponements, forward
calendars have continued to grow and would very likely be augmented
further by a rescheduling of the postponed issues if yields were to
drop back from current levels.
Public offerings of corporate bonds in June are expected to
exceed the reduced volume of offerings in May by more than $500 million.
In fact, the June volume may exceed the all-time record of $1.6 billion
registered in March. However, if private placements continue to con-
form to the pattern of the first quarter, total corporate security
offerings for June--including stocks and private placements as well as
public offerings--are likely to fall short of the $2.4 billion total
sold in June 1966. Stock offerings in June last year were very large.
Looking further ahead, corporate offerings already scheduled
for the third quarter are unusually large. Public bond offerings with
dates set for July now aggregate $1.0 billion and in the absence of
postponements are ultimately expected to be even larger. Similarly,
offerings with dates set for August already exceed $650 million, even
at this early date. Since some institutional investors are also committed
to make large delayed payments during July and September on bonds offered
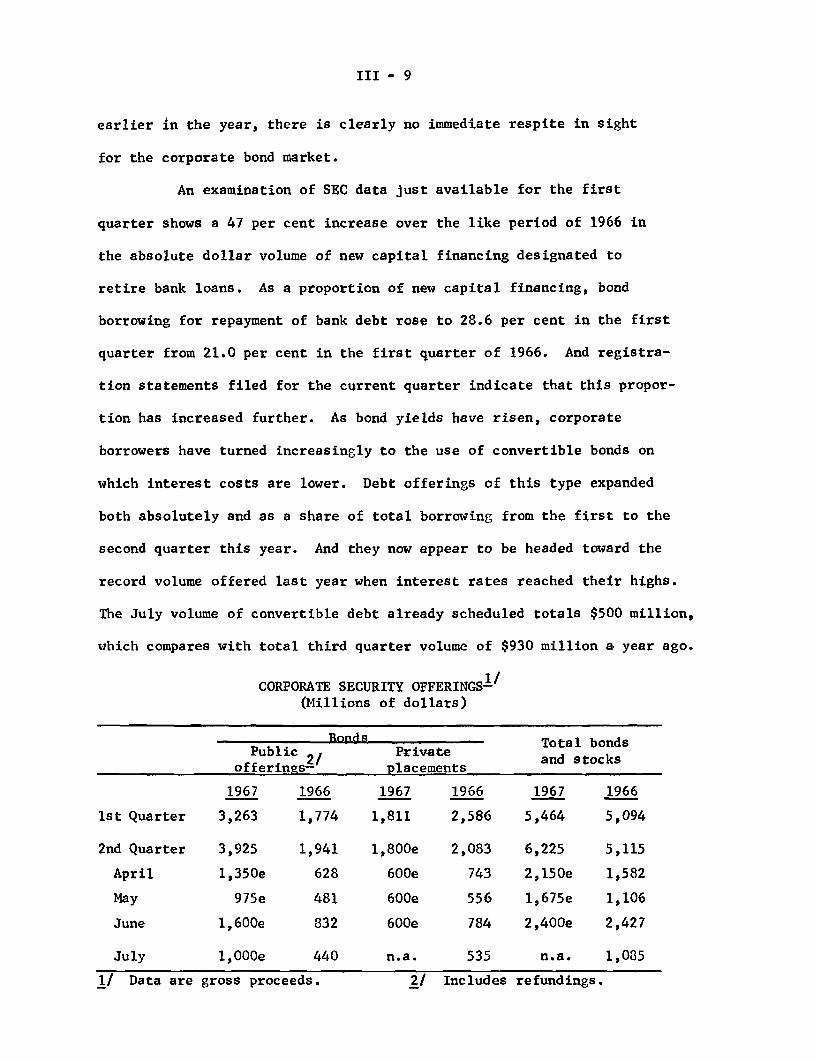
III - 9
earlier in the year, there is clearly no immediate respite in sight
for the corporate bond market.
An examination of SEC data just available for the first
quarter shows a 47 per cent increase over the like period of 1966 in
the absolute dollar volume of new capital financing designated to
retire bank loans. As a proportion of new capital financing, bond
borrowing for repayment of bank debt rose to 28.6 per cent in the first
quarter from 21.0 per cent in the first quarter of 1966. And registra-
tion statements filed for the current quarter indicate that this propor-
tion has increased further. As bond yields have risen, corporate
borrowers have turned increasingly to the use of convertible bonds on
which interest costs are lower. Debt offerings of this type expanded
both absolutely and as a share of total borrowing from the first to the
second quarter this year. And they now appear to be headed toward the
record volume offered last year when interest rates reached their highs.
The July volume of convertible debt already scheduled totals $500 million,
which compares with total third quarter volume of $930 million a year ago.
1/CORPORATE SECURITY OFFERINGS-(Millions of dollars)
RondsPublic 2
offerings--
1967 1966
1st Quarter 3,263 1,774
2nd Quarter 3,925 1,941
April 1,350e 628
May 975e 481
June 1,600e 832
July 1,000e 440
1/ Data are gross proceeds.
Privateplacements
1967 1966
1,811 2,586
1,800e 2,083
600e 743
600e 556
600e 784
n.a. 535
2/ Includes
Total bondsand stocks
1967 1966
5,464 5,094
6,225 5,115
2,150e 1,582
1,675e 1,106
2,400e 2,427
n.a. 1,085
refundings.
Bonds

III - 10
The volume of municipal securities expected in June continues
at more than $1.2 billion. June will thus mark the sixth consecutive
billion-dollar-plus month of municipal long-term financing, and while
no precise estimates have yet been made, underwriters expect municipal
volume to remain relatively high through the summer. Even so, dealers
have substantially lowered their uncomfortably high level of inventories
and are optimistic about being able to sell near-term offerings at
current yield levels (their advertised inventories have declined over
$300 million from the peak of $850 million reached near the end of
April). A major element in the changed outlook has been the increased
demand for longer-term issues exhibited by both banks and fire and
casualty companies last week. Longer-term maturities attracted little
investor demand during April and May, and with the June calendar of new
issues heavily weighted with such maturities, they were an important
source of earlier market weakness.
STATE AND LOCAL GOVERNMENT BOND OFFERINGS(Millions of dollars) 1/
1967 1966
1st Quarter 4,112 2,9642nd Quarter 3,529e 3,257
April 1,099 1,211May 1,175e 903June 1,250e 1,143
July 950e 702
1/ Data are for principal amounts of new issues.

III - 11
Flows to depositary-type intermediaries. Savings flows to
depositary-type institutions continued at record levels in May for the
sixth consecutive month of significant improvement. While the relative
year-to-year growth was largest at mutual savings banks, all three types
of institutions experienced record inflows for the month.
SAVINGS FLOWS TO DEPOSITARY-TYPE INTERMEDIARIES(In millions of dollars)
1/ Savings Commercial BanksTotal- S&L's Banks Without CD's! With CD's
May2/1967 3,848 1 , 1 0 3- 425 2,320 2,815
1966 1,866 387 115 1,364 1,6761965 1,898 792 188 918 1,2871964 2,081 994 270 817 1,316
Year to date2/
1967 15,276 4,028- 2,093 9,155 12,6001966 7,550 903 560 6,087 7,8041965 10,267 2,587 1,248 6,432 8,9591964 9,530 3,659 1,456 4,415 5,998
1/ Excludes negotiable CD's at weekly reporting banks.2/ Based on a preliminary estimate by the U.S. Savings and Loan League.
NOTE: Not adjusted for seasonal influences.
Despite the rapid continuing increase of savings at depositary-
type institutions, the higher levels of mortgage lending one might expect
to be associated with such large inflows have not materialized. Although
May asset data are not yet available, industry spokesmen report that
savings banks have continued to acquire a relatively large volume of
corporate securities. Similarly, the fact that savings and loan asso-
ciations repaid another $361 million of outstanding advances to the Home

III - 12
Loan Banks in May--a month in which their advances usually expand--
suggests that mortgage acquisitions of S&L's also continued to fall
below normal. According to industry spokesmen this relative failure
of thrift institutions to expand mortgage holdings commensurately with
savings inflows is still chiefly attributable to the relative shortage
of immediately available mortgages.
Comment from the savings and loan industry on the recent
announcement of Home Loan Bank Board changes in dividend rate ceilings
for S&L shares has been generally favorable. The only institutions
affected by the change are those in California, Nevada, Hawaii, and
Alaska. Virtually all of these S&L's, which had previously been paying
5-1/4 per cent on passbook savings will, after July 1, have to choose
between paying a maximum 5 per cent on passbook accounts or a maximum
of 4-3/4 per cent on passbook accounts and up to 5-1/4 per cent on
savings certificates. It is expected that most S&L's in these areas
will offer the straight 5 per cent passbook rates since certificates
are issued in minimum amounts of $1,000 for no less than six months.
All other associations which had previously been authorized to choose
between these two plans, primarily those located where savings banks
are paying five per cent, are expected to continue to offer the 5 per
cent passbook rate. The net effect of this Home Loan Bank reduction is
thus chiefly to narrow the favorable rate advantage allowed the
California S&L's last September.

III - 13
Mortgage market developments. Published series on mortgage
rates are not yet available for May. But with bond yields rising
generally, price markdowns in the secondary market for Federally under-
written home mortgages had spread to all geographic regions by the end
of May, according to unofficial FNMA field reports. It thus seems
clear that at least the sensitive secondary market yield series on FHA
home mortgages turned up during May.
Early in June, trade opinion suggested that while mortgage
funds were still generally available, diversified lenders were taking
more of a wait-and-see attitude toward mortgage investments, with some
lenders showing less eagerness to seek out new commitments and a few
temporarily out of the market entirely, at least for FHA and VA loans.
These attitudes have reportedly reflected the same general expectations
and uncertainties on the economic and credit outlook that contributed
to the spring advance in bond yields. As a result of this latter advance,
the yield spread favoring mortgages relative to corporate bonds undoubt-
edly narrowed further in May, probably close to the near-record low that
prevailed in certain months of 1965 and 1966.
With FNMA keeping its prices on secondary market purchases
unchanged, the turnaround in yields on Federally-underwritten home
mortgages during May was reflected in a sharp rise in offerings to FNMA.
In the week ended June 1, the estimated value of such offerings was
nearly 9 times larger than the extremely low volume only three weeks
earlier, and offerings were running at the highest weekly rate since
last November.

III - 14
Information is not yet available to suggest how widely recent
credit tendencies have affected real estate markets. But sensitive data
on the narrow FHA market sector indicate that seasonally adjusted appli-
cations for FHA insurance on existing homes declined somewhat in recent
weeks, in contrast to an uptrend earlier this year.
Stock market. After touching a new high in early May, stock
prices drifted downward through the rest of the month and into early
June. A combination of less favorable economic news, further sharp
advances in corporate bond yields, and renewed attention to the possi-
bility of a tax increase this year all contributed to the decline, along
with rising tensions in the Middle East. From its May 8th high of 94.58
through June 2, when it closed at 89.79--and before the outbreak of
actual hostilities between Arab and Israeli forces--Standard and Poor's
composite index had declined 5 per cent. After the war started, stock
prices experienced the sharpest single-day decline since President
Kennedy's assassination. But as it became apparent that Israel would
be the victor and major powers would not be drawn into the conflict,
prices rose again. On June 13, Standard and Poor's composite index
closed at 92.62, 2 per cent below the May high.
The net decline in prices of industrial stocks was fairly
pervasive including both blue chip and speculative issues. Trading,
which averaged 9.9 million shares during May, was comparable to the
volume attained earlier in the year when stock prices were rising.
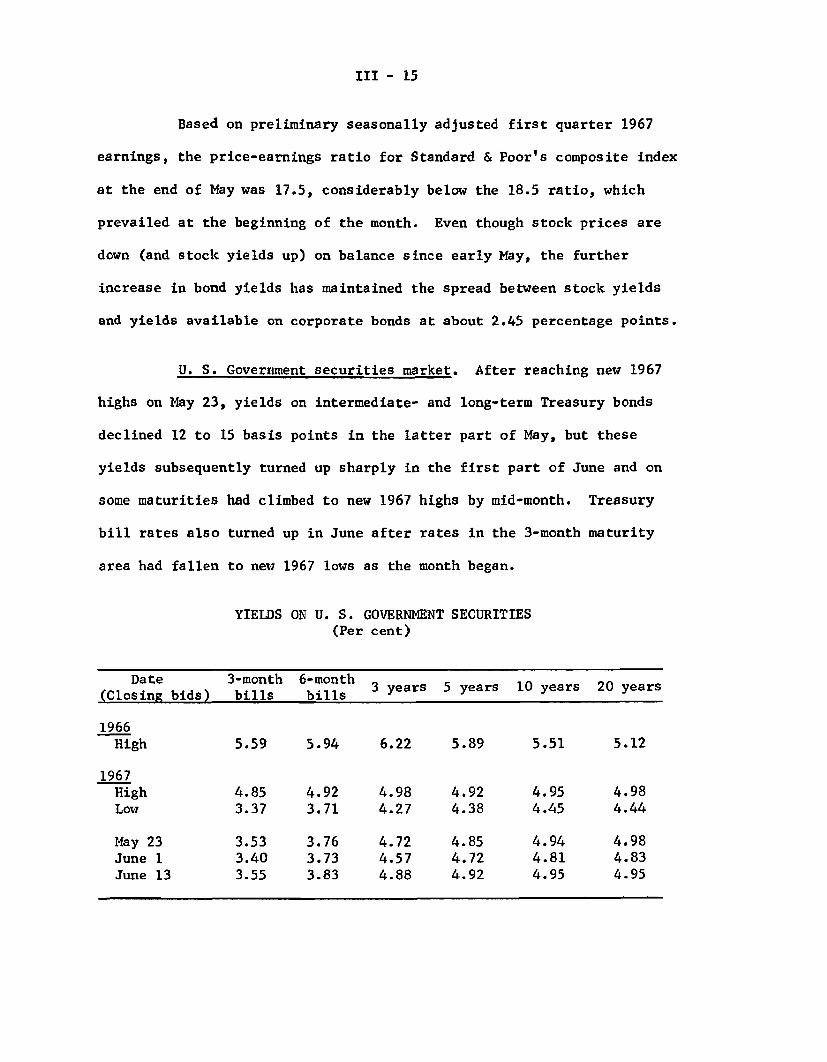
III - 15
Based on preliminary seasonally adjusted first quarter 1967
earnings, the price-earnings ratio for Standard & Poor's composite index
at the end of May was 17.5, considerably below the 18.5 ratio, which
prevailed at the beginning of the month. Even though stock prices are
down (and stock yields up) on balance since early May, the further
increase in bond yields has maintained the spread between stock yields
and yields available on corporate bonds at about 2.45 percentage points.
U. S. Government securities market. After reaching new 1967
highs on May 23, yields on intermediate- and long-term Treasury bonds
declined 12 to 15 basis points in the latter part of May, but these
yields subsequently turned up sharply in the first part of June and on
some maturities had climbed to new 1967 highs by mid-month. Treasury
bill rates also turned up in June after rates in the 3-month maturity
area had fallen to new 1967 lows as the month began.
YIELDS ON U. S. GOVERNMENT SECURITIES(Per cent)
Date 3-month 6-monthDae 3 nth 6-onth 3 years 5 years 10 years 20 years(Closing bids) bills bills
1966High 5.59 5.94 6.22 5.89 5.51 5.12
1967High 4.85 4.92 4.98 4.92 4.95 4.98Low 3.37 3.71 4.27 4.38 4.45 4.44
May 23 3.53 3.76 4.72 4.85 4.94 4.98June 1 3.40 3.73 4.57 4.72 4.81 4.83June 13 3.55 3.83 4.88 4.92 4.95 4.95
III - 16
The late-May rally in the Treasury bond market appeared to
be sparked mainly by professional demand, including dealer short-
covering purchases and buying by so-called trading banks, in conjunction
with moderate System purchases of coupon issues. The latter purchases
gave rise to widespread market discussion concerning their potential
size in the weeks ahead. Views ranged from the feeling that such pur-
chases might constitute an operation twist designed to lower long-term
interest rates to a belief that they formed part of a more routine
program of buying coupon issues to meet part of normal seasonal reserve
needs. The latter view eventually seemed to prevail among market
professionals. The Treasury bond market was also buoyed in late May
by the terms of the long-awaited FNMA offering of $900 million of par-
ticipation certificates: the $650 million offered to the public was
less than had been widely anticipated and the market also reacted
favorably to the relatively short maturities of the new issues (27-months
and 5-years).
The renewed weakness which developed in the Treasury bond
market in the first part of June appeared to be related to continued
congestion in the current and prospective calendar of new corporate
issues and to increasing market focus on the Treasury's large cash needs
in the second half of 1967. The eruption of war in the Middle East had
only a minor and passing effect on the market. Against this background,
dealers developed increasing resistance to some moderate investor selling
of Treasury bonds, including swaps into new corporate issues. Dealer
reluctance to take on bonds was also heightened by the expectation of

III - 17
investor selling later in June on switches in the new FNMA participation
certificates. Despite some further System purchases of coupon issues on
June 5, dealer positions in bonds due after five years rose about $25
million from their late May levels to $120 million on June 13. In the
period since May 23, the System has purchased $222 million of coupon
issues, including $88 million due in more than five years.
The recent uptick in Treasury bill rates has reflected in
part a slowdown in net demand for bills during recent trading sessions
and also the more imminent prospect of a Treasury cash financing expected
in the short-term area. Market supplies of bills have been augmented
recently by Desk sales for System and customer accounts and by sales of
bills by Federal agencies. Demand for bills may have been inhibited by
more aggressive bank bidding for CD funds. Indeed, rates on most com-
peting short-term market instruments have risen recently, as the table
shows.
SELECTED SHORT-TERM INTEREST RATES
1967
April 28 May 23 June 13
Commercial paper 4-6 months 4.75 4.63 4.63
Finance company paper 30-89 days 4.38 4.25 4.38
Bankers' Acceptances 1-90 days 4.25 4.25 4.38
Certificates of deposit (prime NYC)
Typical new issue (posted rates):3-months 4.25 4.38 4.506-months 4.38 4.50 4.75
Secondary market:3-months 4.35 4.50 4.656-months 4.40 4.70 4.85
Federal Agencies (Secondary Market):3-months 3.89 3.82 4.02*6-months 4.19 4.19 4.23*1-year 4.33 4.40 4.65*
Prime Municipals 1-year 2.50 2.75 2.80*
* Rates on June 9.

m-c-1
FINANCIAL DEVELOPMENTS - UNITED STATES
FREE RESERVES AND COSTSBILLIONS OF DOLLARS IT
NE-FREE RESERVES -JUN 7 Z
NET BORROWED RESERVES ____
CHANGES IN BANK CREDITBILLIONS OF DOLLARS I I I I I I I I I I
SEASONALLY ADJUSTED TOTAL A -TOTAL
APR 23 -
3MO MOVING AVERAGE
LOANS -4
A_ AAPR 20 V2
S U.S. GOVT. SECURITIES
,V V FAPR -1 2 2- OTHER SECURITIES APR 14 -2
I e 1 - i1 i I I I I -0
1965 1966 1967
CHANGES IN BANK LOANS-BY TYPEBILLIONS OF DOLLARS | l m F 11 O I I I l I I I I 1 3SEASONALLY ADJUSTEDI AEAMOVING
AVERAGE 2APR 1 4
1965A / 1
BUSINESS A0
I
SFINACIAL 2
ALL OTHER 2
161APR 01
1965 1966 1967
SAVINGS SHARES AND DEPOSITSBILLIONS OF DOLLARS IIlRATIO SCALE APR 1171
SAVINGS AND LOANASSOCIATIONS
APR 56MUTUAL SAVINGS BANKS
I I I I I ] I I I I I I I I I I IL
6/13/67
1963 1965 1967

III-C- 2
FINANCIAL DEVELOPMENTS - UNITED STATES
NET FUNDS RAISED-NONFINANCIAL SECTORSIBILLIONS OF DOLLARS I I I I I I 1100
1963
MARKET YIELDS
1965 1967
PER CENT
NEW HOME FIRST MORTGAGES:/APR 6 3
630-YEAR, FHA-INSURED MAY 57
BONDS AND STOCKS:
NEW CORPORATE Aaa4
I I MAY 37STATE AND LOCAL GOVT. Aaaft
MAY 32 3
COMMON STOCKS DIVIDEND/PRICE RATIO
1963 1965 1967
NEW SECURITY ISSUESBILLIONS OF DOLLARSI I I I I I 3
CORPORATE 2
MA 1 6 2
1966
1
1965
-STATE AND LOCAL GOVERNMENT
Y 211
I i -- ^ - ]F i i ; i 1
.0
.51
.0
.5
.0
.5
SHARES IN TOTAL CREDIT
MARKET YIELDS-U.S. GOVT. SEC.
iATIO SCALE
-MAY 99--
VOLUME OF TRADINGN.Y S E , Av. Daily Volume
1 I I 16 r 7IIj I
MILLIONS OF SHARES_-
6/13/67
PER CENT I PRIVATE DOMESTIC TOPRIVATE INVESTMENT OUTLAYS
TOTAL TO G.N.P
QI 286
QI 92F
MAR. JUNE SEPT. DEC. 1963 1965 1967

IV - 1
INTERNATIONAL DEVELOPMENTS
U.S. balance of payments. Large-scale deficits on the
liquidity basis persisted in the first four months of the year, and
there is not yet any clear sign of change. For the first quarter the
deficit (seasonally adjusted) was $544 million, and would have been
about $1.0 billion if it had not been for special transactions. Such
special transactions include sales of long-term CD's to foreign of-
ficial institutions, similar investments by international agencies,
and advance repayments of Government credits. In April the deficit
was $337 million, before seasonal adjustment. The deficit for the
month was lowered by the early payment (in March) of about $300 mil-
lion of taxes to Libya by petroleum companies and by about $100
million of special transactions. For May the early weekly indicators
show a comparatively small deficit of perhaps $100-200 million, but
reports for the first week of June show another large deficit.
Deficits on the official settlements basis have been far
larger than the liquidity deficits this year. For the first quarter
this balance registered a seasonally adjusted deficit of $1.8 billion,
and in April there was a further deficit of over $600 million, unad-
justed. This balance improved substantially in May. Although there
were wide swings during that month in U.S. banks' liabilities to
their foreign branches, the net change over the month in these lia-
bilities was small. Data are not yet available for overall liabilities
to foreign commercial banks.

IV - 2
The U.S. gold stock declined by $51 million during the first
quarter of 1967. After increasing by $50 million in April as a result
of a purchase from Canada, it declined $20 million (confidential until
published) in May. There was a larger decline than this during the
first week of June, reflecting primarily a sale to Switzerland and the
settlement of May losses by the gold pool.
The full balance of payments accounts for the first quarter,
to be published later this month, identify the transactions responsible
for the persistence of an extraordinarily large liquidity deficit in
that quarter. In the fourth quarter of 1966 direct investment outflows
had been unusually large, possibly reflecting apprehensions about
tightening of restrictions. Also, errors and omissions, which had
been briefly positive in the third quarter -- perhaps reflecting
movements out of sterling, had become negative again in the fourth
quarter. In the first quarter of 1967 there was no further change
in the errors and omissions item, and direct investment outflows
(adjusted for the abnormal transfers to finance petroleum tax payments)
dropped sharply from $920 million to only $700 million.
Offsetting this improvement as well as the $300 million
increase in the merchandise trade balance, several categories of
transactions showed deteriorations.
Income received from direct investments declined by nearly
$100 million to an annual rate of $4.0 billion, no higher than the
annual averages of 1965 and 1966 despite major additions since then

IV - 3
to the amounts invested. Military expenditures abroad rose by $70 mil-
lion to an annual rate of $4.2 billion. This was a relatively large
quarterly increase.
U.S. Government foreign aid and credit operations also
resulted in larger payments, and there were no receipts of debt
prepayments in the quarter. Economic grants were up by $80 million
from the relatively low fourth-quarter rate, largely because of
increased aid shipments to Asia. Disbursements under Government
credits for economic aid also rose somewhat. Other large increases
in Government credit disbursements had little net payments effect
since they had counterparts in Government non-liquid liability
accounts and larger military export sales.
Net purchases of foreign securities of about $240 million
in the first quarter were considerably larger than in the last three
quarters of 1966, when they averaged only about $50 million. Some
of the relatively high first quarter outflow reflects large new
issues by Canada and by the IBRD and IDB, but there was also a
cessation in the sell-off by U.S. investors of outstanding foreign
securities. Purchases of new foreign issues continued high in the
second quarter, again largely for Canada and the international
institutions.
Long-term claims on foreigners reported by U.S. banks
were reduced by over $150 million in the first quarter, seasonally
adjusted, about the same amount as in the fourth quarter. Foreign
claims reported by banks changed little in April.

IV - 4
Financing of direct foreign investments involved the sale
of about $90 million of securities of Delaware affiliates in the first
quarter, and a similar amount of the proceeds of such borrowings was
included in the direct-investment outflow figure. Borrowing abroad on
a similar scale by Delaware affiliates continued in the second quarter.
U.S. merchandise trade. In April the trade surplus con-
tinued the strong improvement of the first quarter. For the first
four months of 1967 as a whole, the trade surplus was at a seasonally
adjusted annual rate of $4.3 billion (balance of payments basis) com-
pared with the exceptionally low $2.9 billion rate in the fourth
quarter of 1966 and $3.7 billion in the full year 1966.
Exports in January-April were at a seasonally adjusted rate
of about $31.0 billion, 5 per cent above that of the fourth quarter
1966 and nearly 10 per cent higher than in January-April 1966.
This expansion in exports was attributable entirely to non-
agricultural products. Exports of farm products, which had turned
down last August, slipped further in the first quarter but registered
a moderate gain in April.
Sales of machinery, particularly computers to the industri-
alized countries and excavating machinery to Australia, have been
strong this year. New export orders have remained high in the first
four months, but increased shipments have kept the backlog of unfilled
orders almost unchanged. There was a sharp rise in civilian aircraft
sales mainly to the Common Market countries and Latin American Republics,
most of which involve an offsetting extension of credit. The upswing

IV - 5 -
in the last six months reflected improvement in deliveries of jet
transports which had been delayed last year due to a shortage of engines.
New pressures on civilian deliveries of engines are again developing
with expanding military orders.
More than one-half of the advance in exports this year over
the fourth quarter level was in increased shipments to East and South
Asia, which included greater U.S. Government financed shipments of
steel-mill products and locomotives to Pakistan and rice to Vietnam,
and commercial sales of raw cotton to Korea and Taiwan. The bulk of
the remaining increase was in shipments to Canada, mainly larger
shipments of duty-free automobiles under the U.S.-Canadian Automotive
Agreement.
Total exports to the industrialized countries -- United
Kingdom, other Western Europe and Japan -- showed little change in
the first four months from those in the fourth quarter 1966.
Shipments to Japan, however, were about 20 per cent higher than in
the first quarter of 1966; sales to the United Kingdom and other
Western Europe were below those of a year earlier.
Imports in April advanced from the preceding two months
but remained well below the January peak. Since the summer of 1966,
imports have remained within a range of $26.4 to $26.7 billion at
annual rates. Among industrial materials, imports of iron and steel-
mill products, aluminum and other metals, and raw wool declined this
year. Total industrial materials imports dipped slightly from late
IV - 6
1966. This was also the case for capital equipment. The rate of
increase in arrival of automotive vehicles and parts slowed noticeably.
Purchases of other nonfood consumer items continued their long-term
uptrend. Imports of foods were sharply larger in the first four
months of this year than in the fourth quarter, as sugar refiners
replenished inventories.
Financial market conditions abroad. The broad de-escalation
of interest rates in industrial countries which began late in 1966
has been interrupted. Bond yields in Germany, now around 6-3/4 per
cent, have fallen little in recent weeks. Since mid-April yields
have risen appreciably in the U.K. and Canada. Bond yields in Japan
have also begun to rise. Declines in short-term rates have tended to
slow in most countries, and in Canada increases occurred in the latter
part of April and in May. In Switzerland, on the other hand, large
inflows of funds from abroad have tended to push interest rates down
recently.
The strongest movement toward easier monetary conditions this
year occurred in Germany, a focal center of recessionary tendencies in
Europe since last summer. Easier German monetary policy has facilitated
capital market borrowing by the Federal, state, and local governments.

IV - 7
SHORT-TERM INTEREST RATES(per cent per annum)
(at dates near month-ends except June 1967)
U.S.: 3-mo. Treas. bill
Euro-dollar: l-mo. depositEuro-dollar: 6-mo. deposit
U.K.: 3-mo. Treas. billCanada: 91 Treas. bill
Germany: 3-mo. interbank loanSwitzerland: 3-mo. Treas. billFrance 1/: Call money
30-day commcl. paper
Netherlands: 3-mos. Treas. billBelgium 4-mo. Govt. cert.Sweden: 3-mo. Treas. bill
1966
Sept. Dec.
5.30 4.79
6.75 6.567.00 6.62
6.60 6.355.01 4.96
6.75 7.004.25 4.504.60 5.704.95 6.06
4.75 4.885.80 6.156.60 6.09
1967More
March
4.09
5.255,38
5.444.13
4.884.505.005.02
4.445.754.53
April May Recent
3.68
4.694.75
5.304.00
4.004.254.814.97
4.505.604.53
3.45
4.885.13
5.134.24
3.564.254.734.90
4.565.504.28
3.50
5.255.44
5.124.31
3.94n.a.4.634.63
4.56n.a.n.a.
1/ Monthly averages.
Private credit demand has remained very weak. The fact that declines in
both short- and long-term rates have slowed in recent weeks seems to be
due in part to the habituation of the Germany economy and financial system
to relatively high interest rates; further declines are impeded as rates
approach levels that are considered "low" (for short-term rates) and "normal"
(for bond yields). But the Bundesbank has not pushed its policies -- for
example, in reducing reserve requirements -- as far as perhaps it might have.
The recent rise in bond yields in Britain has been largely a
reaction to developments unfavorable for the exchange position of sterling.
In Canada bond yields have risen because of increases in U.S. bond yields
IV - 8
and public forecasts of a sizable upturn in the Canadian economy later
in 1967. Increases in Euro-dollar rates in May and June can be attributed
to a combination of seasonal factors and the cessation of U.S. banks'
repayments to the Euro-dollar market.
There were no notable changes in Italian or French interest
rates from early February until May. Italian monetary policy remains
expansive. French policy, in the face of growing slack in the economy,
has been cautiously geared to concern for the French balance of payments
position; since mid-May, however, it has been relaxed somewhat.
In a number of the smaller European countries, moderate declines
in interest rates, resulting in large part from the easing of credit con-
ditions in Germany, have been welcomed in view of the general slackening
of growth in economic activity.
The decline of German interest rates which began in August 1966
has virtually ceased. The earlier substantial decline of German interest
rates reflected the Bundesbank's policy since the beginning of the year of
actively promoting easier credit conditions, and also the very weak private
demand for credit in Germany. Four 1/2 per cent reductions in the Bundesbank's
discount rate have been made this year. Bank liquidity has been fed not only
by the German balance of payments surplus but also by reductions in minimum
reserve requirements. In the five months November through March, the German
banking system added DM 3.2 billion ($800 million) to its holdings of freely
available liquid assets less borrowings from the central bank -- an exception-
ally large amount. There have been further substantial additions to bank
liquidity in the second quarter.

IV - 9
GOVERNMENT BOND YIELDS(per cent per annum)
(at dates near month-ends except June 1967)
1966 1967More
Sept. Dec. March April May recent
U.S. (3-1/2% 1990) 4.77 4.59 4.53 4.68 4.78 4.85
Euro-dollar bonds (H-13 series) 6.81 6.36 6.29 6.13 6.29 6.36
U.K. (War Loan) 7.13 6.82 6.52 6.44 6.62 6.69Canada (5-1/4% 1990) 5.80 5.79 5.47 5.56 5.72 5.76
Germany (6% publ. author, bonds) 8.12 7.57 6.91 6.87 6.74 6.76Switzerland 4.57 4.79 4.84 4.77 4.70 n.a.
France- I (Publ. sector bonds) 6.29 6.44 6.38 6.42 6.39 n.a.ItalyZ/ (Non-govt. bonds) 6.38 6.40 6.39 n.a. n.a. n.a.
Netherlands (4-1/4 and 4-1/2%) 6.47 6.48 5.96 5.95 6.16 n.a.Belgium (20-yr. bonds) 6,76 6.76 6.76 6.77 n.a. n.a.Sweden (15-yr.)!/ 6.52 6.35 5.89 n.a. n.a. n.a.
1/ Mid-month.2/ Monthly averages.
In the first quarter, bank loan expansion (excluding interbank
credit) was only DM 2.1 billion, as compared to DM 7.1 billion during the
same period of 1966. The expansion was confined to loans to the public
sector, which rose by DM 2.3 billion. Borrowing on the bond market in
January-April totaled DM 6.4 billion, or DM 2.1 billion more than in the
same period last year. Here too, the public authorities accounted for
the greater part of the increase in borrowings; last year their access to
the market had been severely limited as a result of tight monetary con-
ditions and falling bond prices. The improvement in the bond market's
absorptive capacity reflects the re-entry of banks as buyers; their

IV - 10
net purchases of bonds in the first quarter (including those of bank
obligations) amounted to DM 1.8 billion.
The private sector has remained reluctant to incur naw debt,
at least through March. Until very recently interest rates were expected
to fall further, and business activity in general showed only little
recovery.
The May 11 action bringing the discount rate to 3 per cent, which
for Germany is a very low rate, was followed by a renewed decline in long-
term bond yields. In recent weeks, however, yields on 6 per cent public
authority bonds have settled near 6-3/4 per cent (compared with 8-1/2 per
cent last summer).
Industrial production in April apparently rose a little (seasonal
adjustment estimated), but new orders, which had risen in March, fell off
again. The value of retail sales in March regained the January level; the
first-quarter average was well above the preceding quarter.
With private demand for credit very weak in Germany, the banks
placed a substantial amount of funds abroad. From the end of November
through April their total external short-term assets less liabilities in-
creased by about $370 million; within the period, year-end repatriation was
followed by larger outflows. (From the end of November through March their
liquid assets abroad -- mainly Euro-dollar deposits -- increased by $80
million; short-term credits to foreigners increased $30 million and lia-
bilities to foreigners decreased $150 million.) This outflow contributed
to holding down German official reserve gains despite the massive trade
surplus; another factor important in this way was official capital move-
ments, including prepayments on military purchases from the United States.

IV - 11
British long-term bond yields have risen moderately since
mid-April -- up to June 8 by about 30 basis points. Expectational
factors played a major role in reversing the earlier rise in bond prices
and decline in yields. The Labor Party's severe defeat in the April
local elections aroused apprehension that the Government might move too
rapidly to reflate the economy. Later developments contributing to
bond market weakness included the unfavorable April trade figures,
De Gaulle's rebuff, and the threat (and ultimate outbreak) of war in the
Middle East.
The Bank of England's three cuts in Bank Rate this year have
been accompanied by a decline of about 1=1/2 per cent in short-term
interest rates. Long-term bond yields had fallen by about 1/2 per cent
before turning up. Since defense of the pound has been given priority
over domestic reflation, each Bank Rate action was delayed until rate
cuts had been made elsewhere, especially in Germany.
Signs of cyclical recovery around the year-end have not been
confirmed by later developments. Manufacturing production in March was
no higher than in January.
French money market rates have remained relatively high this
year and the bond market has remained tight. The decision of the
authorities to maintain relatively high interest rates, despite softness
in the economy, is probably related to what the French see as balance of
payments difficulties; between the end of January and late May, foreign
exchange reserves (including the IMF position) declined by about $60 million,
continuing the slight decline since the fall of last year. However, since

IV - 12
mid-May the banks are being allowed to rediscountlmore medium-term
paper than before, and the Bank of France has lowered its intervention
rate in the market for 30-day funds by 1/2 per cent.
Through the first three months of 1967, bond yields in Italy
continued to show only very minor changes. (Interest rate data are not
available past March.) Nevertheless, Italian monetary policy has re-
mained expansionary. Italy was one of the exceptions to the general rise
of interest rates in 1966, and there has therefore been no need to bring rates
down this year.
The liquidity of the banking system was put under some strain in
the last quarter of 1966 and the first quarter of 1967 by a seasonal balance
of payments deficit and a decline in Bank of Italy credit to the Treasury.
To prevent these factors from slowing down the expansion of earning assets,
the Bank of Italy provided the commercial banks with considerably more
credit through advances and rediscounts than in the corresponding period
a year earlier.
In Japan, monetary policy shifted in April toward restraint.
With economic activity continuing to grow vigorously -- industrial pro-
duction rose 1-1/2 per cent further in April, and was 21 per cent higher
than a year earlier -- the Bank of Japan has become increasingly concerned
about the danger of overheating. Consequently it has been advising the
banks not to make unnecessary or excessive loans. Early in May, the
Bank of Japan required banks to report to it each month their loanable
funds position and lending programs.
The general level of bank lending rates continued to decline
gradually through March, when these rates averaged 7.32 per cent as

IV - 13
compared with a high of 8 per cent in the latter half of 1964. However,
heavy loan demand has put pressure on the call money market and led to
bank liquidations of holdings of national government bonds. Bond yields
have risen, and it has become increasingly difficult to find buyers. The
Bank of Japan has therefore suggested to the Ministry of Finance that it
reduce the volume of planned bond sales.
In Switzerland, as in Italy and Japan, changes in interest
rates have been slow to develop this year. Last year there were relatively
moderate advances in rates. Demand for funds has remained firm this year,
but recent changes in financial markets have nevertheless been toward a
decline in rates, because supplies of funds have been large. Despite the
government's program of voluntary restraints on capital issues, a large
volume of new bonds has been marketed, and with little difficulty. Swiss
banks repatriated liquid funds from abroad in April and May. Recent
large inflows of flight money, influenced by events in the Middle East,
have also added liquidity to the Swiss banking system.
In the Netherlands, Belgium, and Sweden, moderate declines in
short-term interest rates this year have been in part the result of fall-
ing rates and easier credit conditions in large neighboring countries.
The Dutch central bank reduced its discount rate once, by 1/2 per cent,
in March; the Belgian central bank lowered its rate three times, by 3/4
per cent altogether, in February, March, and May; and the Swedish central
bank reduced its rate twice, by 1 per cent altogether.
The Bank for Dutch Municipalities, a major capital market borrower
in the Netherlands, was able to put out a bond issue at the end of May

IV - 14
yielding 6.34 per cent, well below last November's 7.10 per cent. With
recessionary tendencies developing, the central bank in March suspended
the requirements for penalty deposits by banks in cases where they break
through their credit ceilings.
In Belgium, where the capital market is mainly used by the
Government, expectations that government borrowing will again be large
this year have been a principal factor keeping long-tero-bond yields from
falling. Business conditions have remained sluggish.
In Sweden, fiscal policy is still aimed at restricting consumer
demand, but as early as last summer the central bank undertook market
purchases of securities to ease bank liquidity. Also, the counter-
cyclical investment reserve scheme has been activated. From May 19 to
September 30, businesses may draw, under certain rules, from their blocked
deposits at the central bank.
Movements in Canadian long-term bond yields since last December
have in general paralleled those in the United States. Canadian short-
term rates continued to decline until mid-April, but have risen since
then despite the fact that there has apparently been no basic change
in the Bank of Canada's monetary policy. Continued pressures on wages
and costs have led to expectations that an upturn in business would bring
inflation and rapid return to tight money. Although Canada is not in real
balance of payments trouble at present, foreign exchange reserves have
declined slightly this year and there is real concern as to what the position
will be after various favorable developments -- such as initial effects of
the Canadian-U.S. Automotive Agreement and large tourist receipts from
Expo-67 -- are over.

Iy--C-1 6/13/67
U.S. AND INTERNATIONAL ECONOMIC DEVELOPMENTSSEASONALLY ADJUSTED
OF PAYMENTSBILLIONS OF DOLLARS I I I IQUARTIRLY
- 1OFFICIAL RESERVETRANSACTION BASIS
+
01 54
1
LIQUIDITY BASIS
I "r 1 82 2
.. I1 III1961 1963 1965 1967
U.S. MERCHANDISE TRADEBILLONS OF DOLLARS I J5l'"ll ml,,lll 1 35ANNUAL RATES, ADJUSTED FOR STRIKESCENSUS BASIS3 M9 MOV AV (1 2 1) FA 31 2
30
EXPORTSA
- -2F A 25 25
IMPORTS020
- 15
U.S. IMPORTS BY END USE
90-DAY RATESPER CENT I r I i i Ir 7NOT S A
EURO-DOLLARS
JUNE 7
, ^5
JUNE 7448
U.S. C-D'S____ ilI11IlJIl
1964 1965 1966 1967
U.S. BALANCE
1961 1963 1965 1967
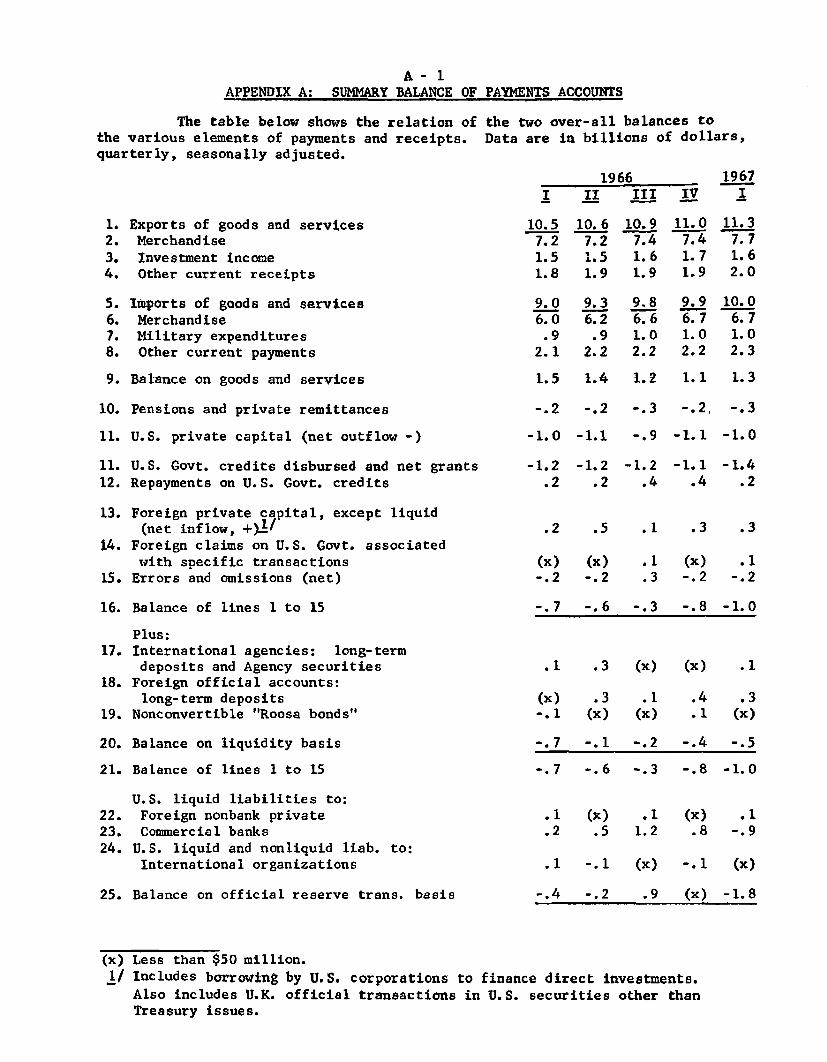
A - 1APPENDIX A: SUMMARY BALANCE OF PAYMENTS ACCOUNTS
The table below shows the relation ofthe various elements of payments and receipts.quarterly, seasonally adjusted.
the two over-all balances toData are in billions of dollars,
1966I II III IV
Exports of goods and servicesMerchandise
Investment incomeOther current receipts
5. Imports of goods and services6. Merchandise7. Military expenditures8. Other current payments
9. Balance on goods and services
10. Pensions and private remittances
11. U.S. private capital (net outflow -)
11. U.S. Govt. credits disbursed and net grants12. Repayments on U.S. Govt. credits
13. Foreign private capital, except liquid(net inflow, +)1/
14. Foreign claims on U.S. Govt. associatedwith specific transactions
15. Errors and omissions (net)
16. Balance of lines 1 to 15
Plus:17. International agencies: long-term
deposits and Agency securities18. Foreign official accounts:
long-term deposits19. Nonconvertible "Roosa bonds"
20. Balance on liquidity basis
21. Balance of lines 1 to 15
U.S. liquid liabilities to:22. Foreign nonbank private23. Commercial banks24. U.S. liquid and nonliquid liab. to:
International organizations
25. Balance on official reserve trans. basis
10.57.21.51.8
9.06.0
.92.1
10. 67.21.51.9
9.36.2
.92.2
10.97.41.61.9
9.86.61.02.2
11. 07.41.71.9
9.96.71.02.2
1967I
11.37.71.62.0
10.06.71.02.3
1.5 1.4 1.2 1.1 1.3
-. 2 -. 2 -. 3 -.2, -.3
-1.0 -1.1 -. 9 -1.1 -1.0
-1.2 -1.2 -1.2 -1.1 -1.4.2 .2 .4 .4 .2
.2 .5 .1 .3 .3
(x) (x) . 1-. 2 -. 2 .3
(x) .1-. 2 -. 2
-. 7 -. 6 -. 3 -. 8 -1.0
.1 .3 (x) (x) .1
(x) .3 .1 .4 .3-. 1 (x) (x) .1 (x)
-. 7 -. 1 -. 2 -. 4 -. 5
-. 7 -. 6 -. 3 -. 8 -1.0
.1 (x) .1 (x) .1
.2 .5 1.2 .8 -.9
.1 -. 1 (x) -. 1 (x)
-. 4 -. 2 .9 (x) -1.8
(x) Less than $50 million.1/ Includes borrowing by U.S. corporations to finance direct investments.
Also includes U.K. official transactions in U.S. securities other thanTreasury issues.
Related Documents