Prefatory Note The attached document represents the most complete and accurate version available based on original copies culled from the files of the FOMC Secretariat at the Board of Governors of the Federal Reserve System. This electronic document was created through a comprehensive digitization process which included identifying the best- preserved paper copies, scanning those copies, 1 and then making the scanned versions text-searchable. 2 Though a stringent quality assurance process was employed, some imperfections may remain. Please note that some material may have been redacted from this document if that material was received on a confidential basis. Redacted material is indicated by occasional gaps in the text or by gray boxes around non-text content. All redacted passages are exempt from disclosure under applicable provisions of the Freedom of Information Act. 1 In some cases, original copies needed to be photocopied before being scanned into electronic format. All scanned images were deskewed (to remove the effects of printer- and scanner-introduced tilting) and lightly cleaned (to remove dark spots caused by staple holes, hole punches, and other blemishes caused after initial printing). 2 A two-step process was used. An advanced optical character recognition computer program (OCR) first created electronic text from the document image. Where the OCR results were inconclusive, staff checked and corrected the text as necessary. Please note that the numbers and text in charts and tables were not reliably recognized by the OCR process and were not checked or corrected by staff. Content last modified 6/05/2009.

Welcome message from author
This document is posted to help you gain knowledge. Please leave a comment to let me know what you think about it! Share it to your friends and learn new things together.
Transcript

Prefatory Note The attached document represents the most complete and accurate version available based on original copies culled from the files of the FOMC Secretariat at the Board of Governors of the Federal Reserve System. This electronic document was created through a comprehensive digitization process which included identifying the best-preserved paper copies, scanning those copies,1
and then making the scanned versions text-searchable.2
Though a stringent quality assurance process was employed, some imperfections may remain. Please note that some material may have been redacted from this document if that material was received on a confidential basis. Redacted material is indicated by occasional gaps in the text or by gray boxes around non-text content. All redacted passages are exempt from disclosure under applicable provisions of the Freedom of Information Act. 1 In some cases, original copies needed to be photocopied before being scanned into electronic format. All scanned images were deskewed (to remove the effects of printer- and scanner-introduced tilting) and lightly cleaned (to remove dark spots caused by staple holes, hole punches, and other blemishes caused after initial printing). 2 A two-step process was used. An advanced optical character recognition computer program (OCR) first created electronic text from the document image. Where the OCR results were inconclusive, staff checked and corrected the text as necessary. Please note that the numbers and text in charts and tables were not reliably recognized by the OCR process and were not checked or corrected by staff.
Content last modified 6/05/2009.

CONFIDENTIAL (FR) December 11, 1970
MONETARY AGGREGATES ANDMONEY MARKET CONDITIONS
Recent developments
(1) Deposit data now available for all of November indicate that
growth in the narrowly-defined money supply was substantially stronger in
the month than indicated either by the estimate based on partial data
shown in the greenbook or by the preliminary week-by-week figures available
to the Trading Desk in late November and early December. According to the
latest estimates, the money supply grew at a 4-1/2 per cent annual rate in
November, and its level was above the monthly figure consistent with a 4 per
cent growth rate for the fourth quarter. The final money supply figure
for October, while showing very little growth on average for the month,
was also a bit above the initial estimate available at the last Committee
meeting. A factor contributing to the larger-than-expected money supply
growth recently may have been a bulge in transactions demand stemming from
enlarged bond and stock market activity.
(2) The bank credit proxy in November also ran a little above
earlier projections, and the gap widened in early December. In addition
to private demand deposits, U.S. Government deposits are larger than
expected, reflecting sales of special securities to foreign official
holders. Banks have continued to substitute time deposits for commercial
paper and, until very recently, for Euro-dollars. Since the Board's
December 1 announcement of regulatory actions affecting the opportunity
cost of obtaining such funds, Euro-dollar borrowings have increased somewhat,
although some of the increase may be seasonal.
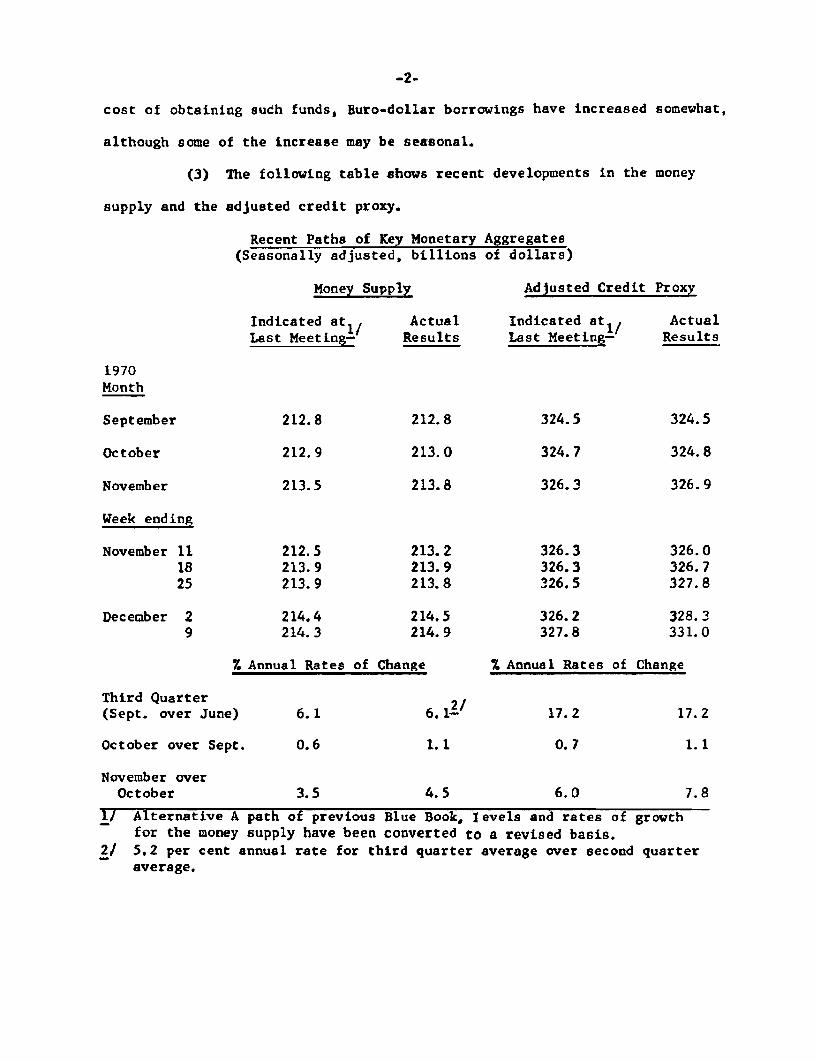
(3) The following table shows recent developments in the money
supply and the adjusted credit proxy.
Recent Paths of Key Monetary Aggregates(Seasonally adjusted, billions of dollars)
Money Supply Adjusted Credit Proxy
Indicated at.Last Meeting-
1970Month
September
October
November
Week ending
November 111825
December 29
212.8
212.9
213.5
212.5213.9213.9
214.4214.3
ActualResults
212.8
213.0
213.8
213.2213.9213.8
214.5214. 9
Indicated at .Last Meetin -
324.5
324.7
326.3
326.3326.3326.5
326.2327.8
7 Annual Rates of Change
Third Quarter(Sept. over June)
October over Sept.
November overOctober
6. 1-
4.5
% Annual Rates of Change
17.2
0.7
6.0
17.2
ActualResults
324.5
324.8
326.9
326.0326.7327.8
328.3331.0
1/ Alternative A path of previous Blue Book, levels and rates of growthfor the money supply have been converted to a revised basis.
2/ 5.2 per cent annual rate for third quarter average over second quarteraverage.
7.8
(4) During the period since the mid-November Committee meeting,
the Federal funds rate was moved down into a 5--5-1/2 per cent range, in
the interest of promoting desired growth in the money supply. Most
recently, Federal funds have been trading at the lower end of the indicated
range, occasionally even dipping below, despite sizable Desk reserve
absorbing operations. Member bank borrowings averaged $370 million in
the past two statement weeks, not much above minimal levels, and about
$60 million below the October-November average. Net borrowed reserves
averaged around $100 million in the past two statement weeks, about $130
million below the October-November average,
(5) The downtrend of market interest rates, begun earlier in
the quarter, was sharply extended during the inter-meeting period, with
yield declines in some short-term markets ranging to as much as another
3/4 of a percentage point, and those in long-term markets generally 1/2
to 5/8 percentage point. Further reductions in the prime rate and the
discount rate, continued weakness in the economy, and anticipations of
still further easing of monetary policy contributed to these declines.
In the Treasury bill market, the key 3-month issue was most recently quoted
around 4.85 per cent, about 40 basis points below its level at the time
of the Committee meeting. The decline in long-term market yields occurred
despite the very heavy calendars of new corporate and municipal bond
offerings. Desk buying of nearly $300 million of Treasury coupon issues
over the period contributed marginally to the declines in long-term rates.
(6) The following table summarizes seasonally adjusted annual
rates of change in major financial aggregates for selected periods.

First Half Third PastPast Year of 1970 Quarter Two Honthe
(Nov. bVoer (June over (Sept. over (Nov. overNov.) December) June) Sept.)
Total Reserves 5.1 -0.2 19.2 - 0.6
Nonborrowed Reserves 8.3 1.9 24.4 0.9
Money Supply 5.1 5.9 6.1 2.8
1/Large CD's (dollar amount)- $12.8 $1.7 $8.7 $2.2
Other time and savingsdeposits 10.0 5.7 15.5 13.1
Savings accountsat nonbank 2/ 3/thrift institutions 6.1- 4.3 10.0 10.8-
Member bank deposits andrelated sources of funds
Total member bank deposits(Bank credit proxy) 9.9 3.3 24.1 12.1
Proxy plus Euro-dollars andother nondeposit sources 7.0 3.5 17.2 4.4
Commercial bank credit(month end)
Total loans and investments 6.5 2.5 17.0 5.1
L&I plus loans soldoutright to affiliatesand foreign branches 6.2 4.5 13.9 3.1
Nonbank commercial paper 4.7 14.2 -17.7 3.5
NOTE: All items are averages of daily figures (with "other nondeposit sources"based on an average for the month of Wednesday data), except thecommercial bank credit series, which are based on total outstanding onlast Wednesday of month, and the nonbank commercial paper and thriftinstitutions series, which are end-of-month data. All additions to thetotal member bank deposit series are seasonally unadjusted numbers,since data have not been available for a long enough time to makeseasonal adjustments.
1/ Actual dollar change over the period in billions.2/ October 1969 to October 1970.3/ September to October 1970.

Prospective developments
(7) Given recent developments, and with a Federal funds
rate generally in a 5--5-1/4 per cent range, it appears that the money
supply may grow at around a 9 per cent annual rate in December, and at
about a 5 per cent annual rate for the fourth quarter. As to the
adjusted bank credit proxy, it may be expected to expand at about a
17 per cent annual rate this month, and by around 8-1/2 per cent over
the fourth quarter. The more rapid growth of the credit proxy in
December, as compared with October-November, reflects not only greater
expansion in private demand deposits but also larger inflows of U.S.
Government and time deposits. Banks have issued a sizable amount of
large CD's in recent weeks, in part to acquire securities at a time of
declining interest rate expectations and partly in anticipation of
seasonal CD run-offs in the latter part of December.
(8) Against the background of a 5 per cent growth rate for
money supply over the fourth quarter, the table on the following page
shows three alternative growth paths for money, bank credit, and total
reserves for the first quarter. Alternative A involves a 5 per cent
money growth rate; alternative B, 6 per cent; and alternative C, 7 per
cent. The last section of the text (paragraphs 14 through 19) discusses
possible directive language for various policy courses.
(9) The bank credit proxy figures shown in the table assume,
for alternatives A and B, no further decline in Euro-dollar borrowings
from recent levels. This neutral assumption seems to be about the best
we can make, given uncertainties as to the ultimate pattern of bank

Alternative Paths of Key
-6-
Monetary Aggregates--Monthlyand Quart~r1y
Money Supply
Alt.A Alt.B Alt.C
1970November
December
1971January
February
March
December
January
February
March
4th Q 1970
1st Q 1971
213.8
215.4
216.7
217.5
218.2
9.0
7.0
4.5
4.0
5.0
5.0
213.8
215.5
216.9
217.9
218.8
9.5
8.0
5.5
5.0
5.0
6.0
213.8
215.5
Adj. Credit Proxy
Alt.A Alt.B
326.9
331.5
326.9
331.6
217.1 333.9 334.6
218.3 335.7 337.3
219.4 338.2 340.4
Per cent Annual Rates
9.5 17,0 17.5
9.0 8.5 11.0
6.5 6.5 9.5
6.0 9.0 11.0
5.0
7.0
8.5 9.0
8.0 10.5
Alt. C
326.9
331.6
334.7
337.6
340.9
of Growth
17.5
11.0
10.5
11.5
9.0
11.0
Total Reserves
Alt.A Alt.B Alt.C
28.7
29.2
29.5
29.4
29.5
18.5
15.0
- 5.0
5.5
28.7
29.2
29.6
29.5
29.7
18.5
16.5
- 3.0
7.5
5.5 5.5
5.0 7.0
28.7
29.2
29.6
29.6
29.8
18.5
17.0
- 1.0
9.5
5.5
8.5
and Quarterly
response to recent Board actions and as to the likely changes in the
recent substantial differentials in costs of Euro-dollars as against
domestic funds. Even under these alternatives, it should be recognized
that a resumption of decline in Euro-dollar borrowings is a real possi-
bility. Under alternative C, declining market interest rates would
very likely encourage some further shift away from Euro-dollar borrow-
ings absent additional Board action. Outstanding bank-related commercial
paper is expected to continue declining, though at a slower pace. In
general, growth in time and savings deposits other than large CD's may
be dampened as post-strike auto sales tend to impinge on the personal
saving rate. Under alternative A, such growth is projected to be a
little less in the first quarter than in the fourth, but under alterna-
tives B and C, time deposits are assumed to grow somewhat more rapidly
because market interest rates would be relatively lower. Bank interest
in large CD's is likely to be fairly strong, as they continue to want
to acquire market securities and as business loan demand picks up.
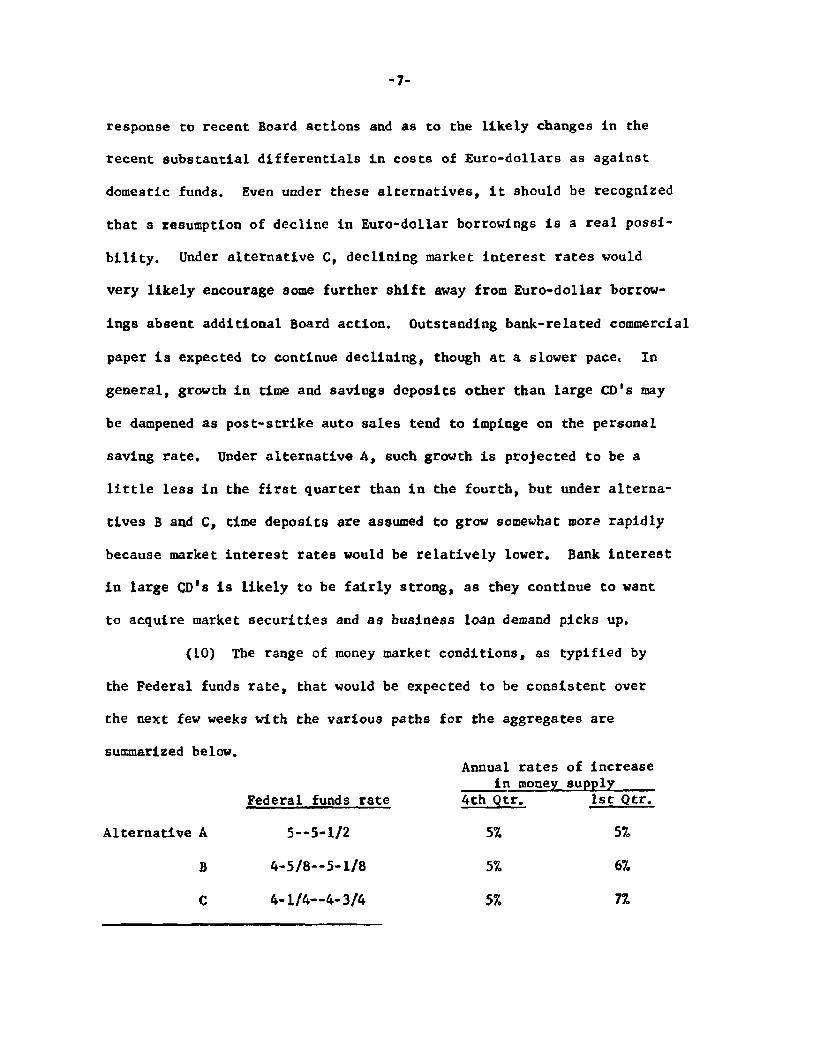
(10) The range of money market conditions, as typified by
the Federal funds rate, that would be expected to be consistent over
the next few weeks with the various paths for the aggregates are
summarized below.Annual rates of increase
in money supplyFederal funds rate 4th Qtr. 1st Qtr.
Alternative A 5--5-1/2 5% 5%
B 4-5/8--5-1/8 5% 67.
C 4-1/4--4-3/4 5% 77

Weekly figures for the aggregates between now and the next FOMC meeting
consistent with these paths are shown in the table on page 9.
(11) In the case of alternative A, the Federal funds range
is wide enough to allow for some tightening from recent levels. This
may be required to limit money growth in the first quarter to 5 per
cent should the Greenbook projection of a 10-1/2 per cent annual rate
of growth in nominal GNP in the first quarter be realized. Since the
last meeting of the Committee, the demand for money has proven to be
somewhat stronger, at given Federal funds rates, than the staff antici-
pated. This greater demand may have been temporary, however, resulting
from a sudden surge in financial market transactions, as noted earlier.
Because of uncertainties as to the source of recent money demand and as
to transactions needs associated with such a large bulge in prospective
GNP growth, a fairly wide Federal funds rate range is also shown for
alternatives B and C. If demand for money at given Federal funds rates
continues to be greater than anticipated--as a result of financial
transactions or the need to finance a temporary large post-strike bulge
in GNP--the Committee may be faced with the possibility of either per-
mitting the Federal funds rate to rise above the ranges shown in
paragraph (10) for any particular alternative chosen, or permitting,
at least temporarily, a higher money growth rate than contemplated.
(12) Between now and the next Committee meeting (mid-
January), the 3-month Treasury bill rate may move through intervals
of both downward and upward pressure, in response to a succession of
seasonal and post auto-strike influences. Consequently, the yield

Alternative Weekly Paths of Key
1970Decenber 9
1971January
AIt.A
214.9
215.5
215.3
216.3
215.5
216.3
216.9
loney Supply
Alt.B Alt.C
214.9 214.9
215.5 215.5
215.4 215.4
216.4 216.5
215.6
216.5
217.2
215.7
216.7
217.4
Adj.
Alt.A
331.0
330.2
332.5
332.9
333.6
332.7
333.0
Credit
Alt. B
331.0
330. 2
332.7
333.2
334.0
333.3
333.8
Proxy
Alt.C
331.0
330.2
332.7
333.3
334.0
333.4
333.9
Total Reserves
Alt.A Alt.B Alt.C
28.9 28.9 28.9
29.2 29.2 29.2
29.3 29.3 29.3
29.2 29.2 29.2
29.7
29.6
29.6
29.7
29.6
29.6
29.7
29.6
29.6
Monetary Aggregates

-10-
may fluctuate in a 4-1/2--5 per cent range, assuming the Federal funds
rate stays around 5--5-1/8 per cent and the net reserve position of banks
is mostly on the negative side, with borrowings at minimal levels (apart
from necessitous borrowing of two banks). If the Federal funds rate
were to move above this range--for example, in order to restrain money
supply growth--an appreciable rise in the 3-month bill rate might
develop; the bill rate might move back up to around 5-1/4 per cent, and
the downward tendency of other interest rates might well be reversed.
If, on the other hand, the Federal funds rate were to be persistently
below 5 per cent, the bill rate might move toward the lower end of, or
even below, the range shown, particularly in view of the absence of a
Treasury cash financing in January. A declining bill rate would likely
be accompanied by some downdrift in other short-term rates, although
yield spreads of other short rates over the bill rate have narrowed
since early November. Any further downdrift in short rates would
intensify pressures for a further reduction in the prime rate.
(13) Long-term interest rates may move downward somewhat
further even in the absence of short-term rate declines, reflecting a
seasonal pick-up in long-term fund flows after year-end and some
moderation in the supply of securities coming to market. There will
be the usual lull in new corporate and municipal issues between now
and the turn of the year; although sizable offerings seem likely in
January, the volume in prospect appears to be somewhat below recent
months. Agency offerings are likely to diminish further in view of
the greater availability of credit at private financial institutions.
-11-
The next Treasury financing--its mid-February refunding--will not be
announced until January 20, shortly after the mid-January FOMC meeting.
No significant amounts of new cash are likely to be raised by the Treasury
until around the time of this refunding and then again in March. Under
the circumstances, if short-term interest rates do show a sustained
downward tendency in the period immediately ahead, a considerable rally
in bond markets may again develop.
Possible directive language
(14) This section presents possible language for the second
paragraph of the directive for the three alternative policy courses
discussed above, as well as a fourth possibility involving renewal of
the present directive language.
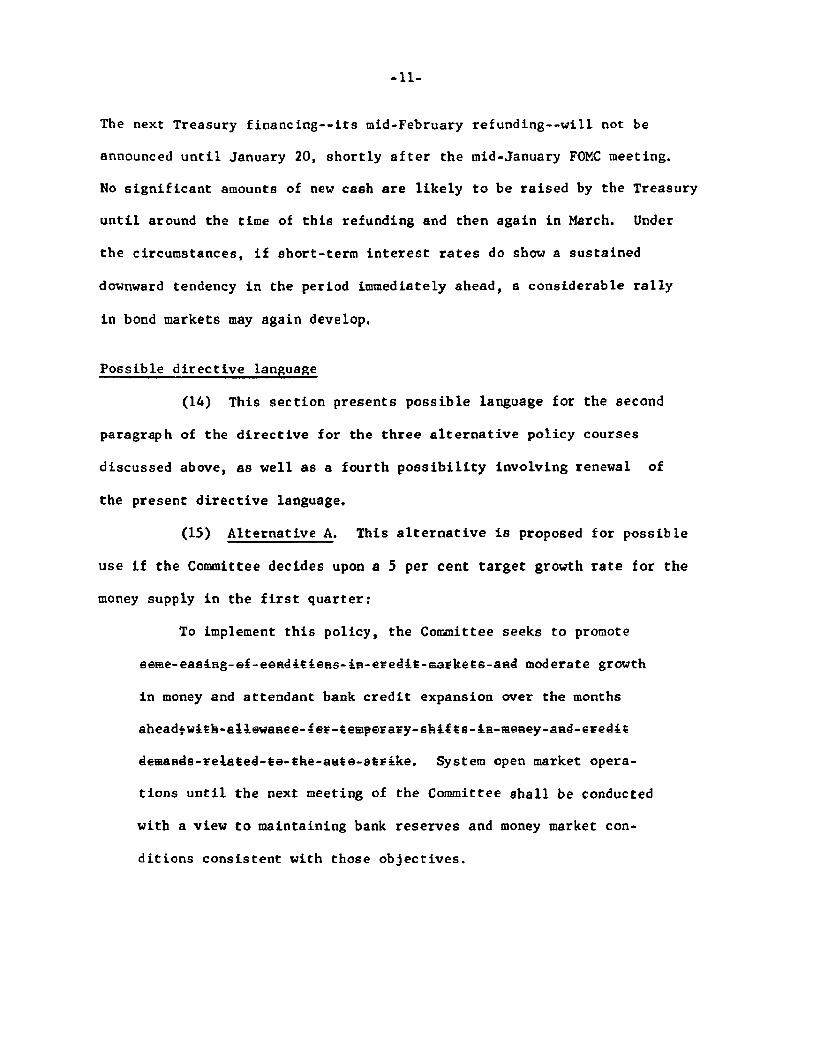
(15) Alternative A. This alternative is proposed for possible
use if the Committee decides upon a 5 per cent target growth rate for the
money supply in the first quarter:
To implement this policy, the Committee seeks to promote
[DEL: some easing of conditions in credit markets and moderate growth
in money and attendant bank credit expansion over the months
ahead with allowance for temporary shifts in money and credit
demands related to the auto strike.] System open market opera-
tions until the next meeting of the Committee shall be conducted
with a view to maintaining bank reserves and money market con-
ditions consistent with those objectives.
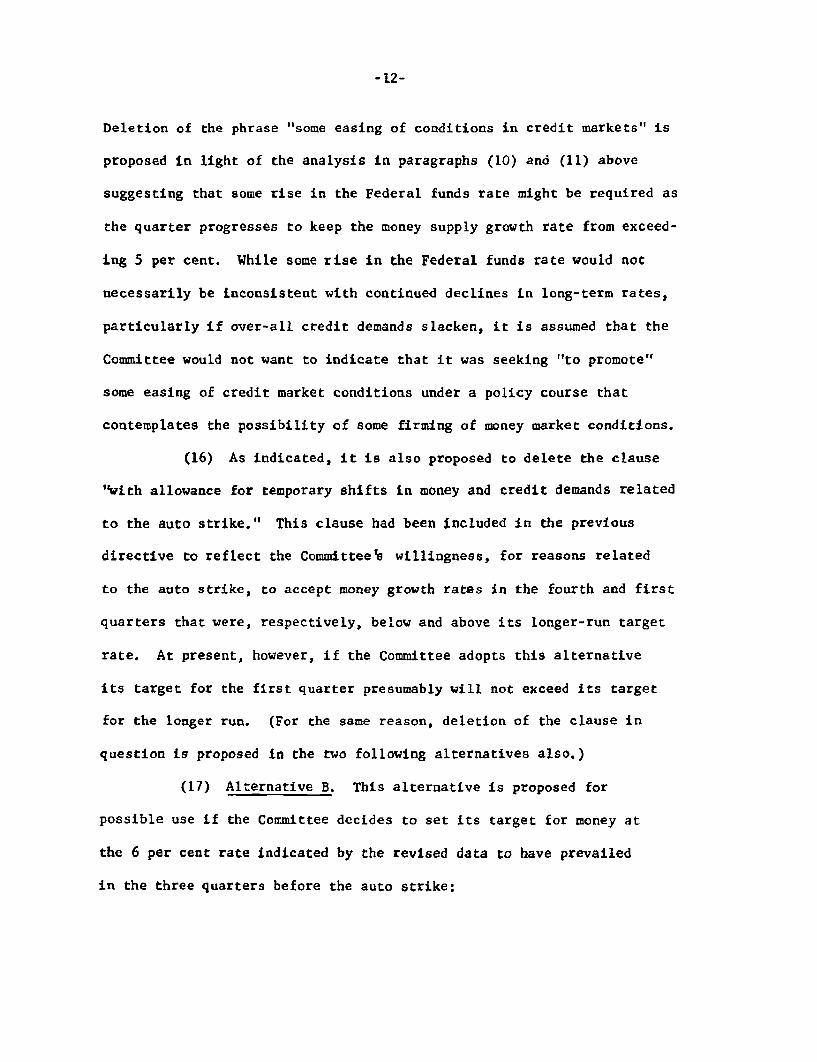
-12-
Deletion of the phrase "some easing of conditions in credit markets" is
proposed in light of the analysis in paragraphs (10) and (11) above
suggesting that some rise in the Federal funds rate might be required as
the quarter progresses to keep the money supply growth rate from exceed-
ing 5 per cent. While some rise in the Federal funds rate would not
necessarily be inconsistent with continued declines in long-term rates,
particularly if over-all credit demands slacken, it is assumed that the
Committee would not want to indicate that it was seeking "to promote"
some easing of credit market conditions under a policy course that
contemplates the possibility of some firming of money market conditions.
(16) As indicated, it is also proposed to delete the clause
"with allowance for temporary shifts in money and credit demands related
to the auto strike." This clause had been included in the previous
directive to reflect the Committee's willingness, for reasons related
to the auto strike, to accept money growth rates in the fourth and first
quarters that were, respectively, below and above its longer-run target
rate. At present, however, if the Committee adopts this alternative
its target for the first quarter presumably will not exceed its target
for the longer run. (For the same reason, deletion of the clause in
question is proposed in the two following alternatives also.)
(17) Alternative B. This alternative is proposed for
possible use if the Committee decides to set its target for money at
the 6 per cent rate indicated by the revised data to have prevailed
in the three quarters before the auto strike:

-13-
To implement this policy, the Committee seeks to promote
some easing of conditions in credit markets and moderate growth
in money [DEL:and attendant bank credit expansion over the months
ahead AT ABOUT THE AVERAGE RATE PREVAILING IN THE FIRST THREE
QUARTERS OF 1970, with ATTENDANT BANK CREDIT EXPANSION allowance
for temporary shifts in money and credit demands related to the
auto strike.] System open market operations until the next
meeting of the Committee shall be conducted with a view to main-
taining bank reserves and money market conditions consistent
with those objectives.
(8) Alternative C. This alternative is suggested for
possible use if the Committee decides to step up its target growth
rate for money to 7 per cent:
To implement this policy, the Committee seeks to promote
some easing of conditions in credit markets and moderate
SOMEWHAT MORE RAPID growth in money [DEL: and attendant bank credit
expansion over the months ahead THAN PREVAILED IN THE FIRST
THREE QUARTERS OF 1970, with ATTENDANT BANK CREDIT EXPANSION
allowance for temporary shifts in money and credit demands
related to the auto strike.] System open market operations
until the next meeting of the Committee shall be conducted
with a view to maintaining bank reserves and money market
conditions consistent with those objectives.
Deletion of the word "some" from the statement that "the Committee
seeks to promote some easing of conditions in credit markets" is
-14-
suggested because of the greater degree of credit market easing likely
to ensue under this policy course.
(19) Alternative D. There remains the possibility that, in
light of the expected first-quarter surge in nominal GNP in the aftermath
of the auto strike, the Committee may wish to accept a temporarily
higher money growth rate during the first quarter than it would contemplate
at this time for the longer run. To articulate such a policy, the
Committee could decide simply to renew the second paragraph of the
existing directive without change:
To implement this policy, the Committee seeks to promote
some easing of conditions in credit markets and moderate growth
in money and attendant bank credit expansion over the months
ahead, with allowance for temporary shifts in money and credit
demands related to the auto strike. System open market operations
until the bext meeting of the Committee shall be conducted with a
view to maintaining bank reserves and money market conditions
consistent with those objectives.
If the Committee adopts this alternative it could instruct the Manager to
maintain essentially prevailing money market conditions--as typified
by a Federal funds rate of 5 to 5-1/4 per cent--so long as the money
supply in the weeks ahead appears to be on a path consistant with growth
in the first quarter at an annual rate in a range between, say, 5 and 7
per cent.

Table 1
PATHS OF KEY MONETARY AGGREGATESSEASONALLY ADJUSTED
STRICTLY CONFIDENTIAL (FR)DECEM I R 11, 1970
Adjusted U.S. Government Nondeposit TCredit Proxy Money Supply Demand Deposits Time Deposits ources of Funds Total ReservesCredit Proxy Demand Deposits Sources of Funds
Period Path 2 3 Path 4 Patth 6 7 Path Path 10 11Pathof Current sof Current as of Current of Current of Current asof CurrentPo roj. Proj. Proj. P rol. Prol. Proj.Nov. 17 Nov. 17 Nov. 17 Nov. 17 Nov. 17 Nov. 17
1970- JuneJulyAug.Sept.
Oct.Nov.Dec.
p(proj.)
1970- 1st Qtr.2nd Qtr.3rd Qtr.4th Qtr.
JuneJulyAug.Sept.
Oct.Nov. pDec. (proj.)
Monthly Pattern in Billions of Dollars311.1 311.1 209.6 209.6315.8 315.8 210.6 210.6321.9 321.9 211.8 211.8324.5 324.5 212.8 212.8
324.7 324.8 212.9 213.0326.3 326.9 213.5 213.8328.1 331.5 214.9 215,4
4.8 4.8
Annual Percentage Rates of Change--Quarterly and Monthly0.56.5
17.24.5
7.018.123.2
9.7
0.76.06.5
0.56.5
17.28.3
7.018.123.2
9.7
1.17.8
17.0
+5.9+5.8+6.1+4.0
+2.3+5.7+6.8+5.7
+0.6+3.5+8.0
+5.9+5.8+6.1+5.0
+2.3+5.7+6.8+5.7
+1.1+4.5+9.0
Weekly Pattern in Billions of Dollars
202.2208.2213.2218.5
221.8224.7227.7
+1.4+14.1+32.2+17.0
+11.4+35.6+28.8+29.8
+18.1+15.5+16.0
202.2208.2213.2218.5
222.2225.0229.6
+1,4+14.1+32.2+20.5
+11.4+35.6+28.8+29.8
+20.3+15.1+24.3
20.719.818.816.5
14.212.812.2
20.719.818.816.5
14.212.711.9
27.928.028.629.2
29.429.629.8
-2.92.6
19.26.0
0.56.0
23.327.5
-3.811.510.5
27.928.028.629.2
29.429.530.0
-2.92.619.2
9.0
0.56.0
23.327.5
-3.64.0
21,0
1970. Oct. 142128
Nov. 4111825
Dec. 29
16
p
pp(proj.)
323.9324.4324.9
325.5326.3326.3326.5
326.2327.8327.6
323.9324.4325.0
325.5326.0326.7327.8
328.3331.0330.3
212.6213.9212.3
212.7212.5213.9213.9
214.4214.3214.6
212.7213.9212.2
212.7213.2213.9213.8
214.5214.9215.5
222.0222.8223.0
223.0224.1
224.7225.4
226.1226.9227.4
222.0222.8223.0
223.4223.8224.9226.1
227.1228.4229.1
14.414.113.6
13.312.912.912.7
12.512.312.2
14.414.113.6
13.213.013.012 .4
11.7
12.012.0
29.229.529.3
29.329.429.629.8
29.729.829.7
29.229.529.4
29.429.429.529.4
29.7
29,730.0
NOTES: Annual rates of change other than those for the past are rounded to the nearest half per cent. Money supply path "as of November17" has been adjusted to reflect the adjustments to the money supply series published November 27, 1970. FR 712 -D

Table 2
AGGREGATE RESERVES AND MONETARY VARIABLESCONFIDENTIAL (FR)
DECEMBER 11,1970
RETROSPECTIVE CHANGES, SEASONALLY ADJUSTED(In per cent, annual rates based on monthly averages of daily figures)
Reserve Aggregates Monetary Variables Addenda1 2 3 Total 4 Money Supply 8 9 10
Period Total Nonborrowed Member Adjusted 5 6 7 Private Depost Instt. CommeralReserves Reserves Bank Credit Proxy Total Currency Demand Adjusted Deposits Paper
SDeposits ,DepositsAnnually19681969
Semi-annuallylet Half 19692nd Half 1969
let Half 1970
Quarterly3rd Qtr. 19694th Qtr. 1969
1st Qtr. 19702nd Qtr. (19703rd Qtr. 1970
Monthly1969, Sept.
OctNovDec
1970 JanFeb.Mar.
Apr.MayJune
JulyAug.Sept.
c t.Nov (p)
+ 7.8- 1.6
+ 0.7- 3.9
- 0.2
- 9.3+ 1.4
- 2.9+ 2.6+19.2
-11.7+ 9 7+97+ 6.3
+ 3.1-12.0
+21.3-13.9+ 0.5
+ 6.0+23.3+27.5
- 3.6+ 4.0
+ 6.0- 3.0
- 3.7- 2.4
+ 1.9
- 4.8-0.1
- 0.4+ 4.1+24.4
+ 7.7
-17 9+ 5.5+12.1
+ 7.2-15.6+ 7.5
+25 4-19.0+ 6.2
-16.1+48.8+40.1
- 0.5
+ 4.7
+ 9.0-4.0
- 3.5- 4.6
+3.3
- 9.4+ 0,1
+ 0.6+ 6.0+24 1
-42- 8,0+14.0
+16 8- 4.5+58
+22.7+29.2+19.0
+10.1+13.9
n.a.
- 1.2
+ 3.5
- 4.3+ 2.0
+ 0.5+ 6.5+17.2
+ 1.6
- 7.9+13.1+ 0.8
3.5- 5.5+10.7
+13.7- 1.2
+ 7.0
+18.1+23.2+ 9.7
+ 1.1
+ 7.8
+ 7.8+ 3.1
+ 0.8+ 1.6
+ 5.9+ 5.8+ 6.1
+ 1.2
+ 2.4+ 1.8+ 0.6
+ 9.4- 4.1+12.3+ 9.9+ 5.2+ 2,3
+ 5.7+ 6.8+ 5.7
+ 1.1+ 4.5
+ 7.4+ 6.0
+ 6.5+ 5.4
+ 7.8
+ 4.5+ 6.2
+ 6.1+ 9.4+ 3.3
+ 2.7
+ 7.9+ 7,9+ 2.6
+ 5.2+ 5.2+ 7.8+10.3+15.3+ 2,5
+ 7.5+ 2.5
+ 7.5+ 2.5
+ 7.9+ 2.4
+ 4.7+ 0.1
+ 5.3
+ 0.3
+ 5.3+ 5.3+ 6.7
+ 1.5
+ 0.8
+ 9.9- 6.8+12.9+10.5+ 3.0+ 2.2
+ 4.4+ 8.9+ 6.6
- 0.7+ 4.4
+11.1- 5.0
- 3.5- 6.6
+ 7.8
-12.7- 0.4
+ 1.4+14.1+32.2
- 3.7
- 3.7- 1.2+ 3.7
- 8.0+ 1.2+11.2
+19.7+10.9+11.4
+35.6+28.8+29.8
+20.3+15.1
+ 6.3+ 3.4
+ 4.8+ 1.9
+ 4.3
+ 2.3+ 1.4
+ 1.7+ 6.9+10.0
+ 3.7
- 0.7+ 3.0+ 1.9
- 4.2+ 2.8+ 6.6
+ 8.1+ 5.3+ 7.0
+13.3+ 6.1+10.5
+10.8
n.a.
I I I I I
NOTE: Aggregate reserve series haveon Euro-dollar borrowings areOctober 1, 1970.
been adjusted to eliminate changes in percentage reserve requirementsincluded beginning October 16, 1969, and requirements on bank-related
against deposits, but reserve requirements
commercial paper are included beginning
n,a.
+27.6
+14,0
+31.0+22.4
+13.2+14.3-17.7
+40.7
+20.0+11.7+34.2
+ 3.6+35.7+ 0.4
+71.3+10.7-37.3
-88.4-14.1+53.1
+31.6- 6.3
FR 712 - E

Table 3
AGGREGATE RESERVES AND MONETARY VARIABLESSEASONALLY ADJUSTED
(Based on averages of daily figures)
Period
Aggregate Reserves
1 2 Non-Total b Non- Requiredborrowed
4 1
1969' JanFebMar
AprMayJune
JulyAugSept
OctNov
Dec
1970- JanFebMar
AprMayJune
JulyAugSept
OctNov. (p)
1970 Oct. 7
142128
Nov 4111825 p
Dec. 2 p
(In millions of dollars)27,31827,20627,024
26,75426 88826.705
26,27526,21426,383
26,21026,53826,806
26,96626 61526,782
27,35026,91627,056
26,69427,78028,708
28,92829,041
29,142
28,80329,93028,820
28,970
28,95729,16728,852
29,304
28,13928,06027,972
27.77528.23528,056
27,53027.40127,402
27,35427 78327,928
28,00127,72227,723
28 21627,89027,902
28,04128,58529,240
29,38529.482
29,49729,20529,49629,353
29,36129,39429,51629,437
29,718
27,90227,83227,729
27,61427,94227,742
27,33427,16127,144
27,12927,54827,707
27,82327,52327,536
28,04627,69227,713
27,89628,40829,024
29,13429,234
29,15529,13829,25029,021
29,04529,23729,30229,204
29,330
CONFIDENTIAL (FR)
DECEMBER 11, 1970
Member Bank Deposits
Total U S. Govt ITotalDemand
297.0296.7294.2
295.4295.1292,6
288.0285.3285.7
283.5285.8285.8
284,8282.9286.2
290.2289. L290.5
296.0303.2308.0
310.6314.2
310.6309.5310.2311.4
312.3313.0313.7315.4
316.6
198.1199.3200.1
201.0201.6202.4
203.1202.6202.9
203.2203.5203.6
205.2204.5206.6
208.3209.2209.6
210.6211.8212.8
213.0213.8
213.7212.7213.9212.2
212.7213.2213.9213.8
214.5
43.643.844.1
44.244.544.8
45.045.245.3
45.645.946.0
46.246.446.7
47.147.747.8
48.148.248.248.548.6
48,448.548.648.5
48.648.648.748.6
48.6
(In billions of dollar!203.7203.2202.5
202.1201,7201.2
198.1195.4194.8
194.2194.0194.6
193.3193.5195.3
198.5200.3202.2
208.2213.2218.5
222.2225.0
154.5155.5156.0
156.8157.1157.6
158.1157.4157.6
157.6157.6157.7
159.0158.1159.8
161.2161.6161.9
162.5163.7164.6164.5165.1
165.4164.2165.3163.7
164.1164.5165.2165.2
165.9
1)21.820.218.9
18.217.415.8
14.112.512.0
11.511.111.2
10.610.611.5
12.913.213.2
16.919.021.723.223.9
22, 723.223.323.4
23.423.523.724.3
24.7
181.9182.9183.6
184.0184.3185.4
184.0182.9182.8
182.6182.9183.4
182.7182,9183.8
185.6187.1189.0
191.3194.2196.8
199.1201. 1
198.3198.8199.5199.6
200.0200.3201.2201.7
202.4
I n.a.25,5
26.126.627.5
27.928.229.0
29.130.030.0
31.832.031.0
28.828.429.7
30.529.5
221. 0222.0222.8223.0
23. 4223.8224.9226.1
227.1
NOTES: Aggregate reserve series have been adjusted to eliminate changes in percentage reserve requirements against deposits, but reserve requirements on Euro-dollar borrowings are included beginning October 16, 1969, and requirements on bank-related commercial paper are included beginning October 1, 1970.
Adjusted credit proxy includes mainly total member bank deposits subject to reserve requirements,, bank-related commercial paper, and Euro-dollarborrowings of U.S, banks. Weekly data are daily averages for statement weeks. Monthly data are daily averages except for nonbank commercial FR 712-Fpaper figures which are for last day of month.
n.a.
307.5
305.7303.8304.2
302.2305.5305.7
304.8303.4306.1
309,6309.3311.1
315.8321.9324.5
324.8326.9
325.4323.9324.4325.0
325.5326.0326.7327.8
328.3
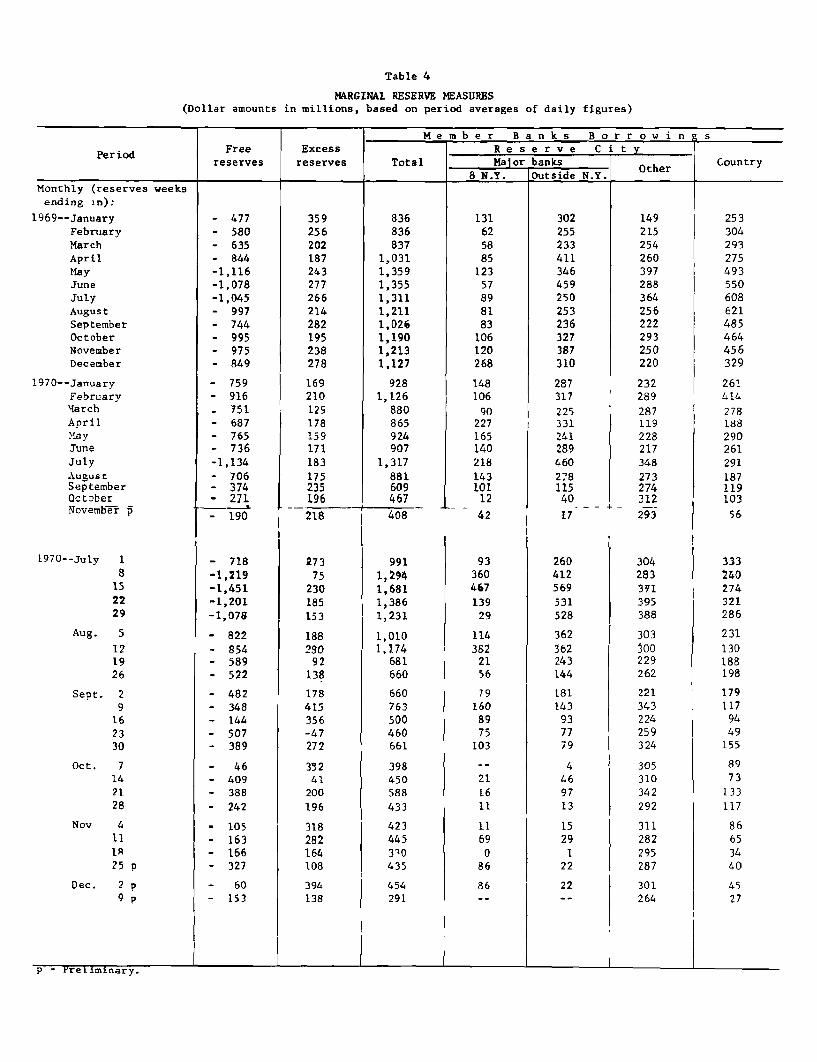
Table 4
MARGINAL RESERVE MEASURES(Dollar amounts in millions, based on period averages of daily figures)
Member Banks Borrowingsd Free Excess R e s e r v e C i ty_
reserves reserves Total Major banks Other Country8 N.Y. Outside N.Y.
Monthly (reserves weeksending in):
1969--JanuaryFebruaryMarchAprilMayJuneJulyAugustSeptemberOctoberNovemberDecember
1970--JanuaryFebruaryMarchAprilMayJuneJuly
AugustSeptemberOct.berNovember p
1970--July 18152229
Aug. 5
121926
Sept. 29162330
Oct. 7142128
Nov 4111,q25 p
Dec. 2 p9 p
- 477- 580- 635- 844-1,116-1,078-1,045- 997- 744- 995- 975- 849
- 759- 916- 751- 687- 765- 736
-1,134- 706- 374- 271
-190
- 718-1,219-1,451-1,201-1,078
- 822- 854- 589- 522
- 482- 348- 144- 507- 389
- 46- 409- 388- 242
- 105- 163- 166- 327
- 60- 153
359256202187243277266214282195238278
169210129178159171183175235196
218
27375
230185153
18823092138
178415356-47272
35241
200196
318282164108
394138
836836837
1,0311,3591,3551,3111,2111,0261,1901,2131,127
9281,126
880865924907
1,317
881609467
408
991
1,2941,6811,3861,231
1,0101,174
681660
660763500460661
398450588
433
423445310435
454291
131625885
12357898183106120268
148106
9022716514021814310112
42
93360467
13929
114
3822156
791608975
103
21
L611
1169086
86
149215254260397288364256222293250220
232289
287119228217348
273274312
-- 4-293
304283371395388
303300229262
221343224259324
305310342
292
311282295287
301264
p - Preliminary.
253304293275493550608621485464456329
261414
278188290261291
187119103
56
333240274321286
231
130188198
1791179449
155
8973
133117
86653440
4527

Table 5
SOURCE OF FEDERAL RESERVE CREDITRetrospective Changes
(Dollar amounts in millions of dollars, based on weekly averages of daily figures)
Total Federal U.S. Government securities FederalPeriod Reserve credit Total 1Repurchase Agency Bankers' Member banks
(Excl. float) holdings Bills 1/ Other _ agreements Securities acceptances borrowingsYear:1968 (12/27/67 - 12/25/68)1969 (12/25/68 - 12/31/69)
Weekly:
-- July 18
152229
Aug. 5121926
Sept. 29
162330
Oct. 7142128
Nov. 4111825
Dec. 29
+3,757+5,539
+ 544+ 231+1,181- 185- 460
+ 362+ 591+ 231- 343
+ 189+ 473- 248-982
+ 689
- 482- 5
+ 224- 479
+ 692- 48+ 671- 142
+ 986- 301
+3,298+5,192
+2,143 ( --+4,279 ( --
+ 445 (+- 73 (-- (
+ 638 (-- 42 (-
+ 293 (++ 266 (+ 644 (+ 209 (
+ 31 (+ 193 (- 236 (-- 358 (-+ 222 (+
- 165 (-- (
- 16 (- 63 (
+ 241 (-- 94
-+ 09 (-+ 407 (
+ 516 (-+ 32 (-
))
145)- )- )
29)42)
71)-- )-- )-- )
-- )-- )
90)256)346)
-- )-- )-- )-- )
214)
150)-- )
144)100)
+1,176+ 707
- 21+ 206
I
S 3+ 67
- 52+ 35
+ 514+ 245
104303387295155
221164
493201
10326340
201
26352
136153
1022
115105
19163
+ . .1.
reflect reserve effect of match sale-purchase agreement.
19/U
1/ Figures in parenthesis
632444188
247196
9452
133123250506196
185683
205
36919
202500
337177
Table 6
MAJOR SOURCES AND USES OF RESERVESRetrospective and Prospective Changes
(Dollar amounts in millions, based on weekly averages of daily figures)
Facto r s affecting u p p y of reserves = Change = Bank use of reserves
Period Federal Reserve Gold nd Currency Treasury Foreign Other nonmember in Required Excesscredit (excl. spec. dr. outside Float deposits deposits and total reserves ressfloat) 1/ rights banks operations and gold loans F.R. accounts reserves reserves reserves
Year:1968 (12/27/67-12/25/68)1969 (12/25/68-12/31/69)
Weekly:1970--Apr. 1
8152229
May 6132027
June 3101724
July 18152229
Aug. 5121926
Sept. 29
162330
Oct. 7142128
Nov. 411
1825 p
Dec. 2 p9 p
1/ For retrospectivep - Preliminary.
+3,757+5,539
+ 179- 720
+ 947- 222
- 17
+1,047+ 131+ 512- 664
+ 639- 213
+ 224- 449
+ 544+ 231+1,181- 185
- 460
+ 362+ 591+ 231- 343
+ 189+ 473- 248
- 982
+ 689
- 482
- 5
+ 224- 479
+ 692- 48
+ 671- 142
+ 986- 301
details, see Table 5.
(S
-2,067
gn ind icat s e f f ct
-3,221-2,676
+ 928- 813
+1,309+ 241
on
- 67+ 54
- 51
+ 24+ 78
+ 28
S34
- 55
+ 44+ 84
- 1511
- 12
- 50
+ 44- 23- 39
+ 37- 35
- 17
+ 18- 22
- 26
+ 20+ 4
+ 6- 15
- 210
- 10- 4
+ 9- 15
- 24
- 1
+ 17+ 18
+ 5- 8
reserves)
+ 869-898
- 54
- 100
+ 98+ 174- 32
- 163
- 174
- 354- 312
- 192- 33
+ 290+ 79
+ 44- 213
- 40
+ 113- 7
- 105
- 45+ 21- 152
- 14
- 45
+ 100+ 169+ 95
+ 271+ 1
+ 230+ 1
- 271
- 86
+ 16- 397
- 187
- 39
+1,508+1,448
+1,563+1,340
- 55
+ 108
.1 L 1 4 1 4 4-
Related Documents