Selection in PLS Path Modeling Galit Shmueli, National Tsing Hua University, Taiwan With: Pratyush Sharma, U. Delaware Marko Sarstedt, Otto-von-Guericke University Magdeburg Kevin H. Kim †

Predictive Model Selection in PLS-PM (SCECR 2015)
Aug 13, 2015
Welcome message from author
This document is posted to help you gain knowledge. Please leave a comment to let me know what you think about it! Share it to your friends and learn new things together.
Transcript

Predictive Model Selection in PLS Path Modeling
Galit Shmueli, National Tsing Hua University, TaiwanWith:Pratyush Sharma, U. DelawareMarko Sarstedt, Otto-von-Guericke University MagdeburgKevin H. Kim† SCECR 2015, Addis Ababa

SCECR 2010
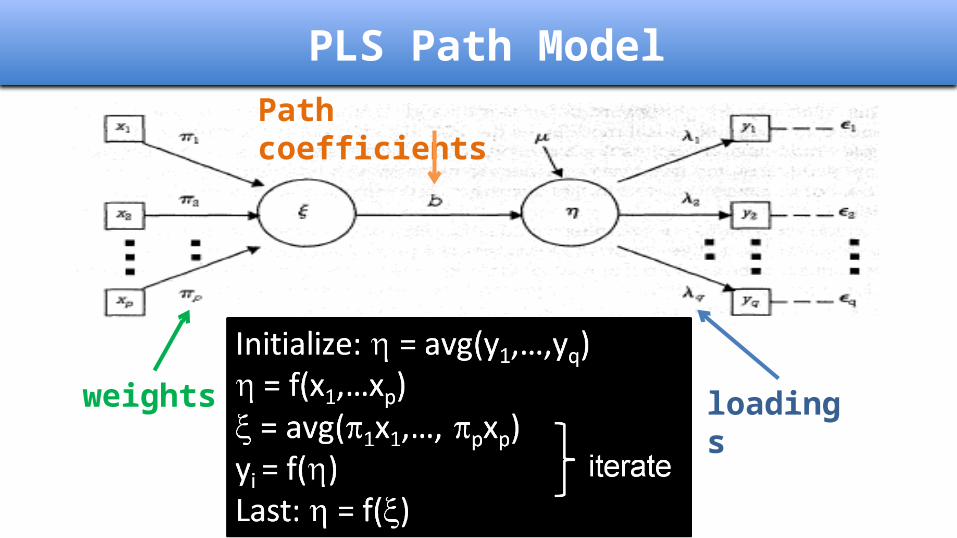
PLS Path ModelPath coefficients
loadingsweights
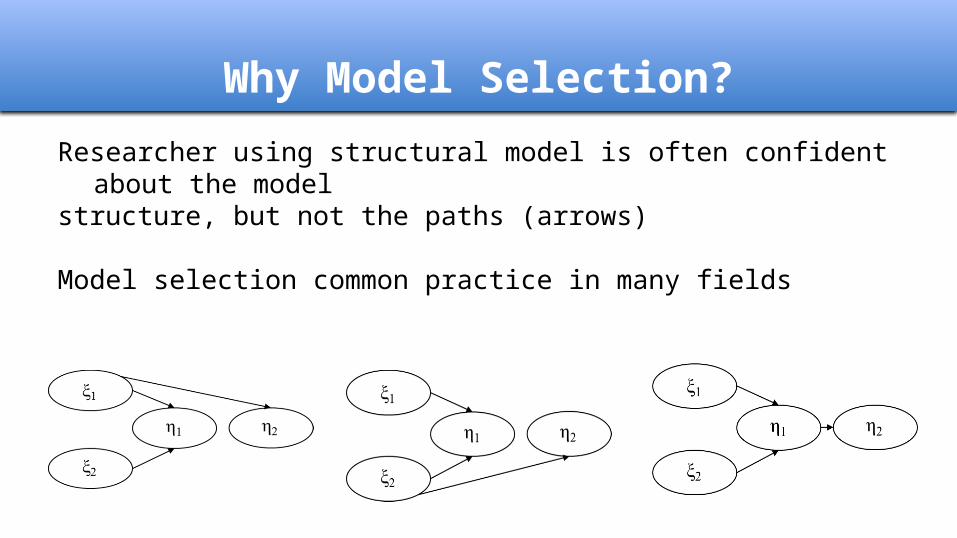
Why Model Selection?
Researcher using structural model is often confident about the modelstructure, but not the paths (arrows)
Model selection common practice in many fields

How to Compare PLS Models?
Suppose... ● theory cannot help and / or● all models yield satisfactory results in terms of significant
paths
Predictive power! Choose the model with best ability to predict out of sample.

Measuring Predictive Power
Classic predictive approach: out-of-sample
1. Partition data randomly into training and holdout samples
2. Fit model to training data; evaluate predictive power by predicting holdout records (RMSE, MAPE...)
For parametric models: “information theoretic” (IT) criteria
● In-sample metrics● Measure out-of-sample
predictive power by penalizing in-sample fit
● (Similar to adj-R2)
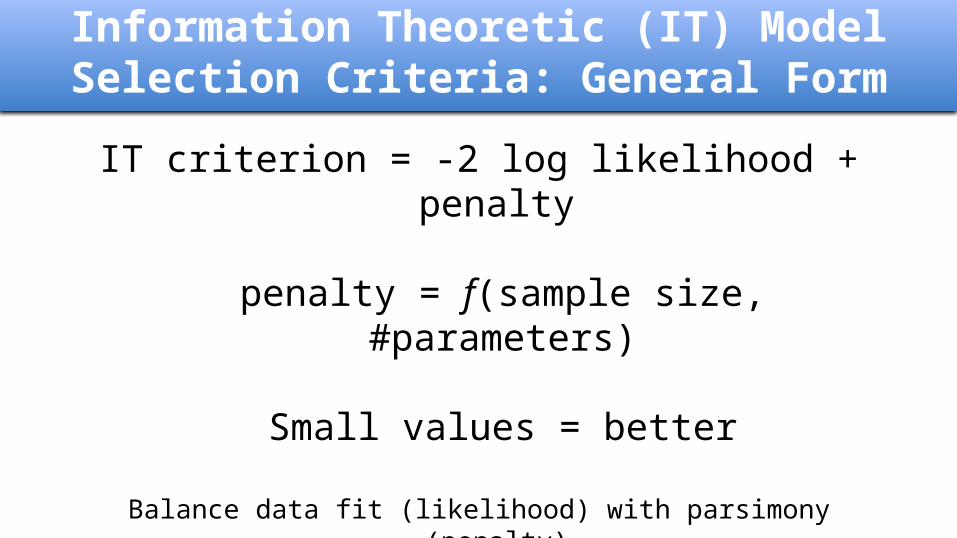
Information Theoretic (IT) Model Selection Criteria: General Form
IT criterion = -2 log likelihood + penalty
penalty = f(sample size, #parameters)
Small values = better
Balance data fit (likelihood) with parsimony (penalty)
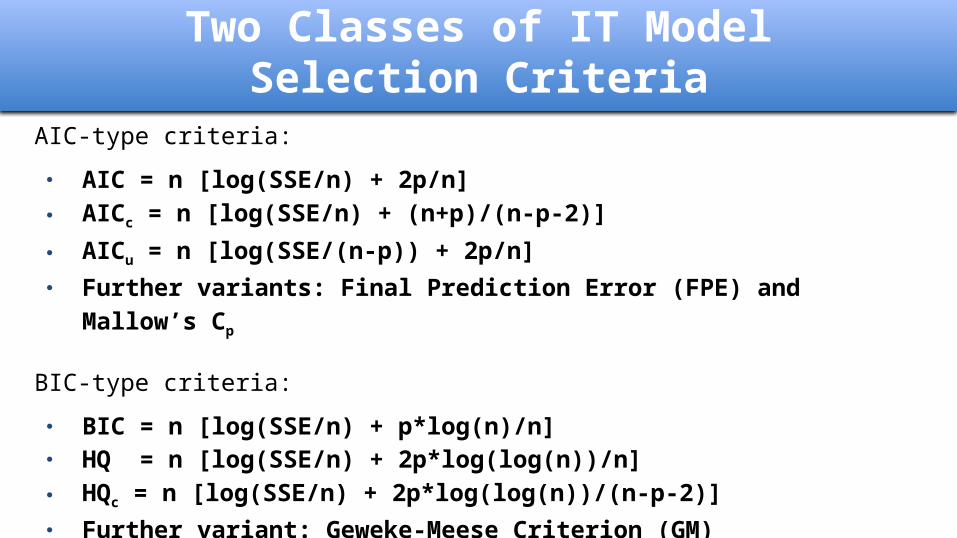
Two Classes of IT Model Selection CriteriaAIC-type criteria:
● AIC = n [log(SSE/n) + 2p/n]● AICc = n [log(SSE/n) + (n+p)/(n-p-2)]● AICu = n [log(SSE/(n-p)) + 2p/n]● Further variants: Final Prediction Error (FPE) and Mallow’s Cp
BIC-type criteria:
● BIC = n [log(SSE/n) + p*log(n)/n]● HQ = n [log(SSE/n) + 2p*log(log(n))/n]● HQc = n [log(SSE/n) + 2p*log(log(n))/(n-p-2)]● Further variant: Geweke-Meese Criterion (GM)
Advantages of IT Criteria
● Commonly used for model selection in predictive modeling
(with parametric models)
● Asymptotic equivalence to cross-validation
● Useful for small samples: do not require data partitioning
● Use well-established in econometrics & statistics

Which IT criterion is best for selecting the best
predictive PLS model?
Simulation Study
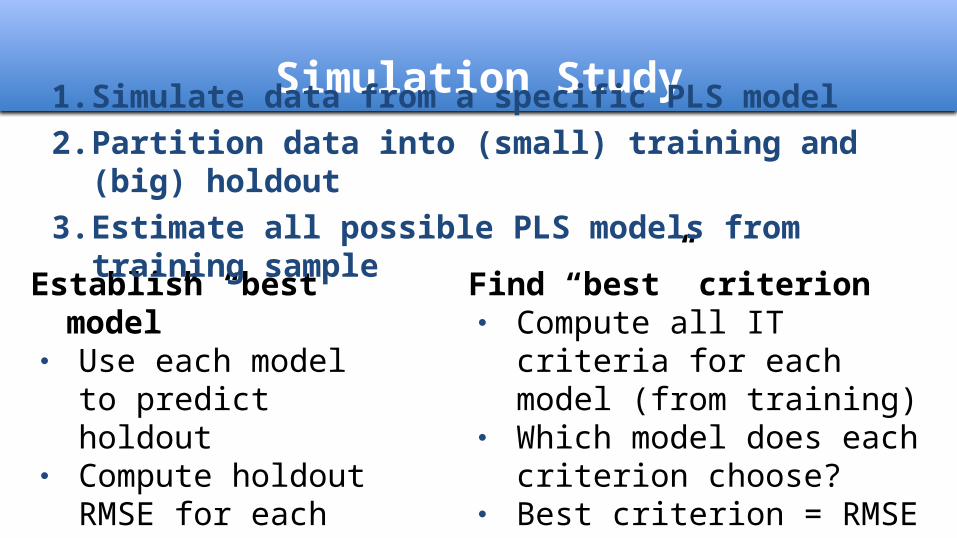
Establish “best model”● Use each model to
predict holdout● Compute holdout
RMSE for each model ● Lowest RMSE -> Best
predictive model
Find “best” criterion● Compute all IT criteria for each
model (from training)● Which model does each
criterion choose?● Best criterion = RMSE choice● Benchmark criterion: Q2
1. Simulate data from a specific PLS model2. Partition data into (small) training and (big)
holdout3. Estimate all possible PLS models from training
sample

Competing Models

Experimental Conditions● Sample Size :
o Training: 50, 100, 150, 200, 250, 500 o Holdout: 1000
● Effect Size (ξ1 → η2): 0.1, 0.2, 0.3, 0.4, 0.5● Data Distributions: Normal, Chi-Squared (df=3), t-dist (df=5), Uniform ● Measurement Model Factor Loadings:
o Higher AVE & Homogenous (0.9, 0.9, 0.9)o Lower AVE & Homogenous (0.7, 0.7, 0.7)o Higher AVE & Heterogenous (0.9, 0.8, 0.7)o Lower AVE & Heterogenous (0.5, 0.6, 0.7)
Results
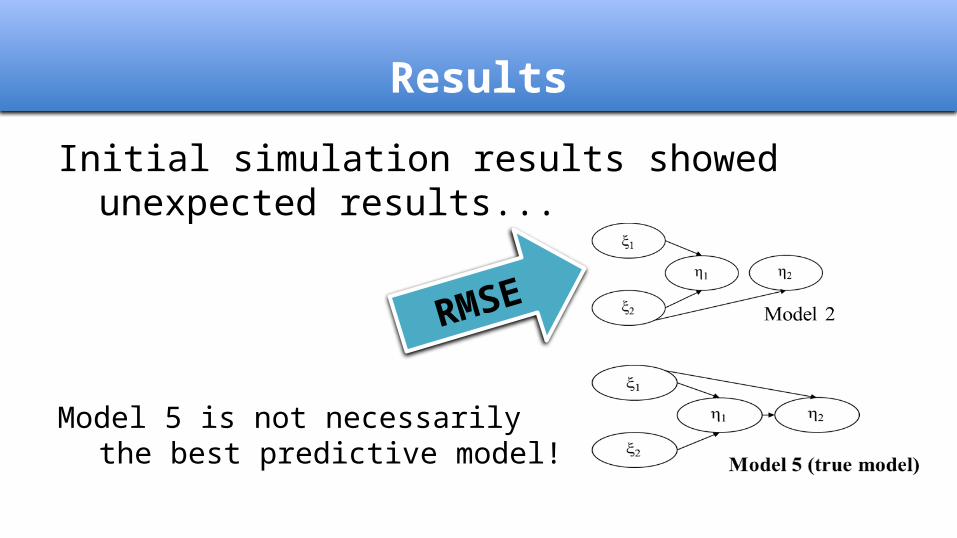
Initial simulation results showed unexpected results...
Model 5 is not necessarilythe best predictive model!
RMSE
What’s Next
● Get meaningful results!● More complex models
(e.g., interaction effects, hierarchical component models, nonlinear relationships)
● Broader set of data constellations (e.g., collinearity)● Design of IT criteria that take the specificities of the PLS
method into account
Related Documents