Predictive Maintenance with Multi-Target Classification Models Mark Last 1 , Alla Sinaiski 1 , Halasya Siva Subramania 2 1 Department of Information Systems Engineering, Ben-Gurion University of the Negev, Beer-Sheva 84105, Israel [email protected] , [email protected] 2 India Science Lab, General Motors Global Research and Development GM Technical Centre India Pvt Ltd, Creator Building, International Tech Park Ltd. Whitefield Road, Bangalore - 560 066, INDIA [email protected] Abstract. Unexpected failures occurring in new cars during the warranty period increase the warranty costs of car manufacturers along with harming their brand reputation. A predictive maintenance strategy can reduce the amount of such costly incidents by suggesting the driver to schedule a visit to the dealer once the failure probability within certain time period exceeds a pre-defined threshold. The condition of each subsystem in a car can be monitored onboard vehicle telematics systems, which become increasingly available in modern cars. In this paper, we apply a multi-target probability estimation algorithm (M- IFN) to an integrated database of sensor measurements and warranty claims with the purpose of predicting the probability and the timing of a failure in a given subsystem. The multi-target algorithm performance is compared to a single-target probability estimation algorithm (IFN) and reliability modeling based on Weibull analysis. Keywords: Predictive Maintenance, Telematics, Fault Prognostics, Vehicle Health Management, Reliability, Multi-Target Classification, Info-Fuzzy Networks. 1 Introduction Three major maintenance policies include corrective, preventive, and predictive maintenance [12]. Corrective maintenance implies that equipment, such as a vehicle, is repaired after a failure has occurred. As long as a vehicle is under a warranty agreement, the vehicle owner does not usually pay for the repair though he or she can suffer a severe inconvenience as a result of an unexpected malfunction and the time wasted on a visit to an authorized car dealer. Most vehicles are also subject to a preventive maintenance policy, which requires performing certain inspections and other operations at a schedule predetermined by the car manufacturer, mostly on the basis of mileage and/or time in service. Since these actions are scheduled in advance,

Welcome message from author
This document is posted to help you gain knowledge. Please leave a comment to let me know what you think about it! Share it to your friends and learn new things together.
Transcript
Predictive Maintenance with Multi-Target
Classification Models
Mark Last1, Alla Sinaiski
1, Halasya Siva Subramania
2
1Department of Information Systems Engineering,
Ben-Gurion University of the Negev, Beer-Sheva 84105, Israel
[email protected], [email protected] 2India Science Lab, General Motors Global Research and Development
GM Technical Centre India Pvt Ltd, Creator Building, International Tech Park Ltd.
Whitefield Road, Bangalore - 560 066, INDIA
Abstract. Unexpected failures occurring in new cars during the warranty period
increase the warranty costs of car manufacturers along with harming their brand
reputation. A predictive maintenance strategy can reduce the amount of such
costly incidents by suggesting the driver to schedule a visit to the dealer once
the failure probability within certain time period exceeds a pre-defined
threshold. The condition of each subsystem in a car can be monitored onboard
vehicle telematics systems, which become increasingly available in modern
cars. In this paper, we apply a multi-target probability estimation algorithm (M-
IFN) to an integrated database of sensor measurements and warranty claims
with the purpose of predicting the probability and the timing of a failure in a
given subsystem. The multi-target algorithm performance is compared to a
single-target probability estimation algorithm (IFN) and reliability modeling
based on Weibull analysis.
Keywords: Predictive Maintenance, Telematics, Fault Prognostics, Vehicle
Health Management, Reliability, Multi-Target Classification, Info-Fuzzy
Networks.
1 Introduction
Three major maintenance policies include corrective, preventive, and predictive
maintenance [12]. Corrective maintenance implies that equipment, such as a vehicle,
is repaired after a failure has occurred. As long as a vehicle is under a warranty
agreement, the vehicle owner does not usually pay for the repair though he or she can
suffer a severe inconvenience as a result of an unexpected malfunction and the time
wasted on a visit to an authorized car dealer. Most vehicles are also subject to a
preventive maintenance policy, which requires performing certain inspections and
other operations at a schedule predetermined by the car manufacturer, mostly on the
basis of mileage and/or time in service. Since these actions are scheduled in advance,

the customer has the flexibility to perform them at the time of his or her convenience.
This policy is also expected to reduce warranty costs by avoiding claims related to
unexpected failures that may occur if the periodic maintenance is not performed on
time.
However, the preventive maintenance policy does not take into account the actual
condition of the car subsystems as periodic maintenance activities are scheduled at a
fixed mileage or time interval. In contrast, predictive maintenance (also called
Condition Based Maintenance [5]) can schedule a visit to the dealer based on some
sensory information representing the current condition of the car and its subsystems.
This approach should, on one hand, minimize the risk of unexpected failures, which
may occur before the next periodic maintenance operation, and on the other hand,
reduce the amount of unnecessary preventive maintenance activities.
Extensive amounts of telematics data are collected nowadays by several car
manufacturers. To utilize this sensory information for predictive maintenance we need
to identify the features relevant to predicting each type of failure and to find accurate
models that will predict the probability of failure as a function of elapsed time (one
week, two weeks, etc.). Such time-based probability distribution will assist the
customer to determine the urgency of his/her next visit to the dealer. Obviously, if the
failure probability until the time of the next periodic maintenance activity is too low,
an extra visit to the dealer would be redundant. Thus, the predictive maintenance
policy should provide the maximum “peace of mind” for the customer.
Several data mining methods have been used in the past to support the predictive
maintenance policy. Thus, the authors of [10] use a hybrid, dynamic Bayesian
network to model the temporal behavior of the faults and determine fault probabilities
in the Mercedes-Benz E320 sedan handling system. The continuous input to the
diagnostic system comes from six sensors located on the vehicle: four wheel speed
sensors, a yaw rate gyro, and a steering angle sensor. In the case study of [10], ten
faults are considered: a failure of any of the four tires as well as faults of any of the
six sensors. In [12], an artificial neural network model is developed to estimate the
life percentile and failure times of roller bearings based on the available sensory
information. Given the conditional probability distribution provided by the neural
network model, the optimal replacement strategies are computed by a cost matrix
method. The authors of [1] propose a two-step approach to predictive maintenance.
First, a decision-tree algorithm is applied to sensory data in order to identify the
relevant features for the condition of the equipment and the associated thresholds
(split values of the features selected by the algorithm). Second, a reliability model,
such as Weibull distribution, is fitted to the live data of the equipment for predicting
the time interval to the next maintenance action. The method is demonstrated on a
historical maintenance database of more than 2000 copiers.
In this paper, we apply a multi-target probability estimation algorithm (Multi-
Target Info-Fuzzy Network) to an integrated synthetic dataset of sensory data and
warranty failure data. The goal is to issue an early warning of a failure expected in
an individual car as well as to estimate the approximate timing of the expected failure
(e.g., within one week, within two weeks, etc.). Multi-target classification and
probability estimation methods are presented in the next section followed by a brief
description of Weibull reliability analysis. The results of a case study based on the
synthetic data are described next. We conclude the paper with some directions for

future applications of multi-target and multi-model data mining methods to the
maintenance data.
2 Multi-Target Classification
As indicated in [2], the common assumption of most data mining algorithms (decision
trees, Naïve Bayes, artificial neural networks, etc.) that a learning task has only one
objective is very restrictive. Data objects in many real-world databases may be
simultaneously assigned multiple class labels related to multiple tasks (targets). These
targets (dimensions) may be strongly related to each other, completely unrelated, or
just weakly related. Thus, in case of predictive maintenance of a car, we may be
interested to predict the occurrence and the timing of one or several failures in the
same subsystem or even in completely different subsystems (e.g., batteries and tires).
The most straightforward approach to the problem of multi-target (sometimes
called multi-objective) classification is to induce a separate model for each target
using any single-target classification algorithm. Though the resulting models may be
the best (e.g., the most accurate) ones for every individual target, the user may find a
multi-target model much more comprehensible than a collection of single-target
models. Moreover, as demonstrated by Caruana [2] and Last [6], the combination of
several classification tasks in a single model may even increase the overall predictive
accuracy.
In order to provide a unified framework for single-target and multi-target
prediction tasks, Last [6] has defined an extended classification task using the
following notation:
R = (A1,..., Ak) - a set of k attributes in the dataset (k 2).
C - a non-empty subset of n candidate input features (C R, |C| = n 1). The
values of these features are usually known and they can be used to predict the
values of target attributes. In case of predictive maintenance, these features may
represent the sensory data.
O - a non-empty subset of m target (“output”) attributes (O R, |O| = m 1).
This is a subset of attributes representing the variables to predict, such as failure
occurrence, time to failure, etc. The extended classification task is to build an
accurate model (or models) for predicting the values of all target attributes, based
on the corresponding dependency subset (or subsets) I C of input features.
The Multi-Target Classification task is different from Multitask Learning described
by Caruana in [2]. The explicit goal of Multitask Learning is to improve the accuracy
of predicting the values of a single-dimensional class (defined as the main learning
task) by training the classification model, such as a neural network or a decision tree,
on several related tasks (additional class dimensions). This is called inductive
transfer between learning tasks. As emphasized by [2], the only concern of Multitask
Learning is the generalization accuracy of the model, not its intelligibility. In
contrast, this paper focuses on multi-target classification rather than on multi-task
learning, since predictive maintenance involves two equally important prediction
tasks: estimating the probability of failure and estimating the time to failure. Multi-
target classification is also different from the multi-objective approach to

classification [4], which is usually aimed at finding the best trade-off between
accuracy and interpretability of a single-target classification model.
As shown in [6], an m-target classification function can be represented by a multi-
target info-fuzzy network (M-IFN), where each terminal node is associated with the
probability distributions of all target attributes (unlike the bloomy decision tree model
[11] where the leaf nodes predict only a subset of class dimensions). The M-IFN
model is an extension of an Oblivious Read-Once Decision Graph (OODG) called
information network (IN) [9]. Unlike the standard decision-tree models, the
information network uses the same input attribute across all nodes of a given layer
(level). The input attributes are selected incrementally by the IN induction algorithm
to maximize a global decrease in the conditional entropy of the target attribute. The
IN induction algorithm is using the pre-pruning approach: when no attribute causes a
statistically significant decrease in the entropy, the network construction is stopped.
In [9], the IN induction algorithm is shown empirically to produce much more
compact models than other methods of decision-tree learning, while preserving nearly
the same level of classification accuracy.
The Multi-Target Info-Fuzzy Network (M-IFN) induction procedure starts with
defining the target layer, which has a node for each category, or value, of every class
dimension and the “root” node representing an empty set of input attributes. The M-
IFN construction algorithm has only the growing (top-down) phase. The top-down
construction is terminated (pre-pruned) by a statistical significance test and,
consequently, there is no need in bottom-up post-pruning of the network branches.
M-IFN construction is an iterative rather than a recursive process. At every iteration,
the algorithm utilizes the entire set of training instances to choose an input
(predicting) feature (from the set of unused "candidate input" features), which
maximizes the decrease in the total conditional entropy of all class dimensions.
The conditional mutual information of a class dimension Yi and an input feature Xn
given the features X1, …, Xn-1 is calculated by:
1 1
1 1 1 1 1
1 11
,..., , 1 1 1 1
( ; / ,..., ) ( / ,..., ) ( / ,..., )
( , / ,..., ) ( ,..., , ) log
( / ,..., ) ( / ,..., )n n i i
i n n i n i n
i n nn i
x X x X y Y i n n n
MI Y X X X H Y X X H Y X X
p y x x xp x x y
p y x x p x x x
(1)
At n-th iteration, the M-IFN construction algorithm chooses the input feature Xj*,
which maximizes the sum of information gains over all class dimensions by finding
1 1
1
* arg max ( ; / ,..., )m
i j nj
i
j MI Y X X X
(2)
Further details on the M-IFN induction algorithm are provided in [6]. It is also
shown in [6] that the resulting M-IFN model has the following information-theoretic
properties:
The average accuracy of a multi-target model in predicting the values of m target
attributes will usually not be worse, or even will be better, than the average
accuracy of m single-target models using the same set of input features.
If all target attributes are either mutually independent or completely dependent on
each other, the M-IFN induction algorithm is expected to produce the optimal
(most accurate) model.
The M-IFN induction algorithm has been successfully applied to several real-world
multi-target tasks such as prediction of grape and wine quality dimensions [8] and
quality control of a complex manufacturing process [7].
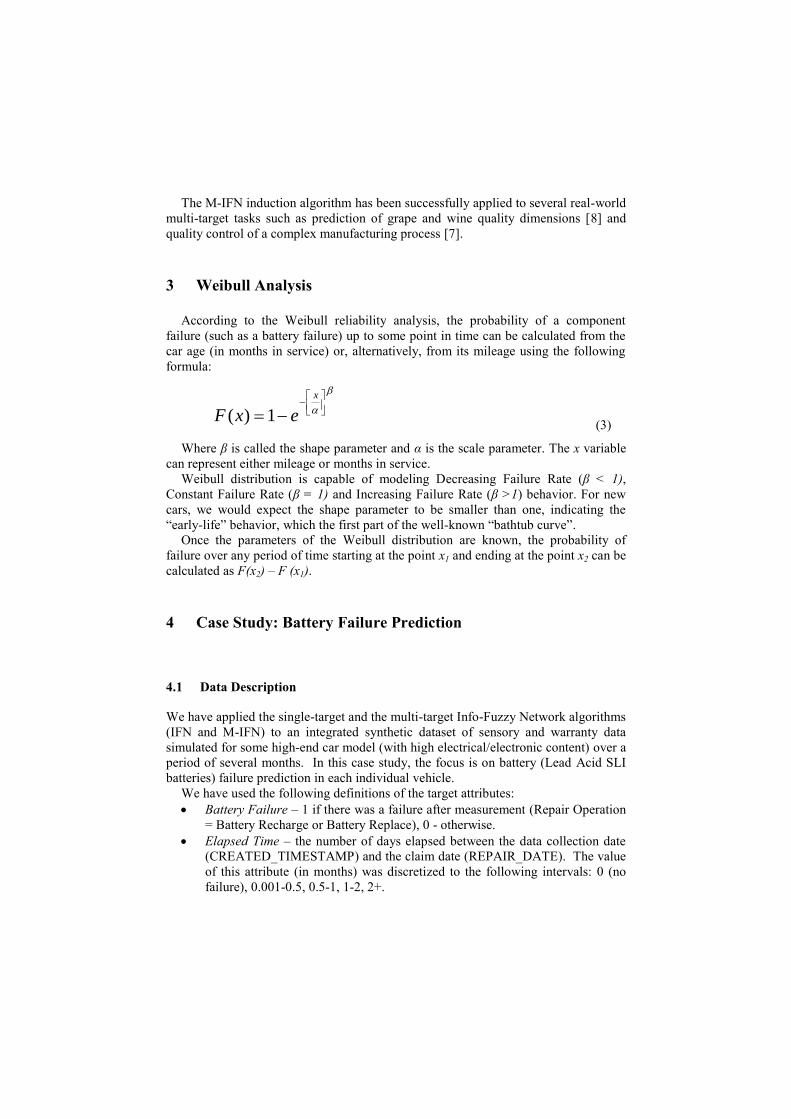
3 Weibull Analysis
According to the Weibull reliability analysis, the probability of a component
failure (such as a battery failure) up to some point in time can be calculated from the
car age (in months in service) or, alternatively, from its mileage using the following
formula:
x
exF 1)( (3)
Where β is called the shape parameter and α is the scale parameter. The x variable
can represent either mileage or months in service.
Weibull distribution is capable of modeling Decreasing Failure Rate (β < 1),
Constant Failure Rate (β = 1) and Increasing Failure Rate (β >1) behavior. For new
cars, we would expect the shape parameter to be smaller than one, indicating the
“early-life” behavior, which the first part of the well-known “bathtub curve”.
Once the parameters of the Weibull distribution are known, the probability of
failure over any period of time starting at the point x1 and ending at the point x2 can be
calculated as F(x2) – F (x1).
4 Case Study: Battery Failure Prediction
4.1 Data Description
We have applied the single-target and the multi-target Info-Fuzzy Network algorithms
(IFN and M-IFN) to an integrated synthetic dataset of sensory and warranty data
simulated for some high-end car model (with high electrical/electronic content) over a
period of several months. In this case study, the focus is on battery (Lead Acid SLI
batteries) failure prediction in each individual vehicle.
We have used the following definitions of the target attributes:
Battery Failure – 1 if there was a failure after measurement (Repair Operation
= Battery Recharge or Battery Replace), 0 - otherwise.
Elapsed Time – the number of days elapsed between the data collection date
(CREATED_TIMESTAMP) and the claim date (REPAIR_DATE). The value
of this attribute (in months) was discretized to the following intervals: 0 (no
failure), 0.001-0.5, 0.5-1, 1-2, 2+.
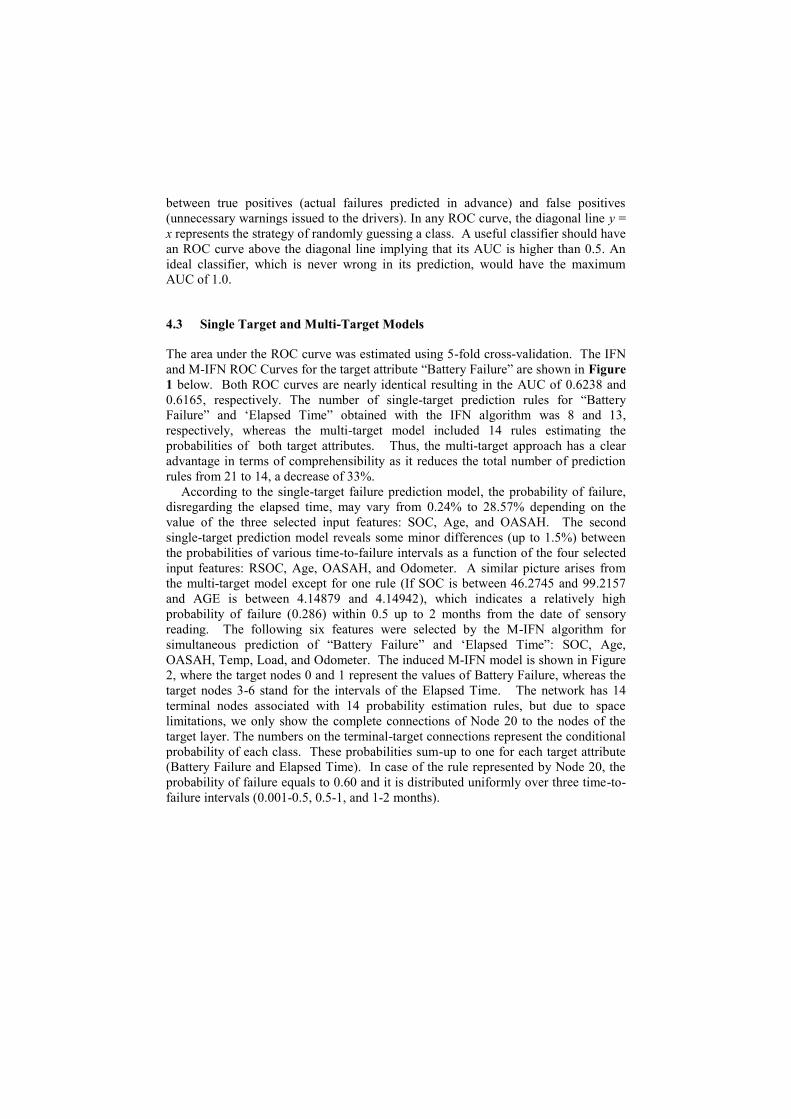
The generated dataset includes 46,418 records representing periodical battery
sensory readings for 21,814 distinct vehicles. We have simulated the failure
distribution based on battery warranty trends in real vehicles, resulting in 394
simulated battery failures, which is only 0.8% of the total number of readings. Thus,
we are facing here a prediction problem characterized by extremely imbalanced
classes.
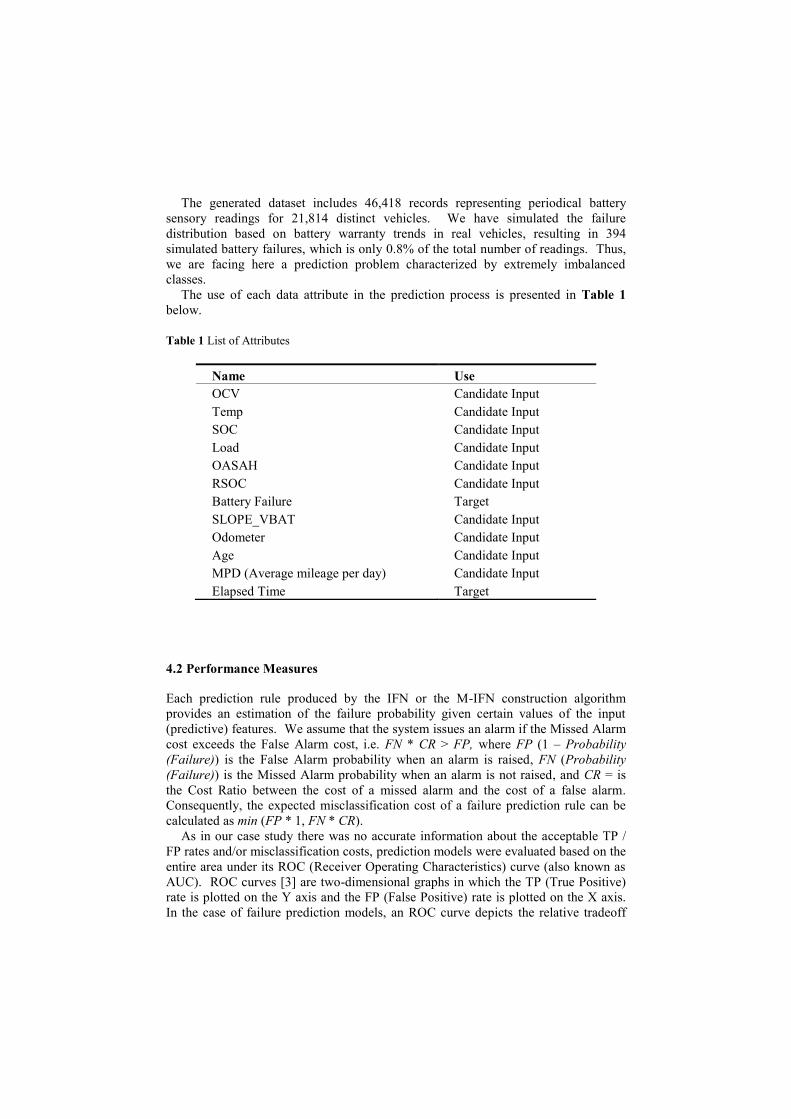
The use of each data attribute in the prediction process is presented in Table 1
below.
Table 1 List of Attributes
4.2 Performance Measures
Each prediction rule produced by the IFN or the M-IFN construction algorithm
provides an estimation of the failure probability given certain values of the input
(predictive) features. We assume that the system issues an alarm if the Missed Alarm
cost exceeds the False Alarm cost, i.e. FN * CR > FP, where FP (1 – Probability
(Failure)) is the False Alarm probability when an alarm is raised, FN (Probability
(Failure)) is the Missed Alarm probability when an alarm is not raised, and CR = is
the Cost Ratio between the cost of a missed alarm and the cost of a false alarm.
Consequently, the expected misclassification cost of a failure prediction rule can be
calculated as min (FP * 1, FN * CR).
As in our case study there was no accurate information about the acceptable TP /
FP rates and/or misclassification costs, prediction models were evaluated based on the
entire area under its ROC (Receiver Operating Characteristics) curve (also known as
AUC). ROC curves [3] are two-dimensional graphs in which the TP (True Positive)
rate is plotted on the Y axis and the FP (False Positive) rate is plotted on the X axis.
In the case of failure prediction models, an ROC curve depicts the relative tradeoff
Name Use
OCV Candidate Input
Temp Candidate Input
SOC Candidate Input
Load Candidate Input
OASAH Candidate Input
RSOC Candidate Input
Battery Failure Target
SLOPE_VBAT Candidate Input
Odometer Candidate Input
Age Candidate Input
MPD (Average mileage per day) Candidate Input
Elapsed Time Target
between true positives (actual failures predicted in advance) and false positives
(unnecessary warnings issued to the drivers). In any ROC curve, the diagonal line y =
x represents the strategy of randomly guessing a class. A useful classifier should have
an ROC curve above the diagonal line implying that its AUC is higher than 0.5. An
ideal classifier, which is never wrong in its prediction, would have the maximum
AUC of 1.0.
4.3 Single Target and Multi-Target Models
The area under the ROC curve was estimated using 5-fold cross-validation. The IFN
and M-IFN ROC Curves for the target attribute “Battery Failure” are shown in Figure
1 below. Both ROC curves are nearly identical resulting in the AUC of 0.6238 and
0.6165, respectively. The number of single-target prediction rules for “Battery
Failure” and „Elapsed Time” obtained with the IFN algorithm was 8 and 13,
respectively, whereas the multi-target model included 14 rules estimating the
probabilities of both target attributes. Thus, the multi-target approach has a clear
advantage in terms of comprehensibility as it reduces the total number of prediction
rules from 21 to 14, a decrease of 33%.
According to the single-target failure prediction model, the probability of failure,
disregarding the elapsed time, may vary from 0.24% to 28.57% depending on the
value of the three selected input features: SOC, Age, and OASAH. The second
single-target prediction model reveals some minor differences (up to 1.5%) between
the probabilities of various time-to-failure intervals as a function of the four selected
input features: RSOC, Age, OASAH, and Odometer. A similar picture arises from
the multi-target model except for one rule (If SOC is between 46.2745 and 99.2157
and AGE is between 4.14879 and 4.14942), which indicates a relatively high
probability of failure (0.286) within 0.5 up to 2 months from the date of sensory
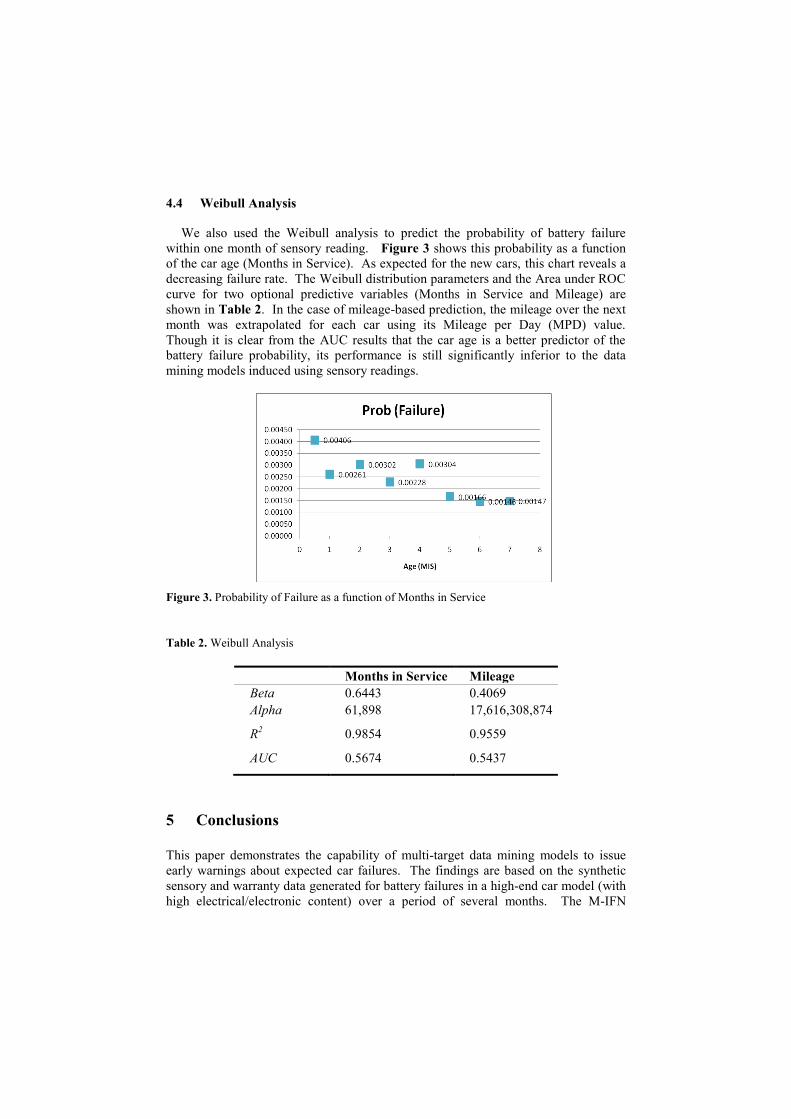
reading. The following six features were selected by the M-IFN algorithm for
simultaneous prediction of “Battery Failure” and „Elapsed Time”: SOC, Age,
OASAH, Temp, Load, and Odometer. The induced M-IFN model is shown in Figure
2, where the target nodes 0 and 1 represent the values of Battery Failure, whereas the
target nodes 3-6 stand for the intervals of the Elapsed Time. The network has 14
terminal nodes associated with 14 probability estimation rules, but due to space
limitations, we only show the complete connections of Node 20 to the nodes of the
target layer. The numbers on the terminal-target connections represent the conditional
probability of each class. These probabilities sum-up to one for each target attribute
(Battery Failure and Elapsed Time). In case of the rule represented by Node 20, the
probability of failure equals to 0.60 and it is distributed uniformly over three time-to-
failure intervals (0.001-0.5, 0.5-1, and 1-2 months).
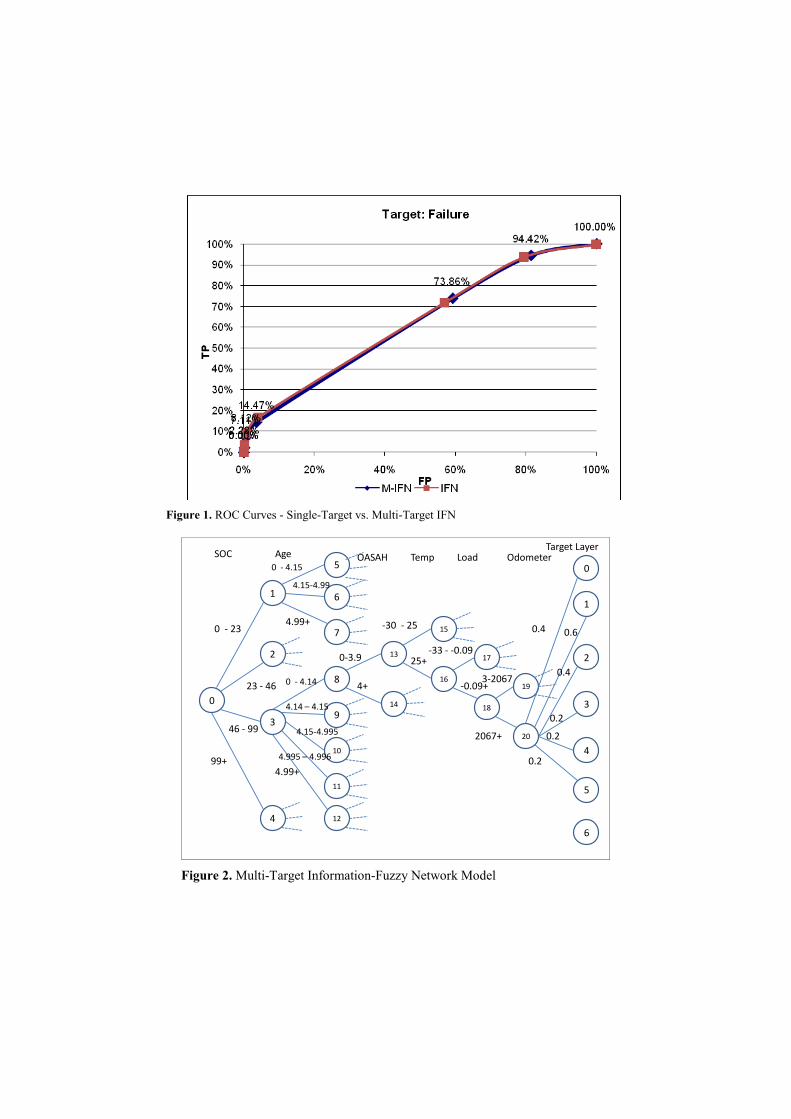
Figure 1. ROC Curves - Single-Target vs. Multi-Target IFN
0
4
3
2
1
7
6
5
12
11
10
9
8
14
13
16
15
18
17
20
19
0
2
1
6
5
4
3
Target LayerSOC Age OASAH Temp Load Odometer
0 - 23
23 - 46
46 - 99
99+
0 - 4.15
4.15-4.99
4.99+
0 - 4.14
4.15-4.995
4.99+
4.14 – 4.15
4.995 – 4.996
0-3.9
4+
-30 - 25
25+-33 - -0.09
-0.09+3-2067
2067+
0.4 0.6
0.4
0.2
0.2
0.2
Figure 2. Multi-Target Information-Fuzzy Network Model
4.4 Weibull Analysis
We also used the Weibull analysis to predict the probability of battery failure
within one month of sensory reading. Figure 3 shows this probability as a function
of the car age (Months in Service). As expected for the new cars, this chart reveals a
decreasing failure rate. The Weibull distribution parameters and the Area under ROC
curve for two optional predictive variables (Months in Service and Mileage) are
shown in Table 2. In the case of mileage-based prediction, the mileage over the next
month was extrapolated for each car using its Mileage per Day (MPD) value.
Though it is clear from the AUC results that the car age is a better predictor of the
battery failure probability, its performance is still significantly inferior to the data
mining models induced using sensory readings.
Figure 3. Probability of Failure as a function of Months in Service
Table 2. Weibull Analysis
Months in Service Mileage
Beta 0.6443 0.4069
Alpha 61,898 17,616,308,874
R2
0.9854 0.9559
AUC 0.5674 0.5437
5 Conclusions
This paper demonstrates the capability of multi-target data mining models to issue
early warnings about expected car failures. The findings are based on the synthetic
sensory and warranty data generated for battery failures in a high-end car model (with
high electrical/electronic content) over a period of several months. The M-IFN

construction algorithm has produced a compact and interpretable model of 14 rules
estimating the probability distributions of two target attributes (Battery Failure and
Elapsed Time). This model has outperformed the Weibull-based reliability analysis.
Further improvement in predictive performance may be reached by combining the
multi-target learning approach with ensemble methods, like bagging. Analyzing
sensory and claims data of each vehicle over the entire warranty period should also
bring more accurate results.
Acknowledgments. This work was supported in part by the General Motors Global
Research & Development – India Science Lab.
References
1. Bey-Temsamani, A., Engels, M., Motten, A., Vandenplas, S., Ompusunggu, A. P.: A
Practical Approach to Combine Data Mining and Prognostics for Improved Predictive
Maintenance. In: The Data Mining Case Studies Workshop (DMCS), 15th ACM
SIGKDD Conference on Knowledge Discovery and Data Mining (KDD-2009), pp. 37-
44, Paris (2009).
2. Caruana, R.: Multitask Learning. Machine Learning, 28, 41–75 (1997)
3. Fawcett, T.: An introduction to ROC analysis. Pattern Recogn. Lett. 27, 8, 861-874
(2006)
4. Ducange, P., Lazzerini, B., Marcelloni, F.: Multi-objective genetic fuzzy classifiers
for imbalanced and cost-sensitive datasets. Soft Computing - A Fusion of
Foundations, Methodologies and Applications. DOI - 10.1007/s00500-009-0460-y
(in press)
5. Gusikhin, O., Rychtyckyj, N., and Filev, D.: Intelligent systems in the automotive
industry: applications and trends. Knowl. Inf. Syst. 12, 2, 147-168 (2007)
6. Last, M.: Multi-Objective Classification with Info-Fuzzy Networks. In: Proceedings of
the 15th European Conference on Machine Learning (ECML 2004), Pisa, Italy,
Springer-Verlag, Lecture Notes in Artificial Intelligence 3201, pp. 239-249 (2004)
7. Last, M., Danon, G., Biderman, Sh., Miron, E.: Optimizing a Batch Manufacturing
Process through Interpretable Data Mining Models. Journal of Intelligent
Manufacturing, 20, 5, 523-534 (2009)
8. Last, M., Elnekave, S., Naor, A., and Shonfeld, V.: Predicting Wine Quality from
Agricultural Data with Single-Objective and Multi-Objective Data Mining Algorithms.
In T. Warren Liao and Evangelos Triantaphyllou (eds), Recent Advances on Mining of
Enterprise Data: Algorithms and Applications, pp. 323-365, World Scientific, Series on
Computers and Operations Research, Vol. 6 (2007)
9. Last, M. and Maimon, O.: A Compact and Accurate Model for Classification. IEEE
Transactions on Knowledge and Data Engineering, 16, 2, 203-215 (2004)
10. Schwall, M., Gerdes, J. C., Bäker, B., Forchert, T.: A probabilistic vehicle diagnostic
system using multiple models. In: 15th Innovative Applications of Artificial
Intelligence Conference (IAAI-03), pp 123–128, Acapulco, Mexico (2003)
11. Suzuki, E., Gotoh, M., and Choki, Y.: Bloomy Decision Tree for Multi-objective
Classification. In: L. De Raedt and A. Siebes (Eds.): PKDD 2001, LNAI 2168, pp.436
–447 Springer, Heidelberg (2001)
12. Wu S., Gebraeel N., Lawley M., and Yih Y.: A Neural Network Integrated Decision
Support System for Condition-Based Optimal Predictive Maintenance Policy. IEEE
Transactions on Systems, Man and Cybernetics-Part A, 37, 2, 226-236 (2007)
Related Documents