This article was downloaded by: [National Textile University] On: 13 November 2014, At: 23:02 Publisher: Taylor & Francis Informa Ltd Registered in England and Wales Registered Number: 1072954 Registered office: Mortimer House, 37-41 Mortimer Street, London W1T 3JH, UK The Journal of The Textile Institute Publication details, including instructions for authors and subscription information: http://www.tandfonline.com/loi/tjti20 Prediction of warp and weft yarn crimp in cotton woven fabrics Muhammad Maqsood a , Tanveer Hussain b , Yasir Nawab a , Khubab Shaker a & Muhammad Umair a a Department of Weaving, National Textile University, Faisalabad, Pakistan b Dean Faculty of Engineering and Technology, National Textile University, Faisalabad, Pakistan Published online: 11 Nov 2014. To cite this article: Muhammad Maqsood, Tanveer Hussain, Yasir Nawab, Khubab Shaker & Muhammad Umair (2014): Prediction of warp and weft yarn crimp in cotton woven fabrics, The Journal of The Textile Institute, DOI: 10.1080/00405000.2014.981041 To link to this article: http://dx.doi.org/10.1080/00405000.2014.981041 PLEASE SCROLL DOWN FOR ARTICLE Taylor & Francis makes every effort to ensure the accuracy of all the information (the “Content”) contained in the publications on our platform. However, Taylor & Francis, our agents, and our licensors make no representations or warranties whatsoever as to the accuracy, completeness, or suitability for any purpose of the Content. Any opinions and views expressed in this publication are the opinions and views of the authors, and are not the views of or endorsed by Taylor & Francis. The accuracy of the Content should not be relied upon and should be independently verified with primary sources of information. Taylor and Francis shall not be liable for any losses, actions, claims, proceedings, demands, costs, expenses, damages, and other liabilities whatsoever or howsoever caused arising directly or indirectly in connection with, in relation to or arising out of the use of the Content. This article may be used for research, teaching, and private study purposes. Any substantial or systematic reproduction, redistribution, reselling, loan, sub-licensing, systematic supply, or distribution in any form to anyone is expressly forbidden. Terms & Conditions of access and use can be found at http:// www.tandfonline.com/page/terms-and-conditions

Welcome message from author
This document is posted to help you gain knowledge. Please leave a comment to let me know what you think about it! Share it to your friends and learn new things together.
Transcript
This article was downloaded by: [National Textile University]On: 13 November 2014, At: 23:02Publisher: Taylor & FrancisInforma Ltd Registered in England and Wales Registered Number: 1072954 Registered office: Mortimer House,37-41 Mortimer Street, London W1T 3JH, UK
The Journal of The Textile InstitutePublication details, including instructions for authors and subscription information:http://www.tandfonline.com/loi/tjti20
Prediction of warp and weft yarn crimp in cottonwoven fabricsMuhammad Maqsooda, Tanveer Hussainb, Yasir Nawaba, Khubab Shakera & MuhammadUmaira
a Department of Weaving, National Textile University, Faisalabad, Pakistanb Dean Faculty of Engineering and Technology, National Textile University, Faisalabad,PakistanPublished online: 11 Nov 2014.
To cite this article: Muhammad Maqsood, Tanveer Hussain, Yasir Nawab, Khubab Shaker & Muhammad Umair(2014): Prediction of warp and weft yarn crimp in cotton woven fabrics, The Journal of The Textile Institute, DOI:10.1080/00405000.2014.981041
To link to this article: http://dx.doi.org/10.1080/00405000.2014.981041
PLEASE SCROLL DOWN FOR ARTICLE
Taylor & Francis makes every effort to ensure the accuracy of all the information (the “Content”) containedin the publications on our platform. However, Taylor & Francis, our agents, and our licensors make norepresentations or warranties whatsoever as to the accuracy, completeness, or suitability for any purpose of theContent. Any opinions and views expressed in this publication are the opinions and views of the authors, andare not the views of or endorsed by Taylor & Francis. The accuracy of the Content should not be relied upon andshould be independently verified with primary sources of information. Taylor and Francis shall not be liable forany losses, actions, claims, proceedings, demands, costs, expenses, damages, and other liabilities whatsoeveror howsoever caused arising directly or indirectly in connection with, in relation to or arising out of the use ofthe Content.
This article may be used for research, teaching, and private study purposes. Any substantial or systematicreproduction, redistribution, reselling, loan, sub-licensing, systematic supply, or distribution in anyform to anyone is expressly forbidden. Terms & Conditions of access and use can be found at http://www.tandfonline.com/page/terms-and-conditions
Prediction of warp and weft yarn crimp in cotton woven fabrics
Muhammad Maqsooda*, Tanveer Hussainb, Yasir Nawaba, Khubab Shakera and Muhammad Umaira
aDepartment of Weaving, National Textile University, Faisalabad, Pakistan; bDean Faculty of Engineering and Technology, NationalTextile University, Faisalabad, Pakistan
(Received 12 March 2014; accepted 22 October 2014)
The aim of this study was to develop statistical models for the prediction of warp and weft crimp percentage of cottonwoven fabrics. The developed models are based on the empirical data obtained from carefully developed 60 fabricsamples with different yarn linear densities, fabric densities, and weave designs. The predictability and accuracy of thedeveloped models was assessed by correlation analysis of the predicted and actual crimp values of another set of eightfabric samples which was not used for the development of models. The results show fairly good capability and accuracyof the prediction models.
Keywords: statistical model; warp crimp; weft crimp; woven fabrics; yarn
Introduction
When warp and weft yarn interweave in fabric, they followa wavy or uneven path. Crimp percentage is defined as themean difference between the straightened thread length andthe distance between the ends of the thread while in thecloth expressed as a percentage (Crimp In Yarn And Fabric,n.d.). The warp and weft crimp is an important aspect of thedesign and production planning of woven fabrics. In orderto predict the quantity of warp and weft yarns required toobtain a certain fabric dimension, the relationship betweenthe yarn dimensions and the fabric parameters should beknown (Yukhin & Yukhina, 1996).The parametersdetermining warp and weft crimps of the grey fabric are theyarn linear densities, fabric thread densities, reed count, andthe weave design. Other factors which may affect the warpand weft crimp include weaving conditions such as theloom type, warp and weft tension, etc. (Yukhin & Yukhina,1996). Some correlation has been reported between theyarn crimp and mechanical properties of the fabric. Forexample, the stiffness of fabric is reported to decrease withincrease in yarn crimp percentage (Peerzada, Aftab, &Awais, 2012). Mechanical and physical properties, such asextensibility, bending, and shear and hygral expansion aredirectly affected by yarn crimp (Garcia, Pailthorpe, &Postle, 1994). Fibers with higher crimp have lower elasticmoduli and breaking stresses and extensions.Correspondingly, the yarns made from these fibers show thesame lower mechanical properties (Dusenbury & Dansizer,1960). A correlation between the fiber or yarn crimp andfabric comfort properties also has been reported. Fabricsconsisting of high level of fiber crimp have high values of
NUMERI (smoothness) and FUKURAMI (fullness andsoftness) (Matsudaira, 1984). Crimp in yarns is a distinctproperty of woven fabrics recognized to have significanteffect on fabric response to impact loading because crimpcan give rise to excessive transverse deflection (Tan, Shim,& Zeng, 2005). If the mass per unit length of the uncrimpedmaterial is known and no weight changes take place in thewoven and finished fabric, then the crimp is obtainablefrom weight measurements on yarn specimens taken from aknown length of fabric (Taylor & Skelton, 2008).
Several studies have reported the effect of crimp onquality of tops, yarns, and fabric, and on ease ofprocessing and spinnability (Liu, Wang, & Wang, 2004).Fabric mechanical properties can be characterized interms of yarn crimp properties and fabric structures(Jeon, Chun, & Hong, 2003). There is a close relationbetween crimp and cover factor, so that a rough idea ofthe crimps to be expected in a cloth can be obtainedfrom cover factors (Peirce, 1937).
Often the warp and weft yarn consumption in a wovenfabric is predicted by experience and/or hit-and-trialmethods. Sometimes the predicted yarn for warp and weftwould luckily result in accurate length of required fabric,while, at times, the desired results would not be obtainedresulting in fabric length shortage. This problem is due tounknown yarn crimp in a fabric to be woven.
Although some research has been reported in thepast on the study of yarn crimp in a woven fabric, thereis currently no simple prediction model available basedon empirical data which could be used for prediction ofyarn crimp in a woven fabric.
*Corresponding author. Email: [email protected]
© 2014 The Textile Institute
The Journal of The Textile Institute, 2014http://dx.doi.org/10.1080/00405000.2014.981041
Dow
nloa
ded
by [
Nat
iona
l Tex
tile
Uni
vers
ity]
at 2
3:02
13
Nov
embe
r 20
14

The present study was therefore undertaken todevelop statistical model for the prediction of yarn crimpin cotton woven fabrics using empirical data based on acarefully manufactured range of 68 cotton woven fabricsunder controlled conditions of temperature and moisture.
Materials and methods
Experimental data was taken from 60 woven fabricsamples which were manufactured on Toyota JAT 710looms in a weaving mill engaged in the production offabrics used in home textiles such as bed linen andcurtains. The data summary of the 60 fabric samples isgiven in Table 1. The range of yarn linear densities,fabric densities, and types of weaves selected in thisstudy is that which is commonly used in majority ofthe home textile products including bed linen andcurtains, which was the main scope of thisinvestigation.
The material of all the samples was cotton, andfabrics were woven in four different weaves comprising1/1, 2/1, 3/1, and 4/1 containing 17 samples for eachweave having float length 1, 2,3, and 4, respectively.The warp and weft crimp percentage of these 68 fabricsamples was measured. Crimp percentage was measuredusing ASTM D 3883 (n.d.). Out of 68 samples, the dataof 60 samples was used to develop the statistical models,while data of 8 samples (2 for each weave) was used forthe validation of the developed models. All statisticalanalysis was performed using MINITAB statisticalsoftware.
The relationship of the length of a piece of fabricand the length of yarn in the fabric can be determinedprecisely only by measuring the length of yarn enteringthe loom and the length of fabric made from thatparticular length of yarn. In most cases, however, thedetermination must necessarily be made on a wovenfabric by measuring the length of yarn removed from ameasured length of fabric, thus introducing certainvariations that will influence the accuracy of the test.Yarn removed from the woven fabric containsundulations or waves/crimps that have been introducedduring weaving process.
Yarn crimp percentage of the fabric specimens wasdetermined according to ASTM D3883 using Equation (1)
Crimp % ¼ Y� F
F� 100; (1)
where F: distance between bench marks on yarn infabric; Y: distance between bench marks on yarn afterremoval from fabric and straightened.
Data analysis was accomplished using MINITAB-16statistical software package. Firstly, best subsets ofregression models were developed to identify the mostsignificant factors to be considered in the final prediction
models. Then, the final prediction models weredeveloped with the most significant factors usingresponse surface regression.
Results and discussion
The summary of the crimp results is given in Table 1.The results were analyzed in MINITAB statisticalsoftware. The significant factors and interactions whichaffect both warp and weft crimp percentages weredetermined and were analyzed separately. The equationswere derived to predict both warp and weft crimppercentages.
Warp crimp prediction model
Tables 2 and 5 give the best subsets of regressionmodels for warp and weft crimp, respectively. These twotables show 15 different statistical models for warp andweft crimp, respectively, as given by the MINITABstatistical software, including different predictor variablessuch as warp count, weft count, ends/inch, picks/inch,width, float, reed count, and ends/dent.
Model number 9 in Table 2 is found to be the bestmodel with high R-Sq and adjusted R-Sq and low S andC-p values close to the number of predictors contained inthe model. Model 9 with weft count, picks/inch, width,float, and reed count as predictor variables was selectedfor further analysis using response surface regression.Analysis of variance for response surface regression isgiven in Table 3. p-Values for regression, linear, andinteraction indicate the significant effects of the selectedpredictor variables on the warp crimp. The responsesurface regression coefficients are given in Table 4.p-Values indicate the significant linear effect of weftcount, picks/inch, width, float, reed count, and significantinteractions of weft count × float, width × float,float × reed count as shown in Equation (2).
Percentage of warp crimp ¼ 9:34511� 0:213050 Yð Þþ 0:104114 Pð Þ� 0:104859 Wð Þ� 0:649173 FLð Þþ 0:166232 R:Cð Þ� 2:389331E� 04 P � Pð Þþ 0:0226854 Y � FLð Þþ 0:0213441 W � FLð Þ� 0:0382312 FL � R:Cð Þ:
(2)
R-Sq = 71.81 %.In Equation (2), weft count has negative sign,
indicating that with increase in weft count (i.e. when
2 M. Maqsood et al.
Dow
nloa
ded
by [
Nat
iona
l Tex
tile
Uni
vers
ity]
at 2
3:02
13
Nov
embe
r 20
14
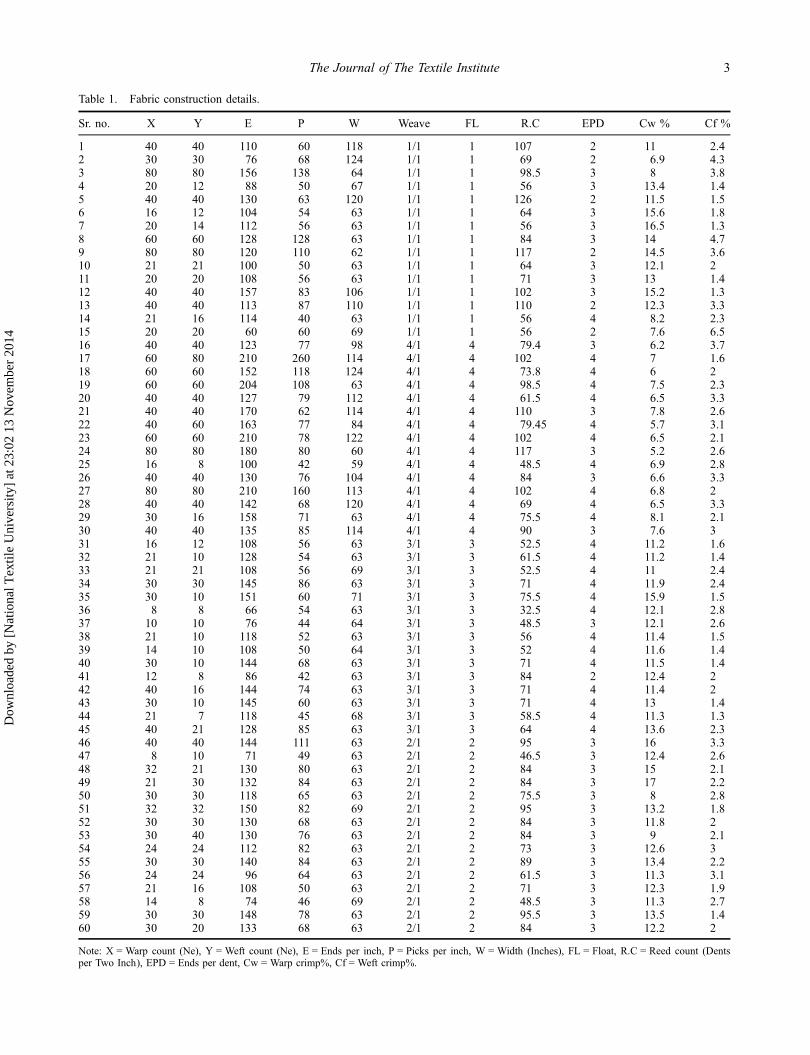
Table 1. Fabric construction details.
Sr. no. X Y E P W Weave FL R.C EPD Cw % Cf %
1 40 40 110 60 118 1/1 1 107 2 11 2.42 30 30 76 68 124 1/1 1 69 2 6.9 4.33 80 80 156 138 64 1/1 1 98.5 3 8 3.84 20 12 88 50 67 1/1 1 56 3 13.4 1.45 40 40 130 63 120 1/1 1 126 2 11.5 1.56 16 12 104 54 63 1/1 1 64 3 15.6 1.87 20 14 112 56 63 1/1 1 56 3 16.5 1.38 60 60 128 128 63 1/1 1 84 3 14 4.79 80 80 120 110 62 1/1 1 117 2 14.5 3.610 21 21 100 50 63 1/1 1 64 3 12.1 211 20 20 108 56 63 1/1 1 71 3 13 1.412 40 40 157 83 106 1/1 1 102 3 15.2 1.313 40 40 113 87 110 1/1 1 110 2 12.3 3.314 21 16 114 40 63 1/1 1 56 4 8.2 2.315 20 20 60 60 69 1/1 1 56 2 7.6 6.516 40 40 123 77 98 4/1 4 79.4 3 6.2 3.717 60 80 210 260 114 4/1 4 102 4 7 1.618 60 60 152 118 124 4/1 4 73.8 4 6 219 60 60 204 108 63 4/1 4 98.5 4 7.5 2.320 40 40 127 79 112 4/1 4 61.5 4 6.5 3.321 40 40 170 62 114 4/1 4 110 3 7.8 2.622 40 60 163 77 84 4/1 4 79.45 4 5.7 3.123 60 60 210 78 122 4/1 4 102 4 6.5 2.124 80 80 180 80 60 4/1 4 117 3 5.2 2.625 16 8 100 42 59 4/1 4 48.5 4 6.9 2.826 40 40 130 76 104 4/1 4 84 3 6.6 3.327 80 80 210 160 113 4/1 4 102 4 6.8 228 40 40 142 68 120 4/1 4 69 4 6.5 3.329 30 16 158 71 63 4/1 4 75.5 4 8.1 2.130 40 40 135 85 114 4/1 4 90 3 7.6 331 16 12 108 56 63 3/1 3 52.5 4 11.2 1.632 21 10 128 54 63 3/1 3 61.5 4 11.2 1.433 21 21 108 56 69 3/1 3 52.5 4 11 2.434 30 30 145 86 63 3/1 3 71 4 11.9 2.435 30 10 151 60 71 3/1 3 75.5 4 15.9 1.536 8 8 66 54 63 3/1 3 32.5 4 12.1 2.837 10 10 76 44 64 3/1 3 48.5 3 12.1 2.638 21 10 118 52 63 3/1 3 56 4 11.4 1.539 14 10 108 50 64 3/1 3 52 4 11.6 1.440 30 10 144 68 63 3/1 3 71 4 11.5 1.441 12 8 86 42 63 3/1 3 84 2 12.4 242 40 16 144 74 63 3/1 3 71 4 11.4 243 30 10 145 60 63 3/1 3 71 4 13 1.444 21 7 118 45 68 3/1 3 58.5 4 11.3 1.345 40 21 128 85 63 3/1 3 64 4 13.6 2.346 40 40 144 111 63 2/1 2 95 3 16 3.347 8 10 71 49 63 2/1 2 46.5 3 12.4 2.648 32 21 130 80 63 2/1 2 84 3 15 2.149 21 30 132 84 63 2/1 2 84 3 17 2.250 30 30 118 65 63 2/1 2 75.5 3 8 2.851 32 32 150 82 69 2/1 2 95 3 13.2 1.852 30 30 130 68 63 2/1 2 84 3 11.8 253 30 40 130 76 63 2/1 2 84 3 9 2.154 24 24 112 82 63 2/1 2 73 3 12.6 355 30 30 140 84 63 2/1 2 89 3 13.4 2.256 24 24 96 64 63 2/1 2 61.5 3 11.3 3.157 21 16 108 50 63 2/1 2 71 3 12.3 1.958 14 8 74 46 69 2/1 2 48.5 3 11.3 2.759 30 30 148 78 63 2/1 2 95.5 3 13.5 1.460 30 20 133 68 63 2/1 2 84 3 12.2 2
Note: X = Warp count (Ne), Y = Weft count (Ne), E = Ends per inch, P = Picks per inch, W = Width (Inches), FL = Float, R.C = Reed count (Dentsper Two Inch), EPD = Ends per dent, Cw = Warp crimp%, Cf = Weft crimp%.
The Journal of The Textile Institute 3
Dow
nloa
ded
by [
Nat
iona
l Tex
tile
Uni
vers
ity]
at 2
3:02
13
Nov
embe
r 20
14

weft count becomes finer), the percentage of warp crimpwill be decreased. The reason may be that the path ofwarp yarn will have less curvature owing to lesserthickness of the weft count. The value of picks per inchin the equation has positive sign indicating that with anincrease in the pick density, the percentage of warpcrimp also increases. This is due to the fact that greaterpicks in one inch will cause warp end to have morecurvature during interlacement than lesser number ofpicks in one inch. The float value also has negative signin Equation (2), which indicates that longer the float ofwarp, lesser will be the yarn crimp. The reason may bethat the warp end will have lesser interlacement points
with weft yarn when float is more and, hence, crimp inthe warp yarn will be less. Reed count has direct relationwith percentage of warp crimp as indicated in Equation(2) because greater reed count shows higher number ofreed dents in a given space which will increase thenumber of warp ends per unit area. Due to increase indensity of warp ends, the fabric made will be compactand greater compactness of warp ends results in highercrimp in the yarn.
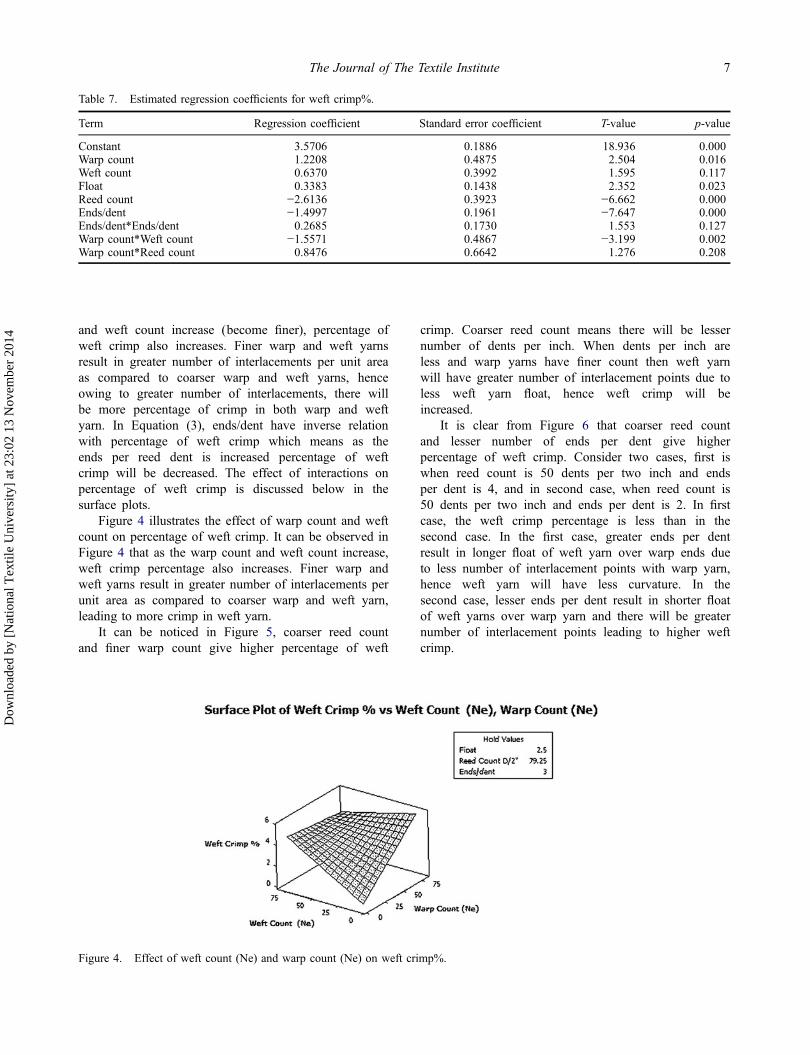
Figure 1 illustrates the effect of weft count and floaton warp crimp percentage. It can be noticed fromFigure 1 that the warp crimp percentage is greater withshorter warp float and coarser weft count. The reason
Table 2. Best subsets regression table for warp crimp models.
Var R-SqR-Sq(adj) Cp S X Y E P W FL R.C EPD
1 33.9 32.7 42.0 2.5855 x1 24.2 22.9 56.3 2.7688 x2 46.6 44.7 25.1 2.3435 x x2 45.8 43.9 26.3 2.3614 X x3 53.9 51.4 16.3 2.1968 X x x3 51.4 48.8 19.9 2.2547 X x x4 58.1 55.0 12.1 2.1146 X x x x4 58.0 54.9 12.2 2.1159 X x x x5 64.2 60.9 5.1 1.9724 X x x x x5 60.8 57.2 10.1 2.0629 X x x x x6 65.2 61.3 5.6 1.9621 X x x x x x6 64.5 60.5 6.6 1.9816 X x x x x x7 65.6 60.9 7.0 1.9704 X x x x x x x7 65.2 60.5 7.6 1.9808 x X x x x x x8 65.6 60.2 9.0 1.9894 x X x x x x x x
Note: x sign indicate the variables included in the model, R-Sq indicates percentage of response variable variation, R-Sq (Adj) indicates percentage ofresponse variable variation adjusted for the no. of predictor, Cp indicates a statistic used as an aid in choosing between multiple regression models, Sindicates standard error of regression, X indicates warp count (Ne), Y indicates weft count (Ne), E indicates ends per inch, P indicates picks per inch,W indicates width of fabric in inches, FL indicates Float Length, R.C indicates Reed count in dents per two inches, EPD indicates ends per reed dent.
Table 3. Analysis of variance for warp crimp%.
Source DF Seq SS Adj SS Adj MS F-value p-value
Regression 9 421.045 421.045 46.783 14.15 0.000Linear 5 376.253 366.340 73.268 22.16 0.000Weft count 1 111.648 123.129 123.129 37.25 0.000Picks/inch 1 22.008 29.123 29.123 8.81 0.005Width 1 59.651 43.644 43.644 13.20 0.001Float 1 135.061 21.449 21.449 6.49 0.014Reed count 1 47.886 45.499 45.499 13.76 0.001Square 1 22.367 15.594 15.594 4.72 0.035PPI*PPI 1 22.367 15.594 15.594 4.72 0.035Interaction 3 22.425 22.425 7.475 2.26 0.093Weft count*Float 1 0.060 6.709 6.709 2.03 0.160Width*Float 1 5.644 13.872 13.872 4.20 0.046Float*Reed count 1 16.721 16.721 16.721 5.06 0.029Residual error 50 165.284 165.284 3.306Total 59 586.328
Note: DF indicates degree of freedom, Seq SS indicates Sequential sum of squares, Adj SS indicates Adjusted sum of square, Adj MS indicatesAdjusted mean square.
4 M. Maqsood et al.
Dow
nloa
ded
by [
Nat
iona
l Tex
tile
Uni
vers
ity]
at 2
3:02
13
Nov
embe
r 20
14
behind this is, when float of warp yarn is short, forexample, one, then warp yarn will bend after each pickresulting in more curvature in the warp yarn which willgive higher crimp percentage. Coarser weft count willcause warp yarn to bend more because of greaterthickness as compared to finer weft count resulting inhigher warp crimp percentage.
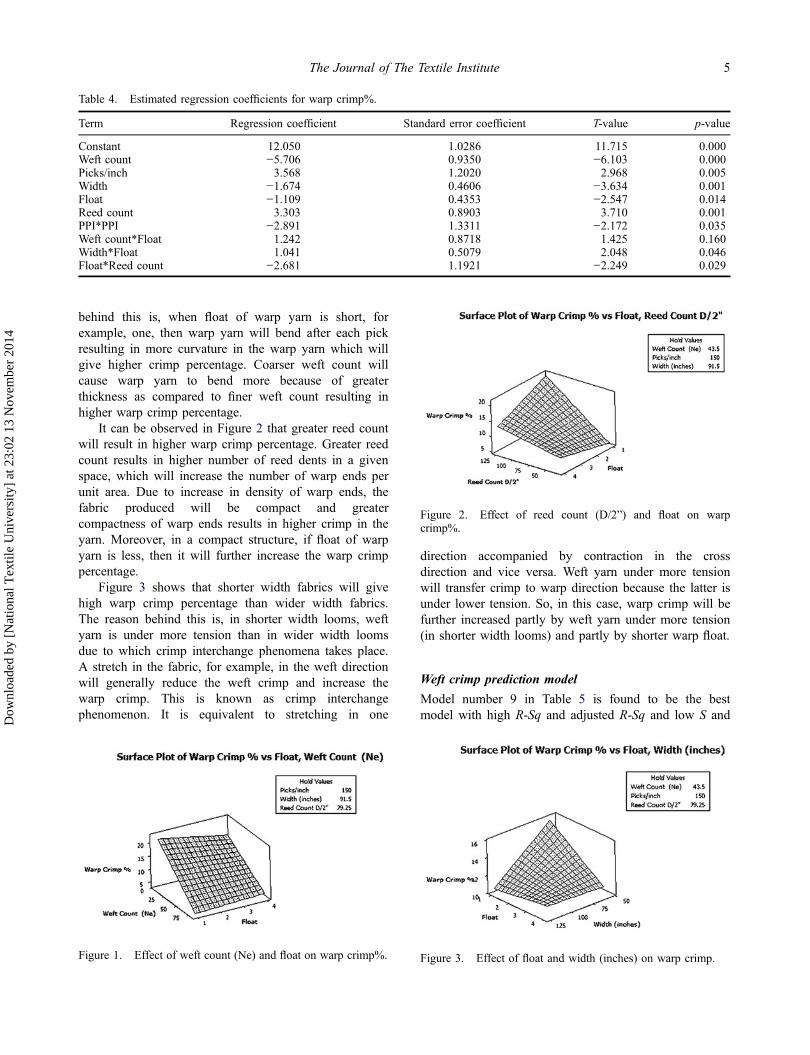
It can be observed in Figure 2 that greater reed countwill result in higher warp crimp percentage. Greater reedcount results in higher number of reed dents in a givenspace, which will increase the number of warp ends perunit area. Due to increase in density of warp ends, thefabric produced will be compact and greatercompactness of warp ends results in higher crimp in theyarn. Moreover, in a compact structure, if float of warpyarn is less, then it will further increase the warp crimppercentage.
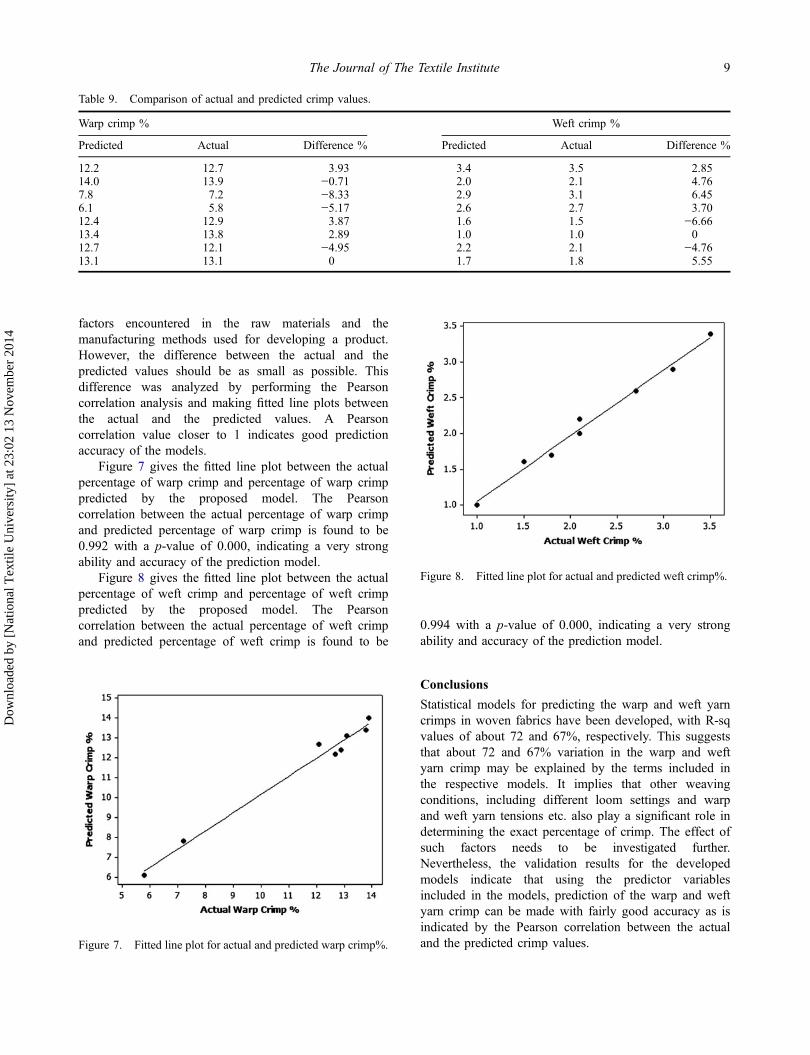
Figure 3 shows that shorter width fabrics will givehigh warp crimp percentage than wider width fabrics.The reason behind this is, in shorter width looms, weftyarn is under more tension than in wider width loomsdue to which crimp interchange phenomena takes place.A stretch in the fabric, for example, in the weft directionwill generally reduce the weft crimp and increase thewarp crimp. This is known as crimp interchangephenomenon. It is equivalent to stretching in one
direction accompanied by contraction in the crossdirection and vice versa. Weft yarn under more tensionwill transfer crimp to warp direction because the latter isunder lower tension. So, in this case, warp crimp will befurther increased partly by weft yarn under more tension(in shorter width looms) and partly by shorter warp float.
Weft crimp prediction model
Model number 9 in Table 5 is found to be the bestmodel with high R-Sq and adjusted R-Sq and low S and
Table 4. Estimated regression coefficients for warp crimp%.
Term Regression coefficient Standard error coefficient T-value p-value
Constant 12.050 1.0286 11.715 0.000Weft count −5.706 0.9350 −6.103 0.000Picks/inch 3.568 1.2020 2.968 0.005Width −1.674 0.4606 −3.634 0.001Float −1.109 0.4353 −2.547 0.014Reed count 3.303 0.8903 3.710 0.001PPI*PPI −2.891 1.3311 −2.172 0.035Weft count*Float 1.242 0.8718 1.425 0.160Width*Float 1.041 0.5079 2.048 0.046Float*Reed count −2.681 1.1921 −2.249 0.029
Figure 1. Effect of weft count (Ne) and float on warp crimp%.
Figure 2. Effect of reed count (D/2”) and float on warpcrimp%.
Figure 3. Effect of float and width (inches) on warp crimp.
The Journal of The Textile Institute 5
Dow
nloa
ded
by [
Nat
iona
l Tex
tile
Uni
vers
ity]
at 2
3:02
13
Nov
embe
r 20
14

C-p values close to the number of predictors containedin the model. Model 9 with warp count, weft count,float, reed count, and ends/dent as predictor variableswas selected for further analysis using response surfaceregression. Analysis of variance for response surfaceregression is given in Table 6. Regression, linear, andinteraction indicate the significant effects of the selectedpredictor variables on the weft crimp. The responsesurface regression coefficients are given in Table 7.p-Values indicate the significant linear effect of warpcount, weft count, float, reed count, ends/dent, andsignificant interactions of warp count × weft count, warpcount × reed count. Regression model to predict the weftcrimp percentage is described as shown in Equation (3).
Percentage of weft crimp ¼ 11:5902þ 0:0455467 Xð Þþ 0:0695917 Yð Þþ 0:225528 FLð Þ� 0:0780662 R:Cð Þ� 3:11096 EPDð Þþ 0:268549 EPD � EPDð Þ� 0:00118502 X � Yð Þþ 0:000503629 X � R:Cð Þ:
(3)
R-Sq = 67.05 %.In Equation (3), warp count and weft count have
positive sign which indicates that as the warp count
Table 5. Subset regression table for weft crimp model.
Var R-Sq R-Sq (adj) Cp S X Y E P W FL R.C EPD
1 14.4 12.9 41.7 0.89440 x1 8.8 7.3 48.0 0.92272 x2 46.1 44.2 7.5 0.71567 x X2 41.3 39.2 13.0 0.74711 x X3 49.4 46.7 5.8 0.69967 x X x3 48.7 45.9 6.6 0.70478 x x x4 52.4 49.0 4.3 0.68459 x x x x4 52.1 48.6 4.6 0.68672 x x x x5 54.9 50.7 3.5 0.67290 x x x x x5 53.0 48.7 5.6 0.68664 x X x x x6 55.3 50.3 5.0 0.67585 x x X x x x6 54.9 49.8 5.5 0.67901 x x x x x x7 55.3 49.3 7.0 0.68231 x x X x x x x7 55.3 49.3 7.0 0.68232 x x X x x x x8 55.3 48.3 9.0 0.68897 x x X x x x x x
Note: x sign indicates that the variables included in the model, R-Sq indicates percentage of response variable variation, R-Sq (Adj) indicatespercentage of response variable variation adjusted for the no. of predictor, Cp indicates a statistic used as an aid in choosing between multipleregression models, S indicates standard error of regression, X indicates warp count (Ne), Y indicates weft count (Ne), E indicates ends per inch, Pindicates picks per inch, W indicates width of fabric in inches, FL indicates Float Length, R.C indicates Reed count in dents per two inches, EPDindicates ends per reed dent.
Table 6. Analysis of variance for weft crimp%.
Source DF Seq SS Adj SS Adj MS F-value
Regression 8 36.3235 36.3235 4.5404 12.97Linear 5 29.7229 29.4919 5.8984 16.85Warp count 1 2.5458 2.1953 2.1953 6.27Weft count 1 3.6374 0.8909 0.8909 2.55Float 1 0.9125 1.9370 1.9370 5.53Reed count 1 5.3540 15.5339 15.5339 44.38Ends/dent 1 17.2732 20.4679 20.4679 58.48Square 1 0.7975 0.8439 0.8439 2.41Ends/dent*Ends/dent 1 0.7975 0.8439 0.8439 2.41Interaction 2 5.8031 5.8031 2.9015 8.29Warp count*Weft count 1 5.2331 3.5819 3.5819 10.23Warp count*Reed count 1 0.5699 0.5699 0.5699 1.63Residual error 51 17.8505 17.8505 0.3500Lack-of-fit 50 17.8505 17.8505 0.3570 *Pure error 1 0.0000 0.0000 0.0000Total 59 54.1740
Note: DF indicates degree of freedom, Seq SS indicates Sequential sum of squares, Adj SS indicates Adjusted sum of square, Adj MS indicatesAdjusted mean square.
6 M. Maqsood et al.
Dow
nloa
ded
by [
Nat
iona
l Tex
tile
Uni
vers
ity]
at 2
3:02
13
Nov
embe
r 20
14
and weft count increase (become finer), percentage ofweft crimp also increases. Finer warp and weft yarnsresult in greater number of interlacements per unit areaas compared to coarser warp and weft yarns, henceowing to greater number of interlacements, there willbe more percentage of crimp in both warp and weftyarn. In Equation (3), ends/dent have inverse relationwith percentage of weft crimp which means as theends per reed dent is increased percentage of weftcrimp will be decreased. The effect of interactions onpercentage of weft crimp is discussed below in thesurface plots.
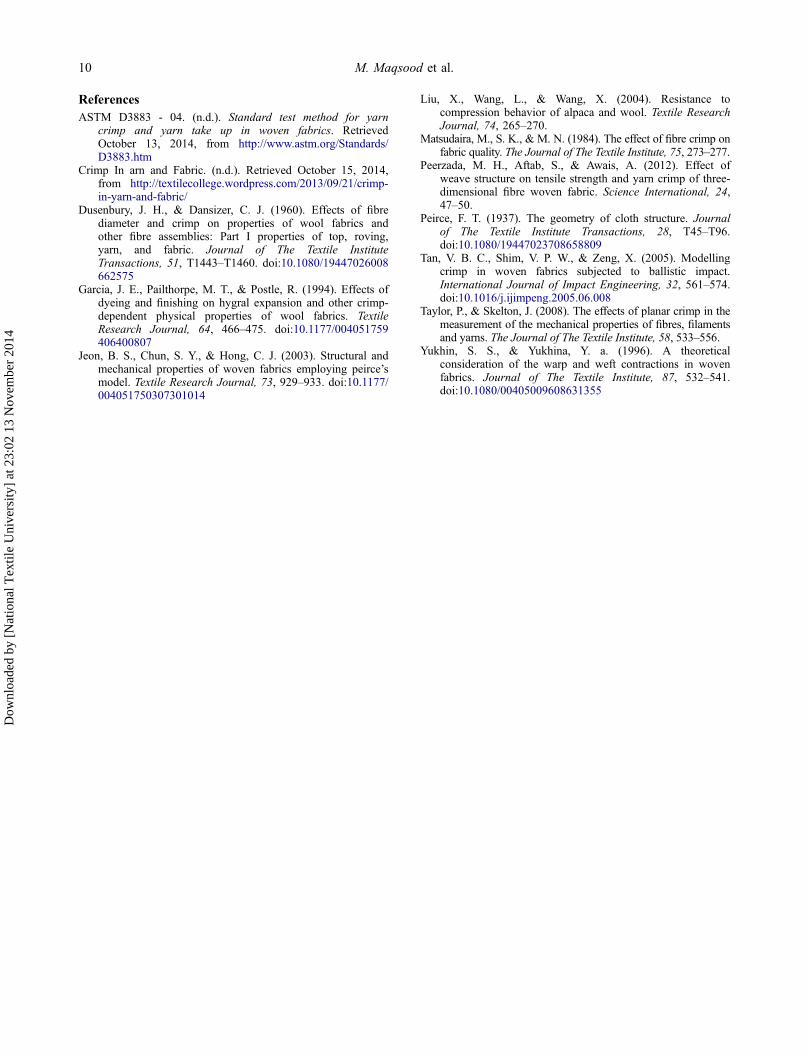
Figure 4 illustrates the effect of warp count and weftcount on percentage of weft crimp. It can be observed inFigure 4 that as the warp count and weft count increase,weft crimp percentage also increases. Finer warp andweft yarns result in greater number of interlacements perunit area as compared to coarser warp and weft yarn,leading to more crimp in weft yarn.
It can be noticed in Figure 5, coarser reed countand finer warp count give higher percentage of weft
crimp. Coarser reed count means there will be lessernumber of dents per inch. When dents per inch areless and warp yarns have finer count then weft yarnwill have greater number of interlacement points due toless weft yarn float, hence weft crimp will beincreased.
It is clear from Figure 6 that coarser reed countand lesser number of ends per dent give higherpercentage of weft crimp. Consider two cases, first iswhen reed count is 50 dents per two inch and endsper dent is 4, and in second case, when reed count is50 dents per two inch and ends per dent is 2. In firstcase, the weft crimp percentage is less than in thesecond case. In the first case, greater ends per dentresult in longer float of weft yarn over warp ends dueto less number of interlacement points with warp yarn,hence weft yarn will have less curvature. In thesecond case, lesser ends per dent result in shorter floatof weft yarns over warp yarn and there will be greaternumber of interlacement points leading to higher weftcrimp.
Table 7. Estimated regression coefficients for weft crimp%.
Term Regression coefficient Standard error coefficient T-value p-value
Constant 3.5706 0.1886 18.936 0.000Warp count 1.2208 0.4875 2.504 0.016Weft count 0.6370 0.3992 1.595 0.117Float 0.3383 0.1438 2.352 0.023Reed count −2.6136 0.3923 −6.662 0.000Ends/dent −1.4997 0.1961 −7.647 0.000Ends/dent*Ends/dent 0.2685 0.1730 1.553 0.127Warp count*Weft count −1.5571 0.4867 −3.199 0.002Warp count*Reed count 0.8476 0.6642 1.276 0.208
Figure 4. Effect of weft count (Ne) and warp count (Ne) on weft crimp%.
The Journal of The Textile Institute 7
Dow
nloa
ded
by [
Nat
iona
l Tex
tile
Uni
vers
ity]
at 2
3:02
13
Nov
embe
r 20
14

Validation of prediction models
As mentioned above, out of total number of 68 samples,the data of 60 samples were used for developing theprediction models, while data of 8 samples (Table 8)were used to check the validity of the developed models.
A comparison of actual crimp values and those predictedby the developed models is given in Table 9.
In most of the prediction model developed by usingany technique, there is always some difference betweenthe actual and the predicted values due to several noise
Figure 5. Effect of reed count (D/2”) and warp count on weft crimp%.
Figure 6. Effect of ends/dent and reed count (D/2”) on weft crimp%.
Table 8. Fabric construction details for validation.
Sr. no. X Y E P W Weave FL R.C EPD Warp crimp % Weft crimp %
1 40 40 105 95 116 1/1. 1 102 2 12.7 3.52 21 21 110 62 63 1/1. 1 71 3 13.9 2.13 40 40 142 83 112 4/1. 4 92 3 7.2 3.14 60 60 185 98 122 4/1. 4 90.1 4 5.8 2.75 21 16 128 80 63 3/1. 3 61.5 4 12.9 1.56 30 10 150 71 63 3/1. 3 75.5 4 13.8 1.07 30 30 130 70 63 2/1. 2 84 3 12.1 2.18 21 30 130 76 63 2/1. 2 84 3 13.1 1.8
8 M. Maqsood et al.
Dow
nloa
ded
by [
Nat
iona
l Tex
tile
Uni
vers
ity]
at 2
3:02
13
Nov
embe
r 20
14
factors encountered in the raw materials and themanufacturing methods used for developing a product.However, the difference between the actual and thepredicted values should be as small as possible. Thisdifference was analyzed by performing the Pearsoncorrelation analysis and making fitted line plots betweenthe actual and the predicted values. A Pearsoncorrelation value closer to 1 indicates good predictionaccuracy of the models.
Figure 7 gives the fitted line plot between the actualpercentage of warp crimp and percentage of warp crimppredicted by the proposed model. The Pearsoncorrelation between the actual percentage of warp crimpand predicted percentage of warp crimp is found to be0.992 with a p-value of 0.000, indicating a very strongability and accuracy of the prediction model.
Figure 8 gives the fitted line plot between the actualpercentage of weft crimp and percentage of weft crimppredicted by the proposed model. The Pearsoncorrelation between the actual percentage of weft crimpand predicted percentage of weft crimp is found to be
0.994 with a p-value of 0.000, indicating a very strongability and accuracy of the prediction model.
Conclusions
Statistical models for predicting the warp and weft yarncrimps in woven fabrics have been developed, with R-sqvalues of about 72 and 67%, respectively. This suggeststhat about 72 and 67% variation in the warp and weftyarn crimp may be explained by the terms included inthe respective models. It implies that other weavingconditions, including different loom settings and warpand weft yarn tensions etc. also play a significant role indetermining the exact percentage of crimp. The effect ofsuch factors needs to be investigated further.Nevertheless, the validation results for the developedmodels indicate that using the predictor variablesincluded in the models, prediction of the warp and weftyarn crimp can be made with fairly good accuracy as isindicated by the Pearson correlation between the actualand the predicted crimp values.
Table 9. Comparison of actual and predicted crimp values.
Warp crimp % Weft crimp %
Predicted Actual Difference % Predicted Actual Difference %
12.2 12.7 3.93 3.4 3.5 2.8514.0 13.9 −0.71 2.0 2.1 4.767.8 7.2 −8.33 2.9 3.1 6.456.1 5.8 −5.17 2.6 2.7 3.7012.4 12.9 3.87 1.6 1.5 −6.6613.4 13.8 2.89 1.0 1.0 012.7 12.1 −4.95 2.2 2.1 −4.7613.1 13.1 0 1.7 1.8 5.55
Figure 7. Fitted line plot for actual and predicted warp crimp%.
Figure 8. Fitted line plot for actual and predicted weft crimp%.
The Journal of The Textile Institute 9
Dow
nloa
ded
by [
Nat
iona
l Tex
tile
Uni
vers
ity]
at 2
3:02
13
Nov
embe
r 20
14
ReferencesASTM D3883 - 04. (n.d.). Standard test method for yarn
crimp and yarn take up in woven fabrics. RetrievedOctober 13, 2014, from http://www.astm.org/Standards/D3883.htm
Crimp In arn and Fabric. (n.d.). Retrieved October 15, 2014,from http://textilecollege.wordpress.com/2013/09/21/crimp-in-yarn-and-fabric/
Dusenbury, J. H., & Dansizer, C. J. (1960). Effects of fibrediameter and crimp on properties of wool fabrics andother fibre assemblies: Part I properties of top, roving,yarn, and fabric. Journal of The Textile InstituteTransactions, 51, T1443–T1460. doi:10.1080/19447026008662575
Garcia, J. E., Pailthorpe, M. T., & Postle, R. (1994). Effects ofdyeing and finishing on hygral expansion and other crimp-dependent physical properties of wool fabrics. TextileResearch Journal, 64, 466–475. doi:10.1177/004051759406400807
Jeon, B. S., Chun, S. Y., & Hong, C. J. (2003). Structural andmechanical properties of woven fabrics employing peirce’smodel. Textile Research Journal, 73, 929–933. doi:10.1177/004051750307301014
Liu, X., Wang, L., & Wang, X. (2004). Resistance tocompression behavior of alpaca and wool. Textile ResearchJournal, 74, 265–270.
Matsudaira, M., S. K., & M. N. (1984). The effect of fibre crimp onfabric quality. The Journal of The Textile Institute, 75, 273–277.
Peerzada, M. H., Aftab, S., & Awais, A. (2012). Effect ofweave structure on tensile strength and yarn crimp of three-dimensional fibre woven fabric. Science International, 24,47–50.
Peirce, F. T. (1937). The geometry of cloth structure. Journalof The Textile Institute Transactions, 28, T45–T96.doi:10.1080/19447023708658809
Tan, V. B. C., Shim, V. P. W., & Zeng, X. (2005). Modellingcrimp in woven fabrics subjected to ballistic impact.International Journal of Impact Engineering, 32, 561–574.doi:10.1016/j.ijimpeng.2005.06.008
Taylor, P., & Skelton, J. (2008). The effects of planar crimp in themeasurement of the mechanical properties of fibres, filamentsand yarns. The Journal of The Textile Institute, 58, 533–556.
Yukhin, S. S., & Yukhina, Y. a. (1996). A theoreticalconsideration of the warp and weft contractions in wovenfabrics. Journal of The Textile Institute, 87, 532–541.doi:10.1080/00405009608631355
10 M. Maqsood et al.
Dow
nloa
ded
by [
Nat
iona
l Tex
tile
Uni
vers
ity]
at 2
3:02
13
Nov
embe
r 20
14
Related Documents