Prediction of the intramuscular fat content in loin muscle of pig carcasses by quantitative time-resolved ultrasound S. Lakshmanan a, 1 , T. Koch b, 1 , S. Brand c , N. Männicke a , M. Wicke b , D. Mörlein b, ⁎, K. Raum a a Julius Wolff Institute & Berlin-Brandenburg School for Regenerative Therapies, Charité - Universitätsmedizin Berlin, Germany b Department of Animal Sciences, Georg August Universität Göttingen, Germany c Fraunhofer Institute of Material Mechanics, Halle, Germany abstract article info Article history: Received 15 December 2010 Received in revised form 5 July 2011 Accepted 7 July 2011 Keywords: Intramuscular fat Muscle Ultrasound Spectrum Cepstrum Apparent integrated backscatter A novel method for non-destructive intramuscular fat (IMF) estimation via spectral ultrasound backscatter analysis of signals obtained from pig carcasses early post mortem is described. A commercial hand-held ultrasound device (center frequency: 2.7 MHz) was modified to focus the sound beam to the longissimus muscle at the 2nd/3rd last rib. Time-resolved ultrasound backscatter signals of loin muscle were recorded 45 min p.m. on 82 pig carcass sides. Backfat width (d BF = 18.9 ± 3.8 mm) and muscle attenuation (α muscle = .77 ± .15 dB MHz −1 cm −1 ) were assessed from the measured pulse echo data. Other propagation properties of skin, backfat and muscle tissue obtained in a previous investigation were incorporated into the signal pre-processing to minimize parameter estimation artifacts. Spectral and cepstral parameters were derived from time-gated backscattered signals measured in the central muscle region. The range of intramuscular fat (IMF) determined by ether extraction was representative for German pig populations (.7% ≤ IMF chem ≤ 3.6%, coefficient of variation CV(IMF chem ) = 44.8%). Variations of IMF were associated with variations of backfat width (CV(d BF ) = 20.2%), muscle attenuation (CV(α muscle ) = 19.3%), and slope of the backscattered amplitude spectrum (CV(m) = 28.8%). A full cross validated multiple linear regression model using these parameters resulted in good predictability of IMF chem (R 2 = .76, RMSEP = .34%). Among all tested carcasses, 73% could be correctly classified into one of three IMF classes (LOW: b 1%, MID: 1–2%, HIGH: N 2%). Using a single threshold (2% IMF), about 92% of all carcasses were correctly classified. With respect to the inherent variability of IMF within a single muscle and the different tissue volumes used for the chemical and ultrasound based IMF estimations the remaining prediction errors are acceptable. Compared to previous ultrasound based studies, the number of acoustic parameters used for the IMF prediction could be reduced. Moreover, the used parameters are based on time-of-flight and spectral slope estimations, which are i) more robust with respect to measurement artifacts and ii) have a causal link to structural variations associated with IMF variations in pork loin. © 2011 Elsevier Ltd. All rights reserved. 1. Introduction The intramuscular fat content (IMF) is widely regarded as one of the major parameters influencing quality and sensory characteristics of meat (Fernandez, Monin, Talmant, Mourot, & Lebret, 1999; Suzuki et al., 2005; Wood et al., 2008). These relations are considered not to be linear and threshold levels between 2 and 3.5% IMF in porcine longissimus muscle at the 2nd/3rd last rib have been proposed as benchmarks for optimal taste (Blanchard, Warkup, Ellis, Willis, & Avery, 1999; Fernandez et al., 1999; Kipfmüller, Bodis, Peschke, & Eichinger, 2000). However, recent investigations on German pig populations revealed average IMF values of about 1 to 1.5%, indicating that only a minority of the animals actually reach the proposed minimum IMF threshold level of 2% (Mörlein, Link, Werner, & Wicke, 2007). For the establishment of a sensory quality based marketing system, the classification of meat according to IMF levels is indispensable. Ultrasound (US) has been demonstrated to be promising for prediction of IMF in a fast, inexpensive and non-destructive way. For example, previous studies for IMF determination in livestock have related variations of either the sound velocity (Benedito, Carcel, Rossello, & Mulet, 2001; Park, Whittaker, Miller, & Hale, 1994) or the texture of the gray scale backscatter images (Brethour, 1994; Hassen, Wilson, Amin, Rouse, & Hays, 2001) to variations of IMF. These methods have been quite successful in the prediction of IMF in beef (R 2 values up to .75), both for in vivo measurements and for measurements on hot carcasses (Hassen et al., 2001; Hassen, Wilson, & Rouse, 2003; Whittaker, Park, Thane, Miller, & Savell, 1992). However, most studies performed on Meat Science 90 (2012) 216–225 ⁎ Corresponding author at: Department of Animal Sciences, Georg-August-Universität, Albrecht-Thaer-Weg 3, D-37075 Göttingen, Germany. Tel.: +49 551 395611; fax: +49 551 395587. E-mail address: [email protected] (D. Mörlein). 1 Both authors equally contributed to this investigation. 0309-1740/$ – see front matter © 2011 Elsevier Ltd. All rights reserved. doi:10.1016/j.meatsci.2011.07.004 Contents lists available at ScienceDirect Meat Science journal homepage: www.elsevier.com/locate/meatsci

Welcome message from author
This document is posted to help you gain knowledge. Please leave a comment to let me know what you think about it! Share it to your friends and learn new things together.
Transcript

Meat Science 90 (2012) 216–225
Contents lists available at ScienceDirect
Meat Science
j ourna l homepage: www.e lsev ie r.com/ locate /meatsc i
Prediction of the intramuscular fat content in loin muscle of pig carcasses byquantitative time-resolved ultrasound
S. Lakshmanan a,1, T. Koch b,1, S. Brand c, N. Männicke a, M. Wicke b, D. Mörlein b,⁎, K. Raum a
a Julius Wolff Institute & Berlin-Brandenburg School for Regenerative Therapies, Charité - Universitätsmedizin Berlin, Germanyb Department of Animal Sciences, Georg August Universität Göttingen, Germanyc Fraunhofer Institute of Material Mechanics, Halle, Germany
⁎ Corresponding author at: Department of Animal ScieAlbrecht-Thaer-Weg 3, D-37075 Göttingen, Germany. Te551 395587.
E-mail address: [email protected] Both authors equally contributed to this investigatio
0309-1740/$ – see front matter © 2011 Elsevier Ltd. Aldoi:10.1016/j.meatsci.2011.07.004
a b s t r a c t
a r t i c l e i n f oArticle history:Received 15 December 2010Received in revised form 5 July 2011Accepted 7 July 2011
Keywords:Intramuscular fatMuscleUltrasoundSpectrumCepstrumApparent integrated backscatter
A novel method for non-destructive intramuscular fat (IMF) estimation via spectral ultrasound backscatteranalysis of signals obtained from pig carcasses early post mortem is described. A commercial hand-heldultrasound device (center frequency: 2.7 MHz) was modified to focus the sound beam to the longissimusmuscle at the 2nd/3rd last rib. Time-resolved ultrasound backscatter signals of loin muscle were recorded45 min p.m. on 82 pig carcass sides. Backfat width (dBF=18.9±3.8 mm) and muscle attenuation(αmuscle=.77±.15 dB MHz−1 cm−1) were assessed from the measured pulse echo data. Other propagationproperties of skin, backfat and muscle tissue obtained in a previous investigation were incorporated into thesignal pre-processing to minimize parameter estimation artifacts. Spectral and cepstral parameters werederived from time-gated backscattered signals measured in the central muscle region. The range ofintramuscular fat (IMF) determined by ether extraction was representative for German pig populations(.7%≤ IMFchem≤3.6%, coefficient of variation CV(IMFchem)=44.8%). Variations of IMF were associated withvariations of backfat width (CV(dBF)=20.2%), muscle attenuation (CV(αmuscle)=19.3%), and slope of thebackscattered amplitude spectrum (CV(m)=28.8%). A full cross validated multiple linear regression modelusing these parameters resulted in good predictability of IMFchem (R2=.76, RMSEP=.34%). Among all testedcarcasses, 73% could be correctly classified into one of three IMF classes (LOW: b1%, MID: 1–2%, HIGH: N2%).Using a single threshold (2% IMF), about 92% of all carcasses were correctly classified. With respect to theinherent variability of IMF within a single muscle and the different tissue volumes used for the chemical andultrasound based IMF estimations the remaining prediction errors are acceptable. Compared to previousultrasound based studies, the number of acoustic parameters used for the IMF prediction could be reduced.Moreover, the used parameters are based on time-of-flight and spectral slope estimations, which are i) morerobust with respect to measurement artifacts and ii) have a causal link to structural variations associated withIMF variations in pork loin.
nces, Georg-August-Universität,l.: +49 551 395611; fax: +49
.de (D. Mörlein).n.
l rights reserved.
© 2011 Elsevier Ltd. All rights reserved.
1. Introduction
The intramuscular fat content (IMF) is widely regarded as one ofthe major parameters influencing quality and sensory characteristicsof meat (Fernandez, Monin, Talmant, Mourot, & Lebret, 1999; Suzukiet al., 2005; Wood et al., 2008). These relations are considered not tobe linear and threshold levels between 2 and 3.5% IMF in porcinelongissimus muscle at the 2nd/3rd last rib have been proposed asbenchmarks for optimal taste (Blanchard, Warkup, Ellis, Willis, &Avery, 1999; Fernandez et al., 1999; Kipfmüller, Bodis, Peschke, &Eichinger, 2000). However, recent investigations on German pig
populations revealed average IMF values of about 1 to 1.5%, indicatingthat only a minority of the animals actually reach the proposedminimum IMF threshold level of 2% (Mörlein, Link, Werner, & Wicke,2007).
For the establishment of a sensory quality based marketing system,the classification of meat according to IMF levels is indispensable.Ultrasound (US) has been demonstrated to be promising for predictionof IMF in a fast, inexpensive and non-destructive way. For example,previous studies for IMF determination in livestock have relatedvariations of either the sound velocity (Benedito, Carcel, Rossello, &Mulet, 2001; Park,Whittaker, Miller, & Hale, 1994) or the texture of thegray scale backscatter images (Brethour, 1994; Hassen, Wilson, Amin,Rouse, & Hays, 2001) to variations of IMF. These methods have beenquite successful in the prediction of IMF in beef (R2 values up to .75),both for in vivo measurements and for measurements on hot carcasses(Hassen et al., 2001; Hassen, Wilson, & Rouse, 2003; Whittaker, Park,Thane, Miller, & Savell, 1992). However, most studies performed on

217S. Lakshmanan et al. / Meat Science 90 (2012) 216–225
porcine muscle were less predictive (R2≤ .4) (Newcom, Baas, & Lampe,2002; Ville et al., 1997). Most recently, ultrasound measurements onliving pigs and subsequent image analysis resulted in R2 values of .48predicting the chemically determined IMF (Maignel, Daigle, Gariépy,Wilson, & Sullivan, 2010).
During the last decade, spectral analysis of the backscatteredultrasound signals has proven to provide more detailed informationabout tissue constitution compared to conventional image texture orsound velocity analyses (Lizzi, Feleppa, Alam, & Deng, 2003; Park,Whittaker, Miller, & Bray, 1994). One major advantage of spectralanalysis of the radio frequency (RF) backscatter signals is that itcontains quantitative information about composition and elasticproperties of structures that are comparable to or smaller than theacoustic wavelength. The frequency dependence of acoustic back-scatter can therefore be used to quantify structural dimensions thatare not visible in the ultrasound image or to differentiate betweentissue types (Banihashemi et al., 2008; Gelse et al., 2010; Raju &Srinivasan, 2001; Scheipers et al., 2003). In muscle tissue, the majoracoustic inhomogeneities are considered to be the connective tissueinterfaces between adjacent muscle fibers and between musclebundles (Lizzi et al., 2003). Alterations of this structure are consideredto affect the backscatter spectrum. Lizzi et al. (1997) introducedseveral spectral parameters that are related to the structure of thescatterers. While the slope of the obtained power spectrum m (dB/MHz) is related to the size, midband fitM (dB, value of the linear fit atthe center frequency) and spectral intercept I (dB, extrapolatedamplitude value at 0 MHz) are affected by size, concentration, andimpedance of the scatterers (Lizzi et al., 1997; Lizzi, Alam, Mikaelian,Lee, & Feleppa, 2006). Another common spectral estimate is theapparent integrated backscatter amplitude AIB (dB, power spectrumwithin the bandwidth of the transducer) (Gelse et al., 2010). Tissueboundaries that are separated at distances larger than the wavelengthand the spatial resolution limit of the imaging system, e.g. themarbling structure in muscle, can often be seen directly in the US grayscale images. A more precise estimation of distance distributionsalong the sound propagation path from RF signals however, can beobtained using cepstral analysis (Oppenheim & Schafer, 2004).
The composition of connective tissue is influenced by multipleparameters, e.g. age or breed (Nishimura, 2010; Purslow, 2005).Moreover, IMF is known to alter the connective tissue structure due tothe deposition of fat inside the perimysium, i.e. between the primarymuscle fiber bundles (Essen-Gustavsson, Karlsson, Lundström, &Enfält, 1994). This deposition is associated with a partial destructionof the honeycomb structure of the connective tissue, which in turnreduces mechanical strength and shear modulus of the tissue(Nishimura, Hattori, & Takahashi, 1999; Wood et al., 2003) andexplains the association with sound velocity. On the other hand, theacoustic properties of fat are remarkably different from those ofmuscle and connective tissue. Therefore, an increasing amount of fatdeposited between muscle fibers and fiber bundles is hypothesized toalter the characteristics of the backscatter power spectrum and toincrease the amplitude of reflections at muscle bundle boundaries.Moreover, an increase of backscatter and reflection amplitudes shouldresult in an increase of the attenuation in muscle (Smith, 1996).
Yet, only few studies have targeted the use of spectral analysis topredict the IMF content of bovine (Abou El Karam, Buquet, Berge, &Culioli, 1997; Park, Whittaker, Miller, & Bray, 1994) and porcinemuscle (Mörlein, Rosner, Brand, Jenderka, & Wicke, 2005). The latterhave performed analysis of unprocessed backscatter signals obtainedwith a medical diagnostic ultrasound device to estimate theintramuscular fat content of porcine loin muscle. Although promisingresults were obtained (root mean squared error of predictionRMSEP=0.36%), the instrument and the prediction errors were notsufficient for industrial use at slaughter.
A prerequisite of a reliable ultrasound spectral analysis is an exactknowledge of the sound properties at the region of interest (ROI) and
all tissues passed by the RF signal. These properties are determined bysystem specific effects, e.g. center frequency, bandwidth and soundfield produced by the transducer. Furthermore, refraction andattenuation in all tissues along the sound propagation path willinfluence the sound field geometry (Gärtner, 2001). The incorporationof sophisticated calibration and correction methods are thereforeanticipated to improve the accuracy of ultrasound based IMFpredictions (Brand, Mörlein, & Rosner, 2002). Thus, reference dataof porcine skin, backfat and muscle, collected under laboratoryconditions (Koch et al., 2011a, 2011b) were implemented into thecorrection algorithms used during the present study. The IMF wasthereafter predicted from backscatter data collected with a custom-ized commercial hand-held US device.
2. Materials and methods
2.1. Animals
A representative set of carcasses with sufficient variation of IMFwas obtained by conducting three series of data acquisitions atdifferent German slaughter houses. For all measurements left carcasssides were used. At 2 commercial slaughter facilities 54 crossbredcarcasses were selected with widely varying carcass weight and leanmeat percentage (LMP) as estimated with the Fat-o-Meat'er (FOM,Carometec A/S, Herlev, Denmark). In addition, 28 Duroc and Duroc-crossbreds raised and slaughtered at a research slaughter unit weremeasured to further increase the range of IMF. After evisceration,muscle width MW (mm) and backfat width BW (mm) weredetermined with a carcass grading probe (FOM) on the Germanofficial site of carcass classification (between 2nd and 3rd last ribs,7 cm off the carcass split line).
2.2. Ultrasound data acquisition
Ultrasound data were recorded 45min post mortem (p.m.) onsuspended carcasses including skin and subcutaneous fat layers at the2nd and 3rd last ribs, 7 cm off the carcass split line (Fig. 1). Care wastaken to avoid the penetration hole of the Fat-o-Meat'ermeasurements.At this time the muscle temperature was approximately 38 °C. Threereplicate US readings were performed on all carcasses parallel to thesplit line, except for the research slaughter unit (28 carcasses, 2 replicatemeasurements). For each individual measurement the ultrasounddevice was detached and re-positioned. Care was taken to ensurecomparability in terms of measurement conditions (e.g. time p.m.,position). Acoustic coupling was achieved using ultrasound contact gel.
2.3. Chemical IMF determination
Approximately 24 h p.m., after chilling of the carcasses overnight,a chop was excised from the m. longissimus at the 2nd/3rd last rib forsubsequent analyses. IMF was determined in duplicate on homoge-nized samples after removal of the subcutaneous fat. The homogeni-zation was done using a Grindomix GM200 blender (Retsch GmbH;Haan, Germany) at 6000 rpm for 30 s. IMF was extracted withpetroleum ether using a Soxtherm-apparatus after HCl pre-treatmentaccording to German Food Legislation (LFGB, 2005) and is givenrelated to fresh matter. The average standard deviation of duplicateIMF determination was 0.05% IMF.
2.4. Ultrasound data analysis
For ultrasound readings, a customized carcass grading deviceUltrafom300 (UF300, Carometec A/S, Herlev, Denmark) was used. Theoriginal device consists of a linear array of 64 unfocused transducerelements (single element size: x=18 mm; y=0.8 mm) aligned alongthe y-axis. The nominal center frequency of the elements is 3.2 MHz.

Fig. 1. Ultrasound data acquisition on hanging pig carcasses at slaughter (left). Representative single radio-frequency signal (A line) and gray scale B-mode image of porcine muscleand backfat (right). The color coded acoustic sound field distribution of a single transducer element has been overlaid in the B-mode image.
218 S. Lakshmanan et al. / Meat Science 90 (2012) 216–225
Single elements are excited separately and produce an ellipticallyshaped sound field with the focus at a distance of approximately100 mm. The beam in the focal plane has−6 dB extensions of 2.5 mmand 50 mm in the x- and y-directions, respectively. This configurationhas been optimized to measure the acoustic reflections at the musclerib interface over an area of approximately 2.5 mm×100 mm (withthe long dimension parallel to y-axis and the carcass split line). Itshould be noted that this systemwas not designed for imaging but fordetection of the fat–muscle and muscle–rib boundaries.
Fig. 2. Contour plot of the spatial intensity distribution in dB of the Ultrafom 300 withoutposition) estimated from simulation and experiment without (lower left) and with acousti
The near field, i.e. the range from the transducer surface to thefocal plane, is characterized by an inhomogeneous pressure distribu-tion, rendering a quantitative backscatter analysis impossible.Therefore, an acoustic lens was designed that shifts the focus of thesound field towards the muscle region and produces smooth spatialand spectral characteristics within the muscle region of interest(Fig. 1). The necessary radius of curvature (ROC) of the lens wascomputed using the Field II simulation software (Jensen & Svendsen,1992). The lens was cast using silicone rubber (Elastosil M4641,
(upper left) and with (upper right) acoustic lens. Sound field plots along the depth (Zc lens (lower right).
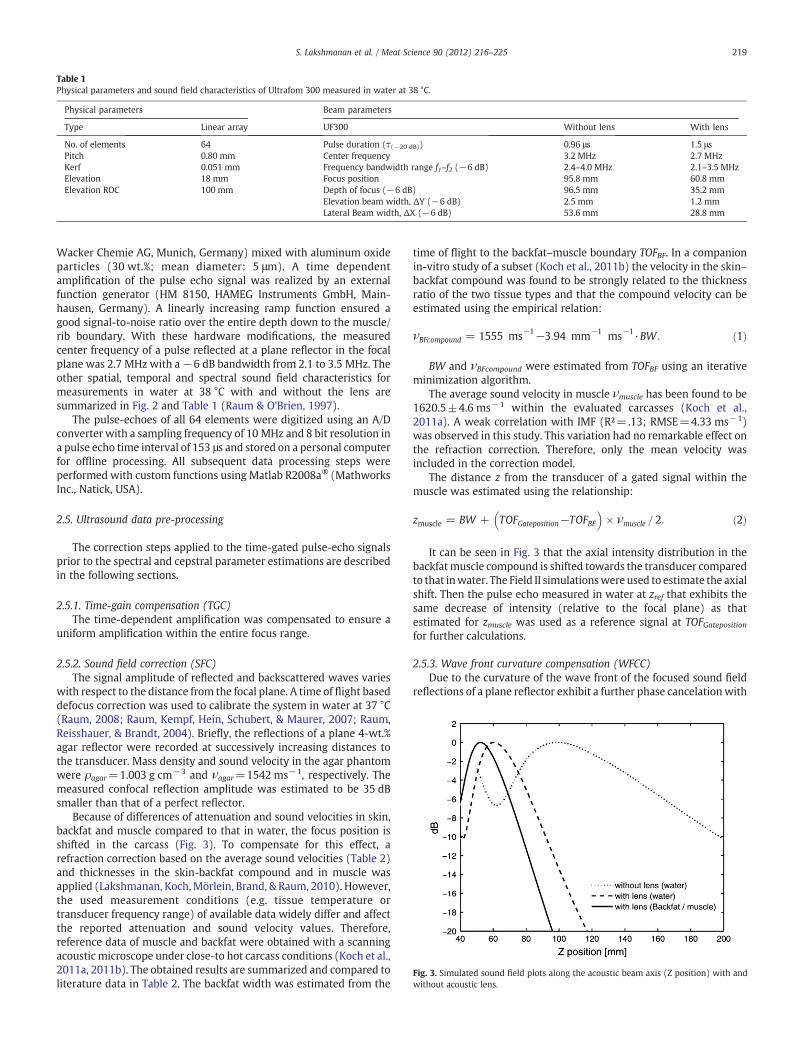
Table 1Physical parameters and sound field characteristics of Ultrafom 300 measured in water at 38 °C.
Physical parameters Beam parameters
Type Linear array UF300 Without lens With lens
No. of elements 64 Pulse duration (τ(−20 dB)) 0.96 μs 1.5 μsPitch 0.80 mm Center frequency 3.2 MHz 2.7 MHzKerf 0.051 mm Frequency bandwidth range f1–f2 (−6 dB) 2.4–4.0 MHz 2.1–3.5 MHzElevation 18 mm Focus position 95.8 mm 60.8 mmElevation ROC 100 mm Depth of focus (−6 dB) 96.5 mm 35.2 mm
Elevation beam width, ΔY (−6 dB) 2.5 mm 1.2 mmLateral Beam width, ΔX (−6 dB) 53.6 mm 28.8 mm
Fig. 3. Simulated sound field plots along the acoustic beam axis (Z position) with andwithout acoustic lens.
219S. Lakshmanan et al. / Meat Science 90 (2012) 216–225
Wacker Chemie AG, Munich, Germany) mixed with aluminum oxideparticles (30 wt.%; mean diameter: 5 μm). A time dependentamplification of the pulse echo signal was realized by an externalfunction generator (HM 8150, HAMEG Instruments GmbH, Main-hausen, Germany). A linearly increasing ramp function ensured agood signal-to-noise ratio over the entire depth down to the muscle/rib boundary. With these hardware modifications, the measuredcenter frequency of a pulse reflected at a plane reflector in the focalplane was 2.7 MHz with a−6 dB bandwidth from 2.1 to 3.5 MHz. Theother spatial, temporal and spectral sound field characteristics formeasurements in water at 38 °C with and without the lens aresummarized in Fig. 2 and Table 1 (Raum & O'Brien, 1997).
The pulse-echoes of all 64 elements were digitized using an A/Dconverter with a sampling frequency of 10 MHz and 8 bit resolution ina pulse echo time interval of 153 μs and stored on a personal computerfor offline processing. All subsequent data processing steps wereperformed with custom functions using Matlab R2008a® (MathworksInc., Natick, USA).
2.5. Ultrasound data pre-processing
The correction steps applied to the time-gated pulse-echo signalsprior to the spectral and cepstral parameter estimations are describedin the following sections.
2.5.1. Time-gain compensation (TGC)The time-dependent amplification was compensated to ensure a
uniform amplification within the entire focus range.
2.5.2. Sound field correction (SFC)The signal amplitude of reflected and backscattered waves varies
with respect to the distance from the focal plane. A time of flight baseddefocus correction was used to calibrate the system in water at 37 °C(Raum, 2008; Raum, Kempf, Hein, Schubert, & Maurer, 2007; Raum,Reisshauer, & Brandt, 2004). Briefly, the reflections of a plane 4-wt.%agar reflector were recorded at successively increasing distances tothe transducer. Mass density and sound velocity in the agar phantomwere ρagar=1.003 g cm−3 and νagar=1542 ms−1, respectively. Themeasured confocal reflection amplitude was estimated to be 35 dBsmaller than that of a perfect reflector.
Because of differences of attenuation and sound velocities in skin,backfat and muscle compared to that in water, the focus position isshifted in the carcass (Fig. 3). To compensate for this effect, arefraction correction based on the average sound velocities (Table 2)and thicknesses in the skin-backfat compound and in muscle wasapplied (Lakshmanan, Koch,Mörlein, Brand, & Raum, 2010). However,the used measurement conditions (e.g. tissue temperature ortransducer frequency range) of available data widely differ and affectthe reported attenuation and sound velocity values. Therefore,reference data of muscle and backfat were obtained with a scanningacoustic microscope under close-to hot carcass conditions (Koch et al.,2011a, 2011b). The obtained results are summarized and compared toliterature data in Table 2. The backfat width was estimated from the
time of flight to the backfat–muscle boundary TOFBF. In a companionin-vitro study of a subset (Koch et al., 2011b) the velocity in the skin–backfat compound was found to be strongly related to the thicknessratio of the two tissue types and that the compound velocity can beestimated using the empirical relation:
νBFcompound = 1555 ms−1−3:94 mm−1 ms−1·BW: ð1Þ
BW and νBFcompound were estimated from TOFBF using an iterativeminimization algorithm.
The average sound velocity in muscle νmuscle has been found to be1620.5±4.6 ms−1 within the evaluated carcasses (Koch et al.,2011a). A weak correlation with IMF (R²=.13; RMSE=4.33 ms−1)was observed in this study. This variation had no remarkable effect onthe refraction correction. Therefore, only the mean velocity wasincluded in the correction model.
The distance z from the transducer of a gated signal within themuscle was estimated using the relationship:
zmuscle = BW + TOFGateposition−TOFBF� �
× νmuscle = 2: ð2Þ
It can be seen in Fig. 3 that the axial intensity distribution in thebackfatmuscle compound is shifted towards the transducer comparedto that inwater. The Field II simulationswere used to estimate the axialshift. Then the pulse echo measured in water at zref that exhibits thesame decrease of intensity (relative to the focal plane) as thatestimated for zmuscle was used as a reference signal at TOFGatepositionfor further calculations.
2.5.3. Wave front curvature compensation (WFCC)Due to the curvature of the wave front of the focused sound field
reflections of a plane reflector exhibit a further phase cancelationwith

Table 2Acoustic properties of agar phantoms and different tissues.
Sound velocity [ms−1] Attenuation [dB MHz−1 cm−1] Source Notes
Agar 1550 0.2–0.3 Madsen et al. (1978) Adjustable from 0.2 to 1.5 dB MHz−1 cm−1 and 1520 to 1650 ms−1.Agar/graphite 1540±15 0.5±0.05 Madsen et al. (1978)Muscle 1621±5 1.02±0.26 Koch et al. (2011a)Skin 1682±23 2.5±0.6 Koch et al. (2011b)Skin 1710±60 0.7 Cantrell et al. (1978) Measured at 25 °CFat 1450±27 1.89±1.05 Koch et al. (2011b) Different between the fat layersFat 1530 Ninoles et al. (2007) Measured at 20 °CBackfat compound 1502±21 1.59–2.27 Koch et al. (2011b)Backfat compound 2.0–2.5 Gammell et al. (1979) Only one animal
220 S. Lakshmanan et al. / Meat Science 90 (2012) 216–225
increasing distance from the focal plane. Therefore, the decrease of themeasured amplitude of a plane reflector with respect to the defocusdistance is larger than that measured from backscattered signalscollected at the corresponding time gates. This amplitude deviationbetween signals reflected from a plane agar reflector after SFCcorrection and those backscattered within the corresponding timegate TOFGateposition was assessed by measurements in a tissue mim-icking agar phantom. This phantom was made of graphite powderimmersed in agar (Madsen et al., 1999). The sound velocity andattenuation are listed in Table 2. The phantom was measured usingthe same device settings as for the muscle measurements and wasattached directly to the transducer surface. Fig. 4 shows the apparentintegrated backscatter amplitude AIB as a function of the defocusdistance. For a proper sound field correction, AIB is supposed todecrease linearly with increasing depth. Due to the curvature of thefocused beam before and after the focal plane, the estimated AIBsincreased with increasing distance from the focal plane (Fig. 4a).
It can be seen in Fig. 4b that after SFC and WFCC corrections themeasured AIB in the focal range depends only on the attenuation ofthe phantom.
2.5.4. Attenuation compensation (AC)The sound waves are attenuated on the two-way travel from the
transducer surface to the muscle region of interest. Further lossesarise from partial reflections at tissue boundaries. Refraction of thesound field and attenuation after propagation through skin andbackfat were estimated using sound velocity and attenuation valuesassessed previously (Koch et al., 2011b). The muscle attenuationαmuscle within the ROI was estimated using a sliding windowtechnique as proposed by (Bigelow & O'Brien, 2005; Bigelow, Oelze,& O'Brien, 2005). For this, all 64 spectra were averaged for eachTOFGateposition and the slope of the frequency dependent attenuation
Fig. 4. Apparent integrated backscatter estimation before wave front curvature compensatioapparent integrated backscatter (right). For better illustration, a bias of 40 dB was added.
was assessed by linear regression. Finally, the attenuation of theoverlaying backfat tissue αBF was compensated. A mean value ofαBF=2.1 dB MHz−1 cm−1 was used (Koch et al., 2011b).
2.6. Spectral parameter estimation
Backscatter properties of muscle tissue were assessed within a ROI54 mm×15 mm (i.e. the axial −6 dB range from 45 to 59 mm inwater). After the above mentioned corrections, the normalized powerspectra S(f) were calculated as follows.
First, a part of the signal was gated using a sliding Hanningwindow. The positions of the first and last windows were placed10 mm above and 7 mm below the estimated focus position,respectively. The gate width was equivalent to the 2-fold pulseduration (3 μs), which corresponds to a depth range of ~15 mmassuming a sound velocity of 1620 ms−1 in muscle. The overlapbetween adjacent gate windows was set to 50%. The logarithmicpower spectrum was normalized to the reference spectrum obtainedfrom the plane agar reflector after SFC, WFCC and AC correction.Spectra intensity within the frequency bandwidth below −40 dB(close to noise level) was excluded. The excluded RF signal percent(RFexcl) was used as an indicator for the quality of the acquired data.The remaining normalized spectra were averaged within the entireROI. AIB was calculated in the frequency range between 2.1 MHz and3.5 MHz:
AIB =1Δf
∫ S fð Þdf ð3Þ
Midband fit M and spectral slope m were calculated as describedelsewhere (Lizzi et al., 2003) and illustrated in Fig. 5.
n (left). Axial intensity distribution and wave front curvature compensation-corrected

Fig. 5. Estimation of spectral parameters from the normalized power spectrum (left). Apparent integrated backscatter (AIB) histogram distribution within the evaluated muscleregion of interest (right).
221S. Lakshmanan et al. / Meat Science 90 (2012) 216–225
2.7. Cepstral parameter estimation
The power cepstral data analysis can be described as the Fouriertransform (FT) of the power spectral density of a time signal:
C τð Þ = FT log10 jSmuscle fð Þ j2− log10 jSref fð Þ j2� ����
���2 ð4Þ
where Smuscle(f) and Sref(f) are the Fourier transforms of the time-gated backscatter signals within the bandwidth of the ultrasoundsystem of muscle and reference, respectively. Cepstral peaks areassociated with the occurrence and the time delay of several echoeswithin a time gate. Resulting time delays below the pulse length wereexcluded in the analysis. The window length was 5 times the pulseduration and the overlap was set to 90%. Only SFC and WFCCcorrections were applied for the cepstral analysis. Prior to the FT thedifference spectrum was preconditioned by removing DC and linearcomponents. Similarly to the spectral analysis, signals with cepstralamplitudes below −40 dB were excluded. The cepstral first peakintensity value Cfp (τfp), the corresponding time-delay τfp and itsstandard deviation were determined by fitting the averaged cepstrumby a Weibull function. The integrated cepstrum IC:
IC =1Δτ
∫ C τð Þdτ ð5Þ
within the interval Δτ from 0.6 μs to 1.6 μs were calculated from theaveraged cepstra (Fig. 6).
Fig. 6. Cepstral parameters estimation (left). Cepstral parameter, τp
The proper selection of the evaluation regions, the measurements,and the analysis of the data was performed by a team of threeultrasounds experts (SL, NM, and KR).
2.8. Statistical analysis
Statistical analysis was performed using SAS 9.1 (SAS Institute,Cary, USA), STATISTICA 7.1 (StatSoft, Tulsa, USA) and The Unscram-bler 9.2 (CAMO AS, Oslo, Norway). Linear correlations betweenacoustic parameters and the IMF were computed as Pearson product–moment correlations. Multiple linear regression (MLR) was per-formed to model the IMF. Acoustic parameters were included into themodel when the required level of significance reached pb .05. Full-cross validation was applied, i.e. every sample was excluded once tobe predicted by the model based on the remaining samples.Correspondingly, model R2 and root-mean square error of prediction(RMSEP) are given. For classification purposes it was analyzed,whether the carcasses were correctly assigned to 3 classes (IMFchem)using the predicted fat content (IMFUS). The thresholds were chosenas follows: b1% IMF (LOW), between 1 and 2% IMF (MID) and N2% IMF(HIGH). All results were considered significant for pb .05.
3. Results
Prior to the statistical analysis, all measurements were checked fordata quality. Out of the 218 ultrasound data acquisitions (54×3 and28×2), 83 measurements (38%) had to be discarded. The reasons for
distribution within region of interest with weibull fit (right).

Table 3Acoustic spectral and cepstral parameters extracted from ultrasound radio-frequencydata.
Parameters Units Description
TOFBF μs Backfat compound time of flightBW mm Backfat compound thicknessSOSBF m/s Backfat compound speed of soundαmuscle dB/MHz/cm Muscle attenuation coefficientAIB dB Mean of apparent integrated backscatter amplitudeM dB MidBandfitm dB/MHz Backscatter power spectral slopeRFexcl % Percent of RF signals correspond to spectral intensity
below −40 dB excludedIC dB Integrated cepstrumCfp(τfp) dB Cepstrum first peak amplitudeτfp μs Cepstrum first peak amplitude position
Fig. 7. Distribution of the chemically determined intramuscular fat in porcinelongissimus muscle (n=62).
222 S. Lakshmanan et al. / Meat Science 90 (2012) 216–225
excluding data were: i) focus area and corresponding ROI at themuscle–rib interface (8%), ii) very weak scattering amplitudesresulting in an insufficient SNR (9%), iii) multiple reflections of thebackfat interfaces in the muscle ROI due to bad coupling (4%), iv) AIBestimationN−20 dB due to higher pressure given on skin surfaceduring measurement, v) bad coupling of the transducer (12%). For 20out of 82 carcasses all US readings had to be excluded (3 forcommercial crossbreds and 2 for Duroc). For the remaining carcasses,the estimated US parameters were averaged per carcass and used forfurther analysis.
The estimated parameters are summarized in Table 3. Thecorresponding descriptive statistics are shown in Table 4. The IMF ofthe loin samples under investigation ranged from 0.65 to 3.56% (1.53±0.69%) and is shown in more detail in Fig. 7.
3.1. Correlations between US parameters and IMF
The linear correlations between the US parameters and the IMF aregiven in Table 5. Moderate correlations of IMF with attenuation(αmuscle) and spectral amplitudes (AIB and M) were observed.Furthermore, slight positive relationships could be found betweenthe IMF content and TOFBF, IC and Cfp. Weak correlations wereobserved between the cepstral parameters and IMF.
3.2. Multivariate IMF prediction
Multiple linear regression analysis (MLR) was performed topredict the IMF using the ultrasound parameters. A highly significantmodel (R2=.76; RMSEP=0.34%) could be obtained by a combination
Table 4Mean values, standard deviation (STD), coefficient of variation (CV), minimum andmaximum of all evaluated carcass parameters.
n Mean±STD CV [%] Minimum Maximum
Intramuscular fat [%] 62 1.53±0.69 44.8 0.65 3.56Carcass weight [kg] 62 95.9±6.4 6.7 80.0 112.0Lean meat percentage [%] 62 54.3±3.6 6.6 47.7 61.0Muscle width [mm] 61 60.5±6.0 9.9 47.1 74.5Backfat width [mm] 61 18.9±3.8 20.2 11.8 26.4TOFBF [μs] 62 20.1±4.5 22.2 11.9 30.4αmuscle [dB MHz−1 cm−1] 62 0.77±0.15 19.3 0.54 1.17AIB [dB] 62 −34.1±4.6 13.5 −42.7 −22.3M [dB] 62 −34.0±4.4 13.0 −42.1 −22.8m [dB MHz−1] 62 4.07±1.17 28.77 1.25 6.33Excluded RF-signals [%] 62 24.5±14.6 59.6 1.4 61.1IC [dB] 62 2.01±0.10 5.02 1.78 2.23Cfp(τfp) [dB] 62 2.33±0.14 5.81 2.07 2.64τfp [μs] 62 1.02±0.01 1.33 0.99 1.05
of backfat compound time of flight TOFBF, muscle attenuation αmuscle
and spectral slope m (Eq. 6):
IMFUS = −2:416%+ 0:108 μs−1TOFBF� �
%
+ 4:755 dB−1MHz⋅ cmαmuscle
� �%− 0:457 mdB−1MHz
� �%
ð6Þ
Including other carcass characteristics (e.g. hot carcass weight orbackfat width) did not significantly improve the model. It should bementioned that, even if αmuscle was the most important variable, theremoval of just one of the 3 variables resulted in a tremendousincrease of the prediction error (to at least 0.52% IMF).
A comparison between IMFUS and IMFchem is shown in Fig. 8. For 59out of 62 analyzed carcasses the difference between the twoprediction methods was less than 0.67% IMF. Furthermore, abouthalf of the samples could be predicted with a root mean squaredprediction error of less than 0.2% IMF.
The results of the classification for meat quality important IMFgroups of b1% (LOW), 1 to 2% (MID) and N2% IMF (HIGH) and thecomparisonwith the IMFchem values is summarized in Table 6. Overall,about 73% of all samples were assigned to the correct IMF class.Furthermore, only 1 sample was falsely classified into the HIGH class.Using a single threshold (2% IMF), about 92% of all carcasses werecorrectly classified in LOW or HIGH IMF.
4. Discussion
The carcass traits are mainly in good agreement with earlierinvestigations of German pig populations (Mörlein et al., 2007). Theselection of carcasses based on LMP and carcass weight and theinclusion of Duroc and Duroc-crossbreds resulted in a high variabilityof IMF. Overall, the carcasses can be considered to represent themajority of commercially slaughtered pigs in Germany with a slightlyhigher proportion of carcasses with IMF values above 2%.
Table 5Linear correlation coefficient (r) of acoustic parameters with intramuscular fat inporcine longissimus muscle.
TOFBF .27⁎ RFexcl −.17SOSBF −.25 IC .26⁎
αmuscle .61⁎⁎ Cfp(τfp) .29⁎
AIB .56⁎⁎ τfp .10M .56⁎⁎ τfp (s.d.) −.21m .04
Significant correlations are marked with: ⁎pb .05; ⁎⁎pb .01.

- 1.0
- 0.8
- 0.6
- 0.4
- 0.2
0.0
0.2
0.4
0.6
0.8
1.0
0.0 0.5 1.0 1.5 2.0 2.5 3.0 3.5
IMF
chem
- IM
FU
S[%
]
IMF mean [%]
0.67 %1.96 S.d.
-0.66%- 1.96 S.d.
0.00 %
Fig. 8. Bland–Altman plot of chemical vs. ultrasound estimated intramuscular fatcontent (n=62).
223S. Lakshmanan et al. / Meat Science 90 (2012) 216–225
4.1. Correlations between US parameters and IMF
Increasing IMFwas related with increased attenuation in both beef(Smith, 1996) and porcinemuscle (Mörlein et al., 2005). Furthermore,earlier investigations performed on a subset (n=27) with a scanningacoustic microscope also revealed positive relationships (r=.66)between muscle attenuation of small excised samples and IMF of thecorresponding loin chop (Koch et al., 2011a). Few studies reportrelations between IMF and spectral or cepstral parameters. Mörleinet al. (2005) analyzed a wide range of parameters obtained by amedical ultrasound device. Backscatter parameters (AIB,M) increasedwith IMF (r=.2 to r=.3). This is confirmed by the present study(r=.56). While Mörlein et al. (2005) found no significant relation-ships between IMF and cepstral parameters, the present study reportscorrelations up to r=.29. Procedural differences (e.g. the usedfrequency or signal processing) may have affected the results.
The effect of IMF on backscatter parameters can be explained by itsdeposition inside the muscle perimysium. Muscular connective tissueis suggested to cause acoustic backscattering (Lizzi et al., 2003; Lizzi,Astor, Feleppa, Shao, & Kalisz, 1997). While the perimysium is knownto increase in thickness and mechanical strength with age, IMF isdeposited in the perimysium during fattening of the muscle. Thus,disorganization and breakdown of the honeycomb structure results ina decrease of the mechanical strength of the muscle (Nishimura et al.,1999; Wood et al., 2008). A reduction in mechanical strength due toincreased IMF (Nishimura et al., 1999; Wood et al., 2003) cantherefore be considered to affect the ultrasonic backscatter intensitydue to differences in size, structure and elastic properties, i.e. acousticimpedance of the connective tissue. Midband fit and apparentintegrated backscatter are associated with the size and the acousticimpedance of the scattering structures (Lizzi, Alam, Mikaelian, Leeand Feleppa, 2006; Lizzi et al., 1997).
The total backscattered signal from muscle can be considered assuperposition of frequency-dependent backscattering from muscle
Table 6Absolute and relative frequency of correct classification based on predicted intramus-cular fat content (IMFUS) compared to chemically determined fat (IMFchem) of porcinelongissimus muscle. The thresholds of 3 classes were as follows: b1% IMFchem (LOW), 1to 2% IMFchem (MID) and N2% IMFchem (HIGH); (n=62).
IMFchem LOW IMFchem MID IMFchem HIGH
IMFUS LOW 10 (50%) 2 (8%)IMFUS MID 10 (50%) 22 (88%) 4 (24%)IMFUS HIGH 1 (4%) 13 (76%)
Overall error rate: 27%.
fibers and reflections from the muscle bundle interfaces. Acousticimpedance values for fat, connective tissue and muscle fibersperpendicular to the beam axis are known to be 1.45, 1.80 and1.67 Mrayl, respectively (Lakshmanan, Koch, Wicke, Mörlein, & Raum,2010; Mamou, Oelze, O'Brien, & Zachary, 2006). IMF is depositedalmost exclusively in the connective tissue regions between adjacentmuscle bundles. Because connective tissue and muscle fibers havesimilar acoustic properties, the reflections from the muscle–connec-tive tissue interfaces are small. For low IMF values, the majority of thebackscattered signal arises from frequency-dependent muscle back-scattering (Roberjot, Laugier, & Berger, 1994). However, an increasingdeposition of fat in the muscle bundle interfaces results in anincreasing impedance mismatch at these interfaces and consequentlyto increasing (frequency-independent) reflection amplitudes andhigher transmission losses. This explains the inverse and directrelations of spectral slopem and attenuation αmuscle, respectively, withincreasing IMF. In accordancewith previous findings the correlation ofIMF with backfat thickness, estimated from the time of flight at thisinterface, could be used for the prediction model.
Dependent on the axial resolution and frequency of the usedultrasound system, structural properties, e.g. scatter size and scattererdistance, may be explained by cepstral parameters. Therefore, aneffect of the deposition of the IMF and the corresponding influence onstructure and size of the connective tissue may partially be reflectedby changes of the cepstral parameters. However, the spatial distanceof the perimysial tissue is mainly affected by the size of the primarymuscle bundles. With increasing bundle size, the distance betweenthe layers of perimysium increases. Therefore, cepstral parameters aresuggested to be mainly related to primary muscle bundle size and theeffect of the IMF deposition inside the connective tissue is rathersmall. This is supported by the correlations found in the present study.
Minor positive relationships with the IMF have been found forbackfat compound time of flight TOFBF. This is in accordance withearlier investigations stating slightly positive relationships betweenbackfat thickness and IMF (Koch et al., 2011b; Moody & Zobrisky,1966). TOFBF is mainly influenced by the overall backfat thickness butalso by the proportion of skin (Koch et al., 2011b).
4.2. IMF prediction
The linear correlations suggest the feasibility to predict the IMFcontent. Promising candidates were found among the spectralparameters. In the present investigation multiple linear regressionanalyses yielded an R2 of .76 and a RMSEP of 0.34% IMF. A previousapproach to predict porcine loin IMF with a large set of spectralparameters using partial least-squares regression (Mörlein et al.,2005) found comparable results (R2=.58; RMSEP=0.36%). Incontrast to spectral analysis, image analysis of in-vivo ultrasoundscans allowed the prediction of porcine loin IMF with R2 of .48;RMSEP: 0.71% (Maignel et al., 2010); and R2=.32; RMSEP: 1.02%(Newcom et al., 2002). B-mode image analyses of bovine longissimusmuscle scans resulted in R2 values comparable to those in the presentinvestigation (up to 0.75) (Brethour, 1994; Hassen et al., 2001).Higher R² in beef may be explained by the broader IMF range (from 1%to more than 11%) of bovine muscle (Hassen et al., 2001).
Compared to the previous study (Mörlein et al., 2005), the numberof acoustic parameters needed for IMF prediction could be reduced.This could be achieved by improved algorithms for ultrasound datapre-processing to correct for system specific and intermediate tissueeffects. Furthermore, the ability to correctly classify 73% of thecarcasses into 3 IMF groups (thresholds at 1 and 2%) proves thepractical use of ultrasound spectral analysis. The correct classificationof 92% of all carcasses into 2 classes is a further improvement onearlier investigations in which nearly 80% of the carcasses wereclassified into 2 IMF groups (threshold at 2% IMF) using discriminantanalysis (Mörlein et al., 2005).

224 S. Lakshmanan et al. / Meat Science 90 (2012) 216–225
4.3. IMF variation
Longitudinal and cross-sectional variations of IMF have been foundin porcine muscle (Heylen, 1999) possibly compromising predictionaccuracy. As for longitudinal variation, the IMF of adjacent loin chops2 ribs apart differed bymore than 1% IMF (Heylen, 1999). Variations ofmore than 1% IMF have also been found for adjacent beef longissimuschops with a distance of 1–2 cm (Blumer, Craig, Pierce, Smart, &Wise,1962).
Besides longitudinal variations, significant differences of morethan 0.7% IMF were found between 5 cross-sectional regions ofporcine loin chops with the highest IMF values for the ventral region(Heylen, 1999). In agreement, significant cross-sectional variation ofIMF was observed in beef longissimus chops (Covington, Tuma, Grant,& Dayton, 1970). As the chemical IMF determination is performed on ahomogenate of the complete chop it can be considered to beunaffected by cross-sectional inhomogeneity. Contrarily, the ROI forultrasound parameter estimation and subsequent IMF prediction isonly a small subsample of the chop. The ROI size was 5.4 cm×1.5 cmwith a beam width of 1.2 mm (Table 1). This results in a musclevolume of about 0.98 cm3 covered by ultrasound. Furthermore, theultrasound parameter estimation of the present investigation used afixed region within the −6 dB range of the transducer. Therefore,measurements performed on carcasses with a small backfat layer anda low attenuation may result in a ROI positioning near to the muscle/rib boundary while increasing backfat layers with higher attenuationwould result in a shift of the focus position in the dorsal direction, i.e.closer to the backfat where the IMF is lower compared to the ventralregion (Heylen, 1999).
Therefore, the obtained RMSEP of 0.34% IMF can be considered tobe close to the possible optimum for predictions using such smallregions of interest.
4.4. Excluded measurements
Thirty-eight percent of all individual measurements were dis-carded for the reasons given above, e.g. insufficient coupling or weakscattering. Within the present study, ultrasound parameter estima-tions were performed off-line after careful inspection of the acquireddata. For future applications, immediate data analysis after signalacquisition is needed to detect erroneousmeasurements and allow forreplicate measurements if required. Several indicators for erroneousmeasurements were developed and applied, e.g. the number ofexcluded RF signals. Single gated RF signals close to the noise level(−40 dB) were excluded from further calculations. If the number ofexcluded gates exceeded 70% of all gates within the ROI, the entiremeasurement was discarded.
Several data sets had to be excluded due to misplacement of theROI, i.e. within the muscle–rib boundary. Thus, future adjustment ofthe acoustic lens or specific design of the transducer elements to shiftthe focus position to the center of themuscle and to increase the -6 dBrange are anticipated to improve the signal to noise ratio.
5. Conclusions and implications
In this study, a novelmethod for the non-destructive IMF estimationvia spectral analysis of backscattered acoustic signals obtained from pigcarcasses early post mortem has been described. A commercialultrasound-based grading device has been modified to focus thesound into the muscle region of interest. Several algorithms forultrasound data pre-processing have been developed and appliedprior to acoustic parameter estimation. Particularly, acoustic propertiesof backfat and muscle tissue were incorporated that were obtained in aprevious in-vitro investigation under laboratory conditions. Based onthese data, refraction, phase cancelation and attenuation correctionscould be implemented to minimize their impact on the derived
ultrasound amplitude parameters. Moreover, the analysis was concen-trated on acoustic parameters that i) have a causal link to variations ofthe intramuscular fat deposition, and ii) are not directly sensitive toabsolute amplitude variations of the backscattered signals. By multi-variate regression analysis it was demonstrated that the combination ofthe backfat reflection travel time and two frequency dependentparameters can be used for IMF estimation and carcass classification.
Compared to previous ultrasound based studies, no amplitudeparameters and fewer acoustic parameters were needed to predict theIMF of pork loin. Therefore, the IMF prediction can be considered to bemuch less dependent on transmission or reflection losses on thepropagation path from the transducer surface to the muscle region ofinterest.
Considering the known longitudinal and cross-sectional variationof loin IMF and the system specific limitation of the ROI due to thesignal to noise ratio, i.e. the size of the ROI used for ultrasound dataanalysis, the achieved prediction error seems reasonable. Furtherimprovements are anticipated by i) analyzing multiple measurementsat varying positions of the muscle, ii) adjustment of the acoustic lensto avoid ROI placement within the muscle/rib boundary, and iii)immediate data evaluation to detect erroneous measurements. Thus,quantitative ultrasound devices for on-line carcass and meat qualityevaluation are feasible. However, the analysis of additional carcasseswould be useful to validate these results.
Acknowledgments
This work was supported by the German Research Council (DFG;grants Mo 1746/1 and Ra 1380/3), PRO INNO (grant KF0380401LF6)and Carometec GmbH. N.M. receives a DFG stipend through theBerlin-Brandenburg School for Regenerative Therapies GSC 203. Theauthors thank U. Vehlow for the careful analysis of intramuscular fatcontent, and the staff of Tönnies (Weißenfels), FLI (Mariensee), andBrand (Lohne) for supporting the data acquisition at slaughter.
References
Abou El Karam, S., Buquet, B., Berge, P., & Culioli, J. (1997). Ultrasonic characterization ofbovine muscles. Proceedings of the 43rd ICoMST. 27 July to 1 August 1997. Auckland,New Zealand (pp. 310–311).
Banihashemi, B., Vlad, R., Debeljevic, B., Giles, A., Kolios, M. C., & Czarnota, G. J. (2008).Ultrasound imaging of apoptosis in tumor response: Novel preclinical monitoringof photodynamic therapy effects. Cancer Research, 68, 8590–8596.
Benedito, J., Carcel, J. A., Rossello, C., & Mulet, A. (2001). Composition assessment of rawmeat mixtures using ultrasonics. Meat Science, 57, 365–370.
Bigelow, T. A., & O'Brien, W. D. (2005). A model for estimating ultrasound attenuationalong the propagation path to the fetus from backscattered waveforms. Journal ofthe Acoustical Society of America, 118, 1210–1220.
Bigelow, T. A., Oelze, M. L., & O'Brien, W. D. (2005). Estimation of total attenuation andscatterer size from backscattered ultrasound waveforms. Journal of the AcousticalSociety of America, 117, 1431–1439.
Blanchard, P. J., Warkup, C. C., Ellis, M., Willis, M. B., & Avery, P. (1999). The influence ofthe proportin of Duroc genes on growth, carcass and pork eating qualitycharacteristics. Animal Science, 68, 495–501.
Blumer, T. N., Craig, H. B., Pierce, E. A., Smart, W. W. G., Jr., & Wise, M. B. (1962). Natureand variability of marbling deposits in longissimus dorsi muscle of beef carcasses.Journal of Animal Science, 21, 935–942.
Brand, S., Mörlein, D., & Rosner, F. (2002). Estimation of intramuscular fat content (IMF)in the muscle longissimus dorsi (LD) of pigs by analysis of RF echo signals obtainedfrom a clinical B-mode device. IEEE Ultrasonic Symposium, 8–11.
Brethour, J. R. (1994). Estimating marbling score in live cattle from ultrasound imagesusing pattern recognition and neural network procedures. Journal of Animal Science,72, 1425–1432.
Cantrell, J. H., Jr., Goans, R. E., & Roswell, R. L. (1978). Acoustic impedance variations atburn-nonburn interfaces in porcine skin. Journal of the Acoustical Society of America,64, 731–735.
Covington, R. C., Tuma, H. J., Grant, D. L., & Dayton, A. D. (1970). Various chemical andhistological characteristics of beef muscle as related to tenderness. Journal of AnimalScience, 30, 191–196.
Essen-Gustavsson, B., Karlsson, A., Lundström, K., & Enfält, A. C. (1994). Intramuscularfat and muscle fibre lipid contents in halothane-gene free pigs fed high or lowprotein diets and its relation to meat quality. Meat Science, 38, 269–277.
Fernandez, X., Monin, G., Talmant, A., Mourot, J., & Lebret, B. (1999). Influence ofintramuscular fat content on the quality of pig meat—2. Consumer acceptability ofM. longissimus lumborum. Meat Science, 53, 67–72.

225S. Lakshmanan et al. / Meat Science 90 (2012) 216–225
Gammel, P. M., Croissette, D. H. L., & Heyser, R. C. (1979). Temperature and frequencydependence of ultrasonic attenuation in selected tissues. Ultrasound in Medicine &Biology, 5, 269–277.
Gärtner, T. (2001). Ultraschallspektroskopie mit fokussierenden Systemen zur quantita-tiven Bestimmung von akustischen Parametern. Halle-Wittenberg: Martin-Luther-Universität. http://deposit.d-nb.de/cgi-bin/dokserv?idn=963210777&dok_var=d1&dok_ext=pdf&filename=963210777.pdf
Gelse, K., Olk, A., Eichhorn, S., Swoboda, B., Schoene, M., & Raum, K. (2010). Quantitativeultrasound biomicroscopy for the analysis of healthy and repair cartilage tissues.European Cells & Materials, 19, 58–71.
Hassen,A.,Wilson,D. E., Amin,V.R., Rouse,G.H.,&Hays, C. L. (2001). Predictingpercentageof intramuscular fat using two types of real-time ultrasound equipment. Journal ofAnimal Science, 79, 11–18.
Hassen, A., Wilson, D. E., & Rouse, G. H. (2003). Estimation of genetic parameters forultrasound-predicted percentage of intramuscular fat in Angus cattle using randomregression models. Journal of Animal Science, 81, 35–45.
Heylen, K. (1999). Variation von anatomisch-physiologischen Merkmalen sowieMerkmalen der Fleischqualität im M. longissimus thoracis et lumborum desSchweins unter besonderer Berücksichtigung des intramuskulären Fettgehaltes.http://sundoc.bibliothek.uni-halle.de/diss-online/99/99H327/index.htm
Jensen, J. A., & Svendsen, N. B. (1992). Calculation of Pressure Fields from ArbitrarilyShaped, Apodized, and Excited Ultrasound Transducers. IEEE Transactions onUltrasonics Ferroelectrics and Frequency Control, 39, 262–267.
Kipfmüller, H., Bodis, K., Peschke, W., & Eichinger, H. M. (2000). Qualität vonSchweinefleisch. Beeinflussung durch das intramuskuläre Fett. Ernährungsumschau,47, 416–422.
Koch, T., Brand, S., Sannachi, L., Raum, K., Wicke, M., & Mörlein, D. (2011a). Ultrasoundvelocity and attenuation of porcine soft tissues with respect to structure andcomposition: I. Muscle. Meat Science, 88, 51–58.
Koch, T., Brand, S., Sannachi, L., Raum, K., Wicke, M., & Mörlein, D. (2011b). Ultrasoundvelocity and attenuation of porcine soft tissues with respect to structure andcomposition: II. Skin and backfat. Meat Science, 88, 67–74.
Lakshmanan, S., Koch, T., Mörlein, D., Brand, S., & Raum, K. (2010). Intramuscular fatcontent estimation in the loin muscle pig carcasses by ultrasound spectralparameter analysis. IFMBE Proceedings, 25, 92–95.
Lakshmanan, S., Koch, T., Wicke, M., Mörlein, D., & Raum, K. (2010). Ultrasonicmicroelastic evaluation of porcine musculus longissimus by 100-MHz time-resolved scanning acoustic microscopy. Biomedical Engineering, 55(s1), 134–137.
LFGB (2005). Bestimmung des Gesamtfettgehaltes in Fleisch und Fleischerzeugnissen.Amtliche Sammlung von Untersuchungsverfahren nach § 64 LFGB: L 06.00 6.
Lizzi, F. L., Alam, S. K., Mikaelian, S., Lee, P., & Feleppa, E. J. (2006). On the statistics ofultrasonic spectral parameters. Ultrasound in Medicine & Biology, 32, 1671–1685.
Lizzi, F. L., Astor, M., Feleppa, E. J., Shao, M., & Kalisz, A. (1997). Statistical framework forultrasonic spectral parameter imaging. Ultrasound in Medicine & Biology, 23,1371–1382.
Lizzi, F. L., Astor, M., Liu, T., Deng, C., Coleman, D. J., & Silverman, R. H. (1997). Ultrasonicspectrum analysis for tissue assays and therapy evaluation. International Journal ofImaging Systems and Technology, 8, 3–10.
Lizzi, F. L., Feleppa, E. J., Alam, S. K., & Deng, C. X. (2003). Ultrasonic spectrum analysisfor tissue evaluation. Pattern Recognition Letters, 24, 637–658.
Madsen, E. L., Dong, F., Frank, G. R., Garra, B. S., Wear, K. A., Wilson, T., et al. (1999).Interlaboratory comparison of ultrasonic backscatter, attenuation, and speedmeasurements. Journal of Ultrasound in Medicine, 18, 615–631.
Maignel, L., Daigle, J. P., Gariépy, C., Wilson, D., & Sullivan, B. (2010). Prediction ofintramuscular fat in live pigs using ultrasound technology and potential use inselection. Proceedings of 9th World Congress on Genetics Applied to LivestockProduction, Leipzig, Germany (Nr.0668).
Mamou, J., Oelze,M. L., O'Brien,W. D., Jr., & Zachary, J. F. (2006). Perspective on biomedicalquantitative ultrasound imaging. IEEE Signal Processing Magazine, 112–116. http://www.brl.uiuc.edu/Publications/2006/Mamou-IEEESP-Mag-112-2006.pdf
Moody,W. G., & Zobrisky, S. E. (1966). Study of backfat layers of swine. Journal of AnimalScience, 25, 809–813.
Mörlein, D., Link, G., Werner, C., & Wicke, M. (2007). Suitability of three commerciallyproduced pig breeds in Germany for a meat quality programwith emphasis on driploss and eating quality. Meat Science, 77, 504–511.
Mörlein, D., Rosner, F., Brand, S., Jenderka, K. V., & Wicke, M. (2005). Non-destructiveestimation of the intramuscular fat content of the longissimus muscle of pigs bymeans of spectral analysis of ultrasound echo signals. Meat Science, 69, 187–199.
Newcom, D. W., Baas, T. J., & Lampe, J. F. (2002). Prediction of intramuscular fatpercentage in live swine using real-time ultrasound. Journal of Animal Science, 80,3046–3052.
Ninoles, L., Clemente, G., Ventanas, S., & Benedito, J. (2007). Quality assessment ofIberian pigs through backfat ultrasound characterization and fatty acid composi-tion. Meat Science, 76, 102–111.
Nishimura, T. (2010). The role of intramuscular tissue in meat texture. Animal ScienceJournal, 81, 21–27.
Nishimura, T., Hattori, A., & Takahashi, K. (1999). Structural changes in intramuscularconnective tissue during the fattening of Japanese black cattle: Effect of marblingon beef tenderization. Journal of Animal Science, 77, 93–104.
Oppenheim, A. V., & Schafer, R. W. (2004). From frequency to quefrency: A history ofthe cepstrum. IEEE Signal Processing Magazine, 21, 95–106.
Park, B., Whittaker, A. D., Miller, R. K., & Bray, D. E. (1994). Measuring intramsucular fatin beef with ultrasonic frequency analysis. Journal of Animal Science, 72, 117–125.
Park, B., Whittaker, A. D., Miller, R. K., & Hale, D. S. (1994). Predicting intramuscular fatin beef longissimus muscle from speed of sound. Journal of Animal Science, 72,109–116.
Purslow, P. P. (2005). Intramuscular connective tissue and its role in meat quality.MeatScience, 70, 435–447.
Raju, B. I., & Srinivasan, M. A. (2001). High-frequency ultrasonic attenuation andbackscatter coefficients of in vivo normal human dermis and subcutaneous fat.Ultrasound in Medicine & Biology, 27, 1543–1556.
Raum, K. (2008). Microelastic imaging of bone. IEEE Transactions on UltrasonicsFerroelectrics and Frequency Control, 55, 1417–1431.
Raum, K., Kempf, K., Hein, H. J., Schubert, J., & Maurer, P. (2007). Preservation ofmicroelastic properties of dentin and tooth enamel in vitro—A scanning acousticmicroscopy study. Dental Materials, 23, 1221–1228.
Raum, K., & O'Brien, W. D., Jr. (1997). Pulse-echo field distribution measurementstechnique for high-frequency ultrasound sources. IEEE Transactions on Ultrasonics,Ferroelectrics, and Frequency Control, 44, 810–815.
Raum, K., Reisshauer, J., & Brandt, J. (2004). Frequency and resolution dependence ofthe anisotropic impedance estimation in cortical bone using time-resolvedscanning acoustic microscopy. Journal of Biomedical Materials Research Part A,71A, 430–438.
Roberjot, V., Laugier, P., & Berger, G. (1994). Anisotropy in bovine skeletal muscle invitro: Frequency dependent attenuation and backscatter coefficient over a widerange of frequencies. Proceedings IEEE Ultrasonics Symposium, 1–4 Nov 1994, Cannes(France), 3. (pp. 1467–1470).
Scheipers, U., Ermert, H., Sommerfeld, H. J., Garcia-Schürmann, M., Senge, T., &Philippou, S. (2003). Ultrasonic multifeature tissue characterization for prostatadiagnostics. Ultrasound in Medicine & Biology, 29, 1137–1149.
Smith, N. B. (1996). Effect of myofibril length and tissue constituents on acousticpropagation properties of muscle. Ph.D. Thesis, University of Illinois.
Suzuki, K., Irie, M., Kadowaki, H., Shibata, T., Kumagai, M., & Nishida, A. (2005). Geneticparameter estimates of meat quality traits in Duroc pigs selected for average dailygain, longissimus muscle area, backfat thickness, and intramuscular fat content.Journal of Animal Science, 83, 2058–2065.
Ville, H., Rombouts, G., Van Hecke, P., Perremans, S., Maes, G., Spincemaille, G., et al.(1997). An evaluation of ultrasound and nuclear magnetic resonance spectroscopyto measure in vivo intramuscular fat content of longissimus muscle of pigs. Journalof Animal Science, 75, 2942–2949.
Whittaker, A. D., Park, B., Thane, B. R., Miller, R. K., & Savell, J. W. (1992). Principles ofultrasound and measurement of intramuscular fat. Journal of Animal Science, 70,942–952.
Wood, J. D., Enser, M., Fisher, A. V., Nute, G. R., Sheard, P. R., Richardson, R. I., et al.(2008). Fat deposition, fatty acid composition and meat quality: A review. MeatScience, 78, 343–358.
Wood, J. D., Richardson, R. I., Nute, G. R., Fisher, A. V., Campo, M. M., Kasapidou, E., et al.(2003). Effects of fatty acids on meat quality: A review. Meat Science, 66, 21–32.
Related Documents