PREDICTION OF OFF-TARGET DRUG EFFECTS THROUGH DATA FUSION EMMANUEL R. YERA, ANN E. CLEVES, and AJAY N. JAIN † Bioengineering and Therapeutic Sciences, University of California, San Francisco, San Francisco, CA 94143, USA † E-mail: [email protected] www.jainlab.org We present a probabilistic data fusion framework that combines multiple computational approaches for drawing relationships between drugs and targets. The approach has special relevance to identi- fying surprising unintended biological targets of drugs. Comparisons between molecules are made based on 2D topological structural considerations, based on 3D surface characteristics, and based on English descriptions of clinical effects. Similarity computations within each modality were trans- formed into probability scores. Given a new molecule along with a set of molecules sharing some biological effect, a single score based on comparison to the known set is produced, reflecting either 2D similarity, 3D similarity, clinical effects similarity or their combination. The methods were validated within a curated structural pharmacology database (SPDB) and further tested by blind application to data derived from the ChEMBL database. For prediction of off-target effects, 3D-similarity per- formed best as a single modality, but combining all methods produced performance gains. Striking examples of structurally surprising off-target predictions are presented. Keywords : Molecular similarity; Surflex-Sim; Patient Package Inserts; Off-Target Predictions. 1. Introduction In prior work, we introduced a methodological approach for data fusion which was used to predict the protein targets of small molecules based on molecular similarity. 1 Given a test molecule and a set of small molecules with a known shared biological effect, the method produces a score corresponding to the likelihood that the test molecule will share the same activity. We showed that for predicting primary targets (i.e. targets modulating intended therapeutic effects) the performance advantage of a 3D similarity method over a 2D method was relatively small, due to the dominating effects of human 2D bias in drug design (i.e. “me-too” drugs). 1,2 However, for predicting secondary targets (i.e. sources of side-effects) 3D similarity was much more effective than 2D topological comparisons. We also showed that clinical effects of drugs could be used as a surrogate for biochemical characterization, 1 making use of common side effects of muscarinic antagonism as markers for the biochemical protein- ligand effect. It was possible using 3D chemical similarity to achieve strong separation of likely muscarinic modulators from those with no evidence of such effects. In the current work, we expand the analysis to a much larger set of small molecule drugs, again making use of 2D and 3D chemical similarity computations. Additionally, computations involving structural similarity are augmented with clinical effects similarity, made possible by automating the extraction and weighting of relevant textual terms from drug package inserts. The top row of Figure 1 shows two highly similar first generation sulfonylureas, tolbutamide and tolazamide, each having highly similar pharmacological effects, 3 with their therapeutic benefits deriving from identical mechanisms. 4 Clinical effects similarity coincides here with

Welcome message from author
This document is posted to help you gain knowledge. Please leave a comment to let me know what you think about it! Share it to your friends and learn new things together.
Transcript
PREDICTION OF OFF-TARGET DRUG EFFECTSTHROUGH DATA FUSION
EMMANUEL R. YERA, ANN E. CLEVES, and AJAY N. JAIN†
Bioengineering and Therapeutic Sciences, University of California, San Francisco,San Francisco, CA 94143, USA
†E-mail: [email protected]
We present a probabilistic data fusion framework that combines multiple computational approachesfor drawing relationships between drugs and targets. The approach has special relevance to identi-fying surprising unintended biological targets of drugs. Comparisons between molecules are madebased on 2D topological structural considerations, based on 3D surface characteristics, and basedon English descriptions of clinical effects. Similarity computations within each modality were trans-formed into probability scores. Given a new molecule along with a set of molecules sharing somebiological effect, a single score based on comparison to the known set is produced, reflecting either 2Dsimilarity, 3D similarity, clinical effects similarity or their combination. The methods were validatedwithin a curated structural pharmacology database (SPDB) and further tested by blind applicationto data derived from the ChEMBL database. For prediction of off-target effects, 3D-similarity per-formed best as a single modality, but combining all methods produced performance gains. Strikingexamples of structurally surprising off-target predictions are presented.
Keywords: Molecular similarity; Surflex-Sim; Patient Package Inserts; Off-Target Predictions.
1. Introduction
In prior work, we introduced a methodological approach for data fusion which was used topredict the protein targets of small molecules based on molecular similarity.1 Given a testmolecule and a set of small molecules with a known shared biological effect, the methodproduces a score corresponding to the likelihood that the test molecule will share the sameactivity. We showed that for predicting primary targets (i.e. targets modulating intendedtherapeutic effects) the performance advantage of a 3D similarity method over a 2D methodwas relatively small, due to the dominating effects of human 2D bias in drug design (i.e.“me-too” drugs).1,2 However, for predicting secondary targets (i.e. sources of side-effects) 3Dsimilarity was much more effective than 2D topological comparisons. We also showed thatclinical effects of drugs could be used as a surrogate for biochemical characterization,1 makinguse of common side effects of muscarinic antagonism as markers for the biochemical protein-ligand effect. It was possible using 3D chemical similarity to achieve strong separation of likelymuscarinic modulators from those with no evidence of such effects.
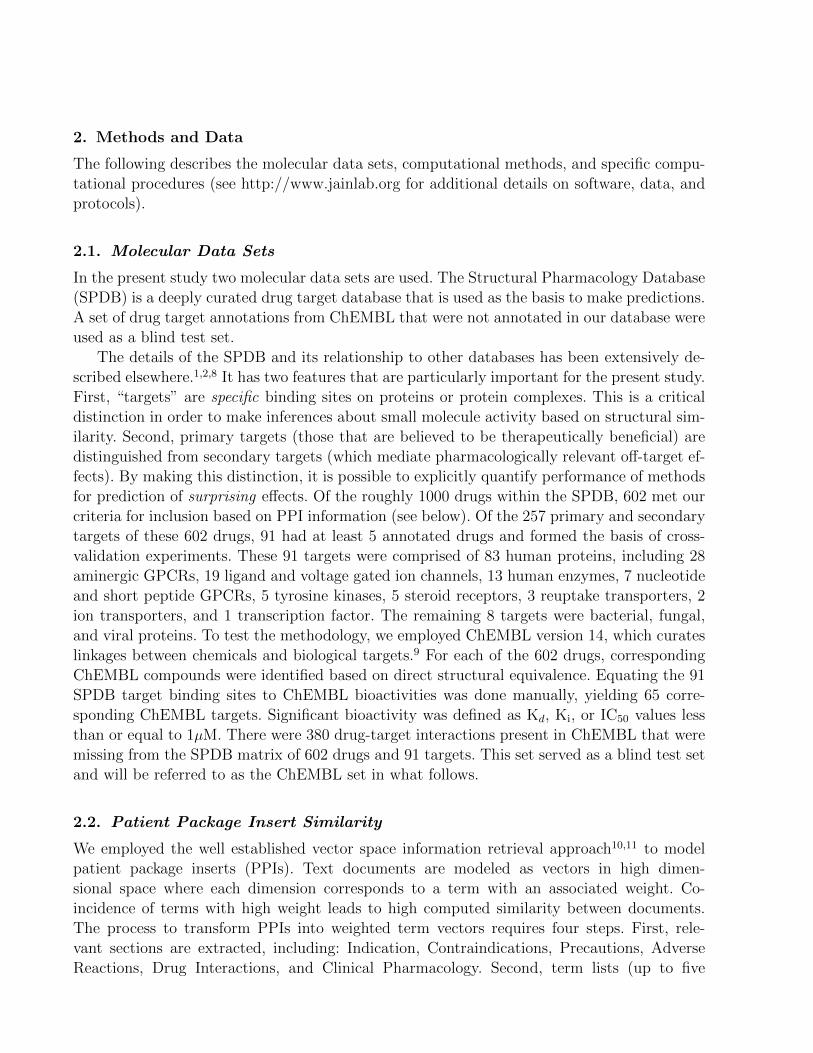
In the current work, we expand the analysis to a much larger set of small molecule drugs,again making use of 2D and 3D chemical similarity computations. Additionally, computationsinvolving structural similarity are augmented with clinical effects similarity, made possible byautomating the extraction and weighting of relevant textual terms from drug package inserts.The top row of Figure 1 shows two highly similar first generation sulfonylureas, tolbutamideand tolazamide, each having highly similar pharmacological effects,3 with their therapeuticbenefits deriving from identical mechanisms.4 Clinical effects similarity coincides here with
Figure 1. Relationship between molecular similarity methods, the proteins they modulate, and clinical effects in common. The top row shows two antidiabetics, tolbutamide (first in class) and tolazamide (follow on) which are very structurally similar, interact with similar proteins, and have similar clinical effects. The bottom row shows two anti-epileptic drugs, carbamazepine and levetiracetam, that have different primary targets but similar clinical effects and 3D molecular similarity. Surflex-Sim's 3D overlay is shown at the bottom where carbamazepine is colored by green carbons and levetiracetam is in atom color. Green sticks correspond to regions of significanthydrophobic similarity and blue/red sticks correspond to regions of significant polar similarity.
Yera/Cleves/Jain: Ligand Structure/Function 20
Tolbutamide Tolazamide
Levetiracetam
NH2
NO
O
Carbamazepine
NH2
N
O
NH
NH
NOO
OS
NH
NH
O
O
OS
Intended Target: Kir6.2 Other Target: PPARγ-RXR
Intended Target: Kir6.2 Other Target: PPARγ-RXR
Intended Target: Nav1.1 Off-Target: Nav1.5
Intended Target: Synaptic Vesicle Glycoprotein 2A
Clinical Terms in Common: diabetes mellitus, blood glucose, and hypoglycemia
Similarity: High 2D and High 3D
Clinical Terms in Common: grand mal and status epilepticus
Similarity: Low 2D but High 3D
Therapeutic Indication: Antidiabetic
Therapeutic Indication: Anticonvulsant
Fig. 1. Relationship between small molecules based on molecular similarity, protein target modulation, andclinical effects. The optimal 3D superimposition (bottom) indicates high similarity, despite little topologicalcommonality (green sticks correspond to regions of significant surface shape similarity and blue/red stickscorrespond to regions of significant polar similarity).
high structural 2D and 3D similarity. Next, consider the two structurally dissimilar anticon-vulsants on the bottom of Figure 1, carbamazepine and levetiracetam. Carbamazepine wasone of the first anticonvulsants (approved in 1968), and its therapeutic benefit is attributed tostabilizing the inactivated state of voltage-gated sodium channels (Nav1.1).5 Levetiracetam isa newer anticonvulsant, believed to act through interaction with synaptic vesicle glycoprotein2A (SV2A).6 As expected, the two package inserts have clinical effect terms in common dueto shared indications. Given the high 3D structural similarity, our expectation is that thesedrugs do in fact share some molecular targets, as will be discussed later.
The present study establishes a computational method to draw relationships between drugsbased on the clinical effects present in Patient Package Inserts (PPI), whose utility for pre-dicting drug target interactions has been shown previously.7 The present study makes threeprimary contributions. First, we introduce a method to extract and weight medically relevantterms from English clinical effects information. Second, we show that drug similarity com-puted from package inserts is directly correlated with drug similarity computed by molecularstructure comparison. Third, we established that the combination of 2D, 3D, and PPI simi-larity yielded better off-target predictive performance over any single similarity computation.Recovery of roughly 40–50% of off-target annotations was possible with false positive rates ofabout 1–3%. The approach is generalizable to other computational modalities (e.g. docking ofligands to protein structures), and it is our hope that broad application of the methods willaid in identifying unexpected interactions between drugs and biological targets.
2. Methods and Data
The following describes the molecular data sets, computational methods, and specific compu-tational procedures (see http://www.jainlab.org for additional details on software, data, andprotocols).
2.1. Molecular Data Sets
In the present study two molecular data sets are used. The Structural Pharmacology Database(SPDB) is a deeply curated drug target database that is used as the basis to make predictions.A set of drug target annotations from ChEMBL that were not annotated in our database wereused as a blind test set.
The details of the SPDB and its relationship to other databases has been extensively de-scribed elsewhere.1,2,8 It has two features that are particularly important for the present study.First, “targets” are specific binding sites on proteins or protein complexes. This is a criticaldistinction in order to make inferences about small molecule activity based on structural sim-ilarity. Second, primary targets (those that are believed to be therapeutically beneficial) aredistinguished from secondary targets (which mediate pharmacologically relevant off-target ef-fects). By making this distinction, it is possible to explicitly quantify performance of methodsfor prediction of surprising effects. Of the roughly 1000 drugs within the SPDB, 602 met ourcriteria for inclusion based on PPI information (see below). Of the 257 primary and secondarytargets of these 602 drugs, 91 had at least 5 annotated drugs and formed the basis of cross-validation experiments. These 91 targets were comprised of 83 human proteins, including 28aminergic GPCRs, 19 ligand and voltage gated ion channels, 13 human enzymes, 7 nucleotideand short peptide GPCRs, 5 tyrosine kinases, 5 steroid receptors, 3 reuptake transporters, 2ion transporters, and 1 transcription factor. The remaining 8 targets were bacterial, fungal,and viral proteins. To test the methodology, we employed ChEMBL version 14, which curateslinkages between chemicals and biological targets.9 For each of the 602 drugs, correspondingChEMBL compounds were identified based on direct structural equivalence. Equating the 91SPDB target binding sites to ChEMBL bioactivities was done manually, yielding 65 corre-sponding ChEMBL targets. Significant bioactivity was defined as Kd, Ki, or IC50 values lessthan or equal to 1µM. There were 380 drug-target interactions present in ChEMBL that weremissing from the SPDB matrix of 602 drugs and 91 targets. This set served as a blind test setand will be referred to as the ChEMBL set in what follows.
2.2. Patient Package Insert Similarity
We employed the well established vector space information retrieval approach10,11 to modelpatient package inserts (PPIs). Text documents are modeled as vectors in high dimen-sional space where each dimension corresponds to a term with an associated weight. Co-incidence of terms with high weight leads to high computed similarity between documents.The process to transform PPIs into weighted term vectors requires four steps. First, rele-vant sections are extracted, including: Indication, Contraindications, Precautions, AdverseReactions, Drug Interactions, and Clinical Pharmacology. Second, term lists (up to five

words each) are generated, with punctuation and short words like prepositions and ar-ticles removed. Third, to eliminate artifactual terms and enhance relevance, terms areidentified that are part of two controlled vocabularies: Medical Subject Headings (MeSH,http://www.ncbi.nlm.nih.gov/mesh) and the low-level Medical Dictionary for RegulatoryActivities (MedDRA, http://www.meddra.org). Last, term weights are assigned based oninformation richness (e.g. “generalized seizures” > “seizures”). Word frequencies from theGoogle Web 1T 5-gram Corpus (http://www.ldc.upenn.edu/Catalog/index.jsp, catalog num-ber LDC2006T13) were used to compute term weights, with rare terms producing higherscores than common ones. For example, “seizures” produced a log odds weighting of 4.74, butthe more specific term “generalized seizures” yielded 6.89. The final output for each drug is avector composed of 6,591 term weights (the weight of the term if present and zero otherwise).From the PPI for carbamazepine, the Indication Section includes: “patients with the followingseizure types: partial seizures with complex symptomatology (psychomotor, temporal lobe).”The unfiltered bigrams include both sensible ones such as “partial seizures” and useless onessuch as “patients with” with the filtering process eliminating the latter. For carbamazepine,the two most heavily weighted terms were “failure liver” (8.83) and “syncope and collapse”(8.62). The term “partial seizures” scored 6.37, with many related terms (e.g. “grand mal”)scoring similarly.
PPISimilarity(A,B) =
∑ni=1Ai ∗Bi√∑n
i=1A2i ∗
√∑ni=1B
2i
(1)
Comparison of a pair of drug PPI vectors is quantified using the cosine similarity metric(Eq. 1). The metric has a range of 0–1, but its units are both arbitrary and counterintuitive.To employ such values in our data fusion framework, the raw similarity scores were normalizedto p-values by generating a distribution of PPI similarity scores for unrelated molecule pairs.The unrelated pairs were identified based on having low 2D and low 3D similarity, quantifiedas described below with pairwise p-value comparisons ≥ 0.5 (we have previously shown thatstructurally unrelated drug pairs very infrequently share targets1). So, given a PPI similarityscore S between a drug pair, the p-value is simply the proportion of occurrences of S orgreater in the background set. For example, the raw PPI similarity between carbamazepineand levetiracetam was 0.286 (see Figure 1), and this corresponded to a p-value of 0.044. Themost heavily weighted terms in the comparison included the following: pancytopenia (6.6),cytochrome p450 (6.6), grand mal (6.5), antiepileptic drugs (6.5), and partial seizures (6.4).
2.3. Target Prediction using Patient Package Insert Similarity
We have previously reported a framework for data fusion which allows for the integrationof similarity scores into a single value.1 Briefly, given a molecule A and a set a moleculeswith a shared biological effect, Bn, the similarity between molecule A and each molecule Bi
is computed. The similarity scores are normalized to p-values as detailed above by assessingscore magnitude against score from a random background set. The multinomial distributionis then used to compute the likelihood, M , of observing the set of p-values and of the converseprobabilities, M∗. The log-odds score L is then computed by taking the log of the ratio of M
and M∗ and inverting the sign. A detailed discussion of the computation and corresponding 2Dand 3D similarity example can be found in the original publication.1 An attractive feature ofour methodology is that it is able to integrate the results of different similarity computationsinto a single value. For example, the log-odds calculation for tolazamide interacting withPPARγ-RXR yields single-modality values of 11.35 for PPI, 7.57 for 3D, and 5.49 for 2D.Combining the similarity methods gives a stronger prediction compared to using any singlemethod alone with 3D+2D+PPI log-odds = 23.43.
2.4. Similarity and p-value Computation with Surflex-Sim
The Surflex-Sim 3D molecular similarity method and its use for virtual screening and off-targetprediction has been extensively described in multiple publications.2,8,12,13 Briefly, given twomolecules in specific poses, a value from 0 to 1 is computed that reflects the degree to whichtheir molecular surfaces are congruent with respect to both shape and polarity. The functionis based on the differences in distances from observer points surrounding the molecules tothe closest points on their surfaces, including both the closest hydrophobic surface points andthe closest polar surface points. So, two molecules that may have very different underlyingchemical scaffolds may exhibit nearly identical surfaces to the observer points. These pointsare analogous to a protein binding pocket, which also “observes” ligands from the outside.Additional details regarding the theory and underlying algorithmic details can be found in thepreviously published work. In order to produce a log-odds value for a molecule against a listof molecules with a shared annotation, 3D similarity values must be computed against eachannotated molecule, and these values must then be transformed into probabilities. Given theparticulars of the conformational sampling density, 3D similarity optimization thoroughness,and empirical conversion of raw scores to p-values, the overall process required many hoursfor each comparison of one molecule to a typical set of annotated molecules.
In the current work, two improvements were made to support large-scale application of themethods. First, a new mode of pose optimization was developed in which diverse conforma-tions of molecules are pre-generated prior to molecular comparison. Using this new mode, theoptimal pose for one molecule onto a specific pose of another can be done quickly enough toprocess roughly 2 million drug-like molecules per day on a single computing core (comparedwith roughly 10,000 previously). Second, rather than using explicit computation of 1000 back-ground similarity values for each molecule (as previously), we made use of the observationthat these distributions were essentially always normally distributed. Given a molecule pair,only the particular mean and standard deviation for each need be estimated in order to de-rive a p-value rather than making use of the full empirical computation. Estimation of thedistributional parameters was accomplished using simple linear regression models that madeuse of “molecular imprints” for each molecule.8 A molecular imprint is a vector of similarityvalues for a particular molecule against a fixed basis set of molecules (one pose each). Suchvectors have precedent in predicting many molecular properties,14,15 and the conformationalpre-search procedure was augmented to produce standard molecular imprints. So, given twopre-searched molecules, their mutual maximal 3D similarity can be rapidly calculated, andthe p-value conversion is immediately derived from the estimated distributional parameters

for each molecule. Taken together, the two improvements allow for typical 3D log-odds com-putations to be made in a few minutes for a given molecule against a target characterized bytwenty known ligands. To test the accuracy of the faster method, we recomputed the p-valuesand log-odds values from our previous work. An all-by-all similarity of the 358 drugs fromthe original study yielded a Pearson’s correlation of 0.947 and Kendall’s tau of 0.814, bothhighly statistically significant. The full log-odds computation of 358 drugs against 44 targetsyielded a Pearson’s correlation of 0.955 and Kendall’s Tau of 0.761 (again highly statisticallysignificant).
For 2D molecular similarity computations, which make purely topological comparisonsbetween molecules, we employed the previously described GSIM-2D method.1,2 This methodis sufficiently efficient that empirical conversion of raw scores into p-values is possible, aswe have previously described.1 For this method to yield high similarity, two molecules mustbe roughly the same size and contain similar subgraph compositions, especially for thosesubgraphs rooted at heteroatoms.
3. Results and Discussion
3.1. Relationship between Structural Novelty and Clinical Effects
Previously, we quantified the effect of me-too drugs by showing that drug pairs with high2D and high 3D similarity had four times more likelihood of having identical primary andsecondary targets than drugs pairs where one was structurally novel.1 Here, this analysis hasbeen extended to clinical effects by making use of the lexical similarity of package inserts.Both to establish the relevance of the PPI similarity metric and to quantify the degree towhich structural novelty is related to changes in clinical effects, we computed the pairwise 2D,3D, and PPI similarity of all 602 drugs. The drug pairs were separated into four categoriesbased on chemical structural similarity: high 2D and 3D similarity, low 2D but high 3D, high2D but low 3D, and low 2D and 3D. High similarity included pairs with p-values ≤ 0.01 andlow similarity were those with p-values ≥ 0.5.
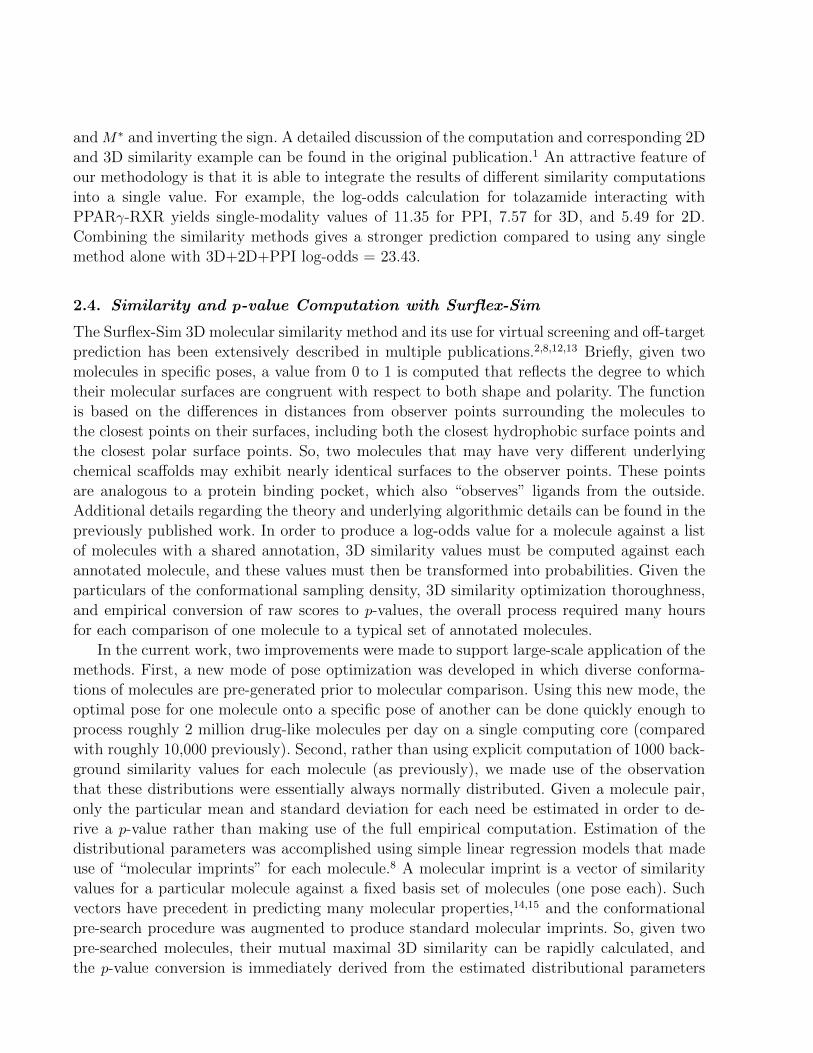
Figure 2A shows the histogram of the PPI p-value distributions for each of the four struc-tural categories. It is clear that the “me-too” drug distribution (red line, drug pairs with high2D and high 3D similarity) is different than the others. Toward the left side of the plot, whereclinical effects similarity was high (PPI p-values ≤ 0.05), a large fraction of the me-too drugpairs had highly similar clinical effects. Structurally novel drug pairs (high 3D but low 2Dsimilarity, green line) exhibited a significantly smaller fraction with highly concordant clin-ical effects but still showed some relationship between structural similarity and therapeuticprofile. The high 2D and low 3D pairs had little signal (blue), and only a very small portionof structurally dissimilar drug pairs (low 2D and low 3D, magenta) shared clinically similareffects. Clearly, drug pairs with very high structural similarity (both by 2D and 3D meth-ods) were much more likely to have closely shared clinical effects than molecule pairs of anyother category, even those sharing high 3D similarity but low 2D similarity. The converseobservations paralleled these observations. Figure 2B shows the corresponding histograms of3D and 2D p-value distributions where molecule pair segregation was made based on clinicaleffect similarity. The 2D and 3D similarity p-value distributions for drug pairs with high PPI
0 0.2 0.4 0.6 0.8 1
Figure 7. Quantifying the effect of me-too drugs based on PPI similarity. Panel A shows the PPI p-value distribution of drug pairs that were segregated based on 2D and 3D p-values into the four bins shown above (number of pairs per quadrant are shown in parentheses).Drug pairs with high 2D and high 3D have a higher likelihood of having significantphenotypic effects than molecules with low 2D but high 3D. Panel B shows the 3D p-values distribution of drug pairs that were segregated based on high and low PPI p-values. len(high_ppi): 3968len(low_ppi): 88539
Yera/Cleves/Jain: Ligand Structure/Function 26
Freq
uenc
y
PPI p-value 3D or 2D p-value
high 2D/high 3D (1065) 2D & 3D p-val ≤ 0.01
low 2D/high 3D (728) 2D p-val ≥ 0.50 & 3D p-val ≤ 0.01
high 2D/low 3D (428) 2D p-val ≤ 0.01 & 3D p-val ≥ 0.50
low 2D/low 3D (79654) 2D & 3D p-val ≥ 0.50
A B
0 0.2 0.4 0.6 0.8 1
2D high PPI 2D low PPI
3D high PPI 3D low PPI
Fig. 2. Relationship between structural similarity and clinical effects similarity.
similarity (red and green lines) showed stronger enrichment for low p-values associated withhigh 3D structural similarity. As expected, drug pairs that had low PPI similarity (blue andbrown lines) also had low 3D and 2D structural similarity.
3.2. Internal SPDB Validation: Off Target Effects
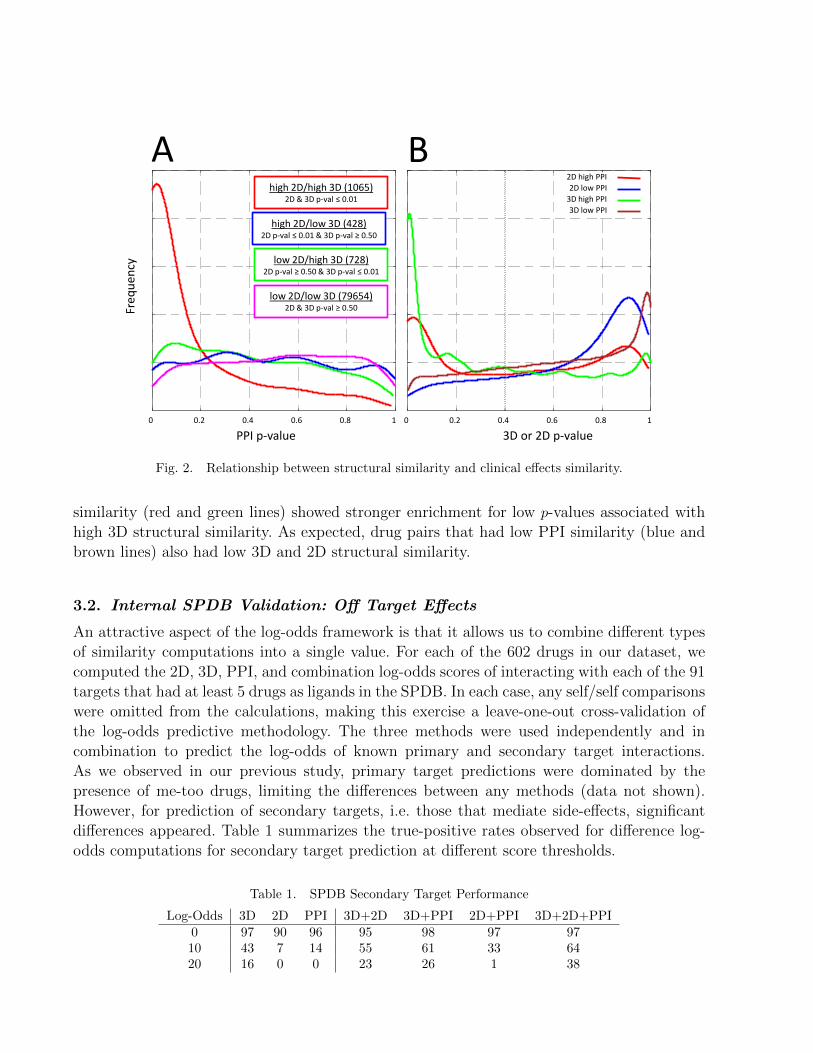
An attractive aspect of the log-odds framework is that it allows us to combine different typesof similarity computations into a single value. For each of the 602 drugs in our dataset, wecomputed the 2D, 3D, PPI, and combination log-odds scores of interacting with each of the 91targets that had at least 5 drugs as ligands in the SPDB. In each case, any self/self comparisonswere omitted from the calculations, making this exercise a leave-one-out cross-validation ofthe log-odds predictive methodology. The three methods were used independently and incombination to predict the log-odds of known primary and secondary target interactions.As we observed in our previous study, primary target predictions were dominated by thepresence of me-too drugs, limiting the differences between any methods (data not shown).However, for prediction of secondary targets, i.e. those that mediate side-effects, significantdifferences appeared. Table 1 summarizes the true-positive rates observed for difference log-odds computations for secondary target prediction at different score thresholds.
Table 1. SPDB Secondary Target Performance
Log-Odds 3D 2D PPI 3D+2D 3D+PPI 2D+PPI 3D+2D+PPI0 97 90 96 95 98 97 9710 43 7 14 55 61 33 6420 16 0 0 23 26 1 38

For all single methods and combinations of methods, the information present in the anno-tated drugs yielded positive information, evidenced by high true-positive rates at a log-oddsthreshold of 0. However, substantial differences among the methods appeared as higher log-odds thresholds were considered. At a threshold of 10, the 3D similarity approach showed amuch higher retrieval rate than either of the other two single-mode methods. All combinationsof methods showed synergy, with the most effective retrieval occurring with a combinationof all three similarity methods to produce a single log-odds score. Roughly 60% of the truesecondary target annotations could be recovered using the log-odds score from 3D+2D+PPIsimilarity computations. Note, however, that true positive rates without the context of falsepositive rates can be very misleading. The issue of estimating false positive rates is not straight-forward though. In our SPDB, a missing annotation between a drug and a target does notmean that the interaction does not occur. Authentic interactions within our 602 drug/91 targetset may have been published after our curation or have yet to be biochemically characterized.Nonetheless, we expect that the large majority of unannotated interactions, in fact, representtrue negative data. So, as a surrogate for a measurement of false positive rates for our sim-ilarity methods, we determined the number of drug/target predictions for interactions thatwere unannotated. At log-odds thresholds of 5, 10, and 20, predictions for non-existent SPDBannotations for both 3D similarity alone and 3D+2D+PPI were 3%, 1%, and 0.2%. These areupper limits of false positive predictions. As will be described below, the false positive ratewas actually lower since many of the new predictions were validated as true by incorporatingannotations from the ChEMBL database.
3.3. Prediction of New Drug-Target Pairs within ChEMBL
As discussed above, a missing annotation within the SPDB between a drug and a target doesnot necessarily mean that the interaction does not occur. For example, the drugs orphenadrineand mesoridazine showed high 3D log-odds against the muscarinic receptor but the interactionshad been unannotated in the SPDB. Careful inspection of the literature revealed that thedrugs were known to antagonize muscarinic receptors.1 Therefore, drug target annotationsthat are known but missing from our SPDB can serve as a blind set to test our methodology.To supplement annotations within the SPDB with a blind set for methodological testing,we searched ChEMBL and found 380 biochemically characterized drug/target interactionsnot present in the SPDB. We then investigated how well the methodology could identify thenew ChEMBL annotations based only upon information within in the SPDB as the basis tocompute the log-odds.
Table 2 shows the proportions correctly predicted at various log-odds using different meth-ods and combinations. In general, the trends observed for the SPDB leave-one-out experimentswere borne out. Among individual methods, 3D similarity strongly outperformed 2D- or PPI-
Table 2. ChEMBL Prediction Performance
Log-Odds 3D 2D PPI 3D+2D 3D+PPI 2D+PPI 3D+2D+PPI5 43 14 13 42 41 19 4110 16 3 3 20 18 8 2220 2 0 0 3 1 0 4

based similarity, with the latter two having similar performance. However, the combination ofthe three methods, overall, yielded better performance than 3D alone. At log-odds thresholdsof 10 and 20, using the full combination of methods, the percentage of recovered annotationswithin the SPDB test set was 22% and 4%, respectively. This compared with 16% and 2%using 3D similarity alone, and 3% and 0% using either 2D or PPI similarity alone. The enrich-ment ratios for the combination approach, using the upper-bound false positive rates discussedabove, corresponded to 22-fold and 40-fold, respectively, at log-odds thresholds of 10 and 20.
Figure 3 shows a typical example of a drug/target interaction not annotated in theSPDB where the combination similarity approach confidently identified a pharmacolog-ically relevant target. Sibutramine is an anorexic annotated in the SPDB as a ligandof the serotonin and norepinephrine reuptake transporters. However, it has been shownthat sibutramine also interacts with the dopamine reuptake transporter and that this in-teraction contributes to the therapeutic benefit (indicated in the Meridia package insert,http://www.rxabbott.com/pdf/meridia.pdf). Computing the similarity between sibutramineand 11 other dopamine reuptake transporter inhibitors (two are shown in Figure Figure 3),the log-odds were 2.3, 4.2, and 6.9 using 2D, 3D, and PPI, respectively. These predictionswere strengthened by combining all three methods, with corresponding log-odds of 9.4. Thepairwise PPI similarities between sibutramine and bupropion and nefazodone are highly signif-icant as are the individual 3D similarities. Clinical effects can be sufficient to infer off-targets,
nefazodone terms: 547
Sibutramine terms: 464
Primary: 5-HT & Norepinephrine reuptake transporters
Figure 15. ChEMBL Example: PPI alone can infer off-target effects and combining with 3D makes stronger inference.
Yera/Cleves/Jain: Ligand Structure/Function 36
2D Sim: 0.085 (p = 0.061)
bupropion terms: 413
3D Sim: 7.1 (p = 0.045)
Predicted Target 2D 3D PPI 3D+PPI 2D+3D+PPI
Dopamine reuptake transporter
2.3 4.2 6.9 9.2 9.4
term (212 in common) weight
tooth disorder 8.04
flu syndrome 7.41
abnormal dreams 7.20
emotional lability 6.95
hypomania 6.36
term (250 in common) weight
thinking abnormal 8.07
tooth disorder 8.04
abnormal dreams 7.20
emotional lability 6.95
suicidal ideation 6.23
PPI Sim: 0.420 (p = 0.001) 3D Sim: 7.6 (p = 0.028)
2D Sim: 0.032 (p = 0.506) PPI Sim: 0.432 (p = 0.001)
Cl
N
Cl
N
N
N
N
NO
O
Cl
HN
O
Fig. 3. ChEMBL example showing that combination similarity effectively predicts a drug target interactionnot covered within the SPDB. Shown are the 2D structures, 3D overlays, and common clinical terms betweensibutramine and two dopamine reuptake transporter inhibitors, bupropion and nefazodone.
Structural Novelty of ChEMBL and SPDB
Fluoxetine Prediction: M3 ligand Apomorphine Prediction: D3 ligandChEMBL
SPDB
quen
cy
M3 Log Odds
highest 2D similarity
N O
D3 Log Odds
highest 2D similarity
Freq 2D: 1.2
3D: 7.7PPI: 3.7
Methadone2D p‐val = 0.0413D p‐val = 0.0074
2D: ‐1.13D: 7.7PPI: 1.2
Ropinirole2D p‐val = 0.2103D p‐val = 0.00035
2D p‐val0 0.2 0.4 0.6 0.8 1
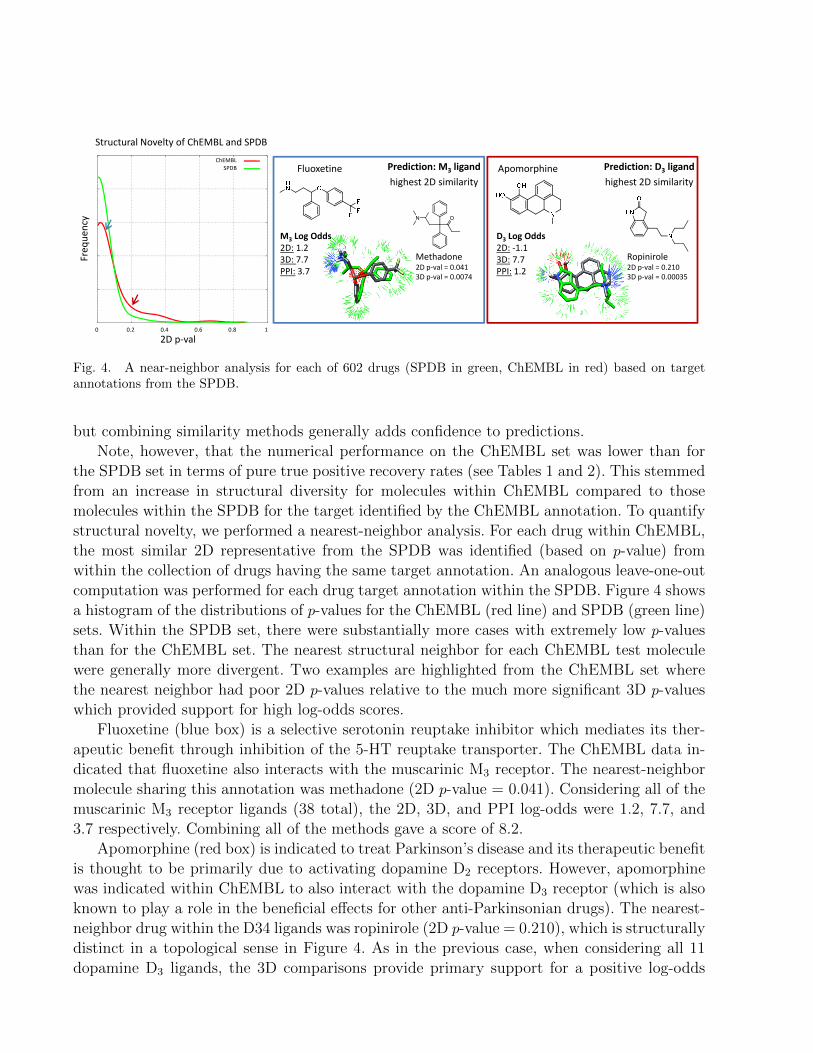
Fig. 4. A near-neighbor analysis for each of 602 drugs (SPDB in green, ChEMBL in red) based on targetannotations from the SPDB.
but combining similarity methods generally adds confidence to predictions.Note, however, that the numerical performance on the ChEMBL set was lower than for
the SPDB set in terms of pure true positive recovery rates (see Tables 1 and 2). This stemmedfrom an increase in structural diversity for molecules within ChEMBL compared to thosemolecules within the SPDB for the target identified by the ChEMBL annotation. To quantifystructural novelty, we performed a nearest-neighbor analysis. For each drug within ChEMBL,the most similar 2D representative from the SPDB was identified (based on p-value) fromwithin the collection of drugs having the same target annotation. An analogous leave-one-outcomputation was performed for each drug target annotation within the SPDB. Figure 4 showsa histogram of the distributions of p-values for the ChEMBL (red line) and SPDB (green line)sets. Within the SPDB set, there were substantially more cases with extremely low p-valuesthan for the ChEMBL set. The nearest structural neighbor for each ChEMBL test moleculewere generally more divergent. Two examples are highlighted from the ChEMBL set wherethe nearest neighbor had poor 2D p-values relative to the much more significant 3D p-valueswhich provided support for high log-odds scores.
Fluoxetine (blue box) is a selective serotonin reuptake inhibitor which mediates its ther-apeutic benefit through inhibition of the 5-HT reuptake transporter. The ChEMBL data in-dicated that fluoxetine also interacts with the muscarinic M3 receptor. The nearest-neighbormolecule sharing this annotation was methadone (2D p-value = 0.041). Considering all of themuscarinic M3 receptor ligands (38 total), the 2D, 3D, and PPI log-odds were 1.2, 7.7, and3.7 respectively. Combining all of the methods gave a score of 8.2.
Apomorphine (red box) is indicated to treat Parkinson’s disease and its therapeutic benefitis thought to be primarily due to activating dopamine D2 receptors. However, apomorphinewas indicated within ChEMBL to also interact with the dopamine D3 receptor (which is alsoknown to play a role in the beneficial effects for other anti-Parkinsonian drugs). The nearest-neighbor drug within the D34 ligands was ropinirole (2D p-value = 0.210), which is structurallydistinct in a topological sense in Figure 4. As in the previous case, when considering all 11dopamine D3 ligands, the 3D comparisons provide primary support for a positive log-odds

score. The 2D, 3D, and PPI log-odds were -1.1, 7.7, and 1.2 respectively. The combination ofall three comparison types yielded a score of 3.3. Here, the 3D molecular similarity informationwas the most reliable predictor.
4. Conclusion
In the present study, we report a means to combine chemical similarity between moleculeswith information derived from computing similarity based upon lexical analysis of patientpackage inserts (PPI). As expected based on our prior work, drugs that were highly struc-turally similar (both by 2D and 3D comparison) were much more likely to have significantoverlap of their clinical effects compared to drugs that were structurally different (low 2Dsimilarity but high 3D similarity). Our prior work illustrated a similar effect with respect tospecifically annotated molecular targets: me-too drugs tend to have nearly identical targetprofiles.1 The correlation between lexical and chemical similarity also served to validate thelexical comparison methodology.
We extended a probabilistic data fusion method to include observations from both molec-ular and clinical effects similarity and reported performance on predicting protein targets ofsmall molecules. This was done both by leave-one-out cross-validation on our internal databaseof drug-target interactions (the SPDB) as well as on a blind test on new interactions presentin ChEMBL. For off-target prediction within the SPDB, 3D similarity was the most effec-tive single information source. However, combining the methods predicted a larger proportionof secondary targets than any of the individual methods, while maintaining a similar nomi-nal false positive rate. On the test against previously unseen ChEMBL drug-target linkages,again 3D similarity was the single most effective predictor, but gains were derived from com-bining the different data sources. We note that the method supports the integration of anymethod that produces scores relating molecules to targets (e.g. docking), and that inclusionof additional information sources is likely to produce further benefits. It is also important tounderstand that this framework is similar in character to virtual screening methods, in thatwhile enrichment for compounds with the predicted effects occurs, the actual potencies of theeffects are not predicted. This point is discussed at length in a prior study.16
In contemplating the problem of off-target prediction for drugs, the problem of moleculardesign ancestry can confuse the issue of methodological validation. For example, ligands ofaminergic GPCRs offer troublesome test case, owing to the established promiscuity of suchdrugs among numerous targets.17 Returning to Figure 1 (bottom), we see the example of lev-etiracetam, an anticonvulsant believed to have a unique mechanism of action when comparedwith most existing anticonvulsants. The established CNS targets of the major classes of an-ticonvulsant drugs include the GABAA receptor (for barbiturates such as pentobarbital) andneuronal voltage-gated sodium channels (for drugs such as carbamazepine and phenytoin).These drugs have been recently shown to modulate voltage-gated potassium channels as partof their anti-epileptic effects.18–21 Levetiracetam, having a novel scaffold, has been proposedto work through an entirely new mechanism of action due to high binding affinity to thesynaptic vesicle protein SV2A (which is not a known therapeutic target of any drug).6,22,23
Our methods strongly predict that levetiracetam is a voltage-gated sodium channel modulator

with 3D log-odds alone of 14.5 (the combination log-odds was 21.4). Levetiracetam has beenshown to inhibit voltage-gated potassium currents,22 leading to the suggestion that this drug,like other anti-epileptics, acts at least in part through potassium channels. Considering thatmany antiepileptics modulate both sodium and potassium channels,23 our prediction supportsthe notion that levetiracetam shares a similar mechanism of action, perhaps in addition tothe interaction with SV2A.
Identification of off-target activities of drugs is a difficult problem, particularly in caseswhere the drug in question has a non-obvious structural relationship with the known ligandsof a given target. Our hope is that methods that make use of multiple information sourceswill help to identify clinically important and unexpected effects.
References
1. E. Yera, A. Cleves and A. Jain, Journal of Medicinal Chemistry 54, 6771 (2011).2. A. E. Cleves and A. N. Jain, Journal of Computer-Aided Molecular Design 22, 147 (2008).3. J. Wright and R. Willette, Journal of Medicinal Chemistry 5, 815 (1962).4. K. Nagashima, A. Takahashi, H. Ikeda, A. Hamasaki, N. Kuwamura, Y. Yamada and Y. Seino,
Diabetes Research and Clinical Practice 66, S75 (2004).5. D. S. Ragsdale and M. Avoli, Brain Research 26, p. 16 (1998).6. B. Lynch, N. Lambeng, K. Nocka, P. Kensel-Hammes, S. Bajjalieh, A. Matagne and B. Fuks,
PNAS 101, 9861 (2004).7. M. Campillos, M. Kuhn, A. Gavin, L. Jensen and P. Bork, Science 321, 263 (2008).8. A. E. Cleves and A. N. Jain, Journal of Medicinal Chemistry 49, 2921 (2006).9. A. Gaulton, L. Bellis, A. Bento, J. Chambers, M. Davies, A. Hersey, Y. Light, S. McGlinchey,
D. Michalovich and B. Al-Lazikani, Nucleic Acids Research 40, D1100 (2012).10. G. Salton and M. J. McGill, Introduction to Modern Information Retrieval (McGraw-Hill, Inc.,
New York, NY, USA, 1986).11. J. Han, M. Kamber and J. Pei, Data Mining: Concepts and Techniques, Second Edition (Morgan
Kaufmann Series in Data Management Systems), 2 edn. (Morgan Kaufmann, 2006).12. A. N. Jain, Journal of Computer-Aided Molecular Design 14, 199 (2000).13. A. N. Jain, Journal of Medicinal Chemistry 47, 947 (2004).14. A. Ghuloum, R. Carleton and A. Jain, Journal of Medicinal Chemistry 42, 1739 (1999).15. J. Mount, J. Ruppert, W. Welch and A. Jain, Journal of Medicinal Chemistry 42, 60 (1999).16. A. Jain and A. Cleves, J Comput Aided Mol Des 26, 57 (2012).17. M. J. Keiser, B. L. Roth, B. N. Armbruster, P. Ernsberger, J. J. Irwin and B. K. Shoichet,
Nature Biotechnology 25, 197 (2007).18. C. Zona, V. Tancredi, E. Palma, G. Pirrone and M. Avoli, Canadian Journal of Physiology and
Pharmacology 68, 545 (1990).19. F. Bloom, D. Kupfer and B. Bunney, Psychopharmacology: The Fourth Generation of Progress
(Raven Press, 1995).20. M. Nobile and P. Vercellino, British Journal of Pharmacology 120, 647 (1997).21. A. Ambrosio, P. Soares-da Silva, C. Carvalho and A. Carvalho, Neurochem. Res. 27, 121 (2002).22. M. Madeja, D. Georg Margineanu, A. Gorji, E. Siep, P. Boerrigter, H. Klitgaard and E. Speck-
mann, Neuropharmacology 45, 661 (2003).23. R. Surges, K. Volynski and M. Walker, Therapeutic Advances in Neurological Disorders 1, 13
(2008).
Related Documents