Prediction of Marshall test results for polypropylene modified dense bituminous mixtures using neural networks Serkan Tapkın a, * , Abdulkadir Çevik b , Ün Us ßar a a Anadolu University, Civil Engineering Department, Eskis ßehir 26555, Turkey b University of Gaziantep, Civil Engineering Department, Gaziantep 27310, Turkey article info Keywords: Neural networks Polypropylene Stability Flow Marshall Quotient Parametric study abstract This study presents an application of neural networks (NN) for the prediction of Marshall test results for polypropylene (PP) modified asphalt mixtures. PP fibers are used to modify the bituminous binder in order to improve the physical and mechanical properties of the resulting asphaltic mixture. Marshall sta- bility and flow tests were carried out on specimens fabricated with different type of PP fibers and also waste PP at optimum bitumen content. It has been shown that the addition of polypropylene fibers results in the improved Marshall stabilities and Marshall Quotient values, which is a kind of pseudo stiff- ness. The proposed NN model uses the physical properties of standard Marshall specimens such as PP type, PP percentage, bitumen percentage, specimen height, unit weight, voids in mineral aggregate, voids filled with asphalt and air voids in order to predict the Marshall stability, flow and Marshall Quotient val- ues obtained at the end of mechanical tests. The explicit formulation of stability, flow and Marshall Quo- tient based on the proposed NN model is also obtained and presented for further use by researchers. Moreover parametric analyses have been carried out. The results of parametric analyses were used to evaluate mechanical properties of the Marshall specimens in a quite well manner. Ó 2009 Elsevier Ltd. All rights reserved. 1. Introduction Types of bituminous mixtures are many and varied. They range from simple surface treatments to more expensive hot bituminous mixtures using high quality aggregates. For better type of pave- ments, dense bituminous concrete is generally produced where carefully proportioned amounts of fines, sand and coarse aggregate are heated and mixed with hot asphalt cement and then carried to the site, placed in the prepared roadbed while still hot (must be at least 125 °C) and rolled to guarantee a dense and relatively perma- nent bituminous concrete. Asphalt concrete was originally developed in the USA to meet the need for stiff and strong pavements to carry the heavy loads and high tire pressures of aircrafts. In the UK asphalt concrete is used for airfields and is often termed as Marshall asphalt. Asphalt concrete derives its strength and stability primarily through aggre- gate interlock and to a lesser extent through the sand/filler/bitu- men mortar. The composition of asphalt concrete is determined by the USA Asphalt Institute Marshall mix design procedure (The Asphalt Institute, 1988). The concepts of the Marshall method of designing paving mixtures were formulated by Bruce Marshall, for- merly bituminous engineer with the Mississippi State Highway Department. The US Corps of Engineers, through extensive re- search and correlation studies, improved and added certain fea- tures to Marshall’s test procedure, and ultimately developed mix design criteria (The Asphalt Institute, 1988). Since 1948, the test has been adopted by organizations and government departments in many countries, sometimes with modifications either to the pro- cedure or to the interpretations of the results. The Marshall test consists of the manufacture of cylindrical specimens 102 mm in diameter and 64 mm high by the use of a standard compaction hammer and a cylindrical mould. The speci- mens are compacted using the compactive effort applicable to the loading conditions. For roads and streets with low tire pres- sures, the materials are compacted on two faces, utilizing fifty blows of a 4.53 kg hammer dropped from a 45.72 cm height. For a 200 psi tire pressure, 75 blows of the hammer on each face is used. The specimens are tested for their resistance to deformation at 60 °C at a constant rate of 50.8 mm/min in a test rig. The jaws of the loading rig confine the majority but not the entire circumfer- ence of the specimen. The top and the bottom of the cylinder is unconfined. Because of this fact, the stress distribution in the spec- imen during testing is extremely complex (Tapkın, 1998). Two properties are determined from the Marshall test. These are: 0957-4174/$ - see front matter Ó 2009 Elsevier Ltd. All rights reserved. doi:10.1016/j.eswa.2009.12.042 * Corresponding author. Tel.: +90 222 3213550/6619; fax: +90 222 3239501. E-mail addresses: [email protected] (S. Tapkın), [email protected] (A. Çevik), [email protected] (Ü. Us ßar). Expert Systems with Applications 37 (2010) 4660–4670 Contents lists available at ScienceDirect Expert Systems with Applications journal homepage: www.elsevier.com/locate/eswa

Welcome message from author
This document is posted to help you gain knowledge. Please leave a comment to let me know what you think about it! Share it to your friends and learn new things together.
Transcript
Expert Systems with Applications 37 (2010) 4660–4670
Contents lists available at ScienceDirect
Expert Systems with Applications
journal homepage: www.elsevier .com/locate /eswa
Prediction of Marshall test results for polypropylene modified densebituminous mixtures using neural networks
Serkan Tapkın a,*, Abdulkadir Çevik b, Ün Us�ar a
a Anadolu University, Civil Engineering Department, Eskis�ehir 26555, Turkeyb University of Gaziantep, Civil Engineering Department, Gaziantep 27310, Turkey
a r t i c l e i n f o
Keywords:Neural networksPolypropyleneStabilityFlowMarshall QuotientParametric study
0957-4174/$ - see front matter � 2009 Elsevier Ltd. Adoi:10.1016/j.eswa.2009.12.042
* Corresponding author. Tel.: +90 222 3213550/661E-mail addresses: [email protected] (S. Ta
(A. Çevik), [email protected] (Ü. Us�ar).
a b s t r a c t
This study presents an application of neural networks (NN) for the prediction of Marshall test results forpolypropylene (PP) modified asphalt mixtures. PP fibers are used to modify the bituminous binder inorder to improve the physical and mechanical properties of the resulting asphaltic mixture. Marshall sta-bility and flow tests were carried out on specimens fabricated with different type of PP fibers and alsowaste PP at optimum bitumen content. It has been shown that the addition of polypropylene fibersresults in the improved Marshall stabilities and Marshall Quotient values, which is a kind of pseudo stiff-ness. The proposed NN model uses the physical properties of standard Marshall specimens such as PPtype, PP percentage, bitumen percentage, specimen height, unit weight, voids in mineral aggregate, voidsfilled with asphalt and air voids in order to predict the Marshall stability, flow and Marshall Quotient val-ues obtained at the end of mechanical tests. The explicit formulation of stability, flow and Marshall Quo-tient based on the proposed NN model is also obtained and presented for further use by researchers.Moreover parametric analyses have been carried out. The results of parametric analyses were used toevaluate mechanical properties of the Marshall specimens in a quite well manner.
� 2009 Elsevier Ltd. All rights reserved.
1. Introduction
Types of bituminous mixtures are many and varied. They rangefrom simple surface treatments to more expensive hot bituminousmixtures using high quality aggregates. For better type of pave-ments, dense bituminous concrete is generally produced wherecarefully proportioned amounts of fines, sand and coarse aggregateare heated and mixed with hot asphalt cement and then carried tothe site, placed in the prepared roadbed while still hot (must be atleast 125 �C) and rolled to guarantee a dense and relatively perma-nent bituminous concrete.
Asphalt concrete was originally developed in the USA to meetthe need for stiff and strong pavements to carry the heavy loadsand high tire pressures of aircrafts. In the UK asphalt concrete isused for airfields and is often termed as Marshall asphalt. Asphaltconcrete derives its strength and stability primarily through aggre-gate interlock and to a lesser extent through the sand/filler/bitu-men mortar. The composition of asphalt concrete is determinedby the USA Asphalt Institute Marshall mix design procedure (TheAsphalt Institute, 1988). The concepts of the Marshall method of
ll rights reserved.
9; fax: +90 222 3239501.pkın), [email protected]
designing paving mixtures were formulated by Bruce Marshall, for-merly bituminous engineer with the Mississippi State HighwayDepartment. The US Corps of Engineers, through extensive re-search and correlation studies, improved and added certain fea-tures to Marshall’s test procedure, and ultimately developed mixdesign criteria (The Asphalt Institute, 1988). Since 1948, the testhas been adopted by organizations and government departmentsin many countries, sometimes with modifications either to the pro-cedure or to the interpretations of the results.
The Marshall test consists of the manufacture of cylindricalspecimens 102 mm in diameter and 64 mm high by the use of astandard compaction hammer and a cylindrical mould. The speci-mens are compacted using the compactive effort applicable tothe loading conditions. For roads and streets with low tire pres-sures, the materials are compacted on two faces, utilizing fiftyblows of a 4.53 kg hammer dropped from a 45.72 cm height. Fora 200 psi tire pressure, 75 blows of the hammer on each face isused. The specimens are tested for their resistance to deformationat 60 �C at a constant rate of 50.8 mm/min in a test rig. The jaws ofthe loading rig confine the majority but not the entire circumfer-ence of the specimen. The top and the bottom of the cylinder isunconfined. Because of this fact, the stress distribution in the spec-imen during testing is extremely complex (Tapkın, 1998).
Two properties are determined from the Marshall test. Theseare:
S. Tapkın et al. / Expert Systems with Applications 37 (2010) 4660–4670 4661
(a) The maximum load the specimen will carry before failure,which is known as the Marshall stability.
(b) The amount of deformation of the specimen before failureoccurred, which is known as the Marshall flow.
The ratio of stability to flow is known as the Marshall Quotient.Marshall Quotient is a sort of pseudo stiffness which is a measureof the material’s resistance to permanent deformation (Tapkın,1998).
From the Marshall design procedure, the aim is to obtain theoptimum bitumen content. In order to find the optimum bitumencontent, the designer has to find the below mentioned values fromthe test property curves.
From these data curves, bitumen contents are determinedwhich yields the following:
(a) Maximum stability.(b) Maximum unit weight.(c) The median of limits for percent air voids.(d) The median of limits for voids filled with asphalt.
The testing procedure in order to determine the optimum bitu-men contents is very time consuming and needs skilled workman-ship. On the other hand, at the end of the Marshall test onlystability and flow values of the specimens can be obtained physi-cally. The specific gravity of mixture, theoretical specific gravity,voids in mineral aggregate (V.M.A.), voids filled with asphalt ðVf Þand air voids (Va) are obtained by carrying out extra calculations.Therefore if the researchers can obtain the stability and flow valuesof a standard mix by the help of another means, the rest of the cal-culations will just be mathematical manipulations. Neural net-works can be a suitable mean to obtain the stability and flowvalues obtained at the end of Marshall test procedure.
The first aim of this study was to review available literature onthe application of neural networks in pavement engineering re-searches. Second, the possibilities of improving the mechanicalproperties of asphalt mixtures by the utilization of polypropylenefibers were explored. Then a short background on neural networkswas stated out. Next, the main focus of this study, which is the pre-diction of stability, flow and Marshall quotient values of asphaltspecimens obtained from a series of Marshall test using neural net-works based on experimental results was given in the numericalapplication part. Finally, in order to obtain the main effect plot, awide range of parametric study has been performed by using thewell trained NN model.
2. Historical background of neural network applications inpavement engineering
Very detailed information about the applications of traffic engi-neering can be found in the relevant literature (Tapkın, 2004). Atthis point, it is important to state out, one by one, the relevantimportant neural network applications in the pavement engineer-ing area.
In a study by Ritchie, Kaseko, and Bavarian (1991), a systemthat integrates three artificial intelligence technologies: computerversion, neural networks and knowledge-based system in addi-tion to conventional algorithmic and modeling techniques werepresented. Kaseko and Ritchie (1993) used neural network mod-els in image processing and pavement crack detection. Gagarin,Flood, and Albrecht (1994) discuss the use of a radial-Gaussian-based neural network for determining truck attributes such asaxle loads, axle spacing and velocity from strain-response read-ings taken from the bridges over which the truck is traveling. El-din and Senouci (1995) describe the use of a BP algorithm for
condition rating of roadway pavements. They report very lowaverage error when compared with a human expert determina-tion. Cal (1995) uses the backpropagation algorithm for soil clas-sification based on three primary factors: plastic index, liquidlimit, water capacity, and clay content. Razaqpur, Abd El Halim,and Mohamed (1996) present a combined dynamic programmingand Hopfield neural network bridge-management model for effi-cient allocation of a limited budget to bridge projects over a gi-ven period of time. The time dimension is modeled by dynamicprogramming, and the bridge network is simulated by the neuralnetwork. Roberts and Attoh-Okine (1998) use a combination ofsupervised and self-organizing neural networks to predict theperformance of pavements as defined by the International Rough-ness Index. Tutumluer and Seyhan investigated neural networkmodeling of anisotropic aggregate behavior from repeated loadtriaxial tests (Tutumluer & Seyhan, 1998). The BP algorithm isused by Owusu-Ababia (1998) for predicting flexible pavementcracking and by Alsugair and Al-Qudrah (1998) to develop apavement-management decision support system for selecting anappropriate maintenance and repair action for a damaged pave-ment. Kim and Kim (1998) used artificial neural networks forprediction of layer module from falling weight deflectometer(FWD) and surface wave measurements. Shekharan (1998) stud-ied the effect of noisy data on pavement performance predictionby an artificial neural network with genetic algorithm. Attoh-Oki-ne (2001) uses the self-organizing map or competitive unsuper-vised learning model of Kohonen for grouping of pavementcondition variables (such as the thickness and age of pavement,average annual daily traffic, alligator cracking, wide cracking, pot-holing, and rut depth) to develop a model for evaluation of pave-ment conditions. Lee and Lee (2004) presents an integratedneural network-based crack imaging system to classify cracktypes of digital pavement images which includes three types ofneural networks: image-based neural network, histogram-basedneural network and proximity-based neural network. In an articleby Mei, Gunaratne, Lu, and Dietrich (2004), it is presented a com-puter-based methodology with which one can estimate the actualdepths of shallow, surface-initiated fatigue cracks in asphaltpavements based on rapid measurement of their surface charac-teristics. Ceylan, Guclu, Tutumluer, and Thompson (2005) hasinvestigated the use of artificial neural networks as pavementstructural analysis tools for the rapid and accurate prediction ofcritical responses and deflection profiles of full-depth flexiblepavements subjected to typical highway loadings. Bosurgi andTrifiro (2005) has described a procedure that has been definedto make use of the available economic resources in the bestway possible for resurfacing interventions on flexible pavementsby using artificial neural networks and genetic algorithms. Attoh-Okine (2005), in his paper, presents the application of functionalequations and networks to incremental roughness prediction offlexible pavement.
3. Use of polypropylene fibers in asphalt concrete mixtures
The main applications of polymer fiber reinforcement in themodern era have begun in early 1990s. Brown et al. have enrichedthe development of this kind or research (Brown, Rowlett, & Bou-cher, 1990). They have stated out the potential of some kind of fi-bers in improving the tensile and cohesive strength of asphalticconcrete on account of developing greater tensile strength whencompared to bitumen. Also some other researchers believe thatsome type of fibers create physical changes to modifiers whichhas a preferable effect on drain-down reduction than polymermodifiers do (Maurer & Malasheskie, 1989; Shao-Peng, 2006). Inanother study, fracture mechanics approach was utilized to assess
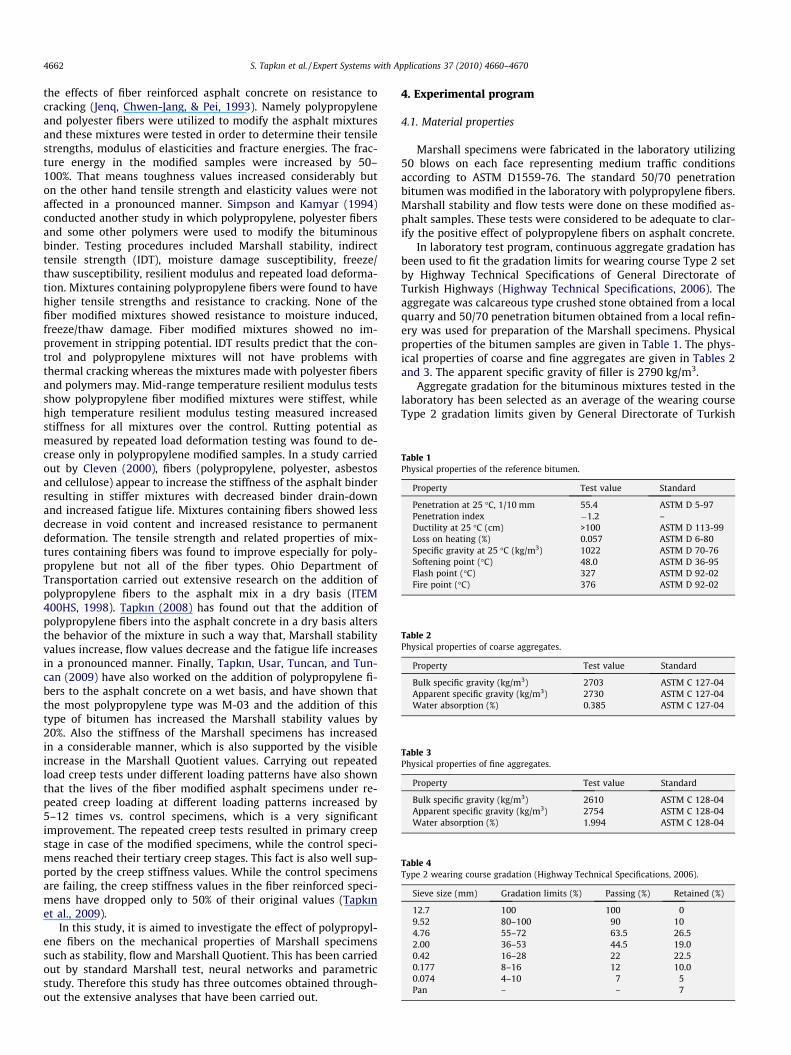
Table 1Physical properties of the reference bitumen.
Property Test value Standard
Penetration at 25 �C, 1/10 mm 55.4 ASTM D 5-97Penetration index �1.2 –Ductility at 25 �C (cm) >100 ASTM D 113-99Loss on heating (%) 0.057 ASTM D 6-80Specific gravity at 25 �C (kg/m3) 1022 ASTM D 70-76Softening point (�C) 48.0 ASTM D 36-95Flash point (�C) 327 ASTM D 92-02Fire point (�C) 376 ASTM D 92-02
Table 2Physical properties of coarse aggregates.
Property Test value Standard
Bulk specific gravity (kg/m3) 2703 ASTM C 127-04Apparent specific gravity (kg/m3) 2730 ASTM C 127-04Water absorption (%) 0.385 ASTM C 127-04
Table 3Physical properties of fine aggregates.
Property Test value Standard
Bulk specific gravity (kg/m3) 2610 ASTM C 128-04Apparent specific gravity (kg/m3) 2754 ASTM C 128-04Water absorption (%) 1.994 ASTM C 128-04
Table 4Type 2 wearing course gradation (Highway Technical Specifications, 2006).
Sieve size (mm) Gradation limits (%) Passing (%) Retained (%)
12.7 100 100 09.52 80–100 90 104.76 55–72 63.5 26.52.00 36–53 44.5 19.00.42 16–28 22 22.50.177 8–16 12 10.00.074 4–10 7 5Pan – – 7
4662 S. Tapkın et al. / Expert Systems with Applications 37 (2010) 4660–4670
the effects of fiber reinforced asphalt concrete on resistance tocracking (Jenq, Chwen-Jang, & Pei, 1993). Namely polypropyleneand polyester fibers were utilized to modify the asphalt mixturesand these mixtures were tested in order to determine their tensilestrengths, modulus of elasticities and fracture energies. The frac-ture energy in the modified samples were increased by 50–100%. That means toughness values increased considerably buton the other hand tensile strength and elasticity values were notaffected in a pronounced manner. Simpson and Kamyar (1994)conducted another study in which polypropylene, polyester fibersand some other polymers were used to modify the bituminousbinder. Testing procedures included Marshall stability, indirecttensile strength (IDT), moisture damage susceptibility, freeze/thaw susceptibility, resilient modulus and repeated load deforma-tion. Mixtures containing polypropylene fibers were found to havehigher tensile strengths and resistance to cracking. None of thefiber modified mixtures showed resistance to moisture induced,freeze/thaw damage. Fiber modified mixtures showed no im-provement in stripping potential. IDT results predict that the con-trol and polypropylene mixtures will not have problems withthermal cracking whereas the mixtures made with polyester fibersand polymers may. Mid-range temperature resilient modulus testsshow polypropylene fiber modified mixtures were stiffest, whilehigh temperature resilient modulus testing measured increasedstiffness for all mixtures over the control. Rutting potential asmeasured by repeated load deformation testing was found to de-crease only in polypropylene modified samples. In a study carriedout by Cleven (2000), fibers (polypropylene, polyester, asbestosand cellulose) appear to increase the stiffness of the asphalt binderresulting in stiffer mixtures with decreased binder drain-downand increased fatigue life. Mixtures containing fibers showed lessdecrease in void content and increased resistance to permanentdeformation. The tensile strength and related properties of mix-tures containing fibers was found to improve especially for poly-propylene but not all of the fiber types. Ohio Department ofTransportation carried out extensive research on the addition ofpolypropylene fibers to the asphalt mix in a dry basis (ITEM400HS, 1998). Tapkın (2008) has found out that the addition ofpolypropylene fibers into the asphalt concrete in a dry basis altersthe behavior of the mixture in such a way that, Marshall stabilityvalues increase, flow values decrease and the fatigue life increasesin a pronounced manner. Finally, Tapkın, Usar, Tuncan, and Tun-can (2009) have also worked on the addition of polypropylene fi-bers to the asphalt concrete on a wet basis, and have shown thatthe most polypropylene type was M-03 and the addition of thistype of bitumen has increased the Marshall stability values by20%. Also the stiffness of the Marshall specimens has increasedin a considerable manner, which is also supported by the visibleincrease in the Marshall Quotient values. Carrying out repeatedload creep tests under different loading patterns have also shownthat the lives of the fiber modified asphalt specimens under re-peated creep loading at different loading patterns increased by5–12 times vs. control specimens, which is a very significantimprovement. The repeated creep tests resulted in primary creepstage in case of the modified specimens, while the control speci-mens reached their tertiary creep stages. This fact is also well sup-ported by the creep stiffness values. While the control specimensare failing, the creep stiffness values in the fiber reinforced speci-mens have dropped only to 50% of their original values (Tapkınet al., 2009).
In this study, it is aimed to investigate the effect of polypropyl-ene fibers on the mechanical properties of Marshall specimenssuch as stability, flow and Marshall Quotient. This has been carriedout by standard Marshall test, neural networks and parametricstudy. Therefore this study has three outcomes obtained through-out the extensive analyses that have been carried out.
4. Experimental program
4.1. Material properties
Marshall specimens were fabricated in the laboratory utilizing50 blows on each face representing medium traffic conditionsaccording to ASTM D1559-76. The standard 50/70 penetrationbitumen was modified in the laboratory with polypropylene fibers.Marshall stability and flow tests were done on these modified as-phalt samples. These tests were considered to be adequate to clar-ify the positive effect of polypropylene fibers on asphalt concrete.
In laboratory test program, continuous aggregate gradation hasbeen used to fit the gradation limits for wearing course Type 2 setby Highway Technical Specifications of General Directorate ofTurkish Highways (Highway Technical Specifications, 2006). Theaggregate was calcareous type crushed stone obtained from a localquarry and 50/70 penetration bitumen obtained from a local refin-ery was used for preparation of the Marshall specimens. Physicalproperties of the bitumen samples are given in Table 1. The phys-ical properties of coarse and fine aggregates are given in Tables 2and 3. The apparent specific gravity of filler is 2790 kg/m3.
Aggregate gradation for the bituminous mixtures tested in thelaboratory has been selected as an average of the wearing courseType 2 gradation limits given by General Directorate of Turkish
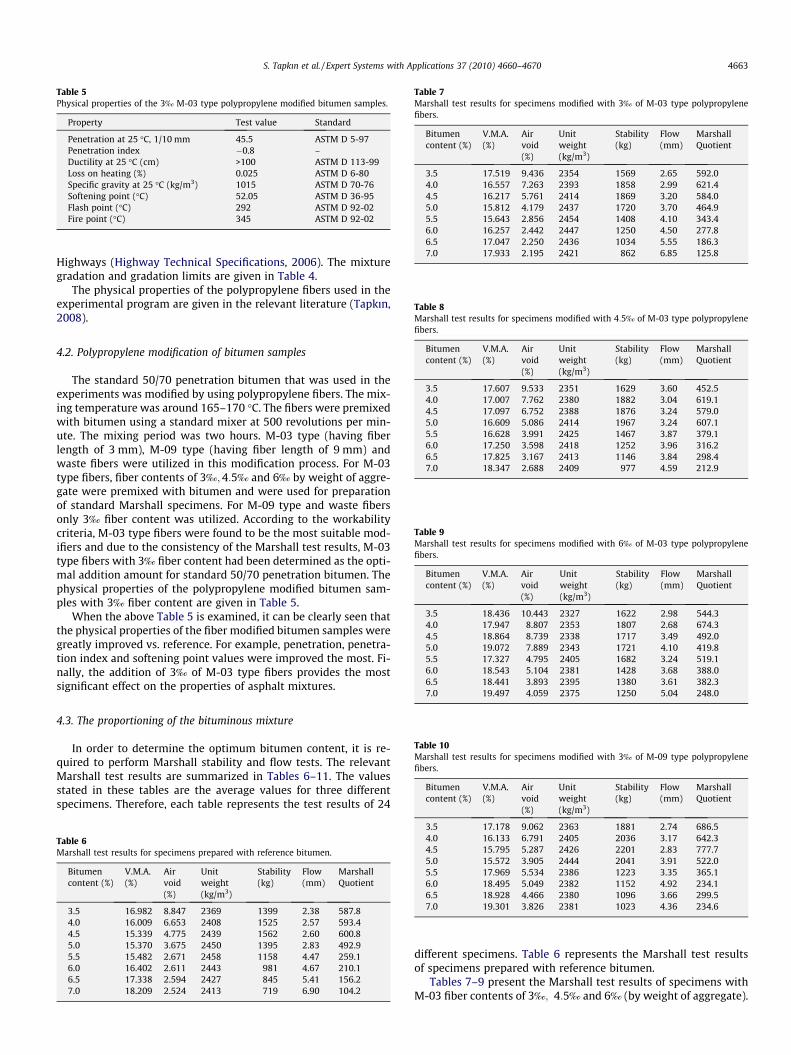
Table 5Physical properties of the 3‰ M-03 type polypropylene modified bitumen samples.
Property Test value Standard
Penetration at 25 �C, 1/10 mm 45.5 ASTM D 5-97Penetration index �0.8 –Ductility at 25 �C (cm) >100 ASTM D 113-99Loss on heating (%) 0.025 ASTM D 6-80Specific gravity at 25 �C (kg/m3) 1015 ASTM D 70-76Softening point (�C) 52.05 ASTM D 36-95Flash point (�C) 292 ASTM D 92-02Fire point (�C) 345 ASTM D 92-02
Table 7Marshall test results for specimens modified with 3‰ of M-03 type polypropylenefibers.
Bitumencontent (%)
V.M.A.(%)
Airvoid(%)
Unitweight(kg/m3)
Stability(kg)
Flow(mm)
MarshallQuotient
3.5 17.519 9.436 2354 1569 2.65 592.04.0 16.557 7.263 2393 1858 2.99 621.44.5 16.217 5.761 2414 1869 3.20 584.05.0 15.812 4.179 2437 1720 3.70 464.95.5 15.643 2.856 2454 1408 4.10 343.46.0 16.257 2.442 2447 1250 4.50 277.86.5 17.047 2.250 2436 1034 5.55 186.37.0 17.933 2.195 2421 862 6.85 125.8
Table 8Marshall test results for specimens modified with 4:5‰ of M-03 type polypropylene
S. Tapkın et al. / Expert Systems with Applications 37 (2010) 4660–4670 4663
Highways (Highway Technical Specifications, 2006). The mixturegradation and gradation limits are given in Table 4.
The physical properties of the polypropylene fibers used in theexperimental program are given in the relevant literature (Tapkın,2008).
fibers.
Bitumencontent (%)
V.M.A.(%)
Airvoid(%)
Unitweight(kg/m3)
Stability(kg)
Flow(mm)
MarshallQuotient
3.5 17.607 9.533 2351 1629 3.60 452.54.0 17.007 7.762 2380 1882 3.04 619.14.5 17.097 6.752 2388 1876 3.24 579.05.0 16.609 5.086 2414 1967 3.24 607.15.5 16.628 3.991 2425 1467 3.87 379.16.0 17.250 3.598 2418 1252 3.96 316.26.5 17.825 3.167 2413 1146 3.84 298.47.0 18.347 2.688 2409 977 4.59 212.9
Table 9Marshall test results for specimens modified with 6‰ of M-03 type polypropylenefibers.
Bitumencontent (%)
V.M.A.(%)
Airvoid(%)
Unitweight(kg/m3)
Stability(kg)
Flow(mm)
MarshallQuotient
3.5 18.436 10.443 2327 1622 2.98 544.34.0 17.947 8.807 2353 1807 2.68 674.34.5 18.864 8.739 2338 1717 3.49 492.05.0 19.072 7.889 2343 1721 4.10 419.85.5 17.327 4.795 2405 1682 3.24 519.16.0 18.543 5.104 2381 1428 3.68 388.06.5 18.441 3.893 2395 1380 3.61 382.37.0 19.497 4.059 2375 1250 5.04 248.0
4.2. Polypropylene modification of bitumen samples
The standard 50/70 penetration bitumen that was used in theexperiments was modified by using polypropylene fibers. The mix-ing temperature was around 165–170 �C. The fibers were premixedwith bitumen using a standard mixer at 500 revolutions per min-ute. The mixing period was two hours. M-03 type (having fiberlength of 3 mm), M-09 type (having fiber length of 9 mm) andwaste fibers were utilized in this modification process. For M-03type fibers, fiber contents of 3‰;4:5‰ and 6‰ by weight of aggre-gate were premixed with bitumen and were used for preparationof standard Marshall specimens. For M-09 type and waste fibersonly 3‰ fiber content was utilized. According to the workabilitycriteria, M-03 type fibers were found to be the most suitable mod-ifiers and due to the consistency of the Marshall test results, M-03type fibers with 3‰ fiber content had been determined as the opti-mal addition amount for standard 50/70 penetration bitumen. Thephysical properties of the polypropylene modified bitumen sam-ples with 3‰ fiber content are given in Table 5.
When the above Table 5 is examined, it can be clearly seen thatthe physical properties of the fiber modified bitumen samples weregreatly improved vs. reference. For example, penetration, penetra-tion index and softening point values were improved the most. Fi-nally, the addition of 3‰ of M-03 type fibers provides the mostsignificant effect on the properties of asphalt mixtures.
Table 10Marshall test results for specimens modified with 3‰ of M-09 type polypropylenefibers.
Bitumencontent (%)
V.M.A.(%)
Airvoid(%)
Unitweight(kg/m3)
Stability(kg)
Flow(mm)
MarshallQuotient
4.3. The proportioning of the bituminous mixture
In order to determine the optimum bitumen content, it is re-quired to perform Marshall stability and flow tests. The relevantMarshall test results are summarized in Tables 6–11. The valuesstated in these tables are the average values for three differentspecimens. Therefore, each table represents the test results of 24
Table 6Marshall test results for specimens prepared with reference bitumen.
Bitumencontent (%)
V.M.A.(%)
Airvoid(%)
Unitweight(kg/m3)
Stability(kg)
Flow(mm)
MarshallQuotient
3.5 16.982 8.847 2369 1399 2.38 587.84.0 16.009 6.653 2408 1525 2.57 593.44.5 15.339 4.775 2439 1562 2.60 600.85.0 15.370 3.675 2450 1395 2.83 492.95.5 15.482 2.671 2458 1158 4.47 259.16.0 16.402 2.611 2443 981 4.67 210.16.5 17.338 2.594 2427 845 5.41 156.27.0 18.209 2.524 2413 719 6.90 104.2
3.5 17.178 9.062 2363 1881 2.74 686.54.0 16.133 6.791 2405 2036 3.17 642.34.5 15.795 5.287 2426 2201 2.83 777.75.0 15.572 3.905 2444 2041 3.91 522.05.5 17.969 5.534 2386 1223 3.35 365.16.0 18.495 5.049 2382 1152 4.92 234.16.5 18.928 4.466 2380 1096 3.66 299.57.0 19.301 3.826 2381 1023 4.36 234.6
different specimens. Table 6 represents the Marshall test resultsof specimens prepared with reference bitumen.
Tables 7–9 present the Marshall test results of specimens withM-03 fiber contents of 3‰; 4:5‰ and 6‰ (by weight of aggregate).
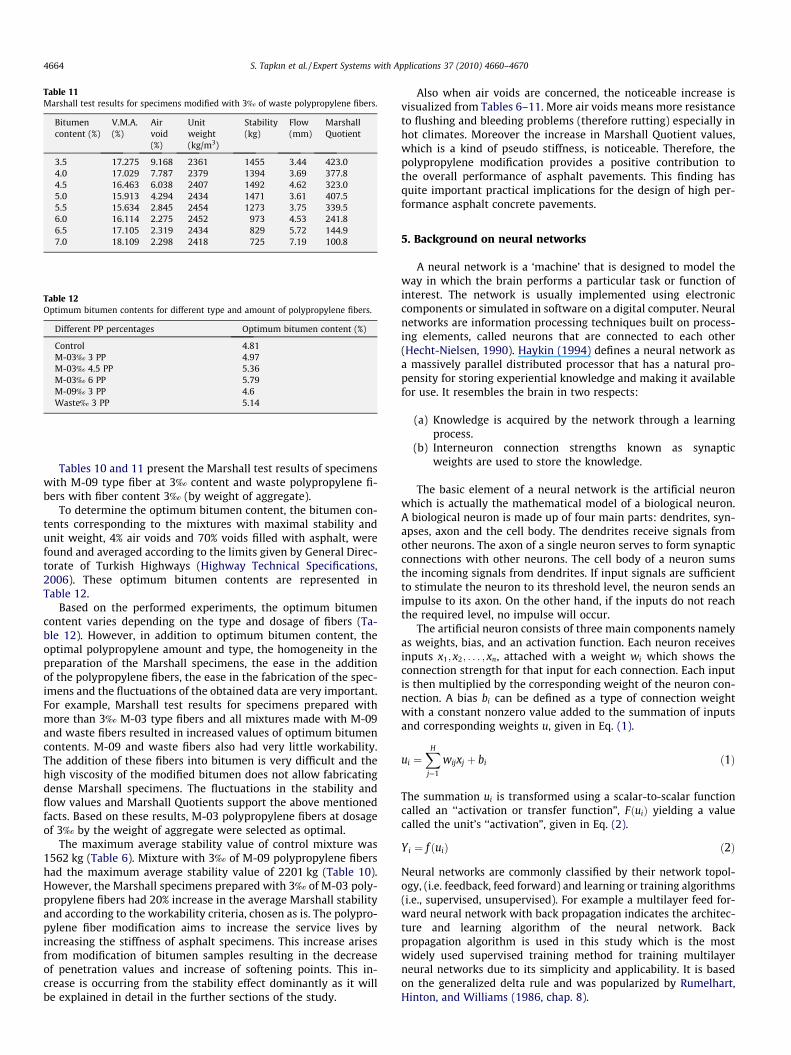
Table 12Optimum bitumen contents for different type and amount of polypropylene fibers.
Different PP percentages Optimum bitumen content (%)
Control 4.81M-03‰ 3 PP 4.97M-03‰ 4.5 PP 5.36M-03‰ 6 PP 5.79M-09‰ 3 PP 4.6Waste‰ 3 PP 5.14
Table 11Marshall test results for specimens modified with 3‰ of waste polypropylene fibers.
Bitumencontent (%)
V.M.A.(%)
Airvoid(%)
Unitweight(kg/m3)
Stability(kg)
Flow(mm)
MarshallQuotient
3.5 17.275 9.168 2361 1455 3.44 423.04.0 17.029 7.787 2379 1394 3.69 377.84.5 16.463 6.038 2407 1492 4.62 323.05.0 15.913 4.294 2434 1471 3.61 407.55.5 15.634 2.845 2454 1273 3.75 339.56.0 16.114 2.275 2452 973 4.53 241.86.5 17.105 2.319 2434 829 5.72 144.97.0 18.109 2.298 2418 725 7.19 100.8
4664 S. Tapkın et al. / Expert Systems with Applications 37 (2010) 4660–4670
Tables 10 and 11 present the Marshall test results of specimenswith M-09 type fiber at 3‰ content and waste polypropylene fi-bers with fiber content 3‰ (by weight of aggregate).
To determine the optimum bitumen content, the bitumen con-tents corresponding to the mixtures with maximal stability andunit weight, 4% air voids and 70% voids filled with asphalt, werefound and averaged according to the limits given by General Direc-torate of Turkish Highways (Highway Technical Specifications,2006). These optimum bitumen contents are represented inTable 12.
Based on the performed experiments, the optimum bitumencontent varies depending on the type and dosage of fibers (Ta-ble 12). However, in addition to optimum bitumen content, theoptimal polypropylene amount and type, the homogeneity in thepreparation of the Marshall specimens, the ease in the additionof the polypropylene fibers, the ease in the fabrication of the spec-imens and the fluctuations of the obtained data are very important.For example, Marshall test results for specimens prepared withmore than 3‰ M-03 type fibers and all mixtures made with M-09and waste fibers resulted in increased values of optimum bitumencontents. M-09 and waste fibers also had very little workability.The addition of these fibers into bitumen is very difficult and thehigh viscosity of the modified bitumen does not allow fabricatingdense Marshall specimens. The fluctuations in the stability andflow values and Marshall Quotients support the above mentionedfacts. Based on these results, M-03 polypropylene fibers at dosageof 3‰ by the weight of aggregate were selected as optimal.
The maximum average stability value of control mixture was1562 kg (Table 6). Mixture with 3‰ of M-09 polypropylene fibershad the maximum average stability value of 2201 kg (Table 10).However, the Marshall specimens prepared with 3‰ of M-03 poly-propylene fibers had 20% increase in the average Marshall stabilityand according to the workability criteria, chosen as is. The polypro-pylene fiber modification aims to increase the service lives byincreasing the stiffness of asphalt specimens. This increase arisesfrom modification of bitumen samples resulting in the decreaseof penetration values and increase of softening points. This in-crease is occurring from the stability effect dominantly as it willbe explained in detail in the further sections of the study.
Also when air voids are concerned, the noticeable increase isvisualized from Tables 6–11. More air voids means more resistanceto flushing and bleeding problems (therefore rutting) especially inhot climates. Moreover the increase in Marshall Quotient values,which is a kind of pseudo stiffness, is noticeable. Therefore, thepolypropylene modification provides a positive contribution tothe overall performance of asphalt pavements. This finding hasquite important practical implications for the design of high per-formance asphalt concrete pavements.
5. Background on neural networks
A neural network is a ‘machine’ that is designed to model theway in which the brain performs a particular task or function ofinterest. The network is usually implemented using electroniccomponents or simulated in software on a digital computer. Neuralnetworks are information processing techniques built on process-ing elements, called neurons that are connected to each other(Hecht-Nielsen, 1990). Haykin (1994) defines a neural network asa massively parallel distributed processor that has a natural pro-pensity for storing experiential knowledge and making it availablefor use. It resembles the brain in two respects:
(a) Knowledge is acquired by the network through a learningprocess.
(b) Interneuron connection strengths known as synapticweights are used to store the knowledge.
The basic element of a neural network is the artificial neuronwhich is actually the mathematical model of a biological neuron.A biological neuron is made up of four main parts: dendrites, syn-apses, axon and the cell body. The dendrites receive signals fromother neurons. The axon of a single neuron serves to form synapticconnections with other neurons. The cell body of a neuron sumsthe incoming signals from dendrites. If input signals are sufficientto stimulate the neuron to its threshold level, the neuron sends animpulse to its axon. On the other hand, if the inputs do not reachthe required level, no impulse will occur.
The artificial neuron consists of three main components namelyas weights, bias, and an activation function. Each neuron receivesinputs x1; x2; . . . ; xn, attached with a weight wi which shows theconnection strength for that input for each connection. Each inputis then multiplied by the corresponding weight of the neuron con-nection. A bias bi can be defined as a type of connection weightwith a constant nonzero value added to the summation of inputsand corresponding weights u, given in Eq. (1).
ui ¼XH
j¼1
wijxj þ bi ð1Þ
The summation ui is transformed using a scalar-to-scalar functioncalled an ‘‘activation or transfer function”, FðuiÞ yielding a valuecalled the unit’s ‘‘activation”, given in Eq. (2).
Yi ¼ f ðuiÞ ð2Þ
Neural networks are commonly classified by their network topol-ogy, (i.e. feedback, feed forward) and learning or training algorithms(i.e., supervised, unsupervised). For example a multilayer feed for-ward neural network with back propagation indicates the architec-ture and learning algorithm of the neural network. Backpropagation algorithm is used in this study which is the mostwidely used supervised training method for training multilayerneural networks due to its simplicity and applicability. It is basedon the generalized delta rule and was popularized by Rumelhart,Hinton, and Williams (1986, chap. 8).
S. Tapkın et al. / Expert Systems with Applications 37 (2010) 4660–4670 4665
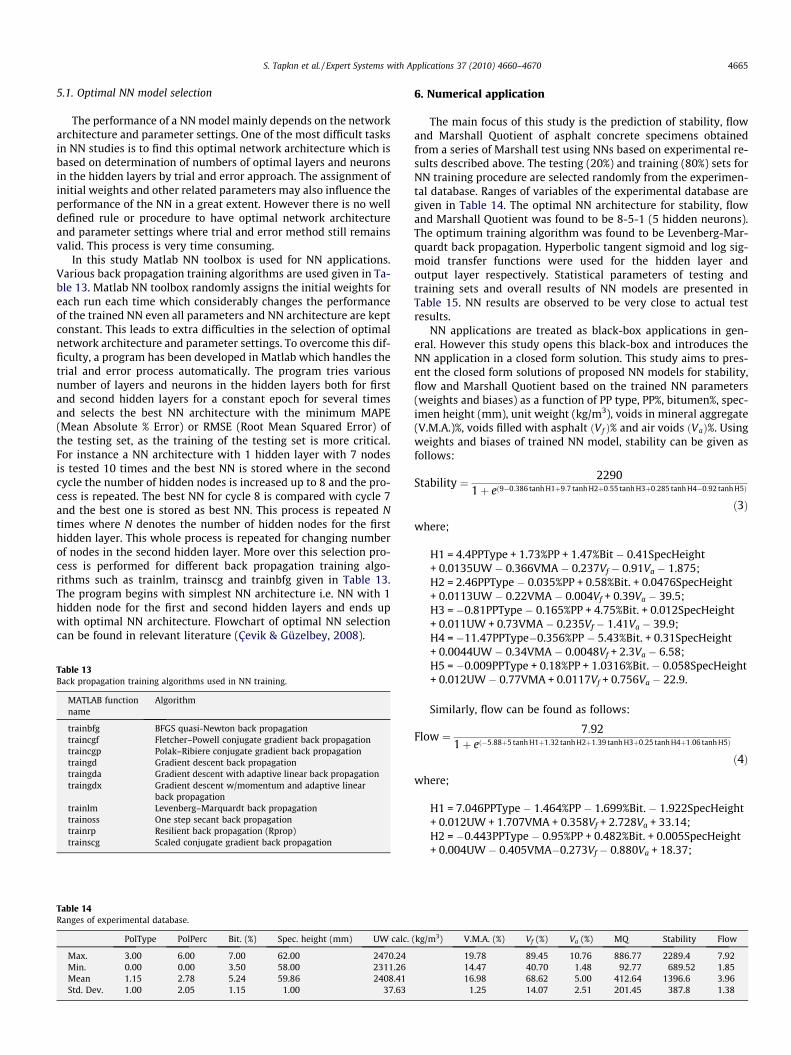
5.1. Optimal NN model selection
The performance of a NN model mainly depends on the networkarchitecture and parameter settings. One of the most difficult tasksin NN studies is to find this optimal network architecture which isbased on determination of numbers of optimal layers and neuronsin the hidden layers by trial and error approach. The assignment ofinitial weights and other related parameters may also influence theperformance of the NN in a great extent. However there is no welldefined rule or procedure to have optimal network architectureand parameter settings where trial and error method still remainsvalid. This process is very time consuming.
In this study Matlab NN toolbox is used for NN applications.Various back propagation training algorithms are used given in Ta-ble 13. Matlab NN toolbox randomly assigns the initial weights foreach run each time which considerably changes the performanceof the trained NN even all parameters and NN architecture are keptconstant. This leads to extra difficulties in the selection of optimalnetwork architecture and parameter settings. To overcome this dif-ficulty, a program has been developed in Matlab which handles thetrial and error process automatically. The program tries variousnumber of layers and neurons in the hidden layers both for firstand second hidden layers for a constant epoch for several timesand selects the best NN architecture with the minimum MAPE(Mean Absolute % Error) or RMSE (Root Mean Squared Error) ofthe testing set, as the training of the testing set is more critical.For instance a NN architecture with 1 hidden layer with 7 nodesis tested 10 times and the best NN is stored where in the secondcycle the number of hidden nodes is increased up to 8 and the pro-cess is repeated. The best NN for cycle 8 is compared with cycle 7and the best one is stored as best NN. This process is repeated Ntimes where N denotes the number of hidden nodes for the firsthidden layer. This whole process is repeated for changing numberof nodes in the second hidden layer. More over this selection pro-cess is performed for different back propagation training algo-rithms such as trainlm, trainscg and trainbfg given in Table 13.The program begins with simplest NN architecture i.e. NN with 1hidden node for the first and second hidden layers and ends upwith optimal NN architecture. Flowchart of optimal NN selectioncan be found in relevant literature (Çevik & Güzelbey, 2008).
Table 13Back propagation training algorithms used in NN training.
MATLAB functionname
Algorithm
trainbfg BFGS quasi-Newton back propagationtraincgf Fletcher–Powell conjugate gradient back propagationtraincgp Polak–Ribiere conjugate gradient back propagationtraingd Gradient descent back propagationtraingda Gradient descent with adaptive linear back propagationtraingdx Gradient descent w/momentum and adaptive linear
back propagationtrainlm Levenberg–Marquardt back propagationtrainoss One step secant back propagationtrainrp Resilient back propagation (Rprop)trainscg Scaled conjugate gradient back propagation
Table 14Ranges of experimental database.
PolType PolPerc Bit. (%) Spec. height (mm) UW calc.
Max. 3.00 6.00 7.00 62.00 2470.24Min. 0.00 0.00 3.50 58.00 2311.26Mean 1.15 2.78 5.24 59.86 2408.41Std. Dev. 1.00 2.05 1.15 1.00 37.63
6. Numerical application
The main focus of this study is the prediction of stability, flowand Marshall Quotient of asphalt concrete specimens obtainedfrom a series of Marshall test using NNs based on experimental re-sults described above. The testing (20%) and training (80%) sets forNN training procedure are selected randomly from the experimen-tal database. Ranges of variables of the experimental database aregiven in Table 14. The optimal NN architecture for stability, flowand Marshall Quotient was found to be 8-5-1 (5 hidden neurons).The optimum training algorithm was found to be Levenberg-Mar-quardt back propagation. Hyperbolic tangent sigmoid and log sig-moid transfer functions were used for the hidden layer andoutput layer respectively. Statistical parameters of testing andtraining sets and overall results of NN models are presented inTable 15. NN results are observed to be very close to actual testresults.
NN applications are treated as black-box applications in gen-eral. However this study opens this black-box and introduces theNN application in a closed form solution. This study aims to pres-ent the closed form solutions of proposed NN models for stability,flow and Marshall Quotient based on the trained NN parameters(weights and biases) as a function of PP type, PP%, bitumen%, spec-imen height (mm), unit weight (kg/m3), voids in mineral aggregate(V.M.A.)%, voids filled with asphalt ðVf Þ% and air voids ðVaÞ%. Usingweights and biases of trained NN model, stability can be given asfollows:
Stability ¼ 22901þ eð9�0:386 tanh H1þ9:7 tanh H2þ0:55 tanh H3þ0:285 tanh H4�0:92 tanh H5Þ
ð3Þ
where;
H1 = 4.4PPType + 1.73%PP + 1.47%Bit � 0.41SpecHeight+ 0.0135UW � 0.366VMA � 0.237Vf � 0.91Va � 1.875;H2 = 2.46PPType � 0.035%PP + 0.58%Bit. + 0.0476SpecHeight+ 0.0113UW � 0.22VMA � 0.004Vf + 0.39Va � 39.5;H3 = �0.81PPType � 0.165%PP + 4.75%Bit. + 0.012SpecHeight+ 0.011UW + 0.73VMA � 0.235Vf � 1.41Va � 39.9;H4 = �11.47PPType�0.356%PP � 5.43%Bit. + 0.31SpecHeight+ 0.0044UW � 0.34VMA � 0.0048Vf + 2.3Va � 6.58;H5 = �0.009PPType + 0.18%PP + 1.0316%Bit. � 0.058SpecHeight+ 0.012UW � 0.77VMA + 0.0117Vf + 0.756Va � 22.9.
Similarly, flow can be found as follows:
Flow ¼ 7:921þ eð�5:88þ5 tanh H1þ1:32 tanh H2þ1:39 tanh H3þ0:25 tanh H4þ1:06 tanh H5Þ
ð4Þ
where;
H1 = 7.046PPType � 1.464%PP � 1.699%Bit. � 1.922SpecHeight+ 0.012UW + 1.707VMA + 0.358Vf + 2.728Va + 33.14;H2 = �0.443PPType � 0.95%PP + 0.482%Bit. + 0.005SpecHeight+ 0.004UW � 0.405VMA�0.273Vf � 0.880Va + 18.37;
(kg/m3) V.M.A. (%) Vf (%) Va (%) MQ Stability Flow
19.78 89.45 10.76 886.77 2289.4 7.9214.47 40.70 1.48 92.77 689.52 1.8516.98 68.62 5.00 412.64 1396.6 3.96
1.25 14.07 2.51 201.45 387.8 1.38
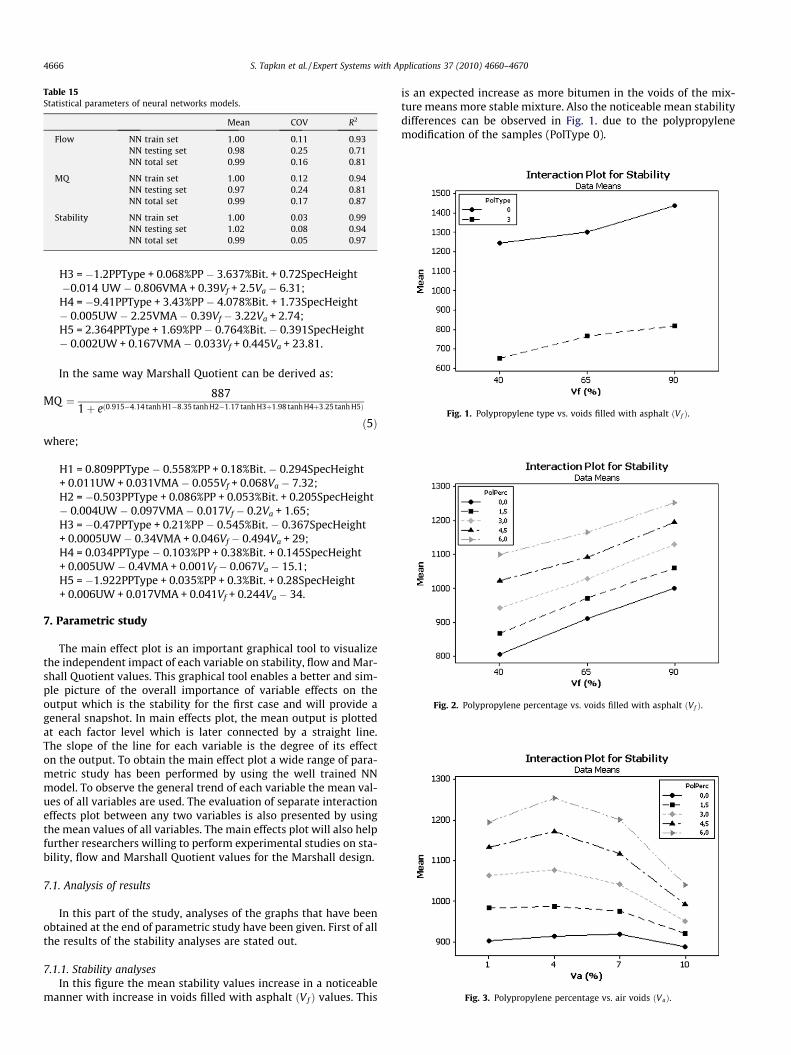
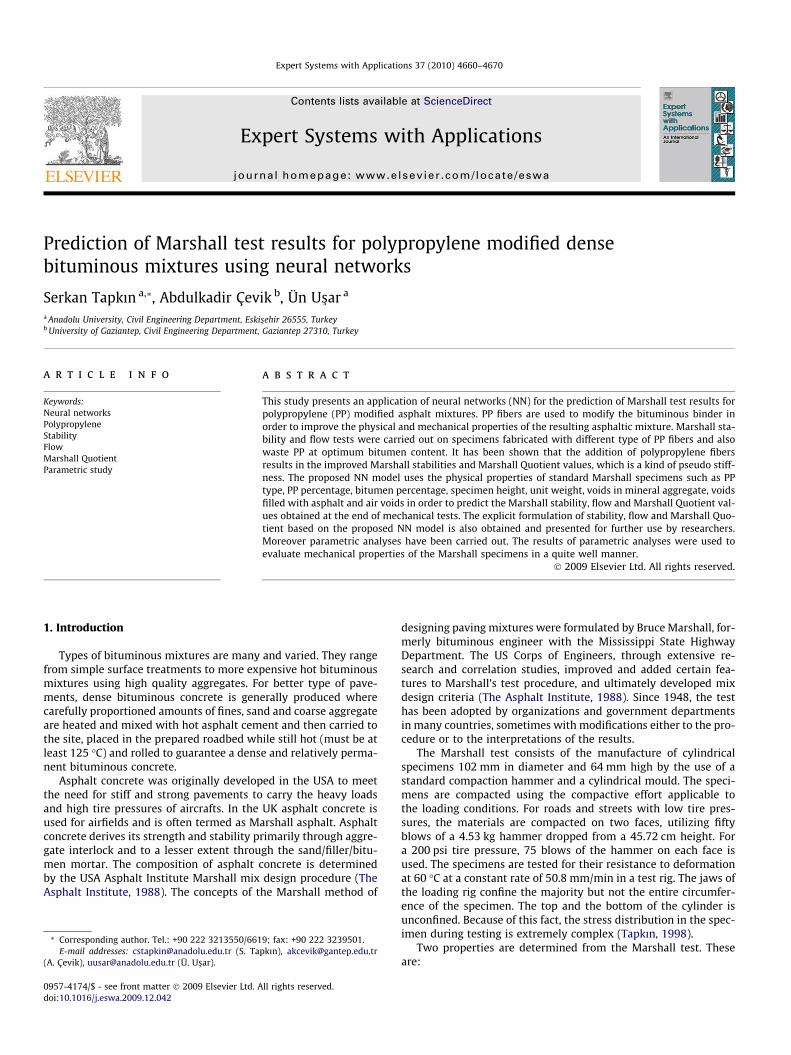
Fig. 1. Polypropylene type vs. voids filled with asphalt ðVf Þ.
Table 15Statistical parameters of neural networks models.
Mean COV R2
Flow NN train set 1.00 0.11 0.93NN testing set 0.98 0.25 0.71NN total set 0.99 0.16 0.81
MQ NN train set 1.00 0.12 0.94NN testing set 0.97 0.24 0.81NN total set 0.99 0.17 0.87
Stability NN train set 1.00 0.03 0.99NN testing set 1.02 0.08 0.94NN total set 0.99 0.05 0.97
4666 S. Tapkın et al. / Expert Systems with Applications 37 (2010) 4660–4670
H3 = �1.2PPType + 0.068%PP � 3.637%Bit. + 0.72SpecHeight�0.014 UW � 0.806VMA + 0.39Vf + 2.5Va � 6.31;H4 = �9.41PPType + 3.43%PP � 4.078%Bit. + 1.73SpecHeight� 0.005UW � 2.25VMA � 0.39Vf � 3.22Va + 2.74;H5 = 2.364PPType + 1.69%PP � 0.764%Bit. � 0.391SpecHeight� 0.002UW + 0.167VMA � 0.033Vf + 0.445Va + 23.81.
In the same way Marshall Quotient can be derived as:
MQ ¼ 8871þ eð0:915�4:14 tanh H1�8:35 tanh H2�1:17 tanh H3þ1:98 tanh H4þ3:25 tanh H5Þ
ð5Þwhere;
H1 = 0.809PPType � 0.558%PP + 0.18%Bit. � 0.294SpecHeight+ 0.011UW + 0.031VMA � 0.055Vf + 0.068Va � 7.32;H2 = �0.503PPType + 0.086%PP + 0.053%Bit. + 0.205SpecHeight� 0.004UW � 0.097VMA � 0.017Vf � 0.2Va + 1.65;H3 = �0.47PPType + 0.21%PP � 0.545%Bit. � 0.367SpecHeight+ 0.0005UW � 0.34VMA + 0.046Vf � 0.494Va + 29;H4 = 0.034PPType � 0.103%PP + 0.38%Bit. + 0.145SpecHeight+ 0.005UW � 0.4VMA + 0.001Vf � 0.067Va � 15.1;H5 = �1.922PPType + 0.035%PP + 0.3%Bit. + 0.28SpecHeight+ 0.006UW + 0.017VMA + 0.041Vf + 0.244Va � 34.
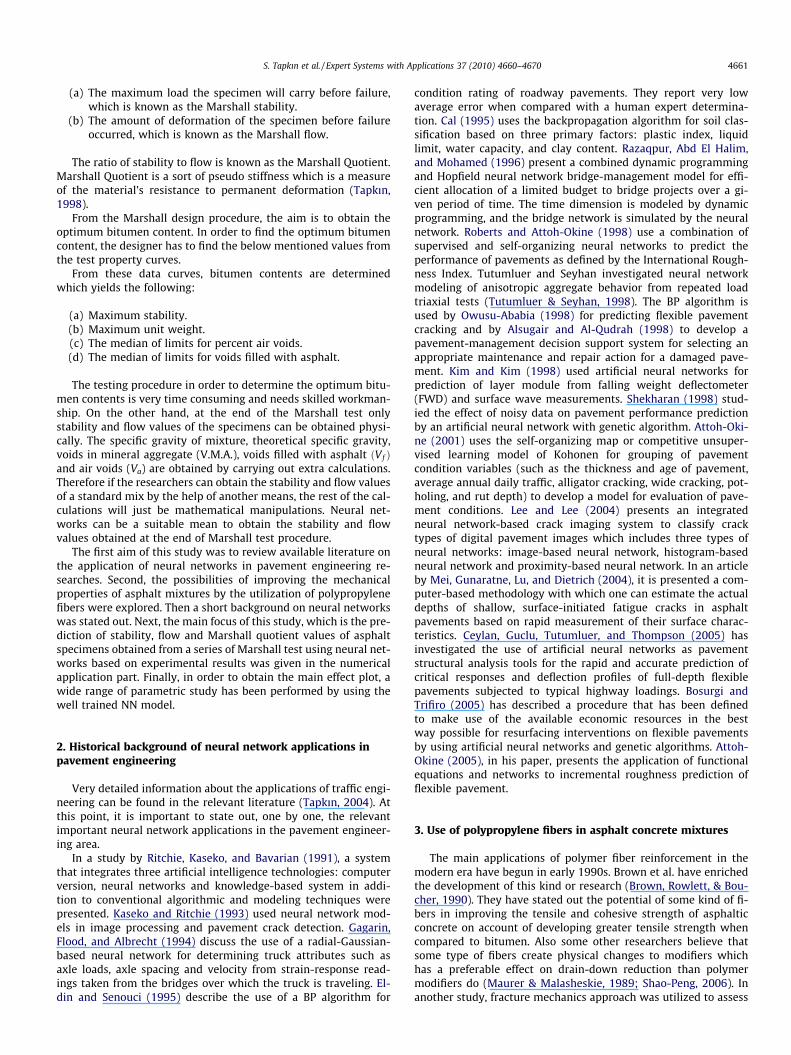
Fig. 3. Polypropylene percentage vs. air voids ðVaÞ.
Fig. 2. Polypropylene percentage vs. voids filled with asphalt ðVf Þ.
7. Parametric study
The main effect plot is an important graphical tool to visualizethe independent impact of each variable on stability, flow and Mar-shall Quotient values. This graphical tool enables a better and sim-ple picture of the overall importance of variable effects on theoutput which is the stability for the first case and will provide ageneral snapshot. In main effects plot, the mean output is plottedat each factor level which is later connected by a straight line.The slope of the line for each variable is the degree of its effecton the output. To obtain the main effect plot a wide range of para-metric study has been performed by using the well trained NNmodel. To observe the general trend of each variable the mean val-ues of all variables are used. The evaluation of separate interactioneffects plot between any two variables is also presented by usingthe mean values of all variables. The main effects plot will also helpfurther researchers willing to perform experimental studies on sta-bility, flow and Marshall Quotient values for the Marshall design.
7.1. Analysis of results
In this part of the study, analyses of the graphs that have beenobtained at the end of parametric study have been given. First of allthe results of the stability analyses are stated out.
7.1.1. Stability analysesIn this figure the mean stability values increase in a noticeable
manner with increase in voids filled with asphalt ðVf Þ values. This
is an expected increase as more bitumen in the voids of the mix-ture means more stable mixture. Also the noticeable mean stabilitydifferences can be observed in Fig. 1. due to the polypropylenemodification of the samples (PolType 0).
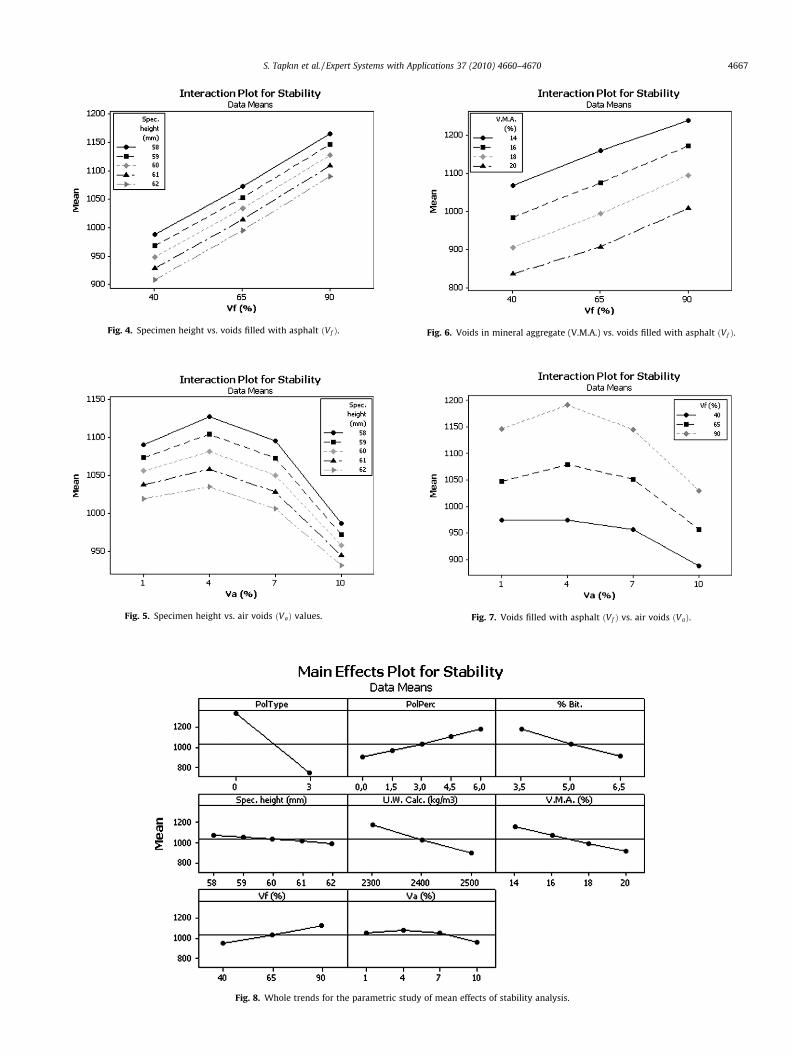
Fig. 4. Specimen height vs. voids filled with asphalt ðVf Þ.
Fig. 5. Specimen height vs. air voids ðVaÞ values.
Fig. 6. Voids in mineral aggregate (V.M.A.) vs. voids filled with asphalt ðVf Þ.
Fig. 7. Voids filled with asphalt ðVf Þ vs. air voids ðVaÞ.
Fig. 8. Whole trends for the parametric study of mean effects of stability analysis.
S. Tapkın et al. / Expert Systems with Applications 37 (2010) 4660–4670 4667
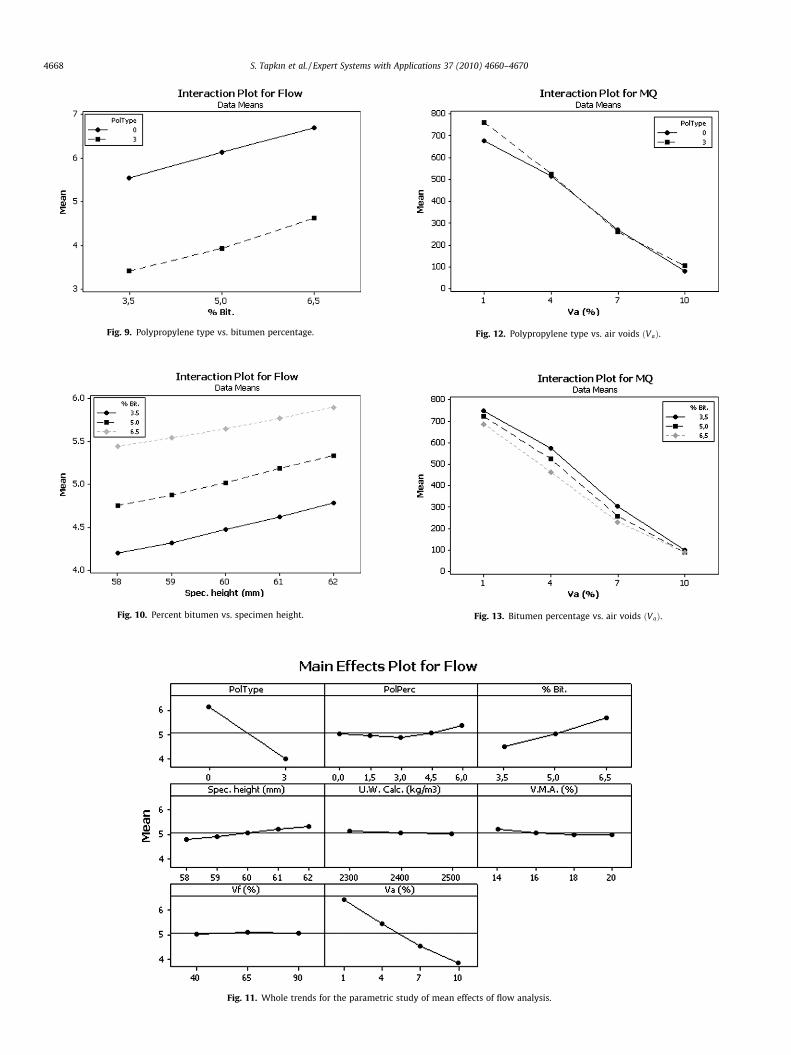
Fig. 9. Polypropylene type vs. bitumen percentage.
Fig. 10. Percent bitumen vs. specimen height.
Fig. 11. Whole trends for the parametric study of mean effects of flow analysis.
Fig. 12. Polypropylene type vs. air voids ðVaÞ.
Fig. 13. Bitumen percentage vs. air voids ðVaÞ.
4668 S. Tapkın et al. / Expert Systems with Applications 37 (2010) 4660–4670
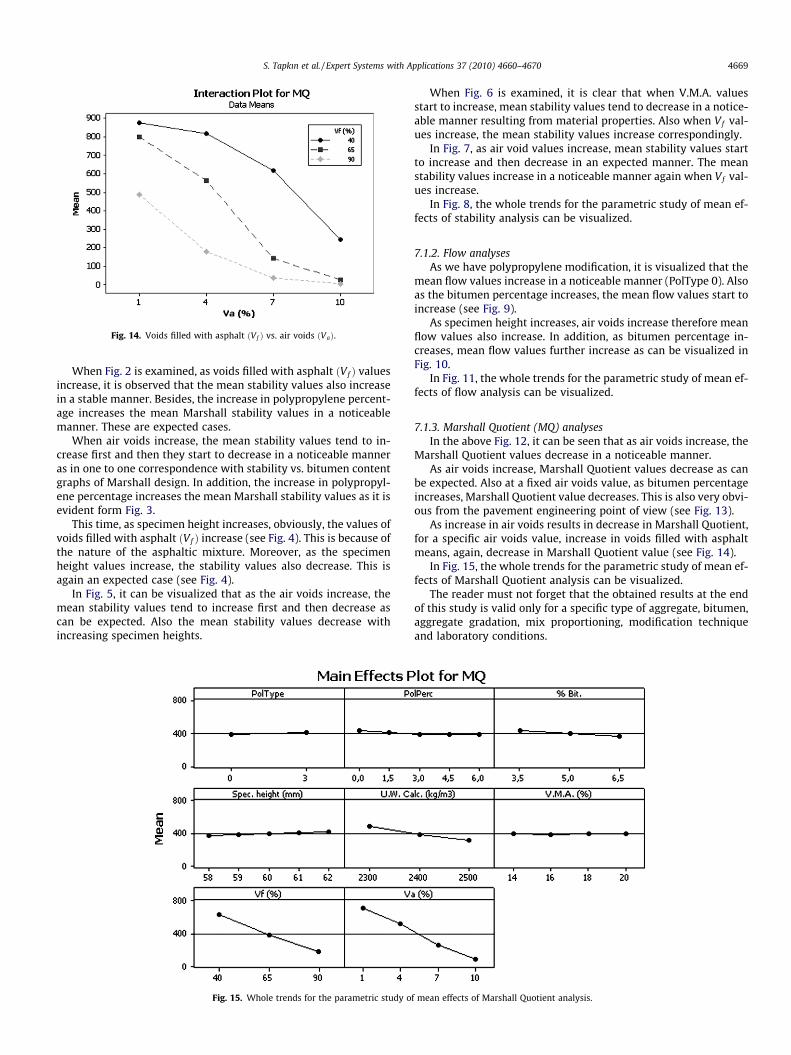
Fig. 14. Voids filled with asphalt ðVf Þ vs. air voids ðVaÞ.
S. Tapkın et al. / Expert Systems with Applications 37 (2010) 4660–4670 4669
When Fig. 2 is examined, as voids filled with asphalt ðVf Þ valuesincrease, it is observed that the mean stability values also increasein a stable manner. Besides, the increase in polypropylene percent-age increases the mean Marshall stability values in a noticeablemanner. These are expected cases.
When air voids increase, the mean stability values tend to in-crease first and then they start to decrease in a noticeable manneras in one to one correspondence with stability vs. bitumen contentgraphs of Marshall design. In addition, the increase in polypropyl-ene percentage increases the mean Marshall stability values as it isevident form Fig. 3.
This time, as specimen height increases, obviously, the values ofvoids filled with asphalt ðVf Þ increase (see Fig. 4). This is because ofthe nature of the asphaltic mixture. Moreover, as the specimenheight values increase, the stability values also decrease. This isagain an expected case (see Fig. 4).
In Fig. 5, it can be visualized that as the air voids increase, themean stability values tend to increase first and then decrease ascan be expected. Also the mean stability values decrease withincreasing specimen heights.
Fig. 15. Whole trends for the parametric study o
When Fig. 6 is examined, it is clear that when V.M.A. valuesstart to increase, mean stability values tend to decrease in a notice-able manner resulting from material properties. Also when Vf val-ues increase, the mean stability values increase correspondingly.
In Fig. 7, as air void values increase, mean stability values startto increase and then decrease in an expected manner. The meanstability values increase in a noticeable manner again when Vf val-ues increase.
In Fig. 8, the whole trends for the parametric study of mean ef-fects of stability analysis can be visualized.
7.1.2. Flow analysesAs we have polypropylene modification, it is visualized that the
mean flow values increase in a noticeable manner (PolType 0). Alsoas the bitumen percentage increases, the mean flow values start toincrease (see Fig. 9).
As specimen height increases, air voids increase therefore meanflow values also increase. In addition, as bitumen percentage in-creases, mean flow values further increase as can be visualized inFig. 10.
In Fig. 11, the whole trends for the parametric study of mean ef-fects of flow analysis can be visualized.
7.1.3. Marshall Quotient (MQ) analysesIn the above Fig. 12, it can be seen that as air voids increase, the
Marshall Quotient values decrease in a noticeable manner.As air voids increase, Marshall Quotient values decrease as can
be expected. Also at a fixed air voids value, as bitumen percentageincreases, Marshall Quotient value decreases. This is also very obvi-ous from the pavement engineering point of view (see Fig. 13).
As increase in air voids results in decrease in Marshall Quotient,for a specific air voids value, increase in voids filled with asphaltmeans, again, decrease in Marshall Quotient value (see Fig. 14).
In Fig. 15, the whole trends for the parametric study of mean ef-fects of Marshall Quotient analysis can be visualized.
The reader must not forget that the obtained results at the endof this study is valid only for a specific type of aggregate, bitumen,aggregate gradation, mix proportioning, modification techniqueand laboratory conditions.
f mean effects of Marshall Quotient analysis.
4670 S. Tapkın et al. / Expert Systems with Applications 37 (2010) 4660–4670
8. Conclusions
This paper presents a new and efficient approach for the predic-tion of mechanical properties such as stability, flow and MarshallQuotient obtained from Marshall design tests utilizing neural net-works. The increase in the stability values for the polypropylenemodification deserves attention. Also when air voids are con-cerned, the noticeable increase is visualized from the test data.Moreover the increase in Marshall Quotient values, which is a kindof pseudo stiffness, is noticeable. This approach is very importantin the sense that for a specific type of asphalt mixture and for pre-determined testing conditions, the stability, flow and MarshallQuotient values obtained at the end of Marshall design tests canbe estimated without carrying out destructive tests which takestoo much time and human effort. Moreover, the polypropylenemodification provides a significant contribution to the perfor-mance of asphalt pavements. These findings have quite importantpractical implications for the design of high performance asphaltconcrete pavements.
Backpropagation neural networks are used for the NN trainingprocess. The proposed neural network models for stability, flowand Marshall Quotient have shown good agreement with experi-mental results ðR2 ¼ 0:97;R2 ¼ 0:81;R2 ¼ 0:87Þ. The proposed NNmodel is valid for the ranges of the experimental database usedfor NN modeling. The explicit formulation of stability, flow andMarshall Quotient based on the proposed NN model is also ob-tained and presented for further use by researchers. To obtainthe main effects of each variable on stability, flow and MarshallQuotient, a wide range of parametric study has been performedby using the well trained NN model. As a result, the proposed neu-ral network model and formulation of the available stability, flowand Marshall Quotient of asphalt samples is quite accurate, fastand practical for use by other researchers studying in this field.
References
Alsugair, A. M., & Al-Qudrah, A. A. (1998). Artificial neural network approach forpavement maintenance. Journal of Computing in Civil Engineering, ASCE, 12(4),249–255.
Attoh-Okine, N. O. (2001). Grouping pavement condition variables for performancemodeling using self-organizing maps. Computer-Aided Civil and InfrastructureEngineering, 16(2), 112–125.
Attoh-Okine, N. O. (2005). Modeling incremental pavement roughness usingfunctional network. Canadian Journal of Civil Engineering, 32(5), 805–899.
Bosurgi, G., & Trifiro, F. (2005). A model based on artificial neural networks andgenetic algorithms for pavement maintenance management. The InternationalJournal of Pavement Engineering, 6(3), 201–209.
Brown, S. F., Rowlett, R. D., & Boucher, J. L. (1990). Asphalt modification. InProceedings of the conference on the United States strategic highway researchprogram: Sharing the benefits, ICE (pp. 181–203).
Cal, Y. (1995). Soil classification by neural network. Advances in EngineeringSoftware, 22, 95–97.
Çevik, A., & Güzelbey, I. H. (2008). Neural network modeling of strengthenhancement for CFRP confined concrete cylinders. Building and Environment,43, 751–763.
Ceylan, H., Guclu, A., Tutumluer, E., & Thompson, M. R. (2005). Backcalculation offull-depth asphalt pavement layer moduli considering nonlinear stress-dependent subgrade behavior. The International Journal of PavementEngineering, 6(3), 171–182.
Cleven, M. A. (2000). Investigation of the properties of carbon fiber modified asphaltmixtures. M.Sc., thesis in Civil Engineering, Michigan Technological University,Michigan.
Eldin, N. N., & Senouci, A. B. (1995). A pavement condition rating model usingbackpropagation neural network. Microcomputers in Civil Engineering, 10(6),433–441.
Gagarin, N., Flood, I., & Albrecht, P. (1994). Computing truck attributes with artificialneural networks. Journal of Computing in Civil Engineering, ASCE, 8(2), 179–200.
Haykin, S. (1994). Neural networks, a comprehensive foundation. New Jersey: PrenticeHall.
Hecht-Nielsen, R. (1990). Neurocomputing. Reading, MA: Addison-Wesley.Highway Technical Specifications (2006). General Directorate of Highways, Item No.
170/2, Ankara, Turkey.ITEM 400HS (1998). Standard specification for asphalt concrete-high stress using
polypropylene fibers. Ohio, USA: Ohio Department of Transportation,Construction and Materials Specifications.
Jenq, Y. S., Chwen-Jang, L., & Pei, L. (1993). Analysis of crack resistance of asphaltconcrete overlays. A fracture mechanics approach. Transportation ResearchRecord, 1388, 160–166.
Kaseko, M. S., & Ritchie, S. G. (1993). A neural network based methodology forpavement crack detection. Transportation Research Part C, 1(4), 275–291.
Kim, Y., & Kim, Y. R., (1998). Prediction of layer moduli from FWD and surface wavemeasurements using artificial neural network. In: A paper presented attransportation research board, 77th annual meeting, Washington, DC, USA.
Lee, B. J., & Lee, H. D. (2004). Position-invariant neural network for digital pavementcrack analysis. Computer-Aided Civil and Infrastructure Engineering, 19(2),105–118.
Maurer, D. A., & Malasheskie, G. (1989). Field performance of fabrics and fibers toretard reflective cracking (pp. 13–23). Transportation Research Record, 1248,National Research Council Washington, DC.
Mei, X., Gunaratne, M., Lu, J. J., & Dietrich, B. (2004). Neural network for rapidevaluation of shallow cracks in asphalt pavements. Computer-Aided Civil andInfrastructure Engineering, 19(3), 223–230.
Owusu-Ababia, S. (1998). Effect of neural network topology on flexible pavementcracking prediction. Computer-Aided Civil and Infrastructure Engineering, 13(5),349–355.
Razaqpur, A. G., Abd El Halim, A. O., & Mohamed, H. A. (1996). Bridge managementby dynamic programming and neural networks. Canadian Journal of CivilEngineering, 23, 1064–1069.
Ritchie, S. G., Kaseko, M., & Bavarian, B. (1991). Development of an intelligentsystem for automated pavement evaluation. Transportation Research Record(Vol. 1311, pp. 112–119). Washington, DC, USA.
Roberts, C. A., & Attoh-Okine, N. O. (1998). A comparative analysis of two artificialneural networks using pavement performance prediction. Computer-Aided Civiland Infrastructure Engineering, 13(5), 339–348.
Rumelhart, D. E., Hinton, G. E., & Williams, R. J. (1986). Learning internalrepresentation by error propagation. Parallel distributed processing: Explorationin the microstructure of cognition (Vol. 1). Cambridge, MA: MIT Press.
Shao-Peng, W. (2006). Effect of fiber types on relevant properties of porous asphalt.Transactions of Nonferrous Metals Society of China, 16, 791–795.
Shekharan, A. R. (1998). Effect of noisy data on pavement performance predictionby artificial neural networks. In: A paper presented at transportation researchboard, 77th annual meeting, Washington, DC, USA.
Simpson, A. L. & Kamyar C. M. (1994). Case study of modified bituminous mixtures:Somerset, Kentucky. In: Proceedings of the third materials engineering conference(Vol. 804, pp. 88–96). ASCE.
Tapkın, S. (1998). Improved asphalt aggregate mix properties by portland cementmodification. Master thesis, Civil Engineering Department, Middle EastTechnical University, Ankara, Turkey.
Tapkın, S. (2004). A recommended neural trip distribution model. PhD thesis, CivilEngineering Department, Middle East Technical University, Ankara, Turkey.
Tapkın, S. (2008). The effect of polypropylene fibers on asphalt performance.Building and Environment, 43, 1065–1071.
Tapkın, S., Us�ar, U., Tuncan, A., & Tuncan, M. (2009). Repeated creep behavior ofpolypropylene fiber-reinforced bituminous mixtures. Journal of TransportationEngineering, ASCE, 135(4), 240–249.
The Asphalt Institute (1988). Mix design methods for asphalt concrete and other hot-mix types. Manual series No. 2.
Tutumluer, E., & Seyhan, U. (1998). Neural network modeling of anistropicaggregate behavior from repeated load triaxial tests. In: A paper presented attransportation research board 77th annual meeting, Washington, DC, USA.
Related Documents