210 Int. J. Cont. Engineering Education and Life-Long Learning, Vol. 21, Nos. 2/3, 2011 Copyright © 2011 Inderscience Enterprises Ltd. Prediction of item psychometric indices from item characteristics automatically extracted from the stem and option text Carmen Garcia and Vicente Ponsoda* Facultad de Psicología, Universidad Autónoma de Madrid, C/ Iván Pavlov, 6, Campus de Cantoblanco, 28049 Madrid, Spain E-mail: [email protected] E-mail: [email protected] *Corresponding author Alejandro Sierra Escuela Politecnica Superior, Universidad Autónoma de Madrid, C/ Francisco Tomas y Valiente, 11, Campus de Cantoblanco, 28049 Madrid, Spain E-mail: [email protected] Abstract: This study has four main parts: first, some of the 31 guidelines proposed by Haladyna et al. (2002) were converted to 39 features that can be automatically extracted from a text file containing the test stem and options. Second, text files of a few multiple choice university exams were collected and the 39 features were extracted. Third, the difficulty and discrimination indices of each item were computed. Finally, linear regression was applied to find which features predict the items’ psychometric indices. The number of special adverbs (always, never, …) in the distracters and the discrimination index show the strongest link. Keywords: multiple choice items; item writing guidelines; item difficulty; item discrimination; item parameter prediction; automatic item reading. Reference to this paper should be made as follows: Garcia, C., Ponsoda, V. and Sierra, A. (2011) ‘Prediction of item psychometric indices from item characteristics automatically extracted from the stem and option text’, Int. J. Continuing Engineering Education and Life-Long Learning, Vol. 21, Nos. 2/3, pp.210–221. Biographical notes: Carmen García works at the Faculty of Psychology of the Universidad Autonoma de Madrid as an Associate Professor since 2002. His current research interests include multiple-choice item writing for classroom assessment and theory and applications of psychometrics. Vicente Ponsoda is a Full Professor of Psychometrics at the Facultad de Psicologia of the Universidad Autonoma de Madrid. His current research interests are item response models for forced-choice items and computerised adaptive testing. He is the Co-director of the Chair ‘Psychometric models and applications’, sponsored by the Instituto de Ingenieria del Conocimiento, and main researcher of the MCI project 2008-01685/PSIC.

Welcome message from author
This document is posted to help you gain knowledge. Please leave a comment to let me know what you think about it! Share it to your friends and learn new things together.
Transcript
210 Int. J. Cont. Engineering Education and Life-Long Learning, Vol. 21, Nos. 2/3, 2011
Copyright © 2011 Inderscience Enterprises Ltd.
Prediction of item psychometric indices from item characteristics automatically extracted from the stem and option text
Carmen Garcia and Vicente Ponsoda* Facultad de Psicología, Universidad Autónoma de Madrid, C/ Iván Pavlov, 6, Campus de Cantoblanco, 28049 Madrid, Spain E-mail: [email protected] E-mail: [email protected] *Corresponding author
Alejandro Sierra Escuela Politecnica Superior, Universidad Autónoma de Madrid, C/ Francisco Tomas y Valiente, 11, Campus de Cantoblanco, 28049 Madrid, Spain E-mail: [email protected]
Abstract: This study has four main parts: first, some of the 31 guidelines proposed by Haladyna et al. (2002) were converted to 39 features that can be automatically extracted from a text file containing the test stem and options. Second, text files of a few multiple choice university exams were collected and the 39 features were extracted. Third, the difficulty and discrimination indices of each item were computed. Finally, linear regression was applied to find which features predict the items’ psychometric indices. The number of special adverbs (always, never, …) in the distracters and the discrimination index show the strongest link.
Keywords: multiple choice items; item writing guidelines; item difficulty; item discrimination; item parameter prediction; automatic item reading.
Reference to this paper should be made as follows: Garcia, C., Ponsoda, V. and Sierra, A. (2011) ‘Prediction of item psychometric indices from item characteristics automatically extracted from the stem and option text’, Int. J. Continuing Engineering Education and Life-Long Learning, Vol. 21, Nos. 2/3, pp.210–221.
Biographical notes: Carmen García works at the Faculty of Psychology of the Universidad Autonoma de Madrid as an Associate Professor since 2002. His current research interests include multiple-choice item writing for classroom assessment and theory and applications of psychometrics.
Vicente Ponsoda is a Full Professor of Psychometrics at the Facultad de Psicologia of the Universidad Autonoma de Madrid. His current research interests are item response models for forced-choice items and computerised adaptive testing. He is the Co-director of the Chair ‘Psychometric models and applications’, sponsored by the Instituto de Ingenieria del Conocimiento, and main researcher of the MCI project 2008-01685/PSIC.
Prediction of item psychometric indices from item characteristics 211
Alejandro Sierra works at the Escuela Politécnica Superior of the Universidad Autónoma de Madrid as Professor since 2001. His main research interests include data mining, pattern recognition and evolutionary computation. Lately, he has been working on the application of pattern recognition techniques to the assessment and improvement of multiple-choice tests.
1 Introduction
Many aspects of the educational system require attention and improvement at all educational levels. It is generally acknowledged that exams are useful for student assessment and to ascertain whether or not they are learning what they should. Well-designed tests may also serve to motivate and help students structure their academic efforts. In the future, it may also be necessary for universities to justify the quality of their assessment tasks in potential legal actions taken by discontented students (Crisp and Palmer, 2007). Rodríguez et al. (2010) show the need to measure student progress and the use of data-driven decision making to improve educational outcomes. However, in higher education institutions, most of the faculty does not receive formal training in assessment procedures.
In spite of the emphasis on performance testing, the multiple choice (MC) format continues to play an important role in student learning assessment. In fact, this is the preferred format when the number of students to assess is high and the topic to be covered is broad enough to require a considerable number of items. Haladyna et al. (2002) proposed a 31-guideline (G) taxonomy for MC items, based on the review of educational testing textbooks and on the results of research studies, classified in five categories according to the topic to which they relate: content (eight), formatting (two), style (three), writing the stem (four), and writing the choices (14). This current study further explores this taxonomy. Its main tenet is that increasing our understanding of MC items may lead to improved item-writing practices and better measures of student achievement.
As explained in the method section, 39 features will be proposed as indicators of the ten guidelines from which we considered we could extract information about the stem and option text of MC items: G7 (avoid trick items), G13 (minimise the amount of reading in each item), G15 (include the central idea in the stem instead of in the choices), G16 (avoid window dressing), G17 (word the stem positively and avoid negatives such as not or except), G22 (keep choices independent; choices should not overlap), G23 (keep choices homogeneous in content and grammatical structure), G24 (keep the length of choices about equal), G27 [phrase choices positively; avoid negatives such as not), and G28 (avoid giving clues to the right answer, such as: (a) specific determiners including always, never, completely, and absolutely, (b) clang associations, choices identical to or resembling words in the stem, and (d) conspicuous correct choice].
Some empirical research has been conducted on the characteristics of MC items and how they affect test validity and reliability. Roberts (1993) provided some empirical evidence for G7 (avoid trick items), showing that trick items were more difficult that non-trick items. Chalifour and Powers (1989) registered some characteristics of 1.400 graduate record examination (GRE) analytical reasoning items. One of them, related to G13 and G16, was the number of words. A significant regression coefficient was found
212 C. Garcia et al.
when predicting item difficulty and discrimination: the more words, the higher the item difficulty and the lower the discrimination. Freedle and Kostin (1993) predicted the difficulty of a sample of 213 reading comprehension items from the Test of English as a Foreign Language (TOEFL). Some of their predictors will be also explored in this study: words in the stem (G13 and G16), negative stem (G17), and use of negative in correct and incorrect options (G27). They accounted for 33% of the item difficulty variance, but none of the previous predictors was statistically significant.
The guideline G15 (central idea in the stem instead of in the options) was endorsed by all the textbooks reviewed by Haladyna et al. (2002). Downing et al. (1991) evaluated the consequences of its violation. They did not find any effects on difficulty or discrimination and suggested that, if the students have enough experience with MC items, its effect was not relevant. Experience with MC items may also moderate the effects of other guidelines and not just those of G15. Based on these results, the current work will compare the exams applied in the first two degree years against those applied in the last three years. The first group has limited practice with MC items because they are not a usual item format in primary, secondary and high school assessments. In contrast, the students in the second group have more training in these types of exams, as most of their previous degree assessments use the MC format, and they have also learned the basics of item development and good writing practices for MC items in the psychometric methods subject they study at the end of their second course.
Students with limited experience in responding to MC items are expected to be more sensitive to the violation of the guidelines. For example, a too lengthy stem (G13 and G16) could be more harmful in a group of students not accustomed to extracting the important information from long texts than for students with more practice in this task.
The effect of G17 (word the stem positively and avoid negatives such as not or except) was investigated by Downing et al. (1991), Rachor and Gray (1996), and Tamir (1993), who found no difference in item difficulty or discrimination due to the use of a negatively worded stem. Harasym et al. (1992) found negatively worded stems to be inconsistently less difficult.
Rodríguez (1997) describes the research on item writing and synthesises the empirical findings using meta-analytic techniques. He selects the seven rules most often studied empirically: avoid the complex MC format, state the stem in question form, word the stem positively, use as many functional distracters as possible, avoid or use sparingly ‘all the above’ and ‘none of the above’ and keep the length of options similar. As for the first guideline, it was found that stating the stem negatively slightly decreased the item difficulty index inconsistently across studies by .032 on average (SE = 0.010), making the items more difficult. Regarding guideline G24, making the correct option longer than the other options increased the difficulty index on average by .057 (SE = 0.014) consistently across studies, making the items easier.
There are conflicting results regarding the guideline G23. Green (1984) found that more heterogeneous options increase item difficulty. Smith and Smith (1988) observed that the option similarity was associated with greater difficulty, but they did not adequately isolate distracter similarity. Downing et al. (1991) found no significant differences in difficulty or discrimination.
More recently, Ascalon et al. (2007) examined guidelines G9 (item stem expressed as a question) and G23 (distracter structure similar to or different from the correct answer). No effect was found for the stem format on item difficulty, but similarly structured distracters significantly raised the mean difficulty by .012.
Prediction of item psychometric indices from item characteristics 213
The aim of this paper is to automatically extract information, exclusively from the item stem and option text, on whether or not the items fulfil some item-writing guidelines. The theoretical aim is to contribute to the research described above on the relationship between item characteristics and their psychometric indices. The applied goal is to advise the faculty, before the exam is applied, on whether or not the writing of some items should be modified in order to improve exam writing.
2 Method
2.1 Dataset
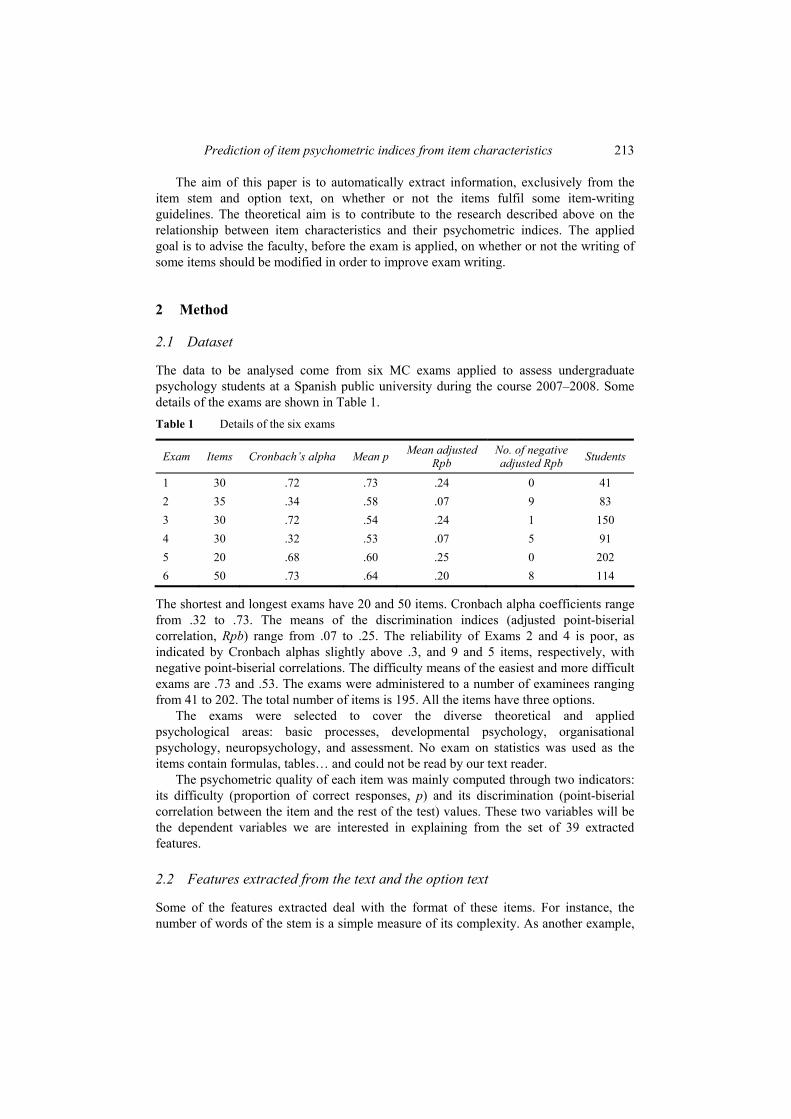
The data to be analysed come from six MC exams applied to assess undergraduate psychology students at a Spanish public university during the course 2007–2008. Some details of the exams are shown in Table 1. Table 1 Details of the six exams
Exam Items Cronbach’s alpha Mean p Mean adjusted Rpb
No. of negative adjusted Rpb Students
1 30 .72 .73 .24 0 41 2 35 .34 .58 .07 9 83 3 30 .72 .54 .24 1 150 4 30 .32 .53 .07 5 91 5 20 .68 .60 .25 0 202 6 50 .73 .64 .20 8 114
The shortest and longest exams have 20 and 50 items. Cronbach alpha coefficients range from .32 to .73. The means of the discrimination indices (adjusted point-biserial correlation, Rpb) range from .07 to .25. The reliability of Exams 2 and 4 is poor, as indicated by Cronbach alphas slightly above .3, and 9 and 5 items, respectively, with negative point-biserial correlations. The difficulty means of the easiest and more difficult exams are .73 and .53. The exams were administered to a number of examinees ranging from 41 to 202. The total number of items is 195. All the items have three options.
The exams were selected to cover the diverse theoretical and applied psychological areas: basic processes, developmental psychology, organisational psychology, neuropsychology, and assessment. No exam on statistics was used as the items contain formulas, tables… and could not be read by our text reader.
The psychometric quality of each item was mainly computed through two indicators: its difficulty (proportion of correct responses, p) and its discrimination (point-biserial correlation between the item and the rest of the test) values. These two variables will be the dependent variables we are interested in explaining from the set of 39 extracted features.
2.2 Features extracted from the text and the option text
Some of the features extracted deal with the format of these items. For instance, the number of words of the stem is a simple measure of its complexity. As another example,
214 C. Garcia et al.
a high standard deviation of the number of characters in the options indicates option length differences.
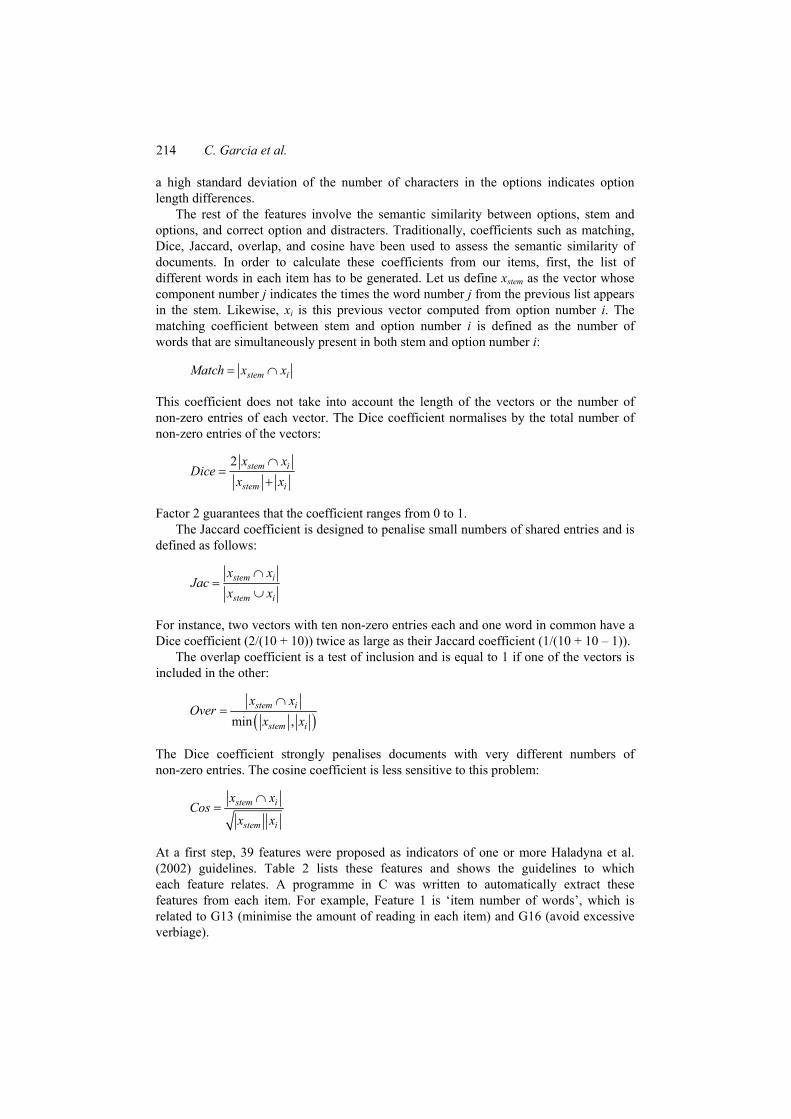
The rest of the features involve the semantic similarity between options, stem and options, and correct option and distracters. Traditionally, coefficients such as matching, Dice, Jaccard, overlap, and cosine have been used to assess the semantic similarity of documents. In order to calculate these coefficients from our items, first, the list of different words in each item has to be generated. Let us define xstem as the vector whose component number j indicates the times the word number j from the previous list appears in the stem. Likewise, xi is this previous vector computed from option number i. The matching coefficient between stem and option number i is defined as the number of words that are simultaneously present in both stem and option number i:
stem iMatch x x= ∩
This coefficient does not take into account the length of the vectors or the number of non-zero entries of each vector. The Dice coefficient normalises by the total number of non-zero entries of the vectors:
2 stem i
stem i
x xDice
x x∩
=+
Factor 2 guarantees that the coefficient ranges from 0 to 1. The Jaccard coefficient is designed to penalise small numbers of shared entries and is
defined as follows:
stem i
stem i
x xJac
x x∩
=∪
For instance, two vectors with ten non-zero entries each and one word in common have a Dice coefficient (2/(10 + 10)) twice as large as their Jaccard coefficient (1/(10 + 10 – 1)).
The overlap coefficient is a test of inclusion and is equal to 1 if one of the vectors is included in the other:
( )min ,stem i
stem i
x xOver
x x∩
=
The Dice coefficient strongly penalises documents with very different numbers of non-zero entries. The cosine coefficient is less sensitive to this problem:
stem i
stem i
x xCos
x x
∩=
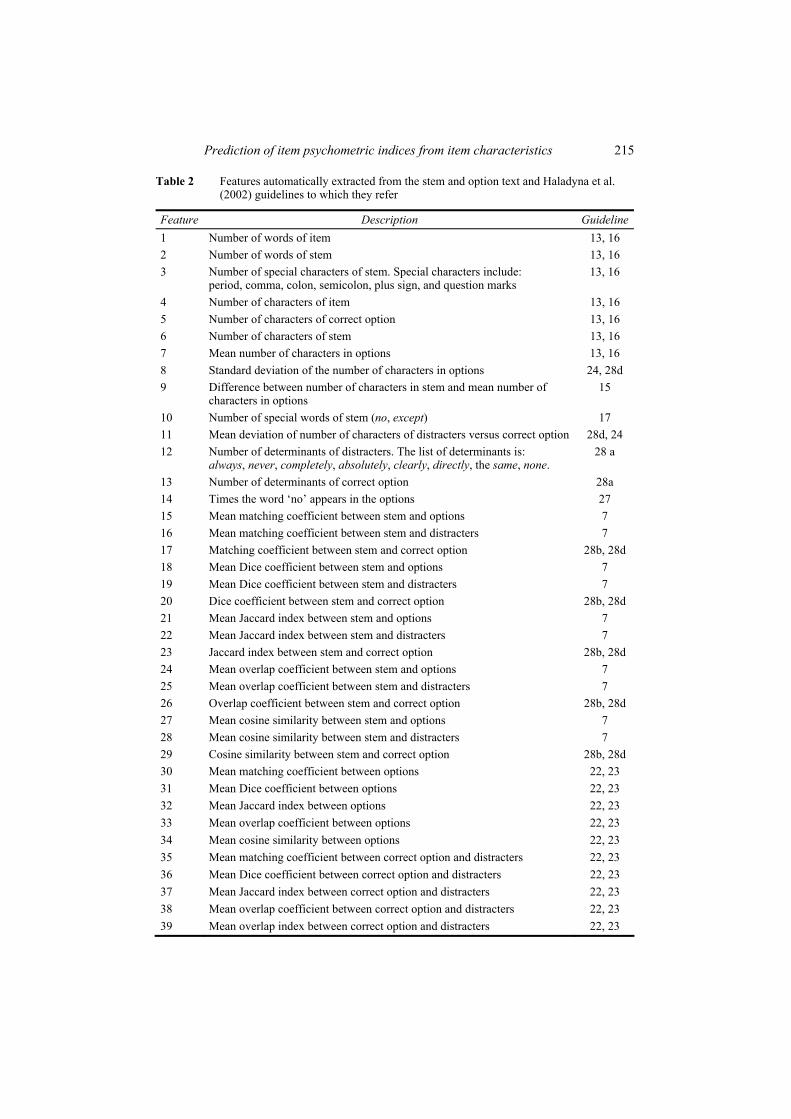
At a first step, 39 features were proposed as indicators of one or more Haladyna et al. (2002) guidelines. Table 2 lists these features and shows the guidelines to which each feature relates. A programme in C was written to automatically extract these features from each item. For example, Feature 1 is ‘item number of words’, which is related to G13 (minimise the amount of reading in each item) and G16 (avoid excessive verbiage).
Prediction of item psychometric indices from item characteristics 215
Table 2 Features automatically extracted from the stem and option text and Haladyna et al. (2002) guidelines to which they refer
Feature Description Guideline 1 Number of words of item 13, 16 2 Number of words of stem 13, 16 3 Number of special characters of stem. Special characters include:
period, comma, colon, semicolon, plus sign, and question marks 13, 16
4 Number of characters of item 13, 16 5 Number of characters of correct option 13, 16 6 Number of characters of stem 13, 16 7 Mean number of characters in options 13, 16 8 Standard deviation of the number of characters in options 24, 28d 9 Difference between number of characters in stem and mean number of
characters in options 15
10 Number of special words of stem (no, except) 17 11 Mean deviation of number of characters of distracters versus correct option 28d, 24 12 Number of determinants of distracters. The list of determinants is:
always, never, completely, absolutely, clearly, directly, the same, none. 28 a
13 Number of determinants of correct option 28a 14 Times the word ‘no’ appears in the options 27 15 Mean matching coefficient between stem and options 7 16 Mean matching coefficient between stem and distracters 7 17 Matching coefficient between stem and correct option 28b, 28d 18 Mean Dice coefficient between stem and options 7 19 Mean Dice coefficient between stem and distracters 7 20 Dice coefficient between stem and correct option 28b, 28d 21 Mean Jaccard index between stem and options 7 22 Mean Jaccard index between stem and distracters 7 23 Jaccard index between stem and correct option 28b, 28d 24 Mean overlap coefficient between stem and options 7 25 Mean overlap coefficient between stem and distracters 7 26 Overlap coefficient between stem and correct option 28b, 28d 27 Mean cosine similarity between stem and options 7 28 Mean cosine similarity between stem and distracters 7 29 Cosine similarity between stem and correct option 28b, 28d 30 Mean matching coefficient between options 22, 23 31 Mean Dice coefficient between options 22, 23 32 Mean Jaccard index between options 22, 23 33 Mean overlap coefficient between options 22, 23 34 Mean cosine similarity between options 22, 23 35 Mean matching coefficient between correct option and distracters 22, 23 36 Mean Dice coefficient between correct option and distracters 22, 23 37 Mean Jaccard index between correct option and distracters 22, 23 38 Mean overlap coefficient between correct option and distracters 22, 23 39 Mean overlap index between correct option and distracters 22, 23
216 C. Garcia et al.
2.3 Results
An initial examination of the data showed a high degree of correlation between many of the 39 predictor variables (some of them exceeded .8), indicating a serious multi-collinearity problem. It was then deemed necessary to select from the whole set the predictors that satisfied two conditions: to be as clearly related to the guidelines as possible and, at the same time, to have the lowest possible correlations between them.
For example, Features f1 to f7 both relate to rules 13 and 16, but Feature f1 was selected because it was considered more clearly related to these two guidelines. A similar procedure was followed for all other feature subsets related to the same rules. Finally, the ten selected variables were f1, f8, f9, f10, f12, f14, f16, f17, f30, and f35. The correlation matrix between these ten variables showed high correlations between f1 and f16 (.810), between f1 and f17 (.703), between f16 and f17 (.788), and between f30 and f35 (.968). Therefore, other features with a similar meaning to f16, f17 and f30 were sought. Features f22, f23, and f32 replaced f16, f17, and f30, respectively. Feature f35 was not replaced by others with a similar meaning (f36 to f39) because all the correlations with f32 were above .9.
The initial set of 39 features was then reduced to only these nine: f1, f8, f9, f10, f12, f14, f22, f23, and f32. The correlations between them were, in all cases, less than .7. In addition, their tolerance indices were always greater than .4, and their condition indices were below ten, indicating that multi-collinearity was no longer a problem.
Two regression equations were obtained to predict item difficulty and discrimination. When the dependent variable was the difficulty index p, the squared multiple correlation,
2 ,mR was .082 and the adjusted squared multiple correlation, 2 ,mR was .037, indicating that 3.7% of the variation in p was accounted for by the predictor set. These results were only marginally significant, F(9, 185) = 1.839, p = .064. A check on the normality, homoscedasticity, and independence assumptions of residuals revealed that they were met. Table 3 shows the standardised regression coefficients and significance values for the nine predictors. Table 3 Regression equation coefficients for the difficulty index
Independent variable Standardised coefficient Significance
f1 –0.091 0.401
f8 –0.006 0.937
f9 0.017 0.845
f10 0.118 0.109
f12 –0.167* 0.024
f14 0.047 0.525
f22 –0.160 0.128
f23 0.180 0.070
f32 –0.106 0.153
Note: *p < 0.05
Table 3 shows that only the coefficient of variable f12 (presence of specific determiners, such as always, never, completely…) reached significance. The Pearson correlation
Prediction of item psychometric indices from item characteristics 217
between this predictor and the dependent variable was –.180 (p = .012). Thus, items with distracters having a higher number of determinants are, in general, more difficult. When the regression equation was applied to each particular exam, the coefficients of f12 were again negative (–2.008 and –1.841, respectively) and marginally significant (p = .058 and .073, respectively) in two exams.
Table 3 also shows a positive marginally significant coefficient for feature f23, suggesting that items with high similarity between the stem and the correct option may be easier.
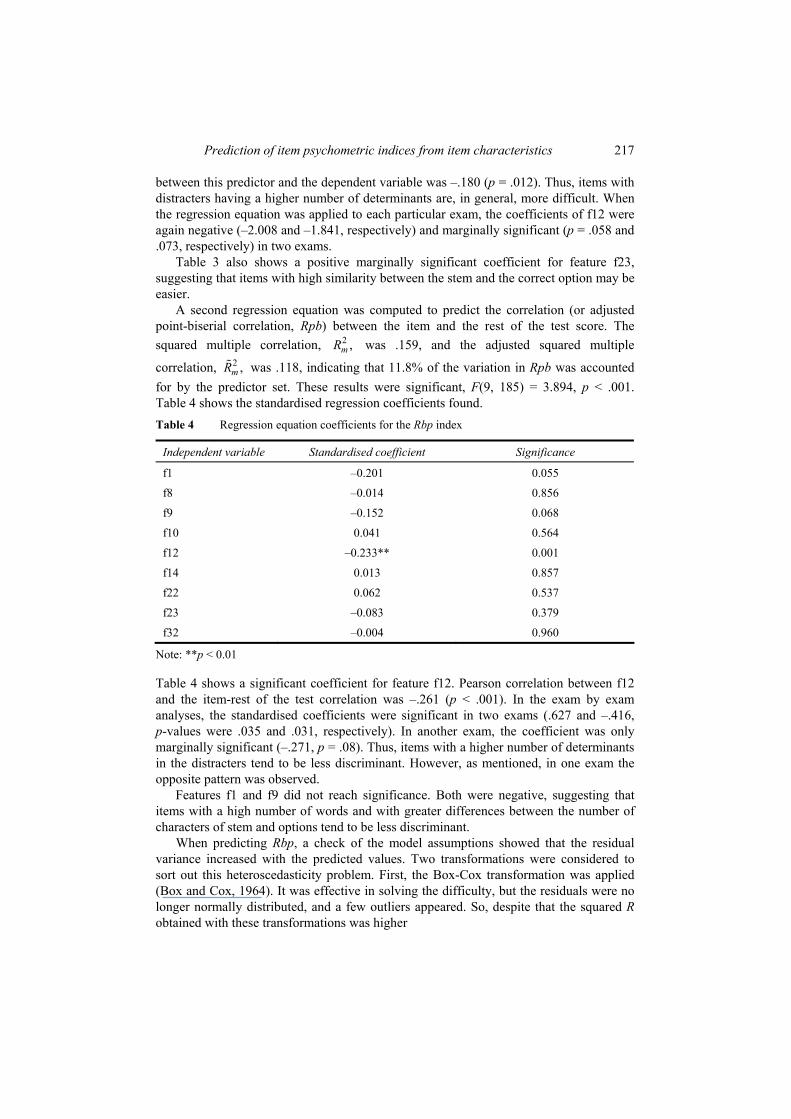
A second regression equation was computed to predict the correlation (or adjusted point-biserial correlation, Rpb) between the item and the rest of the test score. The squared multiple correlation, 2 ,mR was .159, and the adjusted squared multiple
correlation, 2 ,mR was .118, indicating that 11.8% of the variation in Rpb was accounted for by the predictor set. These results were significant, F(9, 185) = 3.894, p < .001. Table 4 shows the standardised regression coefficients found. Table 4 Regression equation coefficients for the Rbp index
Independent variable Standardised coefficient Significance
f1 –0.201 0.055
f8 –0.014 0.856
f9 –0.152 0.068
f10 0.041 0.564
f12 –0.233** 0.001
f14 0.013 0.857
f22 0.062 0.537
f23 –0.083 0.379
f32 –0.004 0.960
Note: **p < 0.01
Table 4 shows a significant coefficient for feature f12. Pearson correlation between f12 and the item-rest of the test correlation was –.261 (p < .001). In the exam by exam analyses, the standardised coefficients were significant in two exams (.627 and –.416, p-values were .035 and .031, respectively). In another exam, the coefficient was only marginally significant (–.271, p = .08). Thus, items with a higher number of determinants in the distracters tend to be less discriminant. However, as mentioned, in one exam the opposite pattern was observed.
Features f1 and f9 did not reach significance. Both were negative, suggesting that items with a high number of words and with greater differences between the number of characters of stem and options tend to be less discriminant.
When predicting Rbp, a check of the model assumptions showed that the residual variance increased with the predicted values. Two transformations were considered to sort out this heteroscedasticity problem. First, the Box-Cox transformation was applied (Box and Cox, 1964). It was effective in solving the difficulty, but the residuals were no longer normally distributed, and a few outliers appeared. So, despite that the squared R obtained with these transformations was higher
218 C. Garcia et al.
( )2 2 was .261 and the adjusted squared multiple correlation, , was .225 ,m mR R
this transformation was not considered appropriate. A second transformation was then attempted. The logarithm of the Rpb index was computed after adding .2 (the minimum sample Rpb was –.19), as also carried out in the Box-Cox case. With this transformation, the heterocedasticity problem was again sorted out, but four standardised residuals smaller than –3 appeared. Therefore, the regression equation computed on the untransformed Rbp was deemed the most appropriate solution for our dataset.
The jackknife procedure was used to conduct a cross-validation. For the two regression equations, the means of the squared residuals were .045 and .022. By applying the jackknife procedure they changed to .050 (11.7% increase) and .024 (11.1%), respectively. These two values are the mean of the squared residuals to be expected if the previous regression equations are applied to other similar datasets.
Two more regression equations were computed to predict the point-biserial item-test correlation and the discrimination index (difference in the proportion of correct responses between 27% of highest and lowest test performers). The adjusted squared multiple correlations were lower than that found for Rpb (.043 and .030), and only the predictor f12 obtained a significant coefficient in both cases (p < .05).
To examine the effect of students’ experience with MC items, the initial set of six exams was divided into two groups. Three exams from the first two courses and a total of 80 items formed the first group, and the remaining three exams from the last three courses and a total of 115 items integrated the second group.
Two regression equations were obtained for each group to again predict item difficulty (p) and discrimination (Rbp). The groups did not differ in the prediction of p, but they did differ when predicting the discrimination index.
In the first group, comprising items responded by students with little experience with MC items, the squared multiple correlation was .356, and the adjusted squared multiple correlation was .274, indicating that 27.4% of the variation in the Rpb index was accounted for by the predictor set. These results were significant, F(9, 70) = 4.306, p < .000. This percentage was 15.6% higher than the one obtained in the total sample. Four predictors obtained significant beta coefficients: f1, f9, f12, and f32 (–0.369, –0.228, –0.288, and 0.306 and their p-values were .002, .035, .009, and .006, respectively). Predictors f1 and f32 were not significant in the full group. The results on Feature f1 (item number of words) indicated that items with a high number of words tend to be less discriminant. Regarding Feature f32 (mean Jaccard index between options), the result obtained suggests that the higher the lexical similarity between the options, the more discriminant the items are.
In the sample with more experience, the squared multiple correlation was .171 and the adjusted squared multiple correlation was .100, indicating that 10% of the variation in the Rpb index was accounted for by the predictor set. These results were significant, F(9, 105) = 2.405, p = .016. This percentage was 1.8% lower than in the total sample. No predictor was statistically significant, but f12 fell short of being significant (–0.180, p = .057). The Chow test was applied to compare the regression results obtained for the two groups of subjects (more and less experience). The F change obtained was again marginally significant, F(1, 176) = 1.775, p = .076.
Prediction of item psychometric indices from item characteristics 219
3 Discussion
In spite of the acknowledged importance of item characteristics and writing practices when developing tests, there is a lack of empirical studies and, more specifically, of empirical tests on the consequences of violating the item-writing guidelines (Haladyna et al., 2002). This study aims at being a step forward in this direction and further explores the impact of violating the item-writing rules on item statistics. Item difficulty and discrimination are frequently used as item quality indicators. Knowing how the writing of the item relates to item difficulty or discrimination may provide useful information. A complete model of item format effects on item difficulty and item discrimination may then be of interest.
When looking at the effects of the violations of item-writing guidelines, contradictory and non-significant results have often been found (Rodríguez, 1997). This current work only explores the ten guidelines from which a text reader can extract information. Therefore, the percentages of variance explained by our regression models are unsurprisingly low. However, a few significant relationships emerged between writing-item characteristics and item discrimination. The relationship is even weaker with item difficulty. Our data support G28a (avoid giving clues to the right answer by using specific determiners such as always, never, completely, and absolutely). These determinants may help the respondent to eliminate some distracters as plausible options. The presence of these determinants may then impact the validity of item scores and therefore item developers should not use them. This result was significant in the three samples studied: that formed by the exams of the first two courses, of the last courses, and by all the exams together, showing the importance of being careful about not violating this rule.
We also found a significant effect of G15 (include the central idea in the stem). This effect is marginally significant in the total sample and significant in the group of students with less experience with MC items, suggesting that, if the students have enough experience, this effect may no longer be relevant. This same interpretation was also provided by Downing et al. (1991) to explain why they did not find any affect of this rule in a sample of experienced students.
Variable f10 (stem number of special words such as no, except…), related to G17, did not reach a significant coefficient in any of the equations. Rodríguez (1997) concludes that to state the stem positively is a supported rule, but there are inconsistent findings among studies. Additional factors may help explaining these inconsistent findings. Tamir (1991) found that negative items were more difficult when they included items of higher cognitive level, and Terranova (1969) found that the effect of negative wording depends on the frequency of switching from positively to negatively stated items. The regression coefficient of predictor f8 (standard deviation of the number of characters in options), related to G24 and G28d, does not reach significance in any equation. Rodríguez (1997) found a higher difficulty index for items in which the correct option length differed from the distracter length.
Two predictors, f1 and f32, emerged as significant only in the group of students with less experience. Predictor f1 refers to item complexity, and f32 refers mainly to the lexical similarity of the options. These results indicate that a complex item may have a negative effect on item discrimination if students have little experience with these types of items, but this effect disappears when students’ experience increases. The positive relationship found in this sub-sample between content similarity among the options and
220 C. Garcia et al.
item discrimination was not expected, as guideline G22 recommends preventing option overlap and keeping them independent. However, f32 can also be considered related to guideline G23 (keep choices homogeneous in content). More content homogeneity can result in higher lexical similarity and, therefore, higher values for Feature f32.
It seems, therefore, important to consider the experience of students when assessing the effect of the violation of the item-writing guidelines on item psychometric indicators. Our study suggests that students with less experience are more affected by the violation of these rules. This is especially interesting, as MC exams are very common during the first years when the number of students to test is especially high. Some previous contradictory results may have overlooked the experience students have on MC items and may have explored the violation of the same rule with students differing in experience. So, it seems important to include information on examinee experience on MC items when informing of the effects of violating the item-writing guidelines.
We did not find any effect of f22 (mean Jaccard index between stem and distracters), related to G7 (avoid trick items), in any regression equation. There are several possible explanations for this. One is that the semantic overlap was not high enough as to consider some of the items as trick items. The percentage of items with zero value in this feature was 20%, the mean was 0.071, and the standard deviation was 0.059. It is also possible (Freedle and Fellbaum, 1987) that lexical overlap accounts for MC item difficulty only in lower scoring examinees: examinees with a low score may tend to select the option with a greater lexical overlap. This hypothesis cannot be tested with our dataset due to the small sample size of some exams.
Feature f23 (Jaccard index between the stem and the correct option) is considered to provide information on guidelines G28b and G28d [avoid giving clues to the right answer, such as: (b) clang associations, choices identical to or resembling words in the stem, and (d) conspicuous correct choice]. The regression coefficient was positive and marginally significant when the dependent variable was the difficulty index in the total sample, showing that items with higher similarity between the stem and the correct option tend to have a higher p difficulty index (i.e., they are easier).
No effect was found of predictor f14 (times the word ‘no’ appears in the options), related to G27 (phrase choices positively; avoid negatives such as not). Freedle and Kostin (1993) found no effects of this variable in their study.
Our investigation supports the idea that item characteristics are related to item difficulty and discrimination indices. The effects found seem to interact with additional variables such as the experience the students have with MC items. The predictors in our case were automatically extracted from the text of the item stem and options and are considered indirect measures of ten out the 31 guidelines proposed by Haladyna et al. (2002).
Acknowledgements
This research has been funded by the Ministerio de Ciencia e Innovacion (Grant PSI2008-01685 and Grant TIN2007-66862-C02-02) and by the Chair ‘Psychometric models and applications’ sponsored by the Instituto de Ingeniería del Conocimiento.
Prediction of item psychometric indices from item characteristics 221
References Ascalon, M.E., Meyers, L.S., Davis, B.W. and Smits, N. (2007) ‘Distractor similarity and
item-stem structure: effects on item difficulty’, Applied Measurement in Education, Vol. 20, No. 2, pp.153–170.
Box, G.E.P. and Cox, D.R. (1964) ‘An analysis of transformations’, Journal of the Royal Statistical Society, Series B26, No. 2, pp.211–252.
Chalifour, C.L. and Powers, D.E. (1989) ‘The relationship of content characteristics of GRE analytical reasoning items to their difficulties and discriminations’, Journal of Educational Measurement, Vol. 26, No. 2, pp.120–132.
Crisp, G.T. and Palmer, E.J. (2007) ‘Engaging academics with a simplified analysis of their multiple-choice question (MCQ) assessment results’, Journal of University Teaching and Learning Practice, Vol. 4, No. 2, pp.88–106.
Downing, S.M., Dawson-Saunders, B., Case, S.M. and Powell, R.D. (1991) ‘The psychometric effects of negative stem, unfocused questions and heterogeneous options on NBME Part I and Part II item characteristics’, Paper presented at the Annual Meeting of the National Council on Measurement in Education, April, Chicago.
Freedle, R. and Fellbaum, C. (1987) ‘An exploratory study of the relative difficulty of TOEFL’s listening comprehension items’, in Freedle, R. and Duran, R. (Eds.): Cognitive and Linguistic Analysis of Test Performance, Ablex, Norwood, NJ.
Freedle, R. and Kostin, I. (1993) ‘The prediction of TOEFL reading comprehension item difficulty for expositor prose passages for three item types: main idea, inference and supporting idea items’, ETS Research Report ETS-RR-93-13, TOEFL-RR-44, Educational Testing Service, Princeton, NJ.
Green, K. (1984) ‘Effects of item characteristics on multiple choice item difficulty’, Educational and Psychological Measurement, Vol. 44, pp.551–561.
Harasym, P.H., Price, P.G., Brant, R., Violato, C. and Lorcheider, F.L. (1992) ‘Evaluation on negation in stems of multiple-choice items’, Evaluation and the Health Professions, Vol. 21, pp.120–133.
Haladyna, Th.M., Downing, S.M. and Rodriguez, M.C. (2002) ‘A review of multiple-choice item-writing guidelines for classroom assessment’, Applied Measurement in Education, Vol. 15, No. 3, pp.309–334.
Rachor, R.E. and Gray, G.T. (1996) ‘Must all stems be green? A study of two guidelines for writing multiple choice items’, Paper presented at the Annual Meeting of the National Council on Measurement in Education, April, New York.
Roberts, D.M. (1993) ‘An empirical study on the nature of trick test questions’, Journal of Educational Measurement, Vol. 30, pp.331–334.
Rodríguez, M.C. (1997) ‘The art and science of item-writing: a meta-analysis of multiple-choice item format effects’, Paper presented at the Annual Meeting of the American Educational Research Association, April, Chicago.
Rodríguez, M.C., Matuska, K., Cabrera, J. and Karl, S. (2010) ‘Improving the education of Minnesota’s students from pre-K through college: measuring student progress and using data to drive decision making’, CURA Reporter 40, Nos. 1–2, pp.3–10.
Smith, R.L. and Smith, J.K. (1988) ‘Differential use of item information by judges using Angoff and Nedelsky procedures’, Journal of Educational Measurement, Vol. 25, pp.259–274.
Tamir, P. (1993) ‘Positive and negative multiple choice items: How different are they?’, Studies in Educational Evaluation, Vol. 19, pp.311–325.
Terranova, C. (1969) ‘The effects of negative stems in multiple-choice tests items’, Unpublished doctoral dissertation, State University of New York at Buffalo (30, 2390A).
Related Documents


![Psychometric item evaluations of the Recovery-Stress ... and orzeck RESTQ final published article.… · Psychology of Sport and Exercise ] (]]]]) ]]]–]]] Psychometric item evaluations](https://static.cupdf.com/doc/110x72/5f5dc559e3e0b101ec78e499/psychometric-item-evaluations-of-the-recovery-stress-and-orzeck-restq-final.jpg)