Prediction of Fracture Risk in Men: A Cohort Study Liisa Byberg , 1 Rolf Gedeborg , 2 Thomas Cars , 3 Johan Sundstro ¨m, 4 Lars Berglund , 5 Lena Kilander , 3 Ha ˚kan Melhus , 6 and Karl Michae ¨ lsson 1 1 Department of Surgical Sciences, Orthopedics, Uppsala University, Uppsala, Sweden 2 Department of Surgical Sciences, Anesthesiology, Intensive Care Medicine, and Pain Treatment, Uppsala University, Uppsala, Sweden 3 Department of Public Health and Caring Sciences, Geriatrics, Uppsala University, Uppsala, Sweden 4 Department of Medical Sciences, Acute and Internal Medicine, Uppsala University, Uppsala, Sweden 5 Uppsala Clinical Research Centre, Uppsala University, Uppsala, Sweden 6 Department of Medical Sciences, Osteoporosis and Clinical Pharmacogenetics, Uppsala University, Uppsala, Sweden ABSTRACT FRAX is a tool that identifies individuals with high fracture risk who will benefit from pharmacological treatment of osteoporosis. However, a majority of fractures among elderly occur in people without osteoporosis and most occur after a fall. Our aim was to accurately identify men with a high future risk of fracture, independent of cause. In the population-based Uppsala Longitudinal Study of Adult Men (ULSAM) and using survival analysis we studied different models’ prognostic values (R 2 ) for any fracture and hip fracture within 10 years from age 50 (n ¼ 2322), 60 (n ¼ 1852), 71 (n ¼ 1221), and 82 (n ¼ 526) years. During the total follow-up period from age 50 years, 897 fractures occurred in 585 individuals. Of these, 281 were hip fractures occurring in 189 individuals. The rates of any fracture were 5.7/1000 person-years at risk from age 50 years and 25.9/1000 person-years at risk from age 82 years. Corresponding hip fractures rates were 2.9 and 11.7/1000 person-years at risk. The FRAX model included all variables in FRAX except bone mineral density. The full model combining FRAX variables, comorbidity, medications, and behavioral factors explained 25% to 45% of all fractures and 80% to 92% of hip fractures, depending on age. The corresponding prognostic values of the FRAX model were 7% to 17% for all fractures and 41% to 60% for hip fractures. Net reclassification improvement (NRI) comparing the full model with the FRAX model ranged between 40% and 53% for any fracture and between 40% and 87% for hip fracture. Within the highest quintile of predicted fracture risk with the full model, one-third of the men will have a fracture within 10 years after age 71 years and two-thirds after age 82 years. We conclude that the addition of comorbidity, medication, and behavioral factors to the clinical components of FRAX can substantially improve the ability to identify men at high risk of fracture, especially hip fracture. ß 2012 American Society for Bone and Mineral Research. KEY WORDS: COMORBIDITY; LIFESTYLE; MEDICINE; FRACTURE; PREDICTION Introduction O steoporotic fractures, especially hip fractures, constitute a large problem for the elderly population and, in terms of health care costs, for society. (1,2) Therefore, preventive measures to reduce the number of fractures are of great importance. To do this, people at high risk for fracture need to be identified. Several fracture risk scoring tools have been presented. (3) The most widely used, the FRAX algorithm, was designed to identify high fracture risk individuals likely to benefit from pharmacologic treatment to increase bone mineral density (BMD) (4–6) and thereby to reduce their fracture risk. (1) However, more than 80% of low-trauma fractures occur in people who do not have osteoporosis, (7) implying that they may not benefit from pharmacological treatment. The risk of fracture is affected by the risk for falls and by bone architecture. These two main determinants are in turn influenced by environmental factors, age, genes, lifestyle behaviors, diseases, and medications. (8–11) Thus, in some individuals, prevention of falls can reduce the risk of fractures, (11–15) sometimes in combination with treatment for low BMD. A majority of patients with hip fracture present with comorbidities when admitted to the hospital (16) but it is not known how much of the variation in fracture risk comorbid conditions and medications can explain. Lifestyle and social factors not included in FRAX have also been associated with fracture risk. (17,18) FRAX calculates the predicted individual absolute 10-year risk of osteoporotic fracture, based on 11 clinical risk factors and, optionally, BMD. (19) Although validated in several cohorts, (5,20) it is not known how well the FRAX variables ORIGINAL ARTICLE J JBMR Received in original form September 28, 2011; revised form November 22, 2011; accepted December 5, 2011. Published online December 20, 2011. Address correspondence to: Liisa Byberg, PhD, UCR/Scheele, Uppsala Science Park, SE-751 85 Uppsala, Sweden. E-mail: [email protected] Additional Supporting Information may be found in the online version of this article. Re-use of this article is permitted in accordance with the Terms and Conditions set out at http://wileyonlinelibrary.com/onlineopen#OnlineOpen_Terms. Journal of Bone and Mineral Research, Vol. 27, No. 4, April 2012, pp 797–807 DOI: 10.1002/jbmr.1498 ß 2012 American Society for Bone and Mineral Research 797

Welcome message from author
This document is posted to help you gain knowledge. Please leave a comment to let me know what you think about it! Share it to your friends and learn new things together.
Transcript

Prediction of Fracture Risk in Men: A Cohort Study
Liisa Byberg ,1 Rolf Gedeborg ,2 Thomas Cars ,3 Johan Sundstrom,4 Lars Berglund ,5 Lena Kilander ,3
Hakan Melhus ,6 and Karl Michaelsson1
1Department of Surgical Sciences, Orthopedics, Uppsala University, Uppsala, Sweden2Department of Surgical Sciences, Anesthesiology, Intensive Care Medicine, and Pain Treatment, Uppsala University, Uppsala, Sweden3Department of Public Health and Caring Sciences, Geriatrics, Uppsala University, Uppsala, Sweden4Department of Medical Sciences, Acute and Internal Medicine, Uppsala University, Uppsala, Sweden5Uppsala Clinical Research Centre, Uppsala University, Uppsala, Sweden6Department of Medical Sciences, Osteoporosis and Clinical Pharmacogenetics, Uppsala University, Uppsala, Sweden
ABSTRACTFRAX is a tool that identifies individuals with high fracture risk who will benefit from pharmacological treatment of osteoporosis.
However, a majority of fractures among elderly occur in people without osteoporosis and most occur after a fall. Our aim was to
accurately identify men with a high future risk of fracture, independent of cause. In the population-based Uppsala Longitudinal Study of
Adult Men (ULSAM) and using survival analysis we studied different models’ prognostic values (R2) for any fracture and hip fracture
within 10 years from age 50 (n¼ 2322), 60 (n¼ 1852), 71 (n¼ 1221), and 82 (n¼ 526) years. During the total follow-up period from age
50 years, 897 fractures occurred in 585 individuals. Of these, 281 were hip fractures occurring in 189 individuals. The rates of any fracture
were 5.7/1000 person-years at risk from age 50 years and 25.9/1000 person-years at risk from age 82 years. Corresponding hip fractures
rates were 2.9 and 11.7/1000 person-years at risk. The FRAX model included all variables in FRAX except bone mineral density. The full
model combining FRAX variables, comorbidity, medications, and behavioral factors explained 25% to 45% of all fractures and 80% to
92% of hip fractures, depending on age. The corresponding prognostic values of the FRAX model were 7% to 17% for all fractures and
41% to 60% for hip fractures. Net reclassification improvement (NRI) comparing the full model with the FRAX model ranged between
40% and 53% for any fracture and between 40% and 87% for hip fracture. Within the highest quintile of predicted fracture risk with the
full model, one-third of themenwill have a fracture within 10 years after age 71 years and two-thirds after age 82 years. We conclude that
the addition of comorbidity, medication, and behavioral factors to the clinical components of FRAX can substantially improve the ability
to identify men at high risk of fracture, especially hip fracture. � 2012 American Society for Bone and Mineral Research.
KEY WORDS: COMORBIDITY; LIFESTYLE; MEDICINE; FRACTURE; PREDICTION
Introduction
Osteoporotic fractures, especially hip fractures, constitute a
large problem for the elderly population and, in terms of
health care costs, for society.(1,2) Therefore, preventive measures
to reduce the number of fractures are of great importance. To do
this, people at high risk for fracture need to be identified. Several
fracture risk scoring tools have been presented.(3) The most
widely used, the FRAX algorithm, was designed to identify high
fracture risk individuals likely to benefit from pharmacologic
treatment to increase bone mineral density (BMD)(4–6) and
thereby to reduce their fracture risk.(1) However, more than 80%
of low-trauma fractures occur in people who do not have
osteoporosis,(7) implying that they may not benefit from
pharmacological treatment. The risk of fracture is affected by
the risk for falls and by bone architecture. These two main
determinants are in turn influenced by environmental factors,
age, genes, lifestyle behaviors, diseases, and medications.(8–11)
Thus, in some individuals, prevention of falls can reduce the risk
of fractures,(11–15) sometimes in combination with treatment for
low BMD.
A majority of patients with hip fracture present with
comorbidities when admitted to the hospital(16) but it is not
known how much of the variation in fracture risk comorbid
conditions and medications can explain. Lifestyle and social
factors not included in FRAX have also been associated with
fracture risk.(17,18) FRAX calculates the predicted individual
absolute 10-year risk of osteoporotic fracture, based on 11
clinical risk factors and, optionally, BMD.(19) Although validated in
several cohorts,(5,20) it is not known how well the FRAX variables
ORIGINAL ARTICLE JJBMR
Received in original form September 28, 2011; revised form November 22, 2011; accepted December 5, 2011. Published online December 20, 2011.
Address correspondence to: Liisa Byberg, PhD, UCR/Scheele, Uppsala Science Park, SE-751 85 Uppsala, Sweden. E-mail: [email protected]
Additional Supporting Information may be found in the online version of this article.
Re-use of this article is permitted in accordance with the Terms and Conditions set out at http://wileyonlinelibrary.com/onlineopen#OnlineOpen_Terms.
Journal of Bone and Mineral Research, Vol. 27, No. 4, April 2012, pp 797–807
DOI: 10.1002/jbmr.1498
� 2012 American Society for Bone and Mineral Research
797

perform in comparison with these factors or whether the
potential differences in performance changewith increasing age.
In the present study, we investigate to what extent variables
included in FRAX, comorbidities, medications, behavioral factors,
and a combination of these four components can explain the
variation in fracture risk at different ages in a population-based
cohort of 50-year-old men followed with repeat examinations for
40 years.
Subjects and Methods
The Uppsala Longitudinal Study of Adult Men (ULSAM) has been
described previously(21) and is outlined in Figure 1. All men born
from 1920 to 1924 and living in Uppsala municipality (n¼ 2841),
Sweden, in January 1970 were invited to a health investigation in
which 2322 men aged around 50 years participated. The men
were re-investigated at 60 (n¼ 1852), 71 (n¼ 1221), 77 (n¼ 838),
and 82 (n¼ 526) years of age. Information was collected by
clinical investigation and by questionnaires at each survey.(21)
The Uppsala University Ethics Committee approved the study
and all participants gave their informed consent before taking
part in the study.
We primarily used four predefined categories of exposure
variables: FRAX variables (VFRAX), comorbidities, medications, and
behavioral factors.
VFRAX
Our model, VFRAX, included the following components of
FRAX(19): age, height and weight (continuous), previous fracture
(yes, no), parent hip fracture (age 71 years: yes, no), current
smoking (yes, no), glucocorticoid use (yes, no), rheumatoid
arthritis (yes, no), alcohol use (high versus lower amounts),
and secondary osteoporosis (yes, no). Secondary osteoporosis
was categorized as ‘‘yes’’ based on the presence of liver
disease, type 1 diabetes mellitus, hypogonadism, malnutrition, or
thyreotoxicosis (Supporting Table 1).(22) We included the
separate variables without interaction terms in VFRAX because
the beta coefficients for the variables in FRAX are not published.
Because all interactions in FRAX, however, are dependent on
age(23) and the men in our cohort had a similar age, the impact
on our estimates of not considering the interaction terms is
probably modest.
Comorbidity
Information on comorbidity at each investigation was extracted
from the National Patient Register (NPR) using the unique
personal identification number given to all Swedish citizens.
We used information from primary diagnosis as well as
information from up to five secondary diagnoses. We used a
modified and expanded comorbidity score based on Elixhauser’s
comorbidity score,(24) with adaption to the Swedish versions of
the International Classification of Diseases (ICD, 10th edition
[ICD-10]; KSH97), ICD-9 (ICD, 9th edition; KSH87), and ICD-8 (ICD,
8th edition)(25) (Supporting Table 1). The 39 comorbidity items
were further collapsed into three major disease groups:
cardiovascular diseases, cancer, and other diseases. Diabetes
mellitus type 2 was diagnosed at the clinical investigations.
1920-1924 and resident in Uppsala invited toMen born 1970 (n=2841)part, Januarytake
Survey 11970-1973Age 50 (n=2322, 82%)
Survey 21980-1984
Survey 31991-1995
Survey 41997-2000
Died (n=98)(n=94)Not available
(n=2130)Invitedinnot participateDid
(n=8)investigationclinicalAge 60 (n=1852, 87%)
Died (n=422)(n=219)Not available
(n=1681)InvitedAge 71 (n=1221, 77%)
Died (n=748)(n=176)Not available
(n=1398)Invitedinnot participateDid
(n=1)investigationclinicalAge 77 (n=838, 60%)
Survey 52003-2005
(n=1095)Died(n=21)Not available
(n=952)Invitedinnot participateDid
investigationclinical
Survey 1 and 31 Dec 2009Between(n=1644)Died
typeanyofFractures(n=897 in 585 individuals)
Hip fractures( )Age 82 (n=526, 56%) (n=281 in 189 individuals)
Fig. 1. Flow chart describing the present study. Deaths are presented as cumulative mortality from start of survey 1. Numbers not available represent
those whowere not living in the Uppsala region at time of invitation. They did not contribute risk factor information at that survey but they could return for
a later survey if they had moved back to Uppsala. All men were traced in patient registers for fracture data, including those ‘‘not available.’’ Men not
participating in the clinical investigation only completed questionnaires and were not included in our analysis.
798 BYBERG ET AL. Journal of Bone and Mineral Research

Medications
Medications reported by the participant at the time of each
investigation were grouped according to major categories of the
Anatomical Therapeutic Chemical (ATC) classification system
(Supporting Table 2).(26)
Behavioral characteristics
In addition to smoking habits (never, former, current) and alcohol
consumption (described three paragraphs above), we included
physical activity (low, moderate, high), educational level (age
50 years, at least high school: yes, no), and whether the person
lived alone (ages 71, 77, and 82 years: yes or no). Information
on marital status and physical activity at work estimated
from occupational groups(18) were retrieved from the Swedish
censuses from 1960, 1970, and 1980. The functional risk factor
cognitive impairment,(13) defined as previously described,(27) was
based on cognitive function tests performed at ages 71, 77, and
82 years.(28)
Additional exposure information
In samples from the age 71 years and age 82 years investigations,
plasma 25-hydroxyvitamin D concentrations were determined
using high-pressure liquid chromatography–mass spectrome-
try.(29) To take into account seasonal variation in vitamin D, we
categorized the season of blood draw as summer (May–October)
and winter (November–April).(29) Concentrations of serum retinol
were determined in samples from ages 50, 70, and 82 years,
using high-performance liquid chromatography.(30)
For the age 82 years investigation, BMD (g/cm2) of the femoral
neck was measured using dual-energy X-ray absorptiometry
(DXA) (Lunar Prodigy, Lunar Corp., Madison, WI, USA; n¼ 461).(31)
Both extremities were used in the calculation when applicable.
We calculated the cumulative number of falls that occurred
before each investigation based on information in the NPR
(Supporting Table 1). In addition, at age 71 years, the number of
self-reported falls during the previous year was reported as none,
1 to 2 times, and 3 times or more.
Outcomes
Our main outcomes, any fracture (ICD-10 codes: S12, S22, S32,
S42, S52, S62, S72, S82, or S92) and hip fracture (ICD-10 codes:
S720, S721, or S722), were retrieved from the NPR and
outpatient-treated fractures were collected from outpatient
registers.(18) Incident fracture admissions were separated from
readmissions of a previous fracture using a previously validated
and accurate method.(32) We studied incident fractures after
each age of investigation; ie, 50, 60, 71, 77, and 82 years. Previous
fractures were recorded. Time to the second of two fractures
occurring within 10 years from each age was considered as
secondary outcome.
We chose not to present the results from the age 77 years
survey because the follow-up time was covered by the 10-year
follow-up periods from ages 71 and 82 years.
Statistical analyses
Statistical analyses were performed using Stata 11.0 (Stata Corp.,
College Station, TX, USA). Kaplan-Meier failure curves are
presented for all fractures, hip fractures, and two fractures.
Cumulative incidence curves for each outcome taking compet-
ing risk from mortality into account only marginally deviated
from the Kaplan-Meier curves. Using Cox proportional hazards
regression we primarily studied five different models—VFRAX,
comorbidity model, medicationmodel, behavioral factors model,
and full model—using the different survey ages as baseline with
10 years of follow-up and with follow-up until end of study
(December 31, 2009) with censoring at time of event, time of
emigration, or time of death, whichever occurred first and
before end of follow-up. Thus, we derived new models for each
�10-year interval and outcome to take into account changes in
exposure prevalences and parameter estimates. Although all
men had a similar age, age was nevertheless added as a linear
term in each model to take into account the limited variation in
age. We additionally studied nested models by combining VFRAXwith comorbidity, medication, and behavioral characteristics to
investigate whether each component contributed to the R2
value. The hazards of our models were considered proportional,
indicated by testing using Shoenfeld’s residuals and by
investigating Nelson-Aalen graphs.
Models were compared with the prognostic value given by
Royston’s R2, a measure of how much of the variation in time to
event that can be explained by amodel.(33) Taking the number of
covariates in the models into account(33) did not change the
interpretation of our results (data not shown).
The incremental discriminative ability of the full model
compared with VFRAX was explored using several methods.
The category-free net reclassification improvement (NRI) was
calculated using improved predicted survival calculated based
on a Weibull model.(34) Wald and Morris’ Risk-Screening
Converter(35) was used for calculation of sensitivity (for a false-
positive rate of 10%) and odds of being affected given a positive
result (OAPR) using the two models. For both models
we compared the highest quintile of predicted hazard with
the lowest quintile using Cox regression. The OAPR is interpreted
as the ratio of the number of men with fracture to those who did
not fracture within the highest quintile. The relative integrated
discrimination improvement (rIDI)(36,37) was based on logistic
regression. IDI and the category-free NRI are suggested to be
more sensitive estimates of discrimination and reclassification
than the previously commonly used C statistic.(34,36) As a
comparison, we calculated Harrell’s C for both models using the
‘‘estat concordance’’ command in Stata. Moreover, we assessed
the added discriminatory benefit of plasma vitamin D, serum
retinol, BMD, and history of falls using rIDI.
To avoid inflated estimates,(38) we report R2, NRI, and Harrell’s
C as median and 95% confidence interval (CI) derived from 1000
bootstrap samples drawn.
Missing data were imputed using one of the following
methods in hierarchical order: (1) the last observation carried
forward; (2) the next observation carried backward; and (3)
the median value.(39) For example, physical activity was the
most commonmissing variable at age 60 years (n¼ 144, of which
Journal of Bone and Mineral Research PREDICTION OF FRACTURE RISK IN MEN 799

130 were replaced with information from age 50 years, 10 with
information from age 70 years, and four with the median value at
age 60 years) and the second most common was height (n¼ 14,
all replaced by information from age 50 years). Sensitivity
analysis with restriction to nonmissing data did not change the
interpretation of our results (data not shown).
Results
Subjects’ characteristics at the different baseline ages are
presented in Table 1. The number of comorbidities and
medications used increased and the proportion of current
smokers decreased with increasing age.
During the total follow-up period (median: 32 years,
maximum: 40 years), 897 fractures occurred in 585 individuals
(25%). Of these, 281 (31%) were hip fractures occurring in 189
individuals. Figure 2 displays the distribution of the fracture
events by years after cohort entry.
The prognostic values of the four different sets of risk factors
and their combination are presented in Table 2. The full model
combining VFRAX, comorbidity, medications, and behavioral
factors had the highest prognostic value for all outcomes and all
ages. Investigating models in which one model is added to the
previous model showed that each model contributed to an
improved prediction of fracture at all ages (Fig. 3). All models had
a higher R2 value for fractures occurring within 10 years from
each baseline than for the whole follow-up period. We focus on
the 10-year results in the following paragraphs.
The prognostic value of VFRAX estimated as R2 was at best 17%
for any fracture (Table 2). Comorbidity and medication were rare
at age 50 years and the models had low predictive ability,
whereas the behavioral model’s performance was twice that
of VFRAX. At ages 60 to 82 years, the four separate models had
Table 1. Characteristics of the Study Subjects at the Different Baseline Ages
50 years 60 years 71 years 82 years
n 2322 1852 1221 526
Age, year, mean (SD) 49.6 (0.6) 59.8 (1.8) 71.0 (0.6) 81.7 (0.9)
FRAX variables
Height, cm, mean (SD) 176 (6) 176 (6) 175 (6) 173 (6)
Weight, kg, mean (SD) 77.8 (11.1) 78.7 (11.4) 80.3 (11.5) 78.1 (11.2)
BMI, kg/m2, mean (SD) 25.0 (3.2) 25.5 (3.3) 26.3 (3.4) 26.1 (3.4)
Previous fracture 26 (1) 110 (6) 138 (11) 104 (20)
Parent fractured hipa 109 (5) 106 (6) 109 (9) 47 (9)
Current smoker 1185 (51) 584 (32) 173 (14) 31 (6)
Glucocorticoids 7 (0.3) 17 (0.9) 119 (10) 40 (8)
Rheumatoid arthritis 0 (0) 0 (0) 3 (0.2) 4 (0.8)
Secondary osteoporosisb 19 (0.8) 21 (1) 19 (2) 11 (2)
High alcohol consumption 222 (10) 222 (12) 134 (11) 52 (10)
Medications
None 2100 (90) 1163 (63) 404 (33) 87 (16)
Comorbidities
None 2149 (92) 1192 (64) 478 (39) 108 (20)
1 comorbidity 142 (6) 411 (22) 355 (29) 109 (21)
2 comorbidities 23 (1) 146 (8) 199 (16) 92 (17)
�3 comorbidities 8 (0.3) 103 (5) 189 (15) 217 (41)
Cardiovascular disease 35 (2) 217 (12) 316 (26) 263 (50)
Cancer 6 (0.3) 33 (2) 75 (6) 85 (16)
Other diseases 140 (6) 532 (29) 589 (48) 352 (67)
Behavioral factors
Former smoker 552 (24) 721 (39) 574 (47) 52 (10)
Low leisure-time physical activity level 337 (14) 221 (12) 61 (5) 79 (15)
Moderate leisure-time physical activity level 884 (38) 941 (51) 437 (36) 189 (36)
High leisure-time physical activity level 1101 (47) 690 (37) 723 (59) 258 (49)
Sedentary work 266 (11) 234 (13) Not assessed Not assessed
Physically demanding work 253 (11) 160 (9) Not assessed Not assessed
Married 1999 (86) 1541 (83) 985 (81) 381 (72)
Living alone Not assessed Not assessed 192 (16) 137 (26)
Educational level less than high school 1931 (83) 1556 (84) 1002 (82) 406 (77)
Impaired cognitive function Not assessed Not assessed 140 (12) 173 (33)
Data are given as number (percentage) of men unless otherwise stated.aAssessed at age 71 years.bSecondary osteoporosis includes: liver disease, type 1 diabetes mellitus, malnutrition, thyreotoxicosis, hypogonadism.
800 BYBERG ET AL. Journal of Bone and Mineral Research

more similar prognostic values. The full model explained 25% to
45% of the variation in time to any fracture occurring within 10
years. Further, the full model could discriminate risk for any
fracture better than VFRAX with rIDI values between 164% and
243% (Table 2). The NRI showed around 50% improved
classification when using the full model compared to VFRAX, at
all ages (Fig. 4). The improvement was largest among nonevents.
Harrell’s C for VFRAX was 0.64 (0.60–0.68) at age 50 years, 0.62
(0.57–0.66) at age 60 years, 0.59 (0.55–0.63) at age 71 years, and
0.66 (0.61–0.72) at age 82 years. The corresponding C coefficients
for the full model were 0.71 (0.68–0.75), 0.72 (0.67–0.75), 0.67
(0.63–0.70), and 0.66 (0.71–0.80), respectively.
For hip fractures, the prognostic value of VFRAX was 41% to
60%. Also, the comorbidity, medication, and behavioral models
had higher R2 values compared to those for any fracture. The full
model explained at least 80% of the variability in time to hip
fracture. Discrimination also improved, with rIDI varying between
83% and 124% (Table 2) and NRI varying between 40% and 87%
(Fig. 4). The NRI among events was low (4%) at age 60 years, but
at older ages it was more similar to the NRI among nonevents.
Harrell’s C for VFRAX was 0.77 (0.68–0.85) at age 60 years, 0.71
(0.63–0.77) at age 71 years, and 0.79 (0.71–0.86) at age 82 years.
Corresponding C coefficients for the full model were 0.87 (0.79–
0.94), 0.84 (0.80–0.89), and 0.88 (0.82–0.93), respectively.
The prognostic values for time to a second fracture within 10
years with VFRAX ranged between 14% and 33% whereas the full
model had R2 values ranging between 61% and 98%. The R2
values of medication increased with increasing age.
BMD at the femoral neck was measured in 461 men (88%) at
age 82 years. VFRAX with the addition of BMD explained 34.2%
(15.7% to 57.0%) of all fractures (n¼ 55) and 58.7% (29.8% to
85.4%) of hip fractures (n¼ 25). Corresponding R2 values for the
full model also including BMD were 62.4% (42.8% to 80.2%) and
96.8% (87.3% to 99.6%), respectively.
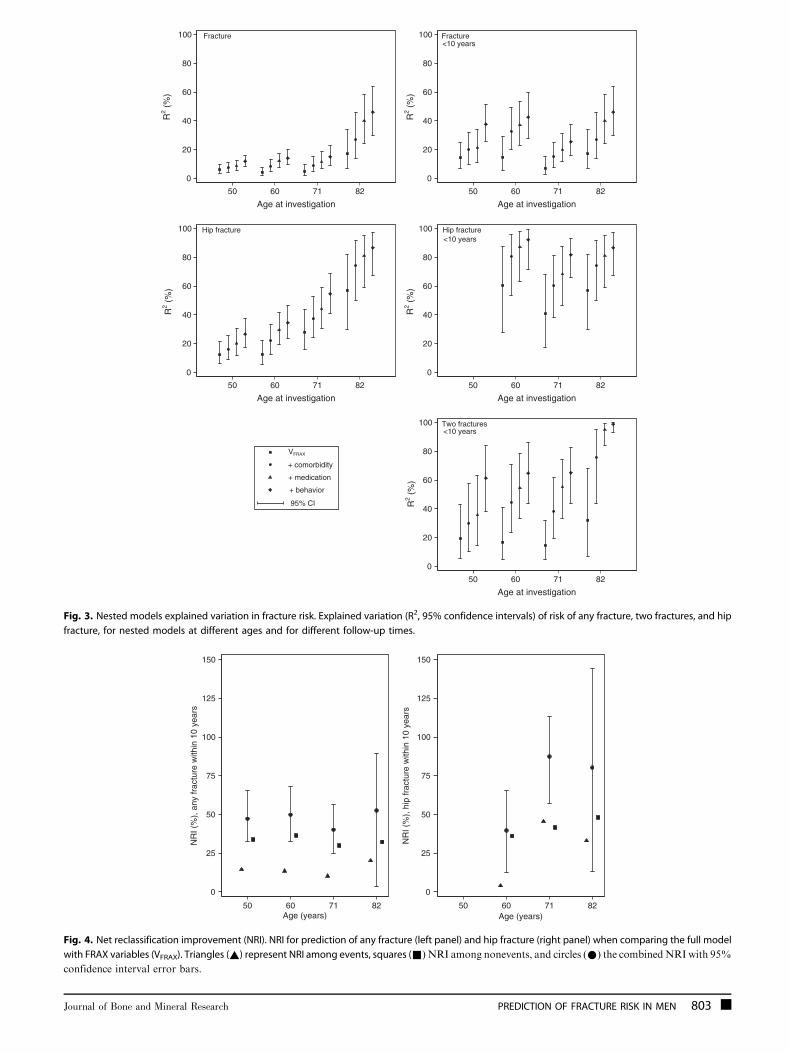
The performances of VFRAX and the full model were also
investigated from a screening perspective. Based on eachmodel,
the highest quintile of predicted hazard was compared with the
lowest. The rate contrasts between the lowest and highest
quintile of predicted fracture risk were more pronounced with
the full model compared with VFRAX. The sensitivity and the odds
of suffering a fracture and being in the highest risk quintile
(OAPR) were calculated (Table 3). The sensitivity was generally
modest. Nevertheless, a high proportion of men within the
highest quintile of predicted risk with the full model will suffer a
fracture. For instance, one-third at age 71 years and two-thirds at
age 82 years, of those predicted as high risk for any fracture also
suffered a fracture (OAPR 1:3.1 and 1:1.6, respectively). The
corresponding odds of hip fracture were one-fifth and one-third.
We further investigated whether discrimination, estimated by
rIDI, could be improved by addition of other exposures with
potential influence on fracture risk. Addition of vitamin D and
retinol concentrations and the number of previous falls to the full
model improved discrimination of any fracture by 29% (p¼ 0.01)
at age 71 years and by 62% (p¼ 0.002) at age 82 years. Hip
fracture discrimination was improved by 15% (p¼ 0.02) and 27%
(p¼ 0.05), and two fractures by 16% (p¼ 0.01) and 110%
(p< 0.001), respectively. The number of previous falls, retrieved
from the NPR, contributed a small part of this added
discrimination, except at age 82 years, where the number of
previous falls added 43% (p¼ 0.03) discrimination of any
fracture to the full model and 110% (p¼ 0.03) to VFRAX. Self-
reported number of falls in the previous year did not improve
discrimination at age 71 years (data not shown).
Discussion
The present population-based study of men followed from their
50s until old age shows that the addition of comorbidity,
medication, and behavioral factors to the clinical components of
FRAX can substantially improve the ability to identify men at high
risk of fracture, especially hip fracture and a second fracture of
any type. Furthermore, using information on comorbidity,
medicine use, and behaviors, we can better identify those
who will not suffer a fracture. The overall enhanced classification
is illustrated by a net reclassification improvement between 40%
and 87%, and a larger proportion of men actually suffering a
fracture when predicted to be in the highest risk category.
The FRAX algorithm was developed to easily identify
individuals at high 10-year risk of fracture likely to benefit from
pharmaceutical treatment to improve bone density.(20) Other
interventions than pharmaceutical treatment need to be
considered(12) because a majority of fractures occur in persons
without osteoporosis.(12) Physical exercise(40) and review of
medications with the purpose of reducing dosage or completely
withdrawing fall-risk–increasing drugs(41,42) can reduce the fall
rate and possibly the fracture rate. Moreover, the injury impact
on the hip by a fall can be reduced by hip protectors if they are
made available to frail, older people.(15,43)
Validation of FRAX in men has been scarce.(20) This is in part
because the beta coefficients for variables in FRAX have not been
published. In a retrospective case-control analysis from Australia
including 144women and 56men aged 60 to 90 years, FRAXwith
BMD was a poor predictor of fragility fracture in men but
was more accurate in women.(5) Although this discrepancy may
have been due to chance, it has been argued that hip fracture–
related comorbidity is a larger problem in men than in
0.0
0.1
0.2
0.3
0.4
0.5
0 10 20 30 40
Follow−up time (years)
all fractures
hip fractures
2 fractures
Fig. 2. Fracture incidence in 50-year-old men. Kaplan-Meier failure esti-
mates for a first fracture of any type, a first hip fracture, and first two
consecutive fractures from age 50 years in Swedish men in the Uppsala
Longitudinal Study of Adult Men (ULSAM).
Journal of Bone and Mineral Research PREDICTION OF FRACTURE RISK IN MEN 801

Table
2.Variationin
Fracture
RateExplained
byDifferentModels(R
2,%)an
drIDI
Fractures,n(%
)PYAR
Rate/1000
PYAR
R2(95%
confiden
ceinterval),%
rIDIa,%
(p)
VFRAXb
Comorbidity
modelc
Med
ication
modeld
Beh
avioral
modele
Fullmodelf
Anyfracture
duringfollow-up
From
50years
585(25)
61167.4
9.6
6.0
(3.5–9
.3)
1.8
(0.6–3
.7)
1.2
(0.3–2
.9)
6.9
(4.2–1
0.6)
11.7
(8.0–1
6.1)
44.5
(<0.001)
From
60years
416(22)
34830.6
11.9
4.3
(1.8–7
.8)
4.3
(1.8–7
.6)
4.6
(1.9–8
.4)
4.5
(2.3–7
.6)
14.1
(9.3–1
9.7)
177.1
(<0.001)
From
71years
254(21)
14297.6
17.8
4.8
(1.8–9
.7)
3.8
(1.3–7
.8)
4.0
(1.1–8
.6)
5.2
(2.0–1
0.7)
14.9
(9.2–2
2.6)
135.0
(<0.001)
From
82yearsg
64(12)
2473.5
25.9
17.1
(6.7–3
3.9)
9.9
(3.3–2
2.8)
18.9
(7.0–3
5.4)
14.1
(5.1–3
0.0)
46.1
(29.7–64.0)
235.5
(<0.001)
Anyfracture
within
10years
From
50years
126(5)
22075.7
5.7
14.3
(6.5–2
4.9)
6.1
(1.6–1
4.2)
1.7
(0.2–6
.7)
28.6
(17.7–4
2.5)
37.5
(25.8–51.3)
242.6
(<0.001)
From
60years
109(6)
16933.2
6.4
14.7
(5.2–2
8.8)
18.5
(8.3–3
3.2)
9.9
(2.9–2
0.8)
11.8
(4.9–2
1.6)
42.5
(27.6–59.5)
210.0
(<0.001)
From
71years
143(12)
10360.3
13.8
7.0
(2.5–1
5.2)
7.1
(2.4–1
4.4)
6.2
(1.7–1
4.2)
8.4
(3.2–1
6.7)
25.4
(15.6–37.5)
230.5
(<0.001)
From
82yearsg
64(12)
2473.5
25.9
17.1
(6.7–3
3.9)
9.9
(3.3–2
2.8)
18.9
(7.0–3
5.4)
14.1
(5.1–3
0.0)
46.1
(29.7–64.0)
235.5
(<0.001)
Twofractureswithin
10years
From
50years
29(1)
22553.3
1.3
19.3
(5.1–4
3.0)
11.7
(2.5–3
3.9)
5.5
(0.5–1
8.2)
44.2
(24.6–6
7.9)
61.4
(38.1–83.9)
358.7
(0.002)
From
60years
24(1)
17318.0
1.4
16.8
(5.1–4
1.1)
28.7
(10.9–5
1.3)
16.6
(6.1–3
5.5)
29.1
(11.3–5
4.1)
64.7
(43.8–86.0)
214.8
(0.020)
From
71years
39(3)
10780.1
3.6
14.6
(4.7–3
2.2)
22.8
(7.8–4
4.4)
23.5
(9.6–4
3.5)
22.5
(8.8–4
3.3)
65.1
(44.0–82.7)
1440(0.003)
From
82yearsh
15(3)
2583.2
5.8
33.1
(7.5–6
7.8)
53.9
(22.3–8
7.5)
77.6
(49.9–9
3.7)
68.9
(41.3–9
0.0)
98.4
(91.9–99.9)
2600(<
0.001)
Hip
fracture
duringfollow-up
From
50years
189(8)
66128.1
2.9
12.1
(6.0–2
1.2)
4.8
(1.1–1
0.8)
4.3
(0.9–1
0.2)
13.8
(7.5–2
2.8)
26.6
(17.1–37.4)
59.1
(0.003)
From
60years
150(8)
37201.8
4.0
12.5
(5.6–2
1.9)
9.7
(4.0–1
8.1)
9.9
(3.9–1
9.0)
11.1
(5.6–1
8.9)
34.5
(23.6–46.8)
168.5
(<0.001)
From
71years
100(8)
15239.4
6.6
28.0
(16.2–4
3.4)
9.0
(3.1–1
9.6)
9.7
(3.3–2
0.2)
19.7
(10.3–3
3.2)
54.5
(41.1–68.7)
63.3
(<0.001)
From
82yearsi
30(6)
2569.7
11.7
57.0
(29.8–8
1.9)
34.9
(15.9–6
0.0)
28.4
(10.0–5
7.6)
27.8
(9.0–5
8.1)
86.7
(67.3–97.0)
154.8
(<0.001)
Hip
fracture
within
10years
From
50years
9(0.4)
22623.6
0.4
Notan
alyzed
Notan
alyzed
Notan
alyzed
Notan
alyzed
Notan
alyzed
Notan
alyzed
From
60years
22(1)
17341.4
1.3
60.5
(27.8–8
7.6)
46.9
(19.8–7
6.1)
39.6
(16.5–6
9.4)
53.0
(27.4–8
5.0)
92.2
(71.8–99.3)
124.7
(0.013)
From
71years
41(3)
10792.8
3.8
40.7
(17.6–6
8.2)
24.8
(8.7–4
7.3)
14.9
(3.7–3
7.5)
42.1
(22.7–6
4.4)
81.7
(66.2–93.1)
117.4
(0.001)
From
82yearsi
30(6)
2569.7
11.7
57.0
(29.8–8
1.9)
34.9
(15.9–6
0.0)
28.4
(10.0–5
7.6)
27.8
(9.0–5
8.1)
86.7
(67.3–97.0)
154.8
(<0.001)
ATC
¼Anatomical
Therap
euticChem
ical
classificationsystem
;PYAR¼person-years
atrisk;rIDI¼
relative
integrateddiscrim
inationim
provemen
t;VFRAX¼FR
AXvariab
les.
arIDImeasuresim
provedpredictionwhen
comparingthefullmodel
withVFRAX.
bVFRAXincludes:ag
e,height,weight,curren
tsm
oking,highalcoholconsumption,previousfracture,secondaryosteo
porosis,rheu
matoid
arthritis,paren
tfracturedhip,an
dglucocorticoid
use.
cTh
ecomorbiditymodel
includes:number
ofcomorbidities,diabetes
mellitustype2,cardiovasculardisease,cancer,an
dother
comorbidities(includingsecondaryosteo
porosisan
drheumatoid
arthritis).
dTh
emed
icationmodel
includes
med
icationgrouped
into
themajorATC
groups.
eTh
ebeh
avioralmodel
includes
curren
tan
dform
ersm
oking,alcoholconsumption,leisure-tim
ean
dwork
physical
activity,civilstatus,ed
ucational
level,an
dim
pairedcognitivefunction.
f Thefullmodelisacombinationofb–ean
dincludes
allvariablesin
VFRAX,pluscomorbidity(number
ofcomorbidities,diabetes,cardiovasculardisease,can
cer,other),med
icationuse
(ATC
groups)an
dbehavioral
factors
(form
ersm
oking,leisure-tim
ean
dwork
physical
activity,civilstatus,ed
ucational
level,an
dim
pairedcognitivefunction).
gDuplicateinform
ation,follow-uptimefrom
82yearsismaxim
um
6.7
years,med
ian5.2
years.
hFo
llow-uptimefrom
82yearsismaxim
um
6.7
years,med
ian5.4
years.
i Duplicateinform
ation,follow-uptimefrom
82yearsismaxim
um
6.7
years,med
ian5.3
years.
802 BYBERG ET AL. Journal of Bone and Mineral Research
Fracture
0
20
40
60
80
100
50 60 71 82
Age at investigation
Fracture
0
20
40
60
80
100
R2
(%)
R2
(%)
R2
(%)
R2
(%)
R2
(%)
50 60 71 82
Age at investigation
Hip fracture
0
20
40
60
80
100
50 60 71 82
Age at investigation
Hip fracture<10 years
0
20
40
60
80
100
50 60 71 82
Age at investigation
VFRAX
+ comorbidity
+ medication
+ behavior
95% CI
Two fractures<10 years
0
20
40
60
80
100
50 60 71 82
Age at investigation
<10 years
Fig. 3. Nested models explained variation in fracture risk. Explained variation (R2, 95% confidence intervals) of risk of any fracture, two fractures, and hip
fracture, for nested models at different ages and for different follow-up times.
0
25
50
75
100
125
150
NR
I (%
), a
ny fr
actu
re w
ithin
10
year
s
50 60 71 82Age (years)
0
25
50
75
100
125
150
NR
I (%
), h
ip fr
actu
re w
ithin
10
year
s
50 60 71 82Age (years)
Fig. 4. Net reclassification improvement (NRI). NRI for prediction of any fracture (left panel) and hip fracture (right panel) when comparing the full model
with FRAX variables (VFRAX). Triangles (~) represent NRI among events, squares (&) NRI among nonevents, and circles (*) the combinedNRI with 95%
confidence interval error bars.
Journal of Bone and Mineral Research PREDICTION OF FRACTURE RISK IN MEN 803
Table
3.ComparisonofVFRAXan
dtheFu
llModel
VFRAXa
FullModelb
Rate/1000
PYARQ1
Rate/1000
PYARQ5
Hazardratio
(95%
CI)Q5versusQ1c
Sensitivity
(%)
OAPRd
Rate/1000
PYARQ1
Rate/1000
PYARQ5
Hazardratio
(95%
CI)Q5versusQ1c
Sensitivity
(%)
OAPRd
Anyfracture
within
10years
From
50years
2.4
9.6
3.99(2.05–7
.76)
22
1:7.7
1.8
13.0
7.44(3.54–1
5.64)
28
1:5.8
From
60years
4.1
10.9
2.67(1.43–4
.96)
18
1:8.3
3.7
15.9
4.27(2.31–7
.86)
22
1:6.6
From
71years
8.5
22.5
2.67(1.54–4
.62)
18
1:3.6
7.6
25.7
3.46(1.99–6
.01)
20
1:3.1
From
82yearse
12.8
44.3
3.43(1.44–8
.17)
20
1:2.4
7.4
58.0
7.74(2.69–2
2.25)
29
1:1.6
Twofractureswithin
10years
From
50years
0.66
3.5
5.34(1.55–1
8.46)
25
1:31
0.44
4.2
9.54(2.21–4
1.1)
31
1:24
From
60years
2.3
3.7
1.57(0.64–3
.83)
13
1:54
0.59
6.7
11.34(2.66–4
8.38)
34
1:21
From
71years
2.4
6.9
2.87(1.03–7
.96)
18
1:15
0.94
14.0
14.95(3.56–6
2.89)
37
1:7.2
From
82yearse
4.2
6.3
1.61(0.27–9
.64)
13
1:19
0.00
25.8
2.34��
1010(6.6��
109–8
.3��
1010)
100f
1:7.8f
Hip
fracture
within
10years
From
50years
na
na
na
na
na
na
na
na
na
na
From
60years
0.57
3.9
6.80(1.53–3
0.12)
27
1:28
0.28
4.2
15.04(1.98–1
14.4)
37
1:20
From
71years
1.9
9.3
5.02(1.71–1
4.76)
24
1:11
0.43
13.1
33.04(4.48–2
43.9)
48
1:5.3
From
82yearse
3.8
36.3
9.58(2.20–4
1.71)
31
1:3.7
1.9
41.0
22.29(2.97–1
67.1)
42
1:2.8
ATC
¼Anatomical
Therap
euticChem
ical
classificationsystem
;na¼notan
alyzed
;OAPR¼oddsofbeingaffected
given
apositive
result;PYAR¼person-years
atrisk;Q¼quintile;VFRAX¼FR
AXvariab
les.
aVFRAXincludes:ag
e,height,weight,curren
tsm
oker,highalcoholconsumption,previousfracture,secondaryosteo
porosis,rheu
matoid
arthritis,paren
tfracturedhip,an
dglucocorticoid
use.
bTh
efullmodelincludes
allvariablesinVFRAXan
d:comorbidity(number
ofcomorbidities,diabetes,cardiovasculardisease,can
cer,other),med
icationuse
(ATC
groups),beh
avioralfactors(form
ersm
oker,leisure-
timean
dwork
physical
activity,civilstatus,ed
ucational
level,an
dim
pairedcognitivefunction).
cHazardratioforhighest(Q5)versuslowest(Q1)quintileofpredictedfracture
rate,sen
sitivity
ofprediction,andtheoddsofhavingafracture
formen
inthehighestquintileat
differentag
esbasedonthetw
o
models.
dOddsofhavingafracture
while
beingin
highest20%
ofpredictedrisk.(35)
eRateisfor6.7
yearsoffollow-up.
f Calculatedman
ually
since
thecalculationtool(35)reached
itslim
it.
804 BYBERG ET AL. Journal of Bone and Mineral Research

women.(16,44) Recent studies from the United States(45) and
United Kingdom(46,47) also indicate that comorbidity information
can improve fracture prediction when added to the FRAX score.
Our results imply that modeling variables in FRAX (VFRAX) in a
population-based setting of men has a limited discriminative
capacity to identify those who will suffer a fracture in the future,
although the estimates for hip fractures seem better than for any
fracture, especially if BMD information is available. We were not
able to use the FRAX algorithm to calculate the FRAX score. The
predictive capacity of the FRAX variables (VFRAX) was, however,
similar to that shown by others using the FRAX algorithm.(46,48)
Further, the actual FRAX algorithm may have performed even
worse in our setting because it was developed as an average
score of several cohorts at different settings. Additionally, we
cannot tell how the other variables included in our analysis
would perform if added to the FRAX score itself.
One criticism of the FRAX algorithm is that it does not include
history of falls.(49) Fall history did not contribute markedly to our
full model at age 82 years, perhaps because fall history may be
related to factors already included in the model,(20,50) or because
is a too crude(50) or poor measure of impaired balance, or both.
The notion that fall history seemed to be of more importance
among the oldest age group is in line with previous research
findings of attenuated importance of BMD in osteoporotic
fracture risk prediction with increasing age.(12,51)
Because the risk of a subsequent fracture is highest in the year
after a first fracture, it has been suggested that identification of
those at high risk for recurrent fractures should be prioritized and
that the treatment should have short-term effects in order to
reduce the risk of a subsequent fracture.(52) Our full model
showed high prognostic value for two consecutive fracture
events.
The strengths of our study include the population-based
cohort of men with similar age, the high participation rate, long
follow-up, and extensive repeated investigations, and linkage
with official registers for the complete identification of all
fractures, comorbid conditions, and previous falls. We were also
able to assess the influence of competing risk from mortality.
Our study also has limitations. We did not use a validation
dataset. To limit overly optimistic estimates, R2, NRI, and
Harrell’s C were calculated as the medians of 1000 bootstrap
samples.(38) Self-reported medications may be underreported by
persons with polypharmacy or with a higher degree of cognitive
impairment, leading to attenuated influence of medication on
our estimates. BMD was only measured at the age 82 years
investigation. However, a recent study demonstrates that more
than 80% of patients with a FRAX designation of ‘‘high risk’’ of
any fracture, calculated without BMD, also had osteoporosis.(53)
Still, around 80% of all fractures in a similar setting did not have
osteoporosis.(7) Our cohort is relatively small, with a limited
number of fractures, especially after age 82 years, which means
that there is a risk of overfitting using our multivariable models.
However, the results point in the same direction for all ages and
outcomes, and taking the number of covariates into account(33)
did not change our conclusions. Finally, inclusion of only Swedish
men may limit generalization to women and other populations.
Prediction deals with several issues: determination of variables
that contribute to the explanation of variation in time to event,
predictive accuracy, and classification of individuals for clinical
decisions.(54) The first of these issues was investigated by the
prognostic (R2) values that were developed for time to event
data.(33) The models’ added discriminative ability was investi-
gated by the rIDI, and the improvement of risk classification was
measured as NRI. Although these twomeasures are suggested to
bemore sensitive estimates of discrimination and reclassification
than the C statistic,(34,36) we could see improved discrimination
with the full model also using the C statistic. In a recent reanalysis
of data, FRAX, compared to age and BMD alone, improved
the classification of fractures.(55) This improvement was not
observed using the C statistic.(4) The screening performance(35)
partly investigates individual classification. Although we can
demonstrate moderate to high prognostic values and improved
discrimination and reclassification with our full model, sensitivity
(discrimination at the individual level) was modest, a common
feature of prediction models.(56)
Some of the components of FRAX are naturally also included in
our other models. For instance, glucocorticoid use was included
in our medication model, rheumatoid arthritis and the other
diseases in VFRAX were included in our diseases model, and
current smoking and alcohol consumption were included in our
behavioral model., To avoid collinearity, these components were
not added twice when evaluating the full model or the nested
models. Therefore, it is essential to emphasize that each group of
variables added to VFRAX contributed to the predictive ability of
the full model, indicating that all categories are important.
One may argue that many comorbidities are known to
increase fracture risk and that they could be entered into the
FRAX tool as secondary causes of osteoporosis. Several of the
diseases in our comorbidity model were tested within the FRAX
cohorts in the development of FRAX, but it was concluded that
‘‘there was no evidence that these risk variables had any
significant importance for fracture’’ (eg, stroke: hazard ratio [HR]
for hip fracture, unadjusted for BMD; 1.20; 95% CI, 0.78–1.84).(57)
However, the lack of association might well be explained by a
self-selection phenomenon: frail individuals are less like likely to
be included in a cohort study. Yet two important strengths of the
FRAX tool are its availability and that it is easy to use for clinicians
without expert knowledge in the field of osteoporosis. We have
therefore used as secondary causes of osteoporosis those that
are suggested in the FRAX online tool. It should be emphasized
that the information used in our full model can be retrieved from
a patient’s medical record or by asking the patient. The ease with
which this is done will differ between settings. Moreover,
compilation of clinical risk factors will in the future also become
more easily accessible with the development of electronic
patient records.(58) A cognitive function test takes only a few
minutes to complete. Our results suggest that bone scans and
serum vitamin analyses could add further discriminatory
capacity. Future studies can investigate whether these markers
can guide the physician to whether the primary treatment of a
person at high risk should be focused toward improving bone
density or balance, or both.
Although we do not provide a ready tool for use by physicians
in their daily work, our results highlight the importance of
increased awareness of risk factors for fractures. It also
emphasizes that future prediction tools aiming at identifying
Journal of Bone and Mineral Research PREDICTION OF FRACTURE RISK IN MEN 805

people at high risk of fracture should include more information
on comorbidity, medication use, and behavioral factors than
what is currently included in the FRAX tool.
We conclude that fracture prediction in older men can be
considerably improved by the addition of easily accessible
clinical and behavioral risk factors to the variables included in
the FRAX algorithm. The full model was especially powerful for
identifying elderly men at high risk of hip fractures and those
with high risk of two fractures.
Disclosures
All authors state that they have no conflicts of interest.
Acknowledgments
This work was supported by the Swedish Research Council
and Uppsala University. The funders had no role in the design
and conduct of the study; collection, management, analysis, and
interpretation of the data; and preparation, review, or approval of
the manuscript.
Authors’ roles: Study design: LB and KM. Data collection: LB,
RG, TC, JS, LK, HM, and KM. Data analysis: LB. Data interpretation:
LB, RG, JS, LaB, LK, HM, and KM. Drafting manuscript: LB and KM.
Revising manuscript content and approving final version of
manuscript: LB, RG, TC, JS, LK, HM, and KM. LB takes responsibility
for the integrity of the data analysis.
References
1. Sambrook P, Cooper C. Osteoporosis. Lancet. 2006;367:2010–8.
2. Pike C, Birnbaum HG, Schiller M, Sharma H, Burge R, Edgell ET. Direct
and indirect costs of non-vertebral fracture patients with osteoporo-
sis in the US. Pharmacoeconomics. 2010;28:395–409.
3. Nelson HD, Haney EM, Dana T, Bougatsos C, Chou R. Screening for
osteoporosis: an update for the U.S. Preventive Services Task Force.
Ann Intern Med. 2010;153:99–111.
4. Ensrud KE, Lui L-Y, Taylor BC, Schousboe JT, Donaldson MG, Fink HA,Cauley JA, Hillier TA, Browner WS, Cummings SR; for the Study of
Osteoporotic Fractures Research Group. A comparison of prediction
models for fractures in older women: is more better? Arch InternMed.2009;169:2087–94.
5. Sandhu S, Nguyen N, Center J, Pocock N, Eisman J, Nguyen T.
Prognosis of fracture: evaluation of predictive accuracy of the FRAXTM
algorithm and Garvan nomogram. Osteoporos Int. 2010;21:863–71.
6. Silverman S, Calderon A. The utility and limitations of FRAX: A US
perspective. Curr Osteoporos Rep. 2010;8:192–7.
7. Siris ES, Chen Y-T, Abbott TA, Barrett-Connor E, Miller PD, Wehren LE,
Berger ML. Bone mineral density thresholds for pharmacologicalintervention to prevent fractures. Arch Intern Med. 2004;164:1108–
12.
8. Cummings SR, Melton LJ. Epidemiology and outcomes of osteopo-rotic fractures. Lancet. 2002;359:1761–7.
9. Michaelsson K, Melhus H, Ferm H, Ahlbom A, Pedersen NL. Genetic
liability to fractures in the elderly. Arch Intern Med. 2005;165:1825–
30.
10. Nuti R, Merlotti D, Francucci CM, Gennari L. Bone fragility in men:
where are we? J Endocrinol Invest. 2010;33:33–8.
11. Panel on Prevention of Falls in Older Persons, American Geriatrics
Society and British Geriatrics Society. Summary of the Updated
American Geriatrics Society/British Geriatrics Society Clinical PracticeGuideline for Prevention of Falls in Older Persons. J Am Geriatr Soc.
2011;59:148–57.
12. Jarvinen TLN, Sievanen H, Khan KM, Heinonen A, Kannus P. Shifting
the focus in fracture prevention from osteoporosis to falls. BMJ.2008;336:124–6.
13. Oliver D, Connelly JB, Victor CR, Shaw FE, Whitehead A, Genc Y, Vanoli
A, Martin FC, Gosney MA. Strategies to prevent falls and fractures inhospitals and care homes and effect of cognitive impairment:
systematic review and meta-analyses. BMJ. 2007;334:82.
14. Robertson MC, Campbell AJ, Gardner MM, Devlin N. Preventing
injuries in older people by preventing falls: a meta-analysis ofindividual-level data. J Am Geriatr Soc. 2002;50:905–11.
15. Sawka AM, Boulos P, Beattie K, Papaioannou A, Gafni A, Cranney A,
Hanley DA, Adachi JD, Papadimitropoulos EA, Thabane L. Hip pro-
tectors decrease hip fracture risk in elderly nursing home residents: aBayesian meta-analysis. J Clin Epidemiol. 2007;60:336–44.
16. Roche JJ, Wenn RT, Sahota O, Moran CG. Effect of comorbidities and
postoperative complications on mortality after hip fracture in elderly
people: prospective observational cohort study. BMJ. 2005;331:1374.
17. Farahmand BY, Persson PG, Michaelsson K, Baron JA, Parker MG,
Ljunghall S; for the Swedish Hip Fracture Study Group. Socioeco-
nomic status, marital status and hip fracture risk: a population-basedcase–control study. Osteoporos Int. 2000;11:803–38.
18. Michaelsson K, Olofsson H, Jensevik K, Larsson S, Mallmin H, Berglund
L, Vessby B, Melhus H. Leisure physical activity and the risk of fracture
in men. PLoS Med. 2007;4:e199.
19. Kanis JA, Oden A, Johansson H, Borgstrom F, Strom O, McCloskey E.
FRAX1 and its applications to clinical practice. Bone. 2009;44:734–43.
20. Kanis JA; on behalf of the World Health Organization Scientific
Group. Assessment of osteoporosis at the primary health-care level.Technical Report. Sheffield, UK: World Health Organization Collabo-
rating Centre for Metabolic Bone Diseases, University of Sheffield;
2007.
21. Byberg L, Melhus H, Gedeborg R, Sundstrom J, AhlbomA, Zethelius B,Berglund LG, Wolk A, Michaelsson K. Total mortality after changes in
leisure time physical activity in 50 year old men: 35 year follow-up of
population based cohort. BMJ. 2009;338:b688.
22. Kanis J, Johnell O, Oden A, Johansson H, McCloskey E. FRAXTM and
the assessment of fracture probability in men and women fromthe UK. Osteoporos Int. 2008;19:385–97.
23. Kanis J, Oden A, Johnell O, Johansson H, De Laet C, Brown J,
Burckhardt P, Cooper C, Christiansen C, Cummings S, Eisman J,
Fujiwara S, Gluer C, Goltzman D, Hans D, Krieg MA, La Croix A,
McCloskey E, MellstromD, Melton L, Pols H, Reeve J, Sanders K, SchottAM, Silman A, Torgerson D, van Staa T, Watts N, Yoshimura N. The use
of clinical risk factors enhances the performance of BMD in the
prediction of hip and osteoporotic fractures in men and women.
Osteoporos Int. 2007;18:1033–46.
24. Elixhauser A, Steiner C, Harris DR, Coffey RM. Comorbidity measuresfor use with administrative data. Med Care. 1998;36:8–27.
25. National Board of Health and Welfare. Historical classifications.
[Internet]. [cited 2011 December 18]. Available from: http://www.
socialstyrelsen.se/klassificeringochkoder/diagnoskoder/historiska-
klassifikationer.
26. WHO Collaborating Centre for Drug Statistics Methodology.The Anatomical Therapeutic Chemical (ATC) classification system.
[Internet]. [cited 2011 December 18]. Available from: http://www.
whocc.no/atc/structure_and_principles.
27. Slinin Y, Paudel ML, Taylor BC, Fink HA, Ishani A, Canales MT, Yaffe K,Barrett-Connor E, Orwoll ES, Shikany JM, LeBlanc ES, Cauley JA,
Ensrud KE; for the Osteoporotic Fractures in Men Study Research
Group. 25-Hydroxyvitamin D levels and cognitive performance and
decline in elderly men. Neurology. 2010;74:33–41.
806 BYBERG ET AL. Journal of Bone and Mineral Research

28. Ronnemaa E, Zethelius B, Sundelof J, Sundstrom J, Degerman-Gunnarsson M, Lannfelt L, Berne C, Kilander L. Glucose metabolism
and the risk of Alzheimer’s disease and dementia: a population-based
12 year follow-up study in 71-year-old men. Diabetologia. 2009;
52:1504–10.
29. Snellman G, Melhus H, Gedeborg R, Byberg L, Berglund L, Wernroth L,
Michaelsson K. Determining vitamin D status: a comparison between
commercially available assays. PLoS One. 2009;5:e11555.
30. Michaelsson K, Lithell H, Vessby B, Melhus H. Serum retinol levels and
the risk of fracture. N Engl J Med. 2003;348:287–94.
31. Michaelsson K, Lind L, Frystyk J, Flyvbjerg A, Gedeborg R, Berne C,
Zethelius B, Mallmin H, Soderberg S, Melhus H. Serum adiponectin inelderly men does not correlate with fracture risk. J Clin Endocrinol
Metab. 2008;93:4041–7.
32. Gedeborg R, Engquist H, Berglund L, Michaelsson K. Identification
of incident injuries in hospital discharge registers. Epidemiology.2008;19:860–7.
33. Royston P. Explained variation for survival models. Stata J. 2006;6:83–
96.
34. Pencina MJ, D’Agostino RB, Steyerberg EW. Extensions of net reclas-sification improvement calculations to measure usefulness of new
biomarkers. Stat Med. 2011;30:11–21.
35. Wald NJ, Morris JK. Assessing risk factors as potential screening tests:a simple assessment tool. Arch Intern Med. 2011;171:286–91.
36. Pencina MJ, D’Agostino RB, Vasan RS. Statistical methods for assess-
ment of added usefulness of new biomarkers. Clin Chem Lab Med.
2010;48:1703–11.
37. Sundstrom J, Byberg L, Gedeborg R, Michaelsson K, Berglund L.
Useful tests of usefulness of new risk factors: tools for assessing
reclassification and discrimination. Scand J Publ Health. 2011;39:439–
41.
38. Hielscher T, Zucknick M, Werft W, Benner A. On the prognostic value
of survival models with application to gene expression signatures.
Stat Med. 2010;29:818–29.
39. Engels JM, Diehr P. Imputation of missing longitudinal data: a
comparison of methods. J Clin Epidemiol. 2003;56:968–76.
40. Gillespie LD, Robertson MC, Gillespie WJ, Lamb SE, Gates S, Cumming
RG, Rowe BH. Interventions for preventing falls in older people livingin the community. Cochrane Database Syst Rev. 2009; CD007146.
41. Pit SW, Byles JE, Henry DA, Holt L, Hansen V, Bowman DA. A Quality
Use of Medicines program for general practitioners and older people:
a cluster randomised controlled trial. Med J Aust. 2007;187:23–30.
42. van der Velde N, Stricker BHC, Pols HAP, van der Cammen TJM. Risk of
falls after withdrawal of fall-risk-increasing drugs: a prospective
cohort study. Br J Clin Pharmacol. 2007;63:232–7.
43. Gillespie WJ, Gillespie LD, Parker MJ. Hip protectors for preventing
hip fractures in older people. Cochrane Database Syst Rev. 2010;CD001255.
44. Kannegaard PN, van der Mark S, Eiken P, Abrahamsen B. Excess
mortality in men compared with women following a hip fracture.
National analysis of comedications, comorbidity and survival. AgeAgeing. 2010;39:203–9.
45. Yun H, Delzell E, Ensrud KE, Kilgore ML, Becker D, Morrisey MA, Curtis
JR. Predicting hip and major osteoporotic fractures using adminis-
trative data. Arch Intern Med. 2010;170:1940–2.
46. Hippisley-Cox J, Coupland C. Predicting risk of osteoporotic fracture
in men and women in England and Wales: prospective derivation
and validation of QFractureScores. BMJ. 2009;339:b4229.
47. Collins GS, Mallett S, Altman DG. Predicting risk of osteoporotic and
hip fracture in the United Kingdom: prospective independent and
external validation of QFractureScores. BMJ. 2011;342:d3651.
48. Schwartz AV, Vittinghoff E, Bauer DC, Hillier TA, Strotmeyer ES, EnsrudKE, Donaldson MG, Cauley JA, Harris TB, Koster A, Womack CR,
Palermo L, Black DM. Association of BMD and FRAX score with
risk of fracture in older adults with type 2 diabetes. JAMA. 2011;
305:2184–92.
49. Binkley N, Lewiecki EM. The evolution of fracture risk estimation.
J Bone Miner Res. 2010;25:2098–100.
50. Wagner H, Melhus H, Gedeborg R, Pedersen NL, Michaelsson K.
Simply ask them about their balance—future fracture risk in anationwide cohort study of twins. Am J Epidemiol. 2009;169:
143–9.
51. Johnell O, Kanis JA, Oden A, Johansson H, De Laet C, Delmas P,Eisman JA, Fujiwara S, Kroger H, Mellstrom D, Meunier PJ, Melton LJ
3rd, O’Neill T, Pols H, Reeve J, Silman A, Tenenhouse A. Predictive
value of BMD for hip and other fractures. J Bone Miner Res.
2005;20:1185–94.
52. van Geel T, Huntjens K, van den Bergh J, Dinant G-J, Geusens P.
Timing of subsequent fractures after an initial fracture. Curr Osteo-
poros Rep. 2010;8:118–22.
53. Leslie WD, Majumdar SR, Lix LM, Johansson H, Oden A, McCloskey E,Kanis JA; for the Manitoba Bone Density Program. High fracture
probability with FRAX1 usually indicates densitometric osteoporosis:
implications for clinical practice. Osteoporos Int. Epub 2011 Mar 2.DOI: 10.1007/s00198-011-1592-3.
54. Lawless JF, Yuan Y. Estimation of prediction error for survival models.
Stat Med. 2010;29:262–74.
55. Donaldson MG, Cawthon PM, Schousboe JT, Ensrud KE, Lui L-Y,Cauley JA, Hillier TA, Taylor BC, Hochberg MC, Bauer DC, Cummings
SR; Study of Osteoporotic Fractures (SOF). Novel methods to evaluate
fracture risk models. J Bone Miner Res. 2011;26:1767–73.
56. Henderson R, Keiding N. Individual survival time prediction usingstatistical models. J Med Ethics. 2005;31:703–6.
57. Johansson H. Estimation of risk in the field of osteoporosis.
Gothenburg, Sweden: University of Gothenburg; 2011 April 15 [cited
2011 December 18]. Available from: http://hdl.handle.net/2077/24320.
58. Russell D, Stalhammar J, Bodegard J, Hasvold P, Thuresson M,
Kjeldsen SE. Cardiovascular events in subgroups of patients duringprimary treatment of hypertension with candesartan or losartan.
J Clin Hypertens. 2011;13:189–97.
Journal of Bone and Mineral Research PREDICTION OF FRACTURE RISK IN MEN 807
Related Documents