PREDICTION OF COEXISTENCE VAPOR-LIQUID DENSITIES FOR SUBSTANCES AND MIXTURES by ANDREAS SOEFAJIN, B.S.M.E. A THESIS IN PETROLEUM ENGINEERING Submitted to the Graduate Faculty of Texas Tech University in Partial Fulfillment of the Requirements for the Degree of MASTER OF SCIENCE IN PETROLEUM ENGINEERING Approved Akanni Lawal Chairperson of the Committee Paulus S. Adisoemarta Accepted John Borrelli Dean of the Graduate School May, 2005

Welcome message from author
This document is posted to help you gain knowledge. Please leave a comment to let me know what you think about it! Share it to your friends and learn new things together.
Transcript

PREDICTION OF COEXISTENCE VAPOR-LIQUID DENSITIES
FOR SUBSTANCES AND MIXTURES
by
ANDREAS SOEFAJIN, B.S.M.E.
A THESIS
IN
PETROLEUM ENGINEERING
Submitted to the Graduate Faculty of Texas Tech University in
Partial Fulfillment of the Requirements for
the Degree of
MASTER OF SCIENCE
IN
PETROLEUM ENGINEERING
Approved
Akanni Lawal Chairperson of the Committee
Paulus S. Adisoemarta
Accepted
John Borrelli Dean of the Graduate School
May, 2005

ACKNOWLEDGEMENTS
I am indebted to my supervisor Professor Akanni S. Lawal for guiding me
through all the phases of this thesis project. He has spent countless invaluable time, day
and night, and attention to mentor and support my effort in finishing the project. He was
extremely patient in explaining challenging materials. I am also indebted to Dr. Paulus S.
Adisoemarta and Dr. Lloyd Heinze for making a constructive suggestion and giving the
necessary support for this project. I am also very grateful to the financial support
received from the Center for Applied Petrophysical and Reservoir Studies and the
Department of Petroleum Engineering at Texas Tech University.
I also want to thank my colleagues Neeraj Kumar, Kaijuan Zou, Akindele Tododo
for the valuable discussions and insight to improve this work and to make my stay more
enjoyable.
Finally, I reserve my greatest gratitude to my family. I thank my father and
mother for giving the opportunity to study in Texas Tech University and for always
supporting my academic career, financially and psychologically. I also thank my brother
and sister for encouragement and support that have been given until this moment.
ii

TABLE OF CONTENTS
ACKNOWLEDGEMENT ii
ABSTRACT v
LIST OF TABLES vi
LIST OF FIGURES xii
NOMENCLATURES xv
CHAPTER
I. INTRODUCTION 1
1.1 Background Information 3
1.2 Statement of the Problem 6
1.3 Significance of the Project for Reservoir Simulation 7
1.4 Objective of the Project 8
II. REVIEW OF EQUATIONS-OF-STATE TECHNIQUES 10
2.1 Concepts of Cubic Equations-of-State 10
2.2 Lawal-Lake-Silberberg Equation-of-State 13
2.3 Selection of Equations of State for Reservoir Models 15
2.4 Transformed Cubic Equations of State 19
2.5 Resolving Near-Critical Fluid Phase Behavior 20
2.6 Generalized Fugacity Coefficient for Pure Substances 21
2.7 Generalized Fugacity Coefficient for Substances in Mixtures 22
III. ORTHOBARIC DENSITIES FOR SUBSTANCES 24
3.1 Algorithm for Resolving Phase Densities for Pure Substances 24
3.2 Estimation of Van der Waals Constant Parameter (Ωw) 26
3.3 Designed Attractive Temperature Functions 31
3.4 Second Virial Coefficient Calculation 38
3.5 Prediction of Phase Densities for Pure Hydrocarbons 43
3.6 Prediction of Phase Densities for Non-Hydrocarbons 46
3.7 Prediction of Phase Densities for Polar Substances 48
3.8 Prediction of Phase Densities for Miscellaneous Substances 50
iii

3.9 Prediction of Critical Densities for Pure Substances 53
3.10 Designed van der Waals Critical Limit for Pure Substances 54
3.11 Prediction of Virial Coefficient for Substances 55
IV. CRITICAL DENSITIES FOR BINARY MIXTURES 59
4.1 Critical Point for Mixtures by Analogy to Pure Substances 59
4.2 Critical Volume Prediction Methods 62
4.3 Critical Volume for Binary Hydrocarbon Systems 65
4.4 Critical Volume for Binary Non-Hydrocarbon Systems 66
4.5 Analysis of Prediction Results for Mixture Critical Volumes 66
V. CONCLUSIONS AND RECOMMENDATIONS 78
5.1 Conclusions 78
5.2 Recommendations 79
REFERENCES 80
APPENDICES 87
A. LAWAL-LAKE-SILBERBERG EQUATIONS OF STATE
A.1 Transformed LLS Equation of State.
A.2 Fugacity for LLS Equation of State.
A.3 Critical Volume Calculation Method.
B. FORTRAN PROGRAMS FOR VOLUMETRIC PROPERTIES
B.1 FORTRAN Program for Van Der Waals Limit (Ωw)
B.2 FORTRAN Program for Coexistence Densities
B.3 FORTRAN Program for Second Virial Coefficients
B.4 FORTRAN Program for Critical Densities of Mixtures
C. PREDICTION RESULTS FOR PURE SUBSTANCES
C.1 Results for the Lawal-Lake-Silberberg Equation of State
C.2 Results for the Peng-Robinson Equation of State
C.3 Results for the Soave-Redlich-Kwong Equation of State
87
87
90
92
95
95
101
118
125
137
137
178
214
iv
ABSTRACT
Knowledge of the critical state is important in any study of phase behavior;
therefore, the applications of critical state prediction methods can be found in many areas
of the petroleum and chemical industries. However, the vapor-liquid and volumetric
computations for reservoir fluid systems in the retrograde and near-critical regions still
remain a challenge. As a precursor in establishing a predictive equation of state for
compositional reservoir processes, a previously established four-parameter cubic
equation of state reported by Lawal-Lake-Silberberg (LLS) is used to predict orthobaric
densities, second virial coefficient and critical volumes of pure substances (hydrocarbon,
non-hydrocarbon, polar and non-polar fluids). The prediction results are generally within
0.5% of the experimental measurements.
A framework of the attractive temperature function is established for two
parameter (Peng-Robinson and Soave-Redlich-Kwong) and four parameter LLS
equations of state. The temperature function is demonstrated to be internally consistent
with the critical behavior of fluids at sub- and super-critical conditions and the function
does not suffer the difficulty encountered with Soave-type of temperature function which
hitherto has been major source of research in equations of state development.
An analysis of the thermodynamic constraint criteria of the critical state of pure
substances and binary mixtures is used to establish a theoretical expression for the van
der Waals critical point. The theoretical expression for the van der Waals criticality is
validated by the prediction results of binary critical volumes of asymmetric substances
and mixtures. This project offers an insight to the phase behavior of ternary and
multicomponent mixtures and the challenge for the future work is to apply this robust
method to the near-critical flash routine in ternary and multicomponent systems.
v
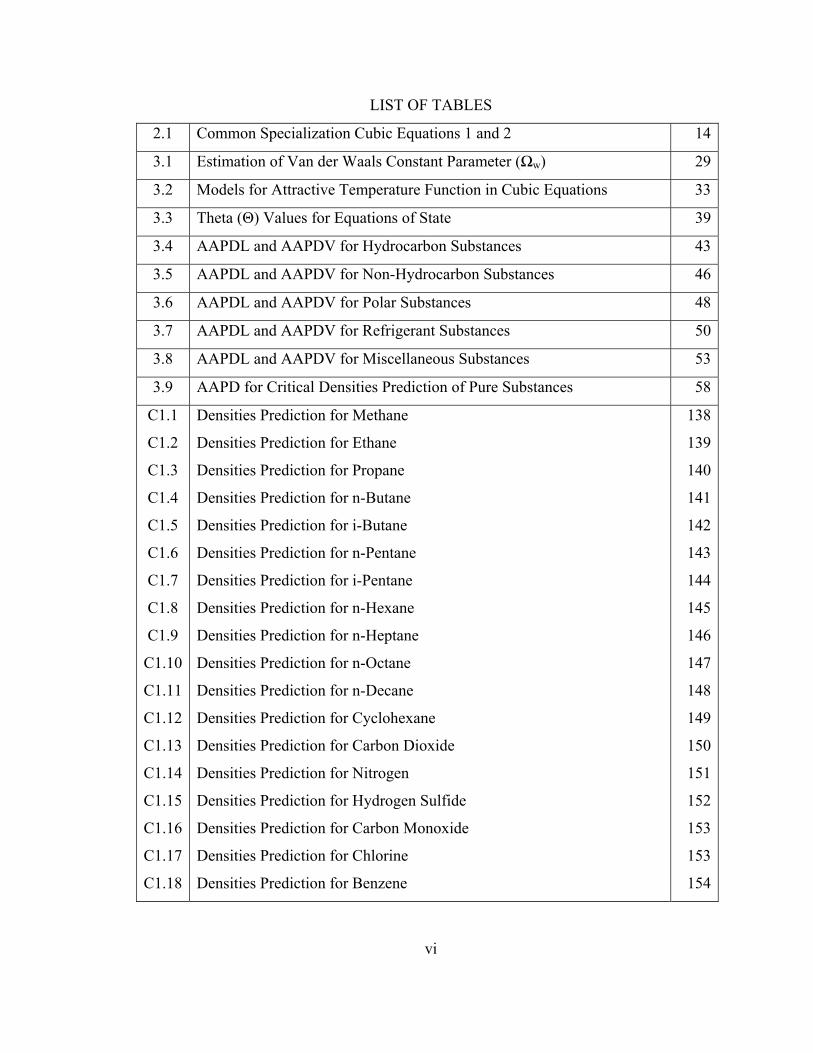
LIST OF TABLES
2.1 Common Specialization Cubic Equations 1 and 2 14
3.1 Estimation of Van der Waals Constant Parameter (Ωw) 29
3.2 Models for Attractive Temperature Function in Cubic Equations 33
3.3 Theta (Θ) Values for Equations of State 39
3.4 AAPDL and AAPDV for Hydrocarbon Substances 43
3.5 AAPDL and AAPDV for Non-Hydrocarbon Substances 46
3.6 AAPDL and AAPDV for Polar Substances 48
3.7 AAPDL and AAPDV for Refrigerant Substances 50
3.8 AAPDL and AAPDV for Miscellaneous Substances 53
3.9 AAPD for Critical Densities Prediction of Pure Substances 58
C1.1
C1.2
C1.3
C1.4
C1.5
C1.6
C1.7
C1.8
C1.9
C1.10
C1.11
C1.12
C1.13
C1.14
C1.15
C1.16
C1.17
C1.18
Densities Prediction for Methane
Densities Prediction for Ethane
Densities Prediction for Propane
Densities Prediction for n-Butane
Densities Prediction for i-Butane
Densities Prediction for n-Pentane
Densities Prediction for i-Pentane
Densities Prediction for n-Hexane
Densities Prediction for n-Heptane
Densities Prediction for n-Octane
Densities Prediction for n-Decane
Densities Prediction for Cyclohexane
Densities Prediction for Carbon Dioxide
Densities Prediction for Nitrogen
Densities Prediction for Hydrogen Sulfide
Densities Prediction for Carbon Monoxide
Densities Prediction for Chlorine
Densities Prediction for Benzene
138
139
140
141
142
143
144
145
146
147
148
149
150
151
152
153
153
154
vi
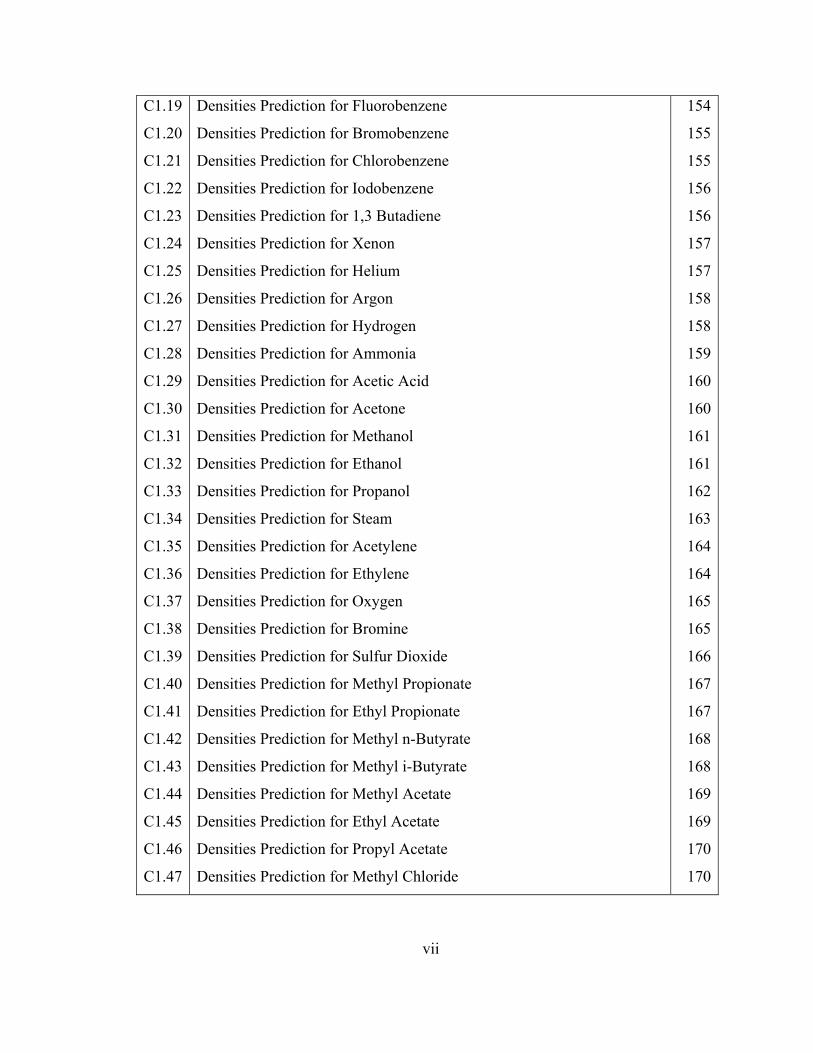
C1.19
C1.20
C1.21
C1.22
C1.23
C1.24
C1.25
C1.26
C1.27
C1.28
C1.29
C1.30
C1.31
C1.32
C1.33
C1.34
C1.35
C1.36
C1.37
C1.38
C1.39
C1.40
C1.41
C1.42
C1.43
C1.44
C1.45
C1.46
C1.47
Densities Prediction for Fluorobenzene
Densities Prediction for Bromobenzene
Densities Prediction for Chlorobenzene
Densities Prediction for Iodobenzene
Densities Prediction for 1,3 Butadiene
Densities Prediction for Xenon
Densities Prediction for Helium
Densities Prediction for Argon
Densities Prediction for Hydrogen
Densities Prediction for Ammonia
Densities Prediction for Acetic Acid
Densities Prediction for Acetone
Densities Prediction for Methanol
Densities Prediction for Ethanol
Densities Prediction for Propanol
Densities Prediction for Steam
Densities Prediction for Acetylene
Densities Prediction for Ethylene
Densities Prediction for Oxygen
Densities Prediction for Bromine
Densities Prediction for Sulfur Dioxide
Densities Prediction for Methyl Propionate
Densities Prediction for Ethyl Propionate
Densities Prediction for Methyl n-Butyrate
Densities Prediction for Methyl i-Butyrate
Densities Prediction for Methyl Acetate
Densities Prediction for Ethyl Acetate
Densities Prediction for Propyl Acetate
Densities Prediction for Methyl Chloride
154
155
155
156
156
157
157
158
158
159
160
160
161
161
162
163
164
164
165
165
166
167
167
168
168
169
169
170
170
vii
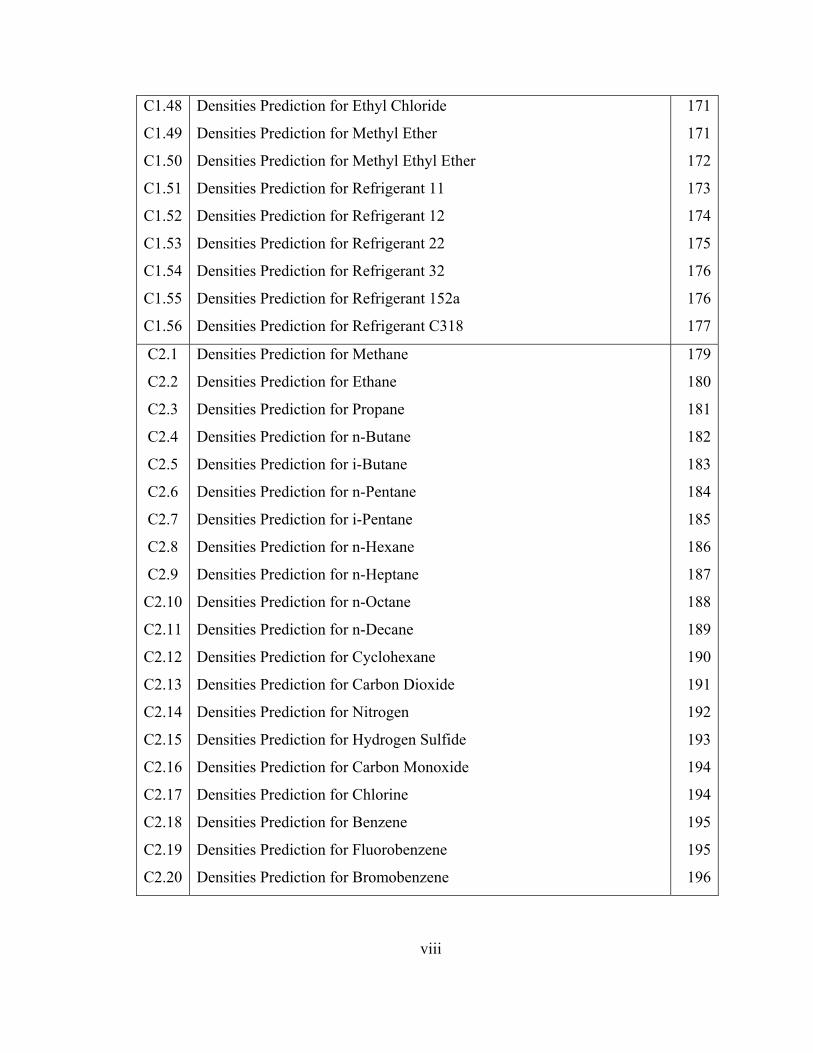
C1.48
C1.49
C1.50
C1.51
C1.52
C1.53
C1.54
C1.55
C1.56
Densities Prediction for Ethyl Chloride
Densities Prediction for Methyl Ether
Densities Prediction for Methyl Ethyl Ether
Densities Prediction for Refrigerant 11
Densities Prediction for Refrigerant 12
Densities Prediction for Refrigerant 22
Densities Prediction for Refrigerant 32
Densities Prediction for Refrigerant 152a
Densities Prediction for Refrigerant C318
171
171
172
173
174
175
176
176
177
C2.1
C2.2
C2.3
C2.4
C2.5
C2.6
C2.7
C2.8
C2.9
C2.10
C2.11
C2.12
C2.13
C2.14
C2.15
C2.16
C2.17
C2.18
C2.19
C2.20
Densities Prediction for Methane
Densities Prediction for Ethane
Densities Prediction for Propane
Densities Prediction for n-Butane
Densities Prediction for i-Butane
Densities Prediction for n-Pentane
Densities Prediction for i-Pentane
Densities Prediction for n-Hexane
Densities Prediction for n-Heptane
Densities Prediction for n-Octane
Densities Prediction for n-Decane
Densities Prediction for Cyclohexane
Densities Prediction for Carbon Dioxide
Densities Prediction for Nitrogen
Densities Prediction for Hydrogen Sulfide
Densities Prediction for Carbon Monoxide
Densities Prediction for Chlorine
Densities Prediction for Benzene
Densities Prediction for Fluorobenzene
Densities Prediction for Bromobenzene
179
180
181
182
183
184
185
186
187
188
189
190
191
192
193
194
194
195
195
196
viii
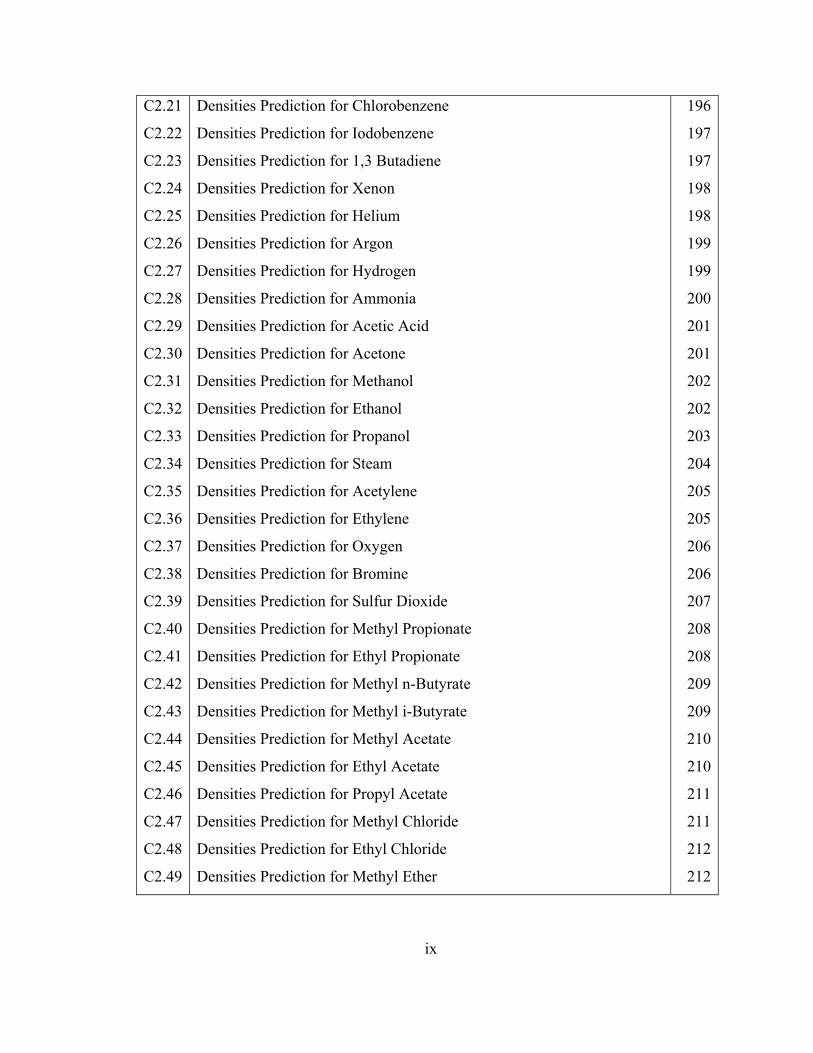
C2.21
C2.22
C2.23
C2.24
C2.25
C2.26
C2.27
C2.28
C2.29
C2.30
C2.31
C2.32
C2.33
C2.34
C2.35
C2.36
C2.37
C2.38
C2.39
C2.40
C2.41
C2.42
C2.43
C2.44
C2.45
C2.46
C2.47
C2.48
C2.49
Densities Prediction for Chlorobenzene
Densities Prediction for Iodobenzene
Densities Prediction for 1,3 Butadiene
Densities Prediction for Xenon
Densities Prediction for Helium
Densities Prediction for Argon
Densities Prediction for Hydrogen
Densities Prediction for Ammonia
Densities Prediction for Acetic Acid
Densities Prediction for Acetone
Densities Prediction for Methanol
Densities Prediction for Ethanol
Densities Prediction for Propanol
Densities Prediction for Steam
Densities Prediction for Acetylene
Densities Prediction for Ethylene
Densities Prediction for Oxygen
Densities Prediction for Bromine
Densities Prediction for Sulfur Dioxide
Densities Prediction for Methyl Propionate
Densities Prediction for Ethyl Propionate
Densities Prediction for Methyl n-Butyrate
Densities Prediction for Methyl i-Butyrate
Densities Prediction for Methyl Acetate
Densities Prediction for Ethyl Acetate
Densities Prediction for Propyl Acetate
Densities Prediction for Methyl Chloride
Densities Prediction for Ethyl Chloride
Densities Prediction for Methyl Ether
196
197
197
198
198
199
199
200
201
201
202
202
203
204
205
205
206
206
207
208
208
209
209
210
210
211
211
212
212
ix
C2.50 Densities Prediction for Methyl Ethyl Ether 213
C3.1
C3.2
C3.3
C3.4
C3.5
C3.6
C3.7
C3.8
C3.9
C3.10
C3.11
C3.12
C3.13
C3.14
C3.15
C3.16
C3.17
C3.18
C3.19
C3.20
C3.21
C3.22
C3.23
C3.24
C3.25
C3.26
C3.27
C3.28
Densities Prediction for Methane
Densities Prediction for Ethane
Densities Prediction for Propane
Densities Prediction for n-Butane
Densities Prediction for i-Butane
Densities Prediction for n-Pentane
Densities Prediction for i-Pentane
Densities Prediction for n-Hexane
Densities Prediction for n-Heptane
Densities Prediction for n-Octane
Densities Prediction for n-Decane
Densities Prediction for Cyclohexane
Densities Prediction for Carbon Dioxide
Densities Prediction for Nitrogen
Densities Prediction for Hydrogen Sulfide
Densities Prediction for Carbon Monoxide
Densities Prediction for Chlorine
Densities Prediction for Benzene
Densities Prediction for Fluorobenzene
Densities Prediction for Bromobenzene
Densities Prediction for Chlorobenzene
Densities Prediction for Iodobenzene
Densities Prediction for 1,3 Butadiene
Densities Prediction for Xenon
Densities Prediction for Helium
Densities Prediction for Argon
Densities Prediction for Hydrogen
Densities Prediction for Ammonia
215
216
217
218
219
220
221
222
223
224
225
226
227
228
229
230
230
231
231
232
232
233
233
234
234
235
235
236
x

C3.29
C3.30
C3.31
C3.32
C3.33
C3.34
C3.35
C3.36
C3.37
C3.38
C3.39
C3.40
C3.41
C3.42
C3.43
C3.44
C3.45
C3.46
C3.47
C3.48
C3.49
C3.50
Densities Prediction for Acetic Acid
Densities Prediction for Acetone
Densities Prediction for Methanol
Densities Prediction for Ethanol
Densities Prediction for Propanol
Densities Prediction for Steam
Densities Prediction for Acetylene
Densities Prediction for Ethylene
Densities Prediction for Oxygen
Densities Prediction for Bromine
Densities Prediction for Sulfur Dioxide
Densities Prediction for Methyl Propionate
Densities Prediction for Ethyl Propionate
Densities Prediction for Methyl n-Butyrate
Densities Prediction for Methyl i-Butyrate
Densities Prediction for Methyl Acetate
Densities Prediction for Ethyl Acetate
Densities Prediction for Propyl Acetate
Densities Prediction for Methyl Chloride
Densities Prediction for Ethyl Chloride
Densities Prediction for Methyl Ether
Densities Prediction for Methyl Ethyl Ether
237
237
238
238
239
240
241
241
242
242
243
244
244
245
245
246
246
247
248
248
249
249
xi

LIST OF FIGURES
1.1 Classifications of Petroleum Fluids 3
1.2 Prediction of Density for Hydrocarbon 5
1.3 Prediction of Density for Pure Substances 5
2.1 Pressure-Composition Diagram of Methane-Kensol 16 System 16
2.2 Critical Locus of Methane-Kensol 16 System 16
2.3 Prediction of ZC-Factor for Pure Substances 18
2.4 Prediction of ZC-Factor for Mixtures 18
3.1 Systematic Algorithm to Calculate Orthobaric Densities 25
3.2 Internal Tuning Parameter (Ωw) Effect on Densities Prediction of Methane 26
3.3 Systematic Algorithm to Estimate Ωw 27
3.4 Regression Analysis of Ωw 28
3.5 Attractive Functions for Soave-Redlich-Kwong Equation of State 34
3.6 Attractive Functions for Peng-Robinson Equation of State 34
3.7 New Attractive Functions for Peng-Robinson Equation of State 35
3.8 New Attractive Functions for Soave-Redlich-Kwong Equation of State 36
3.9 Attractive Functions for Lawal-Lake-Silberberg Equation of State 36
3.10 Slope of Reduced Pressures against Reduced Temperatures 37
3.11 Second Virial Coefficients for Substances 41
3.12 Second Virial Coefficients for n-Octane 41
3.13 Second Virial Coefficients for Argon 42
3.14 Second Virial Coefficients for Hydrogen 42
3.15 Second Virial Coefficients for HFC-114 43
3.16 Prediction of Phase Densities for Methane 44
3.17 Prediction of Phase Densities for n-Pentane 44
3.18 Prediction of Phase Densities for n-Hexane 45
3.19 Prediction of Phase Densities for n-Decane 45
3.20 Prediction of Phase Densities for Carbon Dioxide 46
3.21 Prediction of Phase Densities for Hydrogen Sulfide 47
xii
3.22 Prediction of Phase Densities for Nitrogen 47
3.23 Prediction of Phase Densities for Steam 48
3.24 Prediction of Phase Densities for Propyl Acetate 49
3.25 Prediction of Phase Densities for Methanol 49
3.26 Prediction of Phase Densities for Ethanol 50
3.27 Prediction of Phase Densities for Refrigerant 32 51
3.28 Prediction of Phase Densities for Refrigerant 152a 51
3.29 Prediction of Phase Densities for Refrigerant 134a 52
3.30 Prediction of Phase Densities for Refrigerant 227 52
3.31 Prediction of Phase Densities for Argon 53
3.32 Prediction of Phase Densities for Sulfur Dioxide 54
3.33 Prediction of Critical Densities for Hydrocarbon Substances 56
3.34 Prediction of Critical Densities for Non-Hydrocarbon Substances 56
3.35 Prediction of Critical Densities for Polar Substances 57
3.36 Prediction of Critical Densities for Refrigerant Substances 57
4.1 Pressure-Temperature Diagram for Pure Substances 59
4.2 Pressure-volume Diagram for Pure Substances 60
4.3 Pressure-Temperature Diagram for Mixtures 61
4.4 Pressure-volume Diagram for Mixtures 61
4.5 Predicted Critical Volume in Methane-Propane System 67
4.6 Predicted Critical Volume in Methane-n-Butane System 67
4.7 Predicted Critical Volume in Methane-n-Pentane System 68
4.8 Predicted Critical Volume in Methane-n-Decane System 68
4.9 Predicted Critical Volume in Ethane-n-Butane System 69
4.10 Predicted Critical Volume in Ethane-n-Heptane System 69
4.11 Predicted Critical Volume in Ethane-n-Decane System 70
4.12 Predicted Critical Volume in Propane-n-Butane System 70
4.13 Predicted Critical Volume in Propane-n-Pentane System 71
4.14 Predicted Critical Volume in Propane-n-Hexane System 71
xiii
4.15 Predicted Critical Volume in Propane-n-Octane System 72
4.16 Predicted Critical Volume in Propane-n-Decane System 72
4.17 Predicted Critical Volume in n-Butane-n-Pentane System 73
4.18 Predicted Critical Volume in n-Butane-n-Hexane System 73
4.19 Predicted Critical Volume in n-Butane-n-Heptane System 74
4.20 Predicted Critical Volume in n-Butane-n-Octane System 74
4.21 Predicted Critical Volume in n-Butane-n-Decane System 75
4.22 Predicted Critical Volume in Carbon Dioxide-Hydrogen Sulfured System 75
4.23 Predicted Critical Volume in Carbon Dioxide-n-Butane System 76
4.24 Predicted Critical Volume in Carbon Dioxide-Hexane System 76
4.25 Predicted Critical Volume in Carbon Dioxide-Decane System 77
xiv
NOMENCLATURES
Symbol Definition
a Attractive Term of EOS
A Dimensionless Attractive Term
b van der Waals co-Volume
B Dimensionless Critical Volume
f Fugacity
n Number of moles
M Molecular Weight
P Pressure
R Universal Gas Constant
T Temperature
v Molar Volume
x Mole Fraction
Z Compressibility Factor
Fugr Fugacity Ratio
AAPDL Average Absolute Percentage Deviation of Liquid
AAPDV Average Absolute Percentage Deviation of Vapor
DEVL Liquid State Deviation
DEVG Vapor State Deviation
Subscript
i, j Component Code
1,2 Component Index
C Critical Property
l Liquid Phase
v Vapor Phase
m Mixture
w van der Waals Volume Limit Representation
xv
R Reduced property
Greek Letter
α LLS EOS Parameter
αij Binary Interaction Parameter of α
β LLS EOS Parameter
βij Binary Interaction Parameter β
θa Dimensionless parameter of Attrative Term
ρ Density
ω Acentric Factor
Ωw Van der Waals Constant Parameter
xvi
CHAPTER I
INTRODUCTION
A complete knowledge of phase behavior of substances and multi-component
mixtures is imperative in the petroleum and chemical processes. The reservoir fluid
characterization, reservoir simulation practices and fluid separation processes are some of
the fields where those phase behavior knowledge can be applied. Particular emphasizes
have been given for the phase behavior equilibrium of vapor and liquid in two-phase and
near critical point regions. Two-phase is the region where both the vapor and liquid have
distinct properties such as densities, compressibility factors and viscosities; while the
critical point is the point where there are no properties separations between two phases.
Of interest for petroleum engineers are the vapor and liquid phases. All known substances
have one point where properties distinction between vapor and liquid no longer exist.
This point is the critical point for that component.
Vapor and liquid properties such as volume and density of pure substances and
multi component mixtures at a fixed temperature and pressure can be determined
experimentally or analytically. Due to the high cost, time constraint and apparatus
limitation associated with experimental testing, especially those dealing with multi-
component mixtures at high pressure, laboratory measurement is no longer the preferred
way to measure the thermodynamic properties. Furthermore, in the absence of
experimental data, a robust analytical method is required to supply those values. Hence,
analytical solution has been given more attention to predict or estimate these properties.
Analytical approach ranges from a simple empirical correlation through detailed
thermodynamic approach have been studied. Analytical vapor-liquid equilibrium can be
studied by applying fundamental principle of Gibbs’ free energy,26 65 Wilson
renormalization22 and Van der Waals’ type cubic equations of state.92 Of those
fundamental principles, the van der Waals-derived cubic equation of state has been the
most commonly used and reported in the physical properties calculation. Van der Waals
also introduced law of corresponding states principles which stated that intermolecular
1

forces dependent properties in equilibrium relates with the critical properties
universally.65 The law is the single most significant foundation to develop the analytical
tools for vapor and liquid properties prediction. The van der Waals- type cubic equation
of state is a very valuable prediction method for the binary mixtures and can be extended
to analyze the multi-component hydrocarbon mixtures which of interest to the petroleum
engineer.
In most instances, petroleum industry deals with vapor and liquid phases. The
knowledge of volumetric properties for vapor and liquid phases in equilibrium is an
important tool for any part of petroleum operation. In upstream operation that includes
fluid reserves estimation, reserves depletion techniques, reservoir simulation practices, a
better understanding of vapor and liquid phases can improve the estimation and recovery
of the prospective reserve in the subsurface. For enhance recovery technique practices
such as miscible flooding of CO2 or chemical injections, with several assumptions, the
knowledge of reliable convergence of vapor and liquid properties can be applied to make
multi contact miscibility (MCM) computation. The knowledge can also be extended for
Constant Volume Depletion (CVD) and Constant Composition Expansion calculations.
The vapor and liquid properties prediction can also serve as a tool to determine the
economic prospect of the reserves. The benefit of a better vapor-liquid prediction for the
midstream and downstream operation is determining the size of the separator, heat
exchanger and pipeline to deliver the recovered hydrocarbon. The accurate estimation
reduces many of unnecessary expenses. It is vital to have a robust technique to determine
thermodynamic vapor and liquid properties.
At present, research interests are focused to make accurate prediction of liquid
density and critical properties, to find the extrapolation of a-function to supercritical
temperatures (TR>1), to analyze phase behavior in a high pressure thermodynamic
equilibria and to make a predictive equation of state for transport properties (Viscosity
and Thermal Conductivity) based on the thermodynamic model. One tool to solve these
problems is Equations of State. The most celebrated Equations of State was introduced by
Johannes Didderick van der Waals in 1873. Since that moment, many modifications and
2

alterations of the van der Waals Equations of State have been made, such as the one by
Redlich-Kwong, Soave, Peng-Robinson and Lawal-Lake-Silberberg. Thousands of
papers and publications have been published regarding the prediction of thermodynamic
properties for substances and mixtures using Equations of State method. Yet, the current
available methods still have shortcomings predicting the thermodynamic properties of
pure substances and multi-component mixtures especially those at or near critical point at
high pressure.
This project shows a robust method to predict the thermodynamic properties for
pure substances and multi-component mixtures in equilibrium using the Lawal-Lake-
Silberberg equation of state.
1.1 Background Information
Allen classified the petroleum fluid based on the critical properties. This
classification can be seen in Figure 1.1.
Dry Gas e
l
3
Crude Oi
Volatile Oil
Gas Condensat
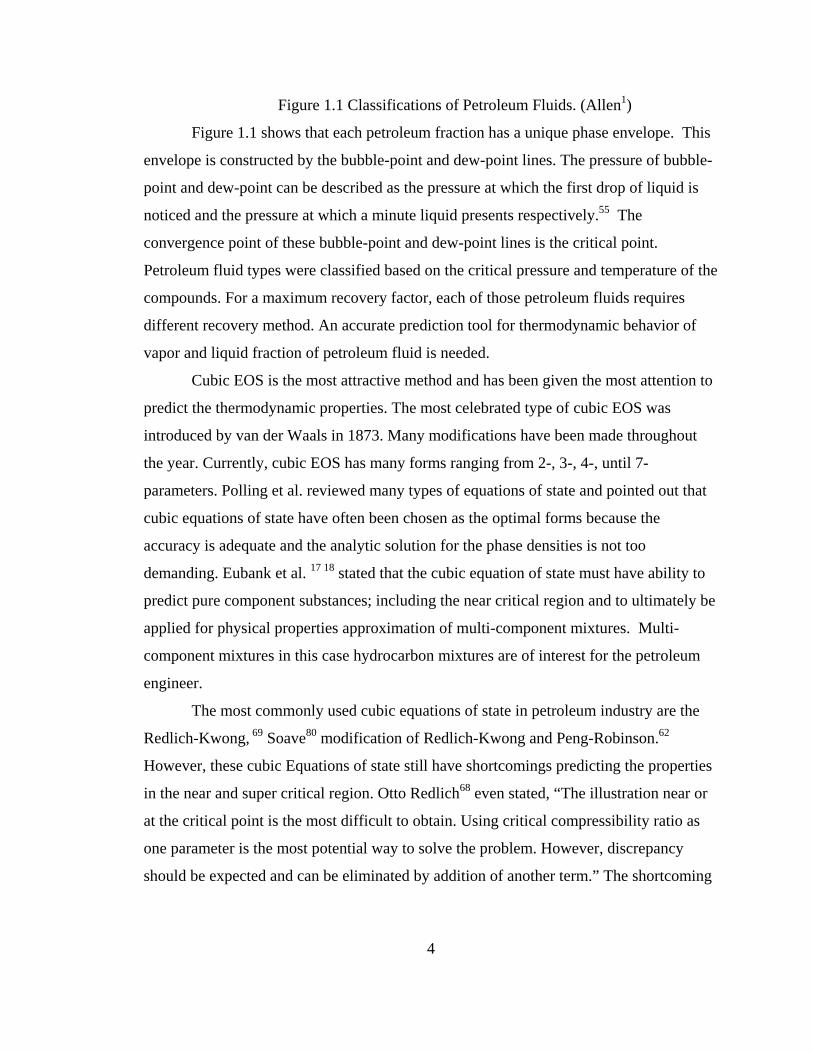
Figure 1.1 Classifications of Petroleum Fluids. (Allen1)
Figure 1.1 shows that each petroleum fraction has a unique phase envelope. This
envelope is constructed by the bubble-point and dew-point lines. The pressure of bubble-
point and dew-point can be described as the pressure at which the first drop of liquid is
noticed and the pressure at which a minute liquid presents respectively.55 The
convergence point of these bubble-point and dew-point lines is the critical point.
Petroleum fluid types were classified based on the critical pressure and temperature of the
compounds. For a maximum recovery factor, each of those petroleum fluids requires
different recovery method. An accurate prediction tool for thermodynamic behavior of
vapor and liquid fraction of petroleum fluid is needed.
Cubic EOS is the most attractive method and has been given the most attention to
predict the thermodynamic properties. The most celebrated type of cubic EOS was
introduced by van der Waals in 1873. Many modifications have been made throughout
the year. Currently, cubic EOS has many forms ranging from 2-, 3-, 4-, until 7-
parameters. Polling et al. reviewed many types of equations of state and pointed out that
cubic equations of state have often been chosen as the optimal forms because the
accuracy is adequate and the analytic solution for the phase densities is not too
demanding. Eubank et al. 17 18 stated that the cubic equation of state must have ability to
predict pure component substances; including the near critical region and to ultimately be
applied for physical properties approximation of multi-component mixtures. Multi-
component mixtures in this case hydrocarbon mixtures are of interest for the petroleum
engineer.
The most commonly used cubic equations of state in petroleum industry are the
Redlich-Kwong, 69 Soave80 modification of Redlich-Kwong and Peng-Robinson.62
However, these cubic Equations of state still have shortcomings predicting the properties
in the near and super critical region. Otto Redlich68 even stated, “The illustration near or
at the critical point is the most difficult to obtain. Using critical compressibility ratio as
one parameter is the most potential way to solve the problem. However, discrepancy
should be expected and can be eliminated by addition of another term.” The shortcoming
4
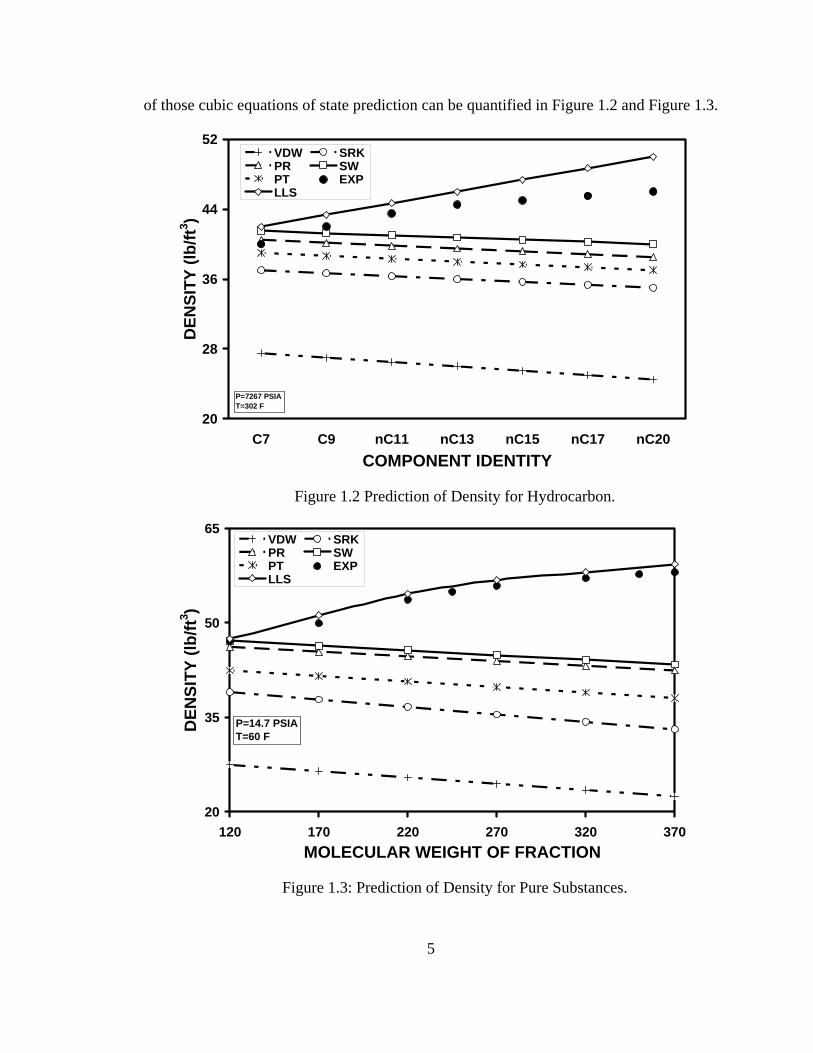
of those cubic equations of state prediction can be quantified in Figure 1.2 and Figure 1.3.
20
28
36
44
52
C7 C9 nC11 nC13 nC15 nC17 nC20COMPONENT IDENTITY
DEN
SITY
(lb/
ft3 )
VDW SRKPR SWPT EXPLLS
P=7267 PSIAT=302 F
Figure 1.2 Prediction of Density for Hydrocarbon.
20
35
50
65
120 170 220 270 320 370MOLECULAR WEIGHT OF FRACTION
DEN
SITY
(lb/
ft3 )
VDW SRKPR SWPT EXPLLS
P=14.7 PSIAT=60 F
Figure 1.3: Prediction of Density for Pure Substances.
5

Figure 1.2 shows the density prediction for several hydrocarbon substances while
Figure 1.3 shows the density prediction as a function of molecular weight. In both
figures, the experimental density has an increasing trend as the molecular weight
increases. The LLS EOS is the only one that follows the same trend as the experimental
values; every other cubic equation of state has a decreasing trend. This inverse trend
magnified the discrepancies between experimental data and cubic equation of state
prediction as the molecular weight increases.
1.2 Statement of the Problem
A reliable method that can approximate the coexistence of vapor-liquid densities
is invaluable in all aspect of petroleum industry. Buxton et al. said that the principle of
corresponding states has been the most widely used of predicting volumetric properties of
gas. The law of corresponding states was introduced by van der Waals. Ever since the
introduction by van der Waals in his famous dissertation about cubic equation of state
many adjustment have been made to predict the thermodynamic properties of substances.
Polling et al. stated that due to the substance’s pressure and temperature sensitivity,
reliable experimental data and EOS predictions in near critical and high pressure region
are hard to attain. Kaliappan et al.35 stated, “Petroleum engineer is interested in the P-T
envelope that describes the fluid existing in a given reservoir.”
The current methods of predicting the volumetric properties near the critical point
and at supercritical region still have limitations. In the near critical region, limitations can
be caused by the fixed values of some parameters use in the calculation (P-R, S-R-K, and
VDW). Sims et al.76 stated that cubic equation of state such as the Peng-Robinson and
Redlich-Kwong fail to converge or are inaccurate in the critical region. Yang et al.97
stated, “Current methods to predict the coexistence of vapor-liquid densities, especially
those for mixtures cannot yield accurate and continuous density-predictions, especially in
the near critical region.” Firoozabadi et al. 20 stated, “All van der Waals-type equation of
state fail to perform satisfactorily in the critical region for binary and multicomponent
systems with a widespread volatility.” Chou et al.7 pointed out that the “classical” cubic
6
EOS such as Redlich-Kwong and Peng-Robinson derivation of van der Waals equation of
state failed to correctly represent thermodynamic properties in the near critical area. In
the supercritical region, some of the shortcomings can be attributed to the inaccuracy of
the temperature dependent attractive function. The most popular attractive function was
proposed by Soave. Many modifications have been made to the original Soave attractive
function, yet the limitation still exists. Segura et al.78 argue that there is a physical
inconsistency for Soave-type attractive function. Twu et al. 89 90 stated that although the
Soave-type attractive function is the most widely used, it becomes zero at finite
temperature and then increases as the temperature reaches infinity. Also, the Soave
function is not suitable for polar component.
1.3 Significance of the Project for Reservoir Simulation
Reservoir simulation has become so popular in petroleum industry that all current
and future oil production can be evaluated by a reservoir simulation package. Keith
Coats8 stated that in reservoir simulation practices, the question is not whether, but how
and how much. A reliable and accurate calculation of vapor-liquid equilibrium is
essential for the compositional 70 and enhanced oil recovery (EOR) 76 simulation. This
calculation can widely range from the two-phase region to at or near critical point.
Reservoir fluids, whether that is dry gas, wet gas or condensate, consist of many
components that do not always have a complete quantitative density data. Although these
data sets can be measured through a laboratory experiment, it is not be cost effective. The
equation of state is an attractive tool to supply those values and has been the backbone of
reservoir fluid properties prediction in reservoir simulation software package. Rowe
pointed out that to predict the phase composition; the correlation has to be internally
consistent, reasonably accurate and reliable, without discontinuity and must not require
excessive computer time. Saeedi et al.74 stated that a necessary condition, for
compositional simulation to be meaningful, is that the oil and gas phase densities and
viscosities should approach the critical point in a consistent and stable manner. However,
the current equation of state methods, which are employed in many simulation packages,
7

cannot accurately and continuously predict these properties, especially when dealing with
high molecular weight substances and mixtures such as C7+. Failing to accurately predict
these properties can result in inaccuracy reserves estimation and misinterpretation of the
reservoir fluid types.
1.4 Objective of the Project
The purpose of the project is to provide a robust calculation technique for
predicting the volumetric properties of substances, binary and ternary mixtures. To
accomplish this goal, several objectives have been set and listed:
1. To gather experimental data sets for pure substances and multi component
mixtures.
2. To determine the Van der Waals critical limit parameter (Ωw) for pure substances
that is consistent with the coexistence vapor-liquid phase densities.
3. To utilize Lawal-Lake-Silberberg equation of state as the foundation in building a
closed form van der Waals density prediction in subcritical, critical and
supercritical region.
4. To resolve the near critical saturation densities calculation for pure substances.
5. To design a robust attractive-temperature function for cubic equations of state.
6. To predict the vapor pressure for pure substances.
7. To predict the critical volume of multi-component mixtures.
To achieve those objectives, this report has been divided into five chapters.
Following a brief introduction of the problem, the proposed solution method and equation
of state technique is reviewed in Chapter 2. This chapter discusses the available method,
explains the concept of equations of state and stated reasoning behind the selection of the
Lawal-Lake-Silberberg equation of state. The prediction results of orthobaric densities
for pure substances are stated in Chapter 3, followed by the prediction of critical volume
8
for mixtures in Chapter 4. Finally, project conclusions and recommendations for future
work are stated in Chapter 5.
9
CHAPTER II
REVIEW OF EQUATIONS-OF-STATE TECHNIQUES
Thermodynamic properties can be predicted experimentally or analytically. Due
to the cost and difficulty associated in conducting the experiment, analytical solutions
have become the more preferred way to predict thermodynamic properties such as density
and vapor pressure. The analytical solutions can be based by Gibbs excess energy,
empirical solution and Equations of State. There are many types of equation of state such
as cubic, virial, empirical, crossover, chemical theory and perturbation model. Poling et
al. 65 reviewed many types of equation of state and stated “cubic Equations of State have
often been chosen as the optimal forms because the accuracy is adequate and the analytic
solution for the phase densities is not too demanding.” The most celebrated type of
equation of state is the van der Waals-derived equation of state. This chapter reviews the
equations of state techniques.
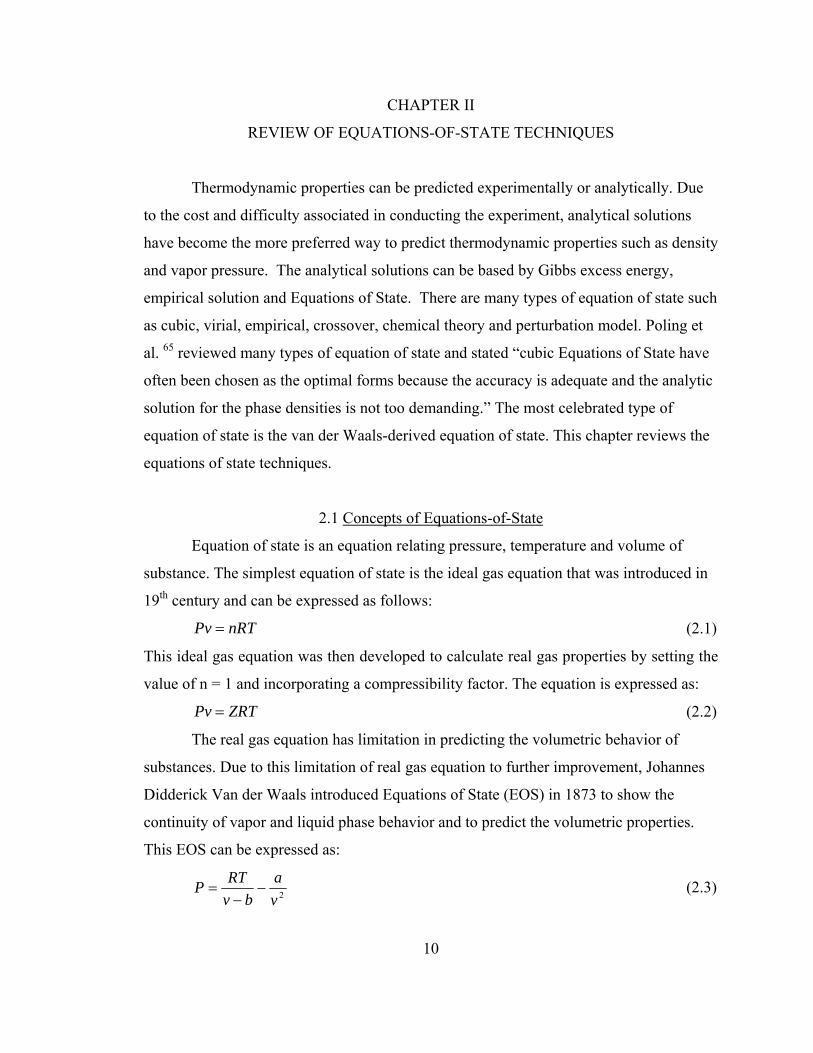
2.1 Concepts of Equations-of-State
Equation of state is an equation relating pressure, temperature and volume of
substance. The simplest equation of state is the ideal gas equation that was introduced in
19th century and can be expressed as follows:
nRTPv = (2.1)
This ideal gas equation was then developed to calculate real gas properties by setting the
value of n = 1 and incorporating a compressibility factor. The equation is expressed as:
ZRTPv = (2.2)
The real gas equation has limitation in predicting the volumetric behavior of
substances. Due to this limitation of real gas equation to further improvement, Johannes
Didderick Van der Waals introduced Equations of State (EOS) in 1873 to show the
continuity of vapor and liquid phase behavior and to predict the volumetric properties.
This EOS can be expressed as:
2va
bvRTP −−
= (2.3)
10

The boundary conditions or stability constraints at the critical point are set as:
0=⎟⎠⎞
⎜⎝⎛∂∂
CTvP (2.4)
02
2
=⎟⎟⎠
⎞⎜⎜⎝
⎛∂∂
CTvP (2.5)
Van der Waals separated Equation 2.3 into repulsive term and
attractive function of . Using the boundary conditions, parameters , which are
constant values and were calculated based on PVT experiment, can be expressed as:
)/( bvRT −
2/ va ba and
C
CC P
TRTa
22
421875.0)( = (2.6)
C
C
PRT
b81
= (2.7)
This EOS was originally developed for pure substances and was good enough to predict
the thermodynamic properties of substances at region far from the critical.
Since the van der Waals introduction of EOS, many adjustments have been made
to better predict the gas and liquid properties of substances. The adjustment can be
classified to so-called “classical” and “non-classical” EOS. The “classical” Equations of
state are the Redlich-Kwong, Peng-Robinson and Soave modification of Redlich-Kwong.
In 1949, Otto Redlich and J.N.S Kwong proposed a new EOS. By this time, there
are already 200 EOS available and most of them are Van der Waals modifications.91
Redlich-Kwong EOS can be described as:
)()(
bvvTa
bvRTP C
+−
−=
α (2.9)
At the critical point by applying the boundary conditions of Equation 2.4 and Equation
2.5 parameters yielded the following: ba and
C
CC P
TRTa
5.22
4278.0)( = (2.10)
( ) )()( TTaTa iCi α= (2.11)
11
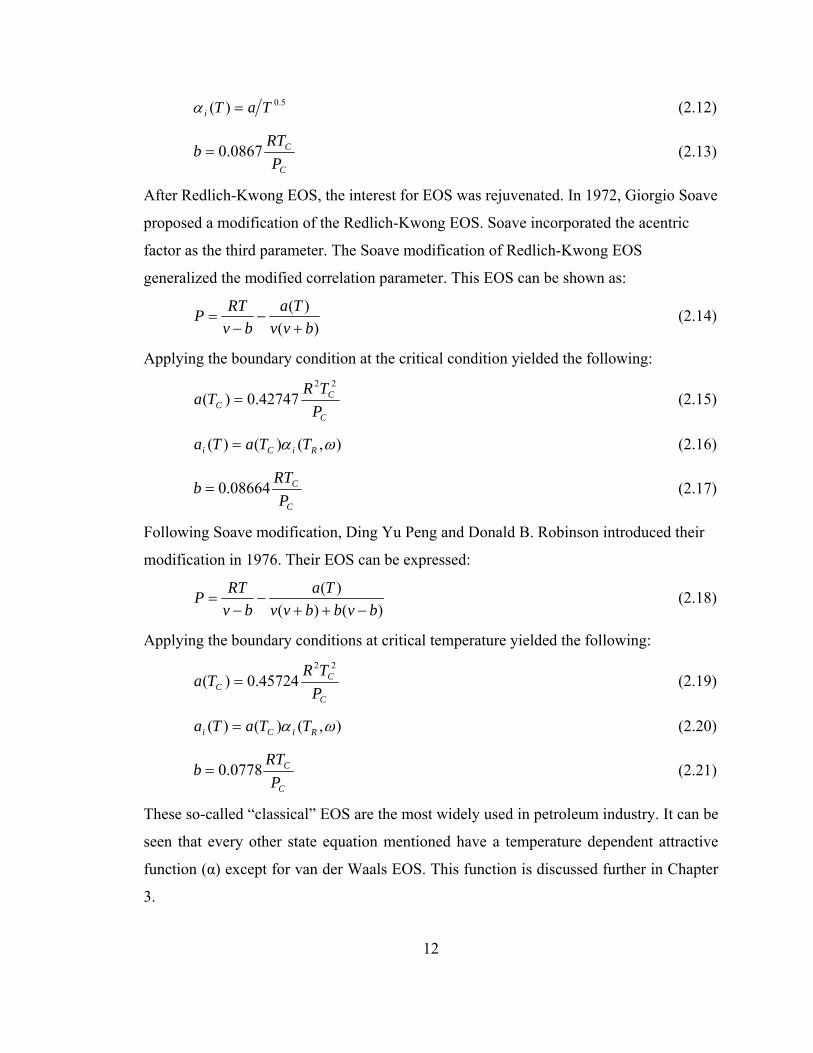
5.0)( TaTi =α (2.12)
C
C
PRT
b 0867.0= (2.13)
After Redlich-Kwong EOS, the interest for EOS was rejuvenated. In 1972, Giorgio Soave
proposed a modification of the Redlich-Kwong EOS. Soave incorporated the acentric
factor as the third parameter. The Soave modification of Redlich-Kwong EOS
generalized the modified correlation parameter. This EOS can be shown as:
)()(bvv
Tabv
RTP+
−−
= (2.14)
Applying the boundary condition at the critical condition yielded the following:
C
CC P
TRTa
22
42747.0)( = (2.15)
),()()( ωα RiCi TTaTa = (2.16)
C
C
PRT
b 08664.0= (2.17)
Following Soave modification, Ding Yu Peng and Donald B. Robinson introduced their
modification in 1976. Their EOS can be expressed:
)()()(
bvbbvvTa
bvRTP
−++−
−= (2.18)
Applying the boundary conditions at critical temperature yielded the following:
C
CC P
TRTa
22
45724.0)( = (2.19)
),()()( ωα RiCi TTaTa = (2.20)
C
C
PRT
b 0778.0= (2.21)
These so-called “classical” EOS are the most widely used in petroleum industry. It can be
seen that every other state equation mentioned have a temperature dependent attractive
function (α) except for van der Waals EOS. This function is discussed further in Chapter
3.
12
In addition to those Equations of state, many more modifications to van der Waals
EOS were made such as Patel-Teja, Trebble-Bishnoi, Schmidt-Wenzel, Twu-Sim-
Tassone and Guo-Du. Judicious selection of EOS methods is required and many of those
EOS methods still have difficulty predicting thermodynamic properties near or at critical
point, especially at high pressures. A simple yet robust method is still needed to
accurately predict volumetric phase behavior of substances.
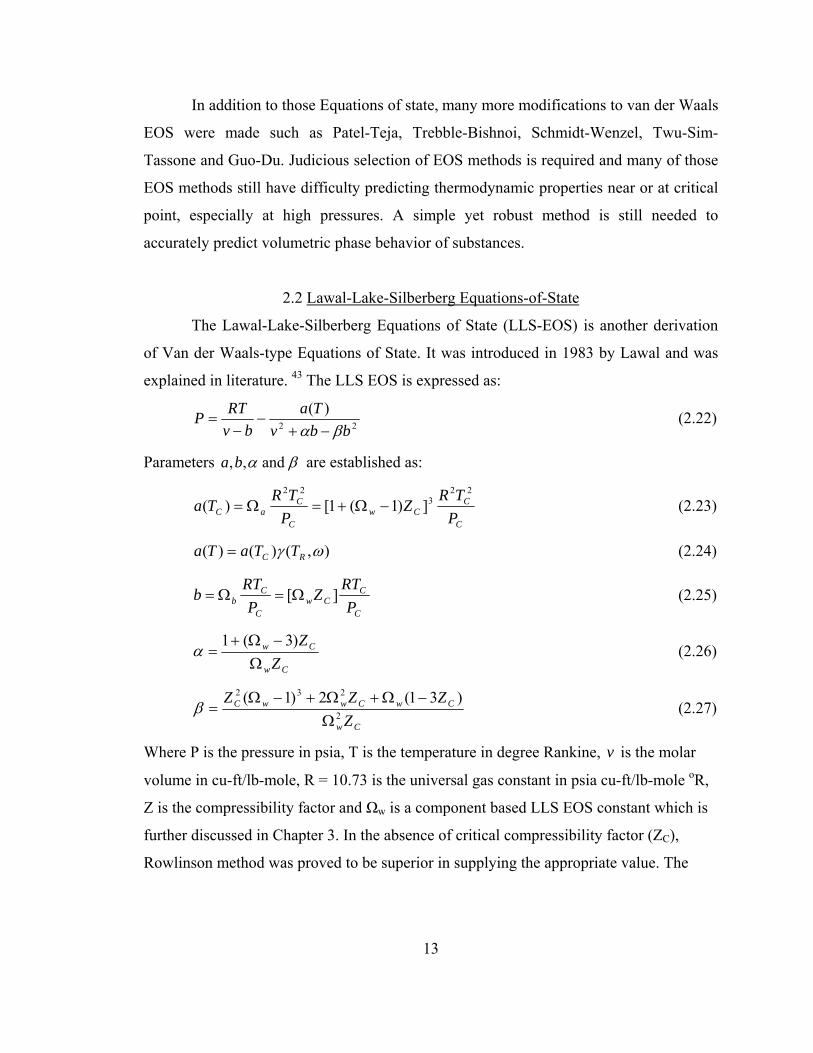
2.2 Lawal-Lake-Silberberg Equations-of-State
The Lawal-Lake-Silberberg Equations of State (LLS-EOS) is another derivation
of Van der Waals-type Equations of State. It was introduced in 1983 by Lawal and was
explained in literature. 43 The LLS EOS is expressed as:
22
)(bbv
Tabv
RTPβα −+
−−
= (2.22)
Parameters βα and ,,ba are established as:
C
CCw
C
CaC P
TRZ
PTR
Ta22
322
])1(1[)( −Ω+=Ω= (2.23)
),()()( ωγ RC TTaTa = (2.24)
C
CCw
C
Cb P
RTZ
PRT
b ][Ω=Ω= (2.25)
Cw
Cw
ZZ
Ω−Ω+
=)3(1
α (2.26)
Cw
CwCwwC
ZZZZ
2
232 )31(2)1(Ω
−Ω+Ω+−Ω=β (2.27)
Where P is the pressure in psia, T is the temperature in degree Rankine, is the molar
volume in cu-ft/lb-mole, R = 10.73 is the universal gas constant in psia cu-ft/lb-mole
voR,
Z is the compressibility factor and Ωw is a component based LLS EOS constant which is
further discussed in Chapter 3. In the absence of critical compressibility factor (ZC),
Rowlinson method was proved to be superior in supplying the appropriate value. The
13

Rowlinson method relates critical compressibility factor (ZC) and acentric factor and can
be expressed as:
ω375.01
293.0+
=CZ (2.28)
The LLS EOS is so flexible that it can be correlated with other EOS by changing
the value of α and β. For example, to show the van der Waals EOS from Equation 2.3 the
value of α and β must be set at 0. Table 2.1 displays the values of α and β for several
EOS.
Table 2.1 - Common Specialization of LLS Equation of State
Authors Year Coefficients of the Quadratic
α β α + β
Two -Constant Equations:
van der Waals 1873 0 0 0
Dieterici 1898 0 0 0
Berthelot 1990 0 0 0
Redlich – Kwong 1949 1 0 1
Peng – Robinson 1976 2 – 1 1
Harmens 1977 3 – 2 1
Zakharov 1977 c 0 c
Three -Constant Equations:
Clausius 1881 2c/b – c2/b2 1 (c =b)
Martins 1979 2 – t2/b2 1 (t = b)
Schmidt – Wenzel 1980 1 + 3ω – 3ω 1
Harmens – Knapp 1980 c – (c – 1) 1
Heyen 1981 (b + e)/b – e/b 1
Joffe – Martins 1981 2c/b – c2/b2 1 (c = b)
Patel – Teja 1982 (b + c)/b – c/b 1
Kubic – Martins 1982 2c/b – c2/b2 1 (c = b)
Table 2.1 (Continued)
14
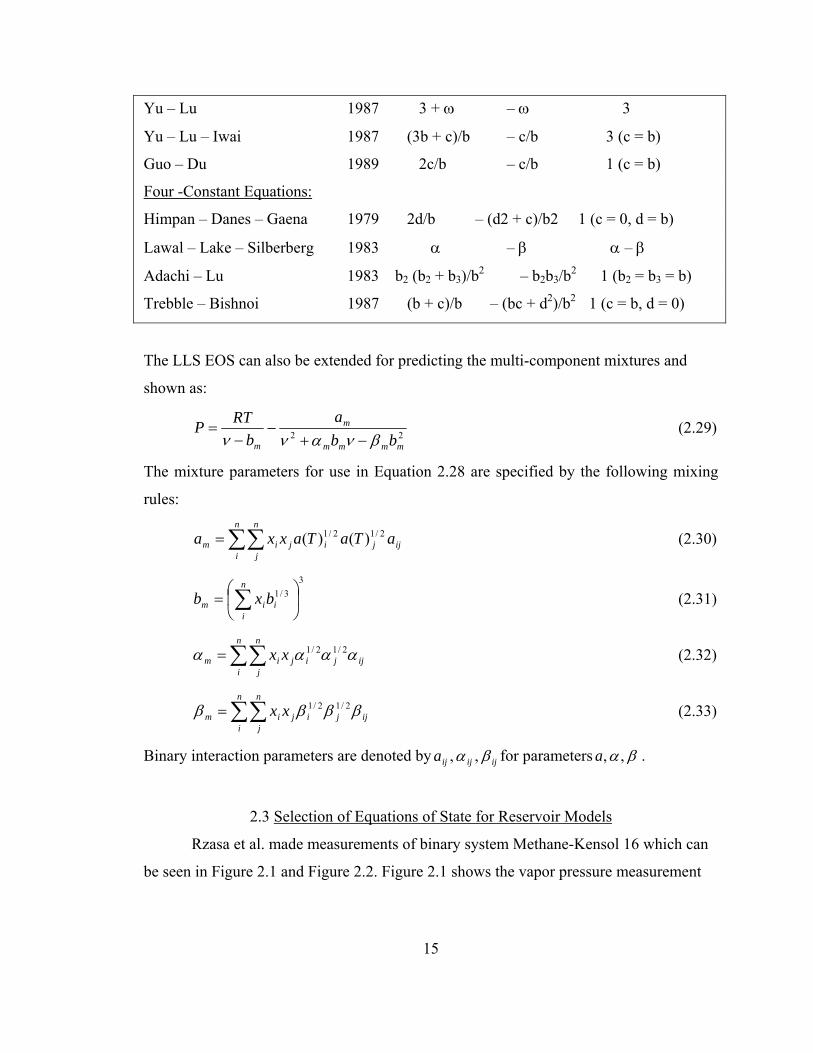
Yu – Lu 1987 3 + ω – ω 3
Yu – Lu – Iwai 1987 (3b + c)/b – c/b 3 (c = b)
Guo – Du 1989 2c/b – c/b 1 (c = b)
Four -Constant Equations:
Himpan – Danes – Gaena 1979 2d/b – (d2 + c)/b2 1 (c = 0, d = b)
Lawal – Lake – Silberberg 1983 α – β α – β
Adachi – Lu 1983 b2 (b2 + b3)/b2 – b2b3/b2 1 (b2 = b3 = b)
Trebble – Bishnoi 1987 (b + c)/b – (bc + d2)/b2 1 (c = b, d = 0)
The LLS EOS can also be extended for predicting the multi-component mixtures and
shown as:
22mmmm
m
m bba
bRTP
βνανν −+−
−= (2.29)
The mixture parameters for use in Equation 2.28 are specified by the following mixing
rules:
(2.30) ijji
n
ij
n
jim aTaTaxxa 2/12/1 )()(∑∑=
(2.31) 3
3/1 ⎟⎠
⎞⎜⎝
⎛= ∑
n
iiim bxb
(2.32) ijji
n
ij
n
jim xx αααα 2/12/1∑∑=
(2.33) ijji
n
ij
n
jim xx ββββ 2/12/1∑∑=
Binary interaction parameters are denoted by ijijija βα , , for parameters βα , ,a .
2.3 Selection of Equations of State for Reservoir Models
Rzasa et al. made measurements of binary system Methane-Kensol 16 which can
be seen in Figure 2.1 and Figure 2.2. Figure 2.1 shows the vapor pressure measurement
15
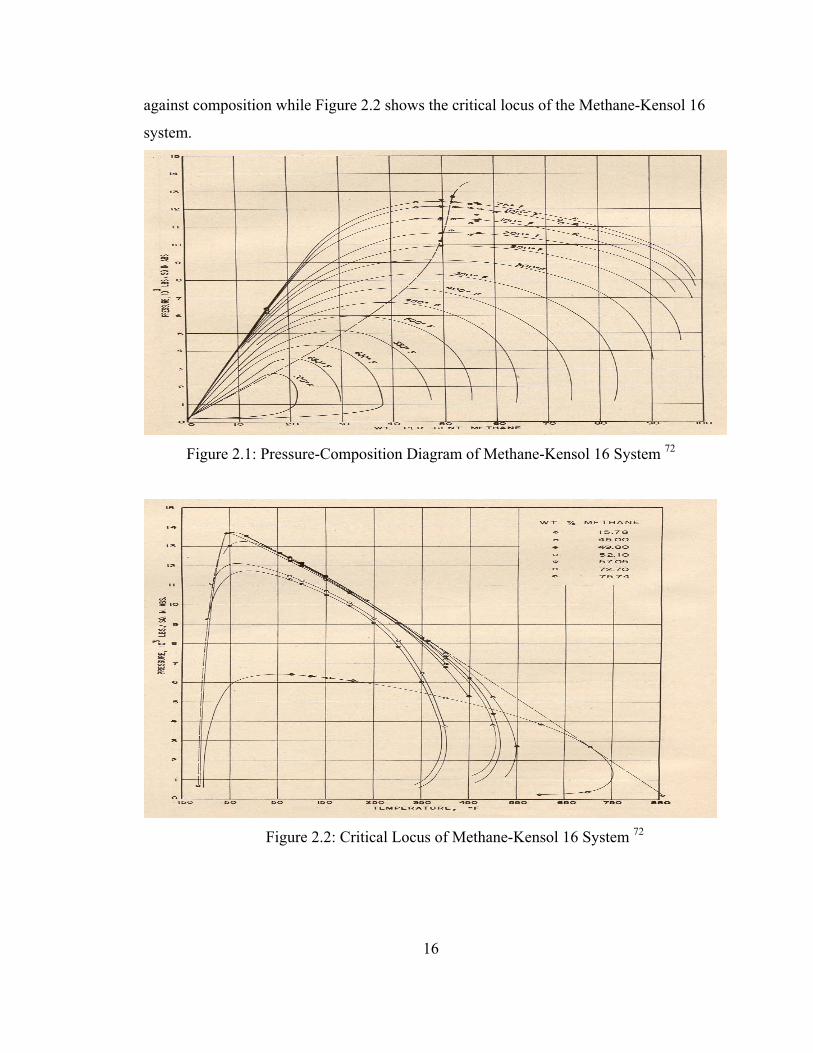
against composition while Figure 2.2 shows the critical locus of the Methane-Kensol 16
system.
Figure 2.1: Pressure-Composition Diagram of Methane-Kensol 16 System 72
Figure 2.2: Critical Locus of Methane-Kensol 16 System 72
16

Both figures illustrated that the pressure can be up to about 13,000 psia which is
much higher than the critical values of each component for this binary mixture. From this
experiment, Rzasa stated, “Two phases can coexist at pressure of 13,000 psia and as the
drilling operation become deeper and deeper, the amount of methane in the reservoir
increases. In the case of the two phases are present, it is a possibility that a more
complicated production and operating technique is considered. The experimental results
also nullify the notion that in depth of 12,000 to 15,000 ft there is only be one phase exist
due to the high bottom-hole pressure.”
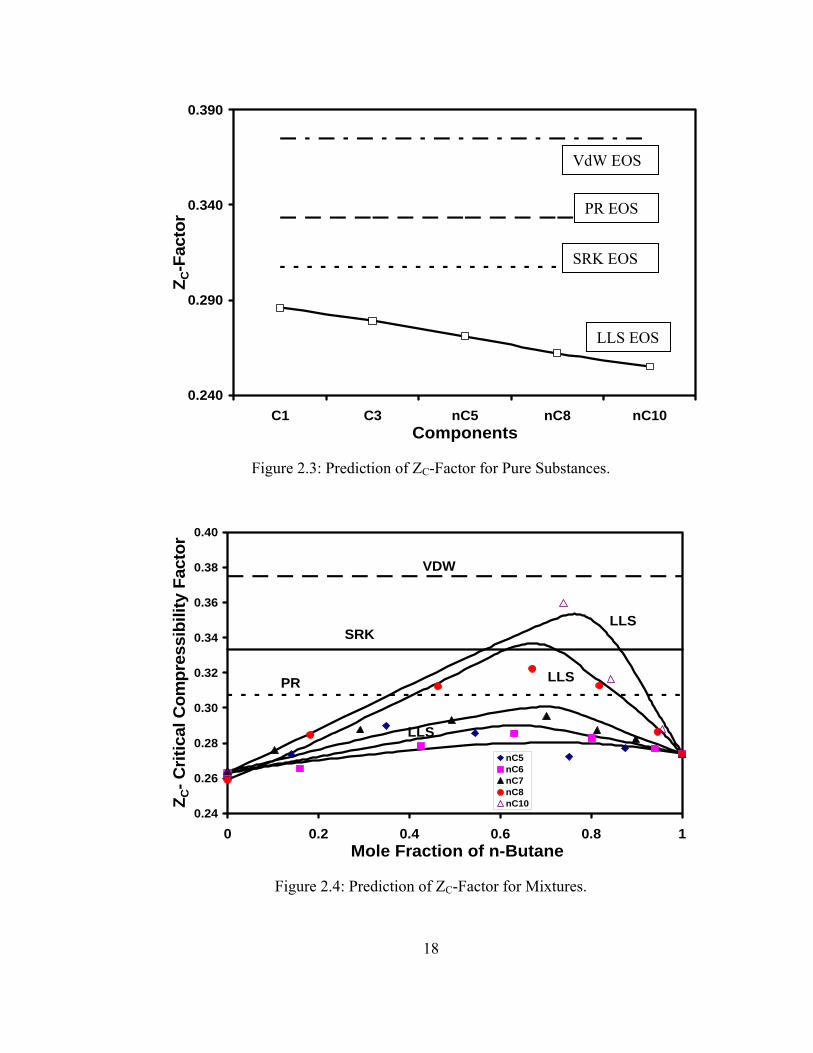
Prediction of critical densities depends on critical pressure, critical temperature,
and critical Z-factor. The critical pressure and critical temperature are accurately obtained
from experimental data while the critical Z-factor is an analytical value. The Z-factor
value can be obtained from EOS. Figure 2.3 shows the prediction and experimental
results of ZC-factor for several single components. The prediction values were obtained
from Van der Waals (VdW), Peng-Robinson (PR), Soave-Redlich-Kwong (SRK) and
Lawal-Lake-Silberberg (LLS) EOS. In this figure, VDW, PR and SRK EOS predicted
universal constant ZC-factor values are shown, which is one of the shortcomings of these
equations of state, while LLS EOS duplicates the value of experimental ZC-factor for
every component. Thus, the LLS EOS predicts a component based ZC-factor.
When the prediction methods are extended for multi-component mixtures, the
same shortcomings as pure component prediction are encountered. Figure 2.4 shows the
shortcomings of the VDW, PR and SRK EOS methods while LLS EOS illustrates the
effect of mixtures composition and follows the experimental data trend. Therefore, the
LLS EOS is selected for this project as a basis to make robust closed form solutions in
predicting the thermodynamic properties for pure substances and mixtures.
17
0.240
0.290
0.340
0.390
C1 C3 nC5 nC8Components
Z C-F
acto
rS
S
Figure 2.3: Prediction of ZC-Factor for Pure Substa
0.24
0.26
0.28
0.30
0.32
0.34
0.36
0.38
0.40
0 0.2 0.4 0.6 Mole Fraction of n-Butane
Z C- C
ritic
al C
ompr
essi
bilit
y Fa
ctor
nC5nC6nC7nC8nC10
VDW
SRK
PR LLS
LLS
Figure 2.4: Prediction of ZC-Factor for Mixture
18
PR EO
SRK EOSS
nc
0
s.
LLS EO
VdW EO
nC10
es.
.8 1
LLS
2.4 Transformed Equations of State
The LLS EOS of Equation 2.22 shows the relation between pressure, temperature
and molar volume ( v ). In calculating the volumetric behavior, it is more convenient to
write this equation into the Z form. Equation 2.22 can be transformed into Z-form as:
0432
23
1 =Θ−Θ+Θ−Θ ZZZ (2.34)
Where parameters Θ1, Θ2, Θ3, Θ4 are:
11 =Θ (2.35)
[ B)1(12 ]α−+=Θ (2.36)
])([ 23 BBA αβα +−−=Θ (2.37)
)]([ 324 BBAB −−=Θ β (2.38)
Parameters were defined as: B andA
22TRaPA = (2.39)
RTbPB = (2.40)
Similarly Equation 2.22 can be written in form−v as:
0432
23
1 =Θ−Θ+Θ−Θ vvv (2.41)
Where parameters Θ1, Θ2, Θ3, Θ4 are:
11 =Θ (2.42)
⎥⎦⎤
⎢⎣⎡ +−=Θ
PRTbb α2 (2.43)
⎥⎦⎤
⎢⎣⎡ +−−=Θ 2
3 )( bP
RTbPa βαα (2.44)
⎥⎦
⎤⎢⎣
⎡⎟⎠⎞
⎜⎝⎛ +−=Θ β
PRTbb
Pab 23
4 (2.45)
Using mixing rules stated in Equation 2.30 to Equation 2.33 the Equations of State can be
extended for mixtures. The Z-form for mixtures is expressed as:
19

(2.46) 0)]([])([])1(1[ 32223 =+−−+−−+−+− BBABZBBAZBZ mmmmm βαβαα
Similarly, the LLS EOS can be expressed in v-form for mixtures as:
0
)(
23
223
=⎥⎦
⎤⎢⎣
⎡⎟⎠⎞
⎜⎝⎛ +−−
⎥⎦⎤
⎢⎣⎡ +−−+⎟
⎠⎞
⎜⎝⎛ +−−
mmmmm
mmmmmm
mmm
PRTbb
Pba
vbP
RTbPa
vP
RTbbv
β
βααα (2.47)
Detailed derivation for the Z-form and v-form can be seen in Appendix A.
The solution of Equation 2.34 and Equation 2.41 can be either one or three real
roots. When three real roots are available, the highest real root is for vapor and the lowest
real root that larger than the value of B is for liquid. The other root is discarded as it
carries no physical meaning. An accurate determination of these roots helps resolve the
near critical region phase behavior.
2.5 Resolving Near-Critical Fluid Phase Behavior
The properties of substances are strongly affected by the presence of critical
point. Anisimov et al. defined critical region as 0.96< T/TC < 1.04. At the critical point,
the properties of liquid and vapor phases are indistinguishable while near the critical
point the properties of liquid and vapor are fairly similar. Although the critical point of
each component is widely varied, the behavior of the substances is not change. The
approach of simple extrapolation must not be used in predicting the phase behavior at the
near critical region condition. This is because as the condition draws nearer to the critical
point, the sensitivity and fluctuation of the properties calculation increases widely as
temperature or pressure is minutely changed. Research showed although properties
universality exists, substance-dependent variables play a significant role in this region.
Polling et al. stated that many adjustments have been made to resolve the
prediction near the critical point. These adjustments range from introduction of switching
20
function which does not required any iteration by Chapel and Rowlinson in 1974,
renormalization TC and ρC such as by Fox (1983) Pitzer et al. (1988) and Chou et al.
(1989), and the crossover functions by Sengers and colleague.
According to van der Waals theory, the EOS must have two-constant parameters.
These parameters which are represented by are the attractive and repulsive term
of the molecule. Resolving the near critical region, non temperature and pressure
dependent parameters are needed. The LLS EOS introduced the neither non temperature
nor pressure dependent parameters of alpha (α) and beta (β). The parameters α and β are
functions of Ω
b and a
w and ZC. These parameters force the prediction to converge consistently at
the critical point. Thus, resolving the near critical region.
The thermodynamic equilibrium condition should be expressed in experimental
quantity of pressure, temperature, volume and composition. The thermodynamic
equilibrium condition can be quantified by the fugacity term which was introduced G.N
Lewis and denoted by f. When there are vapor and liquid phases in the system, the
condition for thermodynamic equilibrium can be shown as: l
iv
i ff = (2.48)
Where v is the vapor state, l is the liquid state and i is the substance name.
2.6 Generalized Fugacity Coefficient for Pure Substances
Fugacity coefficient for pure component was developed for LLS EOS and can be
expressed as:
( ) ( ) QBZZPfi −−−−=⎟⎠⎞
⎜⎝⎛ ln1ln (2.49)
⎥⎥⎥⎥
⎦
⎤
⎢⎢⎢⎢
⎣
⎡
+−+
+++
⎭⎬⎫
⎩⎨⎧
+=
2)4(
2)4(
ln)4( 5.02
5.02
5.02 BZ
BZ
BAQ
βαα
βαα
βα (2.50)
Detailed derivations can be seen in Appendix A. This fugacity function can be extended
to calculate multi-component mixtures thermodynamic equilibrium condition.
21

2.7 Generalized Fugacity Coefficient for Substances in Mixtures
The general fugacity equation for components in multi-component mixture can be
expressed as:
∫ −=⎟⎟⎠
⎞⎜⎜⎝
⎛ P
Pi PdPZ
Pxf
*
)1(ln_
(2.51)
The mixture fugacity equation for LLS EOS was expanded as:
( ) ( )
⎭⎬⎫
⎩⎨⎧
+−⎭⎬⎫
⎩⎨⎧
−+−++
⎭⎬⎫
⎩⎨⎧
+−−−−−−=⎟⎟⎠
⎞⎜⎜⎝
⎛
∑∑
∑
k m
ikk
k m
ikk
kmi
m
ikkmi
i
i
xWHBSK
xWHBSGWHBGS
bbaax
QBZbbZPx
f
ββ
αα
)()(2)1(
2]/[32ln2]/[31ln 3/13/1
(2.52)
Where the parameters are:
⎥⎥⎥⎥
⎦
⎤
⎢⎢⎢⎢
⎣
⎡
+−+
+++
⎪⎭
⎪⎬⎫
⎪⎩
⎪⎨⎧
+=
2)4(
2)4(
ln)4( 5.02
5.02
5.02 BZ
BZ
BAQ
mmm
mmm
mm βαα
βαα
βα (2.53)
⎭⎬⎫
⎩⎨⎧ −−
−= QZ
BZZS (2.54)
( )⎥⎥⎦
⎤
⎢⎢⎣
⎡
+
+
⎭⎬⎫
⎩⎨⎧ −−
−=+
mm
mmQZBZ
ZGSβαβα
4)2(2
1 2
2
(2.55)
⎥⎥⎦
⎤
⎢⎢⎣
⎡
+⎭⎬⎫
⎩⎨⎧ −−
−=
mm
mQZBZ
ZSGβα
α42
2
(2.56)
⎥⎥⎦
⎤
⎢⎢⎣
⎡
+⎭⎬⎫
⎩⎨⎧ −−
−=
mm
mQZBZ
ZSKβα
β4
42 (2.57)
⎥⎥⎦
⎤
⎢⎢⎣
⎡
+⎭⎬⎫
⎩⎨⎧ −
−=
mm
mmBBZ
BWHBβα
βα4
22 (2.58)
22
The mixture fugacity equations are using the mixing rules proposed in Equation 2.30
through Equation 2.33.
23
CHAPTER III
ORTHOBARIC DENSITIES FOR SUBSTANCES
A detailed algorithm and prediction results of orthobaric densities of pure
substances is shown in this chapter. The algorithm shows a robust closed-loop orthobaric
densities prediction. The LLS EOS is used as a basis to construct the solution. The
prediction of single component covers polar, non-polar, hydrocarbon, non hydrocarbon
and refrigerant substances. Internal tuning parameter for pure substances prediction is
also presented in this chapter. In addition, an improved and robust temperature dependant
attractive function is discussed.
3.1 Algorithm for Resolving Phase Densities for Pure Substances
The LLS EOS has been applied as a basis to solve the phase densities for pure
substances. Step by step procedure to calculate orthobaric densities is illustrated in Figure
3.1.
The methodology started by reading input properties of the component. These
properties are component’s critical values of temperature, pressure and compressibility
factor, molecular weight and acentric factor. Calculating cubic EOS parameters of
βα and , , ba is the next step. Parameters βα and , , ba are functions of for
the LLS-EOS. Further discussion about Ω
Cw Zand Ω
w is made later. The next step is calculating
appropriate vapor pressures using the Newton-Raphson iteration. Following the vapor
pressure calculation, compressibility factor and fugacity of vapor and liquid states were
calculated. Fugacity values are important in checking the equilibrium condition. Once the
equilibrium condition is satisfied, the orthobaric densities were calculated. Finally, the
average absolute percent deviations (AAPD) between experimental and prediction values
are calculated. FORTRAN code for the orthobaric densities prediction can be seen in
Appendix B.
24
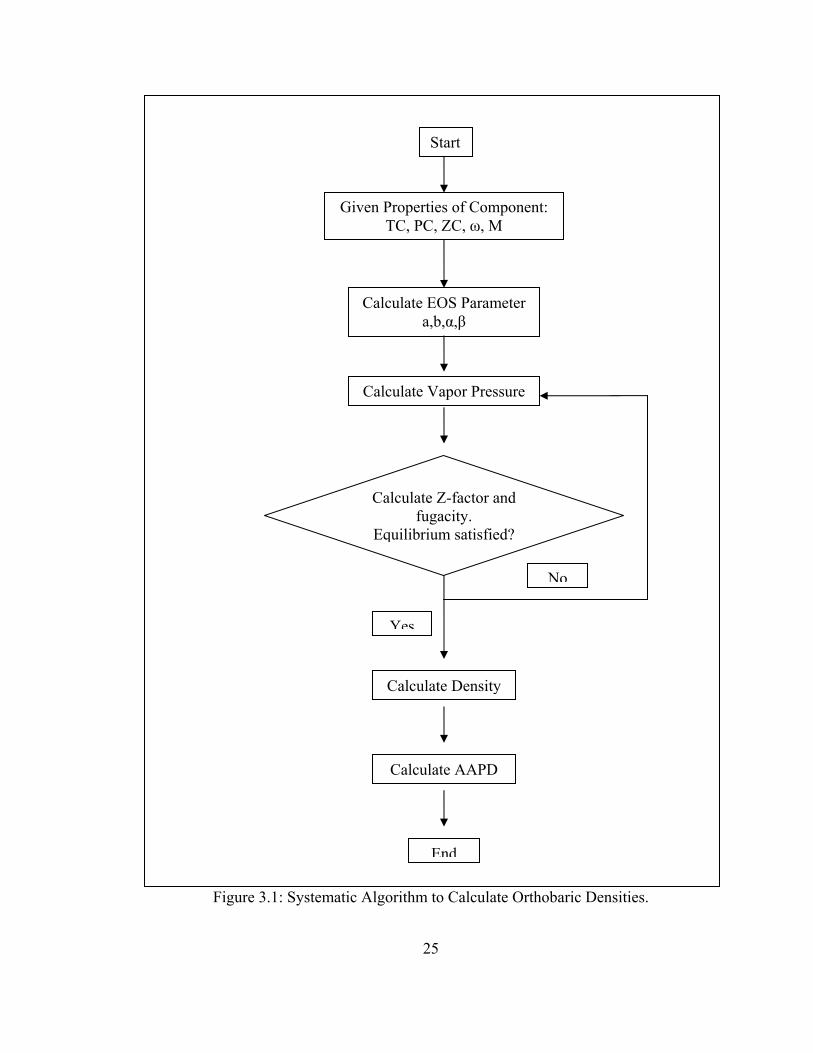
Figure 3.1: Systematic Algorithm to Calculate Orthobaric Densities.
Start
Given Properties of Component: TC, PC, ZC, ω, M
Calculate EOS Parameter a,b,α,β
Calculate Vapor Pressure
Calculate Density
Calculate Z-factor and fugacity.
Equilibrium satisfied?
No
Calculate AAPD
Yes
End
25
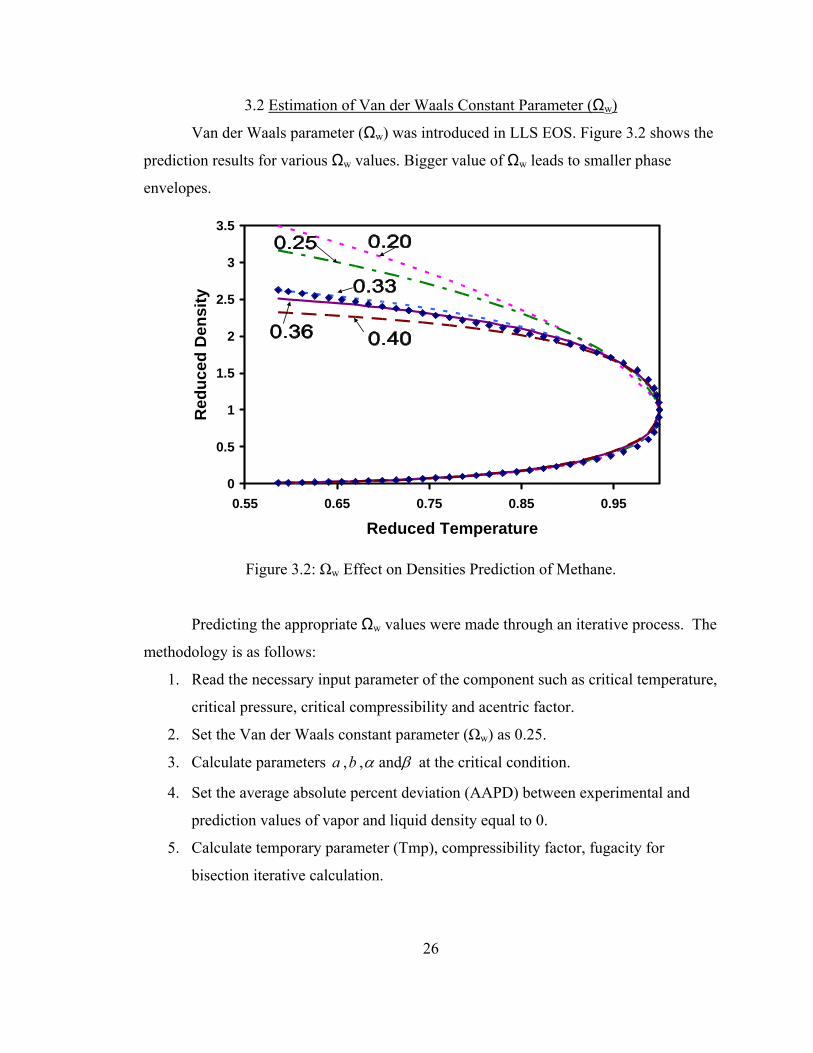
3.2 Estimation of Van der Waals Constant Parameter (Ωw)
Van der Waals parameter (Ωw) was introduced in LLS EOS. Figure 3.2 shows the
prediction results for various Ωw values. Bigger value of Ωw leads to smaller phase
envelopes.
0
0.5
1
1.5
2
2.5
3
3.5
0.55 0.65 0.75 0.85 0.95
Reduced Temperature
Red
uced
Den
sity
Figure 3.2: Ωw Effect on Densities Prediction of Methane.
Predicting the appropriate Ωw values were made through an iterative process. The
methodology is as follows:
1. Read the necessary input parameter of the component such as critical temperature,
critical pressure, critical compressibility and acentric factor.
2. Set the Van der Waals constant parameter (Ωw) as 0.25.
3. Calculate parameters βα and , , ba at the critical condition.
4. Set the average absolute percent deviation (AAPD) between experimental and
prediction values of vapor and liquid density equal to 0.
5. Calculate temporary parameter (Tmp), compressibility factor, fugacity for
bisection iterative calculation.
26
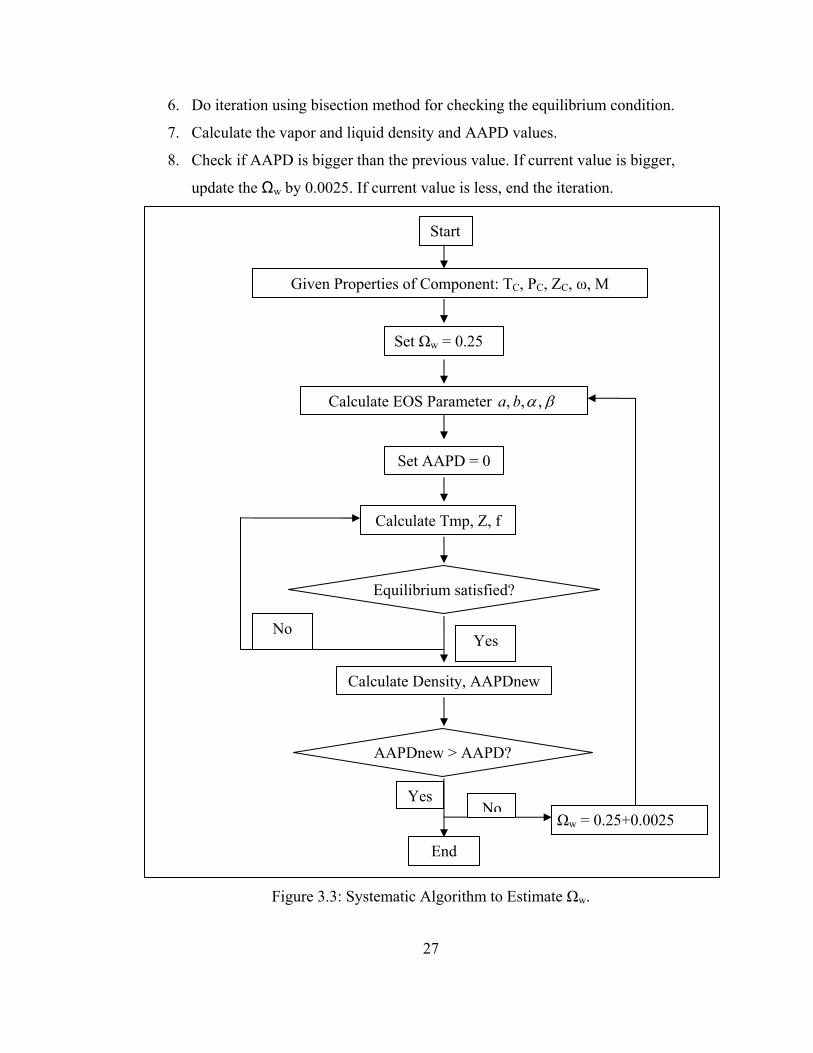
6. Do iteration using bisection method for checking the equilibrium condition.
7. Calculate the vapor and liquid density and AAPD values.
8. Check if AAPD is bigger than the previous value. If current value is bigger,
update the Ωw by 0.0025. If current value is less, end the iteration.
Figure 3.3: Systematic Algorithm to Estimate Ωw.
Given Properties of Component: TC, PC, ZC, ω, M
Calculate Density, AAPDnew
Calculate EOS Parameter βα ,,, ba
Set Ωw = 0.25
Equilibrium satisfied?
End
Yes No
Set AAPD = 0
Calculate Tmp, Z, f
AAPDnew > AAPD?
Ωw = 0.25+0.0025Yes
No
Start
27

The Ωw values were calculated for hydrocarbon, non-hydrocarbon, polar, non-
polar and refrigerant substances. After these values were calculated, regression analysis
was conducted and generalized function was developed. Figure 3.4 showed the regression
results of the Ωw.
0.354
0.355
0.356
0.357
0.358
0.359
0.36
0.361
0.362
0.300 0.310 0.320 0.330 0.340 0.350 0.360 0.370 0.380 0.390Ωw Exp
Ωw
Cal
c
Ωw = 0.361/(1+0.0274*ω)
Figure 3.4: Regression Analysis of Ωw.
The van der Waals constant parameter (Ωw) was determined as a function of acentric
factor. The general form of Ωw is:
ω0274.01361.0
+=Ωw (3.1)
This general form is used as one of the parameter in predicting the thermodynamic
properties and vapor pressures of substances. The complete result of van der Waals can
be seen in Table 3.1.
28
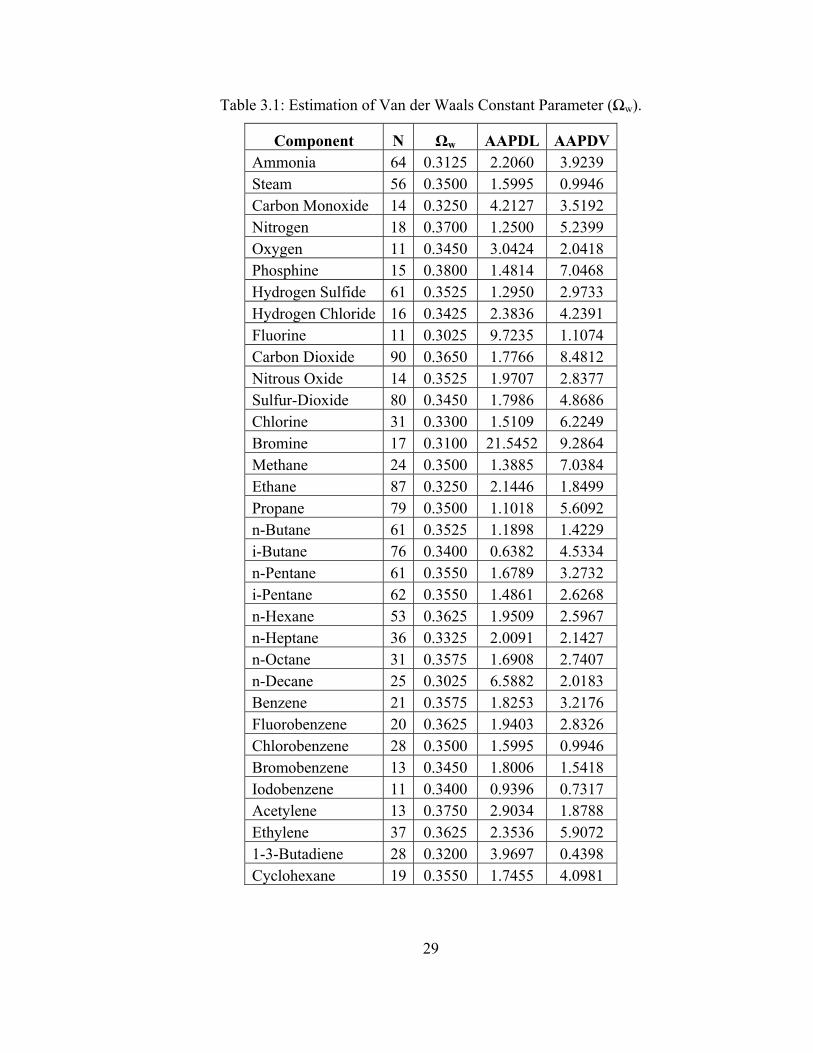
Table 3.1: Estimation of Van der Waals Constant Parameter (Ωw).
Component N Ωw AAPDL AAPDV Ammonia 64 0.3125 2.2060 3.9239 Steam 56 0.3500 1.5995 0.9946 Carbon Monoxide 14 0.3250 4.2127 3.5192 Nitrogen 18 0.3700 1.2500 5.2399 Oxygen 11 0.3450 3.0424 2.0418 Phosphine 15 0.3800 1.4814 7.0468 Hydrogen Sulfide 61 0.3525 1.2950 2.9733 Hydrogen Chloride 16 0.3425 2.3836 4.2391 Fluorine 11 0.3025 9.7235 1.1074 Carbon Dioxide 90 0.3650 1.7766 8.4812 Nitrous Oxide 14 0.3525 1.9707 2.8377 Sulfur-Dioxide 80 0.3450 1.7986 4.8686 Chlorine 31 0.3300 1.5109 6.2249 Bromine 17 0.3100 21.5452 9.2864 Methane 24 0.3500 1.3885 7.0384 Ethane 87 0.3250 2.1446 1.8499 Propane 79 0.3500 1.1018 5.6092 n-Butane 61 0.3525 1.1898 1.4229 i-Butane 76 0.3400 0.6382 4.5334 n-Pentane 61 0.3550 1.6789 3.2732 i-Pentane 62 0.3550 1.4861 2.6268 n-Hexane 53 0.3625 1.9509 2.5967 n-Heptane 36 0.3325 2.0091 2.1427 n-Octane 31 0.3575 1.6908 2.7407 n-Decane 25 0.3025 6.5882 2.0183 Benzene 21 0.3575 1.8253 3.2176 Fluorobenzene 20 0.3625 1.9403 2.8326 Chlorobenzene 28 0.3500 1.5995 0.9946 Bromobenzene 13 0.3450 1.8006 1.5418 Iodobenzene 11 0.3400 0.9396 0.7317 Acetylene 13 0.3750 2.9034 1.8788 Ethylene 37 0.3625 2.3536 5.9072 1-3-Butadiene 28 0.3200 3.9697 0.4398 Cyclohexane 19 0.3550 1.7455 4.0981
29
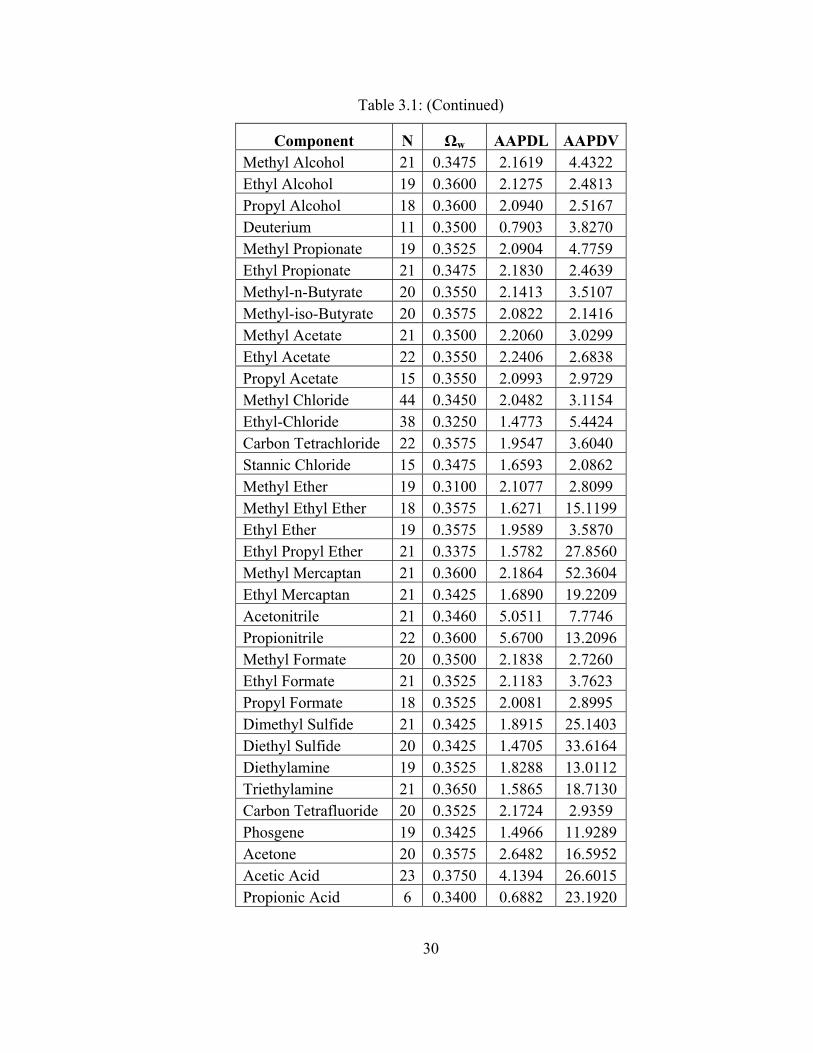
Table 3.1: (Continued)
Component N Ωw AAPDL AAPDV Methyl Alcohol 21 0.3475 2.1619 4.4322 Ethyl Alcohol 19 0.3600 2.1275 2.4813 Propyl Alcohol 18 0.3600 2.0940 2.5167 Deuterium 11 0.3500 0.7903 3.8270 Methyl Propionate 19 0.3525 2.0904 4.7759 Ethyl Propionate 21 0.3475 2.1830 2.4639 Methyl-n-Butyrate 20 0.3550 2.1413 3.5107 Methyl-iso-Butyrate 20 0.3575 2.0822 2.1416 Methyl Acetate 21 0.3500 2.2060 3.0299 Ethyl Acetate 22 0.3550 2.2406 2.6838 Propyl Acetate 15 0.3550 2.0993 2.9729 Methyl Chloride 44 0.3450 2.0482 3.1154 Ethyl-Chloride 38 0.3250 1.4773 5.4424 Carbon Tetrachloride 22 0.3575 1.9547 3.6040 Stannic Chloride 15 0.3475 1.6593 2.0862 Methyl Ether 19 0.3100 2.1077 2.8099 Methyl Ethyl Ether 18 0.3575 1.6271 15.1199 Ethyl Ether 19 0.3575 1.9589 3.5870 Ethyl Propyl Ether 21 0.3375 1.5782 27.8560 Methyl Mercaptan 21 0.3600 2.1864 52.3604 Ethyl Mercaptan 21 0.3425 1.6890 19.2209 Acetonitrile 21 0.3460 5.0511 7.7746 Propionitrile 22 0.3600 5.6700 13.2096 Methyl Formate 20 0.3500 2.1838 2.7260 Ethyl Formate 21 0.3525 2.1183 3.7623 Propyl Formate 18 0.3525 2.0081 2.8995 Dimethyl Sulfide 21 0.3425 1.8915 25.1403 Diethyl Sulfide 20 0.3425 1.4705 33.6164 Diethylamine 19 0.3525 1.8288 13.0112 Triethylamine 21 0.3650 1.5865 18.7130 Carbon Tetrafluoride 20 0.3525 2.1724 2.9359 Phosgene 19 0.3425 1.4966 11.9289 Acetone 20 0.3575 2.6482 16.5952 Acetic Acid 23 0.3750 4.1394 26.6015 Propionic Acid 6 0.3400 0.6882 23.1920
30
3.3 Designed Attractive Temperature Functions
Another use of cubic equation of state is supplying the appropriate vapor pressure
values. An accurate vapor pressure and mixtures properties prediction are important
components for a cubic equation of state in correlating the mixtures phase equlibria.
Modifications have been made to accurately predicting the vapor pressures and mixtures
properties. Applying the stability constraint of Equation 2.4 and Equation 2.5 at the
critical point, any cubic and non-cubic EOS is able to duplicate vapor pressure values.
However, an accurate vapor pressures prediction over a wide range of temperatures
requires a flexible attractive function. Introducing a temperature dependant attractive
function is a way to improve the vapor pressure prediction without negating the
prediction of thermodynamics properties of the substances. The van der Waals cubic EOS
does not include a temperature dependant attractive function. Clausius was the first to
identify that the attractive term of Equations of State should be temperature dependant.
The inclusion of temperature dependant function that can predict the pure
component vapor-pressures was made by Redlich and Kwong for their modification of
the Van der Waals cubic EOS. 69 Redlich-Kwong cubic EOS was developed to predict
the thermodynamics properties of gaseous state. It has limitations when dealing with
liquid phase. The Redlich-Kwong proposal of the temperature dependant attractive
function is: 5.0/)( TaT =α (3.2)
Improving the vapor pressure prediction, Soave proposed a new function in 1972. Soave
made a modification to the attractive function of Redlich-Kwong cubic EOS by using
acentric factor as one of the parameters. Soave modification function is the most popular
model80 for vapor pressure prediction of hydrocarbon but not for polar compounds. Soave
attractive function was developed as: 25.0 )]1(1[),( RR TmT −+=ωα (3.3)
31

CR T
TT = (3.4)
2176.0574.1480.0 ωω −+=m (3.5)
Another commonly used cubic EOS was proposed by Peng and Robinson. They
also proposed a temperature dependant attractive function and can be shown as: 25.0 )]1(1[),( RR TmT −+=ωα (3.6)
CR T
TT = (3.7)
226992.054226.137464.0 ωω −−=m (3.8)
In addition, other models of temperature functions modification can be seen in Table 3.2.
Table 3.2 shows the variations of temperature dependant attractive functions.
Many of these functions are similar to Soave-type functions. Included in the list is
another temperature dependant attractive function by Soave which was introduced in
1979. The new function was claimed to perform better than the previous one.
Twu et al. 89 90 stated that there are three fundamental requirements for useful
temperature functions. These requirements are: First, the function must be finite and
positive for all temperatures. Second, the function equals to unity at critical point. Third,
the function approaches finite value as the temperature goes to infinity. Most
temperature functions in Table 3.2 do not satisfy one or more requirements stated by Twu
et al. Many of the functions have limitation in which the function is no longer decreasing
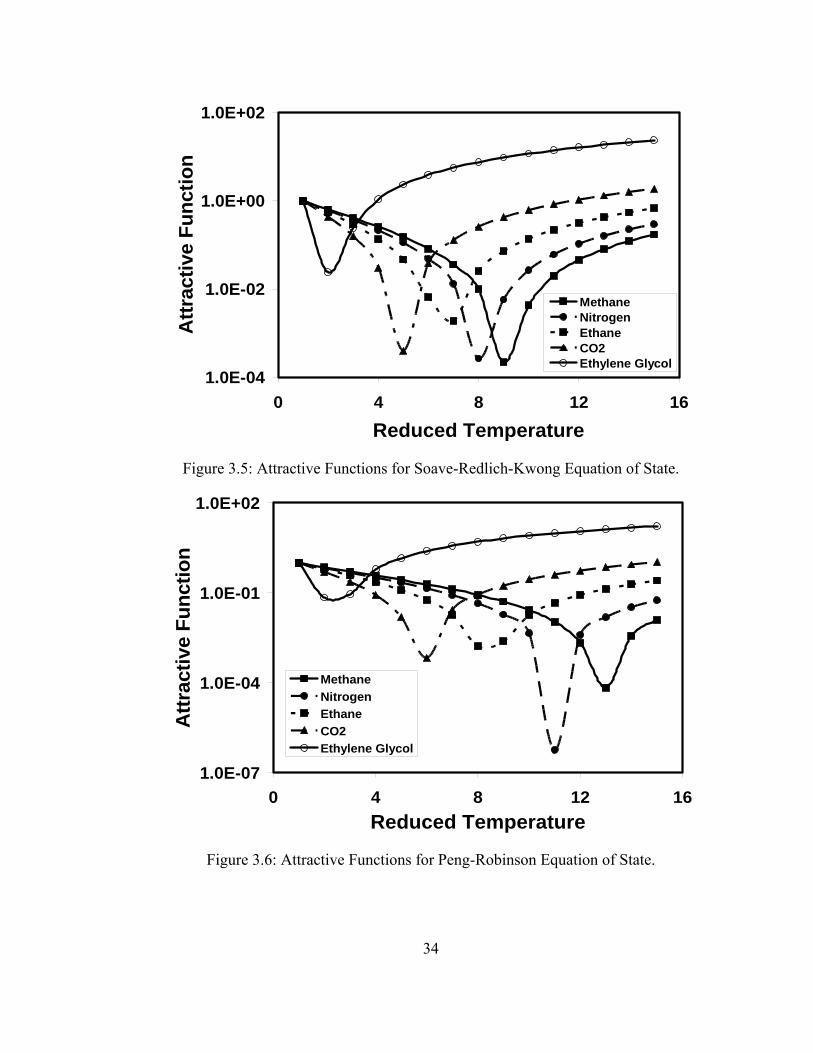
monotonically and resulted to a negative attractive function. Figure 3.4 and Figure 3.5
showed the Soave-Redlich-Kwong and Peng-Robinson attractive function respectively.
These figures illustrated the reduced temperature point at which the attractive functions
are no longer positive for various pure components.
32
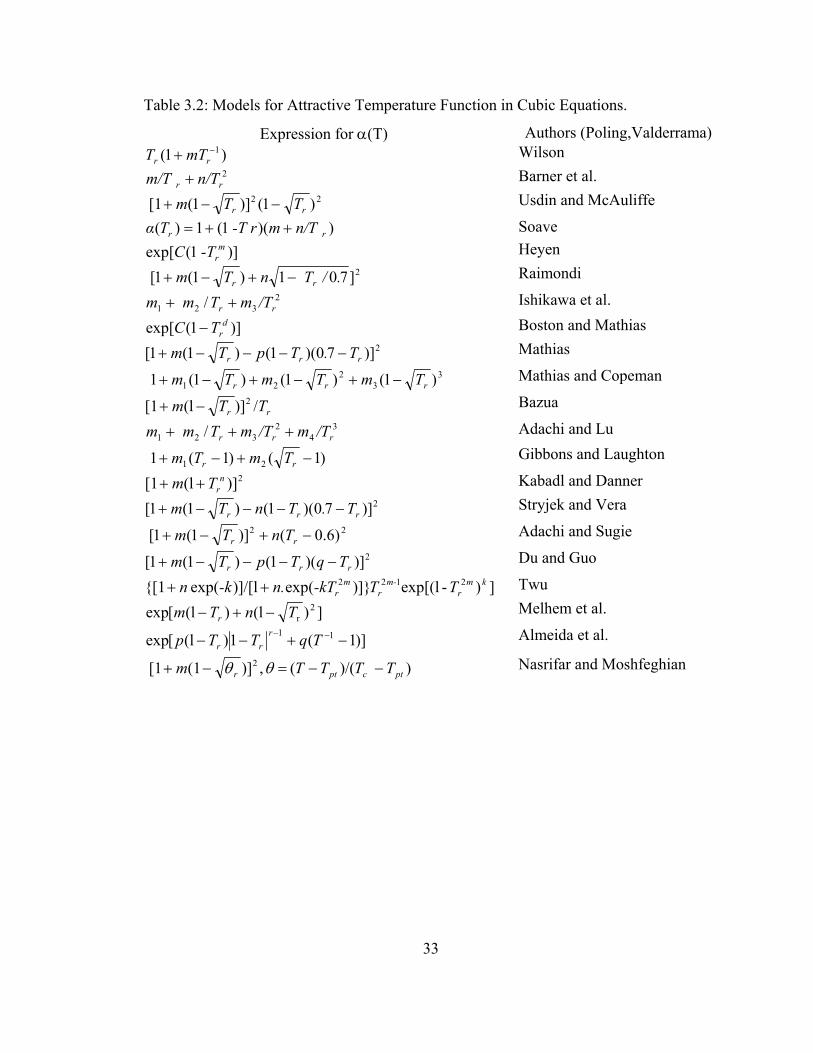
Table 3.2: Models for Attractive Temperature Function in Cubic Equations.
Expression for α(T) Authors (Poling,Valderrama) )1( 1−+ rr mTT Wilson
2rr n/Tm/T + Barner et al.
TTm rr22 )1()]1( [1 −−+ Usdin and McAuliffe
n/T m -T rTα rr ))(1(1)( ++= Soave -TC m
r )]1(exp[ Heyen
]701)1(1[ 2. / TnTm rr −+−+ Raimondi
/TmT mm rr2
321 / ++ Ishikawa et al.
TC dr )]1(exp[ − Boston and Mathias
T.TpTm rrr2)]70)(1()1(1[ −−−−+ Mathias
TmTmTm rrr3
32
21 )1()1()1(1 −+−+−+ Mathias and Copeman
/)](l [1 2rr TTm −+ Bazua
/Tm/TmT mm rrr3
42
321 / +++ Adachi and Lu
TmTm rr )1()1(1 21 −+−+ Gibbons and Laughton
)] (l [1 2nrTm ++ Kabadl and Danner
T.TnTm rrr2)]70)(1()1(1[ −−−−+ Stryjek and Vera
22 )6.0()]1(1[ −+−+ rr TnTm Adachi and Sugie
TqTpTm rrr2)])(1()1(1[ −−−−+ Du and Guo
]) -exp[(l)](exp )]/[l(exp [1 2122 kmr
m-r
mr TT-kTn.-kn ++ Twu
])(l ) (l[exp 2rTnTm r −+− Melhem et al.
)]1(1) (l[exp 11 −+−− −− TqTTp rrr Almeida et al.
))/(( ,)](1 [1 2ptc ptr TTTTm −−=−+ θθ Nasrifar and Moshfeghian
33
1.0E-04
1.0E-02
1.0E+00
1.0E+02
0 4 8 12
Reduced Temperature
Attr
activ
e Fu
nctio
n
16
MethaneNitrogenEthaneCO2Ethylene Glycol
Figure 3.5: Attractive Functions for Soave-Redlich-Kwong Equation of State.
1.0E-07
1.0E-04
1.0E-01
1.0E+02
0 4 8 12Reduced Temperature
Attr
activ
e Fu
nctio
n
16
MethaneNitrogenEthaneCO2Ethylene Glycol
Figure 3.6: Attractive Functions for Peng-Robinson Equation of State.
34

As can be seen in Figures 3.5 and 3.6, the proposed attractive function does not
satisfy the monotonically decreasing trend as the temperature increases (supercritical
region). Addressing those limitations, a consistent temperature function that continuously
and monotonically decreasing, equals unity at the critical point and approaching a finite
value as the temperature increases is proposed for this project as: EOS
RR TT Θ−=)(α (3.9)
Where
M 0.0036 0.3571 0.0863 0.1971 2LLS ωωω +++=Θ (3.10)
M 0.0032 0.3354 0.69050.3803 2PR ωωω +++=Θ (3.11)
M 0.0029 0.1906 0.83820.4526 2SRK ωωω +++=Θ (3.12)
This new temperature dependant attractive function is applied to the Peng-Robinson,
Soave-Redlich-Kwong and Lawal-Lake-Silberberg. The results can be seen in Figure 3.7,
Figure 3.8 and Figure 3.9 respectively.
1.0E-02
1.0E-01
1.0E+00
0 4 8 12Reduced Temperature
Attr
activ
e Fu
nctio
n
16
MethaneNitrogenEthaneCO2Ethylene Glycol
Figure 3.7: New Attractive Functions for Peng-Robinson Equation of State.
35

1.0E-03
1.0E-02
1.0E-01
1.0E+00
0 4 8 12Reduced Temperature
Attr
activ
e Fu
nctio
n
16
MethaneNitrogenEthaneCO2Ethylene Glycol
Figure 3.8: New Attractive Functions for Soave-Redlich-Kwong Equation of State.
1.0E-02
1.0E-01
1.0E+00
0 4 8 12Reduced Temperature
Attr
activ
e Fu
nctio
n
16
MethaneNitrogenEthaneCO2Ethylene Glycol
Figure 3.9: Attractive Functions for Lawal-Lake-Silberberg Equation of State.
36

-5
-4
-3
-2
-1
0
1 1.2 1.4 1.6 1.81/TR
ln P
RMethaneXenonCarbon Dioxiden-PentaneWaterAcetonen-DecaneEthyl Alcohol
Figure 3.10: Slope of Reduced Pressures against Reduced Temperatures.
Application of the proposed temperature dependant attractive function is not limited to
hydrocarbon substances. Figure 3.10 shows the reduced vapor pressures of several fluids
plotted against reduced temperature. The plot illustrates that the vapor pressures are
almost linear for all substances with various slopes. It can be inferred that the shape of
the vapor pressure curve is not highly dependent of the substances’ structure; instead the
curve is affected by the acentric factor values. Elliott et al.13 stated that the slope can be
characterized with acentric factor (ω), which was first introduced by Pitzer et al., as the
third parameter. The acentric factor helps specify the vapor pressure curve which
consecutively correlates the thermodynamic variables. Thus, the vapor pressure
prediction using appropriate temperature dependant attractive function can be applied not
only for predicting properties of hydrocarbon substances but also for every substance.
37

3.4 Second Virial Coefficient Calculation
The trend of the proposed temperature dependant attractive function was checked
for consistency by calculating the second virial coefficient. The coefficient is derived
from virial equation of state which is a polynomial series in pressure. The virial
coefficient is a function of temperature and has a general form of:
⎟⎟⎠
⎞⎜⎜⎝
⎛ Ω−Ω= +Θ 1
R
ab
C
C
TRTBP
(3.13)
The dimensionless parameters, Ωa and Ωb, of Equation 3.13 have been defined for various
cubic equations of state in Chapter 2.
Figures 3.11 until 3.15 show the experimental and prediction results of the virial
coefficient using Equation 3.13 for Peng-Robinson, Soave-Redlich-Kwong and Lawal-
Lake-Silberberg Equations of State. The proposed temperature dependant attractive
function was shown to be relatively accurate in predicting the virial coefficient for the
various substances. These predictions cover polar, non-polar, hydrocarbon, inert gases
and refrigerant compounds. The complete temperature function coefficients for
substances can be seen in Table 3.3.
38

Table 3.3: Theta (Θ) Values for Equations of State.
Component N ΘPR ΘSRK ΘLLS
Ammonia 64 0.6271 0.7172 0.3599 Steam 56 0.9544 1.0763 0.3322 Carbon Monoxide 14 0.3805 0.4643 0.2556 Nitrogen 18 0.3804 0.4659 0.1640 Oxygen 11 0.3415 0.4126 0.1722 Phosphine 15 0.3877 0.4716 0.1059 Hydrogen Sulfide 61 0.4741 0.5751 0.2121 Hydrogen Chloride 16 0.4865 0.5742 0.2059 Fluorine 11 0.3775 0.4690 0.2488 Carbon Dioxide 90 0.6463 0.7712 0.2640 Nitrous Oxide 14 0.5279 0.6214 0.2727 Sulfur-Dioxide 80 0.6366 0.7167 0.3887 Chlorine 31 0.4223 0.5730 0.2004 Bromine 17 0.4567 0.5310 0.2696 Methane 24 0.3393 0.4187 0.1398 Ethane 87 0.4467 0.5018 0.2379 Propane 79 0.5279 0.6214 0.2727 n-Butane 61 0.5964 0.7350 0.2880 i-Butane 76 0.5750 0.6773 0.3218 n-Pentane 61 0.6569 0.6638 0.3122 i-Pentane 62 0.5970 0.7077 0.3249 n-Hexane 53 0.7218 0.8045 0.4341 n-Heptane 36 0.7368 0.8397 0.3952 n-Octane 31 0.8580 0.9130 0.4417 n-Decane 25 0.8539 0.9468 0.6272 Benzene 21 0.6059 0.7134 0.2935 Fluorobenzene 20 0.6476 0.7509 0.2870 Chlorobenzene 28 0.6532 0.6667 0.3202 Bromobenzene 13 0.6424 0.7421 0.3200 Iodobenzene 11 0.6341 0.7304 0.3336 Acetylene 13 0.5684 0.6645 0.2578 Ethylene 37 0.4444 0.5321 0.1902 1-3-Butadiene 28 0.5493 0.6231 0.3849 Cyclohexane 19 0.6863 0.7009 0.3413
39
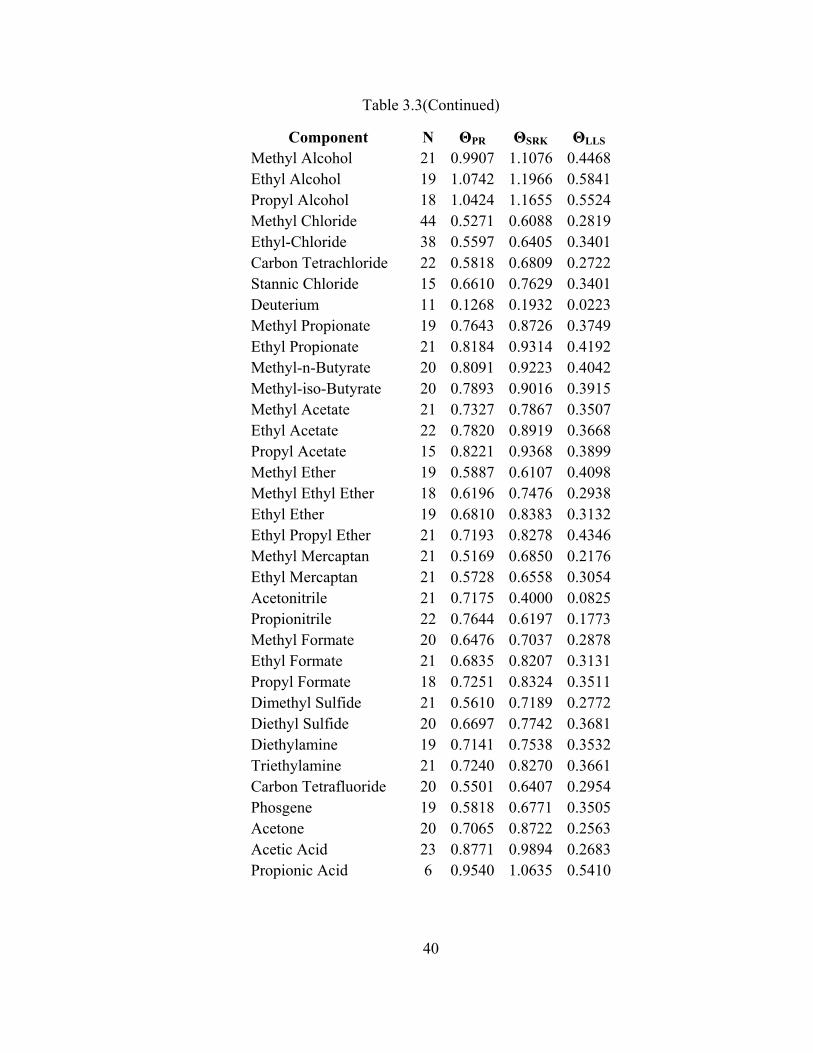
Table 3.3(Continued)
Component N ΘPR ΘSRK ΘLLS
Methyl Alcohol 21 0.9907 1.1076 0.4468 Ethyl Alcohol 19 1.0742 1.1966 0.5841 Propyl Alcohol 18 1.0424 1.1655 0.5524 Methyl Chloride 44 0.5271 0.6088 0.2819 Ethyl-Chloride 38 0.5597 0.6405 0.3401 Carbon Tetrachloride 22 0.5818 0.6809 0.2722 Stannic Chloride 15 0.6610 0.7629 0.3401 Deuterium 11 0.1268 0.1932 0.0223 Methyl Propionate 19 0.7643 0.8726 0.3749 Ethyl Propionate 21 0.8184 0.9314 0.4192 Methyl-n-Butyrate 20 0.8091 0.9223 0.4042 Methyl-iso-Butyrate 20 0.7893 0.9016 0.3915 Methyl Acetate 21 0.7327 0.7867 0.3507 Ethyl Acetate 22 0.7820 0.8919 0.3668 Propyl Acetate 15 0.8221 0.9368 0.3899 Methyl Ether 19 0.5887 0.6107 0.4098 Methyl Ethyl Ether 18 0.6196 0.7476 0.2938 Ethyl Ether 19 0.6810 0.8383 0.3132 Ethyl Propyl Ether 21 0.7193 0.8278 0.4346 Methyl Mercaptan 21 0.5169 0.6850 0.2176 Ethyl Mercaptan 21 0.5728 0.6558 0.3054 Acetonitrile 21 0.7175 0.4000 0.0825 Propionitrile 22 0.7644 0.6197 0.1773 Methyl Formate 20 0.6476 0.7037 0.2878 Ethyl Formate 21 0.6835 0.8207 0.3131 Propyl Formate 18 0.7251 0.8324 0.3511 Dimethyl Sulfide 21 0.5610 0.7189 0.2772 Diethyl Sulfide 20 0.6697 0.7742 0.3681 Diethylamine 19 0.7141 0.7538 0.3532 Triethylamine 21 0.7240 0.8270 0.3661 Carbon Tetrafluoride 20 0.5501 0.6407 0.2954 Phosgene 19 0.5818 0.6771 0.3505 Acetone 20 0.7065 0.8722 0.2563 Acetic Acid 23 0.8771 0.9894 0.2683 Propionic Acid 6 0.9540 1.0635 0.5410
40
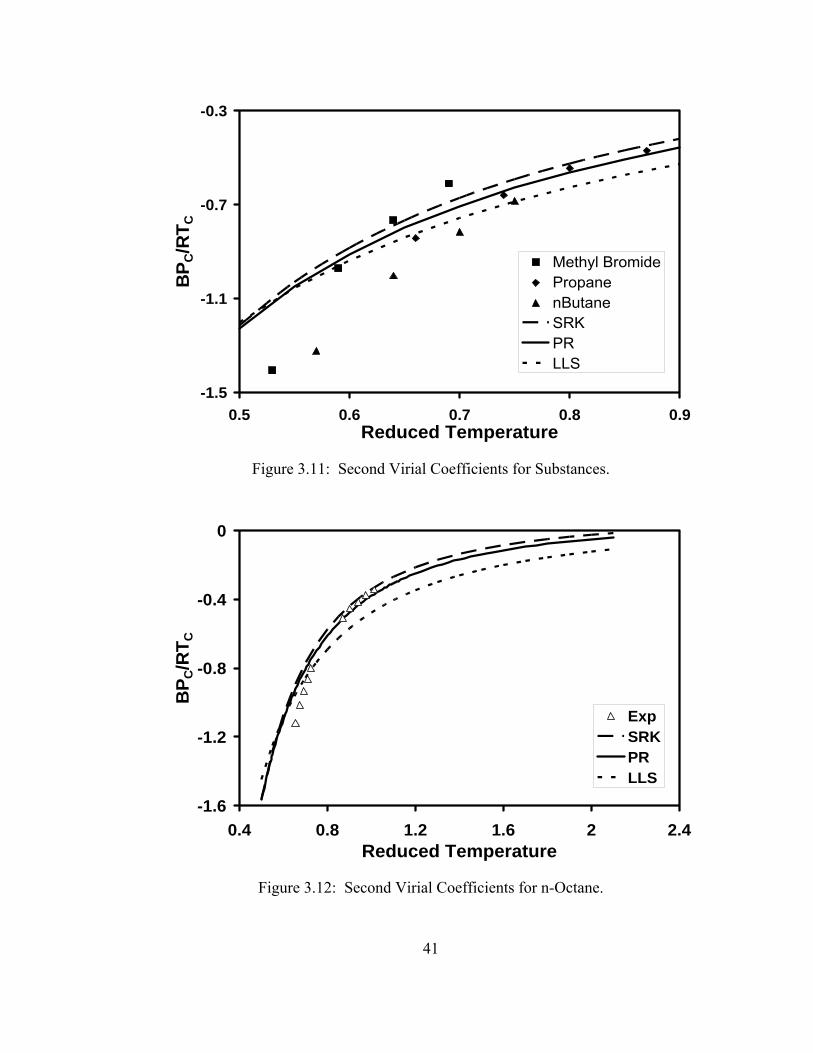
-1.5
-1.1
-0.7
-0.3
0.5 0.6 0.7 0.8 0.9Reduced Temperature
BP C
/RT C
Methyl BromidePropanenButaneSRKPRLLS
Figure 3.11: Second Virial Coefficients for Substances.
-1.6
-1.2
-0.8
-0.4
0
0.4 0.8 1.2 1.6 2 2.4Reduced Temperature
BP C
/RT C
ExpSRKPRLLS
Figure 3.12: Second Virial Coefficients for n-Octane.
41
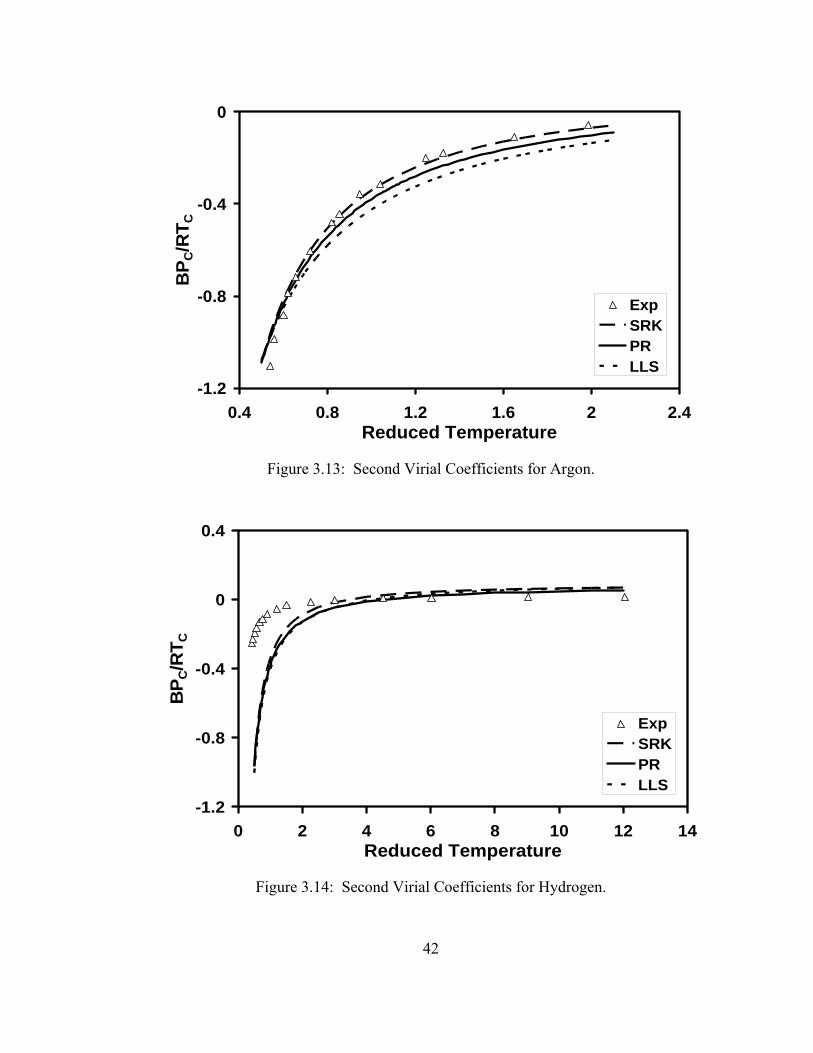
-1.2
-0.8
-0.4
0
0.4 0.8 1.2 1.6 2 2.4Reduced Temperature
BP C
/RT C
ExpSRKPRLLS
Figure 3.13: Second Virial Coefficients for Argon.
-1.2
-0.8
-0.4
0
0.4
0 2 4 6 8 10 12Reduced Temperature
BP C
/RT C
14
ExpSRKPRLLS
Figure 3.14: Second Virial Coefficients for Hydrogen.
42

-1.4
-1.2
-1
-0.8
-0.6
-0.4
-0.2
0
0.4 0.9 1.4 1.9Reduced Temperature
BP C
/RT C
2.4
ExpSRKPRLLS
Figure 3.15: Second Virial Coefficients for HFC-114.
3.5 Prediction of Phase Densities for Pure Hydrocarbons
Densities of defined pure hydrocarbon substances were predicted based on LLS
EOS. Figure 3.16 until Figure 3.19 show densities prediction of methane, n-pentane, n-
hexane and n-decane respectively. The average absolute percent deviations of liquid
(AAPDL) and vapor (AAPDV) for methane, n-pentane, n-hexane and n-decane were
calculated and summarized in Table 3.4. In most cases the liquid average deviation is less
than vapor average deviation. More densities prediction of pure hydrocarbon can be seen
in Appendix C.
Table 3.4: AAPDL and AAPDV for Hydrocarbon Substances.
Component AAPDL AAPDV Methane 2.403 10.208 n-Pentane 1.810 7.225 n-Hexane 3.753 2.588 n-Decane 6.846 7.879
43
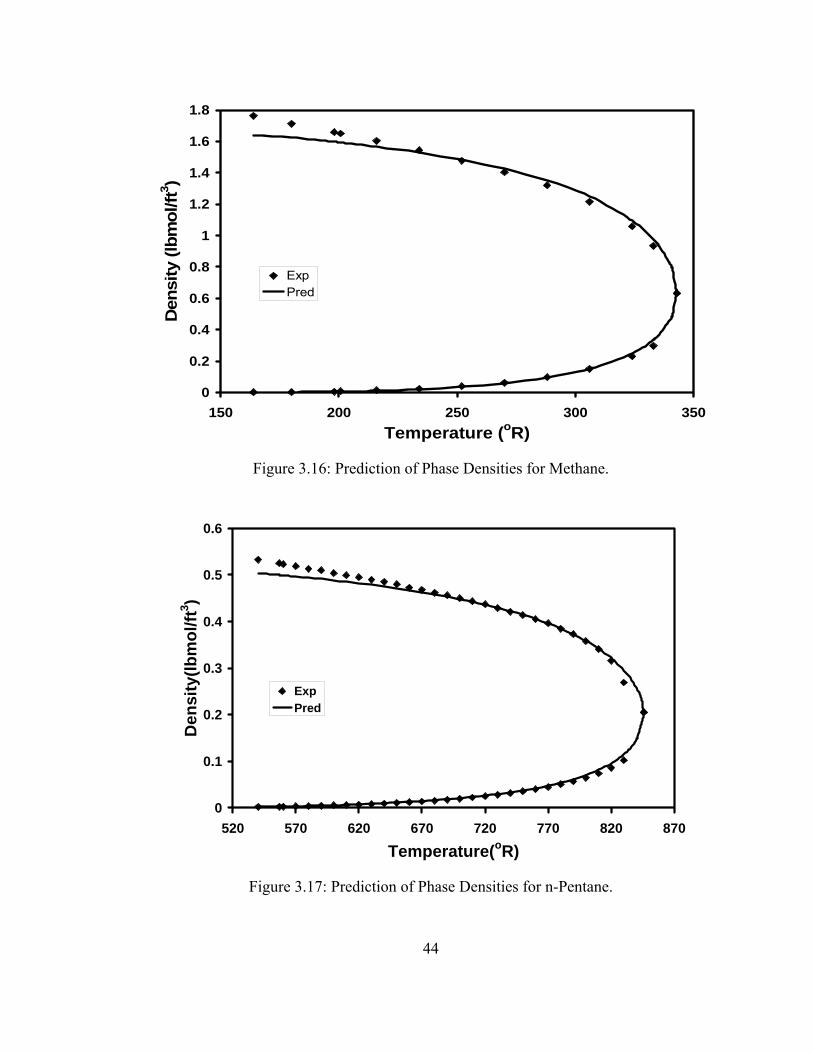
0
0.2
0.4
0.6
0.8
1
1.2
1.4
1.6
1.8
150 200 250 300 350Temperature (oR)
Den
sity
(lbm
ol/ft
3 )
ExpPred
Figure 3.16: Prediction of Phase Densities for Methane.
0
0.1
0.2
0.3
0.4
0.5
0.6
520 570 620 670 720 770 820 870
Temperature(oR)
Den
sity
(lbm
ol/ft
3 )
ExpPred
Figure 3.17: Prediction of Phase Densities for n-Pentane.
44
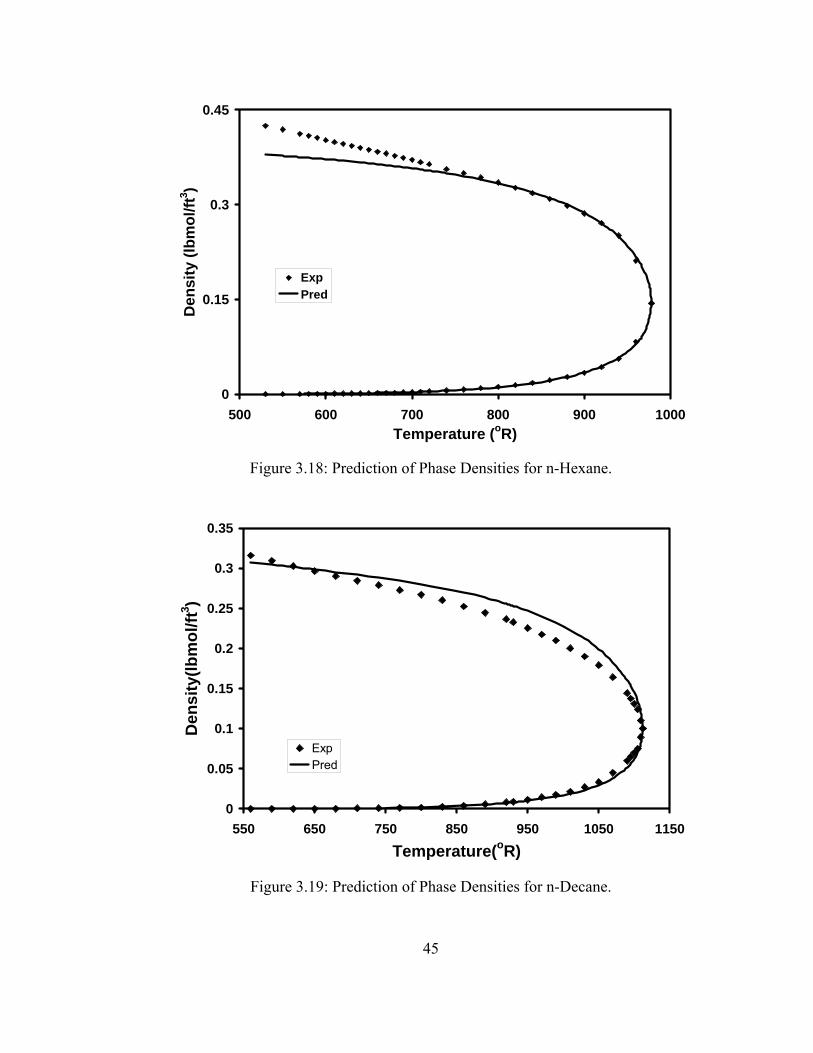
0
0.15
0.3
0.45
500 600 700 800 900 1000Temperature (oR)
Den
sity
(lbm
ol/ft
3 )
ExpPred
Figure 3.18: Prediction of Phase Densities for n-Hexane.
0
0.05
0.1
0.15
0.2
0.25
0.3
0.35
550 650 750 850 950 1050 1150Temperature(oR)
Den
sity
(lbm
ol/ft
3 )
ExpPred
Figure 3.19: Prediction of Phase Densities for n-Decane.
45

3.6 Prediction of Phase Densities for Non-Hydrocarbons
Densities of non hydrocarbon substances have been predicted. Figure 3.20
through Figure 3.22 show densities prediction of Carbon Dioxide (CO2), Hydrogen
Sulfide (H2S) and Nitrogen (N2). The AAPDL and AAPDV were calculated and
summarized in Table 3.5. The results show average deviation for liquid density prediction
is less than the vapor phase. More densities prediction of non-hydrocarbon substances
can be seen in Appendix C.
Table 3.5: AAPDL and AAPDV for Non-Hydrocarbon Substances.
Component AAPDL AAPDV Carbon Dioxide 1.824 5.515
Hydrogen Sulfide 2.720 5.488 Nitrogen 2.194 4.865
0
0.6
1.2
1.8
370 420 470 520 570Temperature (oR)
Den
sity
(lbm
ol/ft
3 )
ExpPred
Figure 3.20: Prediction of Phase Densities for Carbon Dioxide.
46
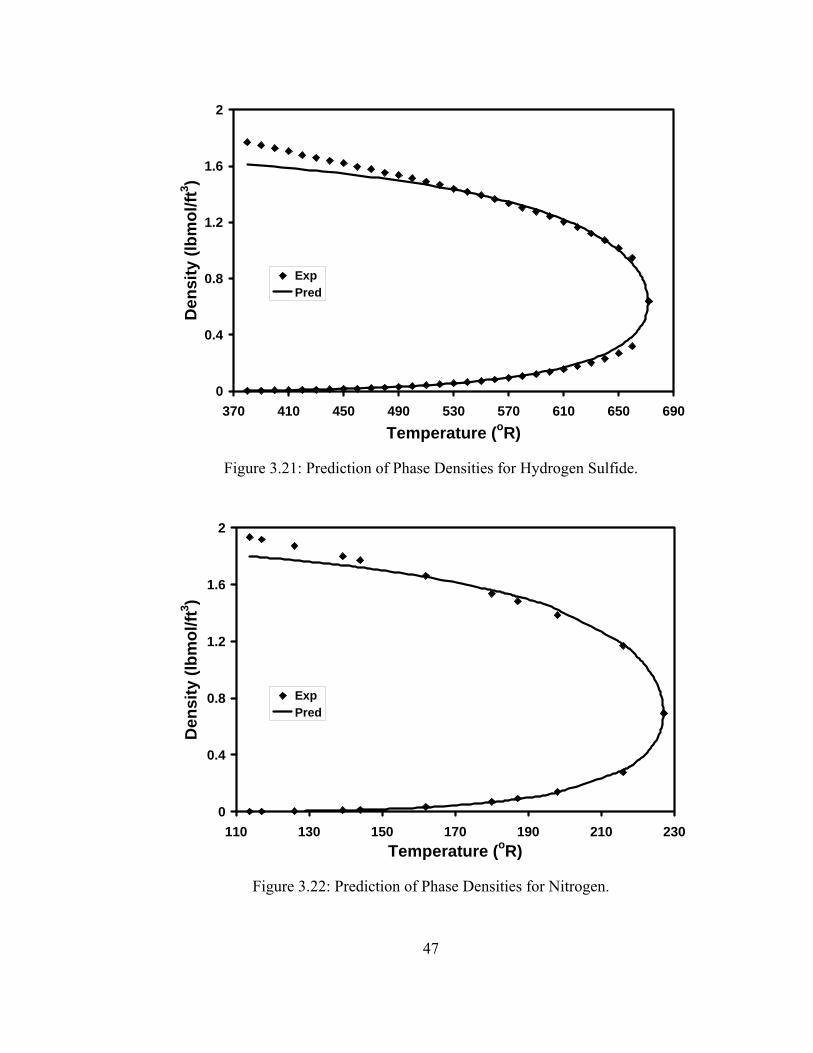
0
0.4
0.8
1.2
1.6
2
370 410 450 490 530 570 610 650 690Temperature (oR)
Den
sity
(lbm
ol/ft
3 )
ExpPred
Figure 3.21: Prediction of Phase Densities for Hydrogen Sulfide.
0
0.4
0.8
1.2
1.6
2
110 130 150 170 190 210 230Temperature (oR)
Den
sity
(lbm
ol/ft
3 )
ExpPred
Figure 3.22: Prediction of Phase Densities for Nitrogen.
47
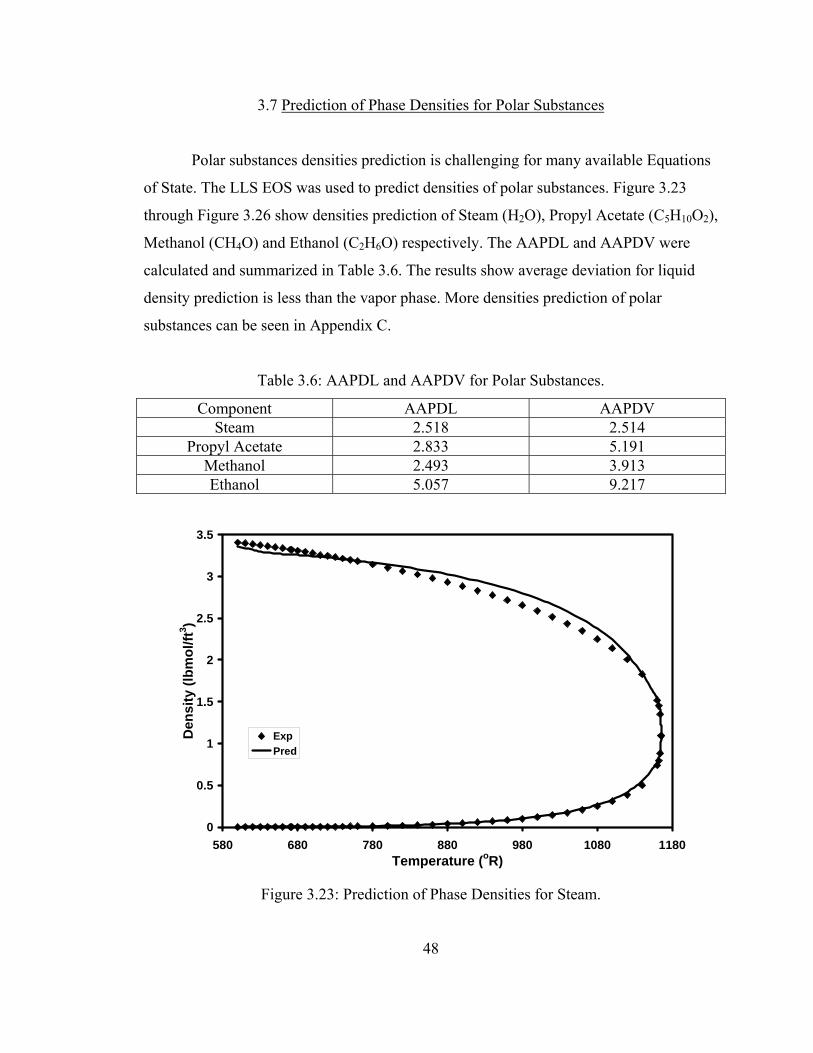
3.7 Prediction of Phase Densities for Polar Substances
Polar substances densities prediction is challenging for many available Equations
of State. The LLS EOS was used to predict densities of polar substances. Figure 3.23
through Figure 3.26 show densities prediction of Steam (H2O), Propyl Acetate (C5H10O2),
Methanol (CH4O) and Ethanol (C2H6O) respectively. The AAPDL and AAPDV were
calculated and summarized in Table 3.6. The results show average deviation for liquid
density prediction is less than the vapor phase. More densities prediction of polar
substances can be seen in Appendix C.
Table 3.6: AAPDL and AAPDV for Polar Substances.
Component AAPDL AAPDV Steam 2.518 2.514
Propyl Acetate 2.833 5.191 Methanol 2.493 3.913 Ethanol 5.057 9.217
0
0.5
1
1.5
2
2.5
3
3.5
580 680 780 880 980 1080 1180Temperature (oR)
Den
sity
(lbm
ol/ft
3 )
ExpPred
Figure 3.23: Prediction of Phase Densities for Steam.
48
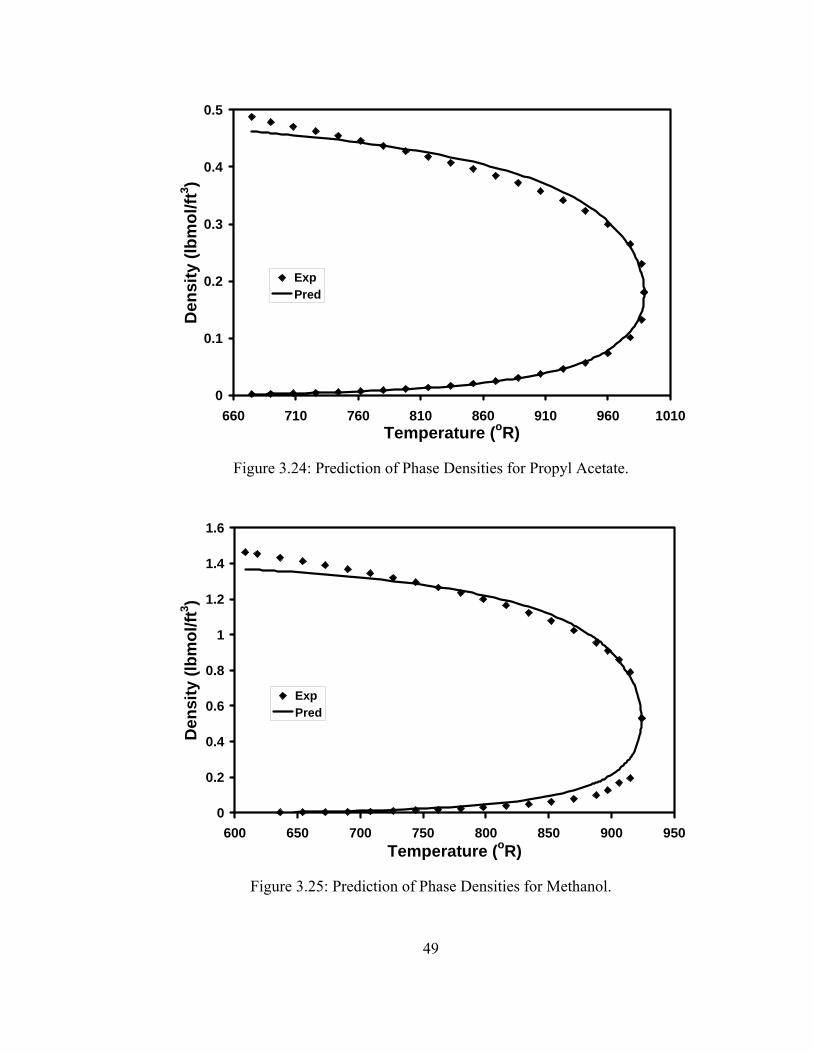
0
0.1
0.2
0.3
0.4
0.5
660 710 760 810 860 910 960 1010Temperature (oR)
Den
sity
(lbm
ol/ft
3 )
ExpPred
Figure 3.24: Prediction of Phase Densities for Propyl Acetate.
0
0.2
0.4
0.6
0.8
1
1.2
1.4
1.6
600 650 700 750 800 850 900 950Temperature (oR)
Den
sity
(lbm
ol/ft
3 )
ExpPred
Figure 3.25: Prediction of Phase Densities for Methanol.
49

0
0.2
0.4
0.6
0.8
1
1.2
610 660 710 760 810 860 910 960Temperature (oR)
Den
sity
(lbm
ol/ft
3 )
ExpPred
Figure 3.26: Prediction of Phase Densities for Ethanol.
3.8 Prediction of Phase Densities for Refrigerant Substances
The LLS EOS was also applied to predict densities of refrigerant substances.
Figure 3.26 through Figure 3.29 show densities prediction of Refrigerant-32, Refrigerant
134a, Refrigerant 152a and Refrigerant 227. The AAPDL and AAPDV were calculated
and summarized in Table 3.7. The results show average deviation for liquid density
prediction is less than the vapor phase. More densities prediction of refrigerant
substances can be seen in Appendix C.
Table 3.7: AAPDL and AAPDV for Refrigerant Substances.
Component AAPDL AAPDV Refrigerant-32 1.833 3.190
Refrigerant 134a 3.025 N/A Refrigerant 152a 3.026 6.127 Refrigerant 227 1.751 12.865
50

0
5
10
15
20
25
220 240 260 280 300 320 340 360Temperature (K)
Satu
rate
d D
ensi
ty (k
g/m
3 )
ExpPred
Figure 3.27: Prediction of Phase Densities for Refrigerant 32.
0
0.2
0.4
0.6
0.8
1
420 470 520 570 620 670 720Temperature(oR)
Den
sity
(lbm
ol/ft
3 )
ExpPred
Figure 3.28: Prediction of Phase Densities for Refrigerant 152a.
51
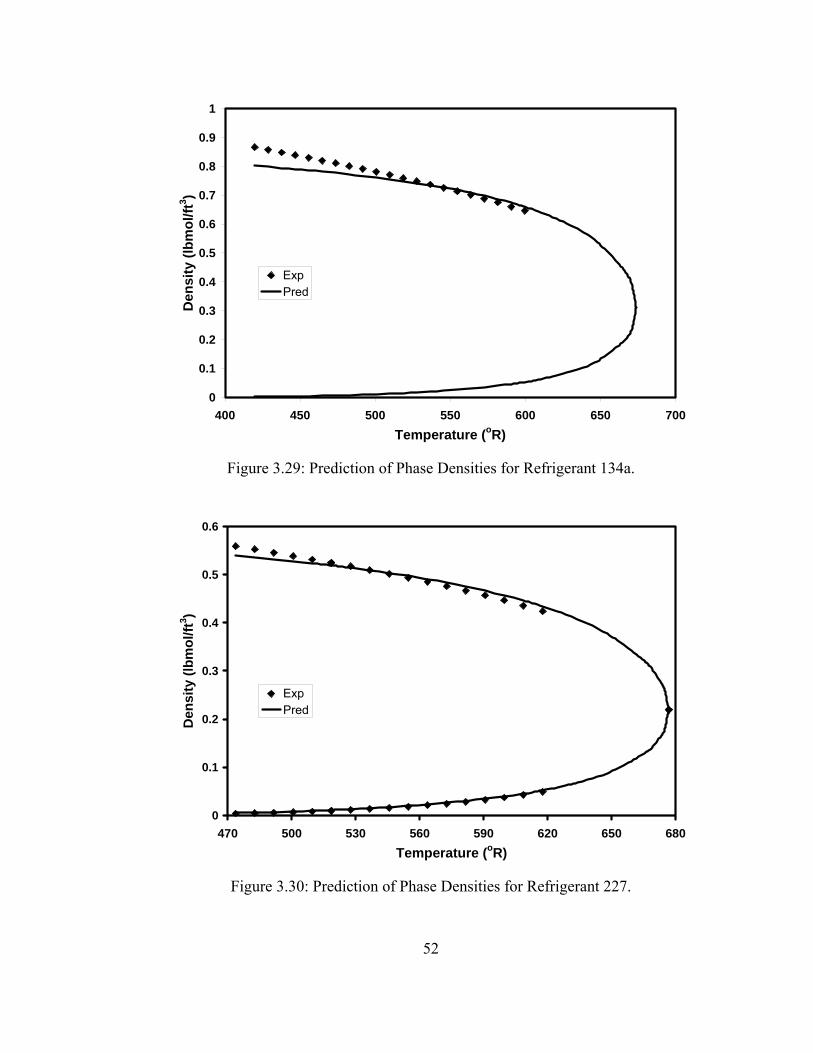
0
0.1
0.2
0.3
0.4
0.5
0.6
0.7
0.8
0.9
1
400 450 500 550 600 650 700Temperature (oR)
Den
sity
(lbm
ol/ft
3 )
ExpPred
Figure 3.29: Prediction of Phase Densities for Refrigerant 134a.
0
0.1
0.2
0.3
0.4
0.5
0.6
470 500 530 560 590 620 650 680Temperature (oR)
Den
sity
(lbm
ol/ft
3 )
ExpPred
Figure 3.30: Prediction of Phase Densities for Refrigerant 227.
52
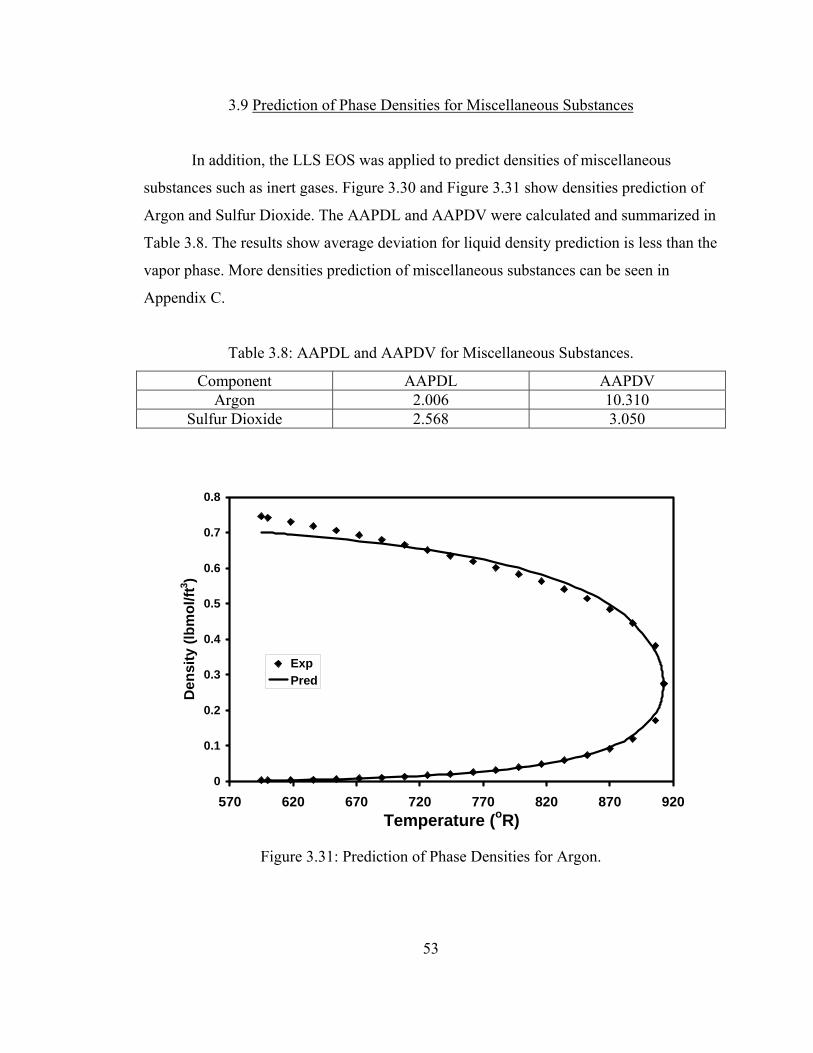
3.9 Prediction of Phase Densities for Miscellaneous Substances
In addition, the LLS EOS was applied to predict densities of miscellaneous
substances such as inert gases. Figure 3.30 and Figure 3.31 show densities prediction of
Argon and Sulfur Dioxide. The AAPDL and AAPDV were calculated and summarized in
Table 3.8. The results show average deviation for liquid density prediction is less than the
vapor phase. More densities prediction of miscellaneous substances can be seen in
Appendix C.
Table 3.8: AAPDL and AAPDV for Miscellaneous Substances.
Component AAPDL AAPDV Argon 2.006 10.310
Sulfur Dioxide 2.568 3.050
0
0.1
0.2
0.3
0.4
0.5
0.6
0.7
0.8
570 620 670 720 770 820 870 920Temperature (oR)
Den
sity
(lbm
ol/ft
3 )
ExpPred
Figure 3.31: Prediction of Phase Densities for Argon.
53
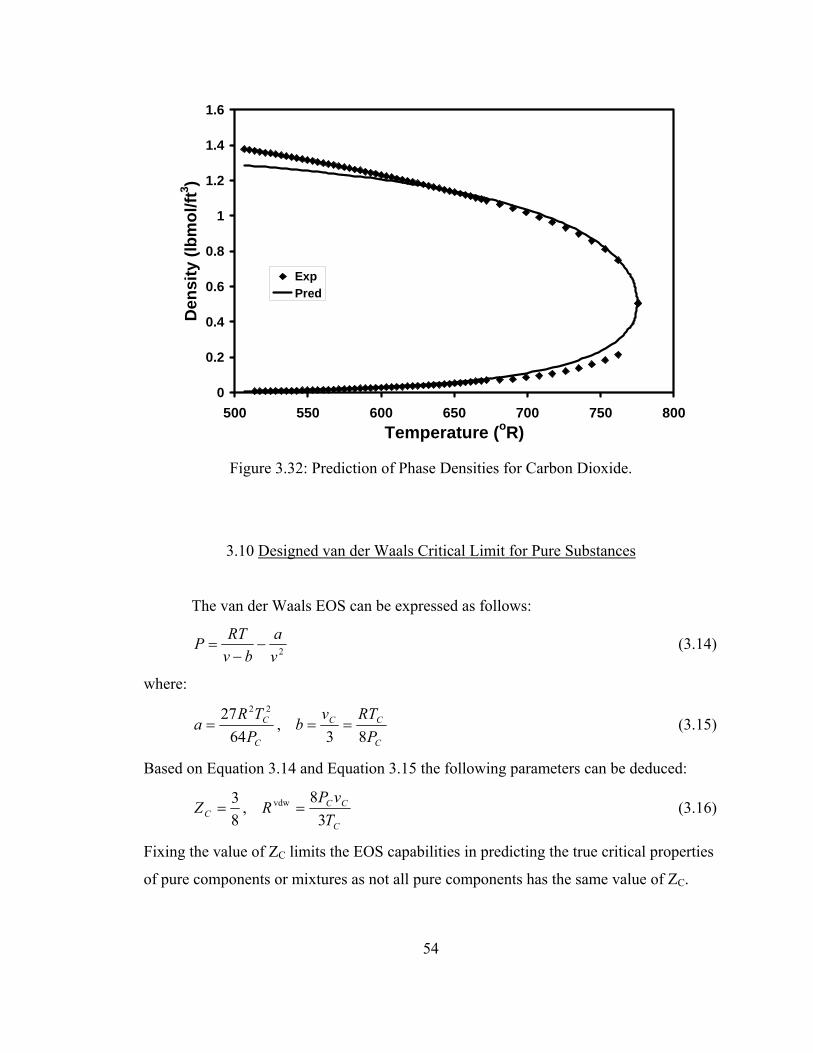
0
0.2
0.4
0.6
0.8
1
1.2
1.4
1.6
500 550 600 650 700 750 800Temperature (oR)
Den
sity
(lbm
ol/ft
3 )
ExpPred
Figure 3.32: Prediction of Phase Densities for Carbon Dioxide.
3.10 Designed van der Waals Critical Limit for Pure Substances
The van der Waals EOS can be expressed as follows:
2va
bvRTP −−
= (3.14)
where:
P
RTvb
PTR
aC
CC
C
C
83 ,
6427 22
=== (3.15)
Based on Equation 3.14 and Equation 3.15 the following parameters can be deduced:
T
vPRZ
C
CCC 3
8 ,
83 vdw == (3.16)
Fixing the value of ZC limits the EOS capabilities in predicting the true critical properties
of pure components or mixtures as not all pure components has the same value of ZC.
54
Improving the ability of equation of state in predicting the critical properties, LLS
EOS established ZC as a function of α and β and can be shown as:
)1(3
1−Ω+
=αw
CZ (3.17)
Parameter ΩW is a function of acentric factor and can be seen in Equation3.1.
Equation 3.17 was deduced from the coefficient comparison of LLS EOS for pure
substances (Equation 2.22) and expansion of ( ) 03 =− Cvv . The limit for the LLS EOS at
the critical point was developed as:
(3.18)
C
C
C
TTLimPPLimbvLim
→→→
3.11 Prediction of Critical Densities for Pure Substances
Applying the Van der Waals critical limit to the LLS EOS the critical densities of
pure substances can be calculated. Figure 3.32 through Figure 3.35 show the prediction of
critical densities of hydrocarbon, non-hydrocarbon, polar and refrigerant substances. The
absolute average percent deviations (AAPD) for these components were summarized in
Table 3.9.
55
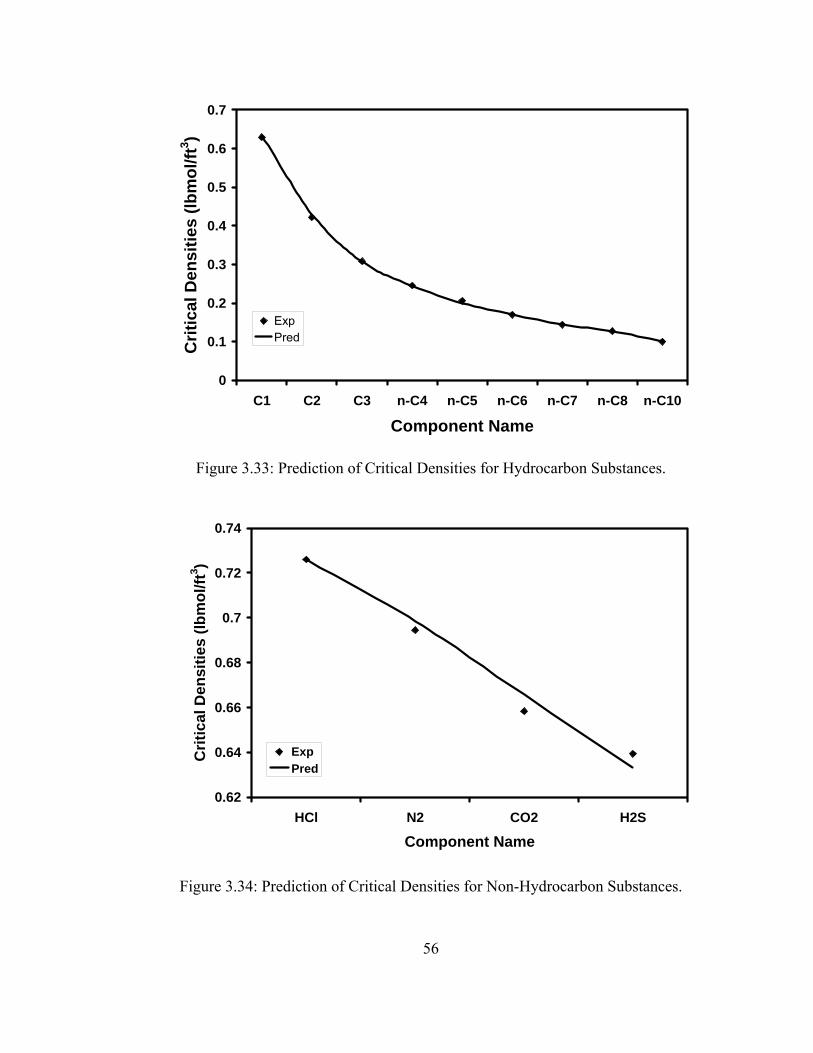
0
0.1
0.2
0.3
0.4
0.5
0.6
0.7
C1 C2 C3 n-C4 n-C5 n-C6 n-C7 n-C8 n-C10
Component Name
Crit
ical
Den
sitie
s (lb
mol
/ft3 )
ExpPred
Figure 3.33: Prediction of Critical Densities for Hydrocarbon Substances.
0.62
0.64
0.66
0.68
0.7
0.72
0.74
HCl N2 CO2 H2S
Component Name
Crit
ical
Den
sitie
s (lb
mol
/ft3 )
ExpPred
Figure 3.34: Prediction of Critical Densities for Non-Hydrocarbon Substances.
56

0
0.2
0.4
0.6
0.8
1
1.2
H2O NH3 HCl CO PH3 C3H8OComponent Name
Crit
ical
Den
sitie
s (lb
mol
/ft3 )
ExpPred
Figure 3.35: Prediction of Critical Densities for Polar Substances.
0.2
0.25
0.3
0.35
0.4
0.45
0.5
0.55
R 32 R152a R134a R12 R11 R227Component Name
Crit
ical
Den
sitie
s (lb
mol
/ft3 )
ExpPred
Figure 3.35: Prediction of Critical Densities for Refrigerant Substances.
57
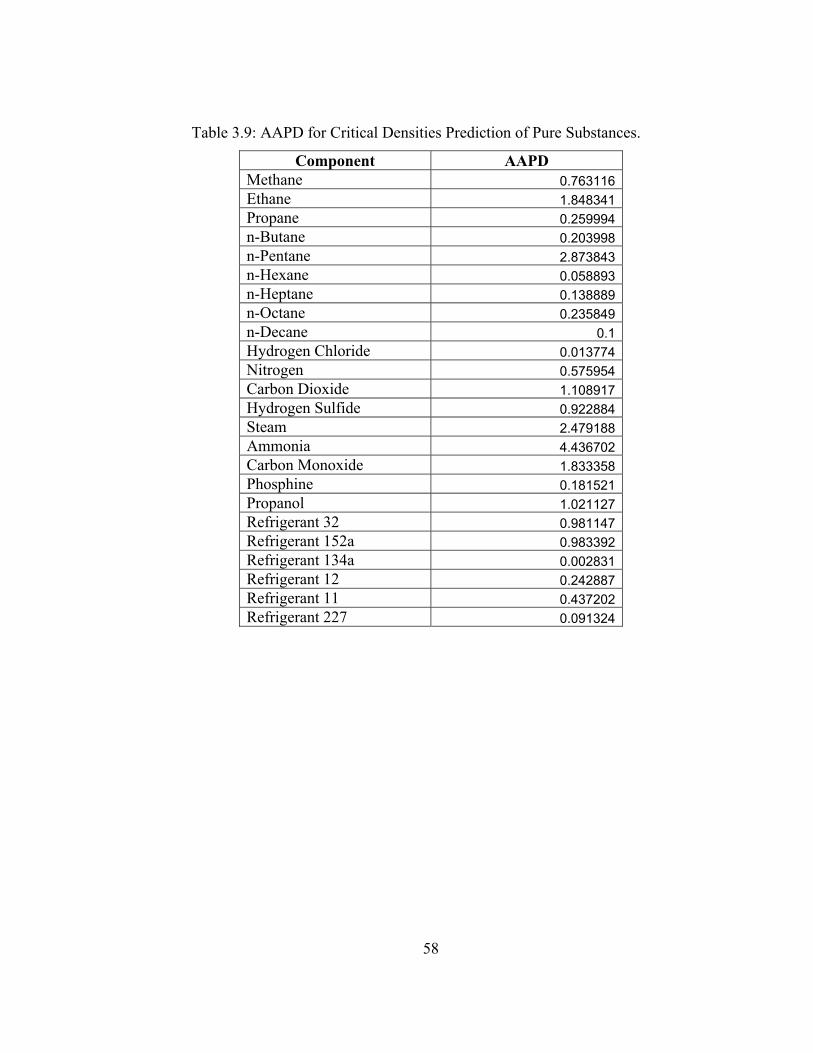
Table 3.9: AAPD for Critical Densities Prediction of Pure Substances.
Component AAPD Methane 0.763116 Ethane 1.848341 Propane 0.259994 n-Butane 0.203998 n-Pentane 2.873843 n-Hexane 0.058893 n-Heptane 0.138889 n-Octane 0.235849 n-Decane 0.1 Hydrogen Chloride 0.013774 Nitrogen 0.575954 Carbon Dioxide 1.108917 Hydrogen Sulfide 0.922884 Steam 2.479188 Ammonia 4.436702 Carbon Monoxide 1.833358 Phosphine 0.181521 Propanol 1.021127 Refrigerant 32 0.981147 Refrigerant 152a 0.983392 Refrigerant 134a 0.002831 Refrigerant 12 0.242887 Refrigerant 11 0.437202 Refrigerant 227 0.091324
58
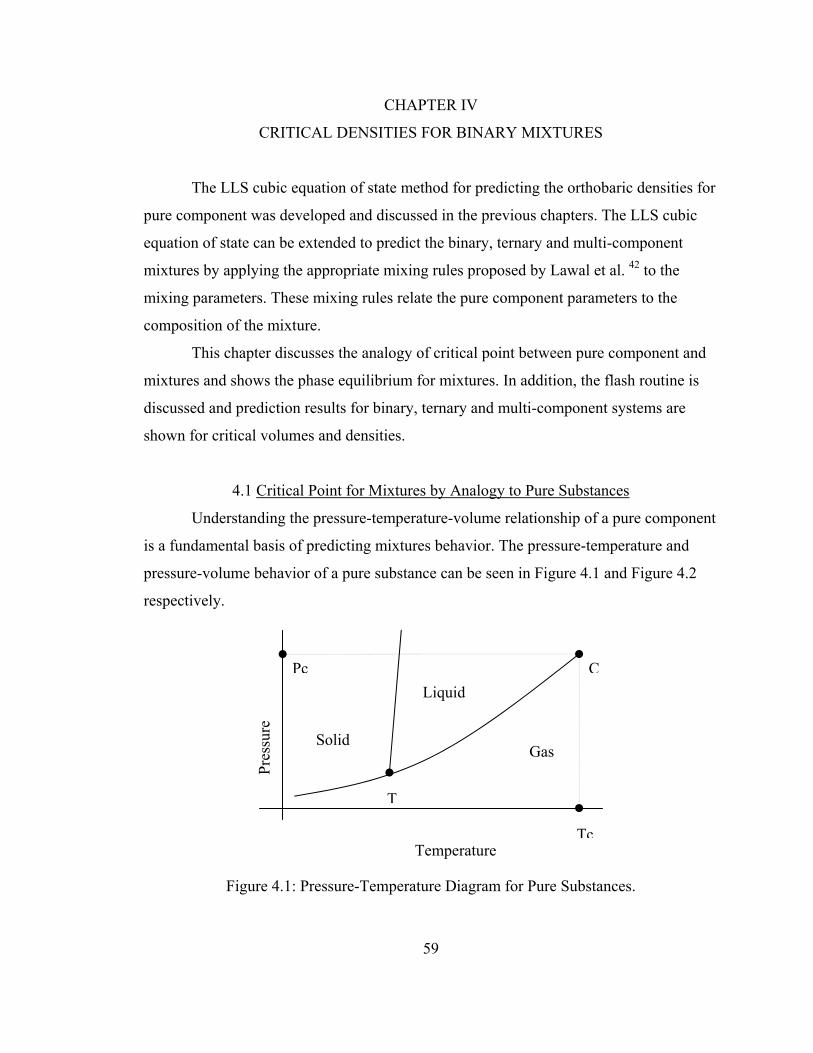
CHAPTER IV
CRITICAL DENSITIES FOR BINARY MIXTURES
The LLS cubic equation of state method for predicting the orthobaric densities for
pure component was developed and discussed in the previous chapters. The LLS cubic
equation of state can be extended to predict the binary, ternary and multi-component
mixtures by applying the appropriate mixing rules proposed by Lawal et al. 42 to the
mixing parameters. These mixing rules relate the pure component parameters to the
composition of the mixture.
This chapter discusses the analogy of critical point between pure component and
mixtures and shows the phase equilibrium for mixtures. In addition, the flash routine is
discussed and prediction results for binary, ternary and multi-component systems are
shown for critical volumes and densities.
4.1 Critical Point for Mixtures by Analogy to Pure Substances
Understanding the pressure-temperature-volume relationship of a pure component
is a fundamental basis of predicting mixtures behavior. The pressure-temperature and
pressure-volume behavior of a pure substance can be seen in Figure 4.1 and Figure 4.2
respectively.
Figure 4.1: Pressure-Temperature Diagram for Pure Substances.
Pres
sure
Liquid
T
Pc C
Solid Gas
TcTemperature
59

Tc
Pres
sure
Volume Figure 4.2: Pressure-volume Diagram for Pure Substances.
The behavior of a two or more component mixture is more complex than a pure
compound. Binary, ternary and multi-component mixtures are formed by combination of
pure substances which has one point in the Pressure-Temperature and Pressure-volume
diagrams for their critical point. As described in Chapter 1, the critical point for a pure
substance is defined as a point where there is no more properties distinction between two
phases. This definition is no longer valid for mixtures because it is possible that both the
vapor and liquid phase exist after the critical point.
Combination of several pure substances forms a mixture. This mixture has a
unique point as the critical state. The critical point for mixtures is defined simply as a
conjunction point of bubble- and dew-point line. Bubble-point is the pressure condition at
which the first bubble is formed while dew-point is the pressure where the amount of
liquid is minute. The Pressure-Temperature and Pressure-volume relation for mixtures
can be seen in Figure 4.3 and Figure 4.4 respectively. In Figure 4.3, the term
cricondenbar means the highest pressure above which no gas can be formed for that
mixture while the term cricondenterm means the highest temperature above which a
liquid cannot occur for a particular mixture.
60
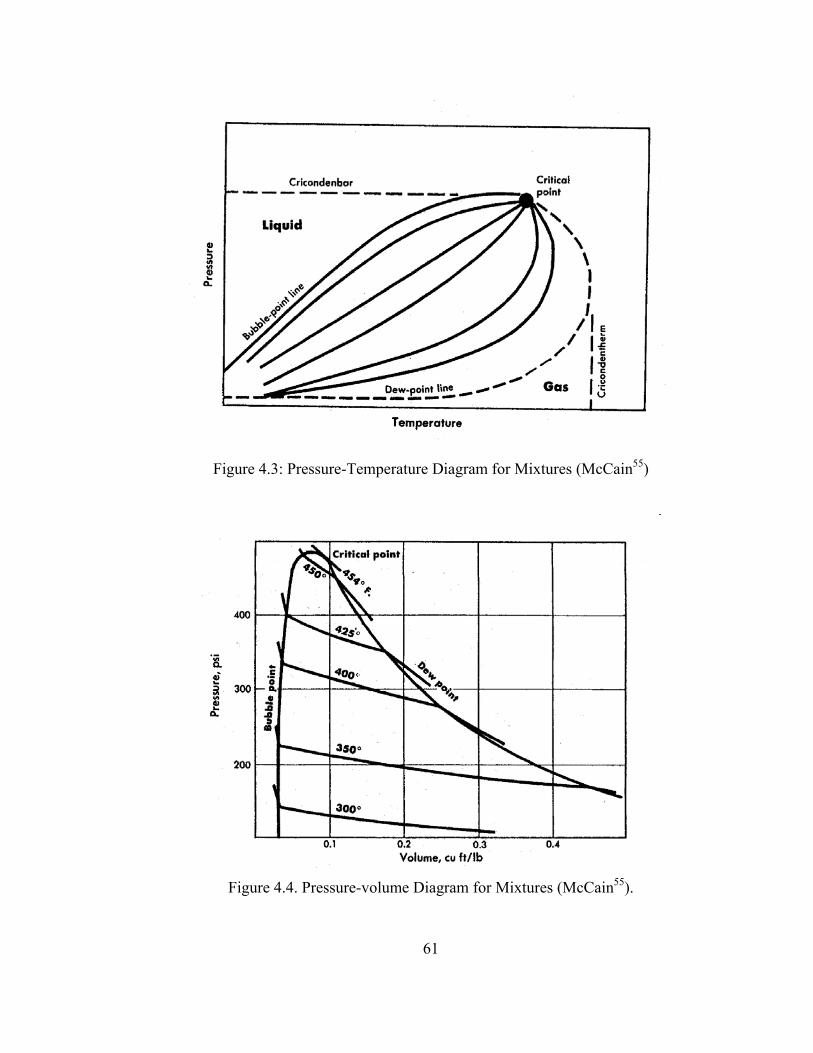
Figure 4.3: Pressure-Temperature Diagram for Mixtures (McCain55)
Figure 4.4. Pressure-volume Diagram for Mixtures (McCain55).
61
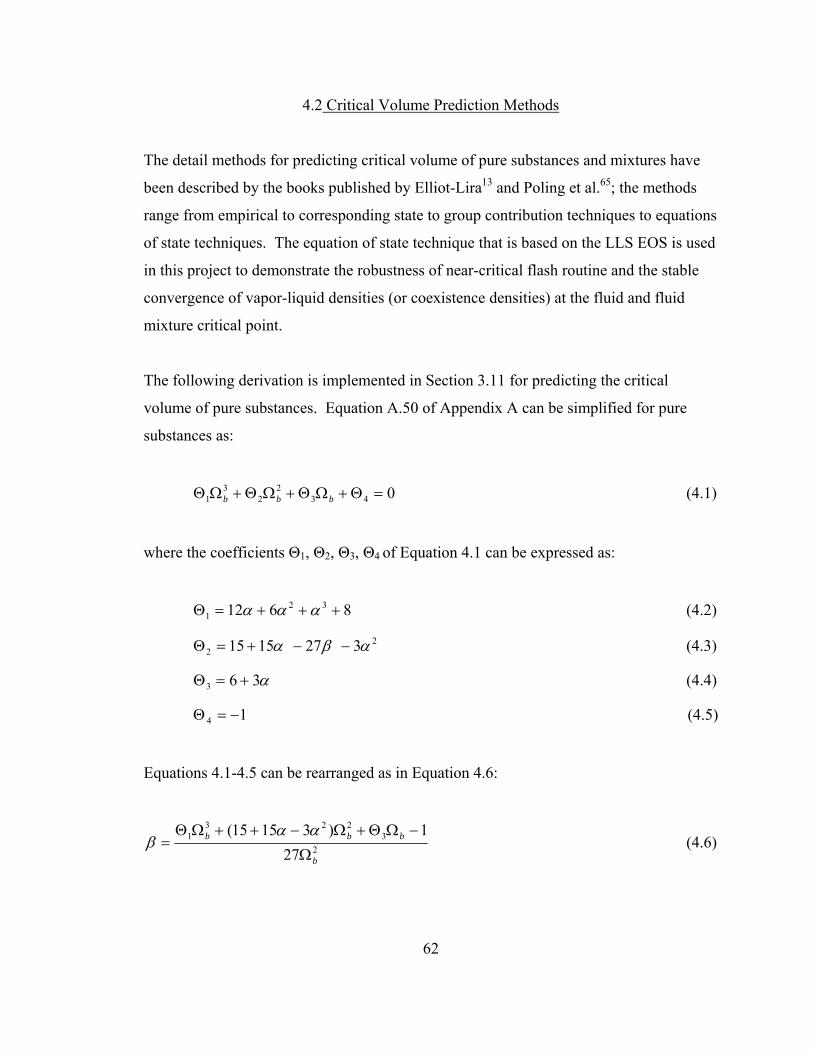
4.2 Critical Volume Prediction Methods
The detail methods for predicting critical volume of pure substances and mixtures have
been described by the books published by Elliot-Lira13 and Poling et al.65; the methods
range from empirical to corresponding state to group contribution techniques to equations
of state techniques. The equation of state technique that is based on the LLS EOS is used
in this project to demonstrate the robustness of near-critical flash routine and the stable
convergence of vapor-liquid densities (or coexistence densities) at the fluid and fluid
mixture critical point.
The following derivation is implemented in Section 3.11 for predicting the critical
volume of pure substances. Equation A.50 of Appendix A can be simplified for pure
substances as:
0432
23
1 =Θ+ΩΘ+ΩΘ+ΩΘ bbb (4.1)
where the coefficients Θ1, Θ2, Θ3, Θ4 of Equation 4.1 can be expressed as:
8612 321 +++=Θ ααα (4.2)
22 3271515 αβα −−+=Θ (4.3)
α363 +=Θ (4.4)
(4.5) 14 −=Θ
Equations 4.1-4.5 can be rearranged as in Equation 4.6:
23
2231
271)31515(
b
bbb
Ω
−ΩΘ+Ω−++ΩΘ=
ααβ (4.6)
62
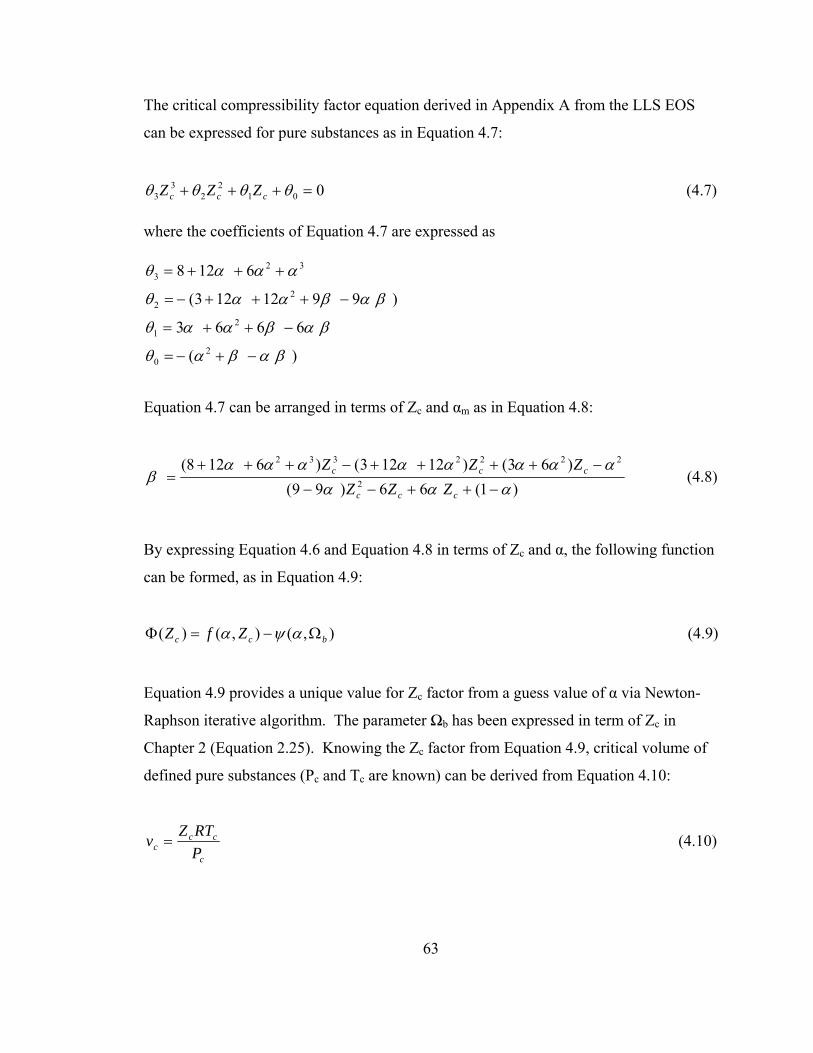
The critical compressibility factor equation derived in Appendix A from the LLS EOS
can be expressed for pure substances as in Equation 4.7:
0012
23
3 =+++ θθθθ ccc ZZZ (4.7) where the coefficients of Equation 4.7 are expressed as
)(
6663
)9912123(
6128
20
21
22
323
βαβαθ
βαβααθ
βαβααθ
αααθ
−+−=
−++=
−+++−=
+++=
Equation 4.7 can be arranged in terms of Zc and αm as in Equation 4.8:
)1(66)99()63()12123()6128(
2
2222332
ααααααααααα
β−++−−
−++++−+++=
ccc
ccc
ZZZZZZ
(4.8)
By expressing Equation 4.6 and Equation 4.8 in terms of Zc and α, the following function
can be formed, as in Equation 4.9:
),(),()( bcc ZfZ Ω−=Φ αψα (4.9)
Equation 4.9 provides a unique value for Zc factor from a guess value of α via Newton-
Raphson iterative algorithm. The parameter Ωb has been expressed in term of Zc in
Chapter 2 (Equation 2.25). Knowing the Zc factor from Equation 4.9, critical volume of
defined pure substances (Pc and Tc are known) can be derived from Equation 4.10:
c
ccc P
RTZv = (4.10)
63

The prediction results for the critical volumes of pure substances are shown in Figures
3.33-3.35. The results are generally within 1% of the experimental values.
Similar process can be performed form the critical volumes of mixtures. In that case, the
mixture forms of Equations 4.1 - 4.7 are applied. Equation A.50 of Appendix A can be
simplified as:
0432
23
1 =Θ+Θ+Θ+Θ CCC BBB (4.11)
where the coefficients are Θ1, Θ2, Θ3, Θ4 of Equation 4.11 defined by:
8612 321 +++=Θ mmm ααα (4.12)
22 3271515 mmm αβα −−+=Θ (4.13)
mα363 +=Θ (4.14)
14 −=Θ (4.15)
It can be seen from Equation 4.11that ),( mmC fB βα= . It is therefore imperative to solve
βm as a function of BC and αm as shown in Equation 4.16, solving for βm yields:
23
2231
271)31515(
C
CCmmCm B
BBB −Θ+−++Θ=
ααβ (4.16)
64

Equation 4.7 can also be used for the composition dependent critical compressibility
factor can be expressed as in Equation 4.17.60
001
22
33 =+++ θθθθ ccc ZZZ (4.17)
where
)(
6663
)9912123(
6128
20
21
22
323
mmmm
mmmmm
mmmmm
mmm
βαβαθ
βαβααθ
βαβααθ
αααθ
−+−=
−++=
−+++−=
+++=
Equation 4.17 can be arranged in terms of Zc and αm as in Equation 4.18:
)1(66)99()63()12123()6128(
2
2222332
mcmccm
mcmmcmmcmmmm ZZZ
ZZZααα
ααααααααβ−++−−
−++++−+++= (4.18)
Equation 4.9 provides a unique value for the mixture Zc factor from a guess value of αm
via Newton-Raphson iterative algorithm. Also, by judiciously selecting the interaction
parameters for parameters αm and βm, Equation 4.17 is readily resolved for the Zc factor
of mixture. That technique is used in this project to derive the critical volumes for
mixtures.
4.3 Critical Volume for Binary Hydrocarbon Systems
Figures 4.5 - 4.8 show the prediction results from the critical volumes of methane binary
systems. Expect for the scatters in the experimental data, the prediction results are within
1.5% of the experimental data. Figures 4.9 - 4.11 show the prediction results from the
critical volumes of ethane binary systems. The prediction results are within 1.6% of the
65

experimental data. Figures 4.12 - 4.16 show the prediction results from the critical
volumes of propane binary systems. The prediction results are within 2.1% of the
experimental data. Figures 4.17 - 4.21 show the prediction results from the critical
volumes of n-butane binary systems. The prediction results are within 1.9% of the
experimental data.
4.4 Critical Volume for Binary Non-Hydrocarbon Systems
Figure 4.22 shows the prediction results from the critical volumes of carbon dioxide in
hydrogen sulfide binary systems. The prediction results are within 3.5% of the
experimental data because of the scatter in the measured data. Figures 4.23 - 4.25 show
the prediction results from the critical volumes of carbon dioxide in paraffin hydrocarbon
binary systems. Expect for the scatters in the experimental data, the prediction results are
within 2.5% of the experimental data.
4.5 Analysis of Prediction Results for Mixture Critical Volumes
The prediction results shown in Sections 4.3 - 4.4, show that technique described in
Section 4.2 can be an aid to the experimentalists, particularly where measurement of
critical volumes are difficult due to thermal decomposition of the substance: such as
unstable substances and petroleum fractions.
66
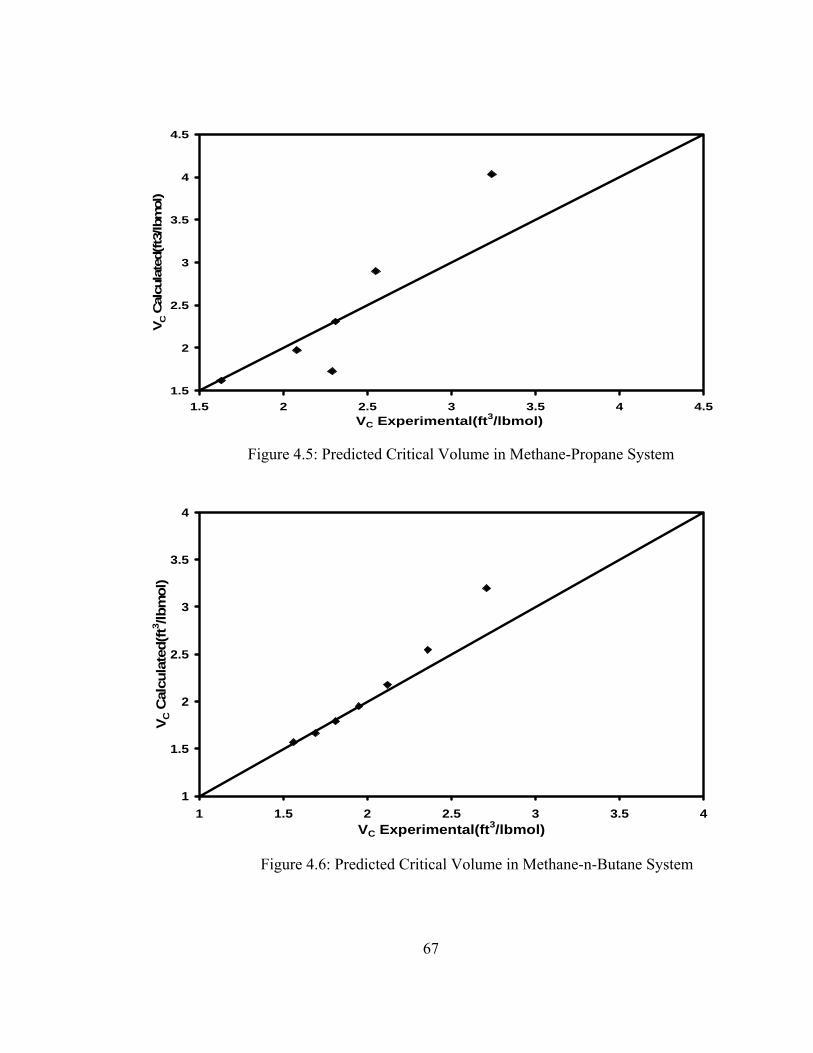
1.5
2
2.5
3
3.5
4
4.5
1.5 2 2.5 3 3.5 4 4.5VC Experimental(ft3/lbmol)
V C C
alcu
late
d(ft3
/lbm
ol)
Figure 4.5: Predicted Critical Volume in Methane-Propane System
1
1.5
2
2.5
3
3.5
4
1 1.5 2 2.5 3 3.5 4VC Experimental(ft3/lbmol)
V C C
alcu
late
d(ft3 /lb
mol
)
Figure 4.6: Predicted Critical Volume in Methane-n-Butane System
67
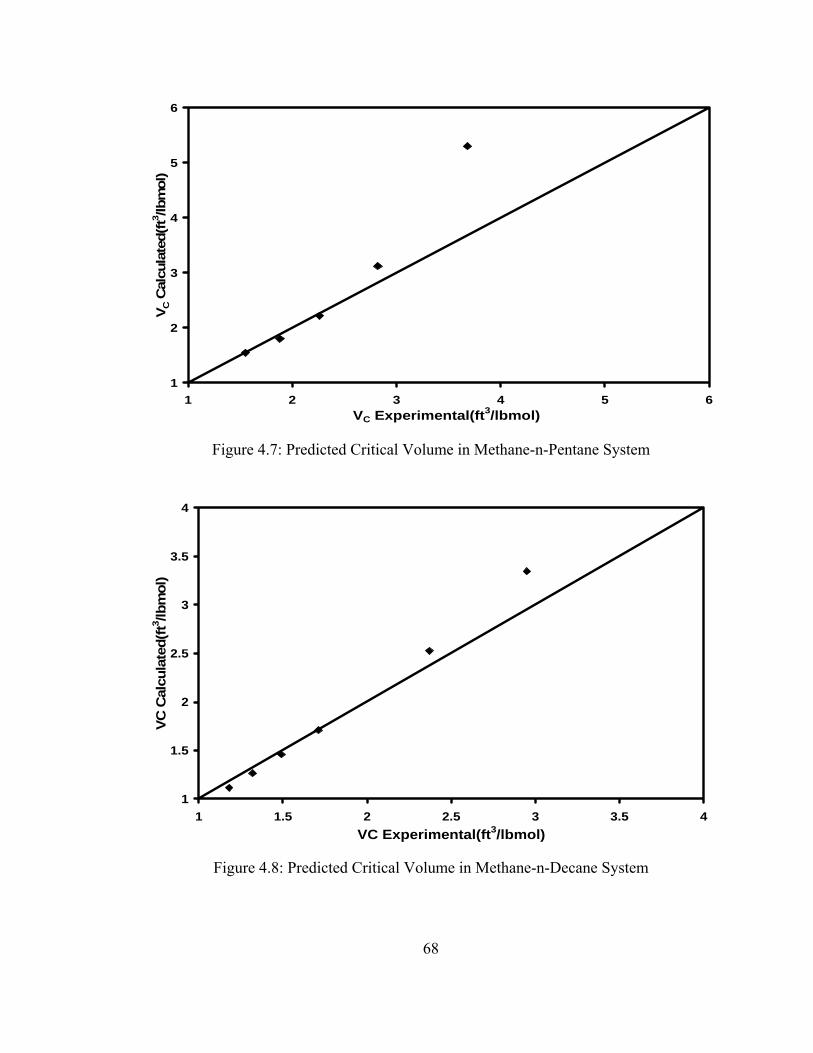
1
2
3
4
5
6
1 2 3 4 5VC Experimental(ft3/lbmol)
V C C
alcu
late
d(ft3 /lb
mol
)
6
Figure 4.7: Predicted Critical Volume in Methane-n-Pentane System
1
1.5
2
2.5
3
3.5
4
1 1.5 2 2.5 3 3.5 4VC Experimental(ft3/lbmol)
VC C
alcu
late
d(ft3 /lb
mol
)
Figure 4.8: Predicted Critical Volume in Methane-n-Decane System
68
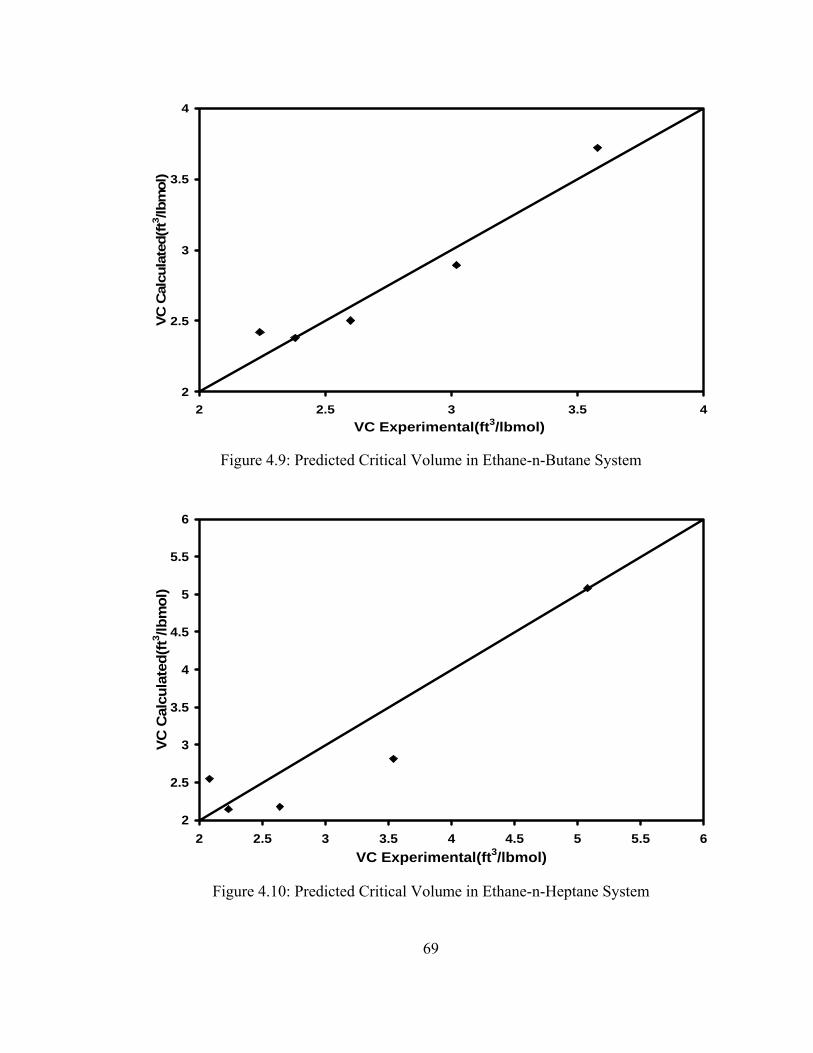
2
2.5
3
3.5
4
2 2.5 3 3.5VC Experimental(ft3/lbmol)
VC C
alcu
late
d(ft3 /lb
mol
)
4
Figure 4.9: Predicted Critical Volume in Ethane-n-Butane System
2
2.5
3
3.5
4
4.5
5
5.5
6
2 2.5 3 3.5 4 4.5 5 5.5VC Experimental(ft3/lbmol)
VC C
alcu
late
d(ft3 /lb
mol
)
6
Figure 4.10: Predicted Critical Volume in Ethane-n-Heptane System
69

1
1.5
2
2.5
3
3.5
4
1 1.5 2 2.5 3 3.5 4VC Experimental(ft3/lbmol)
VC C
alcu
late
d(ft3 /lb
mol
)
Figure 4.11: Predicted Critical Volume in Ethane-n-Decane System
3
3.5
4
4.5
3 3.5 4 4VC Experimental(ft3/lbmol)
VC C
alcu
late
d(ft3 /lb
mol
)
.5
Figure 4.12: Predicted Critical Volume in Propane-n-Butane System
70
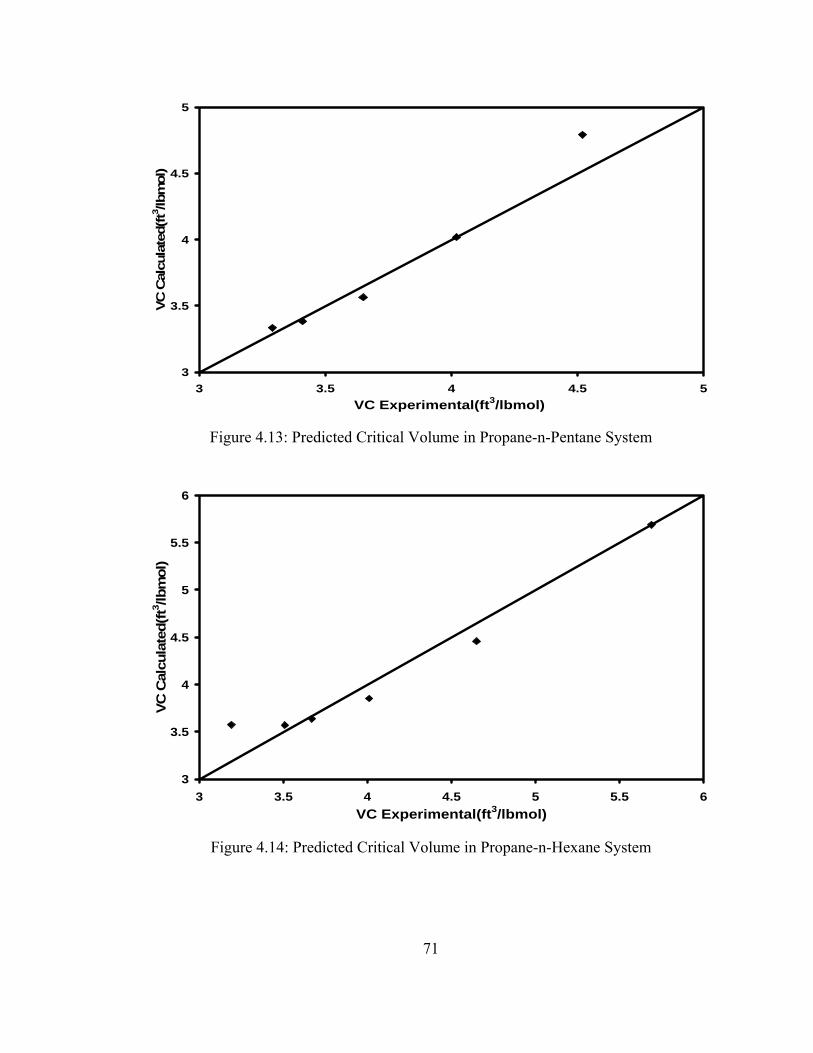
3
3.5
4
4.5
5
3 3.5 4 4.5VC Experimental(ft3/lbmol)
VC C
alcu
late
d(ft3 /lb
mol
)
5
Figure 4.13: Predicted Critical Volume in Propane-n-Pentane System
3
3.5
4
4.5
5
5.5
6
3 3.5 4 4.5 5 5.5 6VC Experimental(ft3/lbmol)
VC C
alcu
late
d(ft3 /lb
mol
)
Figure 4.14: Predicted Critical Volume in Propane-n-Hexane System
71

3
4
5
6
7
8
3 4 5 6 7VC Experimental(ft3/lbmol)
VC C
alcu
late
d(ft3 /lb
mol
)
8
Figure 4.15: Predicted Critical Volume in Propane-n-Octane System
3
3.2
3.4
3.6
3.8
4
4.2
4.4
4.6
4.8
5
3 3.5 4 4.5VC Experimental(ft3/lbmol)
VC C
alcu
late
d(ft3 /lb
mol
)
5
Figure 4.16: Predicted Critical Volume in Propane-n-Decane System
72
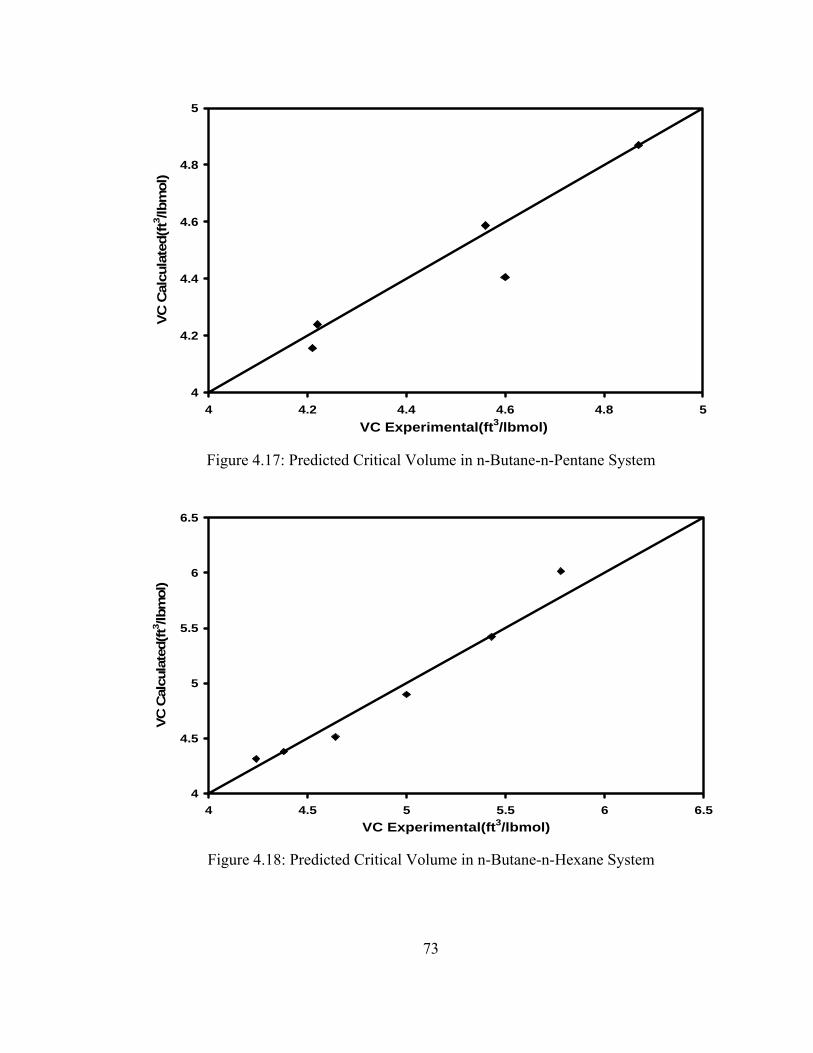
4
4.2
4.4
4.6
4.8
5
4 4.2 4.4 4.6 4.8 5VC Experimental(ft3/lbmol)
VC C
alcu
late
d(ft3 /lb
mol
)
Figure 4.17: Predicted Critical Volume in n-Butane-n-Pentane System
4
4.5
5
5.5
6
6.5
4 4.5 5 5.5 6 6VC Experimental(ft3/lbmol)
VC C
alcu
late
d(ft3 /lb
mol
)
.5
Figure 4.18: Predicted Critical Volume in n-Butane-n-Hexane System
73

4
4.5
5
5.5
6
6.5
7
4 4.5 5 5.5 6 6.5 7VC Experimental(ft3/lbmol)
VC C
alcu
late
d(ft3 /lb
mol
)
Figure 4.19: Predicted Critical Volume in n-Butane-n-Heptane System
4
4.5
5
5.5
6
6.5
7
7.5
8
4 4.5 5 5.5 6 6.5 7 7.5VC Experimental(ft3/lbmol)
VC C
alcu
late
d(ft3 /lb
mol
)
8
Figure 4.20: Predicted Critical Volume in n-Butane-n-Octane System
74
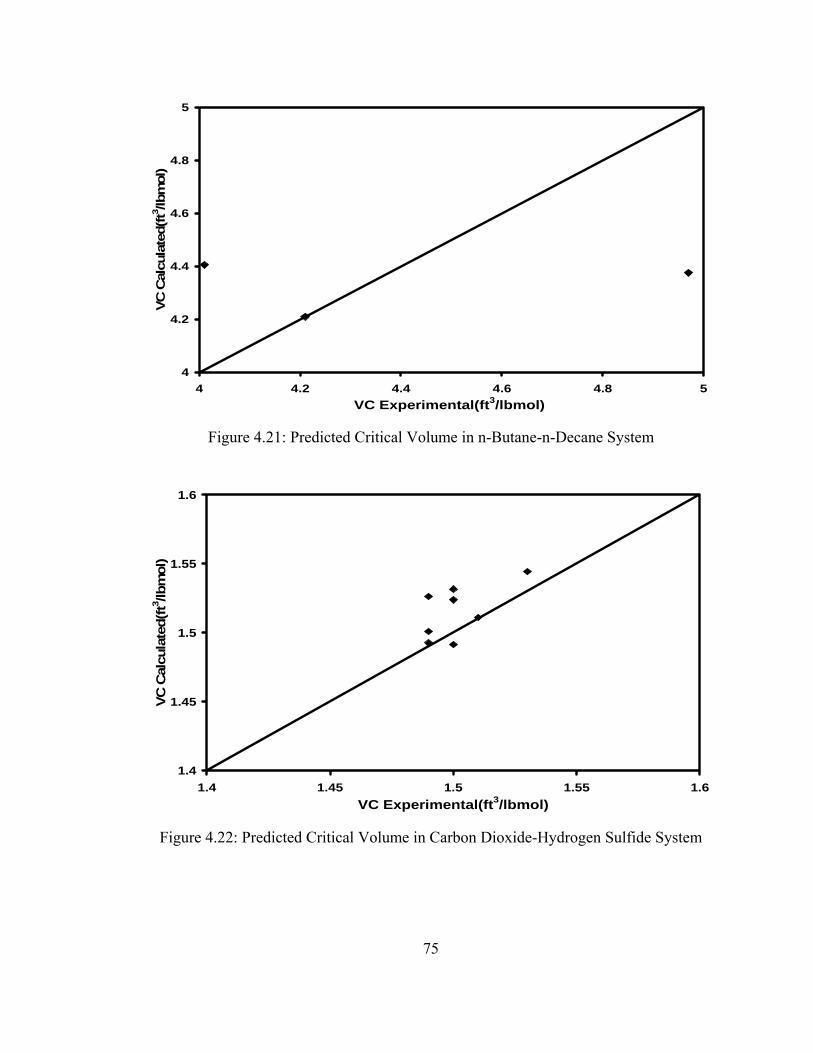
4
4.2
4.4
4.6
4.8
5
4 4.2 4.4 4.6 4.8 5VC Experimental(ft3/lbmol)
VC C
alcu
late
d(ft3 /lb
mol
)
Figure 4.21: Predicted Critical Volume in n-Butane-n-Decane System
1.4
1.45
1.5
1.55
1.6
1.4 1.45 1.5 1.55VC Experimental(ft3/lbmol)
VC C
alcu
late
d(ft3 /lb
mol
)
1.6
Figure 4.22: Predicted Critical Volume in Carbon Dioxide-Hydrogen Sulfide System
75

2
2.5
3
3.5
4
2 2.5 3 3.5VC Experimental(ft3/lbmol)
VC C
alcu
late
d(ft3 /lb
mol
)
4
Figure 4.23: Predicted Critical Volume in Carbon Dioxide-n-Butane System
1
1.5
2
2.5
3
3.5
4
4.5
5
1 1.5 2 2.5 3 3.5 4 4.5VC Experimental(ft3/lbmol)
VC C
alcu
late
d(ft3 /lb
mol
)
5
Figure 4.24: Predicted Critical Volume in Carbon Dioxide-n-Hexane System
76

1
1.5
2
2.5
3
3.5
4
1 1.5 2 2.5 3 3.5 4VC Experimental(ft3/lbmol)
VC C
alcu
late
d(ft3 /lb
mol
)
Figure 4.25: Predicted Critical Volume in Carbon Dioxide-n-Decane System
77
CHAPTER V
CONCLUSIONS AND RECOMMENDATIONS
The primary objective of this project is to develop a reliable and robust method to
predict the density of pure component and mixtures. The method used in predicting phase
densities for pure components is used as a foundation to analyze critical densities of
binary, ternary and multi-component mixtures.
5.1 Conclusions
The conclusions drawn from the results of this project can be stated as:
1. A robust technique is developed for predicting the volumetric
properties of pure substances and critical densities of binary systems.
2. A comprehensive experimental data sets on vapor pressures and
orthobaric densities data for pure substances (hydrocarbons, non-
hydrocarbons, polar, non-polar and refrigerants) have been tabulated
into the data bank of the Center for Applied Petrophysical and
Reservoir Studies.
3. The Van der Waals critical limit parameter (Ωw) correlation for pure
substances (hydrocarbons, non-hydrocarbons, polar, non-polar and
refrigerants) that is consistent with the coexistence vapor-liquid phase
densities has been developed for use in thermodynamic and transport
property correlations.
4. A new attractive-temperature function has been designed for cubic
equations of state, the framework of the temperature function is used
to predict second virial coefficient of pure substances. The prediction
results shown for three cubic equations of state (SRK, PR and LLS)
show the temperature function is applicable to sub- and super-critical
78
fluid behavior. The temperature function is also consistent with the
mathematical constraint established for the theory of cubic equations
of state: as reduced temperature 0)( →Ta .∞→RT
5. Vapor pressures for pure substances and saturated vapor-liquid
volumes of pure substances are accurately predicted with the
temperature function; the prediction results are generally within 0.5%
of the experimental data.
6. Near-critical flash computations for phase densities are resolved for
pure substances and binary mixtures by accurately predicting critical
densities of the fluid and fluid mixture with analytical solution derived
from the LLS EOS. The prediction results are generally within 0.5%
to 3.5% of the experimental measurements.
7. The Lawal-Lake-Silberberg equation of state is also demonstrated as
the foundation for developing a closed-form van der Waals critical
density routine for the prediction of subcritical, critical and
supercritical regions volumetric properties.
5.2 Recommendations
It is recommended that the method developed for the phase densities of pure substances
and the critical volumes of binary systems be extended to ternary and multicomponent
systems. The success of the techniques would provide a basis for the development of a
predictive equation-of-state for reservoir fluids.
79

REFERENCES
1. Allen, J. C., “Classification of Oil and Gas Wells,” Oil and Gas J., 51(12), 355 (1952).
2. American Society of Heating, Refrigeration and Air-Conditioning Engineers, ASHRAE Handbook. Heating, Ventilating, and Air-Conditioning Systems and Equipment (Inch- Pound Edition), American Society of Heating, Refrigeration and Air-Conditioning Engineers, Atlanta, GA (1993).
3. Amyx, J. W., Bass, D. M., Jr., Whiting, R. L., Petroleum Reservoir Engineering Physical Properties, McGraw-Hill, New York (1960).
4. Blas, F. J., and Vega, L. F., “Prediction of Binary and Ternary Diagrams Using the Statistical Associating Fluid Theory (SAFT) Equation of State,” Ind. Eng. Chem. Res., 37, 660 (1998).
5. Buxton, T. S., and Campbell, J. M., “Compressibility for Lean Natural Gas-Carbon Dioxide Mixtures at High Pressure,” Paper SPE 1590 presented at SPE 41st Annual Fall Meeting, Dallas, TX, Oct. 2-5, 1966.
6. Byun, H. S., Kim, K., and McHugh, M. A., “Phase Behavior and Modeling of Supercritical Carbon Dioxide-Organic Acid Mixtures,” Ind. Eng. Chem. Res., 39, 4580 (2000).
7. Chou, G. F., and Prausnitz, J. M., “A Phenomenological Correction to an Equation of State for the Critical Region,” AIChE Journal, 35 (9), 1487 (1989).
8. Coats, K., “Use and Misuse of Reservoir Simulation Models,” J. Pet. Tech., SPE Paper 2367, Nov 1969.
9. Danesh, A., Xu, D.-H., Tehrani, D. H., Todd, A. C., “Improving Predictions of Equation of State by Modifying Its Parameters for Super Critical Components of Hydrocarbon Reservoir Fluids,” Fluid Phase Equilibria, 112, 45 (1995).
10. Dewitt, K. J., and Thodos, G., “Viscosities of Binary Mixtures in the Dense Gaseous State: The Methane- Carbon Dioxide System,” Can. J. Chem. Eng., 44, 148 (1966).
11. Di Nicola, G., “P-V-T Behavior of 1, 1, 1, 2, 3, 3, 3-Heptafluoropropane (R227ea),” J. Chem. Eng. Data 48, 1332 (2003).
12. Dymond, J. H., and Smith, E. B., The Virial Coefficients of Pure Gases and Mixtures. Clarendon Press, Oxford (1980).
13. Elliot, J. R., Lira, C. T., Introductory Chemical Engineering Thermodynamics, Prentice Hall, NJ, (1999).
14. Elsharkawy, A. M., “Predicting the Properties of Sour Gases and Condensates: Equations of State and Empirical Correlations” Paper SPE 74369 presented at the 2002 Society of Petroleum Engineer International Petroleum Conferences and Exhibition, Villahermosa (February 10-12).
80
15. Erdogmus, M., and Adewumi, M. A., “A Modified Equation of State for Gas-Condensate Systems,” Paper SPE 65632 presented at the 2000 Society of Petroleum Engineer Eastern Regional Meeting, Morgantown (October 17-19).
16. Escobedo, J., and Mansoori, G. A., “Surface-Tension Prediction for Liquid Mixtures,” AIChE Journal, 44 (10), 2324 (1998).
17. Eubank, P. T., and Hall, K. R., “New Identities for Critical Constraints with Application to Cubic Equations of State,” Ind. Eng. Chem. Res., 43, 4446 (2004).
18. Eubank, P. T., and Wang, X., “Saturation Properties from Equations of State,” Ind. Eng. Chem. Res., 42, 3838 (2004).
19. Firoozabadi, A., Thermodynamics of Hydrocarbon Reservoirs, McGraw-Hill, New York (1999).
20. Firoozabadi, A., Arbabi, S. and Dindoruk, B., “Near-Critical Behavior of Mixtures Using Equations of State,” Can. J. Chem. Eng., 72, 134 (1994).
21. Flöter, E., de Loos, Th. W., de Swaan Arons, J. Improved Modeling of the Phase Behavior of Asymmetric Hydrocarbon Mixtures with the Peng-Robinson Equation of State Using the Different Temperature Dependency of the Parameter a,” Ind. Chem. Eng. Res., 37, 1651 (1998).
22. Fu, D., and Li, Y. G., “Investigation of the Phase Equilibria for Nonpolar Chainlike Fluids by the Yukawa Potential and Renormalization-Group Theory,” Ind. Eng. Chem. Res., 43, 2271 (2004).
23. Gasem, K. A. M., Gao, W., Pan, Z., Robinson, R. L., Jr., “A Modified Temperature Dependence for the Peng-Robinson Equation of State,” Fluid Phase Equilibria, 181, 113 (2001).
24. Geller, V., Bivens, D., and Yokozeki, A., “Transport Properties and Surface Tension of Hydrofluorocarbons HFC 236fa and HFC 245fa,” Proceedings of the 20th International Congress of Refrigeration, Sydney, Australia (September 19-24, 1999).
25. Gess, M. A., Danner, R. P., and Nagvekar, M., Thermodynamic Analysis of Vapor-Liquid Equilibria: Recommended Models and a Standard Data Base, Department of Chemical Engineering, The Pennsylvania State University, University Park, PA, DIPPR, American Institute of Chemical Engineering (1991).
26. Gibbs, J.W., The Scientific Papers of J Willard Gibbs, 1, Dover Publications, New York (1961).
27. Gonzalez, M. H., Bukacek, R. F., and Lee, A. L., “The Viscosity of Methane,” Paper SPE 1483 presented at the 41st Society of Petroleum Engineer Annual Fall Meeting, Dallas, Texas, Oct. 2-5, 1966.
28. Gonzalez, M. H., and Lee, A. L., “Viscosity of Isobutane,” J. Chem. Eng. Data, 11 (3), 357 (1966).
81

29. Gross, J., and Sadowski, G., “Application of the Perturbed-Chain SAFT Equation of State to Associating Systems,” Ind. Eng. Chem. Res., 41, 5510 (2002).
30. Han, L. Z., Zhu, M. S., Li, X. Y., and Luo, D., “Viscosity of Saturated Liquid for 1, 1, 1, 2-Tetrafluoroethane,” J. Chem. Eng. Data, 40 (3), 650 (1995).
31. Horstmann, S., Fischer, K., and Gmehling, J., “Measurement and Calculation of Critical Points for Binary and Ternary Mixtures,” AIChE Journal, 48 (10), 2350 (2002).
32. Hu, P., Chen, Z. S., and Cheng, W. L., “Prediction of Vapor-Liquid Equilibria Properties of Several HFC Binary Refrigerant Mixtures,” Fluid Phase Equilibria, 204, 75 (2003).
33. Jiuxun, S., “Totally Inclusive Cubic Equation of State with Five Parameters for Pure Fluids,” Fluid Phase Equilibria, 193, 1 (2003).
34. Kappallo, W., Lund, N., Schaffer, K., “Intermolecular Forces Between Equal and Different Molecular from the Virial Coefficient,” Z. Phys. Chem., 37 (34), 196 (1963).
35. Kaliappan, C. S., and Rowe, A. M., “Calculation of Pressure-Temperature Phase Envelopes of Multicomponent Systems,” Paper SPE 2885 presented at Third Biennial Gas Industry Symposium, Omaha, Nebraska, May 21-22, 1970.
36. Kedge, C. J., and Trebble, M.A., “Improvements to A New Equation of State for Pure Components,” Fluid Phase Equilibria, 215, 91 (2004).
37. Kiselev, S. B., and Friend, D. G., “Cubic Crossover Equation of State for Mixtures,” Fluid Phase Equilibria, 162, 51 (1999).
38. Laesecke, A., and Hafer, R. F., “Viscosity of Fluorinated Propane Isomers. 2. Measurements of Three Compounds and Model Comparisons,” J. Chem. Eng. Data, 43, 84 (1998).
39. Lal, M. K., Binary Interaction Parameters for Critical Loci of Polar and Non-Polar Systems, MS Thesis, Department of Petroleum Engineering, Texas Tech University, Lubbock, Texas, 2002.
40. Lange, N. A., and Forker, G. M., Handbook of Chemistry, Tenth Edition, McGraw-Hill, New York (1961).
41. Lawal, A. S., “Revival of the van der Waals Classical Theory via Silberberg Constant,” Paper SPE 22712 presented at the 66th Annual Technical Conference and Exhibition of the Society of Petroleum Engineer, Dallas, TX, Oct. 6-9 2001.
42. Lawal, A. S., and van der Laan, E. T., “A Partial Molar Fugacity Coefficient Useful for Changing Mixing Rules of Cubic Equations of State,” Fluid Phase Equlibria, 95, 109 (1994).
82
43. Lawal, A. S., van der Laan, E. T., and Thambynayagam, R. K. M., “ Four Parameter Modification of the Lawal-Lake-Silberberg Equation of State for Calculating Gas-Condensate Phase Equilibria,” Paper SPE 14269 presented at the 60th Annual Technical Conference and Exhibition of the Society of Petroleum Engineers, Las Vegas, NV, Sept. 22-25, 1985.
44. Lee, A. L., and Ellington, R. T., “Viscosity of n-Pentane,” J. Chem. Eng. Data, 10 (2), 101 (1965).
45. Lee, A. L., and Ellington, R. T., “Viscosity of n-Decane in the Liquid Phase,” J. Chem. Eng. Data, 10 (4), 346 (1965).
46. Lee, A. L., Gonzalez, M. H., and Eakin, B.E. “Viscosity of Methane-n-Decane Mixtures,” J. Chem. Eng. Data 11 (3), 281 (1966).
47. Lim, J. S., Park, J. Y., Lee, B. G., and Lee, Y. W., “Phase Equilibria of 1, 1, 1-Trifluoroethane (HFC-143a) + 1, 1, 1, 2-Tetrafluoroethane (HFC-134a), and + 1, 1-Difluoroethane (HFC-152a) at 273.15, 293.15, 303.15, and 313.15 K,” Fluid Phase Equilibria, 193, 29 (2002).
48. Liu, K., “Reduce the Number of Components for Compositional Reservoir Simulation,” Paper SPE 66363 presented at the SPE Reservoir Simulation Symposium in Houston, Texas, Feb. 11-14, 2001.
49. Liu, X. J., Shi, L., Han, L. Z., and Zhu, M. S., “Liquid Viscosity of 1, 1, 1, 2, 3, 3, 3-Heptafluoropropane (R227ea) along the Saturation Line,” J. Chem. Eng. Data 44, 688 (1999).
50. Lue, L., and Prausnitz, J. M., “Thermodynamics of Fluid Mixtures Near to and Far from the Critical Region,” AIChE Journal, 44 (6), 1455 (1998).
51. Ma, R., Shi, L., Duan, Y., Han, L., and Liu, N., “Saturated Liquid Viscosity of Cyclopentane and Isopentane,” J. Chem. Eng. Data 48, 1418 (2003).
52. Martins, L. F. G., Filipe, E. J. M., and Calado, J. C. G., “Liquid Mixtures Involving Cyclic Molecules. 2: Xenon + Cyclobutane,” J. Phys. Chem. B, 105, 10936 (2001).
53. Mathias, P. M., “Comments on “Unnoticed Pitfalls of Soave-Type Alpha Functions in Cubic Equations of State,” Ind. Eng. Chem. Res., 43, 1894 (2004).
54. Mathias, P. M., “The Second Virial Coefficient and the Redlich-Kwong Equation,” Ind. Eng. Chem. Res., 42, 233 (1949).
55. McCain, W. D., Jr., The Properties of Petroleum Fluids, Petroleum Publishing Company, Tulsa (1973).
56. Morgan, D. L., and Kobayashi, R., “Direct Vapor Pressure Measurements of ten alkanes in the C10-C28 Range,” Fluid Phase Equilibria, 97, 211 (1994).
83

57. Muller, E. A., and Gelb, L. D., “Molecular Modeling of Fluid-Phase Equilibria Using an Isotropic Multipolar Potential,” Ind. Eng. Chem. Res., 42, 4123 (2003).
58. Nasrifar, Kh., Bolland, O., “Square-Well Potential and a New α Function for the Soave-Redlich-Kwong Equation of State,” Ind. Eng. Chem. Res., 43(21), 6901 (2004).
59. Nasrifar, Kh., Moshfeghian, M., “Application of an Improved Equation of State to Reservoir Fluids: Computation of Minimum Miscibility Pressure,” J. Pet. Sci. Eng., 42, 223 (2004).
60. Ortiz, A., Prediction of Critical Properties for Mixtures of Carbon Dioxide and Reservoir Fluids, MS Thesis, Department of Petroleum Engineering, Texas Tech University, Lubbock, Texas, 2001.
61. Papari, M. M., Razavizadeh, A., Mokhberi, F., and Bousheri, A., “Equation of State and P-V-T-x Properties of Refrigerant Mixtures Based on Speed of Sound Data,” Ind. Eng. Chem. Res., 42, 3802 (2003).
62. Peng, D. Y., and Robinson, D. B., “A New Two-Constant Equation of State,” Ind. Eng. Chem. Res., 15, 59 (1976).
63. Perry, R. H., and Chilton C. H., Chemical Engineers’ Handbook, Fifth Edition, McGraw-Hill, New York (1973).
64. Ping, G., Liangtian, S., Shilun, L., and Lei, S., “A theoretical Study of the Effect of Porous Media on the Dew Point Pressure of a Gas Condensate,” Paper SPE 35644, presented at SPE Gas Technology Symposium & Exhibition, Alberta (1996).
65. Poling, B. E., Prausnitz, J. M., and O’Connell, J. P., The Properties of Gases and Liquids, Fifth Edition, McGraw-Hill, New York (2001).
66. Prausnitz, J. M., “Equations of State from van der Waals Theory: The Legacy of Otto Redlich,” Fluid Phase Equilibria, 24, 62 (1985).
67. Rachford, H. H., Jr., “Procedure for Use of Electronic Digital Computers in Calculating Flash Vaporization Hydrocarbon Equilibrium,” J. Petrol. Tech., 4(10), 10 (1952).
68. Redlich, O., “On the Three Parameter Representation of the Equation of State,” Ind. Eng. Chem. Res., 14(3), 257 (1975).
69. Redlich, O., Kwong, J. N. S., “On the Thermodynamics of Solutions. V An Equation of State. Fugacities of Gaseous Solutions,” Chem. Rev., 44, 233 (1949).
70. Rowe, A. M., “Internally Consistent Correlations for Predicting Phase Compositions for Use in Reservoir Composition Simulators,” Paper SPE 7475 presented at the 53rd Annual Fall Technical Conference and Exhibition of Society of Petroleum Engineers of AIME, Houston, TX, Oct. 1-3, 1978.
71. Rowe, A. M., “The Critical Composition Method-A New Convergence Pressure Method,” Paper SPE 1631 presented at SPE Gas Technology Symposium, Omaha, NE, Sept. 15-16, 1966.
84

72. Rzasa, M. J., Phase Equlibria of the Methane-Kensol 16 System to Pressures of 25,000 Pounds Per Square Inch and Temperature to 250oF, Ph.D. Dissertation, Department of Chemical Engineering, University of Michigan, Ann Arbor, Michigan, 1947.
73. Rzasa, M. J., Katz, D. L., “The Coexistence of Liquid and Vapor Phases at Pressure above 10,000 Psi,” Trans. AIME, 189, 119 (1950).
74. Saeedi, J., and Rowe, A. M., “Viscosity Correlations for Compositional Reservoir Simulators,” Paper SPE 9643 presented at the Middle East Oil Technical Conference of the Society of Petroleum Engineers, Manama, Bahrain, March 9-12, 1981.
75. Sage, B.H., and Lacey, W.N., Monograph on API Research Project 37 Thermodynamic Properties of the Lighter Paraffin Hydrocarbons and Nitrogen, American Petroleum Industry, New York, 1950.
76. Sams, W. N., Lynch, J. J., and Smith, D. H., “The Simulation of Enhanced Oil Recovery Processes Using a Vapor/Liquid Equilibrium Model Based on Critical Scaling Theory,” Paper SPE 25256 presented at the 12th SPE Symposium on Reservoir Simulation, New Orleans, LA, Feb. 28- March 3, 1993.
77. Satter, A., and Campbell, J. M., “Non-Ideal Behavior of Gases and Their Mixtures,” Paper SPE presented at SPE Fall Meeting, New Orleans, LA, Oct. 6-9, 1963.
78. Segura, H., Kraska, T., Mejia, A., Wisniak, J., and Polishuk, I., “Unnoticed Pitfalls of Soave-Type Alpha Functions in Cubic Equations of State,” Ind. Eng. Chem. Res., 42, 5662 (2003)
79. Singh, M., and Mohanty, K. K., “Dynamic Modeling of Drainage through Three Dimensional Porous Material,” Chem. Eng. Sci., 58, 1 (2003).
80. Soave, G., “Equilibrium Constant from a Modified Redlich-Kwong Equation of State,” Chem. Eng. Sci., 27, 1197 (1972).
81. Soave, G. S., “Universal Method for Equations of State (UNIFEST) An Application of UNIFAC to Predict the Parameters of Cubic Equations of State,” Fluid Phase Equilibria, 193, 75 (2002).
82. Standing, M. B., Katz, D. L., “Density of Natural Gases,” Trans. AIME, 146, 140 (1942).
83. Standing, M. B., Katz, D. L., “Vapor-liquid Equilibria of Natural Gas-Crude Oil Systems,” Trans. AIME, 155, 232 (1944).
84. Starling, K. E., Fluid Thermodynamic Properties for Light Petroleum Systems, Gulf Publishing Co., Houston, Texas (1973).
85. Stradi, B. A., Brennecke, J. F., Kohn, J. P., and Stadherr, M. A., “Reliable Computation of Mixture Critical Points,” AIChE Journal, 47 (1), 212 (2001).
85
86. Sun, L. Q., Zhu, M. S., Han, L. Z., and Lin, Z. Z., “Viscosity of Difluoromethane and Pentafluoroethane along the Saturation Line,” J. Chem. Eng. Data, 41, 292 (1996).
87. Super, M. S., Beckman, E. J., and Enick, R. M., “Near-Critical and Supercritical Fluid Densities of CO2-SF6 Mixtures,” Fluid Phase Equilibria, 86, 275 (1993).
88. Taylor, Z. L., and Reed, T. M., “Virial Coefficients and Critical Properties of Perfluorohexanes,” AIChE Journal, 16 (5), 738 (1970).
89. Twu, C. H., Coon, J. E., Cunningham, J. R., “A New Generalized Alpha Function for a Cubic Equation of State: Part 1. Peng-Robinson Equation,” Fluid Phase Equilibria, 105, 49 (1995).
90. Twu, C. H., Coon, J. E., Cunningham, J. R., “A New Generalized Alpha Function for a Cubic Equation of State: Part 1. Soave-Redlich-Kwong Equation,” Fluid Phase Equilibria, 105, 61 (1995).
91. Valderrama, J. O., “The State of the Cubic Equations of State,” Ind. Eng. Chem. Res., 42, 1603 (2003).
92. Van der Waals, J. D., “The Equation of State for Gases and Liquids,” in Nobel Lectures in Physics, Dec. 12, 1910.
93. Whitson, C. H., Brule, M. R., Phase Behavior, SPE Monograph Series vol. 20, First Printing, Henry L. Doherty Memorial Fund of AIME, Richardson, TX (2000).
94. Wu, J., Liu, Z., Pan J., and Zhao, X., “Vapor Pressure Measurements of Dimethyl Ether from (233 to 399) K,” J. Chem. Eng. Data 49, 32 (2004).
95. Wu, J., Liu, Z., Wang B., and Pan, J., “Measurement of the Critical Parameters and the Saturation Densities of Dimethyl Ether,” J. Chem. Eng. Data 49, 704 (2004).
96. Wu, J., Liu, Z., Bi, S., and Meng, X., “Viscosity of Saturated Liquid Dimethyl Ether from (227 to 343) K,” J. Chem. Eng. Data 48, 426 (2003).
97. Yang, T., Chen, G. J., Yan, W., and Guo, T. M., “Extension of the Wong-Sandler Rule to the Three-Parameter Patel-Teja Equation of State: Application Up to the Near-Critical Region,” Chem. Eng. J., 67, 27 (1997).
86
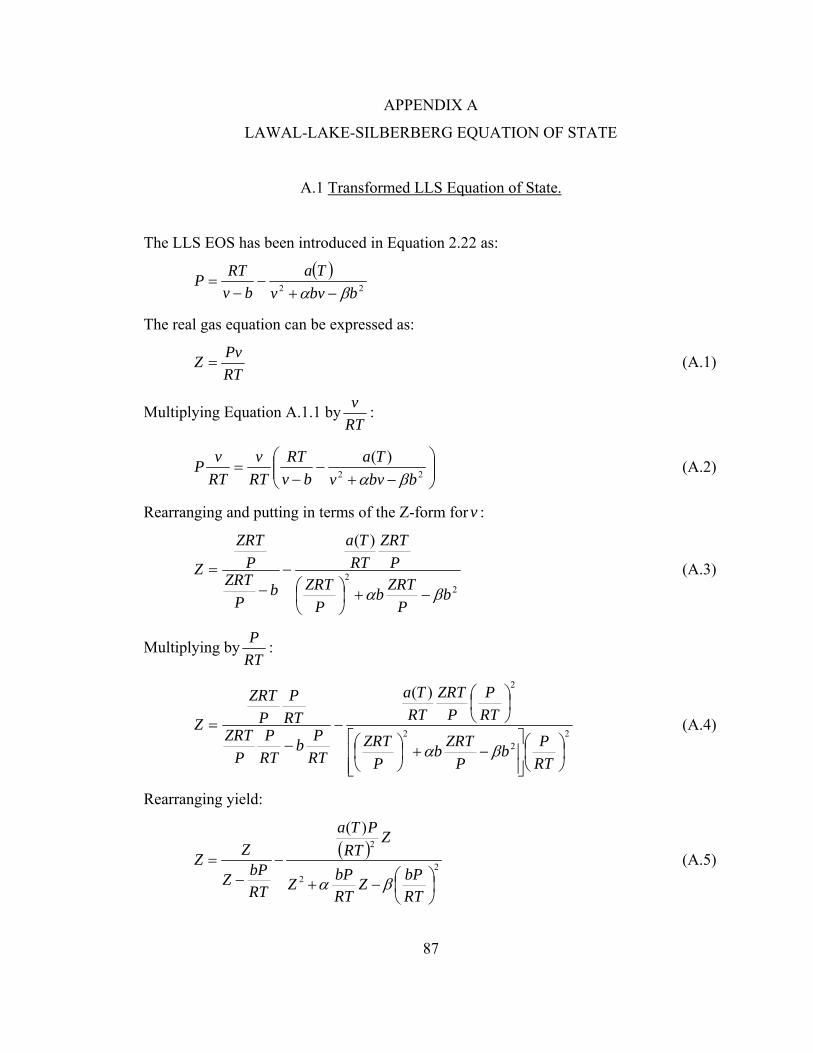
APPENDIX A
LAWAL-LAKE-SILBERBERG EQUATION OF STATE
A.1 Transformed LLS Equation of State.
The LLS EOS has been introduced in Equation 2.22 as:
( )22 bbvv
Tabv
RTPβα −+
−−
=
The real gas equation can be expressed as:
RTPvZ = (A.1)
Multiplying Equation A.1.1 byRTv :
⎟⎟⎠
⎞⎜⎜⎝
⎛−+
−−
= 22
)(bbvv
Tabv
RTRTv
RTvP
βα (A.2)
Rearranging and putting in terms of the Z-form for : v
22
)(
bP
ZRTbP
ZRTP
ZRTRTTa
bP
ZRTP
ZRT
Zβα −+⎟
⎠⎞
⎜⎝⎛
−−
= (A.3)
Multiplying byRTP :
22
2
2)(
⎟⎠⎞
⎜⎝⎛
⎥⎥⎦
⎤
⎢⎢⎣
⎡−+⎟
⎠⎞
⎜⎝⎛
⎟⎠⎞
⎜⎝⎛
−−
=
RTPb
PZRTb
PZRT
RTP
PZRT
RTTa
RTPb
RTP
PZRT
RTP
PZRT
Z
βα
(A.4)
Rearranging yield:
( )2
2
2)(
⎟⎠⎞
⎜⎝⎛−+
−−
=
RTbPZ
RTbPZ
ZRT
PTa
RTbPZ
ZZβα
(A.5)
87

Assume:
( )2)(
RTPTaA = (A.6)
RTbPB = (A.7)
Inserting Equation A1.7 and Equation A1.8 to Equation A1.6 yield:
22 BBZZAZ
BZZZ
βα −+−
−= (A.8)
Dividing each side with Z:
22
11BBZZ
ABZ βα −+−
−= (A.9)
Multiplying each side with , Equation 2.22 can be expressed in
Z-form as:
))(( 22 BBZZBZ βα −+−
ABAZBBZZBBZZBZ −−−+=−+− 2222 ))(( βαβα (A.10)
Rearranging:
0432
23
1 =Θ−Θ+Θ−Θ ZZZ (A.11)
Where parameters Θ1, Θ2, Θ3, Θ4 are:
11 =Θ (A.12)
[ ]B)1(12 α−+=Θ (A.13)
])([ 23 BBA αβα +−−=Θ (A.14)
)]([ 324 BBAB −−=Θ β (A.15)
Similarly, The LLS EOS that has been introduced in Equation 2.22 can be expressed in
the v-form by expanding Equation 2.22 into the molar volume term yield:
( ) )()())(( 2222 bvTabbvvRTbbvvbvP −−−+=−+− βαβα (A.16)
Grouping the appropriate terms yield:
0432
23
1 =Θ−Θ+Θ−Θ vvv (A.17)
Where parameters Θ1, Θ2, Θ3, Θ4 are:
88

11 =Θ (A.18)
⎥⎦⎤
⎢⎣⎡ +−=Θ
PRTbb α2 (A.19)
⎥⎦⎤
⎢⎣⎡ +−−=Θ 2
3 )( bP
RTbPa βαα (A.20)
⎥⎦
⎤⎢⎣
⎡⎟⎠⎞
⎜⎝⎛ +−=Θ β
PRTbb
Pab 23
4 (A.21)
89
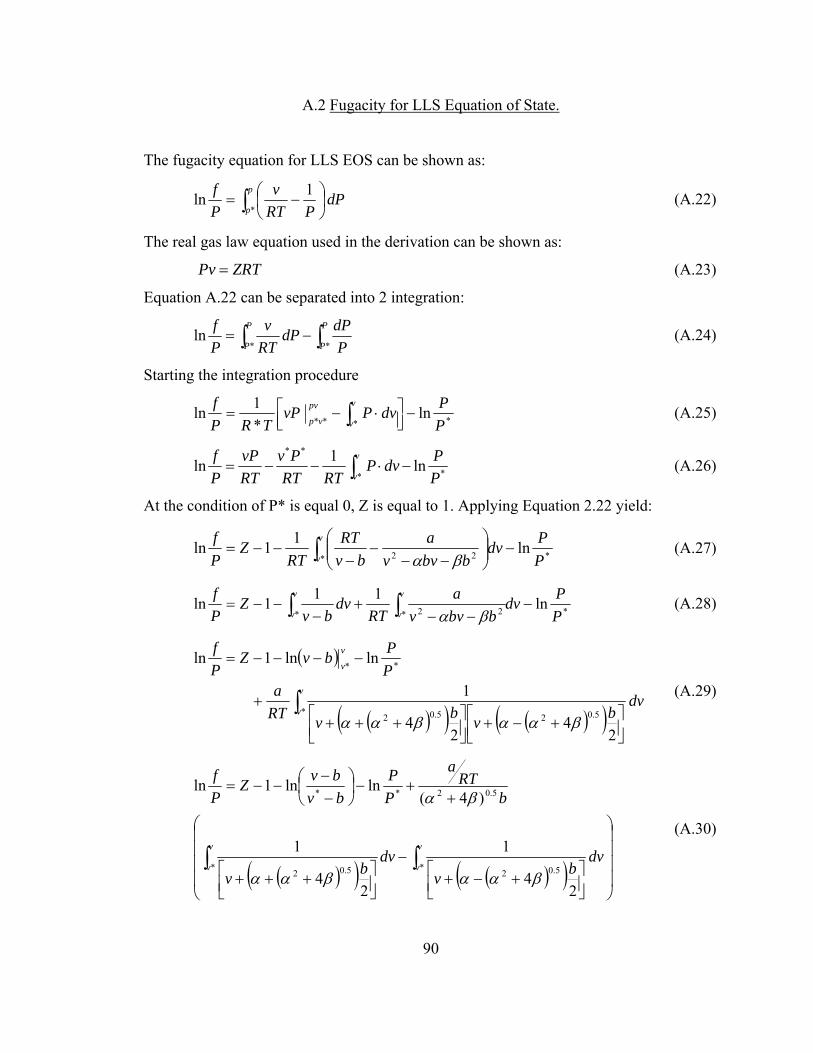
A.2 Fugacity for LLS Equation of State.
The fugacity equation for LLS EOS can be shown as:
dPPRT
vPf p
p 1ln
*∫ ⎟⎠⎞
⎜⎝⎛ −= (A.22)
The real gas law equation used in the derivation can be shown as:
(A.23) ZRTPv =
Equation A.22 can be separated into 2 integration:
∫∫ −=P
P
P
P PdPdP
RTv
Pf
**ln (A.24)
Starting the integration procedure
****ln
*1ln
PPdvPvP
TRPf v
v
pv
vp−⎥⎦
⎤⎢⎣⎡ ⋅−= ∫ (A.25)
**
**
ln 1lnPPdvP
RTRTPv
RTvP
Pf v
v−⋅−−= ∫ (A.26)
At the condition of P* is equal 0, Z is equal to 1. Applying Equation 2.22 yield:
** 22 ln11lnPPdv
bbvva
bvRT
RTZ
Pf v
v−⎟⎟
⎠
⎞⎜⎜⎝
⎛−−
−−
−−= ∫ βα (A.27)
** 22*ln111ln
PPdv
bbvva
RTdv
bvZ
Pf v
v
v
v−
−−+
−−−= ∫∫ βα
(A.28)
( )
( )( ) ( )( )dv
bvbvRTa
PPbvZ
Pf
v
v
v
v
24
24
1
lnln1ln
* 5.025.02
**
∫⎥⎦⎤
⎢⎣⎡ +−+⎥⎦⎤
⎢⎣⎡ +++
+
−−−−=
βααβαα
(A.29)
( )( ) ( )( ) ⎟⎟⎟⎟
⎠
⎞
⎜⎜⎜⎜
⎝
⎛
⎥⎦⎤
⎢⎣⎡ +−+
−
⎥⎦⎤
⎢⎣⎡ +++
++−⎟
⎠⎞
⎜⎝⎛
−−
−−=
∫ ∫v
v
v
vdv
bvdv
bv
bRT
a
PP
bvbvZ
Pf
* * 5.025.02
5.02**
24
1
24
1
)4(lnln1ln
βααβαα
βα
(A.30)
90

( )( )
v
v
bv
bv
bRT
a
PP
RTRT
bvbvZ
Pf
*
5.02
5.02
5.02
**
2)4(2)4(
ln)4(
lnln1ln
⎟⎟⎟
⎠
⎞
⎜⎜⎜
⎝
⎛
+−+
+++
++
−⎟⎠⎞
⎜⎝⎛ ÷
−−
−−=
βαα
βαα
βα
(A.31)
The value of v* is a lot bigger than b, thus b can be neglected.
( )( ) ⎟⎟
⎟
⎠
⎞
⎜⎜⎜
⎝
⎛
+−+
++++
⎟⎟⎟⎟
⎠
⎞
⎜⎜⎜⎜
⎝
⎛
×
−
−−=RT
PRT
P
bv
bv
bRT
a
PP
RTvRT
bv
ZPf
2)4(2)4(
ln22
ln1ln5.02
5.02
** βαα
βαα (A.32)
( )( ) ⎟⎟
⎟
⎠
⎞
⎜⎜⎜
⎝
⎛
+−+
+++
++
⎟⎟⎟⎟
⎠
⎞
⎜⎜⎜⎜
⎝
⎛−
−−=
RTP
RTP
bv
bv
RTP
RTP
bRT
aRT
vPRTbP
RTPv
ZPf
2)4(2)4(
ln)4(
ln1ln
5.02
5.02
5.02
**
βαα
βαα
βα
(A.33)
Assuming that:
22TRaPA = (A.34)
RTbPB = (A.35)
The above equation can be rewritten as:
( )( )
( ) ⎟⎟⎟⎟
⎠
⎞
⎜⎜⎜⎜
⎝
⎛
+−+
+++
++−−−=
2)4(
2)4(
ln)4(
ln1ln5.02
5.02
5.02 BZ
BZ
BABZZ
Pf
βαα
βαα
βα (A.36)
91
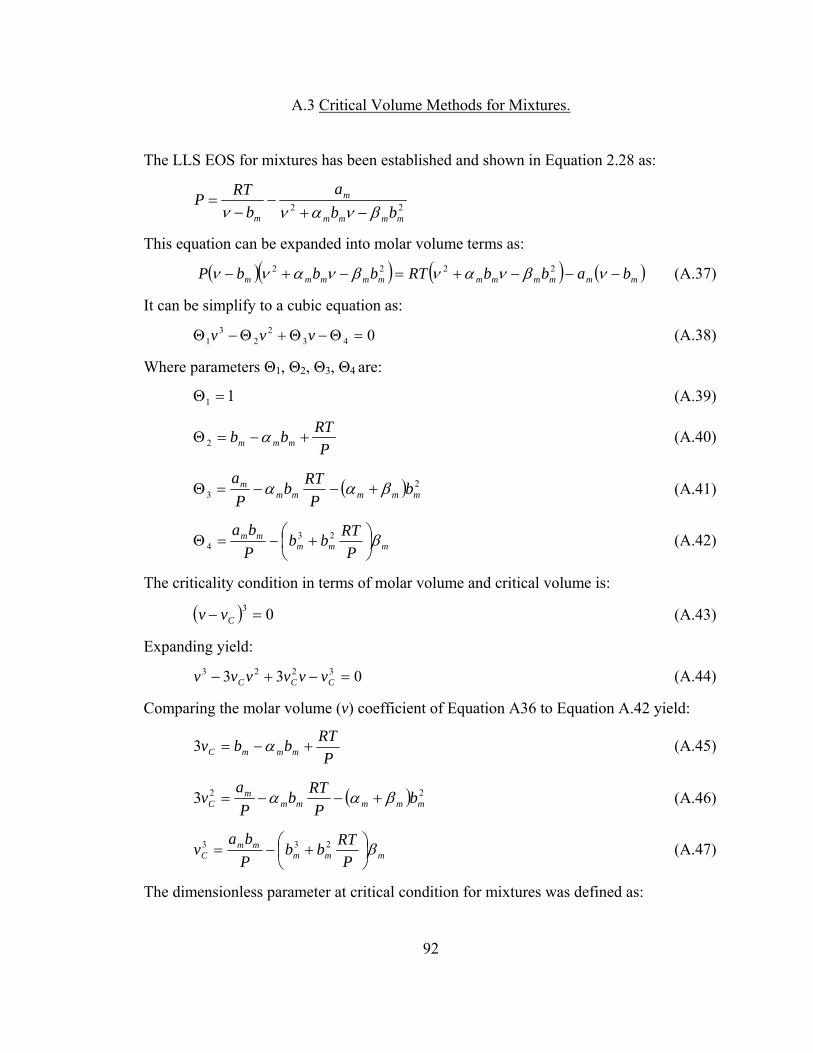
A.3 Critical Volume Methods for Mixtures.
The LLS EOS for mixtures has been established and shown in Equation 2.28 as:
22mmmm
m
m bba
bRTP
βνανν −+−
−=
This equation can be expanded into molar volume terms as:
( )( ) ( ) ( mmmmmmmmmmm babbRTbbbP −−−+=−+− νβνανβνανν 2222 ) (A.37)
It can be simplify to a cubic equation as:
0432
23
1 =Θ−Θ+Θ−Θ vvv (A.38)
Where parameters Θ1, Θ2, Θ3, Θ4 are:
11 =Θ (A.39)
PRTbb mmm +−=Θ α2 (A.40)
( ) 23 mmmmm
m bP
RTbPa
βαα +−−=Θ (A.41)
mmmmm
PRTbb
Pba
β⎟⎠⎞
⎜⎝⎛ +−=Θ 23
4 (A.42)
The criticality condition in terms of molar volume and critical volume is:
( ) 03 =− Cvv (A.43)
Expanding yield:
(A.44) 033 3223 =−+− CCC vvvvvv
Comparing the molar volume (v) coefficient of Equation A36 to Equation A.42 yield:
P
RTbbv mmmC +−= α3 (A.45)
( 223 mmmmmm
C bP
RTbPa
v βαα +−−= ) (A.46)
mmmmm
C PRTbb
Pba
v β⎟⎠⎞
⎜⎝⎛ +−= 233 (A.47)
The dimensionless parameter at critical condition for mixtures was defined as:
92

22C
CmC TR
PaA = (A.48)
C
CmC RT
PbB = (A.49)
The real gas law at critical condition was defined as:
C
CCC P
RTZv = (A.50)
Substituting Equation A.48 through Equation A.50 to Equation A.45 through Equation
A.47 yield:
CmCC BBZ α−+= 13 (A.45)
(A.46) ( 223 CmmCmCC BBAZ βαα +−−= )
( ) mCCCCC BBBAZ β233 +−= (A.47)
Rearranging Equation A.45, the critical compressibility factor (ZC) for particular mixture
can be solved as:
3)1(1
31 CmCmC
CBBBZ αα −+
=−+
= (A.48)
Substituting Equation A.48 to Equation A.46, parameter AC can be calculated as:
( ) ( ) CmCmmCmC
C BBBBA αβαα
+++−+
= 22
31 (A.49)
Substituting Equation A.48 and Equation A.49 to Equation A.27 yield the following:
( ) ( )
( ) mCC
CCmCmmCmCCmC
BB
BBBBBBB
β
αβααα
23
223
31
31
+−
⎥⎥⎦
⎤
⎢⎢⎣
⎡+++
−+=⎟
⎠⎞
⎜⎝⎛ −+
(A.50)
Equation A.50 can be simplified as:
0432
23
1 =Θ+Θ+Θ+Θ CCC BBB (A.51)
Where parameters Θ1, Θ2, Θ3, Θ4 are:
93

8612 321 +++=Θ mmm ααα (A.52)
22 3271515 mmm αβα −−+=Θ (A.53)
mα363 +=Θ (A.54)
14 −=Θ (A.55)
It can be seen that ),( mmC fB βα= . It is imperative to solve βm as a function of BC and
αm. This is an iterative process with the αm value is guessed at the starting point.
Rearranging Equation A.51 to solve for βm yield:
23
2231
271)31515(
C
CCmmCm B
BBB −Θ+−++Θ=
ααβ (A.56)
By rearranging Equations A.45 to A.47, the composition dependent critical
compressibility factor can be expressed as in Equation A. 57.60
0012
23
3 =+++ θθθθ ccc ZZZ (A.57) where
)(
6663
)9912123(
6128
20
21
22
323
mmmm
mmmmm
mmmmm
mmm
βαβαθ
βαβααθ
βαβααθ
αααθ
−+−=
−++=
−+++−=
+++=
Equation A. 57 can be arranged in terms of Zc and αm as in Equation A.58:
)1(66)99()63()12123()6128(
2
2222332
mcmccm
mcmmcmmcmmmm ZZZ
ZZZααα
ααααααααβ−++−−
−++++−+++= (A.58)
Equations A.57 to A.58 can be resolved for Zc from a guess value of αm.
94
APPENDIX B
FORTRAN PROGRAM
B.1 Internal Tuning Parameter Approximation
! Program LLSpredsat_pure ! Input: Tc, Pc, Zc, densV, densL ! Input Units: Tc=R, Pc=psia, Zc=null, densV=lb-mole/cu-ft, densL=lb-mole/cu-ft ! Input Units: T = R, P = psia Character(Len=40)CName real, allocatable, dimension(:):: Pr,Tr,T, P, DLE, DGE, DLC, DGC, ZVC, ZLC, & DEVL, DEVG, Fugr,Gam, B open(unit=5,file='input.txt',status='old') open(unit=6,file='output.txt',status='old') read(5,*)NCOMP Do IC = 1,NCOMP AAPDL = 1.0E+05 AAPDV = 1.0E+05 ITMAX = 250 read(5,*)CName read(5,*)Tc,Pc,Zc,ACF read(5,*)NDT write(6,*)NDT,Tc,Pc,Zc,ACF allocate(DLE(NDT),DGE(NDT),P(NDT),T(NDT),DLC(NDT),DGC(NDT), & Gam(NDT), ZVC(NDT), ZLC(NDT), Fugr(NDT), DEVL(NDT), DEVG(NDT), & Pr(NDT), Tr(NDT),B(NDT)) write(6,*)CName R = 10.73 DO 60 I =1,NDT read(5,*)DLE(I),DGE(I),P(I),T(I) 60 continue Omw=0.25 write (6,20) 'IT',' OmW',' AAPDL',' AAPDV' 20 Format(2A10,2A15) Do 200 IT=1,ITMAX Call Crtpar(Tc, Pc, Zc, R, ACF, Omw, AC, BC, Alp, Bet) APDL = 0.0 APDV = 0.0 Do 100 J=1,NDT VL = 1/DLE(J) If (J.EQ. 1) Tmp = (((R*T(J))/(VL-BC))-P(J))*((VL**2+Alp*BC*VL-Bet*BC**2)/AC) RT = T(J)/Tc
95
if (RT.GE.0.9999) ZV = Zc if (RT.GE.0.9999) ZL = ZV if (RT.GE.0.9999) FugrC = 0.0 if (RT.GE.0.9999) Tmp = 1 if (RT.GE.0.9999) GO TO 35 XR = 0.0 XL = 0.0 50 Continue XC1 = XR XC2 = XL If (XC1.NE.0.0 .and. XC2.NE.0.0) GO TO 130 AT= Tmp*AC Call Zfactr(Alp, Bet, AT, BC, P(J), T(J), R, BB, ZV, ZL) If (ZV.NE.ZL) GO TO 55 If (ZV.EQ.ZL) Tmp = Tmp*1.0005 GO TO 50 55 Call fugacty (Alp, Bet, P(J), T(J), R, AT, BB, ZV, ZL, AB, FugrC) if (FugrC.GT.0.0) GO TO 120 if (FugrC.LE.0.0) GO TO 125 120 Continue If (FugrC.GT.0.0) XR = Tmp If (FugrC.GT.0.0) FXR = FugrC If (FugrC.GT.0.0) Tmp = Tmp*0.75 If (XC2.EQ.0.0) Go to 50 125 Continue If (FugrC.LE.0.0) XL = Tmp If (FugrC.LE.0.0) FXL = FugrC If (FugrC.LE.0.0) Tmp = Tmp*1.05 If (XC1.EQ.0.0) Go to 50 130 Continue Tr(J)=T(J)/Tc Pr(J)=P(J)/Pc If(Tr(J).GT.0.97) EPS=1.0E-02 If(Tr(J).LE.0.97) EPS=1.0E-07 Call BISECT (XL, XR, FXL, FXR,EPS, T(J),Tc, P(J), Pc,Alp, Bet, BC, BB, & AC,R,ZV,ZL,Tmp,FugrC) 35 Continue Pr(J) = P(J)/Pc Tr(J) = T(J)/Tc Fugr(J)= FugrC ZVC(J) = ZV ZLC(J) = ZL Gam(J) = Tmp B(J) = BB
96
! Calculating the fluid density. If (DLE(J).GT.0) Call Apdev (P(J), ZLC(J), DLE(J), T(J), R, DEVL(J), DLC(J)) If (DLE(J).EQ.0) DEVL(J) = 0.0 If (DGE(J).GT.0) Call Apdev (P(J), ZVC(J), DGE(J), T(J), R, DEVG(J), DGC(J)) If (DGE(J).EQ.0) DEVG(J) = 0.0 APDL = APDL + ABS(DEVL(J)) APDV = APDV + ABS(DEVG(J)) 100 Continue DN=NDT APDL=APDL/DN APDV=APDV/DN write(6,*)IT,Omw,APDL,APDV If (APDL .GE. AAPDL) Go to 300 If (AAPDL .GT. APDL) AAPDL = APDL Omw = Omw + 0.0025 200 Continue 300 Continue write(6,10) 'Pr','Tr','Gam','ZVC','ZLC','Fugr','BB','DLE','DGE','DLC','DGC','DEVL',& 'DEVG' 10 Format(2A6, 2A8,2A10, A9, 4A8, 2A7) DO 800 J=1,NDT write(6,19) Pr(J),Tr(J),Gam(J),ZVC(J),ZLC(J),Fugr(J),B(J),DLE(J),DGE(J),& DLC(J),DGC(J),DEVL(J),DEVG(J) 800 Continue 19 Format(2F6.3,2F8.4,3E10.2,4F8.4,2F7.2) deallocate(DLE, DGE, P, T, DLC, DGC, ZVC, ZLC,B, Fugr, DEVL, DEVG,Gam,Pr,Tr) end do close(5) close(6) Stop End SUBROUTINE Apdev (P, ZV, DGE, T, R, Pdev, Den) Den = P/(ZV*T*R) Dev = Den - DGE Pdev = 100.0*(Dev/DGE) RETURN END
SUBROUTINE BISECT (XL, XR, FXL, FXR,EPS,T, Tc, P, Pc,Alp, Bet, BC, & BB, AC, R, ZVC, ZLC, XFIT, FIT) IMAX=50
97
! EPS=1.0E-07 ! Check for Presence of a Root if(FXL*FXR)50,30,80 30 IT=1 if(FXL.NE.0.0)go to 40 XFIT=XL FIT=0.0 go to 80 40 XFIT=XR FIT=0.0 go to 80 ! Begin Bisection Method 50 do 70 IJ=1, IMAX XFIT=(XL*FXR-XR*FXL)/(FXR-FXL) AT=XFIT*AC Call Zfactr (Alp, Bet, AT, BC, P, T, R, BB, ZVC, ZLC) Call fugacty (Alp, Bet, P, T, R, AT, BB, ZVC, ZLC, AB,FIT) ! Check for Convergence with Tolerance IF(ABS(FIT).LE.EPS) go to 80 ! Keep Right or Left Subinterval IF(FIT*FXL<0) go to 60 XL=XFIT FXL=FIT go to 70 60 XR=XFIT FXR=FIT 70 continue 80 RETURN END Subroutine Crtpar(Tc, Pc, Zc, R, ACF, Omw, AC, BC, Alp, Bet) AC = (1.+(Omw-1.)*Zc)**3*(R**2*Tc**2/Pc) BC = (Omw*Zc)*R*Tc/Pc Alp= (1.+(Omw-3.)*Zc)/(Omw*Zc) Bet= (Zc**2*((Omw-1.)**3)+2.*Omw**2.*Zc+Omw*(1.-3.*Zc))/(Omw**2*Zc) Return End Subroutine Zfactr (Alp, Bet, AT,BC, P, T, R, BB, ZV, ZL) Dimension Coef(4),RT(3) ! write(6,*) 'Root=',RT ,BB AA = AT*P/(R**2*T**2) BB = BC*P/(R*T)
98
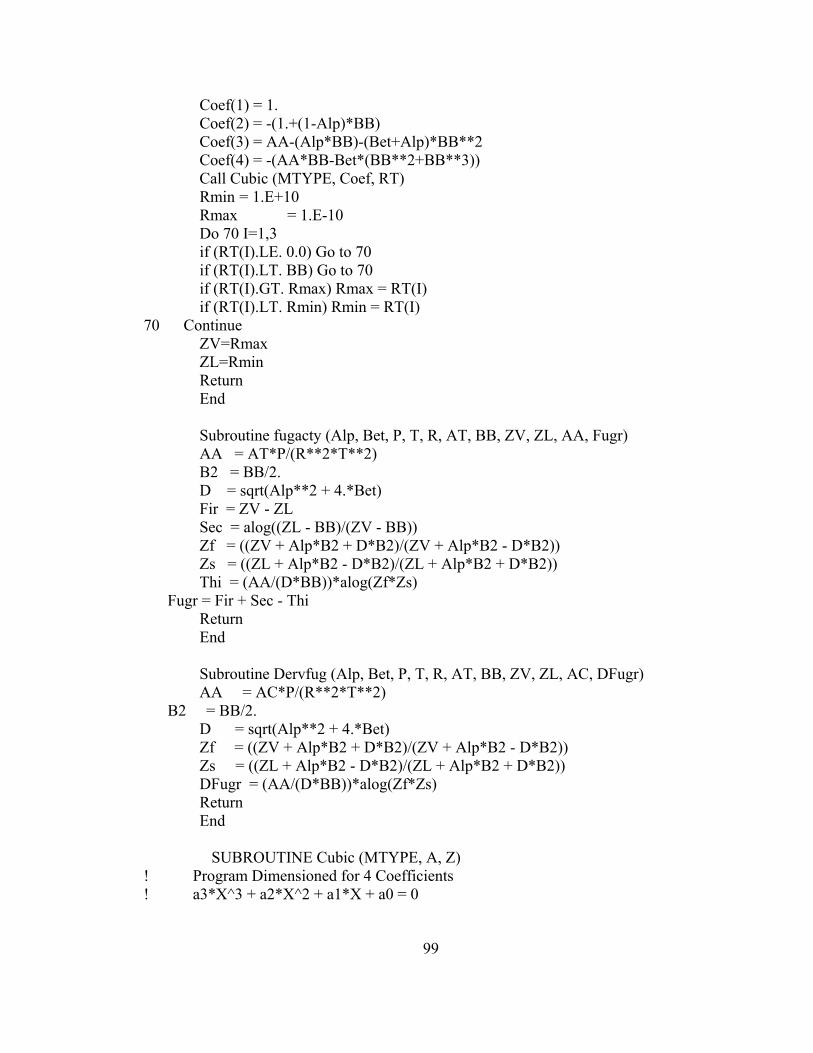
Coef(1) = 1. Coef(2) = -(1.+(1-Alp)*BB) Coef(3) = AA-(Alp*BB)-(Bet+Alp)*BB**2 Coef(4) = -(AA*BB-Bet*(BB**2+BB**3)) Call Cubic (MTYPE, Coef, RT) Rmin = 1.E+10 Rmax = 1.E-10 Do 70 I=1,3 if (RT(I).LE. 0.0) Go to 70 if (RT(I).LT. BB) Go to 70 if (RT(I).GT. Rmax) Rmax = RT(I) if (RT(I).LT. Rmin) Rmin = RT(I) 70 Continue ZV=Rmax ZL=Rmin Return End Subroutine fugacty (Alp, Bet, P, T, R, AT, BB, ZV, ZL, AA, Fugr) AA = AT*P/(R**2*T**2) B2 = BB/2. D = sqrt(Alp**2 + 4.*Bet) Fir = ZV - ZL Sec = alog((ZL - BB)/(ZV - BB)) Zf = ((ZV + Alp*B2 + D*B2)/(ZV + Alp*B2 - D*B2)) Zs = ((ZL + Alp*B2 - D*B2)/(ZL + Alp*B2 + D*B2)) Thi = (AA/(D*BB))*alog(Zf*Zs) Fugr = Fir + Sec - Thi Return End Subroutine Dervfug (Alp, Bet, P, T, R, AT, BB, ZV, ZL, AC, DFugr) AA = AC*P/(R**2*T**2) B2 = BB/2. D = sqrt(Alp**2 + 4.*Bet) Zf = ((ZV + Alp*B2 + D*B2)/(ZV + Alp*B2 - D*B2)) Zs = ((ZL + Alp*B2 - D*B2)/(ZL + Alp*B2 + D*B2)) DFugr = (AA/(D*BB))*alog(Zf*Zs) Return End SUBROUTINE Cubic (MTYPE, A, Z) ! Program Dimensioned for 4 Coefficients ! a3*X^3 + a2*X^2 + a1*X + a0 = 0
99
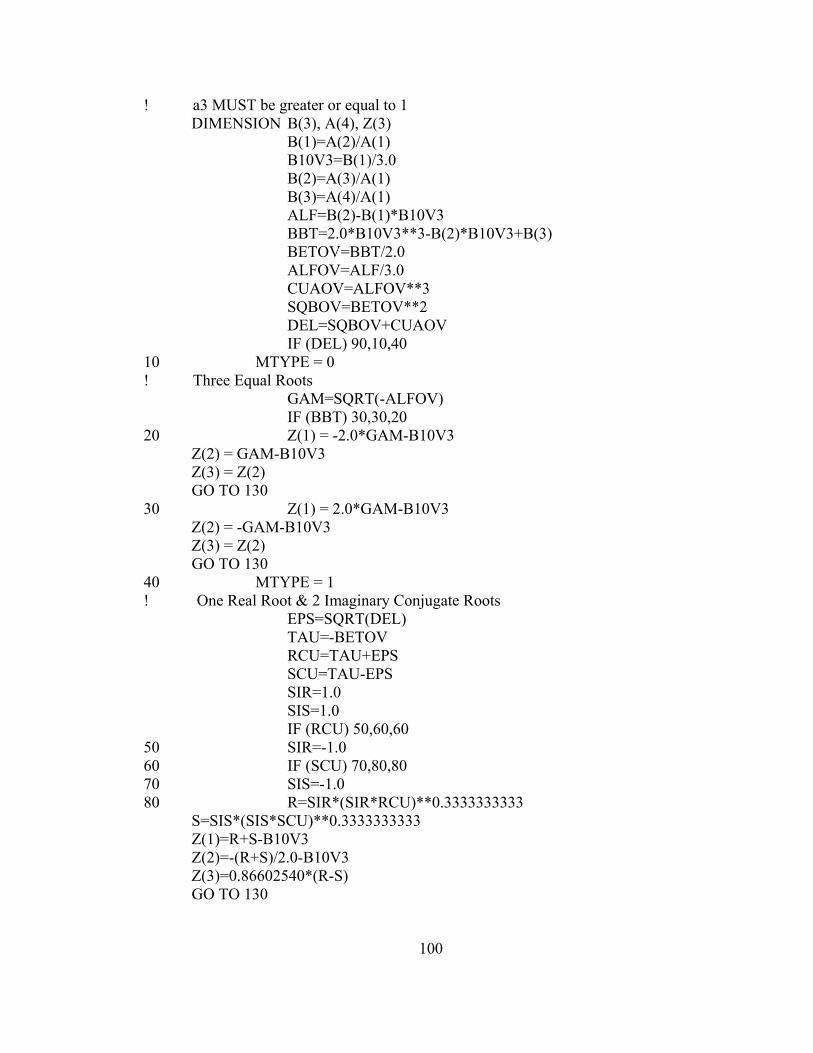
! a3 MUST be greater or equal to 1 DIMENSION B(3), A(4), Z(3) B(1)=A(2)/A(1) B10V3=B(1)/3.0 B(2)=A(3)/A(1) B(3)=A(4)/A(1) ALF=B(2)-B(1)*B10V3 BBT=2.0*B10V3**3-B(2)*B10V3+B(3) BETOV=BBT/2.0 ALFOV=ALF/3.0 CUAOV=ALFOV**3 SQBOV=BETOV**2 DEL=SQBOV+CUAOV IF (DEL) 90,10,40 10 MTYPE = 0 ! Three Equal Roots GAM=SQRT(-ALFOV) IF (BBT) 30,30,20 20 Z(1) = -2.0*GAM-B10V3 Z(2) = GAM-B10V3 Z(3) = Z(2) GO TO 130 30 Z(1) = 2.0*GAM-B10V3 Z(2) = -GAM-B10V3 Z(3) = Z(2) GO TO 130 40 MTYPE = 1 ! One Real Root & 2 Imaginary Conjugate Roots EPS=SQRT(DEL) TAU=-BETOV RCU=TAU+EPS SCU=TAU-EPS SIR=1.0 SIS=1.0 IF (RCU) 50,60,60 50 SIR=-1.0 60 IF (SCU) 70,80,80 70 SIS=-1.0 80 R=SIR*(SIR*RCU)**0.3333333333 S=SIS*(SIS*SCU)**0.3333333333 Z(1)=R+S-B10V3 Z(2)=-(R+S)/2.0-B10V3 Z(3)=0.86602540*(R-S) GO TO 130
100
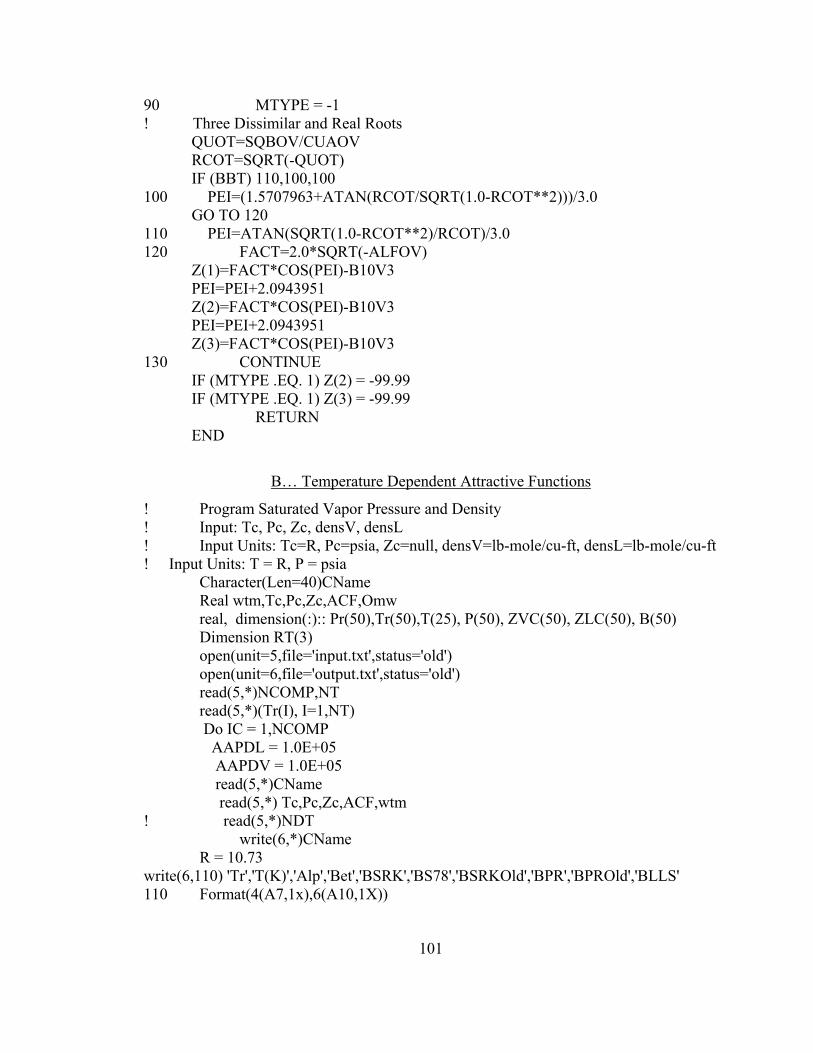
90 MTYPE = -1 ! Three Dissimilar and Real Roots QUOT=SQBOV/CUAOV RCOT=SQRT(-QUOT) IF (BBT) 110,100,100 100 PEI=(1.5707963+ATAN(RCOT/SQRT(1.0-RCOT**2)))/3.0 GO TO 120 110 PEI=ATAN(SQRT(1.0-RCOT**2)/RCOT)/3.0 120 FACT=2.0*SQRT(-ALFOV) Z(1)=FACT*COS(PEI)-B10V3 PEI=PEI+2.0943951 Z(2)=FACT*COS(PEI)-B10V3 PEI=PEI+2.0943951 Z(3)=FACT*COS(PEI)-B10V3 130 CONTINUE IF (MTYPE .EQ. 1) Z(2) = -99.99 IF (MTYPE .EQ. 1) Z(3) = -99.99 RETURN END
B… Temperature Dependent Attractive Functions
! Program Saturated Vapor Pressure and Density ! Input: Tc, Pc, Zc, densV, densL ! Input Units: Tc=R, Pc=psia, Zc=null, densV=lb-mole/cu-ft, densL=lb-mole/cu-ft ! Input Units: T = R, P = psia Character(Len=40)CName Real wtm,Tc,Pc,Zc,ACF,Omw real, dimension(:):: Pr(50),Tr(50),T(25), P(50), ZVC(50), ZLC(50), B(50) Dimension RT(3) open(unit=5,file='input.txt',status='old') open(unit=6,file='output.txt',status='old') read(5,*)NCOMP,NT read(5,*)(Tr(I), I=1,NT) Do IC = 1,NCOMP AAPDL = 1.0E+05 AAPDV = 1.0E+05 read(5,*)CName read(5,*) Tc,Pc,Zc,ACF,wtm ! read(5,*)NDT write(6,*)CName R = 10.73 write(6,110) 'Tr','T(K)','Alp','Bet','BSRK','BS78','BSRKOld','BPR','BPROld','BLLS' 110 Format(4(A7,1x),6(A10,1X))
101

Do 200 I = 1,NT Call BVirial(Tc,Tr(I),P,Pc,Zc,R,ACF,wtm,BSRK,BS78,BSOld,BPR,BPOld,BLLS,& ZRK,ZPR,ZLLS,Alp,Bet,Omw) write (6,1)Tr(I),(Tr(I)*Tc),Alp,Bet,BSRK,BS78,BSOld,BPR,BPOld,BLLS 1 Format (2(F7.2,1x),2(F7.4,1x),6(F10.4,1X)) 200 Continue write(6,1) Tc,Pc,Zc,ACF,wtm,Omw end do close(5) close(6) Stop End Subroutine BVirial(Tc,TR, P, Pc, Zc, R, ACF, wtm, BSRK, BS78, BSOld, BPR,& BPOld, BLLS, ZRK, ZPR, ZLLS,Alp,Bet,Omw) Omw = ((0.361)/(1+0.0274*ACF))*0.9 ! Omw = ((0.361)/(1+0.0274*ACF))*1.1 ! Omw = ((0.361)/(1+0.0274*ACF)) ! CoefLLS = 0.1778+0.2287*ACF+0.1710*ACF**2+0.0034*(ACF*wtm) ! CoefSRK =0.4604+0.7775*ACF+0.2146*ACF**2+0.0032*(ACF*wtm) ! CoefPR =0.3588+0.8562*ACF+0.1213*ACF**2+0.0028*(ACF*wtm) ! CoefLLS = 0.1971+0.0863*ACF+0.3571*ACF**2+0.0036*(ACF*wtm) ! CoefSRK =0.4604+0.7775*ACF+0.2146*ACF**2+0.0032*(ACF*wtm) ! CoefPR =0.3588+0.8562*ACF+0.1213*ACF**2+0.0028*(ACF*wtm) CoefLLS = 0.132239978 CoefPR = 0.321378375 CoefSRK =0.399954468 ! CoefLLS = -0.10988 ! CoefPR = 0.0136 ! CoefSRK =0.07092 CoefS78 =(1+(0.48508+1.55171*ACF-0.156136*ACF**2)*(1-sqrt(TR)))**2 CoefSOld =(1+(0.480+1.574*ACF-0.176*ACF**2)*(1-sqrt(TR)))**2 CoefPOld = (1+(0.37464+1.54226*ACF-0.26992*ACF**2)*(1-sqrt(TR)))**2 Alp = (1.+(Omw-3.)*Zc)/(Omw*Zc) Bet = (Zc**2*((Omw-1.)**3)+2.*Omw**2.*Zc+Omw*(1.-.*Zc))/(Omw**2*Zc) OmaLLS =(1.+(Omw-1.)*Zc)**3 OmbLLS = Omw*Zc OmaSRK = 0.42747 OmbSRK = 0.08664 OmaPR = 0.45724 OmbPR = 0.07780 BPR = (OmbPR-(OmaPR*TR**(-(CoefPR+1)))) BPOld =(OmbPR-(OmaPR*TR**(-(CoefPOld+1)))) BSRK = (OmbSRK-(OmaSRK*TR**(-(CoefSRK+1))))
102

BSOld=(OmbSRK-(OmaSRK*TR**(-(CoefSOld+1)))) BS78=(OmbSRK-(OmaSRK*TR**(-(CoefS78+1)))) BLLS =(OmbLLS-(OmaLLS*TR**(-(CoefLLS+1)))) ZSRK =1+((PR/TR)*(BSRK*Pc/(R*Tc))) ZPR =1+((PR/TR)*(BPR*Pc/(R*Tc))) ZLLS =1+((PR/TR)*(BLLS*Pc/(R*Tc))) Return End
B…. Density Prediction by Lawal-Lake-Silberberg EOS
! Program Saturated Density and Vapor Pressure Prediction with LLS EOS ! Input: Tc, Pc, Zc, densV, densL ! Input Units: Tc=R, Pc=psia, Zc=null, densV=lb-mole/cu-ft, densL=lb-mole/cu-ft ! Input Units: T = R, P = psia Character(Len=40)CName Real wtm,Tc,Pc real, allocatable, dimension(:):: Pr,Tr,T, P, DLE, DGE, DLC, DGC, & VPD, ZVC, ZLC, FUGR, DEVL, DEVG, B Dimension RT(3) open(unit=5,file='input.txt',status='old') open(unit=6,file='output.txt',status='unknown') read(5,*)NCOMP Do IC = 1,NCOMP AAPDL = 1.0E+05 AAPDV = 1.0E+05 read(5,*)CName read(5,*) Tc,Pc,Zc,ACF,wtm read(5,*)NDT write(6,*)CName write(6,1)'Tc=',Tc,'Pc=',Pc,'Zc=',Zc,'ACF=',ACF,'wtm=',wtm 1 Format (A5,F8.2,A5,F8.2,A5,F8.2,A5,F8.2,A5,F8.2) allocate(Pr(NDT),Tr(NDT),P(NDT),T(NDT),DLE(NDT),DGE(NDT),DLC(NDT),& DGC(NDT),VPD(NDT),ZVC(NDT),ZLC(NDT),FUGR(NDT),DEVL(NDT),& DEVG(NDT),B(NDT)) R = 10.73 DO 60 I =1,NDT read(5,*)DLE(I),DGE(I),P(I),T(I) write (6,*)DLE(I),DGE(I),P(I),T(I) 60 continue APDL = 0.0 APDV = 0.0 ! VP=1 If (P(1).GT.0.0) VP = P(1)
103
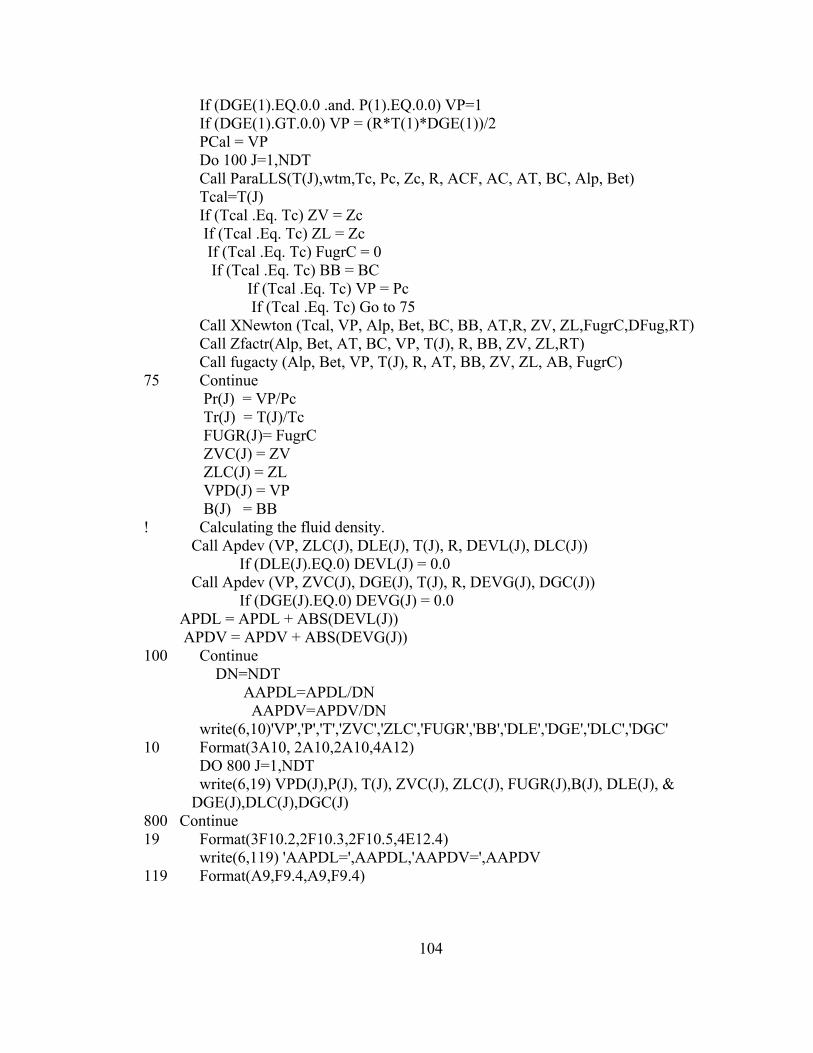
If (DGE(1).EQ.0.0 .and. P(1).EQ.0.0) VP=1 If (DGE(1).GT.0.0) VP = (R*T(1)*DGE(1))/2 PCal = VP Do 100 J=1,NDT Call ParaLLS(T(J),wtm,Tc, Pc, Zc, R, ACF, AC, AT, BC, Alp, Bet) Tcal=T(J) If (Tcal .Eq. Tc) ZV = Zc If (Tcal .Eq. Tc) ZL = Zc If (Tcal .Eq. Tc) FugrC = 0 If (Tcal .Eq. Tc) BB = BC If (Tcal .Eq. Tc) VP = Pc If (Tcal .Eq. Tc) Go to 75 Call XNewton (Tcal, VP, Alp, Bet, BC, BB, AT,R, ZV, ZL,FugrC,DFug,RT) Call Zfactr(Alp, Bet, AT, BC, VP, T(J), R, BB, ZV, ZL,RT) Call fugacty (Alp, Bet, VP, T(J), R, AT, BB, ZV, ZL, AB, FugrC) 75 Continue Pr(J) = VP/Pc Tr(J) = T(J)/Tc FUGR(J)= FugrC ZVC(J) = ZV ZLC(J) = ZL VPD(J) = VP B(J) = BB ! Calculating the fluid density. Call Apdev (VP, ZLC(J), DLE(J), T(J), R, DEVL(J), DLC(J)) If (DLE(J).EQ.0) DEVL(J) = 0.0 Call Apdev (VP, ZVC(J), DGE(J), T(J), R, DEVG(J), DGC(J)) If (DGE(J).EQ.0) DEVG(J) = 0.0 APDL = APDL + ABS(DEVL(J)) APDV = APDV + ABS(DEVG(J)) 100 Continue DN=NDT AAPDL=APDL/DN AAPDV=APDV/DN write(6,10)'VP','P','T','ZVC','ZLC','FUGR','BB','DLE','DGE','DLC','DGC' 10 Format(3A10, 2A10,2A10,4A12) DO 800 J=1,NDT write(6,19) VPD(J),P(J), T(J), ZVC(J), ZLC(J), FUGR(J),B(J), DLE(J), & DGE(J),DLC(J),DGC(J) 800 Continue 19 Format(3F10.2,2F10.3,2F10.5,4E12.4) write(6,119) 'AAPDL=',AAPDL,'AAPDV=',AAPDV 119 Format(A9,F9.4,A9,F9.4)
104

deallocate(Pr,Tr,T,P,DLE,DGE,DLC,DGC,ZVC,ZLC,DEVL,DEVG,FUGR,VPD,B) end do close(5) close(6) Stop End SUBROUTINE Apdev (P, ZV, DGE, T, R, Pdev, Den) Den = P/(ZV*T*R) Dev = Den - DGE Pdev = 100.0*(Dev/DGE) RETURN END Subroutine BISINIT(Alp,Bet,XL,XR,FXL,FXR,T,PCal,AT,BC,R) ! To initialize the Bisection Method XR = 0.0 XL = 0.0 50 Continue XC1 = XR XC2 = XL If (XC1.NE.0.0 .and. XC2.NE.0.0) GO TO 130 Call Zfactr(Alp, Bet, AT, BC, PCal, T, R, BB, ZV, ZL,RT) ! write (6,*) Alp, Bet, AT, BC, PCal, T, R, BB, ZV, ZL If (ZV.NE.ZL) GO TO 55 If (ZV.EQ.ZL) PCal = PCal*1.005 GO TO 50 55 Call fugacty (Alp, Bet, PCal, T, R, AT, BB, ZV, ZL, AB, FugrC) if (FugrC.GT.0.0) GO TO 120 if (FugrC.LE.0.0) GO TO 125 120 Continue If (FugrC.GT.0.0) XR = PCal If (FugrC.GT.0.0) FXR = FugrC If (FugrC.GT.0.0) PCal = PCal*0.75 If (XC2.EQ.0.0) Go to 50 125 Continue If (FugrC.LE.0.0) XL = PCal If (FugrC.LE.0.0) FXL = FugrC If (FugrC.LE.0.0) PCal = PCal*1.005 If (XC1.EQ.0.0) Go to 50 ! write(6,*)'J=',J,' XL=',XL,' XR=',XR,' XC1=',XC1,' FXL=',FXL,' FXR=',FXR 130 Continue RETURN END
105

SUBROUTINE BISECT (XL, XR, FXL, FXR,T, Tc, P, Pc,Alp, Bet, BC, BB, & AC, AT, R, ZVC, ZLC, XFIT,FGV,FGL, FIT,RT) Dimension RT(3) IMAX=50 EPS=1.0E-07 ! Check for Presence of a Root if(FXL*FXR)50,30,80 30 IT=1 if(FXL.NE.0.0)go to 40 XFIT=XL FIT=0.0 go to 80 40 XFIT=XR FIT=0.0 go to 80 ! Begin Bisection Method 50 do 70 IJ=1, IMAX XFIT=(XL*FXR-XR*FXL)/(FXR-FXL) P=XFIT Call Zfactr (Alp, Bet, AT, BC, P, T, R, BB, ZVC, ZLC,RT) Call fugacty (Alp, Bet, P, T, R, AT, BB, ZVC, ZLC, AB, FIT) ! Check for Convergence with Tolerance IF(ABS(FIT).LE.EPS) go to 80 ! Keep Right or Left Subinterval IF(FIT*FXL<0) go to 60 XL=XFIT FXL=FIT go to 70 60 XR=XFIT FXR=FIT 70 continue 80 RETURN END SUBROUTINE XNewton (T, P, Alp, Bet, BC, BB, AT,R, ZVC, ZLC,Fugr,DFug,RT) Dimension RT (3) IMAX=50 DFR = 1.0E-05 EPS = 1.0E-03 ! Begin Newton-Raphson Method DP = 0.005 Do 70 IJ=1, IMAX
106
60 Continue Call Zfactr (Alp, Bet, AT, BC, P, T, R, BB, ZVC, ZLC,RT) ! If (ZVC .EQ.ZLC) write (6,*) 'T=',T,'P=',P,'ZVC=',ZVC,'ZLC=',ZLC If (ZVC .NE. ZLC) Go to 65 ! If (ZVC.GT. 0.1) P=P-0.001 ! If (ZVC .LE. 0.1) P = P+0.001 P= P*1.005 Go to 60 65 Continue Call fugacty (Alp, Bet, P, T, R, AT, BB, ZVC, ZLC, AB, Fugr) PDP = P + DP Call Zfactr (Alp, Bet, AT, BC, PDP, T, R, BBD, ZVDC, ZLDC,RTD) Call fugacty (Alp, Bet, PDP, T, R, AT, BBD, ZVDC, ZLDC, AB, DFugr) ! ...... Perform Derivative of the Fugacity ....... Call Dervfug (DP, Fugr, DFugr, DFug) ! Check for Convergence with Tolerance Pnew = P - (Fugr/DFug) RFDgr = Fugr/DFug DEVP= (Pnew-P)/P ! write (6,1)'P=',P,'ZV=',ZVC,'ZL=',ZLC,'Fugr=',Fugr,'DFug=',DFug,'RFDgr=',RFDgr,'DEVP=',DEVP,'BB=',BB !1 Format (2(A4,F9.5),6(A7,E12.3)) ! write(6,*) 'Root=',RT ! IF(RFDgr.GE.P) go to 80 IF (ABS(DEVP) .LE. EPS) Go to 80 P=Pnew ! .... Keep New P ..... 70 continue 80 RETURN END Subroutine ParaSRK(T,P,wtm,Tc, Pc, R, ACF, AC, AT, BC, Alp, Bet) TR = T/Tc ! tmp = 0.480+1.574*ACF-0.176*ACF**2 ! GamT= (1+tmp*(1-sqrt(TR)))**2 ! theta = 0.457+0.721*ACF+0.322*ACF**2+0.0038*(ACF* wtm) GamT= (TR)**(-theta) Oma = 0.42747 Omb = 0.08664 AC = Oma*(R**2*Tc**2/Pc) BC = Omb*R*Tc/Pc AT = AC*GamT
107
Alp = 1 Bet = 0 Return End Subroutine ParaPR(T,P,wtm,Tc, Pc, R, ACF, AC, AT, BC, Alp, Bet) TR = T/Tc ! tmp = 0.37464+1.54226*ACF-0.26992*ACF**2 ! GamT= (1+tmp*(1-sqrt(TR)))**2 theta = 0.38+0.691*ACF+0.335*ACF**2+0.00315*(ACF*wtm) GamT= (TR)**(-theta) Oma = 0.45724 Omb = 0.07780 AC = Oma*(R**2*Tc**2/Pc) BC = Omb*R*Tc/Pc AT = AC*GamT Alp = 2 Bet = 1 Return End Subroutine ParaLLS(T,wtm,Tc, Pc, Zc, R, ACF, AC, AT,BC, Alp, Bet) ! Omw = (0.327)/(1.+0.0513*ACF) ! Sensitivity Analysis for Omw at +/- 10% ! Omw = ((0.361)/(1+0.0274*ACF))*0.9 ! Omw = ((0.361)/(1+0.0274*ACF))*1.1 ! Omw = 0.31 Omw = ((0.361)/(1+0.0274*ACF)) TR = T/Tc PR = P/Pc AC = (1.+(Omw-1.)*Zc)**3*(R**2*Tc**2/Pc) BC = (Omw*Zc)*R*Tc/Pc theta = 0.19708+0.08627*ACF+0.35714*(ACF**2)+(3.59015E-03)*(ACF*wtm) GamT= (TR)**(-theta) AT = AC*GamT Alp = (1.+(Omw-3.)*Zc)/(Omw*Zc) Bet = (Zc**2*((Omw-1.)**3)+2.*Omw**2.*Zc+Omw*(1.-3.*Zc))/(Omw**2*Zc) ! write(6,*) AC, AT,GamT, BC, Alp, Bet,Omw Return End Subroutine Zfactr (Alp, Bet, AT,BC, P, T, R, BB, ZV, ZL,RT)
108

Dimension Coef(4),RT(3) AA = AT*P/(R**2*T**2) BB = BC*P/(R*T) Coef(1) = 1. Coef(2) = -(1.+(1-Alp)*BB) Coef(3) = AA-(Alp*BB)-(Bet+Alp)*BB**2 Coef(4) = -(AA*BB-Bet*(BB**2+BB**3)) Call Cubic (MTYPE, Coef, RT) ! write(6,*) 'Root=',RT ,' BB=',BB Rmin = 1.E+10 Rmax = 1.E-10 Do 70 I=1,3 if (RT(I).LE. 0.0) Go to 70 if (RT(I).LT. BB) Go to 70 if (RT(I).GT. Rmax) Rmax = RT(I) if (RT(I).LT. Rmin) Rmin = RT(I) 70 Continue ZV=Rmax ZL=Rmin Return End Subroutine fugacty (Alp, Bet, P, T, R, AT, BB, ZV, ZL, AA, Fugr) AA = AT*P/(R**2*T**2) B2 = BB/2. D = sqrt(Alp**2 + 4.*Bet) Fir = ZV - ZL Sec = alog((ZL - BB)/(ZV - BB)) Zf = ((ZV + Alp*B2 + D*B2)/(ZV + Alp*B2 - D*B2)) Zs = ((ZL + Alp*B2 - D*B2)/(ZL + Alp*B2 + D*B2)) Thi = (AA/(D*BB))*alog(Zf*Zs) FGV = (ZV-1)-alog(ZV-BB)-(AA/(D*BB))*alog(Zf) FGL = (ZL-1)-alog(ZL-BB)-(AA/(D*BB))*alog(1/Zs) Fugr = Fir + Sec - Thi ! write(6,*) 'ZV=',ZV,'ZL=',ZL,'BB',BB Return End Subroutine Dervfug (DP, Fugr, DFugr, DFug) DFug = (DFugr-Fugr)/DP Return End SUBROUTINE Cubic (MTYPE, A, Z)
109
! Program Dimensioned for 4 Coefficients ! a3*X^3 + a2*X^2 + a1*X + a0 = 0 ! a3 MUST be greater or equal to 1 DIMENSION B(3), A(4), Z(3) B(1)=A(2)/A(1) B10V3=B(1)/3.0 B(2)=A(3)/A(1) B(3)=A(4)/A(1) ALF=B(2)-B(1)*B10V3 BBT=2.0*B10V3**3-B(2)*B10V3+B(3) BETOV=BBT/2.0 ALFOV=ALF/3.0 CUAOV=ALFOV**3 SQBOV=BETOV**2 DEL=SQBOV+CUAOV IF (DEL) 90,10,40 10 MTYPE = 0 ! Three Equal Roots GAM=SQRT(-ALFOV) IF (BBT) 30,30,20 20 Z(1) = -2.0*GAM-B10V3 Z(2) = GAM-B10V3 Z(3) = Z(2) GO TO 130 30 Z(1) = 2.0*GAM-B10V3 Z(2) = -GAM-B10V3 Z(3) = Z(2) GO TO 130 40 MTYPE = 1 ! One Real Root & 2 Imaginary Conjugate Roots EPS=SQRT(DEL) TAU=-BETOV RCU=TAU+EPS SCU=TAU-EPS SIR=1.0 SIS=1.0 IF (RCU) 50,60,60 50 SIR=-1.0 60 IF (SCU) 70,80,80 70 SIS=-1.0 80 R=SIR*(SIR*RCU)**0.3333333333 S=SIS*(SIS*SCU)**0.3333333333 Z(1)=R+S-B10V3 Z(2)=-(R+S)/2.0-B10V3
110
Z(3)=0.86602540*(R-S) GO TO 130 90 MTYPE = -1 ! Three Dissimilar and Real Roots QUOT=SQBOV/CUAOV RCOT=SQRT(-QUOT) IF (BBT) 110,100,100 100 PEI=(1.5707963+ATAN(RCOT/SQRT(1.0-RCOT**2)))/3.0 GO TO 120 110 PEI=ATAN(SQRT(1.0-RCOT**2)/RCOT)/3.0 120 FACT=2.0*SQRT(-ALFOV) Z(1)=FACT*COS(PEI)-B10V3 PEI=PEI+2.0943951 Z(2)=FACT*COS(PEI)-B10V3 PEI=PEI+2.0943951 Z(3)=FACT*COS(PEI)-B10V3 130 CONTINUE IF (MTYPE .EQ. 1) Z(2) = -99.99 IF (MTYPE .EQ. 1) Z(3) = -99.99 RETURN END
B…..Density Prediction by Soave-Redlich-Kwong EOS
! Program SatDSRK ! Input: Tc, Pc, Zc, densV, densL ! Input Units: Tc=R, Pc=psia, Zc=null, densV=lb-mole/cu-ft, densL=lb-mole/cu-ft ! Input Units: T = R, P = psia Character(Len=40)CName real, allocatable, dimension(:):: Pr,Tr,T, P, DLE, DGE, DLC, DGC, ZVC,ZLC,& DEVL, DEVG, Fugr,Gam open(unit=5,file='input.txt',status='old') open(unit=6,file='output.txt',status='old') read(5,*)NCOMP Do IC = 1,NCOMP AAPDL = 1.0E+05 AAPDV = 1.0E+05 ITMAX = 250 read(5,*)CName read(5,*)Tc,Pc,Zc,ACF read(5,*)NDT write(6,*)NDT,Tc,Pc,Zc,ACF
111
allocate(DLE(NDT),DGE(NDT),P(NDT),T(NDT),DLC(NDT),DGC(NDT),Gam(NDT)& ,ZVC(NDT),ZLC(NDT),Fugr(NDT),DEVL(NDT),DEVG(NDT),Pr(NDT),Tr(NDT)) write(6,*)CName R = 10.73 DO 60 I =1,NDT read(5,*)DLE(I),DGE(I),P(I),T(I) 60 continue ZCRK = 1.0/3.0 Omw=0.08664/ZCRK write (6,20) 'IT',' OmW',' AAPDL',' AAPDV' 20 Format(2A10,2A15) IT=1 Call Crtpar(Tc, Pc, Zc, R, ACF, Omw, AC, BC, Alp, Bet) APDL = 0.0 APDV = 0.0 Do 100 J=1,NDT VL = 1/DLE(J) If (J.EQ. 1) Tmp = (((R*T(J))/(ABS(VL-BC)))-P(J))*((VL**2+Alp*BC*VL-& Bet*BC**2)/AC) RT = T(J)/Tc
if (RT.GE.0.9999) ZV = ZCRK if (RT.GE.0.9999) ZL = ZV if (RT.GE.0.9999) FugrC = 0.0 if (RT.GE.0.9999) Tmp = 1 if (RT.GE.0.9999) GO TO 35 XR = 0.0 XL = 0.0 50 Continue XC1 = XR XC2 = XL If (XC1.NE.0.0 .and. XC2.NE.0.0) GO TO 130 AT= Tmp*AC Call Zfactr(Alp, Bet, AT, BC, P(J), T(J), R, BB, ZV, ZL) If (ZV.NE.ZL) GO TO 55 If (ZV.EQ.ZL) Tmp = Tmp*1.0005 GO TO 50 55 Call fugacty (Alp, Bet, P(J), T(J), R, AT, BB, ZV, ZL, AB, FugrC) if (FugrC.GT.0.0) GO TO 120 if (FugrC.LE.0.0) GO TO 125 120 Continue If (FugrC.GT.0.0) XR = Tmp If (FugrC.GT.0.0) FXR = FugrC If (FugrC.GT.0.0) Tmp = Tmp*0.75 If (XC2.EQ.0.0) Go to 50
112

125 Continue If (FugrC.LE.0.0) XL = Tmp If (FugrC.LE.0.0) FXL = FugrC If (FugrC.LE.0.0) Tmp = Tmp*1.05 If (XC1.EQ.0.0) Go to 50 130 Continue Tr(J)=T(J)/Tc Pr(J)=P(J)/Pc If(Tr(J).GT.0.97) EPS=1.0E-02 If(Tr(J).LE.0.97) EPS=1.0E-07 Call BISECT (XL, XR, FXL, FXR,EPS, T(J),Tc, P(J), Pc,Alp, Bet, BC, BB, & AC,R,ZV,ZL,Tmp,FugrC) 35 Continue Pr(J)=P(J)/Pc Tr(J)=T(J)/Tc Fugr(J)=FugrC ZVC(J) = ZV ZLC(J) = ZL Gam(J)= Tmp ! Calculating the fluid density. If (DLE(J).GT.0) Call Apdev (P(J), ZLC(J), DLE(J), T(J), R, DEVL(J), DLC(J)) If (DLE(J).EQ.0) DEVL(J) = 0.0 If (DGE(J).GT.0) Call Apdev (P(J), ZVC(J), DGE(J), T(J), R, DEVG(J), DGC(J)) If (DGE(J).EQ.0) DEVG(J) = 0.0 APDL = APDL + ABS(DEVL(J)) APDV = APDV + ABS(DEVG(J)) 100 Continue DN=NDT APDL=APDL/DN APDV=APDV/DN write(6,*)IT,Omw,APDL,APDV write(6,10) 'Pr','Tr','Gam','ZVC','ZLC','Fugr','DLE','DGE','DLC','DGC','DEVL',& 'DEVG' 10 Format(2A6, 2A8,2A10, 4A8, 2A7) DO 800 J=1,NDT write(6,19) Pr(J),Tr(J),Gam(J),ZVC(J),ZLC(J),Fugr(J),DLE(J),DGE(J),& DLC(J),DGC(J),DEVL(J),DEVG(J) 800 Continue 19 Format(2F6.3,2F8.4,F10.4,E10.2,4F8.4,2F7.2) deallocate(DLE, DGE, P, T, DLC, DGC, ZVC, ZLC, Fugr, DEVL, DEVG,Gam,Pr,Tr) end do close(5)
113
close(6) Stop End SUBROUTINE Apdev (P, ZV, DGE, T, R, Pdev, Den) Den = P/(ZV*T*R) Dev = Den - DGE Pdev = 100.0*(Dev/DGE) RETURN END SUBROUTINE BISECT (XL, XR, FXL, FXR,EPS,T, Tc, P, Pc,Alp, Bet, BC, BB, AC, & R, ZVC, ZLC, XFIT, FIT) IMAX=50 ! EPS=1.0E-07 ! Check for Presence of a Root if(FXL*FXR)50,30,80 30 IT=1 if(FXL.NE.0.0)go to 40 XFIT=XL FIT=0.0 go to 80 40 XFIT=XR FIT=0.0 go to 80 ! Begin Bisection Method 50 do 70 IJ=1, IMAX XFIT=(XL*FXR-XR*FXL)/(FXR-FXL) AT=XFIT*AC Call Zfactr (Alp, Bet, AT, BC, P, T, R, BB, ZVC, ZLC) Call fugacty (Alp, Bet, P, T, R, AT, BB, ZVC, ZLC, AB,& FIT) ! Check for Convergence with Tolerance IF(ABS(FIT).LE.EPS) go to 80 ! Keep Right or Left Subinterval IF(FIT*FXL<0) go to 60 XL=XFIT FXL=FIT go to 70 60 XR=XFIT FXR=FIT 70 continue 80 RETURN
114
END SUBROUTINE XNewton (T, P, Alp, Bet, BC, BB, AC,R, ZVC, ZLC, tmp, Fugr) IMAX=50 EPS=1.0E-07 ! Begin Newton-Raphson Method oldtmp = tmp do 70 IJ=1, IMAX 30 continue AT=tmp*AC 20 continue Call Zfactr (Alp, Bet, AT, BC, P, T, R, BB, ZVC, ZLC) if (ZVC.NE.ZLC) GO TO 50 if (ZVC.EQ.ZLC) Tmp = Tmp*1.005 GO TO 20 50 Call fugacty (Alp, Bet, P, T, R, AT, BB, ZVC, ZLC, AB,Fugr) ! ...... Perform Derivative of the Fugacity ....... Call Dervfug (Alp, Bet, P, T, R, AT, BB, ZV, ZL, AC, DFugr) tmp = tmp - Fugr/DFugr ! Check for Convergence with Tolerance Ptmp = (tmp-oldtmp)/oldtmp IF(ABS(Ptmp).LE.EPS) go to 80 ! .... Keep New tmp ..... oldtmp = tmp 70 continue 80 RETURN END Subroutine Crtpar(Tc, Pc, Zc, R, ACF, Omw, AC, BC, Alp, Bet) Oma=0.42747 Omb=0.08664 AC = Oma*(R**2*Tc**2/Pc) BC = Omb*R*Tc/Pc Alp = 1 Bet = 0 Return End Subroutine Zfactr (Alp, Bet, AT,BC, P, T, R, BB, ZV, ZL) Dimension Coef(4),RT(3) AA = AT*P/(R**2*T**2) BB = BC*P/(R*T) Coef(1) = 1. Coef(2) = -(1.+(1-Alp)*BB)
115

Coef(3) = AA-(Alp*BB)-(Bet+Alp)*BB**2 Coef(4) = -(AA*BB-Bet*(BB**2+BB**3)) Call Cubic (MTYPE, Coef, RT) Rmin = 1.E+10 Rmax = 1.E-10 Do 70 I=1,3 if (RT(I).LE. 0.0) Go to 70 if (RT(I).LT. BB) Go to 70 if (RT(I).GT. Rmax) Rmax = RT(I) if (RT(I).LT. Rmin) Rmin = RT(I) 70 Continue ZV=Rmax ZL=Rmin Return End Subroutine fugacty (Alp, Bet, P, T, R, AT, BB, ZV, ZL, AA, Fugr) AA = AT*P/(R**2*T**2) B2 = BB/2. D = sqrt(Alp**2 + 4.*Bet) Fir = ZV - ZL Sec = alog((ZL - BB)/(ZV - BB)) Zf = ((ZV + Alp*B2 + D*B2)/(ZV + Alp*B2 - D*B2)) Zs = ((ZL + Alp*B2 - D*B2)/(ZL + Alp*B2 + D*B2)) Thi = (AA/(D*BB))*alog(Zf*Zs) Fugr = Fir + Sec - Thi Return End Subroutine Dervfug (Alp, Bet, P, T, R, AT, BB, ZV, ZL, AC, DFugr) AA = AC*P/(R**2*T**2) B2 = BB/2. D = sqrt(Alp**2 + 4.*Bet) Zf = ((ZV + Alp*B2 + D*B2)/(ZV + Alp*B2 - D*B2)) Zs = ((ZL + Alp*B2 - D*B2)/(ZL + Alp*B2 + D*B2)) DFugr = (AA/(D*BB))*alog(Zf*Zs) Return End SUBROUTINE Cubic (MTYPE, A, Z) ! Program Dimensioned for 4 Coefficients ! a3*X^3 + a2*X^2 + a1*X + a0 = 0 ! a3 MUST be greater or equal to 1 DIMENSION B(3), A(4), Z(3)
116
B(1)=A(2)/A(1) B10V3=B(1)/3.0 B(2)=A(3)/A(1) B(3)=A(4)/A(1) ALF=B(2)-B(1)*B10V3 BBT=2.0*B10V3**3-B(2)*B10V3+B(3) BETOV=BBT/2.0 ALFOV=ALF/3.0 CUAOV=ALFOV**3 SQBOV=BETOV**2 DEL=SQBOV+CUAOV IF (DEL) 90,10,40 10 MTYPE = 0 ! Three Equal Roots GAM=SQRT(-ALFOV) IF (BBT) 30,30,20 20 Z(1) = -2.0*GAM-B10V3 Z(2) = GAM-B10V3 Z(3) = Z(2) GO TO 130 30 Z(1) = 2.0*GAM-B10V3 Z(2) = -GAM-B10V3 Z(3) = Z(2) GO TO 130 40 MTYPE = 1 ! One Real Root & 2 Imaginary Conjugate Roots EPS=SQRT(DEL) TAU=-BETOV RCU=TAU+EPS SCU=TAU-EPS SIR=1.0 SIS=1.0 IF (RCU) 50,60,60 50 SIR=-1.0 60 IF (SCU) 70,80,80 70 SIS=-1.0 80 R=SIR*(SIR*RCU)**0.3333333333 S=SIS*(SIS*SCU)**0.3333333333 Z(1)=R+S-B10V3 Z(2)=-(R+S)/2.0-B10V3 Z(3)=0.86602540*(R-S) GO TO 130 90 MTYPE = -1 ! Three Dissimilar and Real Roots
117
QUOT=SQBOV/CUAOV RCOT=SQRT(-QUOT) IF (BBT) 110,100,100 100 PEI=(1.5707963+ATAN(RCOT/SQRT(1.0-RCOT**2)))/3.0 GO TO 120 110 PEI=ATAN(SQRT(1.0-RCOT**2)/RCOT)/3.0 120 FACT=2.0*SQRT(-ALFOV) Z(1)=FACT*COS(PEI)-B10V3 PEI=PEI+2.0943951 Z(2)=FACT*COS(PEI)-B10V3 PEI=PEI+2.0943951 Z(3)=FACT*COS(PEI)-B10V3 130 CONTINUE IF (MTYPE .EQ. 1) Z(2) = -99.99 IF (MTYPE .EQ. 1) Z(3) = -99.99 RETURN END
B…. Density Prediction by Peng-Robinson EOS
! Program SatDPR ! Input: Tc, Pc, Zc, densV, densL ! Input Units: Tc=R, Pc=psia, Zc=null, densV=lb-mole/cu-ft, densL=lb-mole/cu-ft ! Input Units: T = R, P = psia Character(Len=40)CName real, allocatable, dimension(:):: Pr,Tr,T, P, DLE, DGE, DLC, DGC, ZVC, ZLC, & DEVL, DEVG, Fugr,Gam open(unit=5,file='input.txt',status='old') open(unit=6,file='output.txt',status='old') read(5,*)NCOMP Do IC = 1,NCOMP AAPDL = 1.0E+05 AAPDV = 1.0E+05 ITMAX = 250 read(5,*)CName read(5,*)Tc,Pc,Zc,ACF read(5,*)NDT write(6,*)NDT,Tc,Pc,Zc,ACF allocate(DLE(NDT),DGE(NDT),P(NDT),T(NDT),DLC(NDT),DGC(NDT),Gam(NDT)& , ZVC(NDT),ZLC(NDT),Fugr(NDT),DEVL(NDT),DEVG(NDT),Pr(NDT),Tr(NDT)) write(6,*)CName R = 10.73 DO 60 I =1,NDT
118
read(5,*)DLE(I),DGE(I),P(I),T(I) 60 continue ZCPR=0.3074 Omw=0.07780/ZCPR write (6,20) 'IT',' OmW',' AAPDL',' AAPDV' 20 Format(2A10,2A15) IT=1 Call Crtpar(Tc, Pc, ZCPR, R, ACF, Omw, AC, BC, Alp, Bet) APDL = 0.0 APDV = 0.0 Do 100 J=1,NDT VL = 1/DLE(J) If (J.EQ. 1) Tmp = (((R*T(J))/(abs(VL-BC)))-P(J))*((VL**2+Alp*BC*VL-Bet*BC**2)/AC) RT = T(J)/Tc if (RT.GE.0.9999) ZV = ZCPR if (RT.GE.0.9999) ZL = ZV if (RT.GE.0.9999) FugrC = 0.0 if (RT.GE.0.9999) Tmp = 1 if (RT.GE.0.9999) GO TO 35 XR = 0.0 XL = 0.0 50 Continue
XC1 = XR XC2 = XL If (XC1.NE.0.0 .and. XC2.NE.0.0) GO TO 130 AT= Tmp*AC Call Zfactr(Alp, Bet, AT, BC, P(J), T(J), R, BB, ZV, ZL) If (ZV.NE.ZL) GO TO 55 If (ZV.EQ.ZL) Tmp = Tmp*1.0005 GO TO 50 55 Call fugacty (Alp, Bet, P(J), T(J), R, AT, BB, ZV, ZL, AB, FugrC) if (FugrC.GT.0.0) GO TO 120 if (FugrC.LE.0.0) GO TO 125 120 Continue If (FugrC.GT.0.0) XR = Tmp If (FugrC.GT.0.0) FXR = FugrC If (FugrC.GT.0.0) Tmp = Tmp*0.75 If (XC2.EQ.0.0) Go to 50 125 Continue If (FugrC.LE.0.0) XL = Tmp If (FugrC.LE.0.0) FXL = FugrC If (FugrC.LE.0.0) Tmp = Tmp*1.05 If (XC1.EQ.0.0) Go to 50
119

130 Continue Tr(J)=T(J)/Tc Pr(J)=P(J)/Pc If(Tr(J).GT.0.97) EPS=1.0E-02 If(Tr(J).LE.0.97) EPS=1.0E-07 Call BISECT (XL, XR, FXL, FXR,EPS, T(J),Tc, P(J), Pc,Alp, Bet, BC, BB, & AC,R,ZV,ZL,Tmp,FugrC) 35 Continue Pr(J)=P(J)/Pc Tr(J)=T(J)/Tc Fugr(J)=FugrC ZVC(J) = ZV ZLC(J) = ZL Gam(J)= Tmp ! Calculating the fluid density. If (DLE(J).GT.0) Call Apdev (P(J), ZLC(J), DLE(J), T(J), R, DEVL(J), DLC(J)) If (DLE(J).EQ.0) DEVL(J) = 0.0 If (DGE(J).GT.0) Call Apdev (P(J), ZVC(J), DGE(J), T(J), R, DEVG(J), DGC(J)) If (DGE(J).EQ.0) DEVG(J) = 0.0 APDL = APDL + ABS(DEVL(J)) APDV = APDV + ABS(DEVG(J)) 100 Continue DN=NDT APDL=APDL/DN APDV=APDV/DN write(6,*)IT,Omw,APDL,APDV write(6,10) 'Pr','Tr','Gam','ZVC','ZLC','Fugr','DLE','DGE','DLC','DGC','DEVL',& 'DEVG' 10 Format(2A6, 2A8,2A10, 4A8, 2A7) DO 800 J=1,NDT write(6,19) Pr(J),Tr(J),Gam(J),ZVC(J),ZLC(J),Fugr(J),DLE(J),DGE(J),& DLC(J),DGC(J),DEVL(J),DEVG(J) 800 Continue 19 Format(2F6.3,2F8.4,F10.4,E10.2,4F8.4,2F7.2) deallocate(DLE, DGE, P, T, DLC, DGC, ZVC, ZLC, Fugr, DEVL, DEVG,Gam,Pr,Tr) end do close(5) close(6) Stop End SUBROUTINE Apdev (P, ZV, DGE, T, R, Pdev, Den)
120
Den = P/(ZV*T*R) Dev = Den - DGE Pdev = 100.0*(Dev/DGE) RETURN END SUBROUTINE BISECT (XL, XR, FXL, FXR,EPS,T, Tc, P, Pc,Alp, Bet, BC, & BB, AC, R, ZVC, ZLC, XFIT, FIT) IMAX=50 ! EPS=1.0E-07 ! Check for Presence of a Root if(FXL*FXR)50,30,80 30 IT=1 if(FXL.NE.0.0)go to 40 XFIT=XL FIT=0.0 go to 80 40 XFIT=XR FIT=0.0 go to 80 ! Begin Bisection Method 50 do 70 IJ=1, IMAX XFIT=(XL*FXR-XR*FXL)/(FXR-FXL) AT=XFIT*AC Call Zfactr (Alp, Bet, AT, BC, P, T, R, BB, ZVC, ZLC) Call fugacty (Alp, Bet, P, T, R, AT, BB, ZVC, ZLC, AB,& FIT) ! Check for Convergence with Tolerance IF(ABS(FIT).LE.EPS) go to 80 ! Keep Right or Left Subinterval IF(FIT*FXL<0) go to 60 XL=XFIT FXL=FIT go to 70 60 XR=XFIT FXR=FIT 70 continue 80 RETURN END SUBROUTINE XNewton (T, P, Alp, Bet, BC, BB, AC,R, ZVC, ZLC, tmp, Fugr) IMAX=50 EPS=1.0E-07 ! Begin Newton-Raphson Method
121

oldtmp = tmp do 70 IJ=1, IMAX 30 continue AT=tmp*AC 20 continue Call Zfactr (Alp, Bet, AT, BC, P, T, R, BB, ZVC, ZLC) if (ZVC.NE.ZLC) GO TO 50 if (ZVC.EQ.ZLC) Tmp = Tmp*1.005 GO TO 20 50 Call fugacty (Alp, Bet, P, T, R, AT, BB, ZVC, ZLC, AB,Fugr) ! ...... Perform Derivative of the Fugacity ....... Call Dervfug (Alp, Bet, P, T, R, AT, BB, ZV, ZL, AC, DFugr) tmp = tmp - Fugr/DFugr ! Check for Convergence with Tolerance Ptmp = (tmp-oldtmp)/oldtmp IF(ABS(Ptmp).LE.EPS) go to 80 ! .... Keep New tmp ..... oldtmp = tmp 70 continue 80 RETURN END ! Oma=(1.+(Omw-1.)*Zc)**3 ! Omb=(Omw*Zc) Subroutine Crtpar(Tc, Pc, Zc, R, ACF, Omw, AC, BC, Alp, Bet) Oma=0.45724 Omb=0.07780 AC = Oma*(R**2*Tc**2/Pc) BC = Omb*R*Tc/Pc Alp= 2 Bet= 1 ! Alp= (1.+(Omw-3.)*Zc)/(Omw*Zc) ! Bet= (Zc**2*((Omw-1.)**3)+2.*Omw**2.*Zc+Omw*(1.-3.*Zc))/(Omw**2*Zc) Return End Subroutine Zfactr (Alp, Bet, AT,BC, P, T, R, BB, ZV, ZL) Dimension Coef(4),RT(3) AA = AT*P/(R**2*T**2) BB = BC*P/(R*T) Coef(1) = 1. Coef(2) = -(1.+(1-Alp)*BB)
122

Coef(3) = AA-(Alp*BB)-(Bet+Alp)*BB**2 Coef(4) = -(AA*BB-Bet*(BB**2+BB**3)) Call Cubic (MTYPE, Coef, RT) ! write(6,*) 'Root=',RT Rmin = 1.E+10 Rmax = 1.E-10 Do 70 I=1,3 if (RT(I).LE. 0.0) Go to 70 if (RT(I).LT. BB) Go to 70 if (RT(I).GT. Rmax) Rmax = RT(I) if (RT(I).LT. Rmin) Rmin = RT(I) 70 Continue ZV=Rmax ZL=Rmin Return End Subroutine fugacty (Alp, Bet, P, T, R, AT, BB, ZV, ZL, AA, Fugr) AA = AT*P/(R**2*T**2) B2 = BB/2. D = sqrt(Alp**2 + 4.*Bet) Fir = ZV - ZL Sec = alog((ZL - BB)/(ZV - BB)) Zf = ((ZV + Alp*B2 + D*B2)/(ZV + Alp*B2 - D*B2)) Zs = ((ZL + Alp*B2 - D*B2)/(ZL + Alp*B2 + D*B2)) Thi = (AA/(D*BB))*alog(Zf*Zs) Fugr = Fir + Sec - Thi Return End Subroutine Dervfug (Alp, Bet, P, T, R, AT, BB, ZV, ZL, AC, DFugr) AA = AC*P/(R**2*T**2) B2 = BB/2. D = sqrt(Alp**2 + 4.*Bet) Zf = ((ZV + Alp*B2 + D*B2)/(ZV + Alp*B2 - D*B2)) Zs = ((ZL + Alp*B2 - D*B2)/(ZL + Alp*B2 + D*B2)) DFugr = (AA/(D*BB))*alog(Zf*Zs) Return End SUBROUTINE Cubic (MTYPE, A, Z) ! Program Dimensioned for 4 Coefficients ! a3*X^3 + a2*X^2 + a1*X + a0 = 0 ! a3 MUST be greater or equal to 1
123
DIMENSION B(3), A(4), Z(3) B(1)=A(2)/A(1) B10V3=B(1)/3.0 B(2)=A(3)/A(1) B(3)=A(4)/A(1) ALF=B(2)-B(1)*B10V3 BBT=2.0*B10V3**3-B(2)*B10V3+B(3) BETOV=BBT/2.0 ALFOV=ALF/3.0 CUAOV=ALFOV**3 SQBOV=BETOV**2 DEL=SQBOV+CUAOV IF (DEL) 90,10,40 10 MTYPE = 0 ! Three Equal Roots GAM=SQRT(-ALFOV) IF (BBT) 30,30,20 20 Z(1) = -2.0*GAM-B10V3 Z(2) = GAM-B10V3 Z(3) = Z(2) GO TO 130 30 Z(1) = 2.0*GAM-B10V3 Z(2) = -GAM-B10V3 Z(3) = Z(2) GO TO 130 40 MTYPE = 1 ! One Real Root & 2 Imaginary Conjugate Roots EPS=SQRT(DEL) TAU=-BETOV RCU=TAU+EPS SCU=TAU-EPS SIR=1.0 SIS=1.0 IF (RCU) 50,60,60 50 SIR=-1.0 60 IF (SCU) 70,80,80 70 SIS=-1.0 80 R=SIR*(SIR*RCU)**0.3333333333 S=SIS*(SIS*SCU)**0.3333333333 Z(1)=R+S-B10V3 Z(2)=-(R+S)/2.0-B10V3 Z(3)=0.86602540*(R-S) GO TO 130 90 MTYPE = -1
124
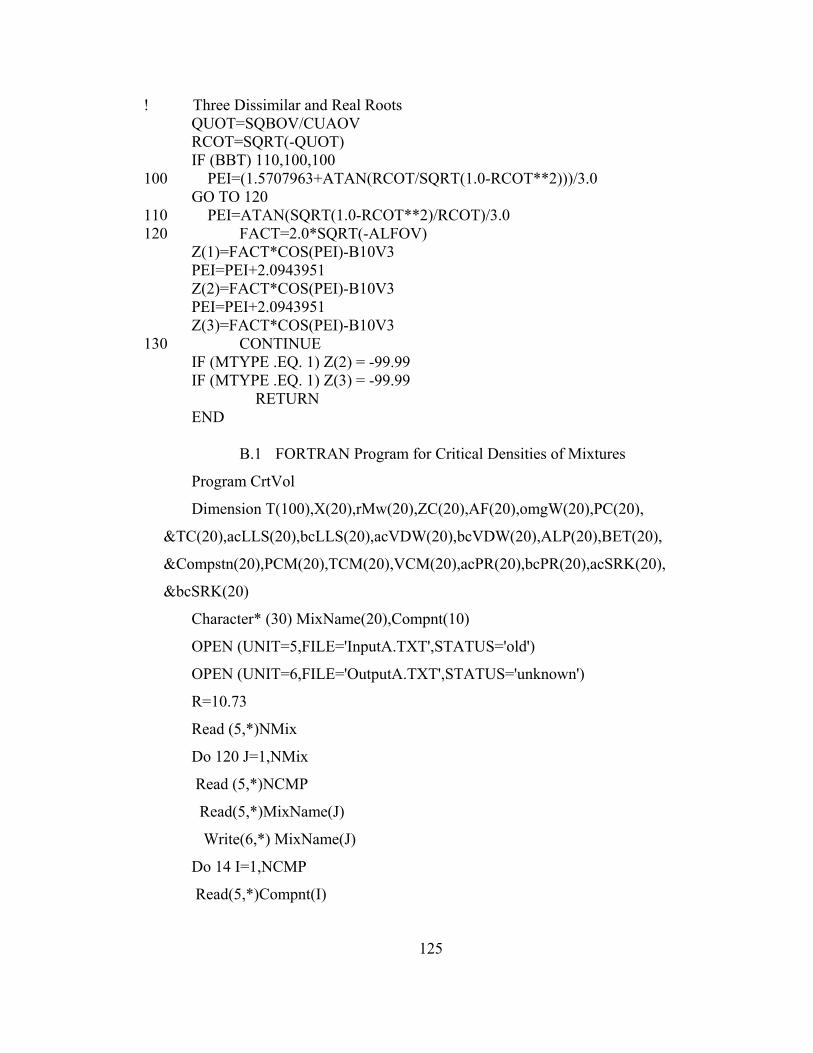
! Three Dissimilar and Real Roots QUOT=SQBOV/CUAOV RCOT=SQRT(-QUOT) IF (BBT) 110,100,100 100 PEI=(1.5707963+ATAN(RCOT/SQRT(1.0-RCOT**2)))/3.0 GO TO 120 110 PEI=ATAN(SQRT(1.0-RCOT**2)/RCOT)/3.0 120 FACT=2.0*SQRT(-ALFOV) Z(1)=FACT*COS(PEI)-B10V3 PEI=PEI+2.0943951 Z(2)=FACT*COS(PEI)-B10V3 PEI=PEI+2.0943951 Z(3)=FACT*COS(PEI)-B10V3 130 CONTINUE IF (MTYPE .EQ. 1) Z(2) = -99.99 IF (MTYPE .EQ. 1) Z(3) = -99.99 RETURN END
B.1 FORTRAN Program for Critical Densities of Mixtures
Program CrtVol
Dimension T(100),X(20),rMw(20),ZC(20),AF(20),omgW(20),PC(20),
&TC(20),acLLS(20),bcLLS(20),acVDW(20),bcVDW(20),ALP(20),BET(20),
&Compstn(20),PCM(20),TCM(20),VCM(20),acPR(20),bcPR(20),acSRK(20),
&bcSRK(20)
Character* (30) MixName(20),Compnt(10)
OPEN (UNIT=5,FILE='InputA.TXT',STATUS='old')
OPEN (UNIT=6,FILE='OutputA.TXT',STATUS='unknown')
R=10.73
Read (5,*)NMix
Do 120 J=1,NMix
Read (5,*)NCMP
Read(5,*)MixName(J)
Write(6,*) MixName(J)
Do 14 I=1,NCMP
Read(5,*)Compnt(I)
125

Read(5,*)TC(I),PC(I),ZC(I),AF(I),rMw(I)
C Compute a(I),b(I),ALP(I),BET(I) (by calling para)
Call Para(X(I),ZC(I),AF(I),omgW(I),PC(I),TC(I),
& ALP(I),BET(I),acLLS(I),bcLLS(I),acVDW(I),bcVDW(I),
& acPR(I),bcPR(I),acSRK(I),bcSRK(I))
14 Continue
C write(6,*)J,rMw(11)
C Compute am,bm (by calling Mixrule)
Read (5,*)NDT
write(6,300)"Compstn","PCM","TCM","VCM"
300 Format(4(A10))
Do 10 IJ=1,NDT
Read(5,*)Compstn(IJ),PCM(IJ),TCM(IJ),VCM(IJ)
10 write(6,310)Compstn(IJ),PCM(IJ),TCM(IJ),VCM(IJ)
310 Format(4(F10.3))
C Call EOSrule(Ncomp,X,AF,rMw,acLLS,bcLLS,acVDW,bcVDW,acPR,bcPR,
C &acSRK,bcSRK,amLLS,bmLLS,amVDW,bmVDW,amPR,bmPR,amSRK,bmSRK)
C Call
EOSPCTC(Ncomp,X,Pci,Tci,amVDW,bmVDW,amPR,bmPR,amSRK,bmSRK,
C &PCVDW,TCVDW,PCPR,TCPR,PCSRK,TCSRK,PCKay,TCKay)
C Write(6,50)J,Tc,Pc,PCKay,TCKay,PCVDW,TCVDW,PCPR,TCPR,PCSRK,
C &TCSRK
50 Format(1X,I3,10(F8.2,1X))
Call Volume(NDT,NCMP,Compstn,ALP,BET,AF,rMw,TCM,PCM,VCM)
18 Format(2I8,8(F10.4,X))
120 Continue
Close(5)
Close(6)
Stop
126
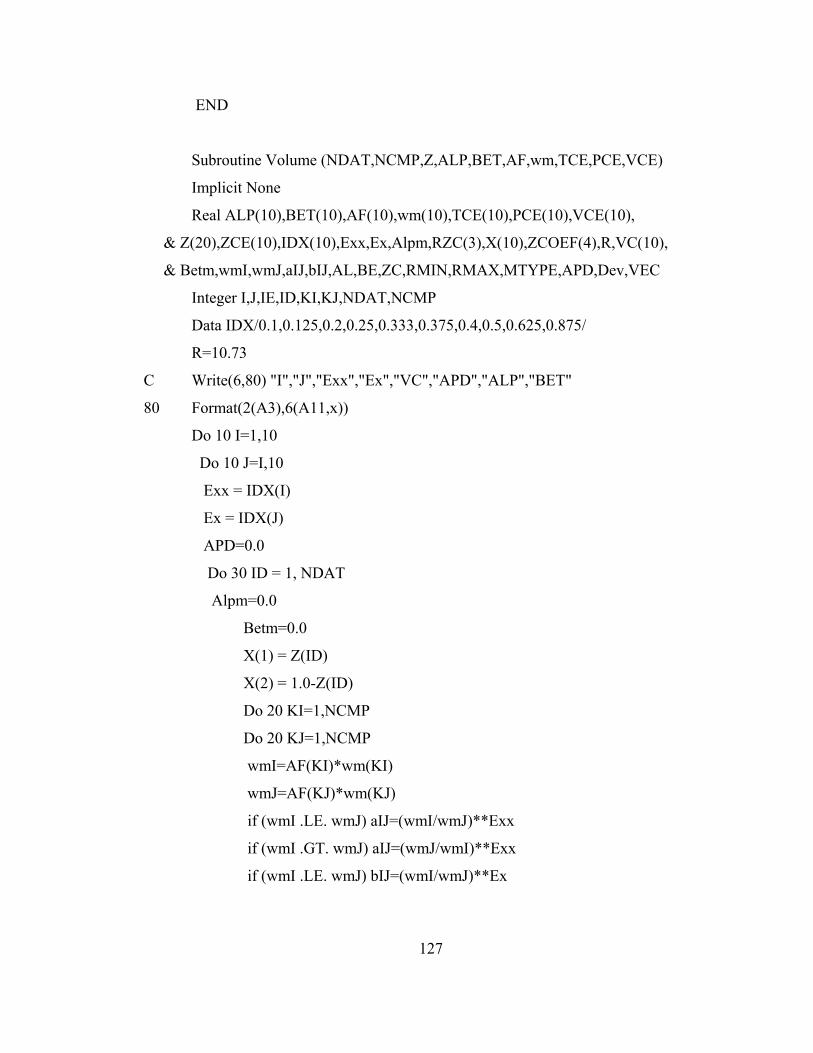
END
Subroutine Volume (NDAT,NCMP,Z,ALP,BET,AF,wm,TCE,PCE,VCE)
Implicit None
Real ALP(10),BET(10),AF(10),wm(10),TCE(10),PCE(10),VCE(10),
& Z(20),ZCE(10),IDX(10),Exx,Ex,Alpm,RZC(3),X(10),ZCOEF(4),R,VC(10),
& Betm,wmI,wmJ,aIJ,bIJ,AL,BE,ZC,RMIN,RMAX,MTYPE,APD,Dev,VEC
Integer I,J,IE,ID,KI,KJ,NDAT,NCMP
Data IDX/0.1,0.125,0.2,0.25,0.333,0.375,0.4,0.5,0.625,0.875/
R=10.73
C Write(6,80) "I","J","Exx","Ex","VC","APD","ALP","BET"
80 Format(2(A3),6(A11,x))
Do 10 I=1,10
Do 10 J=I,10
Exx = IDX(I)
Ex = IDX(J)
APD=0.0
Do 30 ID = 1, NDAT
Alpm=0.0
Betm=0.0
X(1) = Z(ID)
X(2) = 1.0-Z(ID)
Do 20 KI=1,NCMP
Do 20 KJ=1,NCMP
wmI=AF(KI)*wm(KI)
wmJ=AF(KJ)*wm(KJ)
if (wmI .LE. wmJ) aIJ=(wmI/wmJ)**Exx
if (wmI .GT. wmJ) aIJ=(wmJ/wmI)**Exx
if (wmI .LE. wmJ) bIJ=(wmI/wmJ)**Ex
127
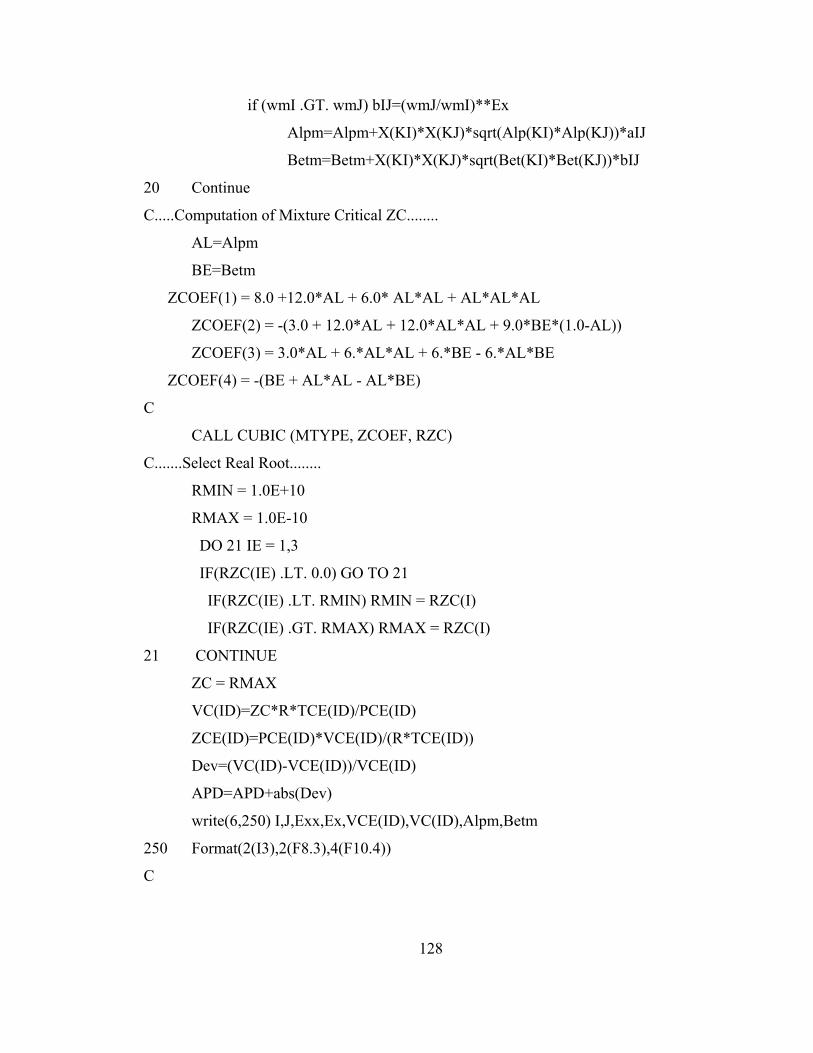
if (wmI .GT. wmJ) bIJ=(wmJ/wmI)**Ex
Alpm=Alpm+X(KI)*X(KJ)*sqrt(Alp(KI)*Alp(KJ))*aIJ
Betm=Betm+X(KI)*X(KJ)*sqrt(Bet(KI)*Bet(KJ))*bIJ
20 Continue
C.....Computation of Mixture Critical ZC........
AL=Alpm
BE=Betm
ZCOEF(1) = 8.0 +12.0*AL + 6.0* AL*AL + AL*AL*AL
ZCOEF(2) = -(3.0 + 12.0*AL + 12.0*AL*AL + 9.0*BE*(1.0-AL))
ZCOEF(3) = 3.0*AL + 6.*AL*AL + 6.*BE - 6.*AL*BE
ZCOEF(4) = -(BE + AL*AL - AL*BE)
C
CALL CUBIC (MTYPE, ZCOEF, RZC)
C.......Select Real Root........
RMIN = 1.0E+10
RMAX = 1.0E-10
DO 21 IE = 1,3
IF(RZC(IE) .LT. 0.0) GO TO 21
IF(RZC(IE) .LT. RMIN) RMIN = RZC(I)
IF(RZC(IE) .GT. RMAX) RMAX = RZC(I)
21 CONTINUE
ZC = RMAX
VC(ID)=ZC*R*TCE(ID)/PCE(ID)
ZCE(ID)=PCE(ID)*VCE(ID)/(R*TCE(ID))
Dev=(VC(ID)-VCE(ID))/VCE(ID)
APD=APD+abs(Dev)
write(6,250) I,J,Exx,Ex,VCE(ID),VC(ID),Alpm,Betm
250 Format(2(I3),2(F8.3),4(F10.4))
C
128
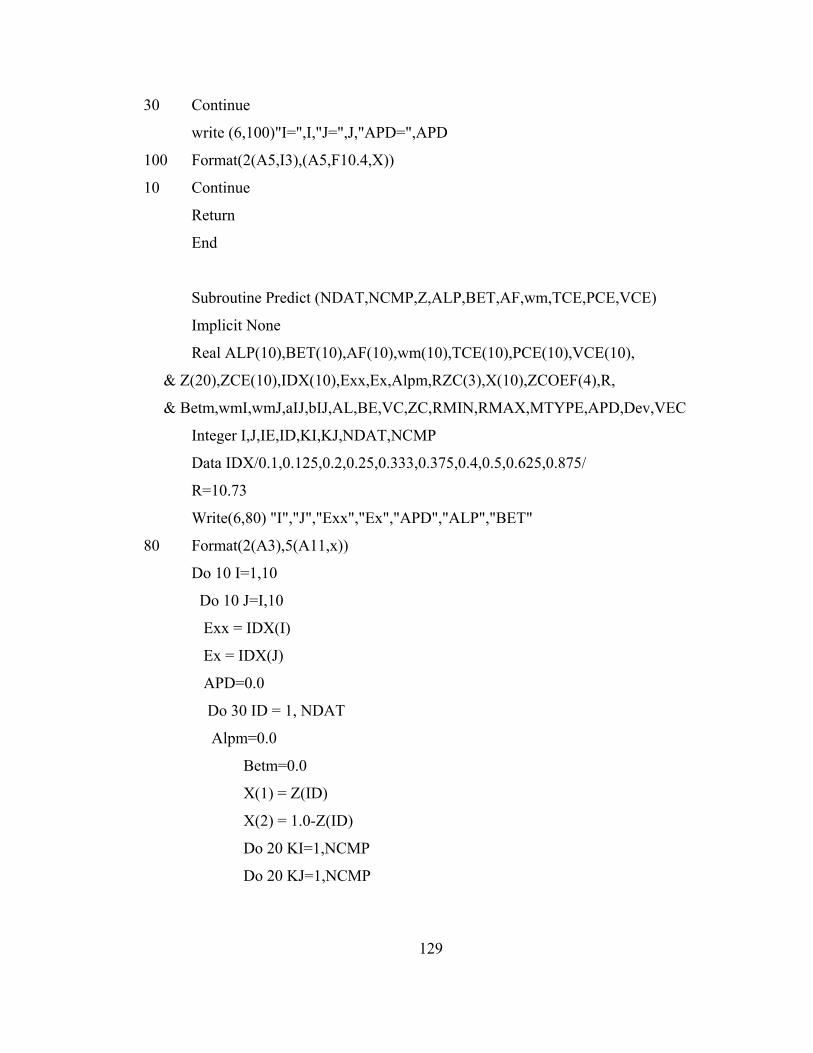
30 Continue
write (6,100)"I=",I,"J=",J,"APD=",APD
100 Format(2(A5,I3),(A5,F10.4,X))
10 Continue
Return
End
Subroutine Predict (NDAT,NCMP,Z,ALP,BET,AF,wm,TCE,PCE,VCE)
Implicit None
Real ALP(10),BET(10),AF(10),wm(10),TCE(10),PCE(10),VCE(10),
& Z(20),ZCE(10),IDX(10),Exx,Ex,Alpm,RZC(3),X(10),ZCOEF(4),R,
& Betm,wmI,wmJ,aIJ,bIJ,AL,BE,VC,ZC,RMIN,RMAX,MTYPE,APD,Dev,VEC
Integer I,J,IE,ID,KI,KJ,NDAT,NCMP
Data IDX/0.1,0.125,0.2,0.25,0.333,0.375,0.4,0.5,0.625,0.875/
R=10.73
Write(6,80) "I","J","Exx","Ex","APD","ALP","BET"
80 Format(2(A3),5(A11,x))
Do 10 I=1,10
Do 10 J=I,10
Exx = IDX(I)
Ex = IDX(J)
APD=0.0
Do 30 ID = 1, NDAT
Alpm=0.0
Betm=0.0
X(1) = Z(ID)
X(2) = 1.0-Z(ID)
Do 20 KI=1,NCMP
Do 20 KJ=1,NCMP
129
wmI=AF(KI)*wm(KI)
wmJ=AF(KJ)*wm(KJ)
if (wmI .LE. wmJ) aIJ=(wmI/wmJ)**Exx
if (wmI .GT. wmJ) aIJ=(wmJ/wmI)**Exx
if (wmI .LE. wmJ) bIJ=(wmI/wmJ)**Ex
if (wmI .GT. wmJ) bIJ=(wmJ/wmI)**Ex
Alpm=Alpm+X(KI)*X(KJ)*sqrt(Alp(KI)*Alp(KJ))*aIJ
Betm=Betm+X(KI)*X(KJ)*sqrt(Bet(KI)*Bet(KJ))*bIJ
20 Continue
C.....Computation of Mixture Critical ZC........
AL=Alpm
BE=Betm
ZCOEF(1) = 8.0 +12.0*AL + 6.0* AL*AL + AL*AL*AL
ZCOEF(2) = -(3.0 + 12.0*AL + 12.0*AL*AL + 9.0*BE*(1.0-AL))
ZCOEF(3) = 3.0*AL + 6.*AL*AL + 6.*BE - 6.*AL*BE
ZCOEF(4) = -(BE + AL*AL - AL*BE)
C
CALL CUBIC (MTYPE, ZCOEF, RZC)
C.......Select Real Root........
RMIN = 1.0E+10
RMAX = 1.0E-10
DO 21 IE = 1,3
IF(RZC(IE) .LT. 0.0) GO TO 21
IF(RZC(IE) .LT. RMIN) RMIN = RZC(I)
IF(RZC(IE) .GT. RMAX) RMAX = RZC(I)
21 CONTINUE
ZC = RMAX
VC=ZC*R*TCE(ID)/PCE(ID)
ZCE(ID)=PCE(ID)*VCE(ID)/(R*TCE(ID))
130
Dev=(VC-VCE(ID))/VCE(ID)
APD=APD+abs(Dev)
C
30 Continue
write (6,100)I,J,Exx,Ex,APD,Alpm,Betm
100 Format(2(I3),5(F11.4,X))
10 Continue
Return
End
Subroutine Para(X,Zc,AF,omgw,Pc,Tc,
& Alp,Bet,acLLS,bcLLS,acVDW,bcVDW,acPR,bcPR,acSRK,bcSRK)
Implicit None
Real X,Zc,AF,Pc,Tc,Alp,Bet,acLLS,bcLLS,
&acVDW,bcVDW,acPR,bcPR,omgw,acSRK,bcSRK,omgb,omga,R
R=10.73
omgw = 0.361/(1.0+0.0274*AF)
Alp = (1.0+omgw*Zc-3.0*Zc)/(omgw*Zc)
Bet = (Zc*Zc*(omgw-1.0)**3.0+(2.0*Zc*omgw
&*omgw)+omgw*(1.0-3.0*Zc))/(omgw*omgw*Zc)
omga = (1.0+(omgw-1.0)*Zc)**3.0
omgb = omgw*Zc
bcLLS = omgb*R*Tc/Pc
acLLS = omga*R**2*Tc**2/Pc
acVDW=0.4218*R**2*Tc**2/Pc
bcVDW=0.125*R*Tc/Pc
acPR=0.4572*R**2*Tc**2/Pc
bcPR=0.0778*R*Tc/Pc
acSRK=0.4275*R**2*Tc**2/Pc
131
bcSRK=0.0866*R*Tc/Pc
Return
End
Subroutine EOSrule(NComp,x,AF,wm,acLLS,bcLLS,acVDW,bcVDW,
&acPR,bcPR,acSRK,bcSRK,SumamLLS,bmLLS,SumamVDW,SumbmVDW,SumamPR
,
&SumbmPR,SumamSRK,SumbmSRK)
Implicit None
Integer I,J,NComp
Real SumamLLS,bmLLS,SumamVDW,SumbmVDW,SumamPR,SumbmPR,
&SumamSRK,SumbmSRK,SumAlpm,SumBetm
Real SumbmLLS,wmI,wmJ,BIN,exx
Real x(20),acLLS(20),bcLLS(20),acVDW(20),bcVDW(20),acPR(20),
&bcPR(20),acSRK(20),bcSRK(20),Alp(20),Bet(20),AF(20),wm(20)
SumamLLS=0.0
SumbmLLS=0.0
SumamVDW=0.0
SumbmVDW=0.0
SumamPR=0.0
SumbmPR=0.0
SumamSRK=0.0
SumbmSRK=0.0
SumAlpm = 0.0
SumBetm = 0.0
Do 16 I = 1,NComp
SumbmVDW = SumbmVDW + x(I)*bcVDW(I)
SumbmLLS = SumbmLLS + x(I)*bcLLS(I)**(1.0/3.0)
132
SumbmPR = SumbmPR + x(I)*bcPR(I)
SumbmSRK = SumbmSRK + x(I)*bcSRK(I)
16 Continue
bmLLS = (SumbmLLS)**3.0
Return
End
Subroutine
EOSPCTC(NComp,X,PC,TC,amVDW,bmVDW,amPR,bmPR,amSRK,
&bmSRK,VCVDW,VCPR,VCSRK,VCKay)
Implicit None
Integer NComp,I
Real amVDW,bmVDW,amPR,bmPR,amSRK,R,SumPC,SumTC,SumVC,X,
&bmSRK,PCVDW,TCVDW,VCVDW,PCPR,TCPR,VCPR,PCSRK,TCSRK,VCSRK,
&PCKay,TCKay,VCKay
Real Dimension X(20),TC(20),PC(20),VC(20)
R=10.73
SumPC=0.0
SumTC=0.0
SumVC=0.0
DO 10 I=1,NComp
SumPC=SumPC+X(I)*PC(I)
SumTC=SumTC+X(I)*TC(I)
SumVC=SumVC+X(I)*VC(I)
10 Continue
C Critical Parameters for Kay's Rule
PCKay=SumPC
TCKay=SumTC
133
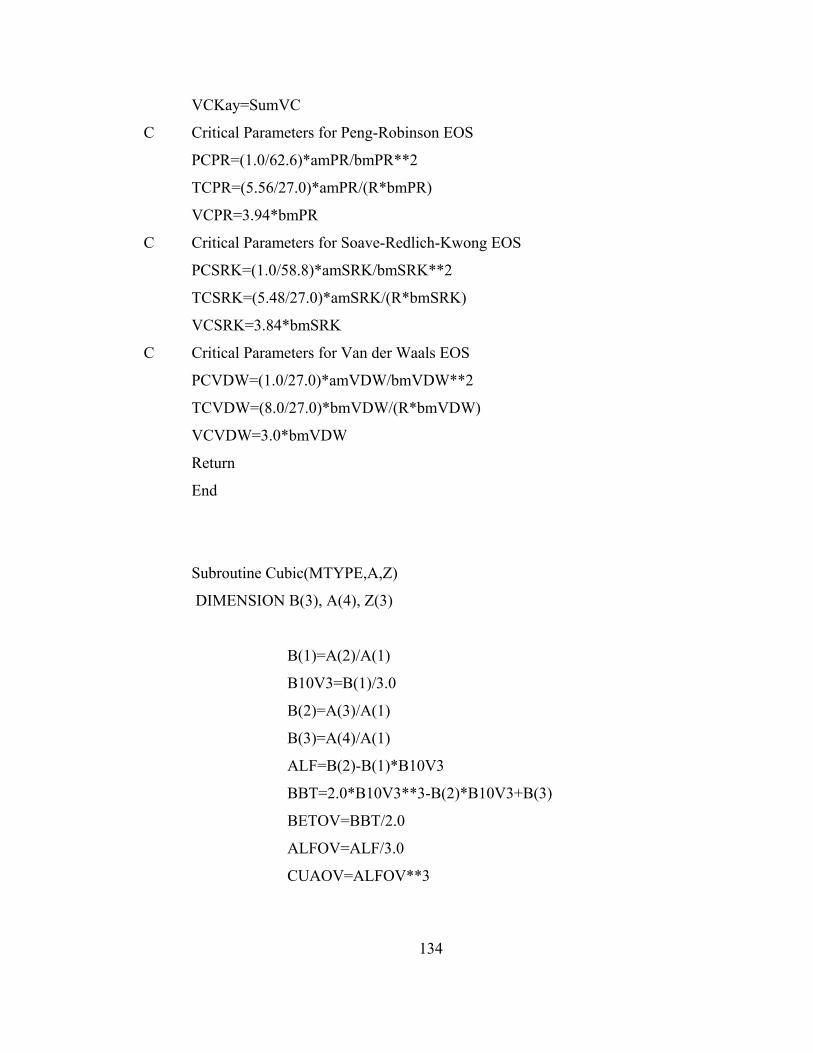
VCKay=SumVC
C Critical Parameters for Peng-Robinson EOS
PCPR=(1.0/62.6)*amPR/bmPR**2
TCPR=(5.56/27.0)*amPR/(R*bmPR)
VCPR=3.94*bmPR
C Critical Parameters for Soave-Redlich-Kwong EOS
PCSRK=(1.0/58.8)*amSRK/bmSRK**2
TCSRK=(5.48/27.0)*amSRK/(R*bmSRK)
VCSRK=3.84*bmSRK
C Critical Parameters for Van der Waals EOS
PCVDW=(1.0/27.0)*amVDW/bmVDW**2
TCVDW=(8.0/27.0)*bmVDW/(R*bmVDW)
VCVDW=3.0*bmVDW
Return
End
Subroutine Cubic(MTYPE,A,Z)
DIMENSION B(3), A(4), Z(3)
B(1)=A(2)/A(1)
B10V3=B(1)/3.0
B(2)=A(3)/A(1)
B(3)=A(4)/A(1)
ALF=B(2)-B(1)*B10V3
BBT=2.0*B10V3**3-B(2)*B10V3+B(3)
BETOV=BBT/2.0
ALFOV=ALF/3.0
CUAOV=ALFOV**3
134
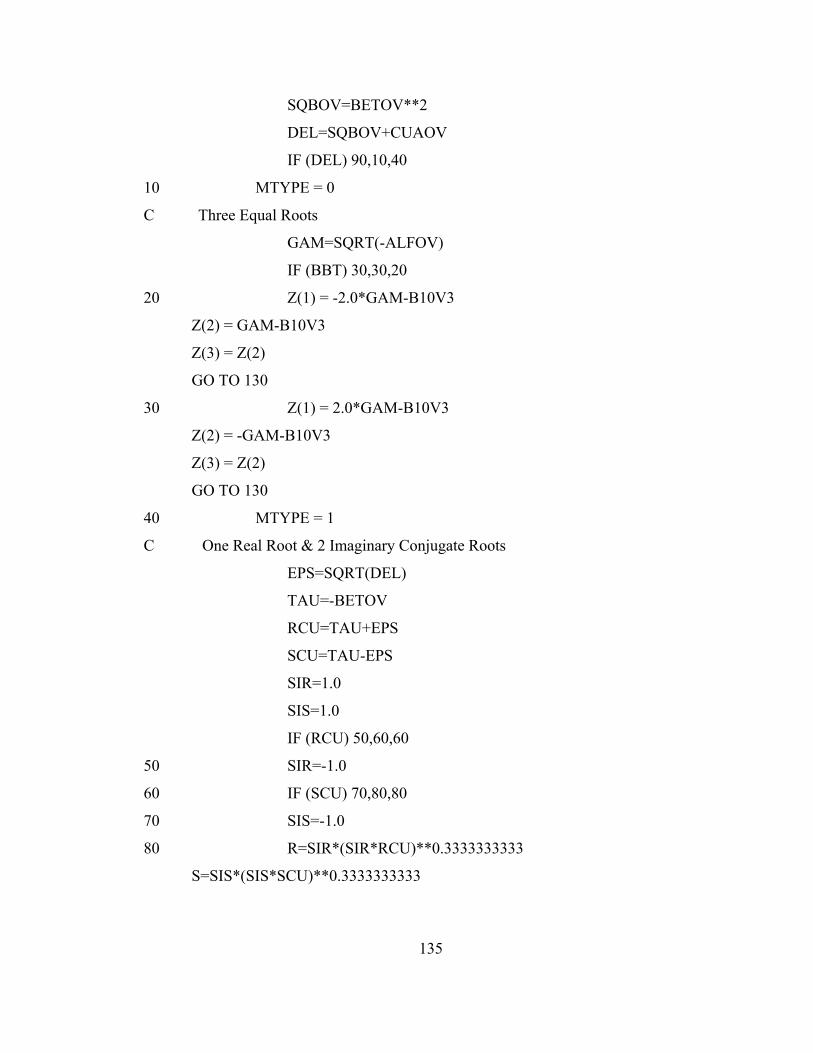
SQBOV=BETOV**2
DEL=SQBOV+CUAOV
IF (DEL) 90,10,40
10 MTYPE = 0
C Three Equal Roots
GAM=SQRT(-ALFOV)
IF (BBT) 30,30,20
20 Z(1) = -2.0*GAM-B10V3
Z(2) = GAM-B10V3
Z(3) = Z(2)
GO TO 130
30 Z(1) = 2.0*GAM-B10V3
Z(2) = -GAM-B10V3
Z(3) = Z(2)
GO TO 130
40 MTYPE = 1
C One Real Root & 2 Imaginary Conjugate Roots
EPS=SQRT(DEL)
TAU=-BETOV
RCU=TAU+EPS
SCU=TAU-EPS
SIR=1.0
SIS=1.0
IF (RCU) 50,60,60
50 SIR=-1.0
60 IF (SCU) 70,80,80
70 SIS=-1.0
80 R=SIR*(SIR*RCU)**0.3333333333
S=SIS*(SIS*SCU)**0.3333333333
135
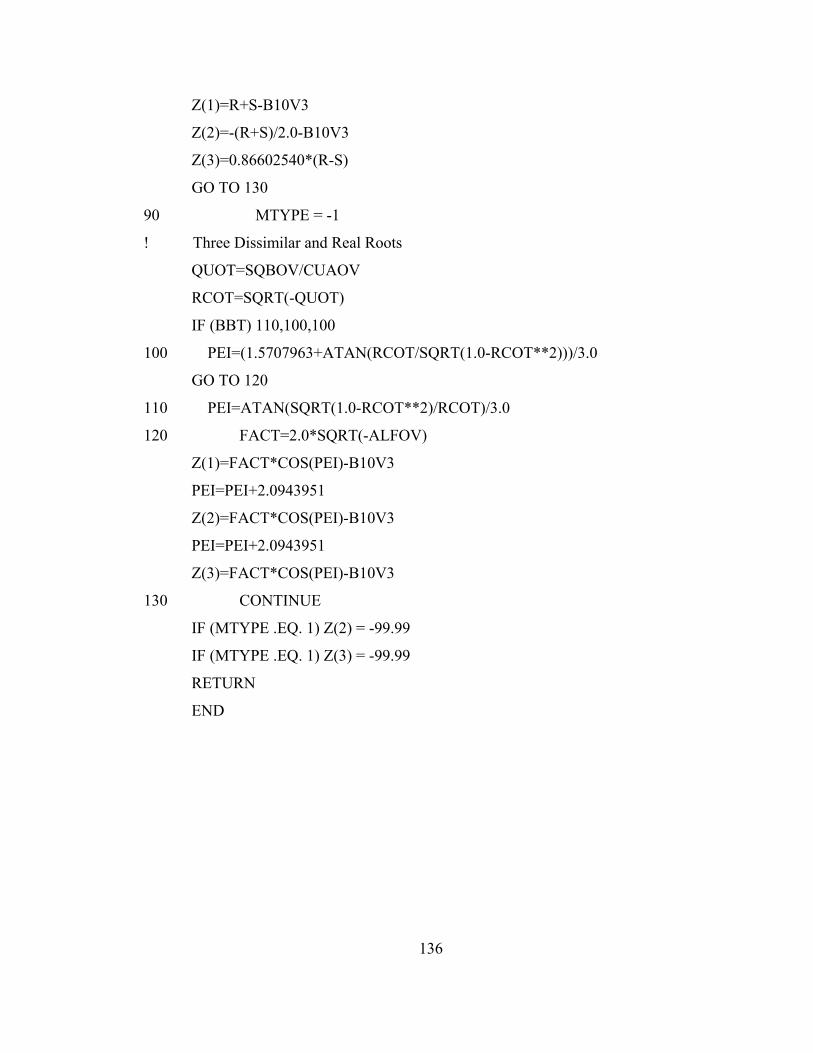
Z(1)=R+S-B10V3
Z(2)=-(R+S)/2.0-B10V3
Z(3)=0.86602540*(R-S)
GO TO 130
90 MTYPE = -1
! Three Dissimilar and Real Roots
QUOT=SQBOV/CUAOV
RCOT=SQRT(-QUOT)
IF (BBT) 110,100,100
100 PEI=(1.5707963+ATAN(RCOT/SQRT(1.0-RCOT**2)))/3.0
GO TO 120
110 PEI=ATAN(SQRT(1.0-RCOT**2)/RCOT)/3.0
120 FACT=2.0*SQRT(-ALFOV)
Z(1)=FACT*COS(PEI)-B10V3
PEI=PEI+2.0943951
Z(2)=FACT*COS(PEI)-B10V3
PEI=PEI+2.0943951
Z(3)=FACT*COS(PEI)-B10V3
130 CONTINUE
IF (MTYPE .EQ. 1) Z(2) = -99.99
IF (MTYPE .EQ. 1) Z(3) = -99.99
RETURN
END
136
APPENDIX C
DENSITY PREDICTION RESULTS FOR PURE SUBSTANCES
C.1 Results for the Lawal-Lake-Silberberg Equation of State.
137

Table C1.1: Densities Prediction for Methane.
Pr Tr Gam ZV ZL Fugr DSL DSV DL DV DEVL DEVG0.02 0.59 1.0749 0.9654 4.30E-03 0.00E+00 1.653 0.007 1.5771 0.007 -4.591 0.130.03 0.61 1.0659 0.9534 6.20E-03 -3.00E-07 1.623 0.0101 1.5613 0.0101 -3.804 0.060.04 0.63 1.0619 0.9457 7.40E-03 0.00E+00 1.602 0.0122 1.5518 0.0122 -3.133 -0.220.05 0.64 1.0574 0.9369 8.90E-03 2.40E-07 1.586 0.0147 1.5417 0.0146 -2.792 -0.010.06 0.66 1.0535 0.9275 1.10E-02 -1.80E-07 1.57 0.0174 1.5313 0.0174 -2.468 0.150.07 0.67 1.0503 0.9175 1.20E-02 2.40E-07 1.551 0.0204 1.5204 0.0205 -1.97 0.20.08 0.68 1.0472 0.9067 1.40E-02 -3.00E-07 1.532 0.0239 1.509 0.024 -1.5 0.41
0.1 0.7 1.0436 0.8947 1.70E-02 2.40E-07 1.513 0.0279 1.4967 0.028 -1.076 0.480.11 0.71 1.0406 0.8821 1.90E-02 2.40E-07 1.495 0.0322 1.4839 0.0324 -0.741 0.610.13 0.73 1.0386 0.8691 2.20E-02 1.20E-07 1.477 0.0369 1.4709 0.0372 -0.413 0.850.15 0.74 1.0339 0.8535 2.50E-02 0.00E+00 1.456 0.0428 1.4554 0.0432 -0.043 1.140.17 0.76 1.0314 0.8382 2.90E-02 6.00E-08 1.436 0.0488 1.4401 0.0495 0.289 1.36
0.2 0.77 1.0288 0.8219 3.30E-02 1.20E-07 1.417 0.0555 1.4238 0.0565 0.481 1.70.22 0.79 1.0261 0.8044 3.70E-02 -2.40E-07 1.394 0.063 1.4063 0.0644 0.879 2.140.25 0.8 1.0237 0.7859 4.10E-02 -1.20E-07 1.373 0.0714 1.3875 0.0732 1.053 2.540.29 0.82 1.021 0.766 4.70E-02 1.80E-07 1.352 0.0808 1.3669 0.0832 1.104 3.020.32 0.83 1.0187 0.7452 5.20E-02 -1.20E-07 1.329 0.0911 1.3451 0.0943 1.215 3.480.36 0.84 1.0169 0.7236 5.80E-02 0.00E+00 1.304 0.1024 1.3219 0.1066 1.373 4.080.44 0.87 1.013 0.676 7.30E-02 0.00E+00 1.252 0.1294 1.2684 0.1365 1.313 5.480.49 0.89 1.0112 0.6498 8.10E-02 -1.80E-07 1.222 0.1455 1.2376 0.1547 1.278 6.290.55 0.9 1.0091 0.6215 9.10E-02 1.20E-07 1.192 0.1644 1.2027 0.1761 0.9 7.13
0.6 0.92 1.0076 0.5916 1.00E-01 -8.90E-08 1.159 0.1854 1.1644 0.2005 0.462 8.140.66 0.93 1.0064 0.5601 1.10E-01 -1.20E-07 1.119 0.2094 1.1217 0.2288 0.241 9.280.72 0.95 1.0053 0.5254 1.30E-01 -3.00E-08 1.077 0.2379 1.0721 0.2631 -0.456 10.580.79 0.96 1.0042 0.4866 1.50E-01 -8.90E-08 1.029 0.2727 1.013 0.3059 -1.552 12.160.86 0.98 1.0031 0.442 1.70E-01 -6.30E-05 0.968 0.3172 0.9391 0.3619 -2.989 14.09
1 1 1 0.286 2.90E-01 0.00E+00 0.629 0.629 0.6338 0.6338 0.755 0.76
138
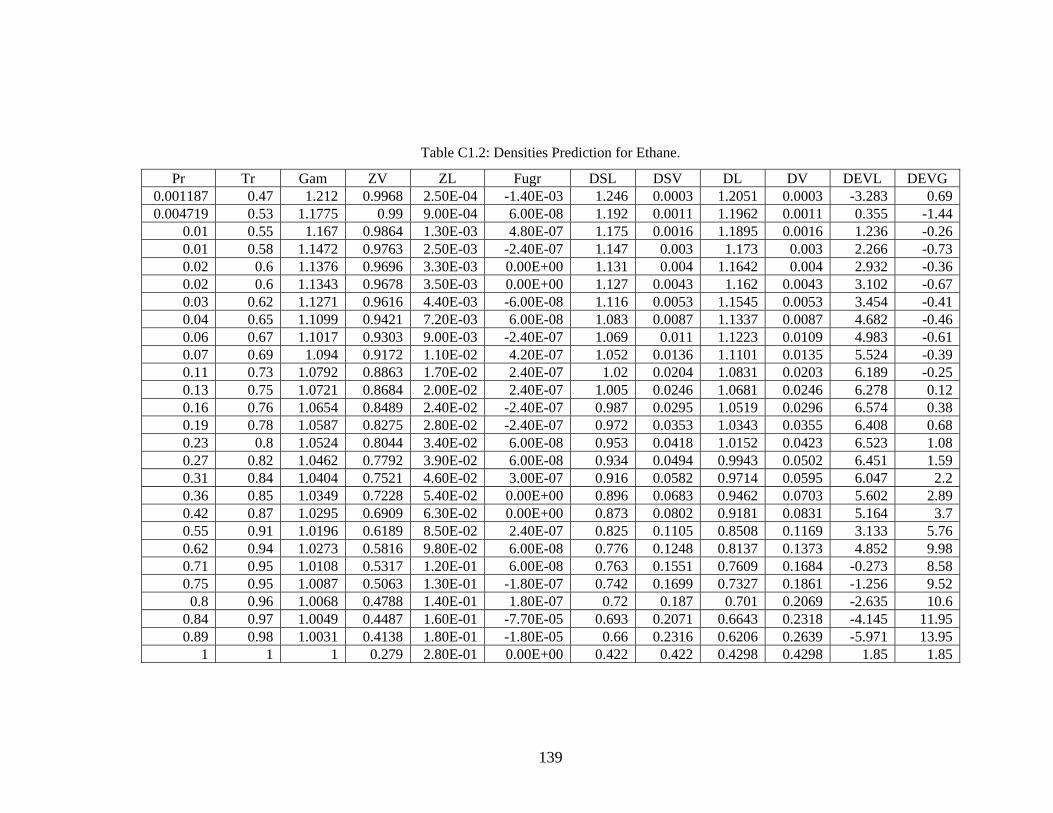
Table C1.2: Densities Prediction for Ethane.
Pr Tr Gam ZV ZL Fugr DSL DSV DL DV DEVL DEVG0.001187 0.47 1.212 0.9968 2.50E-04 -1.40E-03 1.246 0.0003 1.2051 0.0003 -3.283 0.690.004719 0.53 1.1775 0.99 9.00E-04 6.00E-08 1.192 0.0011 1.1962 0.0011 0.355 -1.44
0.01 0.55 1.167 0.9864 1.30E-03 4.80E-07 1.175 0.0016 1.1895 0.0016 1.236 -0.260.01 0.58 1.1472 0.9763 2.50E-03 -2.40E-07 1.147 0.003 1.173 0.003 2.266 -0.730.02 0.6 1.1376 0.9696 3.30E-03 0.00E+00 1.131 0.004 1.1642 0.004 2.932 -0.360.02 0.6 1.1343 0.9678 3.50E-03 0.00E+00 1.127 0.0043 1.162 0.0043 3.102 -0.670.03 0.62 1.1271 0.9616 4.40E-03 -6.00E-08 1.116 0.0053 1.1545 0.0053 3.454 -0.410.04 0.65 1.1099 0.9421 7.20E-03 6.00E-08 1.083 0.0087 1.1337 0.0087 4.682 -0.460.06 0.67 1.1017 0.9303 9.00E-03 -2.40E-07 1.069 0.011 1.1223 0.0109 4.983 -0.610.07 0.69 1.094 0.9172 1.10E-02 4.20E-07 1.052 0.0136 1.1101 0.0135 5.524 -0.390.11 0.73 1.0792 0.8863 1.70E-02 2.40E-07 1.02 0.0204 1.0831 0.0203 6.189 -0.250.13 0.75 1.0721 0.8684 2.00E-02 2.40E-07 1.005 0.0246 1.0681 0.0246 6.278 0.120.16 0.76 1.0654 0.8489 2.40E-02 -2.40E-07 0.987 0.0295 1.0519 0.0296 6.574 0.380.19 0.78 1.0587 0.8275 2.80E-02 -2.40E-07 0.972 0.0353 1.0343 0.0355 6.408 0.680.23 0.8 1.0524 0.8044 3.40E-02 6.00E-08 0.953 0.0418 1.0152 0.0423 6.523 1.080.27 0.82 1.0462 0.7792 3.90E-02 6.00E-08 0.934 0.0494 0.9943 0.0502 6.451 1.590.31 0.84 1.0404 0.7521 4.60E-02 3.00E-07 0.916 0.0582 0.9714 0.0595 6.047 2.20.36 0.85 1.0349 0.7228 5.40E-02 0.00E+00 0.896 0.0683 0.9462 0.0703 5.602 2.890.42 0.87 1.0295 0.6909 6.30E-02 0.00E+00 0.873 0.0802 0.9181 0.0831 5.164 3.70.55 0.91 1.0196 0.6189 8.50E-02 2.40E-07 0.825 0.1105 0.8508 0.1169 3.133 5.760.62 0.94 1.0273 0.5816 9.80E-02 6.00E-08 0.776 0.1248 0.8137 0.1373 4.852 9.980.71 0.95 1.0108 0.5317 1.20E-01 6.00E-08 0.763 0.1551 0.7609 0.1684 -0.273 8.580.75 0.95 1.0087 0.5063 1.30E-01 -1.80E-07 0.742 0.1699 0.7327 0.1861 -1.256 9.52
0.8 0.96 1.0068 0.4788 1.40E-01 1.80E-07 0.72 0.187 0.701 0.2069 -2.635 10.60.84 0.97 1.0049 0.4487 1.60E-01 -7.70E-05 0.693 0.2071 0.6643 0.2318 -4.145 11.950.89 0.98 1.0031 0.4138 1.80E-01 -1.80E-05 0.66 0.2316 0.6206 0.2639 -5.971 13.95
1 1 1 0.279 2.80E-01 0.00E+00 0.422 0.422 0.4298 0.4298 1.85 1.85
139
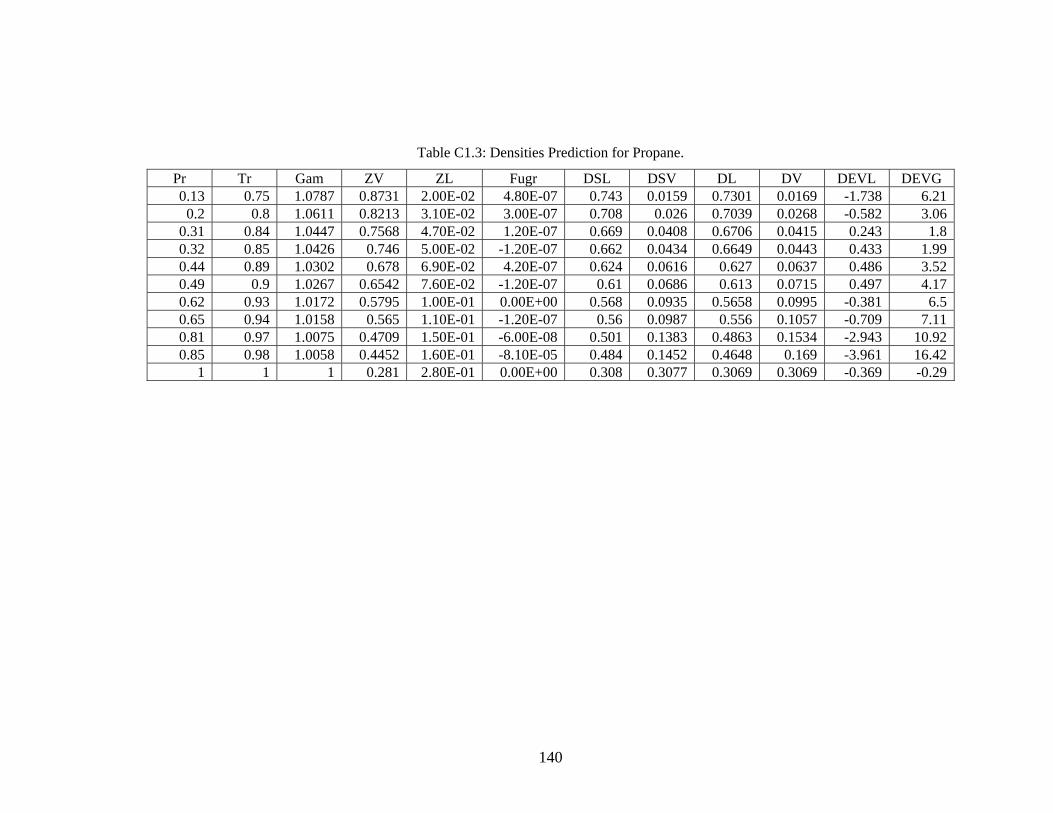
Table C1.3: Densities Prediction for Propane.
Pr Tr Gam ZV ZL Fugr DSL DSV DL DV DEVL DEVG0.13 0.75 1.0787 0.8731 2.00E-02 4.80E-07 0.743 0.0159 0.7301 0.0169 -1.738 6.21
0.2 0.8 1.0611 0.8213 3.10E-02 3.00E-07 0.708 0.026 0.7039 0.0268 -0.582 3.060.31 0.84 1.0447 0.7568 4.70E-02 1.20E-07 0.669 0.0408 0.6706 0.0415 0.243 1.80.32 0.85 1.0426 0.746 5.00E-02 -1.20E-07 0.662 0.0434 0.6649 0.0443 0.433 1.990.44 0.89 1.0302 0.678 6.90E-02 4.20E-07 0.624 0.0616 0.627 0.0637 0.486 3.520.49 0.9 1.0267 0.6542 7.60E-02 -1.20E-07 0.61 0.0686 0.613 0.0715 0.497 4.170.62 0.93 1.0172 0.5795 1.00E-01 0.00E+00 0.568 0.0935 0.5658 0.0995 -0.381 6.50.65 0.94 1.0158 0.565 1.10E-01 -1.20E-07 0.56 0.0987 0.556 0.1057 -0.709 7.110.81 0.97 1.0075 0.4709 1.50E-01 -6.00E-08 0.501 0.1383 0.4863 0.1534 -2.943 10.920.85 0.98 1.0058 0.4452 1.60E-01 -8.10E-05 0.484 0.1452 0.4648 0.169 -3.961 16.42
1 1 1 0.281 2.80E-01 0.00E+00 0.308 0.3077 0.3069 0.3069 -0.369 -0.29
140
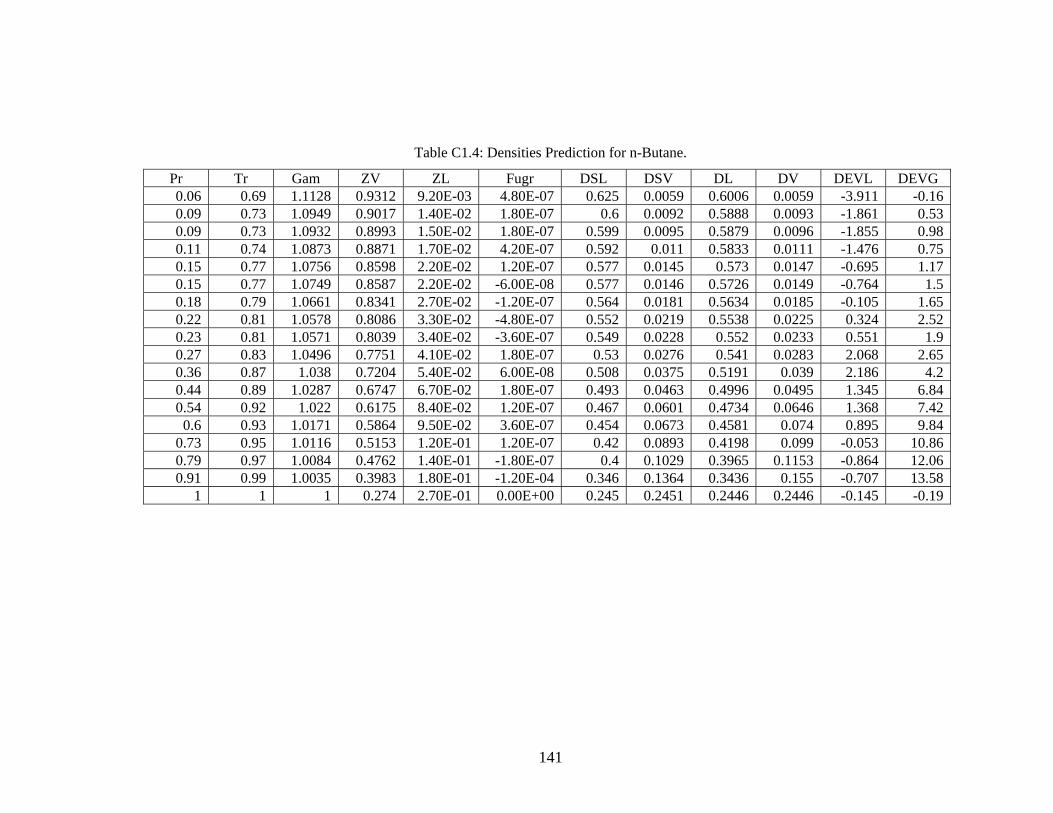
Table C1.4: Densities Prediction for n-Butane.
Pr Tr Gam ZV ZL Fugr DSL DSV DL DV DEVL DEVG0.06 0.69 1.1128 0.9312 9.20E-03 4.80E-07 0.625 0.0059 0.6006 0.0059 -3.911 -0.160.09 0.73 1.0949 0.9017 1.40E-02 1.80E-07 0.6 0.0092 0.5888 0.0093 -1.861 0.530.09 0.73 1.0932 0.8993 1.50E-02 1.80E-07 0.599 0.0095 0.5879 0.0096 -1.855 0.980.11 0.74 1.0873 0.8871 1.70E-02 4.20E-07 0.592 0.011 0.5833 0.0111 -1.476 0.750.15 0.77 1.0756 0.8598 2.20E-02 1.20E-07 0.577 0.0145 0.573 0.0147 -0.695 1.170.15 0.77 1.0749 0.8587 2.20E-02 -6.00E-08 0.577 0.0146 0.5726 0.0149 -0.764 1.50.18 0.79 1.0661 0.8341 2.70E-02 -1.20E-07 0.564 0.0181 0.5634 0.0185 -0.105 1.650.22 0.81 1.0578 0.8086 3.30E-02 -4.80E-07 0.552 0.0219 0.5538 0.0225 0.324 2.520.23 0.81 1.0571 0.8039 3.40E-02 -3.60E-07 0.549 0.0228 0.552 0.0233 0.551 1.90.27 0.83 1.0496 0.7751 4.10E-02 1.80E-07 0.53 0.0276 0.541 0.0283 2.068 2.650.36 0.87 1.038 0.7204 5.40E-02 6.00E-08 0.508 0.0375 0.5191 0.039 2.186 4.20.44 0.89 1.0287 0.6747 6.70E-02 1.80E-07 0.493 0.0463 0.4996 0.0495 1.345 6.840.54 0.92 1.022 0.6175 8.40E-02 1.20E-07 0.467 0.0601 0.4734 0.0646 1.368 7.42
0.6 0.93 1.0171 0.5864 9.50E-02 3.60E-07 0.454 0.0673 0.4581 0.074 0.895 9.840.73 0.95 1.0116 0.5153 1.20E-01 1.20E-07 0.42 0.0893 0.4198 0.099 -0.053 10.860.79 0.97 1.0084 0.4762 1.40E-01 -1.80E-07 0.4 0.1029 0.3965 0.1153 -0.864 12.060.91 0.99 1.0035 0.3983 1.80E-01 -1.20E-04 0.346 0.1364 0.3436 0.155 -0.707 13.58
1 1 1 0.274 2.70E-01 0.00E+00 0.245 0.2451 0.2446 0.2446 -0.145 -0.19
141
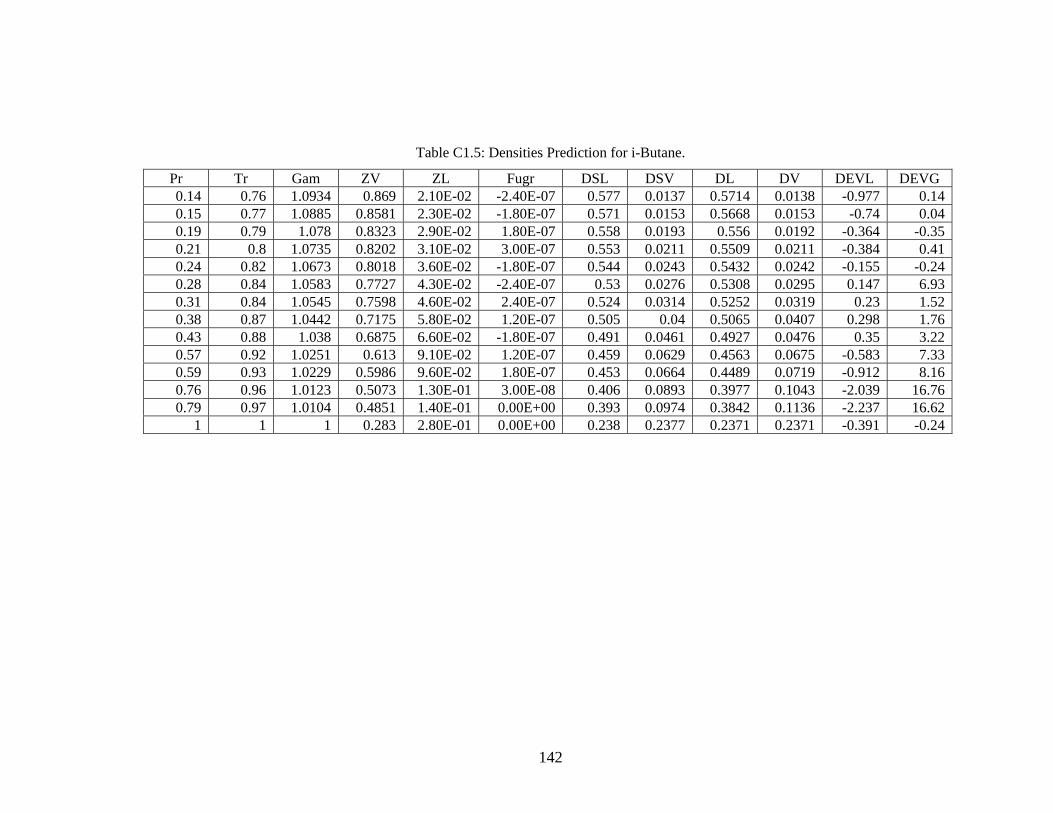
Table C1.5: Densities Prediction for i-Butane.
Pr Tr Gam ZV ZL Fugr DSL DSV DL DV DEVL DEVG0.14 0.76 1.0934 0.869 2.10E-02 -2.40E-07 0.577 0.0137 0.5714 0.0138 -0.977 0.140.15 0.77 1.0885 0.8581 2.30E-02 -1.80E-07 0.571 0.0153 0.5668 0.0153 -0.74 0.040.19 0.79 1.078 0.8323 2.90E-02 1.80E-07 0.558 0.0193 0.556 0.0192 -0.364 -0.350.21 0.8 1.0735 0.8202 3.10E-02 3.00E-07 0.553 0.0211 0.5509 0.0211 -0.384 0.410.24 0.82 1.0673 0.8018 3.60E-02 -1.80E-07 0.544 0.0243 0.5432 0.0242 -0.155 -0.240.28 0.84 1.0583 0.7727 4.30E-02 -2.40E-07 0.53 0.0276 0.5308 0.0295 0.147 6.930.31 0.84 1.0545 0.7598 4.60E-02 2.40E-07 0.524 0.0314 0.5252 0.0319 0.23 1.520.38 0.87 1.0442 0.7175 5.80E-02 1.20E-07 0.505 0.04 0.5065 0.0407 0.298 1.760.43 0.88 1.038 0.6875 6.60E-02 -1.80E-07 0.491 0.0461 0.4927 0.0476 0.35 3.220.57 0.92 1.0251 0.613 9.10E-02 1.20E-07 0.459 0.0629 0.4563 0.0675 -0.583 7.330.59 0.93 1.0229 0.5986 9.60E-02 1.80E-07 0.453 0.0664 0.4489 0.0719 -0.912 8.160.76 0.96 1.0123 0.5073 1.30E-01 3.00E-08 0.406 0.0893 0.3977 0.1043 -2.039 16.760.79 0.97 1.0104 0.4851 1.40E-01 0.00E+00 0.393 0.0974 0.3842 0.1136 -2.237 16.62
1 1 1 0.283 2.80E-01 0.00E+00 0.238 0.2377 0.2371 0.2371 -0.391 -0.24
142
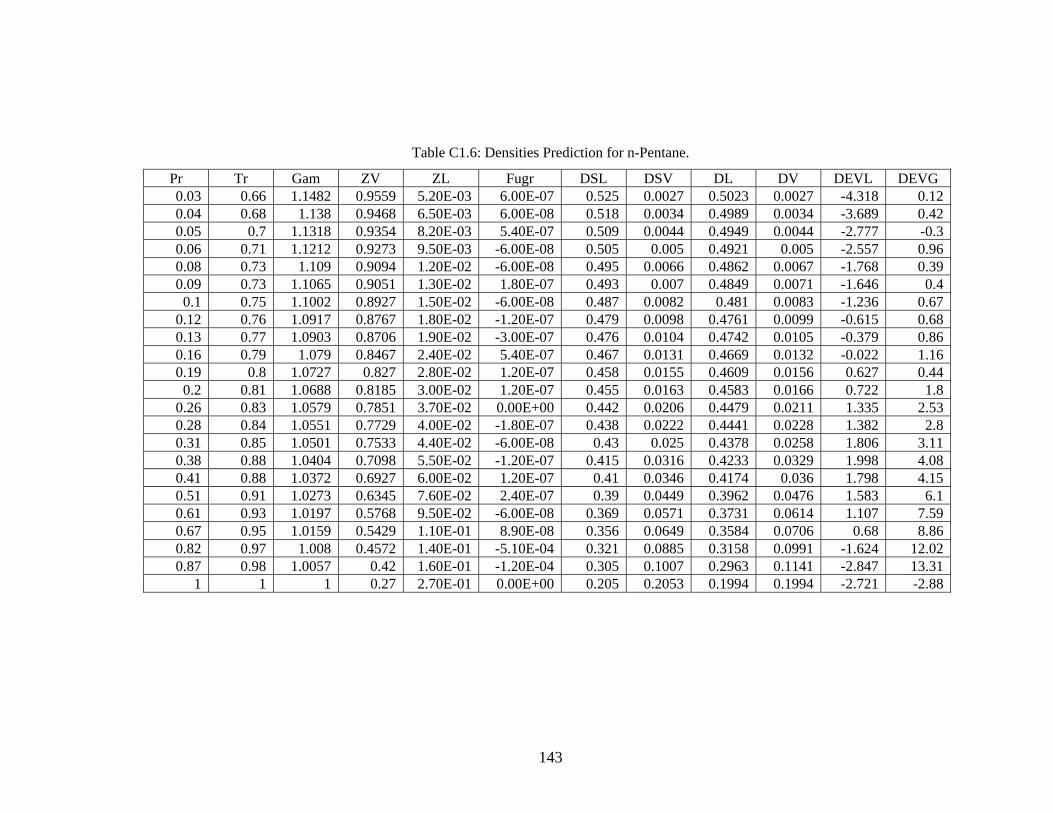
Table C1.6: Densities Prediction for n-Pentane.
Pr Tr Gam ZV ZL Fugr DSL DSV DL DV DEVL DEVG0.03 0.66 1.1482 0.9559 5.20E-03 6.00E-07 0.525 0.0027 0.5023 0.0027 -4.318 0.120.04 0.68 1.138 0.9468 6.50E-03 6.00E-08 0.518 0.0034 0.4989 0.0034 -3.689 0.420.05 0.7 1.1318 0.9354 8.20E-03 5.40E-07 0.509 0.0044 0.4949 0.0044 -2.777 -0.30.06 0.71 1.1212 0.9273 9.50E-03 -6.00E-08 0.505 0.005 0.4921 0.005 -2.557 0.960.08 0.73 1.109 0.9094 1.20E-02 -6.00E-08 0.495 0.0066 0.4862 0.0067 -1.768 0.390.09 0.73 1.1065 0.9051 1.30E-02 1.80E-07 0.493 0.007 0.4849 0.0071 -1.646 0.4
0.1 0.75 1.1002 0.8927 1.50E-02 -6.00E-08 0.487 0.0082 0.481 0.0083 -1.236 0.670.12 0.76 1.0917 0.8767 1.80E-02 -1.20E-07 0.479 0.0098 0.4761 0.0099 -0.615 0.680.13 0.77 1.0903 0.8706 1.90E-02 -3.00E-07 0.476 0.0104 0.4742 0.0105 -0.379 0.860.16 0.79 1.079 0.8467 2.40E-02 5.40E-07 0.467 0.0131 0.4669 0.0132 -0.022 1.160.19 0.8 1.0727 0.827 2.80E-02 1.20E-07 0.458 0.0155 0.4609 0.0156 0.627 0.44
0.2 0.81 1.0688 0.8185 3.00E-02 1.20E-07 0.455 0.0163 0.4583 0.0166 0.722 1.80.26 0.83 1.0579 0.7851 3.70E-02 0.00E+00 0.442 0.0206 0.4479 0.0211 1.335 2.530.28 0.84 1.0551 0.7729 4.00E-02 -1.80E-07 0.438 0.0222 0.4441 0.0228 1.382 2.80.31 0.85 1.0501 0.7533 4.40E-02 -6.00E-08 0.43 0.025 0.4378 0.0258 1.806 3.110.38 0.88 1.0404 0.7098 5.50E-02 -1.20E-07 0.415 0.0316 0.4233 0.0329 1.998 4.080.41 0.88 1.0372 0.6927 6.00E-02 1.20E-07 0.41 0.0346 0.4174 0.036 1.798 4.150.51 0.91 1.0273 0.6345 7.60E-02 2.40E-07 0.39 0.0449 0.3962 0.0476 1.583 6.10.61 0.93 1.0197 0.5768 9.50E-02 -6.00E-08 0.369 0.0571 0.3731 0.0614 1.107 7.590.67 0.95 1.0159 0.5429 1.10E-01 8.90E-08 0.356 0.0649 0.3584 0.0706 0.68 8.860.82 0.97 1.008 0.4572 1.40E-01 -5.10E-04 0.321 0.0885 0.3158 0.0991 -1.624 12.020.87 0.98 1.0057 0.42 1.60E-01 -1.20E-04 0.305 0.1007 0.2963 0.1141 -2.847 13.31
1 1 1 0.27 2.70E-01 0.00E+00 0.205 0.2053 0.1994 0.1994 -2.721 -2.88
143

Table C1.7: Densities Prediction for i-Pentane.
Pr Tr Gam ZV ZL Fugr DSL DSV DL DV DEVL DEVG0.000408 0.48 1.3039 0.9982 1.20E-04 2.80E-02 0.6 0.0001 0.5923 0.0001 -1.276 0.03 0.000612 0.49 1.2902 0.9976 1.70E-04 6.10E-03 0.595 0.0001 0.583 0.0001 -2.011 -2.020.000877 0.51 1.2791 0.9968 2.40E-04 -1.60E-04 0.59 0.0001 0.5727 0.0001 -2.926 -1.410.001264 0.52 1.2672 0.9957 3.30E-04 3.60E-04 0.585 0.0002 0.5762 0.0002 -1.497 -0.330.003324 0.55 1.2359 0.9909 7.70E-04 2.90E-05 0.57 0.0004 0.5723 0.0004 0.403 1.31
0.01 0.57 1.2262 0.9886 1.00E-03 4.80E-07 0.566 0.0006 0.57 0.0006 0.708 -0.750.01 0.58 1.2166 0.9859 1.30E-03 4.20E-07 0.559 0.0007 0.5674 0.0007 1.495 0.630.01 0.59 1.2074 0.9828 1.60E-03 3.00E-07 0.554 0.0009 0.565 0.0009 1.988 -0.530.01 0.6 1.1986 0.9792 2.00E-03 3.60E-07 0.55 0.0012 0.5623 0.0012 2.243 0.140.02 0.62 1.1898 0.9751 2.50E-03 4.80E-07 0.546 0.0014 0.5598 0.0014 2.52 -0.530.02 0.63 1.1812 0.9705 3.00E-03 4.80E-07 0.541 0.0018 0.5569 0.0017 2.935 -0.590.02 0.64 1.173 0.9653 3.70E-03 3.00E-07 0.537 0.0021 0.554 0.0021 3.158 -0.120.03 0.65 1.1648 0.9595 4.40E-03 6.00E-08 0.531 0.0026 0.5509 0.0025 3.739 -0.550.03 0.66 1.1569 0.9531 5.30E-03 1.20E-07 0.527 0.003 0.5476 0.003 3.913 -0.350.04 0.68 1.1491 0.946 6.30E-03 -1.80E-07 0.521 0.0036 0.5442 0.0036 4.459 -0.120.06 0.7 1.134 0.9298 8.60E-03 -1.80E-07 0.511 0.005 0.5369 0.005 5.071 -0.050.08 0.72 1.1199 0.9106 1.20E-02 0.00E+00 0.502 0.0067 0.5289 0.0067 5.354 0.260.11 0.75 1.1064 0.8883 1.50E-02 -3.00E-07 0.491 0.0089 0.52 0.009 5.899 0.660.14 0.77 1.0934 0.8625 2.00E-02 -1.80E-07 0.481 0.0117 0.51 0.0118 6.024 1.030.18 0.8 1.0811 0.8331 2.60E-02 4.20E-07 0.47 0.015 0.4988 0.0153 6.125 1.780.23 0.82 1.0693 0.7997 3.20E-02 -1.20E-07 0.457 0.0192 0.4861 0.0197 6.36 2.540.29 0.84 1.0582 0.7622 4.10E-02 2.40E-07 0.444 0.0243 0.4716 0.0252 6.207 3.610.36 0.87 1.0478 0.7201 5.10E-02 -2.40E-07 0.43 0.0306 0.4548 0.0321 5.767 4.880.54 0.92 1.0285 0.6186 7.90E-02 0.00E+00 0.396 0.0487 0.4113 0.0528 3.853 8.450.66 0.94 1.0189 0.555 1.00E-01 6.00E-08 0.375 0.0625 0.381 0.0692 1.6 10.720.78 0.96 1.011 0.4812 1.30E-01 0.00E+00 0.345 0.0816 0.3422 0.0928 -0.81 13.73
1 1 1 0.27 2.70E-01 0.00E+00 0.204 0.204 0.2042 0.2042 0.081 0.08
144
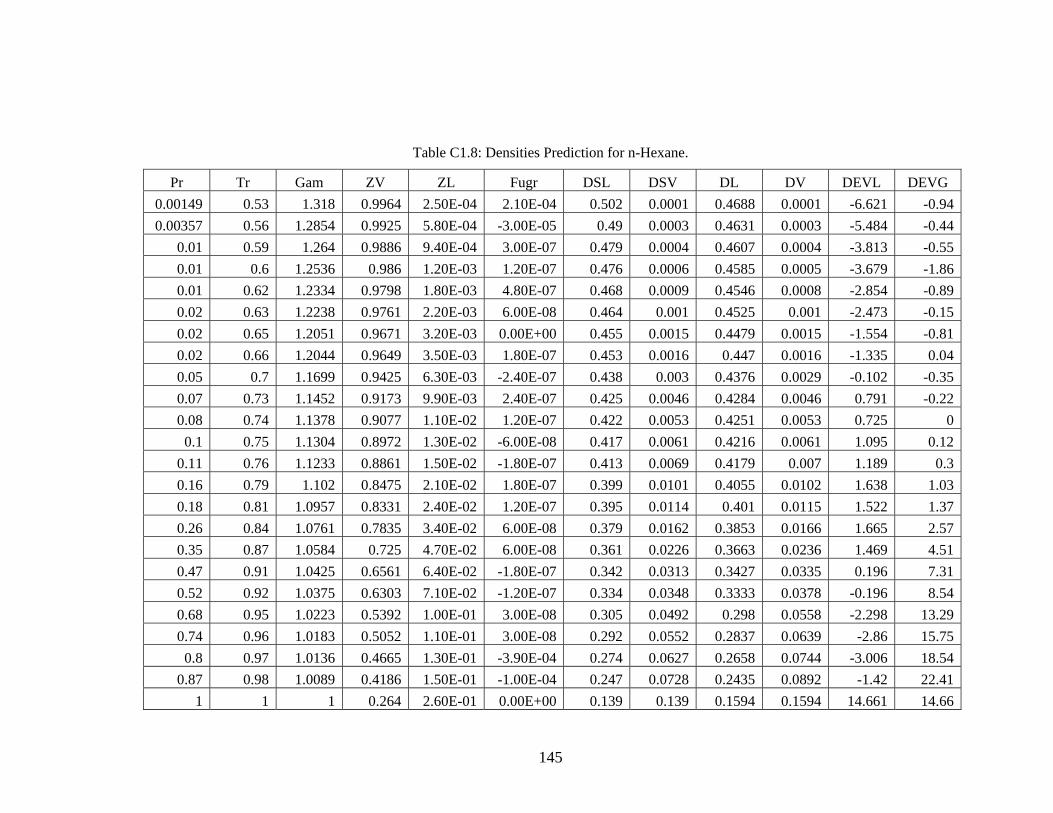
Table C1.8: Densities Prediction for n-Hexane.
Pr Tr Gam ZV ZL Fugr DSL DSV DL DV DEVL DEVG0.00149 0.53 1.318 0.9964 2.50E-04 2.10E-04 0.502 0.0001 0.4688 0.0001 -6.621 -0.940.00357 0.56 1.2854 0.9925 5.80E-04 -3.00E-05 0.49 0.0003 0.4631 0.0003 -5.484 -0.44
0.01 0.59 1.264 0.9886 9.40E-04 3.00E-07 0.479 0.0004 0.4607 0.0004 -3.813 -0.550.01 0.6 1.2536 0.986 1.20E-03 1.20E-07 0.476 0.0006 0.4585 0.0005 -3.679 -1.860.01 0.62 1.2334 0.9798 1.80E-03 4.80E-07 0.468 0.0009 0.4546 0.0008 -2.854 -0.890.02 0.63 1.2238 0.9761 2.20E-03 6.00E-08 0.464 0.001 0.4525 0.001 -2.473 -0.150.02 0.65 1.2051 0.9671 3.20E-03 0.00E+00 0.455 0.0015 0.4479 0.0015 -1.554 -0.810.02 0.66 1.2044 0.9649 3.50E-03 1.80E-07 0.453 0.0016 0.447 0.0016 -1.335 0.040.05 0.7 1.1699 0.9425 6.30E-03 -2.40E-07 0.438 0.003 0.4376 0.0029 -0.102 -0.350.07 0.73 1.1452 0.9173 9.90E-03 2.40E-07 0.425 0.0046 0.4284 0.0046 0.791 -0.220.08 0.74 1.1378 0.9077 1.10E-02 1.20E-07 0.422 0.0053 0.4251 0.0053 0.725 0
0.1 0.75 1.1304 0.8972 1.30E-02 -6.00E-08 0.417 0.0061 0.4216 0.0061 1.095 0.120.11 0.76 1.1233 0.8861 1.50E-02 -1.80E-07 0.413 0.0069 0.4179 0.007 1.189 0.30.16 0.79 1.102 0.8475 2.10E-02 1.80E-07 0.399 0.0101 0.4055 0.0102 1.638 1.030.18 0.81 1.0957 0.8331 2.40E-02 1.20E-07 0.395 0.0114 0.401 0.0115 1.522 1.370.26 0.84 1.0761 0.7835 3.40E-02 6.00E-08 0.379 0.0162 0.3853 0.0166 1.665 2.570.35 0.87 1.0584 0.725 4.70E-02 6.00E-08 0.361 0.0226 0.3663 0.0236 1.469 4.510.47 0.91 1.0425 0.6561 6.40E-02 -1.80E-07 0.342 0.0313 0.3427 0.0335 0.196 7.310.52 0.92 1.0375 0.6303 7.10E-02 -1.20E-07 0.334 0.0348 0.3333 0.0378 -0.196 8.540.68 0.95 1.0223 0.5392 1.00E-01 3.00E-08 0.305 0.0492 0.298 0.0558 -2.298 13.290.74 0.96 1.0183 0.5052 1.10E-01 3.00E-08 0.292 0.0552 0.2837 0.0639 -2.86 15.75
0.8 0.97 1.0136 0.4665 1.30E-01 -3.90E-04 0.274 0.0627 0.2658 0.0744 -3.006 18.540.87 0.98 1.0089 0.4186 1.50E-01 -1.00E-04 0.247 0.0728 0.2435 0.0892 -1.42 22.41
1 1 1 0.264 2.60E-01 0.00E+00 0.139 0.139 0.1594 0.1594 14.661 14.66
145
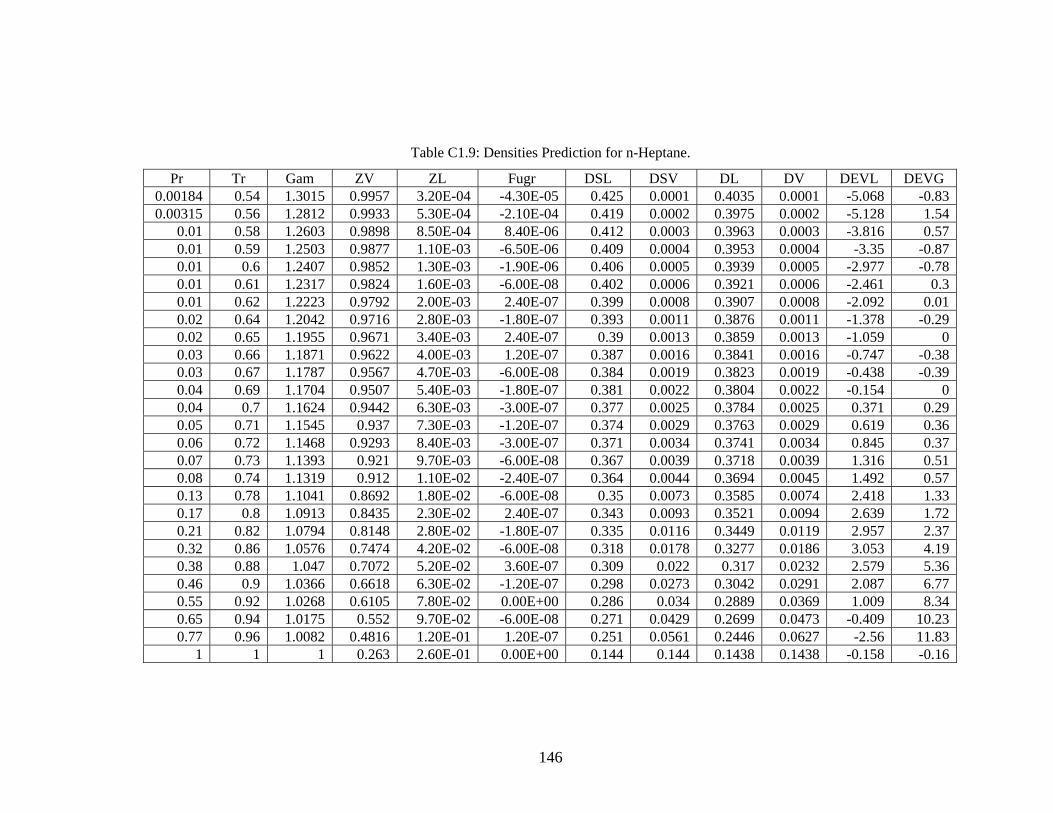
Table C1.9: Densities Prediction for n-Heptane.
Pr Tr Gam ZV ZL Fugr DSL DSV DL DV DEVL DEVG0.00184 0.54 1.3015 0.9957 3.20E-04 -4.30E-05 0.425 0.0001 0.4035 0.0001 -5.068 -0.830.00315 0.56 1.2812 0.9933 5.30E-04 -2.10E-04 0.419 0.0002 0.3975 0.0002 -5.128 1.54
0.01 0.58 1.2603 0.9898 8.50E-04 8.40E-06 0.412 0.0003 0.3963 0.0003 -3.816 0.570.01 0.59 1.2503 0.9877 1.10E-03 -6.50E-06 0.409 0.0004 0.3953 0.0004 -3.35 -0.870.01 0.6 1.2407 0.9852 1.30E-03 -1.90E-06 0.406 0.0005 0.3939 0.0005 -2.977 -0.780.01 0.61 1.2317 0.9824 1.60E-03 -6.00E-08 0.402 0.0006 0.3921 0.0006 -2.461 0.30.01 0.00080.62 1.2223 0.9792 2.00E-03 2.40E-07 0.399 0.0008 0.3907 -2.092 0.010.02 0.64 1.2042 0.9716 2.80E-03 -1.80E-07 0.393 0.0011 0.3876 0.0011 -1.378 -0.290.02 0.65 1.1955 0.9671 3.40E-03 2.40E-07 0.39 0.0013 0.3859 0.0013 -1.059 00.03 0.66 1.1871 0.9622 4.00E-03 1.20E-07 0.387 0.0016 0.3841 0.0016 -0.747 -0.380.03 0.67 1.1787 0.9567 4.70E-03 -6.00E-08 0.384 0.0019 0.3823 0.0019 -0.438 -0.390.04 0.69 1.1704 0.9507 5.40E-03 -1.80E-07 0.381 0.0022 0.3804 0.0022 -0.154 00.04 0.7 1.1624 0.9442 6.30E-03 -3.00E-07 0.377 0.0025 0.3784 0.0025 0.371 0.290.05 0.71 1.1545 0.937 7.30E-03 -1.20E-07 0.374 0.0029 0.3763 0.0029 0.619 0.360.06 0.72 1.1468 0.9293 8.40E-03 -3.00E-07 0.371 0.0034 0.3741 0.0034 0.845 0.370.07 0.73 1.1393 0.921 9.70E-03 -6.00E-08 0.367 0.0039 0.3718 0.0039 1.316 0.510.08 0.74 1.1319 0.912 1.10E-02 -2.40E-07 0.364 0.0044 0.3694 0.0045 1.492 0.570.13 0.78 1.1041 0.8692 1.80E-02 -6.00E-08 0.35 0.0073 0.3585 0.0074 2.418 1.330.17 0.8 1.0913 0.8435 2.30E-02 2.40E-07 0.343 0.0093 0.3521 0.0094 2.639 1.720.21 0.82 1.0794 0.8148 2.80E-02 -1.80E-07 0.335 0.0116 0.3449 0.0119 2.957 2.370.32 0.86 1.0576 0.7474 4.20E-02 -6.00E-08 0.318 0.0178 0.3277 0.0186 3.053 4.190.38 0.88 1.047 0.7072 5.20E-02 3.60E-07 0.309 0.022 0.317 0.0232 2.579 5.360.46 0.9 1.0366 0.6618 6.30E-02 -1.20E-07 0.298 0.0273 0.3042 0.0291 2.087 6.770.55 0.92 1.0268 0.6105 7.80E-02 0.00E+00 0.286 0.034 0.2889 0.0369 1.009 8.340.65 0.94 1.0175 0.552 9.70E-02 -6.00E-08 0.271 0.0429 0.2699 0.0473 -0.409 10.230.77 0.96 1.0082 0.4816 1.20E-01 1.20E-07 0.251 0.0561 0.2446 0.0627 -2.56 11.83
1 1 1 0.263 2.60E-01 0.00E+00 0.144 0.144 0.1438 0.1438 -0.158 -0.16
146
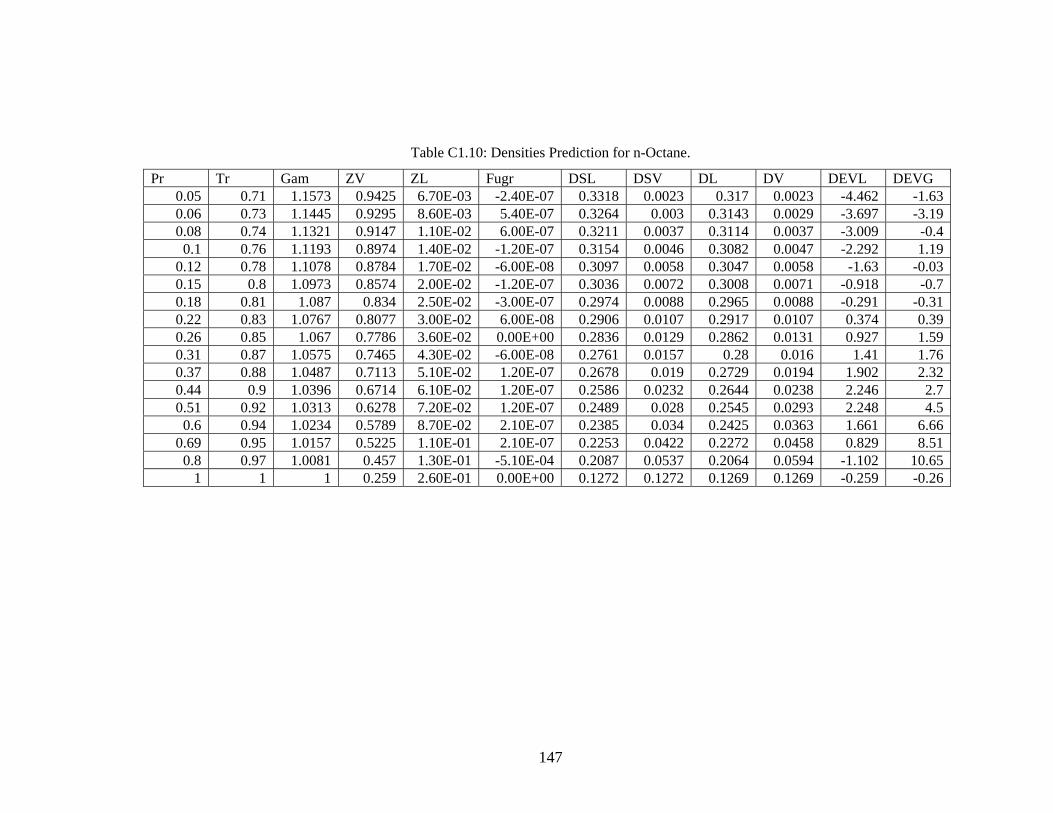
Table C1.10: Densities Prediction for n-Octane.
Pr Tr Gam ZV ZL Fugr DSL DSV DL DV DEVL DEVG0.05 0.71 1.1573 0.9425 6.70E-03 -2.40E-07 0.3318 0.0023 0.317 0.0023 -4.462 -1.630.06 0.73 1.1445 0.9295 8.60E-03 5.40E-07 0.3264 0.003 0.3143 0.0029 -3.697 -3.190.08 0.74 1.1321 0.9147 1.10E-02 6.00E-07 0.3211 0.0037 0.3114 0.0037 -3.009 -0.4
0.1 0.76 1.1193 0.8974 1.40E-02 -1.20E-07 0.3154 0.0046 0.3082 0.0047 -2.292 1.190.12 0.78 1.1078 0.8784 1.70E-02 -6.00E-08 0.3097 0.0058 0.3047 0.0058 -1.63 -0.030.15 0.8 1.0973 0.8574 2.00E-02 -1.20E-07 0.3036 0.0072 0.3008 0.0071 -0.918 -0.70.18 0.81 1.087 0.834 2.50E-02 -3.00E-07 0.2974 0.0088 0.2965 0.0088 -0.291 -0.310.22 0.83 1.0767 0.8077 3.00E-02 6.00E-08 0.2906 0.0107 0.2917 0.0107 0.374 0.390.26 0.85 1.067 0.7786 3.60E-02 0.00E+00 0.2836 0.0129 0.2862 0.0131 0.927 1.590.31 0.87 1.0575 0.7465 4.30E-02 -6.00E-08 0.2761 0.0157 0.28 0.016 1.41 1.760.37 0.88 1.0487 0.7113 5.10E-02 1.20E-07 0.2678 0.019 0.2729 0.0194 1.902 2.320.44 0.9 1.0396 0.6714 6.10E-02 1.20E-07 0.2586 0.0232 0.2644 0.0238 2.246 2.70.51 0.92 1.0313 0.6278 7.20E-02 1.20E-07 0.2489 0.028 0.2545 0.0293 2.248 4.5
0.6 0.94 1.0234 0.5789 8.70E-02 2.10E-07 0.2385 0.034 0.2425 0.0363 1.661 6.660.69 0.95 1.0157 0.5225 1.10E-01 2.10E-07 0.2253 0.0422 0.2272 0.0458 0.829 8.51
0.8 0.97 1.0081 0.457 1.30E-01 -5.10E-04 0.2087 0.0537 0.2064 0.0594 -1.102 10.651 1 1 0.259 2.60E-01 0.00E+00 0.1272 0.1272 0.1269 0.1269 -0.259 -0.26
147
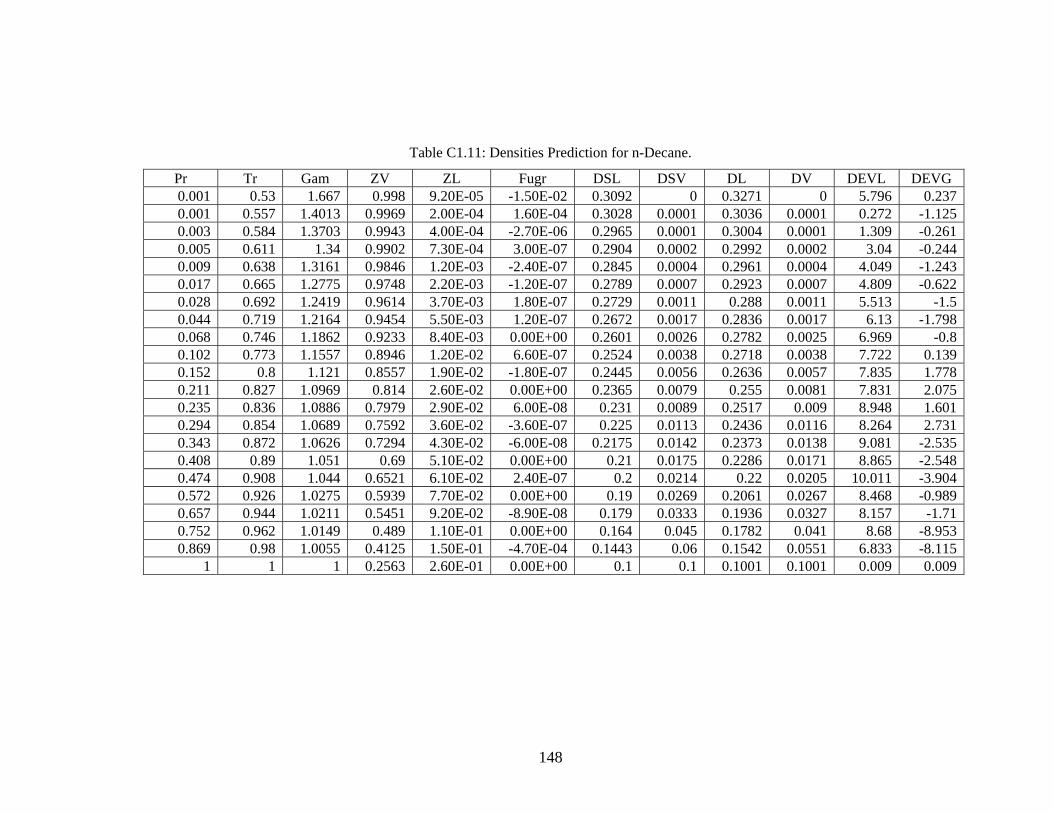
Table C1.11: Densities Prediction for n-Decane.
Pr Tr Gam ZV ZL Fugr DSL DSV DL DV DEVL DEVG0.001 0.53 1.667 0.998 9.20E-05 -1.50E-02 0.3092 0 0.3271 0 5.796 0.2370.001 0.557 1.4013 0.9969 2.00E-04 1.60E-04 0.3028 0.0001 0.3036 0.0001 0.272 -1.1250.003 0.584 1.3703 0.9943 4.00E-04 -2.70E-06 0.2965 0.0001 0.3004 0.0001 1.309 -0.2610.005 0.611 1.34 0.9902 7.30E-04 3.00E-07 0.2904 0.0002 0.2992 0.0002 3.04 -0.2440.009 0.638 1.3161 0.9846 1.20E-03 -2.40E-07 0.2845 0.0004 0.2961 0.0004 4.049 -1.2430.017 0.665 1.2775 0.9748 2.20E-03 -1.20E-07 0.2789 0.0007 0.2923 0.0007 4.809 -0.6220.028 0.692 1.2419 0.9614 3.70E-03 1.80E-07 0.2729 0.0011 0.288 0.0011 5.513 -1.50.044 0.719 1.2164 0.9454 5.50E-03 1.20E-07 0.2672 0.0017 0.2836 0.0017 6.13 -1.7980.068 0.746 1.1862 0.9233 8.40E-03 0.00E+00 0.2601 0.0026 0.2782 0.0025 6.969 -0.80.102 0.773 1.1557 0.8946 1.20E-02 6.60E-07 0.2524 0.0038 0.2718 0.0038 7.722 0.1390.152 0.8 1.121 0.8557 1.90E-02 -1.80E-07 0.2445 0.0056 0.2636 0.0057 7.835 1.7780.211 0.827 1.0969 0.814 2.60E-02 0.00E+00 0.2365 0.0079 0.255 0.0081 7.831 2.0750.235 0.836 1.0886 0.7979 2.90E-02 6.00E-08 0.231 0.0089 0.2517 0.009 8.948 1.6010.294 0.854 1.0689 0.7592 3.60E-02 -3.60E-07 0.225 0.0113 0.2436 0.0116 8.264 2.7310.343 0.872 1.0626 0.7294 4.30E-02 -6.00E-08 0.2175 0.0142 0.2373 0.0138 9.081 -2.5350.408 0.89 1.051 0.69 5.10E-02 0.00E+00 0.21 0.0175 0.2286 0.0171 8.865 -2.5480.474 0.908 1.044 0.6521 6.10E-02 2.40E-07 0.2 0.0214 0.22 0.0205 10.011 -3.9040.572 0.926 1.0275 0.5939 7.70E-02 0.00E+00 0.19 0.0269 0.2061 0.0267 8.468 -0.9890.657 0.944 1.0211 0.5451 9.20E-02 -8.90E-08 0.179 0.0333 0.1936 0.0327 8.157 -1.710.752 0.962 1.0149 0.489 1.10E-01 0.00E+00 0.164 0.045 0.1782 0.041 8.68 -8.9530.869 0.98 1.0055 0.4125 1.50E-01 -4.70E-04 0.1443 0.06 0.1542 0.0551 6.833 -8.115
1 1 1 0.2563 2.60E-01 0.00E+00 0.1 0.1 0.1001 0.1001 0.009 0.009
148

Table C1.12: Densities Prediction for Cyclohexane.
Pr Tr Gam ZV ZL Fugr DSL DSV DL DV DEVL DEVG0.03 0.64 1.1492 0.9636 4.20E-03 6.00E-08 0.534 0.0022 0.5099 0.0022 -4.52 1.40.03 0.66 1.1391 0.9552 5.40E-03 1.80E-07 0.5265 0.0028 0.5064 0.0029 -3.811 2.360.04 0.67 1.1285 0.9446 7.00E-03 0.00E+00 0.5183 0.0036 0.5024 0.0037 -3.069 2.890.06 0.69 1.1181 0.9325 8.80E-03 0.00E+00 0.5106 0.0047 0.4981 0.0047 -2.457 0.560.07 0.71 1.109 0.9191 1.10E-02 0.00E+00 0.5025 0.0059 0.4935 0.0059 -1.797 0.50.09 0.73 1.0998 0.9038 1.40E-02 1.20E-07 0.4945 0.0074 0.4884 0.0074 -1.225 -0.230.11 0.75 1.0898 0.8861 1.70E-02 1.80E-07 0.4861 0.0091 0.4828 0.0092 -0.679 0.80.14 0.77 1.0802 0.8664 2.10E-02 -3.00E-07 0.4773 0.0111 0.4766 0.0113 -0.141 1.820.17 0.78 1.0715 0.8451 2.50E-02 4.20E-07 0.4683 0.0136 0.47 0.0138 0.355 1.350.24 0.82 1.055 0.7955 3.50E-02 3.00E-07 0.4495 0.0197 0.4544 0.0202 1.085 2.70.28 0.84 1.0477 0.7675 4.20E-02 -1.20E-07 0.4389 0.0235 0.4454 0.0243 1.477 3.460.33 0.86 1.0414 0.7377 4.90E-02 0.00E+00 0.4282 0.0282 0.4355 0.0291 1.706 3.030.39 0.87 1.0351 0.7049 5.80E-02 -3.00E-07 0.4164 0.0334 0.4243 0.0348 1.888 4.060.45 0.89 1.0297 0.67 6.70E-02 1.20E-07 0.4037 0.0396 0.4117 0.0415 1.985 4.730.52 0.91 1.024 0.6308 7.90E-02 1.20E-07 0.3899 0.0469 0.3969 0.0499 1.783 6.32
0.6 0.93 1.0188 0.588 9.30E-02 8.90E-08 0.3752 0.0553 0.3796 0.0602 1.164 8.840.68 0.95 1.0142 0.5407 1.10E-01 6.00E-08 0.3578 0.0665 0.3589 0.0733 0.319 10.180.78 0.96 1.0094 0.4851 1.30E-01 6.00E-08 0.3365 0.0814 0.3324 0.0913 -1.227 12.170.88 0.98 1.0044 0.416 1.70E-01 -1.10E-04 0.3081 0.1039 0.2947 0.1189 -4.348 14.4
1 1 1 0.273 2.70E-01 0.00E+00 0.2025 0.2025 0.2015 0.2015 -0.475 -0.48
149

Table C1.13: Densities Prediction for Carbon Dioxide.
Pr Tr Gam ZV ZL Fugr DSL DSV DL DV DEVL DEVG0.07 0.71 1.1074 0.9194 1.10E-02 0.00E+00 1.623 0.0195 1.5957 0.0195 -1.682 -0.060.08 0.72 1.1034 0.9123 1.20E-02 -6.00E-08 1.611 0.0217 1.5884 0.0217 -1.402 0.02
0.1 0.74 1.0934 0.8955 1.50E-02 -4.20E-07 1.589 0.0271 1.5717 0.0272 -1.088 0.190.11 0.75 1.0886 0.8864 1.70E-02 3.60E-07 1.567 0.0302 1.5628 0.0303 -0.27 0.30.12 0.76 1.0836 0.8767 1.90E-02 -5.40E-07 1.556 0.0335 1.5533 0.0337 -0.174 0.430.15 0.78 1.0752 0.8563 2.30E-02 3.00E-07 1.535 0.041 1.5336 0.0412 -0.089 0.680.17 0.78 1.0713 0.8455 2.50E-02 2.40E-07 1.525 0.0451 1.5232 0.0454 -0.119 0.860.18 0.79 1.0673 0.8341 2.80E-02 1.80E-07 1.515 0.0496 1.5121 0.0501 -0.192 1.030.22 0.81 1.059 0.809 3.30E-02 1.80E-07 1.485 0.06 1.4877 0.0608 0.179 1.410.24 0.82 1.0549 0.7954 3.60E-02 -1.80E-07 1.475 0.0659 1.4743 0.067 -0.047 1.670.26 0.83 1.0509 0.7813 3.90E-02 6.00E-08 1.457 0.0723 1.4603 0.0737 0.223 1.890.31 0.85 1.0442 0.752 4.70E-02 -1.20E-07 1.429 0.0863 1.4304 0.0885 0.095 2.510.34 0.86 1.0408 0.7363 5.00E-02 1.20E-07 1.411 0.0943 1.414 0.0969 0.21 2.840.36 0.87 1.0375 0.7197 5.50E-02 -1.20E-07 1.403 0.103 1.3963 0.1063 -0.477 3.180.42 0.89 1.0317 0.6853 6.40E-02 1.80E-07 1.369 0.1224 1.3582 0.1273 -0.786 3.980.46 0.89 1.0284 0.6661 7.00E-02 3.00E-07 1.353 0.134 1.3362 0.1399 -1.239 4.440.49 0.9 1.0256 0.6465 7.60E-02 -6.00E-08 1.337 0.1463 1.313 0.1536 -1.793 4.960.57 0.92 1.0202 0.6044 8.90E-02 1.20E-07 1.298 0.1748 1.2606 0.1856 -2.878 6.210.61 0.93 1.0172 0.5809 9.70E-02 -6.00E-08 1.277 0.1922 1.2296 0.2054 -3.712 6.860.66 0.94 1.0135 0.5544 1.10E-01 -2.10E-07 1.255 0.2136 1.193 0.2295 -4.942 7.450.75 0.96 1.0094 0.5019 1.30E-01 1.50E-07 1.202 0.2576 1.1149 0.2833 -7.244 9.980.79 0.97 1.0081 0.4741 1.40E-01 -1.80E-07 1.171 0.2816 1.0703 0.3156 -8.596 12.10.85 0.98 1.0065 0.4425 1.60E-01 -7.90E-05 1.136 0.3096 1.0156 0.3563 -10.596 15.09
1 1 1 0.274 2.70E-01 0.00E+00 0.664 0.6644 0.6649 0.6649 0.131 0.07
150

Table C1.14: Densities Prediction for Nitrogen.
Pr Tr Gam ZV ZL Fugr DSL DSV DL DV DEVL DEVG0.09 0.7 1.0536 0.8978 1.70E-02 -1.20E-07 1.668 0.0299 1.6198 0.0301 -2.892 0.66
0.1 0.71 1.0522 0.8933 1.80E-02 2.40E-07 1.66 0.0316 1.615 0.0318 -2.713 0.80.12 0.72 1.0475 0.8781 2.10E-02 3.60E-07 1.637 0.0375 1.599 0.0379 -2.323 1.060.12 0.73 1.0472 0.8769 2.10E-02 2.40E-07 1.63 0.038 1.5977 0.0384 -1.983 1.080.15 0.75 1.0417 0.8562 2.60E-02 -6.60E-07 1.601 0.0465 1.5761 0.0472 -1.555 1.490.16 0.76 1.0393 0.8462 2.80E-02 -4.20E-07 1.586 0.0508 1.5658 0.0516 -1.274 1.670.18 0.77 1.0361 0.8318 3.10E-02 -2.40E-07 1.566 0.0572 1.5508 0.0583 -0.97 1.97
0.2 0.78 1.0336 0.8198 3.40E-02 -1.20E-07 1.545 0.0627 1.5383 0.0642 -0.436 2.270.23 0.79 1.0308 0.8051 3.80E-02 -1.80E-07 1.525 0.0698 1.5227 0.0716 -0.148 2.60.27 0.81 1.0258 0.7757 4.60E-02 -6.00E-07 1.487 0.0847 1.4914 0.0875 0.293 3.34
0.3 0.83 1.023 0.7568 5.10E-02 3.00E-07 1.463 0.0948 1.4707 0.0984 0.528 3.830.33 0.83 1.0212 0.7437 5.40E-02 1.80E-07 1.451 0.1022 1.4561 0.1064 0.35 4.190.39 0.86 1.017 0.7088 6.50E-02 1.80E-07 1.405 0.1228 1.4161 0.1292 0.788 5.180.41 0.86 1.016 0.6992 6.80E-02 -3.00E-07 1.394 0.1288 1.4048 0.1358 0.773 5.440.46 0.88 1.0132 0.6706 7.70E-02 -2.40E-07 1.357 0.1475 1.3702 0.1567 0.975 6.280.51 0.89 1.0108 0.6418 8.60E-02 -1.20E-07 1.317 0.1676 1.3338 0.1796 1.278 7.170.53 0.9 1.0099 0.6289 9.10E-02 0.00E+00 1.303 0.177 1.3169 0.1905 1.069 7.60.61 0.92 1.0072 0.5867 1.10E-01 8.90E-08 1.248 0.2101 1.2593 0.229 0.901 90.62 0.92 1.007 0.5829 1.10E-01 -3.00E-08 1.244 0.2134 1.2537 0.2328 0.783 9.110.71 0.94 1.0046 0.5311 1.30E-01 -6.00E-08 1.17 0.2592 1.1765 0.2876 0.552 10.930.81 0.97 1.0029 0.4747 1.60E-01 -1.20E-07 1.092 0.317 1.0834 0.3578 -0.788 12.860.82 0.97 1.0028 0.4707 1.60E-01 0.00E+00 1.088 0.3216 1.0765 0.3632 -1.061 12.940.93 0.99 1.0013 0.3912 2.10E-01 -2.80E-05 0.978 0.4265 0.925 0.487 -5.423 14.2
1 1 1 0.289 2.90E-01 0.00E+00 0.694 0.6945 0.6985 0.6985 0.651 0.58
151
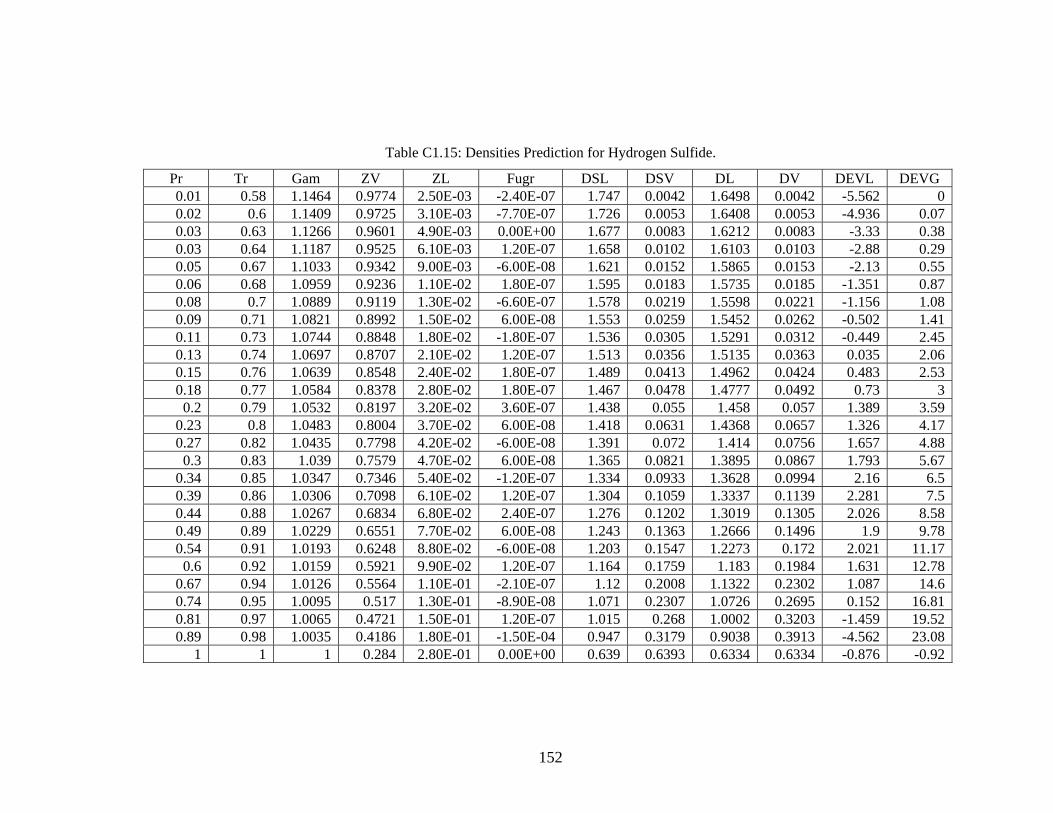
Table C1.15: Densities Prediction for Hydrogen Sulfide.
Pr Tr Gam ZV ZL Fugr DSL DSV DL DV DEVL DEVG0.01 0.58 1.1464 0.9774 2.50E-03 -2.40E-07 1.747 0.0042 1.6498 0.0042 -5.562 00.02 0.6 1.1409 0.9725 3.10E-03 -7.70E-07 1.726 0.0053 1.6408 0.0053 -4.936 0.070.03 0.63 1.1266 0.9601 4.90E-03 0.00E+00 1.677 0.0083 1.6212 0.0083 -3.33 0.380.03 0.64 1.1187 0.9525 6.10E-03 1.20E-07 1.658 0.0102 1.6103 0.0103 -2.88 0.290.05 0.67 1.1033 0.9342 9.00E-03 -6.00E-08 1.621 0.0152 1.5865 0.0153 -2.13 0.550.06 0.68 1.0959 0.9236 1.10E-02 1.80E-07 1.595 0.0183 1.5735 0.0185 -1.351 0.870.08 0.7 1.0889 0.9119 1.30E-02 -6.60E-07 1.578 0.0219 1.5598 0.0221 -1.156 1.080.09 0.71 1.0821 0.8992 1.50E-02 6.00E-08 1.553 0.0259 1.5452 0.0262 -0.502 1.410.11 0.73 1.0744 0.8848 1.80E-02 -1.80E-07 1.536 0.0305 1.5291 0.0312 -0.449 2.450.13 0.74 1.0697 0.8707 2.10E-02 1.20E-07 1.513 0.0356 1.5135 0.0363 0.035 2.060.15 0.76 1.0639 0.8548 2.40E-02 1.80E-07 1.489 0.0413 1.4962 0.0424 0.483 2.530.18 0.77 1.0584 0.8378 2.80E-02 1.80E-07 1.467 0.0478 1.4777 0.0492 0.73 3
0.2 0.79 1.0532 0.8197 3.20E-02 3.60E-07 1.438 0.055 1.458 0.057 1.389 3.590.23 0.8 1.0483 0.8004 3.70E-02 6.00E-08 1.418 0.0631 1.4368 0.0657 1.326 4.170.27 0.82 1.0435 0.7798 4.20E-02 -6.00E-08 1.391 0.072 1.414 0.0756 1.657 4.88
0.3 0.83 1.039 0.7579 4.70E-02 6.00E-08 1.365 0.0821 1.3895 0.0867 1.793 5.670.34 0.85 1.0347 0.7346 5.40E-02 -1.20E-07 1.334 0.0933 1.3628 0.0994 2.16 6.50.39 0.86 1.0306 0.7098 6.10E-02 1.20E-07 1.304 0.1059 1.3337 0.1139 2.281 7.50.44 0.88 1.0267 0.6834 6.80E-02 2.40E-07 1.276 0.1202 1.3019 0.1305 2.026 8.580.49 0.89 1.0229 0.6551 7.70E-02 6.00E-08 1.243 0.1363 1.2666 0.1496 1.9 9.780.54 0.91 1.0193 0.6248 8.80E-02 -6.00E-08 1.203 0.1547 1.2273 0.172 2.021 11.17
0.6 0.92 1.0159 0.5921 9.90E-02 1.20E-07 1.164 0.1759 1.183 0.1984 1.631 12.780.67 0.94 1.0126 0.5564 1.10E-01 -2.10E-07 1.12 0.2008 1.1322 0.2302 1.087 14.60.74 0.95 1.0095 0.517 1.30E-01 -8.90E-08 1.071 0.2307 1.0726 0.2695 0.152 16.810.81 0.97 1.0065 0.4721 1.50E-01 1.20E-07 1.015 0.268 1.0002 0.3203 -1.459 19.520.89 0.98 1.0035 0.4186 1.80E-01 -1.50E-04 0.947 0.3179 0.9038 0.3913 -4.562 23.08
1 1 1 0.284 2.80E-01 0.00E+00 0.639 0.6393 0.6334 0.6334 -0.876 -0.92
152
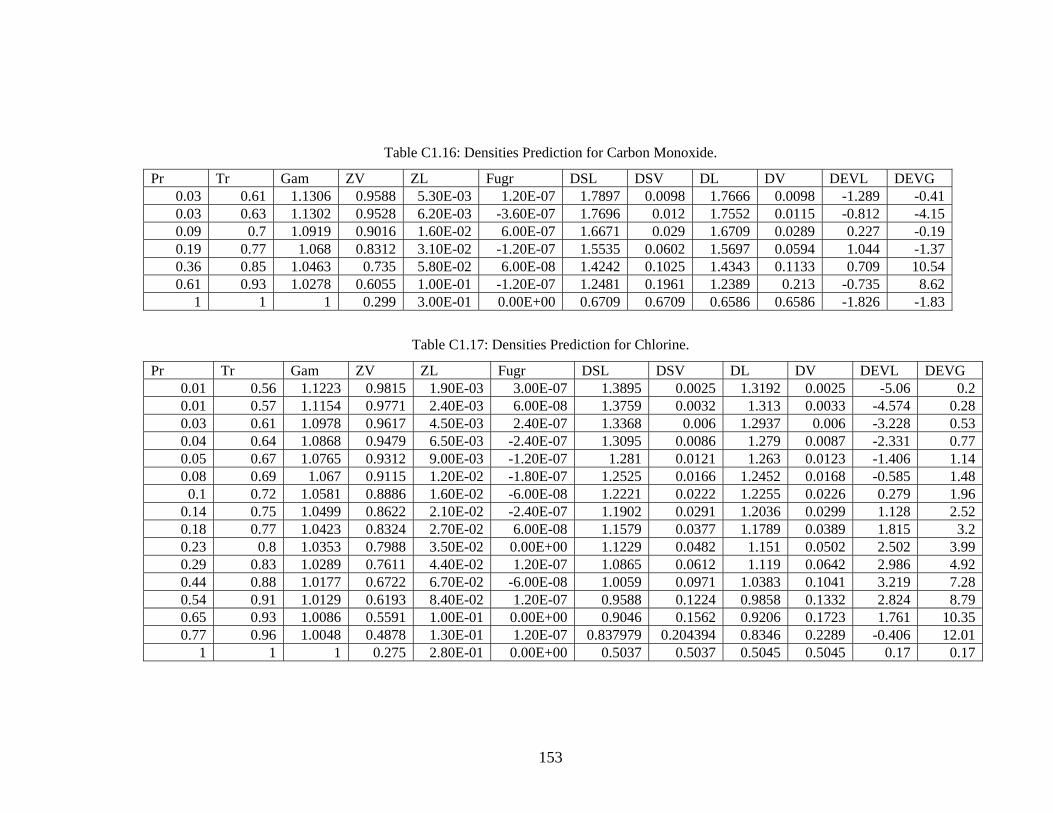
Table C1.16: Densities Prediction for Carbon Monoxide.
Pr Tr Gam ZV ZL Fugr DSL DSV DL DV DEVL DEVG0.03 0.61 1.1306 0.9588 5.30E-03 1.20E-07 1.7897 0.0098 1.7666 0.0098 -1.289 -0.410.03 0.63 1.1302 0.9528 6.20E-03 -3.60E-07 1.7696 0.012 1.7552 0.0115 -0.812 -4.150.09 0.7 1.0919 0.9016 1.60E-02 6.00E-07 1.6671 0.029 1.6709 0.0289 0.227 -0.190.19 0.77 1.068 0.8312 3.10E-02 -1.20E-07 1.5535 0.0602 1.5697 0.0594 1.044 -1.370.36 0.85 1.0463 0.735 5.80E-02 6.00E-08 1.4242 0.1025 1.4343 0.1133 0.709 10.540.61 0.93 1.0278 0.6055 1.00E-01 -1.20E-07 1.2481 0.1961 1.2389 0.213 -0.735 8.62
1 1 1 0.299 3.00E-01 0.00E+00 0.6709 0.6709 0.6586 0.6586 -1.826 -1.83
Table C1.17: Densities Prediction for Chlorine.
Pr Tr Gam ZV ZL Fugr DSL DSV DL DV DEVL DEVG0.01 0.56 1.1223 0.9815 1.90E-03 3.00E-07 1.3895 0.0025 1.3192 0.0025 -5.06 0.20.01 0.57 1.1154 0.9771 2.40E-03 6.00E-08 1.3759 0.0032 1.313 0.0033 -4.574 0.280.03 0.61 1.0978 0.9617 4.50E-03 2.40E-07 1.3368 0.006 1.2937 0.006 -3.228 0.530.04 0.64 1.0868 0.9479 6.50E-03 -2.40E-07 1.3095 0.0086 1.279 0.0087 -2.331 0.770.05 0.67 1.0765 0.9312 9.00E-03 -1.20E-07 1.281 0.0121 1.263 0.0123 -1.406 1.140.08 0.69 1.067 0.9115 1.20E-02 -1.80E-07 1.2525 0.0166 1.2452 0.0168 -0.585 1.48
0.1 0.72 1.0581 0.8886 1.60E-02 -6.00E-08 1.2221 0.0222 1.2255 0.0226 0.279 1.960.14 0.75 1.0499 0.8622 2.10E-02 -2.40E-07 1.1902 0.0291 1.2036 0.0299 1.128 2.520.18 0.77 1.0423 0.8324 2.70E-02 6.00E-08 1.1579 0.0377 1.1789 0.0389 1.815 3.20.23 0.8 1.0353 0.7988 3.50E-02 0.00E+00 1.1229 0.0482 1.151 0.0502 2.502 3.990.29 0.83 1.0289 0.7611 4.40E-02 1.20E-07 1.0865 0.0612 1.119 0.0642 2.986 4.920.44 0.88 1.0177 0.6722 6.70E-02 -6.00E-08 1.0059 0.0971 1.0383 0.1041 3.219 7.280.54 0.91 1.0129 0.6193 8.40E-02 1.20E-07 0.9588 0.1224 0.9858 0.1332 2.824 8.790.65 0.93 1.0086 0.5591 1.00E-01 0.00E+00 0.9046 0.1562 0.9206 0.1723 1.761 10.350.77 0.96 1.0048 0.4878 1.30E-01 1.20E-07 0.837979 0.204394 0.8346 0.2289 -0.406 12.01
1 1 1 0.275 2.80E-01 0.00E+00 0.5037 0.5037 0.5045 0.5045 0.17 0.17
153

Table C1.18: Densities Prediction for Benzene.
Pr Tr Gam ZV ZL Fugr DSL DSV DL DV DEVL DEVG0.03 0.65 1.1429 0.961 4.60E-03 1.80E-07 0.6426 0.0029 0.6102 0.0029 -5.047 -0.340.05 0.68 1.1214 0.9403 7.60E-03 0.00E+00 0.6241 0.0048 0.6009 0.0048 -3.718 0.730.08 0.60480.72 1.102 0.9136 1.20E-02 3.00E-07 0.0077 0.5902 0.0077 -2.421 -0.480.12 0.75 1.0847 0.8803 1.80E-02 1.80E-07 0.5842 0.0115 0.5776 0.0116 -1.125 1.220.17 0.79 1.0688 0.8397 2.60E-02 -2.40E-07 0.5629 0.0167 0.5627 0.0172 -0.033 2.840.21 0.81 1.062 0.8169 3.00E-02 -1.80E-07 0.5519 0.0199 0.5543 0.0206 0.437 3.590.34 0.86 1.0429 0.735 4.90E-02 1.20E-07 0.514 0.0336 0.523 0.0351 1.755 4.450.46 0.9 1.0306 0.6663 6.80E-02 1.20E-07 0.4847 0.0478 0.4944 0.0502 1.996 5.070.69 0.95 1.0151 0.5363 1.10E-01 -3.00E-08 0.4258 0.083 0.431 0.0888 1.222 6.940.78 0.97 1.0104 0.4807 1.30E-01 1.20E-07 0.3983 0.1029 0.399 0.1106 0.188 7.5
1 1 1 0.271 2.70E-01 0.00E+00 0.2398 0.2398 0.2427 0.2427 1.221 1.22
Table C1.19: Densities Prediction for Fluorobenzene.
Pr Tr Gam ZV ZL Fugr DSL DSV DL DV DEVL DEVG0.03 0.65 1.1401 0.9622 4.20E-03 6.00E-08 0.6084 0.0025 0.5766 0.0025 -5.223 1.180.06 0.7 1.1119 0.9301 8.80E-03 -6.60E-07 0.5817 0.0054 0.5641 0.0053 -3.022 -1.140.07 0.72 1.0988 0.9144 1.10E-02 6.00E-08 0.5724 0.0068 0.5587 0.0069 -2.397 1.040.14 0.77 1.0724 0.86 2.10E-02 -4.20E-07 0.5433 0.0129 0.5406 0.013 -0.488 0.540.21 0.81 1.0578 0.8142 2.90E-02 6.00E-08 0.5221 0.0189 0.5257 0.019 0.685 0.70.29 0.85 1.044 0.7587 4.10E-02 -1.20E-07 0.4983 0.0272 0.5069 0.0276 1.725 1.520.46 0.9 1.0269 0.6562 6.70E-02 2.40E-07 0.4571 0.0457 0.4686 0.0477 2.527 4.320.54 0.92 1.0216 0.615 7.80E-02 6.00E-08 0.441 0.0546 0.4515 0.0576 2.371 5.530.62 0.93 1.0165 0.569 9.30E-02 -8.90E-08 0.4225 0.0655 0.4307 0.0703 1.944 7.310.71 0.95 1.0117 0.5171 1.10E-01 3.00E-08 0.4004 0.0796 0.405 0.087 1.155 9.240.81 0.97 1.007 0.4566 1.40E-01 -2.50E-04 0.3728 0.0997 0.3708 0.1104 -0.529 10.75
1 1 1 0.263 2.60E-01 0.00E+00 0.23 0.23 0.2306 0.2306 0.244 0.24
154
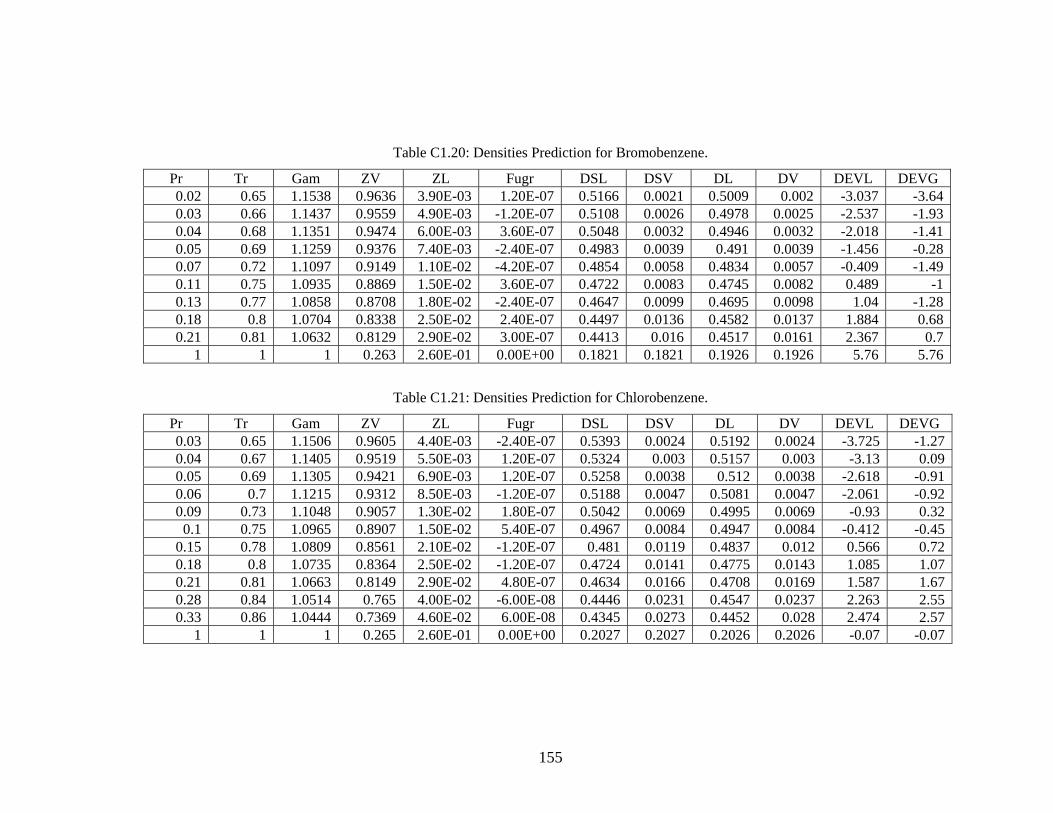
Table C1.20: Densities Prediction for Bromobenzene.
Pr Tr Gam ZV ZL Fugr DSL DSV DL DV DEVL DEVG0.02 0.65 1.1538 0.9636 3.90E-03 1.20E-07 0.5166 0.0021 0.5009 0.002 -3.037 -3.640.03 0.66 1.1437 0.9559 4.90E-03 -1.20E-07 0.5108 0.0026 0.4978 0.0025 -2.537 -1.930.04 0.68 1.1351 0.9474 6.00E-03 3.60E-07 0.5048 0.0032 0.4946 0.0032 -2.018 -1.410.05 0.69 1.1259 0.9376 7.40E-03 -2.40E-07 0.4983 0.0039 0.491 0.0039 -1.456 -0.280.07 0.72 1.1097 0.9149 1.10E-02 -4.20E-07 0.4854 0.0058 0.4834 0.0057 -0.409 -1.490.11 0.75 1.0935 0.8869 1.50E-02 3.60E-07 0.4722 0.0083 0.4745 0.0082 0.489 -10.13 0.77 1.0858 0.8708 1.80E-02 -2.40E-07 0.4647 0.0099 0.4695 0.0098 1.04 -1.280.18 0.8 1.0704 0.8338 2.50E-02 2.40E-07 0.4497 0.0136 0.4582 0.0137 1.884 0.680.21 0.81 1.0632 0.8129 2.90E-02 3.00E-07 0.4413 0.016 0.4517 0.0161 2.367 0.7
1 1 1 0.263 2.60E-01 0.00E+00 0.1821 0.1821 0.1926 0.1926 5.76 5.76
Table C1.21: Densities Prediction for Chlorobenzene.
Pr Tr Gam ZV ZL Fugr DSL DSV DL DV DEVL DEVG0.03 0.65 1.1506 0.9605 4.40E-03 -2.40E-07 0.5393 0.0024 0.5192 0.0024 -3.725 -1.270.04 0.67 1.1405 0.9519 5.50E-03 1.20E-07 0.5324 0.003 0.5157 0.003 -3.13 0.090.05 0.69 1.1305 0.9421 6.90E-03 1.20E-07 0.5258 0.0038 0.512 0.0038 -2.618 -0.910.06 0.7 1.1215 0.9312 8.50E-03 -1.20E-07 0.5188 0.0047 0.5081 0.0047 -2.061 -0.920.09 0.73 1.1048 0.9057 1.30E-02 1.80E-07 0.5042 0.0069 0.4995 0.0069 -0.93 0.32
0.1 0.75 1.0965 0.8907 1.50E-02 5.40E-07 0.4967 0.0084 0.4947 0.0084 -0.412 -0.450.15 0.78 1.0809 0.8561 2.10E-02 -1.20E-07 0.481 0.0119 0.4837 0.012 0.566 0.720.18 0.8 1.0735 0.8364 2.50E-02 -1.20E-07 0.4724 0.0141 0.4775 0.0143 1.085 1.070.21 0.81 1.0663 0.8149 2.90E-02 4.80E-07 0.4634 0.0166 0.4708 0.0169 1.587 1.670.28 0.84 1.0514 0.765 4.00E-02 -6.00E-08 0.4446 0.0231 0.4547 0.0237 2.263 2.550.33 0.86 1.0444 0.7369 4.60E-02 6.00E-08 0.4345 0.0273 0.4452 0.028 2.474 2.57
1 1 1 0.265 2.60E-01 0.00E+00 0.2027 0.2027 0.2026 0.2026 -0.07 -0.07
155

Table C1.22: Densities Prediction for Iodobenzene.
Pr Tr Gam ZV ZL Fugr DSL DSV DL DV DEVL DEVG0.02 0.64 1.1621 0.9655 3.70E-03 0.00E+00 0.4785 0.0018 0.4674 0.0018 -2.328 -1.420.03 0.66 1.1538 0.9589 4.50E-03 6.00E-08 0.4734 0.0022 0.4647 0.0022 -1.838 -0.60.04 0.67 1.145 0.9513 5.50E-03 4.80E-07 0.4681 0.0027 0.4619 0.0027 -1.332 -0.610.04 0.68 1.136 0.9426 6.70E-03 -1.80E-07 0.4628 0.0033 0.4588 0.0033 -0.869 -0.810.05 0.7 1.1275 0.9331 8.10E-03 0.00E+00 0.4572 0.004 0.4555 0.004 -0.366 -1.110.07 0.71 1.1191 0.9225 9.70E-03 2.40E-07 0.4518 0.0048 0.4521 0.0047 0.058 -1.10.08 0.73 1.1106 0.9107 1.20E-02 3.00E-07 0.4462 0.0057 0.4483 0.0057 0.478 -0.450.09 0.74 1.1026 0.8978 1.40E-02 2.40E-07 0.4401 0.0067 0.4444 0.0067 0.973 0.510.11 0.75 1.0947 0.8837 1.60E-02 - 42 -0.541.80E-07 0.43 0.008 0.4401 0.008 1.363
1 1 1 0.265 2.60E-01 0.00E+00 0.1779 0.1779 0.1776 0.1776 -0.156 -0.16
Table C1.23: Densities Prediction for 1,3 Butadiene.
Pr Tr Gam ZV ZL Fugr DSL DSV DL DV DEVL DEVG 0.000525 0.47 1.313 0.9984 1.10E-04 2.60E-02 0.8384 0.0001 0.7697 0.0001 -8.197 00.000798 0.48 1.2782 0.9978 1.50E-04 2.00E-02 0.8313 0.0001 0.8276 0.0001 -0.438 -0.040.001709 0.51 1.252 0.9958 3.20E-04 6.80E-05 0.8177 0.0003 0.8106 0.0003 -0.867 -0.070.004575 0.55 1.2212 0.9905 7.90E-04 -5.30E-05 0.7969 0.0006 0.8032 0.0006 0.794 -0.12
0.01 0.57 1.202 0.985 1.40E-03 -3.60E-07 0.7827 0.0011 0.7939 0.0011 1.428 -0.140.01 0.6 1.1839 0.9775 2.20E-03 4.80E-07 0.7684 0.0018 0.7865 0.0018 2.358 -0.160.03 0.65 1.1504 0.955 5.00E-03 0.00E+00 0.7386 0.004 0.7678 0.004 3.955 -0.120.06 0.69 1.1275 0.9304 8.40E-03 -6.00E-08 0.7152 0.0068 0.7515 0.0068 5.085 0.050.13 0.76 1.0932 0.8726 1.80E-02 -1.20E-07 0.673 0.0146 0.7181 0.0148 6.7 0.70.22 0.81 1.0693 0.809 3.00E-02 0.00E+00 0.6355 0.0251 0.6834 0.0255 7.531 1.670.28 0.84 1.0582 0.7705 3.90E-02 6.00E-08 0.6148 0.0323 0.6623 0.0331 7.717 2.480.35 0.86 1.048 0.7272 4.90E-02 2.40E-07 0.5924 0.0414 0.6379 0.0428 7.685 3.41
1 1 1 0.27 2.70E-01 0.00E+00 0.2826 0.2826 0.2826 0.2826 0 0
156

Table C1.24: Densities Prediction for Xenon.
Pr Tr Gam ZV ZL Fugr DSL DSV DL DV DEVL DEVG 0.1 0.7 1.0476 0.8894 1.70E-02 6.00E-08 1.3276 0.0228 1.3041 0.0253 -1.769 11.14
0.15 0.74 1.0388 0.8567 2.40E-02 -2.40E-07 1.2834 0.0376 1.2719 0.0357 -0.893 -5.080.2 0.77 1.0334 0.8206 3.20E-02 0.00E+00 1.2387 0.0514 1.237 0.0485 -0.137 -5.7
0.27 0.8 1.0239 0.7753 4.30E-02 -1.80E-07 1.194 0.0651 1.1927 0.0667 -0.111 2.440.35 0.84 1.0242 0.7328 5.50E-02 0.00E+00 1.1459 0.0856 1.1501 0.0861 0.363 0.540.46 0.87 1.0119 0.6689 7.40E-02 -1.20E-07 1.0898 0.1132 1.0826 0.1201 -0.664 6.060.55 0.91 1.0199 0.624 8.90E-02 -1.80E-07 1.0314 0.1488 1.0322 0.1478 0.075 -0.640.71 0.94 1.0073 0.5352 1.20E-01 -1.20E-07 0.9448 0.2002 0.9232 0.2146 -2.291 7.18
1 1 1 0.287 2.90E-01 0.00E+00 0.5487 0.5487 0.5325 0.5325 -2.949 -2.95
Table C1.25: Densities Prediction for Helium.
Pr Tr Gam ZV ZL Fugr DSL DSV DL DV DEVL DEVG 0.02 0.42 0.7102 0.9522 8.00E-03 0.00E+00 2.2782 0.0192 2.2812 0.0191 0.13 -0.640.04 0.46 0.7341 0.9349 1.20E-02 1.80E-07 2.2644 0.0281 2.261 0.0279 -0.152 -0.670.05 0.5 0.757 0.915 1.60E-02 -4.20E-07 2.2466 0.0392 2.2393 0.039 -0.324 -0.590.08 0.54 0.779 0.8925 2.10E-02 -6.60E-07 2.2251 0.0529 2.2155 0.0527 -0.432 -0.370.11 0.58 0.8002 0.8675 2.70E-02 -6.00E-08 2.2003 0.0694 2.1893 0.0693 -0.497 -0.020.14 0.62 0.8206 0.84 3.50E-02 1.80E-07 2.1721 0.089 2.1604 0.0894 -0.541 0.390.18 0.65 0.8405 0.81 4.30E-02 -6.00E-08 2.1406 0.1123 2.128 0.1133 -0.589 0.880.23 0.69 0.8597 0.7774 5.30E-02 -4.20E-07 2.1051 0.1399 2.0914 0.142 -0.654 1.490.29 0.73 0.8784 0.7422 6.40E-02 -1.20E-07 2.0652 0.1724 2.0497 0.1762 -0.753 2.180.36 0.77 0.8968 0.7041 7.60E-02 0.00E+00 2.0199 0.2111 2.0015 0.2173 -0.91 2.950.44 0.81 0.9148 0.6629 9.10E-02 6.00E-08 1.9676 0.2574 1.945 0.2671 -1.147 3.770.52 0.85 0.9324 0.618 1.10E-01 -6.00E-08 1.9059 0.3142 1.8772 0.3287 -1.505 4.620.62 0.88 0.9497 0.5683 1.30E-01 -1.20E-07 1.830201 0.386092 1.7931 0.4068 -2.026 5.36
1 1 1 0.301 3.00E-01 0.00E+00 1.0862 1.0862 1.0916 1.0916 0.501 0.5
157

Table C1.26: Densities Prediction for Argon.
Pr Tr Gam ZV ZL Fugr DSL DSV DL DV DEVL DEVG 0.01 0.56 1.0866 0.9756 2.90E-03 -6.00E-08 2.2106 0.0063 2.1221 0.0063 -4.003 0.010.02 0.56 1.084 0.9729 3.30E-03 3.00E-07 2.2 0.0072 2.1162 0.0072 -3.809 -0.040.03 0.6 1.0732 0.9593 5.30E-03 -1.80E-07 2.1519 0.0116 2.0891 0.0116 -2.918 0.070.04 0.63 1.0632 0.942 8.20E-03 3.00E-07 2.1019 0.0179 2.0594 0.018 -2.025 0.210.07 0.66 1.0541 0.9207 1.20E-02 3.00E-07 2.0495 0.0264 2.0261 0.0265 -1.141 0.37
0.1 0.7 1.0459 0.8951 1.70E-02 -4.80E-07 1.9952 0.0377 1.9889 0.0379 -0.316 0.630.14 0.73 1.0384 0.8652 2.30E-02 4.80E-07 1.9378 0.0522 1.9469 0.0527 0.472 1.020.19 0.76 1.0316 0.8306 3.10E-02 1.80E-07 1.8766 0.0707 1.8991 0.0718 1.201 1.530.25 0.8 1.0256 0.7912 4.10E-02 1.20E-07 1.8123 0.0941 1.8442 0.0962 1.761 2.170.32 0.83 1.0201 0.7465 5.30E-02 -3.00E-07 1.7424 0.1238 1.7801 0.1275 2.165 30.41 0.86 1.0153 0.6958 6.90E-02 -3.00E-07 1.6643 0.1619 1.7039 0.1683 2.377 40.52 0.89 1.011 0.6379 8.80E-02 -3.00E-07 1.5769 0.2118 1.6109 0.2226 2.151 5.130.65 0.93 1.007 0.5704 1.10E-01 -3.00E-08 1.4721 0.2804 1.4921 0.2983 1.36 6.41
0.8 0.96 1.0035 0.4875 1.50E-01 -6.00E-08 1.3335 0.3861 1.328 0.4139 -0.407 7.211 1 1 0.291 2.90E-01 0.00E+00 0.8372 0.8372 0.8379 0.8379 0.083 0.08
Table C1.27: Densities Prediction for Hydrogen.
Pr Tr Gam ZV ZL Fugr DSL DSV DL DV DEVL DEVG 0.009 0.451 0.9156 0.9799 2.60E-03 -5.40E-07 2.363 0.0062 2.3386 0.0061 -1.03 -0.970.019 0.496 0.926 0.9659 4.80E-03 -4.20E-07 2.3206 0.0118 2.3062 0.0115 -0.62 -2.480.068 0.601 0.9445 0.9139 1.50E-02 -1.20E-07 2.2091 0.0359 2.2139 0.0361 0.22 0.440.168 0.701 0.9594 0.8376 3.30E-02 1.20E-07 2.0822 0.0818 2.0973 0.0833 0.73 1.83
1 1 1 0.305 3.10E-01 0.00E+00 0.9606 0.9606 0.9557 0.9557 -0.51 -0.51
158
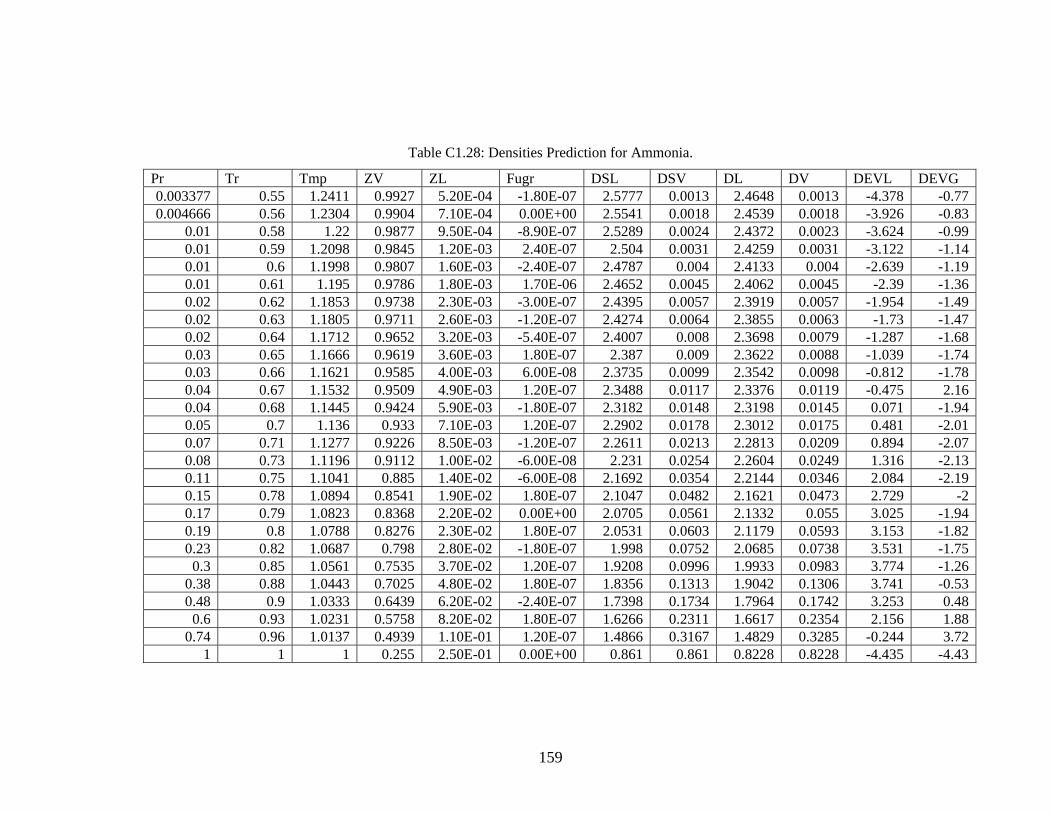
Table C1.28: Densities Prediction for Ammonia.
Pr Tr Tmp ZV ZL Fugr DSL DSV DL DV DEVL DEVG 0.003377 0.55 1.2411 0.9927 5.20E-04 -1.80E-07 2.5777 0.0013 2.4648 0.0013 -4.378 -0.770.004666 0.56 1.2304 0.9904 7.10E-04 0.00E+00 2.5541 0.0018 2.4539 0.0018 -3.926 -0.83
0.01 0.58 1.22 0.9877 9.50E-04 -8.90E-07 2.5289 0.0024 2.4372 0.0023 -3.624 -0.990.01 0.59 1.2098 0.9845 1.20E-03 2.40E-07 2.504 0.0031 2.4259 0.0031 -3.122 -1.140.01 0.6 1.1998 0.9807 1.60E-03 -2.40E-07 2.4787 0.004 2.4133 0.004 -2.639 -1.190.01 0.61 1.195 0.9786 1.80E-03 1.70E-06 2.4652 0.0045 2.4062 0.0045 -2.39 -1.360.02 0.62 1.1853 0.9738 2.30E-03 -3.00E-07 2.4395 0.0057 2.3919 0.0057 -1.954 -1.490.02 0.63 1.1805 0.9711 2.60E-03 -1.20E-07 2.4274 0.0064 2.3855 0.0063 -1.73 -1.470.02 0.64 1.1712 0.9652 3.20E-03 -5.40E-07 2.4007 0.008 2.3698 0.0079 -1.287 -1.680.03 0.65 1.1666 0.9619 3.60E-03 1.80E-07 2.387 0.009 2.3622 0.0088 -1.039 -1.740.03 0.66 1.1621 0.9585 4.00E-03 6.00E-08 2.3735 0.0099 2.3542 0.0098 -0.812 -1.780.04 0.67 1.1532 0.9509 4.90E-03 1.20E-07 2.3488 0.0117 2.3376 0.0119 -0.475 2.160.04 0.68 1.1445 0.9424 5.90E-03 -1.80E-07 2.3182 0.0148 2.3198 0.0145 0.071 -1.940.05 0.7 1.136 0.933 7.10E-03 1.20E-07 2.2902 0.0178 2.3012 0.0175 0.481 -2.010.07 0.71 1.1277 0.9226 8.50E-03 -1.20E-07 2.2611 0.0213 2.2813 0.0209 0.894 -2.070.08 0.73 1.1196 0.9112 1.00E-02 -6.00E-08 2.231 0.0254 2.2604 0.0249 1.316 -2.130.11 0.75 1.1041 0.885 1.40E-02 -6.00E-08 2.1692 0.0354 2.2144 0.0346 2.084 -2.190.15 0.78 1.0894 0.8541 1.90E-02 1.80E-07 2.1047 0.0482 2.1621 0.0473 2.729 -20.17 0.79 1.0823 0.8368 2.20E-02 0.00E+00 2.0705 0.0561 2.1332 0.055 3.025 -1.940.19 0.8 1.0788 0.8276 2.30E-02 1.80E-07 2.0531 0.0603 2.1179 0.0593 3.153 -1.820.23 0.82 1.0687 0.798 2.80E-02 -1.80E-07 1.998 0.0752 2.0685 0.0738 3.531 -1.75
0.3 0.85 1.0561 0.7535 3.70E-02 1.20E-07 1.9208 0.0996 1.9933 0.0983 3.774 -1.260.38 0.88 1.0443 0.7025 4.80E-02 1.80E-07 1.8356 0.1313 1.9042 0.1306 3.741 -0.530.48 0.9 1.0333 0.6439 6.20E-02 -2.40E-07 1.7398 0.1734 1.7964 0.1742 3.253 0.48
0.6 0.93 1.0231 0.5758 8.20E-02 1.80E-07 1.6266 0.2311 1.6617 0.2354 2.156 1.880.74 0.96 1.0137 0.4939 1.10E-01 1.20E-07 1.4866 0.3167 1.4829 0.3285 -0.244 3.72
1 1 1 0.255 2.50E-01 0.00E+00 0.861 0.861 0.8228 0.8228 -4.435 -4.43
159
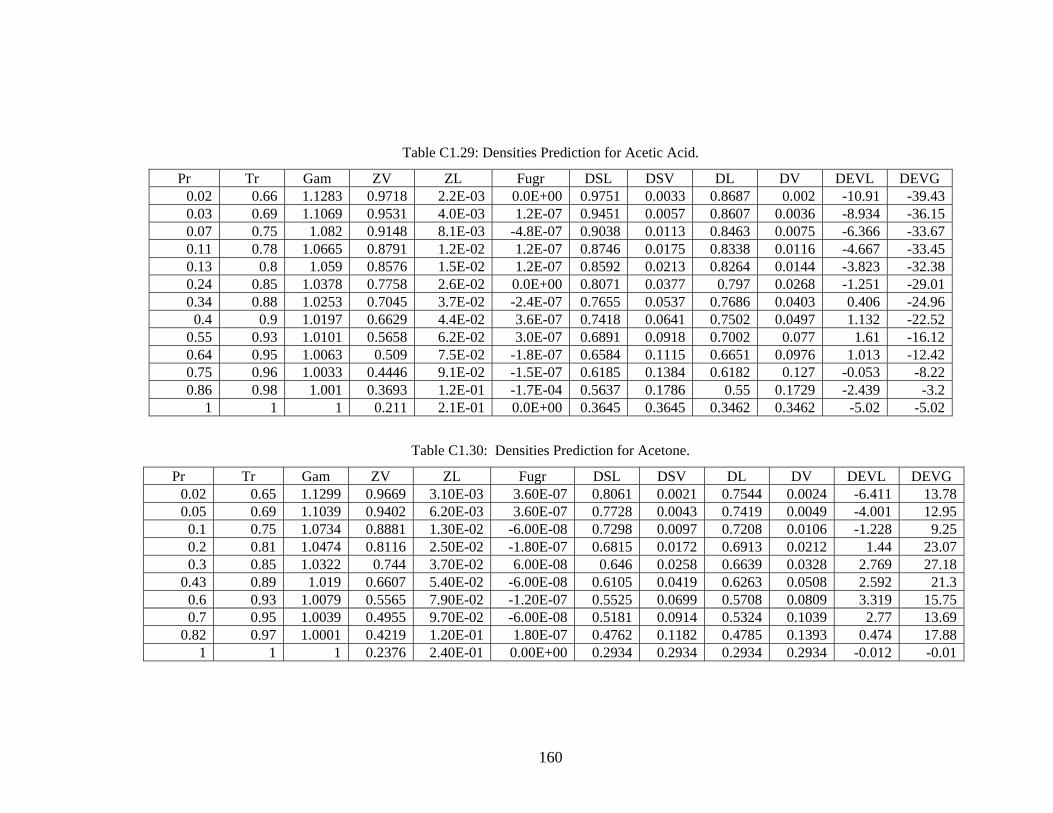
Table C1.29: Densities Prediction for Acetic Acid.
Pr Tr Gam ZV ZL Fugr DSL DSV DL DV DEVL DEVG 0.02 0.66 1.1283 0.9718 2.2E-03 0.0E+00 0.9751 0.0033 0.8687 0.002 -10.91 -39.430.03 0.69 1.1069 0.9531 4.0E-03 1.2E-07 0.9451 0.0057 0.8607 0.0036 -8.934 -36.150.07 0.75 1.082 0.9148 8.1E-03 -4.8E-07 0.9038 0.0113 0.8463 0.0075 -6.366 -33.670.11 0.78 1.0665 0.8791 1.2E-02 1.2E-07 0.8746 0.0175 0.8338 0.0116 -4.667 -33.450.13 0.8 1.059 0.8576 1.5E-02 1.2E-07 0.8592 0.0213 0.8264 0.0144 -3.823 -32.380.24 0.85 1.0378 0.7758 2.6E-02 0.0E+00 0.8071 0.0377 0.797 0.0268 -1.251 -29.010.34 0.88 1.0253 0.7045 3.7E-02 -2.4E-07 0.7655 0.0537 0.7686 0.0403 0.406 -24.96
0.4 0.9 1.0197 0.6629 4.4E-02 3.6E-07 0.7418 0.0641 0.7502 0.0497 1.132 -22.520.55 0.93 1.0101 0.5658 6.2E-02 3.0E-07 0.6891 0.0918 0.7002 0.077 1.61 -16.120.64 0.95 1.0063 0.509 7.5E-02 -1.8E-07 0.6584 0.1115 0.6651 0.0976 1.013 -12.420.75 0.96 1.0033 0.4446 9.1E-02 -1.5E-07 0.6185 0.1384 0.6182 0.127 -0.053 -8.220.86 0.98 1.001 0.3693 1.2E-01 -1.7E-04 0.5637 0.1786 0.55 0.1729 -2.439 -3.2
1 1 1 0.211 2.1E-01 0.0E+00 0.3645 0.3645 0.3462 0.3462 -5.02 -5.02
Table C1.30: Densities Prediction for Acetone.
Pr Tr Gam ZV ZL Fugr DSL DSV DL DV DEVL DEVG 0.02 0.65 1.1299 0.9669 3.10E-03 3.60E-07 0.8061 0.0021 0.7544 0.0024 -6.411 13.780.05 0.69 1.1039 0.9402 6.20E-03 3.60E-07 0.7728 0.0043 0.7419 0.0049 -4.001 12.95
0.1 0.75 1.0734 0.8881 1.30E-02 -6.00E-08 0.7298 0.0097 0.7208 0.0106 -1.228 9.250.2 0.81 1.0474 0.8116 2.50E-02 -1.80E-07 0.6815 0.0172 0.6913 0.0212 1.44 23.070.3 0.85 1.0322 0.744 3.70E-02 6.00E-08 0.646 0.0258 0.6639 0.0328 2.769 27.18
0.43 0.89 1.019 0.6607 5.40E-02 -6.00E-08 0.6105 0.0419 0.6263 0.0508 2.592 21.30.6 0.93 1.0079 0.5565 7.90E-02 -1.20E-07 0.5525 0.0699 0.5708 0.0809 3.319 15.750.7 0.95 1.0039 0.4955 9.70E-02 -6.00E-08 0.5181 0.0914 0.5324 0.1039 2.77 13.69
0.82 0.97 1.0001 0.4219 1.20E-01 1.80E-07 0.4762 0.1182 0.4785 0.1393 0.474 17.881 1 1 0.2376 2.40E-01 0.00E+00 0.2934 0.2934 0.2934 0.2934 -0.012 -0.01
160

Table C1.31: Densities Prediction for Methanol.
Pr Tr Gam ZV ZL Fugr DSL DSV DL DV DEVL DEVG 0.01 0.66 1.2111 0.9791 1.60E-03 -2.40E-07 1.4632 0.0024 1.3897 0.0023 -5.02 -4.180.02 0.69 1.1866 0.9668 2.80E-03 -2.10E-06 1.433 0.0041 1.3771 0.0039 -3.904 -4.150.06 0.75 1.1392 0.9275 6.90E-03 1.20E-07 1.3677 0.0105 1.3455 0.01 -1.624 -4.43
0.1 0.79 1.11 0.8872 1.20E-02 -1.80E-07 1.319 0.0183 1.3169 0.0175 -0.161 -4.540.17 0.82 1.0832 0.8327 1.90E-02 -1.20E-07 1.2654 0.0304 1.2795 0.0293 1.113 -3.620.34 0.88 1.0479 0.7184 3.70E-02 -1.20E-07 1.1651 0.0621 1.1962 0.0616 2.67 -0.830.41 0.9 1.0375 0.6698 4.60E-02 2.40E-07 1.1242 0.0781 1.1566 0.079 2.883 1.21
0.5 0.92 1.0281 0.6147 5.70E-02 0.00E+00 1.0774 0.0989 1.1076 0.1022 2.803 3.360.72 0.96 1.0118 0.4793 9.00E-02 0.00E+00 0.9547 0.1682 0.9612 0.1808 0.676 7.520.78 0.97 1.0081 0.4382 1.00E-01 -4.50E-04 0.9108 0.1954 0.9052 0.2135 -0.612 9.240.85 0.98 1.0051 0.391 1.20E-01 -1.40E-04 0.8592 0.2313 0.8374 0.2578 -2.539 11.46
1 1 1 0.224 2.20E-01 0.00E+00 0.5303 0.5303 0.5196 0.5196 -2.018 -2.02
Table C1.32: Densities Prediction for Ethanol.
Pr Tr Gam ZV ZL Fugr DSL DSV DL DV DEVL DEVG 0.02 0.68 1.2618 0.976 2.30E-03 -6.00E-07 0.998 0.0022 0.956 0.0022 -4.208 0.80.02 0.7 1.2358 0.9656 3.50E-03 3.00E-07 0.9826 0.0034 0.9482 0.0034 -3.505 -0.340.07 0.76 1.173 0.9237 8.90E-03 4.80E-07 0.9384 0.0089 0.9232 0.0089 -1.624 -0.130.09 0.78 1.1538 0.9039 1.20E-02 -1.20E-07 0.92 0.0119 0.9127 0.0119 -0.793 -0.260.12 0.8 1.1353 0.8807 1.50E-02 -1.80E-07 0.8986 0.0156 0.9008 0.0157 0.248 0.330.25 0.86 1.0857 0.7882 3.10E-02 -6.00E-08 0.8354 0.0331 0.8536 0.034 2.177 2.720.31 0.88 1.071 0.7485 3.90E-02 1.20E-07 0.8109 0.0422 0.8323 0.0436 2.636 3.330.38 0.9 1.0573 0.7037 4.90E-02 -1.20E-07 0.7835 0.0538 0.8069 0.0559 2.985 3.870.67 0.96 1.0217 0.5286 9.50E-02 3.00E-08 0.6719 0.1157 0.6868 0.1237 2.222 6.91
0.8 0.97 1.0111 0.4496 1.20E-01 -9.20E-04 0.6166 0.1538 0.6136 0.17 -0.479 10.51 1 1 0.2488 2.50E-01 0.00E+00 0.3733 0.3733 0.3733 0.3733 -0.012 -0.01
161
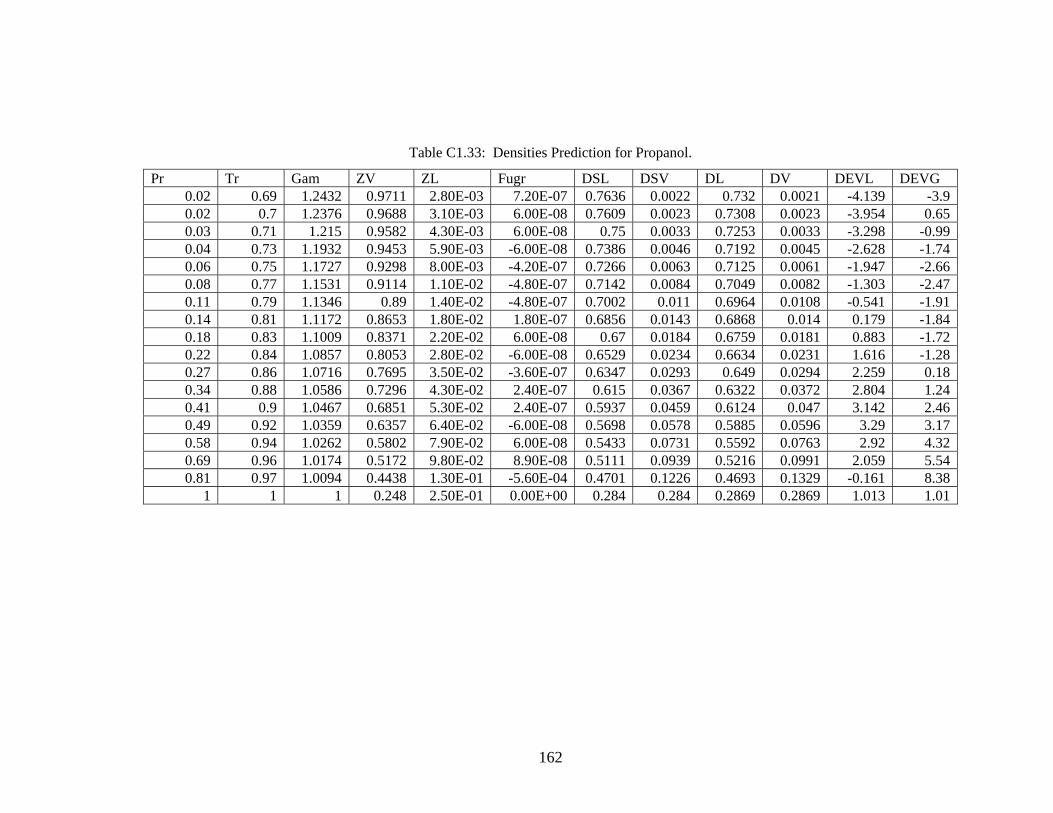
Table C1.33: Densities Prediction for Propanol.
Pr Tr Gam ZV ZL Fugr DSL DSV DL DV DEVL DEVG 0.02 0.69 1.2432 0.9711 2.80E-03 7.20E-07 0.7636 0.0022 0.732 0.0021 -4.139 -3.90.02 0.7 1.2376 0.9688 3.10E-03 6.00E-08 0.7609 0.0023 0.7308 0.0023 -3.954 0.650.03 0.71 1.215 0.9582 4.30E-03 6.00E-08 0.75 0.0033 0.7253 0.0033 -3.298 -0.990.04 0.73 1.1932 0.9453 5.90E-03 -6.00E-08 0.7386 0.0046 0.7192 0.0045 -2.628 -1.740.06 0.75 1.1727 0.9298 8.00E-03 -4.20E-07 0.7266 0.0063 0.7125 0.0061 -1.947 -2.660.08 0.77 1.1531 0.9114 1.10E-02 -4.80E-07 0.7142 0.0084 0.7049 0.0082 -1.303 -2.470.11 0.79 1.1346 0.89 1.40E-02 -4.80E-07 0.7002 0.011 0.6964 0.0108 -0.541 -1.910.14 0.81 1.1172 0.8653 1.80E-02 1.80E-07 0.6856 0.0143 0.6868 0.014 0.179 -1.840.18 0.83 1.1009 0.8371 2.20E-02 6.00E-08 0.67 0.0184 0.6759 0.0181 0.883 -1.720.22 0.84 1.0857 0.8053 2.80E-02 -6.00E-08 0.6529 0.0234 0.6634 0.0231 1.616 -1.280.27 0.86 1.0716 0.7695 3.50E-02 -3.60E-07 0.6347 0.0293 0.649 0.0294 2.259 0.180.34 0.88 1.0586 0.7296 4.30E-02 2.40E-07 0.615 0.0367 0.6322 0.0372 2.804 1.240.41 0.9 1.0467 0.6851 5.30E-02 2.40E-07 0.5937 0.0459 0.6124 0.047 3.142 2.460.49 0.92 1.0359 0.6357 6.40E-02 -6.00E-08 0.5698 0.0578 0.5885 0.0596 3.29 3.170.58 0.94 1.0262 0.5802 7.90E-02 6.00E-08 0.5433 0.0731 0.5592 0.0763 2.92 4.320.69 0.96 1.0174 0.5172 9.80E-02 8.90E-08 0.5111 0.0939 0.5216 0.0991 2.059 5.540.81 0.97 1.0094 0.4438 1.30E-01 -5.60E-04 0.4701 0.1226 0.4693 0.1329 -0.161 8.38
1 1 1 0.248 2.50E-01 0.00E+00 0.284 0.284 0.2869 0.2869 1.013 1.01
162
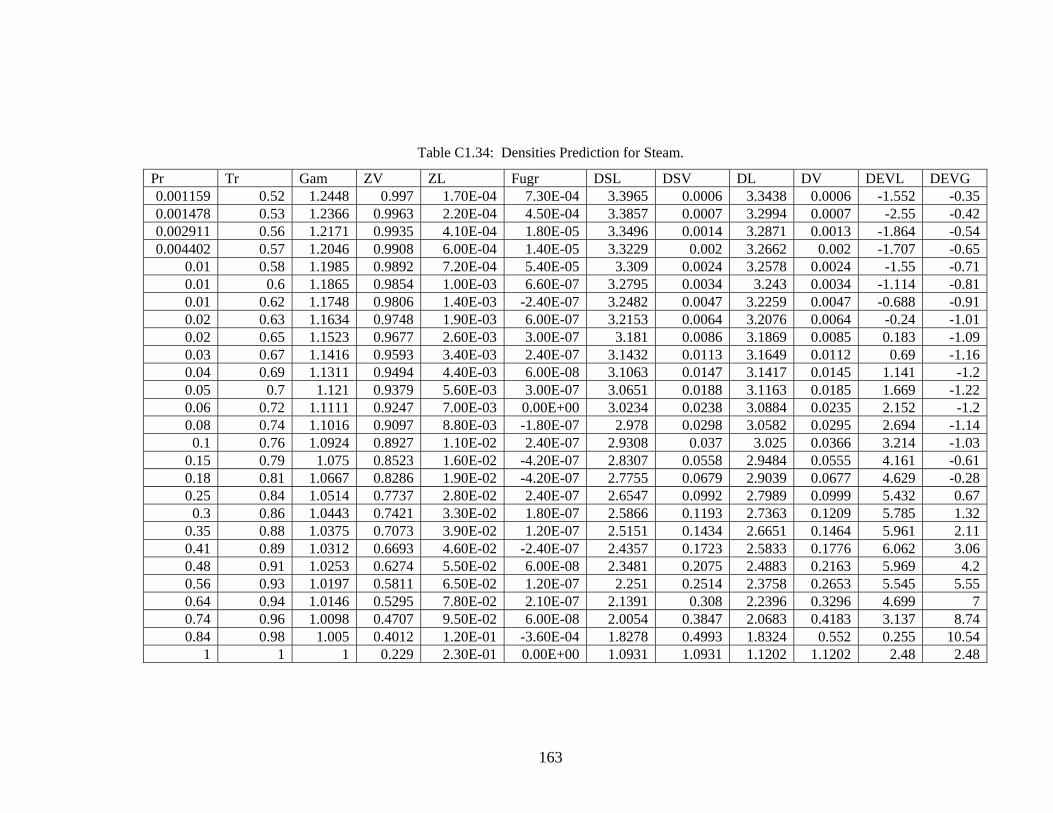
Table C1.34: Densities Prediction for Steam.
Pr Tr Gam ZV ZL Fugr DSL DSV DL DV DEVL DEVG 0.001159 0.52 1.2448 0.997 1.70E-04 7.30E-04 3.3965 0.0006 3.3438 0.0006 -1.552 -0.350.001478 0.53 1.2366 0.9963 2.20E-04 4.50E-04 3.3857 0.0007 3.2994 0.0007 -2.55 -0.420.002911 0.56 1.2171 0.9935 4.10E-04 1.80E-05 3.3496 0.0014 3.2871 0.0013 -1.864 -0.540.004402 0.57 1.2046 0.9908 6.00E-04 1.40E-05 3.3229 0.002 3.2662 0.002 -1.707 -0.65
0.01 0.58 1.1985 0.9892 7.20E-04 5.40E-05 3.309 0.0024 3.2578 0.0024 -1.55 -0.710.01 0.6 1.1865 0.9854 1.00E-03 6.60E-07 3.2795 0.0034 3.243 0.0034 -1.114 -0.810.01 0.62 1.1748 0.9806 1.40E-03 -2.40E-07 3.2482 0.0047 3.2259 0.0047 -0.688 -0.910.02 0.63 1.1634 0.9748 1.90E-03 6.00E-07 3.2153 0.0064 3.2076 0.0064 -0.24 -1.010.02 0.65 1.1523 0.9677 2.60E-03 3.00E-07 3.181 0.0086 3.1869 0.0085 0.183 -1.090.03 0.67 1.1416 0.9593 3.40E-03 2.40E-07 3.1432 0.0113 3.1649 0.0112 0.69 -1.160.04 0.69 1.1311 0.9494 4.40E-03 6.00E-08 3.1063 0.0147 3.1417 0.0145 1.141 -1.20.05 0.7 1.121 0.9379 5.60E-03 3.00E-07 3.0651 0.0188 3.1163 0.0185 1.669 -1.220.06 0.72 1.1111 0.9247 7.00E-03 0.00E+00 3.0234 0.0238 3.0884 0.0235 2.152 -1.20.08 0.74 1.1016 0.9097 8.80E-03 -1.80E-07 2.978 0.0298 3.0582 0.0295 2.694 -1.14
0.1 0.76 1.0924 0.8927 1.10E-02 2.40E-07 2.9308 0.037 3.025 0.0366 3.214 -1.030.15 0.79 1.075 0.8523 1.60E-02 -4.20E-07 2.8307 0.0558 2.9484 0.0555 4.161 -0.610.18 0.81 1.0667 0.8286 1.90E-02 -4.20E-07 2.7755 0.0679 2.9039 0.0677 4.629 -0.280.25 0.84 1.0514 0.7737 2.80E-02 2.40E-07 2.6547 0.0992 2.7989 0.0999 5.432 0.67
0.3 0.86 1.0443 0.7421 3.30E-02 1.80E-07 2.5866 0.1193 2.7363 0.1209 5.785 1.320.35 0.88 1.0375 0.7073 3.90E-02 1.20E-07 2.5151 0.1434 2.6651 0.1464 5.961 2.110.41 0.89 1.0312 0.6693 4.60E-02 -2.40E-07 2.4357 0.1723 2.5833 0.1776 6.062 3.060.48 0.91 1.0253 0.6274 5.50E-02 6.00E-08 2.3481 0.2075 2.4883 0.2163 5.969 4.20.56 0.93 1.0197 0.5811 6.50E-02 1.20E-07 2.251 0.2514 2.3758 0.2653 5.545 5.550.64 0.94 1.0146 0.5295 7.80E-02 2.10E-07 2.1391 0.308 2.2396 0.3296 4.699 70.74 0.96 1.0098 0.4707 9.50E-02 6.00E-08 2.0054 0.3847 2.0683 0.4183 3.137 8.740.84 0.98 1.005 0.4012 1.20E-01 -3.60E-04 1.8278 0.4993 1.8324 0.552 0.255 10.54
1 1 1 0.229 2.30E-01 0.00E+00 1.0931 1.0931 1.1202 1.1202 2.48 2.48
163
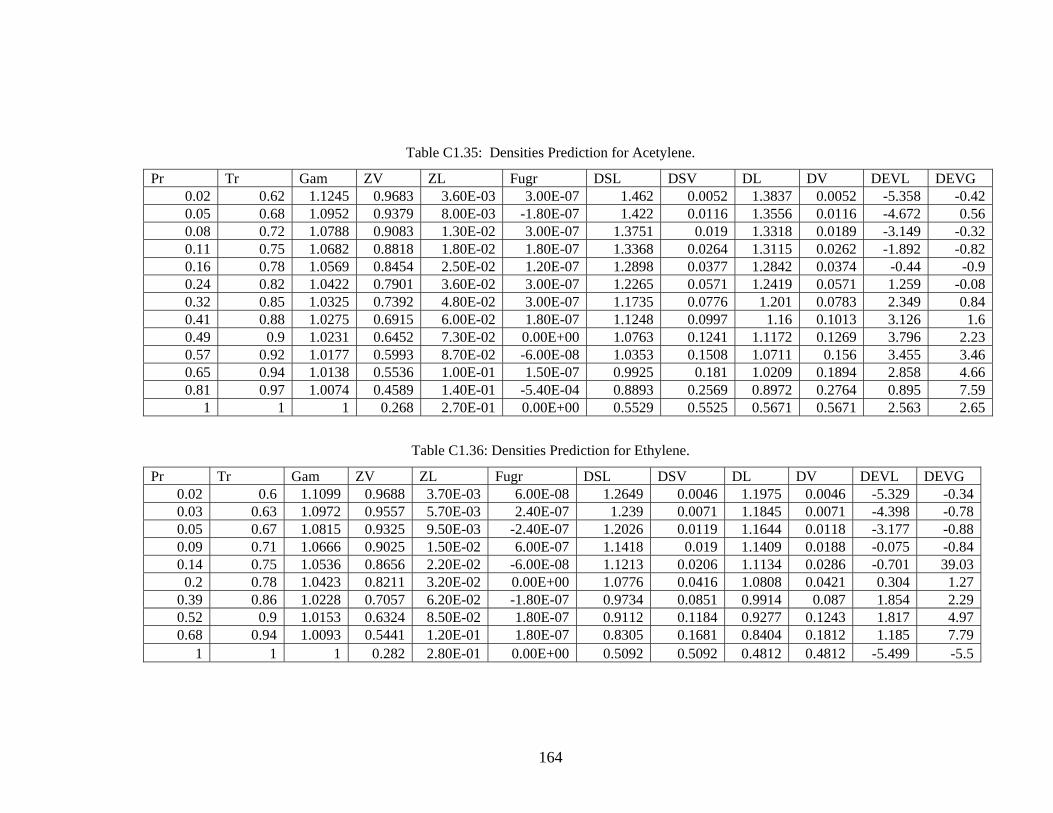
Table C1.35: Densities Prediction for Acetylene.
Pr Tr Gam ZV ZL Fugr DSL DSV DL DV DEVL DEVG 0.02 0.62 1.1245 0.9683 3.60E-03 3.00E-07 1.462 0.0052 1.3837 0.0052 -5.358 -0.42 0.05 0.68 1.0952 0.9379 8.00E-03 -1.80E-07 1.422 0.0116 1.3556 0.0116 -4.672 0.56 0.08 0.72 1.0788 0.9083 1.30E-02 3.00E-07 1.3751 0.019 1.3318 0.0189 -3.149 -0.32 0.11 0.75 1.0682 0.8818 1.80E-02 1.80E-07 1.3368 0.0264 1.3115 0.0262 -1.892 -0.82 0.16 0.78 1.0569 0.8454 2.50E-02 1.20E-07 1.2898 0.0377 1.2842 0.0374 -0.44 -0.9 0.24 0.82 1.0422 0.7901 3.60E-02 3.00E-07 1.2265 0.0571 1.2419 0.0571 1.259 -0.08 0.32 0.85 1.0325 0.7392 4.80E-02 3.00E-07 1.1735 0.0776 1.201 0.0783 2.349 0.84 0.41 0.88 1.0275 0.6915 6.00E-02 1.80E-07 1.1248 0.0997 1.16 0.1013 3.126 1.6 0.49 0.9 1.0231 0.6452 7.30E-02 0.00E+00 1.0763 0.1241 1.1172 0.1269 3.796 2.23 0.57 0.92 1.0177 0.5993 8.70E-02 -6.00E-08 1.0353 0.1508 1.0711 0.156 3.455 3.46 0.65 0.94 1.0138 0.5536 1.00E-01 1.50E-07 0.9925 0.181 1.0209 0.1894 2.858 4.66 0.81 0.97 1.0074 0.4589 1.40E-01 -5.40E-04 0.8893 0.2569 0.8972 0.2764 0.895 7.59
1 1 1 0.268 2.70E-01 0.00E+00 0.5529 0.5525 0.5671 0.5671 2.563 2.65
Table C1.36: Densities Prediction for Ethylene.
Pr Tr Gam ZV ZL Fugr DSL DSV DL DV DEVL DEVG 0.02 0.6 1.1099 0.9688 3.70E-03 6.00E-08 1.2649 0.0046 1.1975 0.0046 -5.329 -0.340.03 0.63 1.0972 0.9557 5.70E-03 2.40E-07 1.239 0.0071 1.1845 0.0071 -4.398 -0.780.05 0.67 1.0815 0.9325 9.50E-03 -2.40E-07 1.2026 0.0119 1.1644 0.0118 -3.177 -0.880.09 0.71 1.0666 0.9025 1.50E-02 6.00E-07 1.1418 0.019 1.1409 0.0188 -0.075 -0.840.14 0.75 1.0536 0.8656 2.20E-02 -6.00E-08 1.1213 0.0206 1.1134 0.0286 -0.701 39.03
0.2 0.78 1.0423 0.8211 3.20E-02 0.00E+00 1.0776 0.0416 1.0808 0.0421 0.304 1.270.39 0.86 1.0228 0.7057 6.20E-02 -1.80E-07 0.9734 0.0851 0.9914 0.087 1.854 2.290.52 0.9 1.0153 0.6324 8.50E-02 1.80E-07 0.9112 0.1184 0.9277 0.1243 1.817 4.970.68 0.94 1.0093 0.5441 1.20E-01 1.80E-07 0.8305 0.1681 0.8404 0.1812 1.185 7.79
1 1 1 0.282 2.80E-01 0.00E+00 0.5092 0.5092 0.4812 0.4812 -5.499 -5.5
164
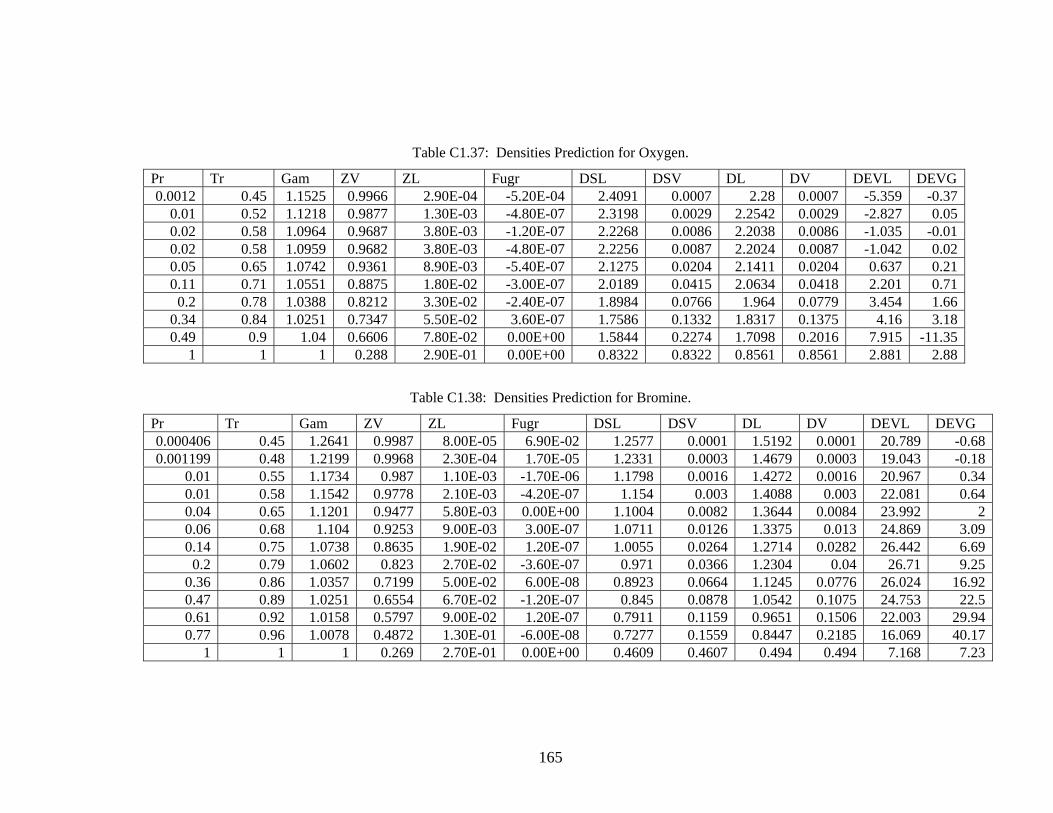
Table C1.37: Densities Prediction for Oxygen.
Pr Tr Gam ZV ZL Fugr DSL DSV DL DV DEVL DEVG 0.0012 0.45 1.1525 0.9966 2.90E-04 -5.20E-04 2.4091 0.0007 2.28 0.0007 -5.359 -0.37
0.01 0.52 1.1218 0.9877 1.30E-03 -4.80E-07 2.3198 0.0029 2.2542 0.0029 -2.827 0.050.02 0.58 1.0964 0.9687 3.80E-03 -1.20E-07 2.2268 0.0086 2.2038 0.0086 -1.035 -0.010.02 0.58 1.0959 0.9682 3.80E-03 -4.80E-07 2.2256 0.0087 2.2024 0.0087 -1.042 0.020.05 0.65 1.0742 0.9361 8.90E-03 -5.40E-07 2.1275 0.0204 2.1411 0.0204 0.637 0.210.11 0.71 1.0551 0.8875 1.80E-02 -3.00E-07 2.0189 0.0415 2.0634 0.0418 2.201 0.71
0.2 0.78 1.0388 0.8212 3.30E-02 -2.40E-07 1.8984 0.0766 1.964 0.0779 3.454 1.660.34 0.84 1.0251 0.7347 5.50E-02 3.60E-07 1.7586 0.1332 1.8317 0.1375 4.16 3.180.49 0.9 1.04 0.6606 7.80E-02 0.00E+00 1.5844 0.2274 1.7098 0.2016 7.915 -11.35
1 1 1 0.288 2.90E-01 0.00E+00 0.8322 0.8322 0.8561 0.8561 2.881 2.88
Table C1.38: Densities Prediction for Bromine.
Pr Tr Gam ZV ZL Fugr DSL DSV DL DV DEVL DEVG 0.000406 0.45 1.2641 0.9987 8.00E-05 6.90E-02 1.2577 0.0001 1.5192 0.0001 20.789 -0.68 0.001199 0.48 1.2199 0.9968 2.30E-04 1.70E-05 1.2331 0.0003 1.4679 0.0003 19.043 -0.18
0.01 0.55 1.1734 0.987 1.10E-03 -1.70E-06 1.1798 0.0016 1.4272 0.0016 20.967 0.34 0.01 0.58 1.1542 0.9778 2.10E-03 -4.20E-07 1.154 0.003 1.4088 0.003 22.081 0.64 0.04 0.65 1.1201 0.9477 5.80E-03 0.00E+00 1.1004 0.0082 1.3644 0.0084 23.992 2 0.06 0.68 1.104 0.9253 9.00E-03 3.00E-07 1.0711 0.0126 1.3375 0.013 24.869 3.09 0.14 0.75 1.0738 0.8635 1.90E-02 1.20E-07 1.0055 0.0264 1.2714 0.0282 26.442 6.69
0.2 0.79 1.0602 0.823 2.70E-02 -3.60E-07 0.971 0.0366 1.2304 0.04 26.71 9.25 0.36 0.86 1.0357 0.7199 5.00E-02 6.00E-08 0.8923 0.0664 1.1245 0.0776 26.024 16.92 0.47 0.89 1.0251 0.6554 6.70E-02 -1.20E-07 0.845 0.0878 1.0542 0.1075 24.753 22.5 0.61 0.92 1.0158 0.5797 9.00E-02 1.20E-07 0.7911 0.1159 0.9651 0.1506 22.003 29.94 0.77 0.96 1.0078 0.4872 1.30E-01 -6.00E-08 0.7277 0.1559 0.8447 0.2185 16.069 40.17
1 1 1 0.269 2.70E-01 0.00E+00 0.4609 0.4607 0.494 0.494 7.168 7.23
165
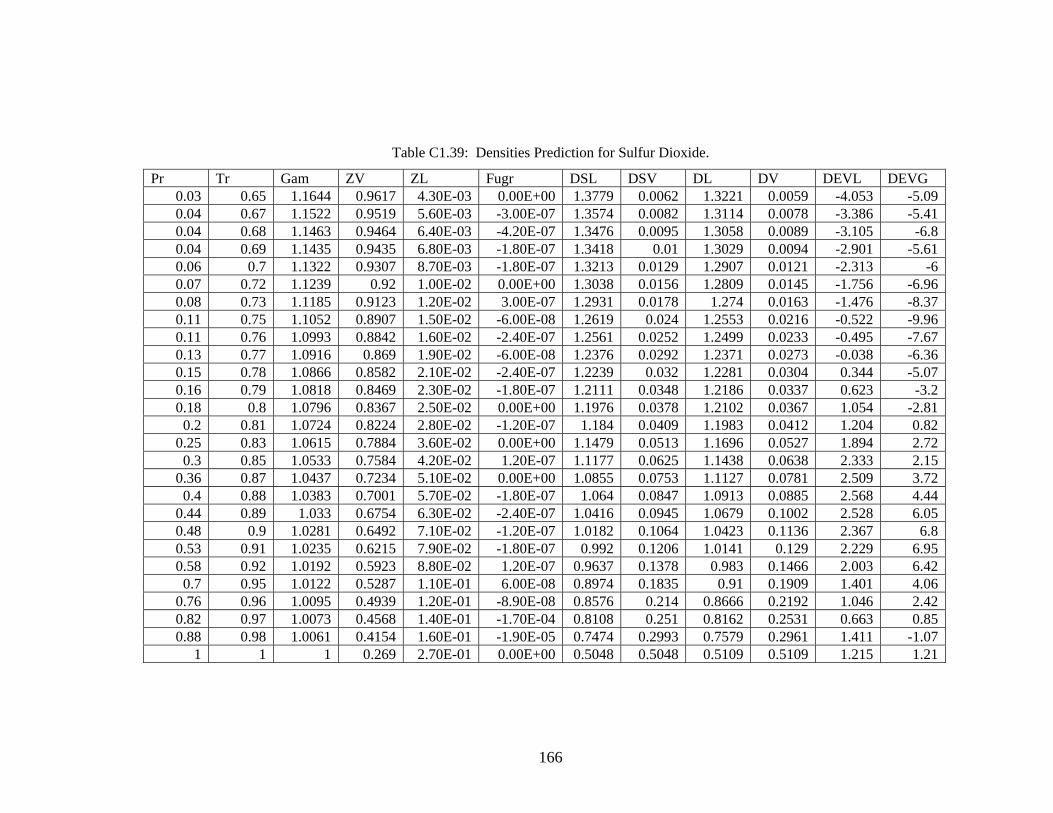
Table C1.39: Densities Prediction for Sulfur Dioxide.
Pr Tr Gam ZV ZL Fugr DSL DSV DL DV DEVL DEVG 0.03 0.65 1.1644 0.9617 4.30E-03 0.00E+00 1.3779 0.0062 1.3221 0.0059 -4.053 -5.090.04 0.67 1.1522 0.9519 5.60E-03 -3.00E-07 1.3574 0.0082 1.3114 0.0078 -3.386 -5.410.04 0.68 1.1463 0.9464 6.40E-03 -4.20E-07 1.3476 0.0095 1.3058 0.0089 -3.105 -6.80.04 0.69 1.1435 0.9435 6.80E-03 -1.80E-07 1.3418 0.01 1.3029 0.0094 -2.901 -5.610.06 0.7 1.1322 0.9307 8.70E-03 -1.80E-07 1.3213 0.0129 1.2907 0.0121 -2.313 -60.07 0.72 1.1239 0.92 1.00E-02 0.00E+00 1.3038 0.0156 1.2809 0.0145 -1.756 -6.960.08 0.73 1.1185 0.9123 1.20E-02 3.00E-07 1.2931 0.0178 1.274 0.0163 -1.476 -8.370.11 0.75 1.1052 0.8907 1.50E-02 -6.00E-08 1.2619 0.024 1.2553 0.0216 -0.522 -9.960.11 0.76 1.0993 0.8842 1.60E-02 -2.40E-07 1.2561 0.0252 1.2499 0.0233 -0.495 -7.670.13 0.77 1.0916 0.869 1.90E-02 -6.00E-08 1.2376 0.0292 1.2371 0.0273 -0.038 -6.360.15 0.78 1.0866 0.8582 2.10E-02 -2.40E-07 1.2239 0.032 1.2281 0.0304 0.344 -5.070.16 0.79 1.0818 0.8469 2.30E-02 -1.80E-07 1.2111 0.0348 1.2186 0.0337 0.623 -3.20.18 0.8 1.0796 0.8367 2.50E-02 0.00E+00 1.1976 0.0378 1.2102 0.0367 1.054 -2.81
0.2 0.81 1.0724 0.8224 2.80E-02 -1.20E-07 1.184 0.0409 1.1983 0.0412 1.204 0.820.25 0.83 1.0615 0.7884 3.60E-02 0.00E+00 1.1479 0.0513 1.1696 0.0527 1.894 2.72
0.3 0.85 1.0533 0.7584 4.20E-02 1.20E-07 1.1177 0.0625 1.1438 0.0638 2.333 2.150.36 0.87 1.0437 0.7234 5.10E-02 0.00E+00 1.0855 0.0753 1.1127 0.0781 2.509 3.72
0.4 0.88 1.0383 0.7001 5.70E-02 -1.80E-07 1.064 0.0847 1.0913 0.0885 2.568 4.440.44 0.89 1.033 0.6754 6.30E-02 -2.40E-07 1.0416 0.0945 1.0679 0.1002 2.528 6.050.48 0.9 1.0281 0.6492 7.10E-02 -1.20E-07 1.0182 0.1064 1.0423 0.1136 2.367 6.80.53 0.91 1.0235 0.6215 7.90E-02 -1.80E-07 0.992 0.1206 1.0141 0.129 2.229 6.950.58 0.92 1.0192 0.5923 8.80E-02 1.20E-07 0.9637 0.1378 0.983 0.1466 2.003 6.42
0.7 0.95 1.0122 0.5287 1.10E-01 6.00E-08 0.8974 0.1835 0.91 0.1909 1.401 4.060.76 0.96 1.0095 0.4939 1.20E-01 -8.90E-08 0.8576 0.214 0.8666 0.2192 1.046 2.420.82 0.97 1.0073 0.4568 1.40E-01 -1.70E-04 0.8108 0.251 0.8162 0.2531 0.663 0.850.88 0.98 1.0061 0.4154 1.60E-01 -1.90E-05 0.7474 0.2993 0.7579 0.2961 1.411 -1.07
1 1 1 0.269 2.70E-01 0.00E+00 0.5048 0.5048 0.5109 0.5109 1.215 1.21
166

Table C1.40: Densities Prediction for Methyl Propionate.
Pr Tr Gam ZV ZL Fugr DSL DSV DL DV DEVL DEVG 0.03 0.67 1.1719 0.9635 3.80E-03 4.80E-07 0.596 0.0022 0.5661 0.0022 -5.019 1.710.05 0.7 1.1439 0.9407 6.80E-03 2.40E-07 0.5766 0.004 0.5569 0.004 -3.412 0.29
0.1 0.76 1.1063 0.8914 1.40E-02 2.40E-07 0.5459 0.0086 0.5399 0.0086 -1.107 -0.480.13 0.78 1.0949 0.8702 1.80E-02 -2.40E-07 0.5352 0.0108 0.5329 0.0108 -0.421 -0.160.16 0.8 1.0841 0.8465 2.20E-02 6.00E-08 0.5236 0.0135 0.5253 0.0135 0.316 -0.18
0.2 0.82 1.0737 0.82 2.70E-02 1.20E-07 0.5116 0.0167 0.5166 0.0167 0.985 0.20.29 0.85 1.0546 0.758 3.90E-02 -2.40E-07 0.4858 0.0252 0.4959 0.0255 2.072 1.080.42 0.89 1.0374 0.6819 5.60E-02 1.20E-07 0.4567 0.03 0.4683 0.0386 2.549 28.750.67 0.95 1.0156 0.5324 9.90E-02 -2.10E-07 0.3993 0.0685 0.4036 0.0752 1.07 9.720.84 0.98 1.0065 0.4295 1.40E-01 -1.10E-04 0.3526 0.1005 0.3468 0.1128 -1.644 12.28
0.9 0.99 1.0038 0.3848 1.60E-01 -1.30E-05 0.3298 0.1187 0.3185 0.134 -3.413 12.921 1 1 0.256 2.60E-01 0.00E+00 0.2214 0.2214 0.2204 0.2204 -0.462 -0.46
Table C1.41: Densities Prediction for Ethyl Propionate.
Pr Tr Gam ZV ZL Fugr DSL DSV DL DV DEVL DEVG 0.03 0.68 1.1793 0.9584 4.40E-03 6.00E-08 0.4868 0.0021 0.4651 0.0021 -4.467 1.570.04 0.7 1.1637 0.9463 6.00E-03 0.00E+00 0.4782 0.0029 0.461 0.0029 -3.602 0.060.07 0.74 1.1362 0.9181 9.90E-03 -1.80E-07 0.4614 0.0049 0.4523 0.0049 -1.966 -0.330.14 0.79 1.0996 0.8594 1.90E-02 -3.00E-07 0.4349 0.0099 0.4359 0.0098 0.239 -1.170.26 0.85 1.0676 0.7772 3.50E-02 -1.20E-07 0.4049 0.0184 0.4132 0.0184 2.042 0.240.38 0.88 1.049 0.707 5.00E-02 6.00E-08 0.3816 0.0273 0.3924 0.0277 2.836 1.570.45 0.9 1.0402 0.6659 6.00E-02 -6.00E-08 0.3684 0.0332 0.3794 0.0341 2.977 2.790.72 0.96 1.0161 0.5086 1.10E-01 3.00E-08 0.3167 0.063 0.3205 0.0675 1.204 7.210.83 0.98 1.0084 0.438 1.40E-01 -6.10E-04 0.29 0.0817 0.2865 0.0893 -1.209 9.270.89 0.99 1.0052 0.393 1.60E-01 -1.70E-04 0.2726 0.0955 0.2639 0.106 -3.187 11.05
1 1 1 0.256 2.60E-01 0.00E+00 0.1812 0.1812 0.1798 0.1798 -0.785 -0.79
167
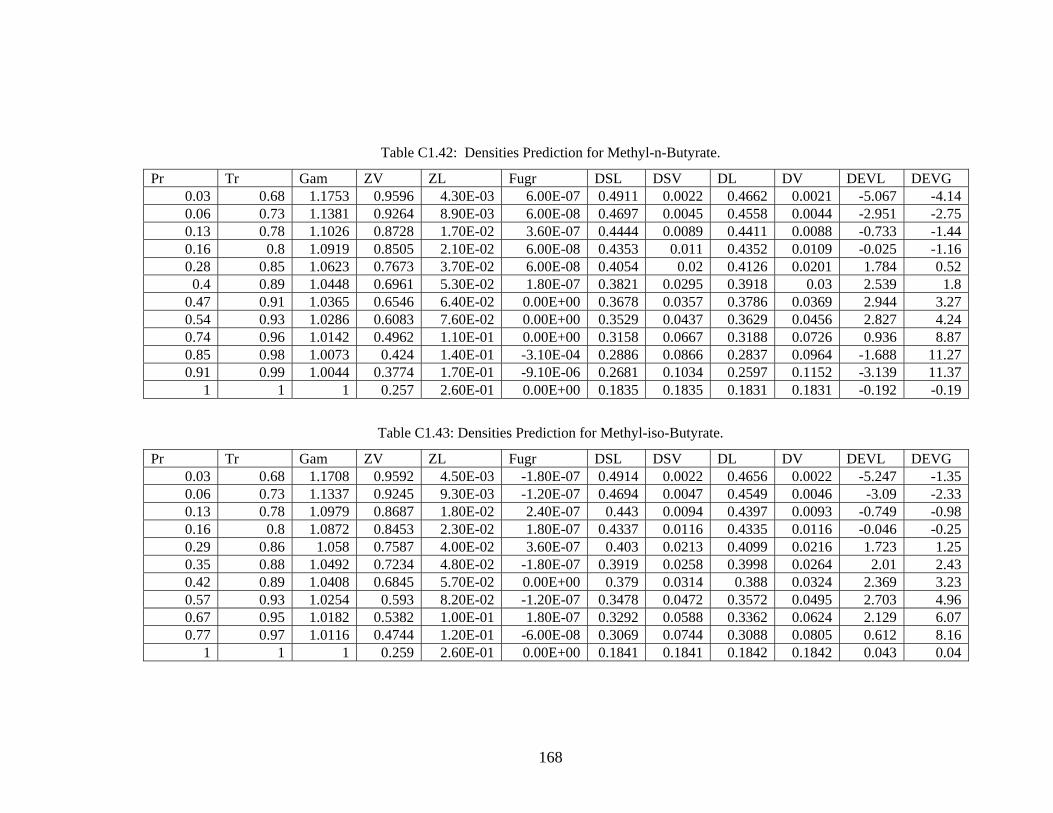
Table C1.42: Densities Prediction for Methyl-n-Butyrate.
Pr Tr Gam ZV ZL Fugr DSL DSV DL DV DEVL DEVG 0.03 0.68 1.1753 0.9596 4.30E-03 6.00E-07 0.4911 0.0022 0.4662 0.0021 -5.067 -4.140.06 0.73 1.1381 0.9264 8.90E-03 6.00E-08 0.4697 0.0045 0.4558 0.0044 -2.951 -2.750.13 0.78 1.1026 0.8728 1.70E-02 3.60E-07 0.4444 0.0089 0.4411 0.0088 -0.733 -1.440.16 0.8 1.0919 0.8505 2.10E-02 6.00E-08 0.4353 0.011 0.4352 0.0109 -0.025 -1.160.28 0.85 1.0623 0.7673 3.70E-02 6.00E-08 0.4054 0.02 0.4126 0.0201 1.784 0.52
0.4 0.89 1.0448 0.6961 5.30E-02 1.80E-07 0.3821 0.0295 0.3918 0.03 2.539 1.80.47 0.91 1.0365 0.6546 6.40E-02 0.00E+00 0.3678 0.0357 0.3786 0.0369 2.944 3.270.54 0.93 1.0286 0.6083 7.60E-02 0.00E+00 0.3529 0.0437 0.3629 0.0456 2.827 4.240.74 0.96 1.0142 0.4962 1.10E-01 0.00E+00 0.3158 0.0667 0.3188 0.0726 0.936 8.870.85 0.98 1.0073 0.424 1.40E-01 -3.10E-04 0.2886 0.0866 0.2837 0.0964 -1.688 11.270.91 0.99 1.0044 0.3774 1.70E-01 -9.10E-06 0.2681 0.1034 0.2597 0.1152 -3.139 11.37
1 1 1 0.257 2.60E-01 0.00E+00 0.1835 0.1835 0.1831 0.1831 -0.192 -0.19
Table C1.43: Densities Prediction for Methyl-iso-Butyrate.
Pr Tr Gam ZV ZL Fugr DSL DSV DL DV DEVL DEVG 0.03 0.68 1.1708 0.9592 4.50E-03 -1.80E-07 0.4914 0.0022 0.4656 0.0022 -5.247 -1.350.06 0.73 1.1337 0.9245 9.30E-03 -1.20E-07 0.4694 0.0047 0.4549 0.0046 -3.09 -2.330.13 0.78 1.0979 0.8687 1.80E-02 2.40E-07 0.443 0.0094 0.4397 0.0093 -0.749 -0.980.16 0.8 1.0872 0.8453 2.30E-02 1.80E-07 0.4337 0.0116 0.4335 0.0116 -0.046 -0.250.29 0.86 1.058 0.7587 4.00E-02 3.60E-07 0.403 0.0213 0.4099 0.0216 1.723 1.250.35 0.88 1.0492 0.7234 4.80E-02 -1.80E-07 0.3919 0.0258 0.3998 0.0264 2.01 2.430.42 0.89 1.0408 0.6845 5.70E-02 0.00E+00 0.379 0.0314 0.388 0.0324 2.369 3.230.57 0.93 1.0254 0.593 8.20E-02 -1.20E-07 0.3478 0.0472 0.3572 0.0495 2.703 4.960.67 0.95 1.0182 0.5382 1.00E-01 1.80E-07 0.3292 0.0588 0.3362 0.0624 2.129 6.070.77 0.97 1.0116 0.4744 1.20E-01 -6.00E-08 0.3069 0.0744 0.3088 0.0805 0.612 8.16
1 1 1 0.259 2.60E-01 0.00E+00 0.1841 0.1841 0.1842 0.1842 0.043 0.04
168
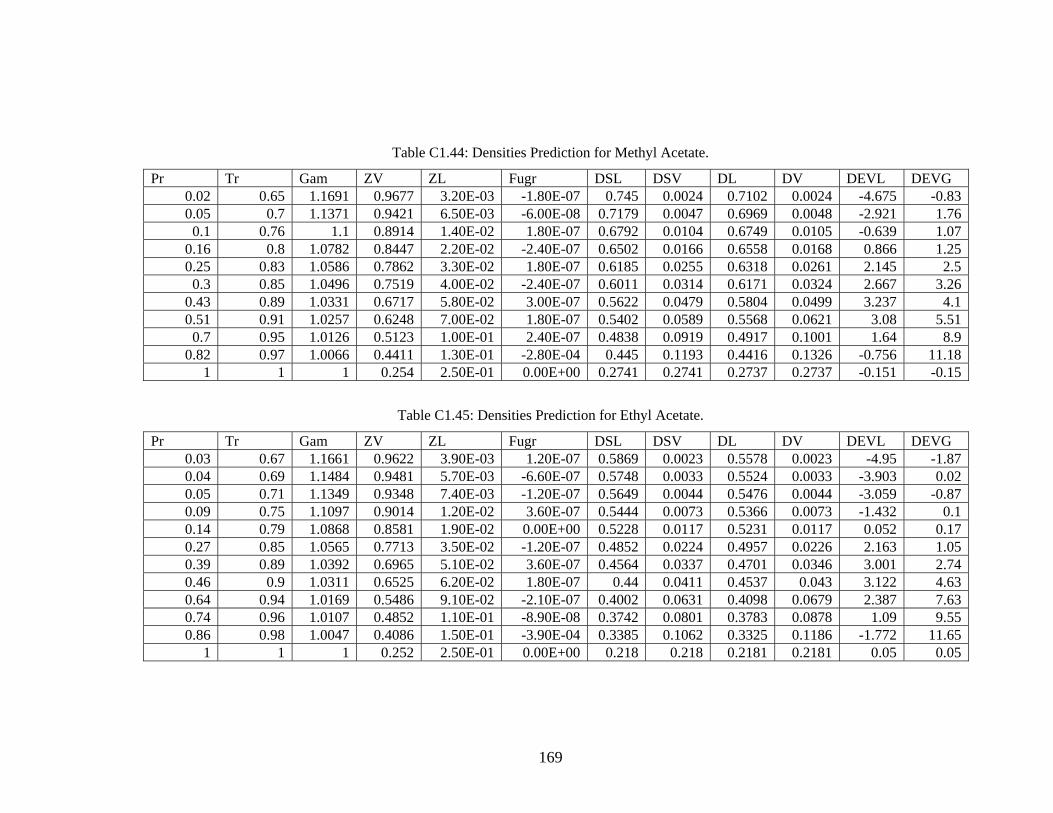
Table C1.44: Densities Prediction for Methyl Acetate.
Pr Tr Gam ZV ZL Fugr DSL DSV DL DV DEVL DEVG 0.02 0.65 1.1691 0.9677 3.20E-03 -1.80E-07 0.745 0.0024 0.7102 0.0024 -4.675 -0.830.05 0.7 1.1371 0.9421 6.50E-03 -6.00E-08 0.7179 0.0047 0.6969 0.0048 -2.921 1.76
0.1 0.76 1.1 0.8914 1.40E-02 1.80E-07 0.6792 0.0104 0.6749 0.0105 -0.639 1.070.16 0.8 1.0782 0.8447 2.20E-02 -2.40E-07 0.6502 0.0166 0.6558 0.0168 0.866 1.250.25 0.83 1.0586 0.7862 3.30E-02 1.80E-07 0.6185 0.0255 0.6318 0.0261 2.145 2.5
0.3 0.85 1.0496 0.7519 4.00E-02 -2.40E-07 0.6011 0.0314 0.6171 0.0324 2.667 3.260.43 0.89 1.0331 0.6717 5.80E-02 3.00E-07 0.5622 0.0479 0.5804 0.0499 3.237 4.10.51 0.91 1.0257 0.6248 7.00E-02 1.80E-07 0.5402 0.0589 0.5568 0.0621 3.08 5.51
0.7 0.95 1.0126 0.5123 1.00E-01 2.40E-07 0.4838 0.0919 0.4917 0.1001 1.64 8.90.82 0.97 1.0066 0.4411 1.30E-01 -2.80E-04 0.445 0.1193 0.4416 0.1326 -0.756 11.18
1 1 1 0.254 2.50E-01 0.00E+00 0.2741 0.2741 0.2737 0.2737 -0.151 -0.15
Table C1.45: Densities Prediction for Ethyl Acetate.
Pr Tr Gam ZV ZL Fugr DSL DSV DL DV DEVL DEVG 0.03 0.67 1.1661 0.9622 3.90E-03 1.20E-07 0.5869 0.0023 0.5578 0.0023 -4.95 -1.870.04 0.69 1.1484 0.9481 5.70E-03 -6.60E-07 0.5748 0.0033 0.5524 0.0033 -3.903 0.020.05 0.71 1.1349 0.9348 7.40E-03 -1.20E-07 0.5649 0.0044 0.5476 0.0044 -3.059 -0.870.09 0.75 1.1097 0.9014 1.20E-02 3.60E-07 0.5444 0.0073 0.5366 0.0073 -1.432 0.10.14 0.79 1.0868 0.8581 1.90E-02 0.00E+00 0.5228 0.0117 0.5231 0.0117 0.052 0.170.27 0.85 1.0565 0.7713 3.50E-02 -1.20E-07 0.4852 0.0224 0.4957 0.0226 2.163 1.050.39 0.89 1.0392 0.6965 5.10E-02 3.60E-07 0.4564 0.0337 0.4701 0.0346 3.001 2.740.46 0.9 1.0311 0.6525 6.20E-02 1.80E-07 0.44 0.0411 0.4537 0.043 3.122 4.630.64 0.94 1.0169 0.5486 9.10E-02 -2.10E-07 0.4002 0.0631 0.4098 0.0679 2.387 7.630.74 0.96 1.0107 0.4852 1.10E-01 -8.90E-08 0.3742 0.0801 0.3783 0.0878 1.09 9.550.86 0.98 1.0047 0.4086 1.50E-01 -3.90E-04 0.3385 0.1062 0.3325 0.1186 -1.772 11.65
1 1 1 0.252 2.50E-01 0.00E+00 0.218 0.218 0.2181 0.2181 0.05 0.05
169
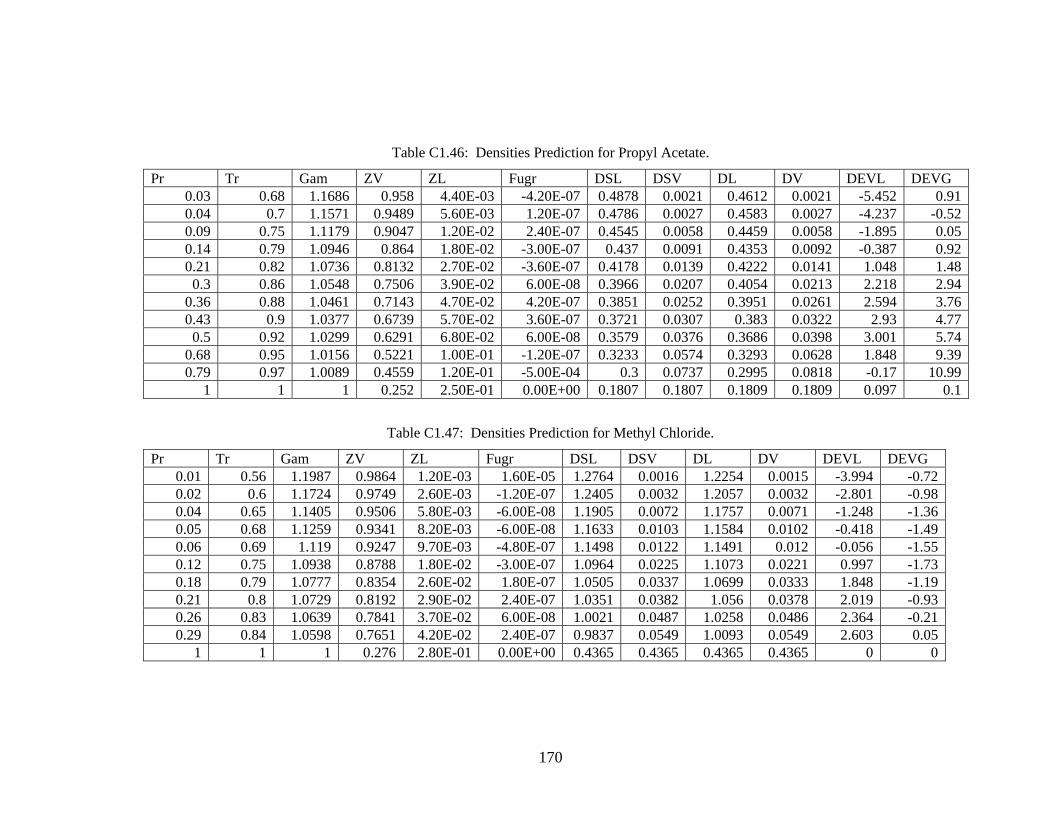
Table C1.46: Densities Prediction for Propyl Acetate.
Pr Tr Gam ZV ZL Fugr DSL DSV DL DV DEVL DEVG 0.03 0.68 1.1686 0.958 4.40E-03 -4.20E-07 0.4878 0.0021 0.4612 0.0021 -5.452 0.910.04 0.7 1.1571 0.9489 5.60E-03 1.20E-07 0.4786 0.0027 0.4583 0.0027 -4.237 -0.520.09 0.75 1.1179 0.9047 1.20E-02 2.40E-07 0.4545 0.0058 0.4459 0.0058 -1.895 0.050.14 0.79 1.0946 0.864 1.80E-02 -3.00E-07 0.437 0.0091 0.4353 0.0092 -0.387 0.920.21 0.82 1.0736 0.8132 2.70E-02 -3.60E-07 0.4178 0.0139 0.4222 0.0141 1.048 1.48
0.3 0.86 1.0548 0.7506 3.90E-02 6.00E-08 0.3966 0.0207 0.4054 0.0213 2.218 2.940.36 0.88 1.0461 0.7143 4.70E-02 4.20E-07 0.3851 0.0252 0.3951 0.0261 2.594 3.760.43 0.9 1.0377 0.6739 5.70E-02 3.60E-07 0.3721 0.0307 0.383 0.0322 2.93 4.77
0.5 0.92 1.0299 0.6291 6.80E-02 6.00E-08 0.3579 0.0376 0.3686 0.0398 3.001 5.740.68 0.95 1.0156 0.5221 1.00E-01 -1.20E-07 0.3233 0.0574 0.3293 0.0628 1.848 9.390.79 0.97 1.0089 0.4559 1.20E-01 -5.00E-04 0.3 0.0737 0.2995 0.0818 -0.17 10.99
1 1 1 0.252 2.50E-01 0.00E+00 0.1807 0.1807 0.1809 0.1809 0.097 0.1
Table C1.47: Densities Prediction for Methyl Chloride.
Pr Tr Gam ZV ZL Fugr DSL DSV DL DV DEVL DEVG 0.01 0.56 1.1987 0.9864 1.20E-03 1.60E-05 1.2764 0.0016 1.2254 0.0015 -3.994 -0.720.02 0.6 1.1724 0.9749 2.60E-03 -1.20E-07 1.2405 0.0032 1.2057 0.0032 -2.801 -0.980.04 0.65 1.1405 0.9506 5.80E-03 -6.00E-08 1.1905 0.0072 1.1757 0.0071 -1.248 -1.360.05 0.68 1.1259 0.9341 8.20E-03 -6.00E-08 1.1633 0.0103 1.1584 0.0102 -0.418 -1.490.06 0.69 1.119 0.9247 9.70E-03 -4.80E-07 1.1498 0.0122 1.1491 0.012 -0.056 -1.550.12 0.75 1.0938 0.8788 1.80E-02 -3.00E-07 1.0964 0.0225 1.1073 0.0221 0.997 -1.730.18 0.79 1.0777 0.8354 2.60E-02 1.80E-07 1.0505 0.0337 1.0699 0.0333 1.848 -1.190.21 0.8 1.0729 0.8192 2.90E-02 2.40E-07 1.0351 0.0382 1.056 0.0378 2.019 -0.930.26 0.83 1.0639 0.7841 3.70E-02 6.00E-08 1.0021 0.0487 1.0258 0.0486 2.364 -0.210.29 0.84 1.0598 0.7651 4.20E-02 2.40E-07 0.9837 0.0549 1.0093 0.0549 2.603 0.05
1 1 1 0.276 2.80E-01 0.00E+00 0.4365 0.4365 0.4365 0.4365 0 0
170
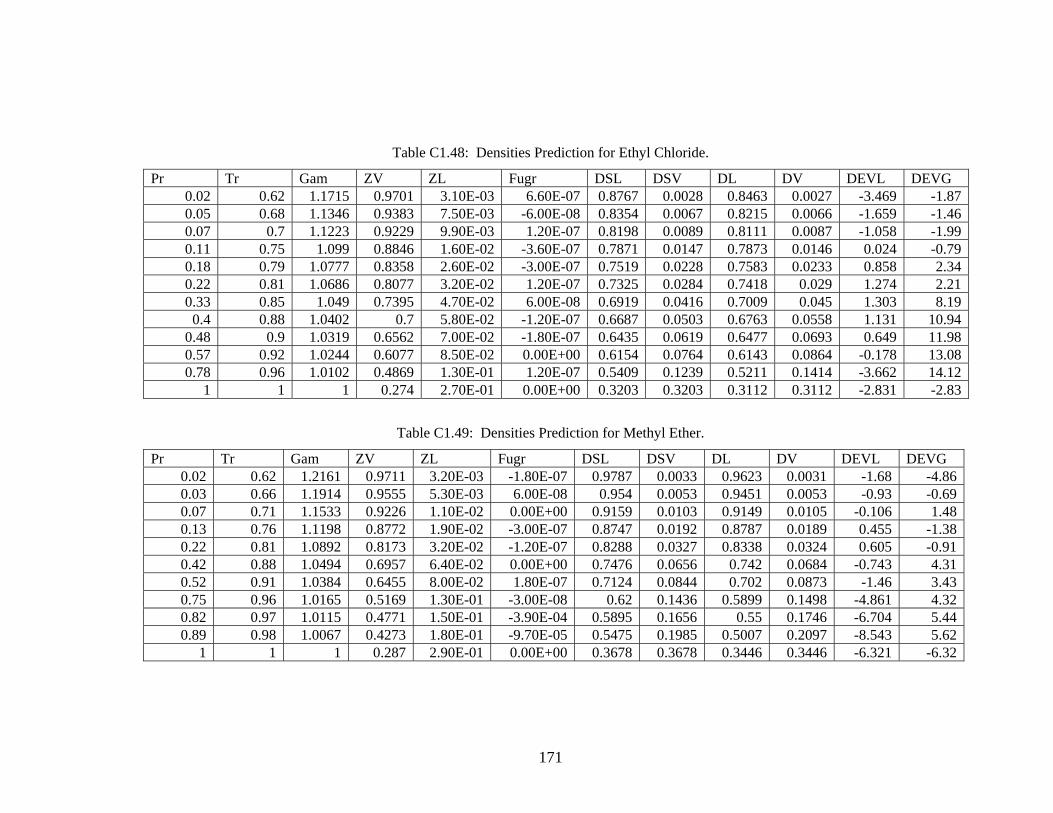
Table C1.48: Densities Prediction for Ethyl Chloride.
Pr Tr Gam ZV ZL Fugr DSL DSV DL DV DEVL DEVG 0.02 0.62 1.1715 0.9701 3.10E-03 6.60E-07 0.8767 0.0028 0.8463 0.0027 -3.469 -1.870.05 0.68 1.1346 0.9383 7.50E-03 -6.00E-08 0.8354 0.0067 0.8215 0.0066 -1.659 -1.460.07 0.7 1.1223 0.9229 9.90E-03 1.20E-07 0.8198 0.0089 0.8111 0.0087 -1.058 -1.990.11 0.75 1.099 0.8846 1.60E-02 -3.60E-07 0.7871 0.0147 0.7873 0.0146 0.024 -0.790.18 0.79 1.0777 0.8358 2.60E-02 -3.00E-07 0.7519 0.0228 0.7583 0.0233 0.858 2.340.22 0.81 1.0686 0.8077 3.20E-02 1.20E-07 0.7325 0.0284 0.7418 0.029 1.274 2.210.33 0.85 1.049 0.7395 4.70E-02 6.00E-08 0.6919 0.0416 0.7009 0.045 1.303 8.19
0.4 0.88 1.0402 0.7 5.80E-02 -1.20E-07 0.6687 0.0503 0.6763 0.0558 1.131 10.940.48 0.9 1.0319 0.6562 7.00E-02 -1.80E-07 0.6435 0.0619 0.6477 0.0693 0.649 11.980.57 0.92 1.0244 0.6077 8.50E-02 0.00E+00 0.6154 0.0764 0.6143 0.0864 -0.178 13.080.78 0.96 1.0102 0.4869 1.30E-01 1.20E-07 0.5409 0.1239 0.5211 0.1414 -3.662 14.12
1 1 1 0.274 2.70E-01 0.00E+00 0.3203 0.3203 0.3112 0.3112 -2.831 -2.83
Table C1.49: Densities Prediction for Methyl Ether.
Pr Tr Gam ZV ZL Fugr DSL DSV DL DV DEVL DEVG 0.02 0.62 1.2161 0.9711 3.20E-03 -1.80E-07 0.9787 0.0033 0.9623 0.0031 -1.68 -4.860.03 0.66 1.1914 0.9555 5.30E-03 6.00E-08 0.954 0.0053 0.9451 0.0053 -0.93 -0.690.07 0.71 1.1533 0.9226 1.10E-02 0.00E+00 0.9159 0.0103 0.9149 0.0105 -0.106 1.480.13 0.76 1.1198 0.8772 1.90E-02 -3.00E-07 0.8747 0.0192 0.8787 0.0189 0.455 -1.380.22 0.81 1.0892 0.8173 3.20E-02 -1.20E-07 0.8288 0.0327 0.8338 0.0324 0.605 -0.910.42 0.88 1.0494 0.6957 6.40E-02 0.00E+00 0.7476 0.0656 0.742 0.0684 -0.743 4.310.52 0.91 1.0384 0.6455 8.00E-02 1.80E-07 0.7124 0.0844 0.702 0.0873 -1.46 3.430.75 0.96 1.0165 0.5169 1.30E-01 -3.00E-08 0.62 0.1436 0.5899 0.1498 -4.861 4.320.82 0.97 1.0115 0.4771 1.50E-01 -3.90E-04 0.5895 0.1656 0.55 0.1746 -6.704 5.440.89 0.98 1.0067 0.4273 1.80E-01 -9.70E-05 0.5475 0.1985 0.5007 0.2097 -8.543 5.62
1 1 1 0.287 2.90E-01 0.00E+00 0.3678 0.3678 0.3446 0.3446 -6.321 -6.32
171
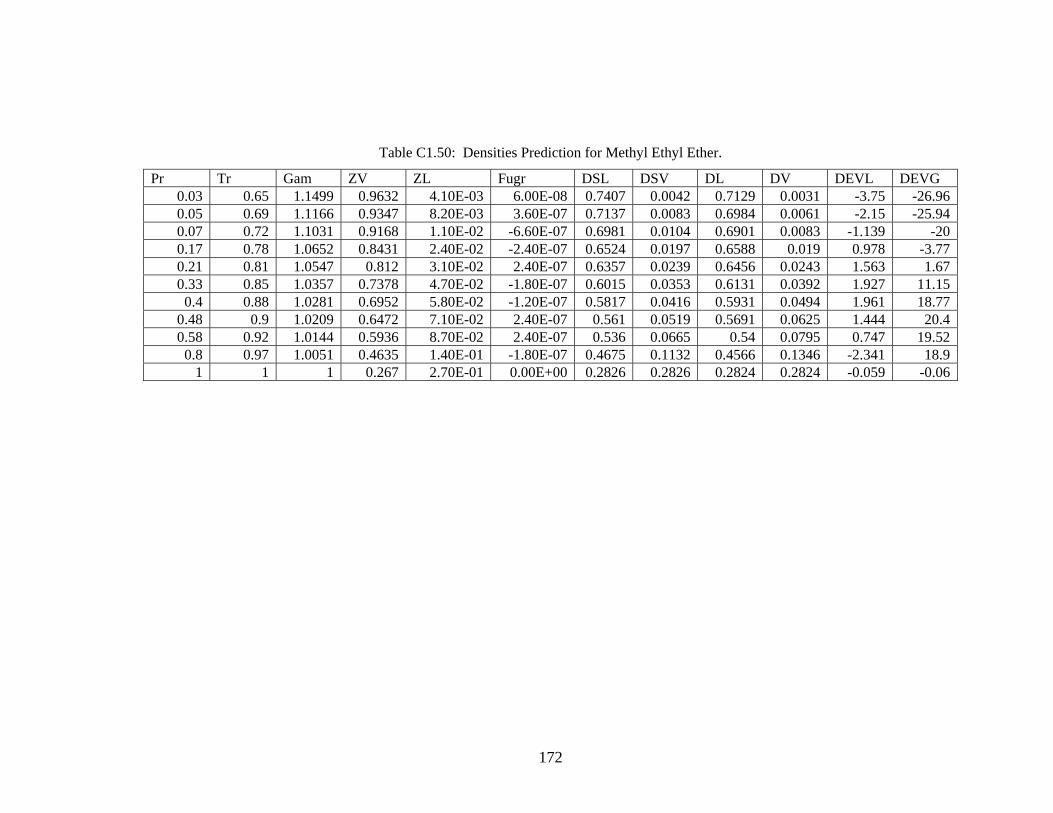
Table C1.50: Densities Prediction for Methyl Ethyl Ether.
Pr Tr Gam ZV ZL Fugr DSL DSV DL DV DEVL DEVG 0.03 0.65 1.1499 0.9632 4.10E-03 6.00E-08 0.7407 0.0042 0.7129 0.0031 -3.75 -26.960.05 0.69 1.1166 0.9347 8.20E-03 3.60E-07 0.7137 0.0083 0.6984 0.0061 -2.15 -25.940.07 0.72 1.1031 0.9168 1.10E-02 -6.60E-07 0.6981 0.0104 0.6901 0.0083 -1.139 -200.17 0.78 1.0652 0.8431 2.40E-02 -2.40E-07 0.6524 0.0197 0.6588 0.019 0.978 -3.770.21 0.81 1.0547 0.812 3.10E-02 2.40E-07 0.6357 0.0239 0.6456 0.0243 1.563 1.670.33 0.85 1.0357 0.7378 4.70E-02 -1.80E-07 0.6015 0.0353 0.6131 0.0392 1.927 11.15
0.4 0.88 1.0281 0.6952 5.80E-02 -1.20E-07 0.5817 0.0416 0.5931 0.0494 1.961 18.770.48 0.9 1.0209 0.6472 7.10E-02 2.40E-07 0.561 0.0519 0.5691 0.0625 1.444 20.40.58 0.92 1.0144 0.5936 8.70E-02 2.40E-07 0.536 0.0665 0.54 0.0795 0.747 19.52
0.8 0.97 1.0051 0.4635 1.40E-01 -1.80E-07 0.4675 0.1132 0.4566 0.1346 -2.341 18.91 1 1 0.267 2.70E-01 0.00E+00 0.2826 0.2826 0.2824 0.2824 -0.059 -0.06
172
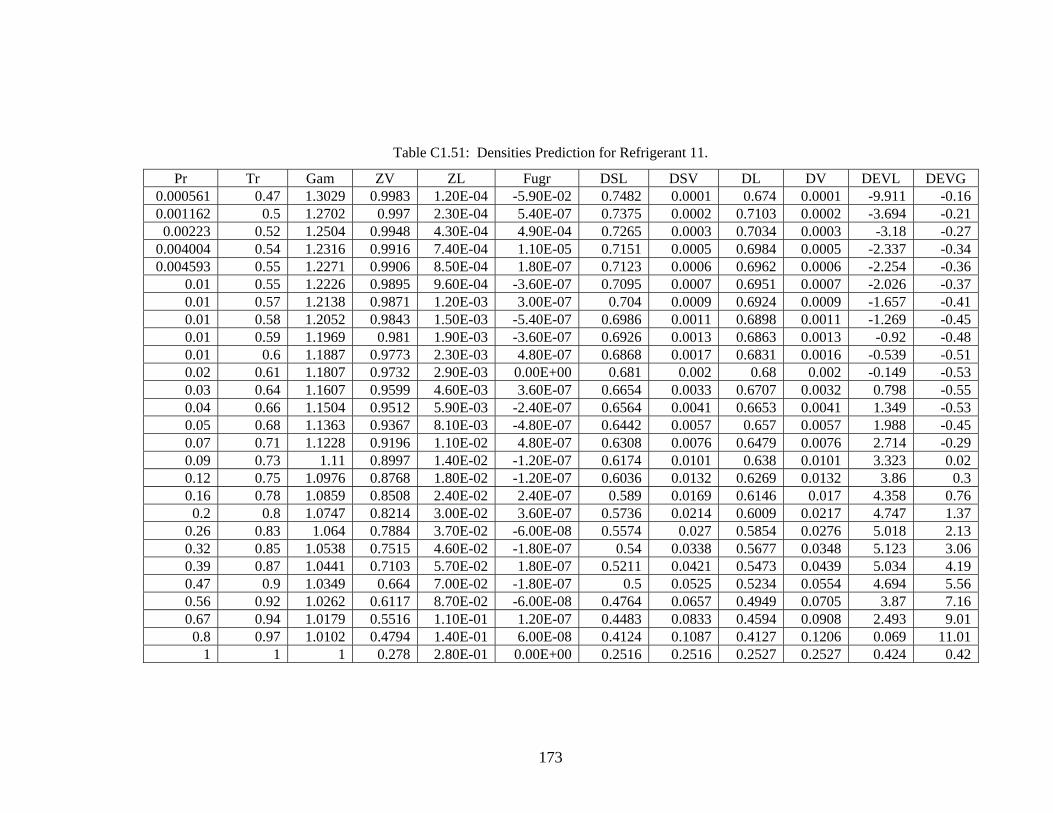
Table C1.51: Densities Prediction for Refrigerant 11.
Pr Tr Gam ZV ZL Fugr DSL DSV DL DV DEVL DEVG 0.000561 0.47 1.3029 0.9983 1.20E-04 -5.90E-02 0.7482 0.0001 0.674 0.0001 -9.911 -0.160.001162 0.5 1.2702 0.997 2.30E-04 5.40E-07 0.7375 0.0002 0.7103 0.0002 -3.694 -0.210.00223 0.52 1.2504 0.9948 4.30E-04 4.90E-04 0.7265 0.0003 0.7034 0.0003 -3.18 -0.27
0.004004 0.54 1.2316 0.9916 7.40E-04 1.10E-05 0.7151 0.0005 0.6984 0.0005 -2.337 -0.340.004593 0.55 1.2271 0.9906 8.50E-04 1.80E-07 0.7123 0.0006 0.6962 0.0006 -2.254 -0.36
0.01 0.55 1.2226 0.9895 9.60E-04 -3.60E-07 0.7095 0.0007 0.6951 0.0007 -2.026 -0.370.01 0.57 1.2138 0.9871 1.20E-03 3.00E-07 0.704 0.0009 0.6924 0.0009 -1.657 -0.410.01 0.58 1.2052 0.9843 1.50E-03 -5.40E-07 0.6986 0.0011 0.6898 0.0011 -1.269 -0.450.01 0.59 1.1969 0.981 1.90E-03 -3.60E-07 0.6926 0.0013 0.6863 0.0013 -0.92 -0.480.01 0.6 1.1887 0.9773 2.30E-03 4.80E-07 0.6868 0.0017 0.6831 0.0016 -0.539 -0.510.02 0.61 1.1807 0.9732 2.90E-03 0.00E+00 0.681 0.002 0.68 0.002 -0.149 -0.530.03 0.64 1.1607 0.9599 4.60E-03 3.60E-07 0.6654 0.0033 0.6707 0.0032 0.798 -0.550.04 0.66 1.1504 0.9512 5.90E-03 -2.40E-07 0.6564 0.0041 0.6653 0.0041 1.349 -0.530.05 0.68 1.1363 0.9367 8.10E-03 -4.80E-07 0.6442 0.0057 0.657 0.0057 1.988 -0.450.07 0.71 1.1228 0.9196 1.10E-02 4.80E-07 0.6308 0.0076 0.6479 0.0076 2.714 -0.290.09 0.73 1.11 0.8997 1.40E-02 -1.20E-07 0.6174 0.0101 0.638 0.0101 3.323 0.020.12 0.75 1.0976 0.8768 1.80E-02 -1.20E-07 0.6036 0.0132 0.6269 0.0132 3.86 0.30.16 0.78 1.0859 0.8508 2.40E-02 2.40E-07 0.589 0.0169 0.6146 0.017 4.358 0.76
0.2 0.8 1.0747 0.8214 3.00E-02 3.60E-07 0.5736 0.0214 0.6009 0.0217 4.747 1.370.26 0.83 1.064 0.7884 3.70E-02 -6.00E-08 0.5574 0.027 0.5854 0.0276 5.018 2.130.32 0.85 1.0538 0.7515 4.60E-02 -1.80E-07 0.54 0.0338 0.5677 0.0348 5.123 3.060.39 0.87 1.0441 0.7103 5.70E-02 1.80E-07 0.5211 0.0421 0.5473 0.0439 5.034 4.190.47 0.9 1.0349 0.664 7.00E-02 -1.80E-07 0.5 0.0525 0.5234 0.0554 4.694 5.560.56 0.92 1.0262 0.6117 8.70E-02 -6.00E-08 0.4764 0.0657 0.4949 0.0705 3.87 7.160.67 0.94 1.0179 0.5516 1.10E-01 1.20E-07 0.4483 0.0833 0.4594 0.0908 2.493 9.01
0.8 0.97 1.0102 0.4794 1.40E-01 6.00E-08 0.4124 0.1087 0.4127 0.1206 0.069 11.011 1 1 0.278 2.80E-01 0.00E+00 0.2516 0.2516 0.2527 0.2527 0.424 0.42
173
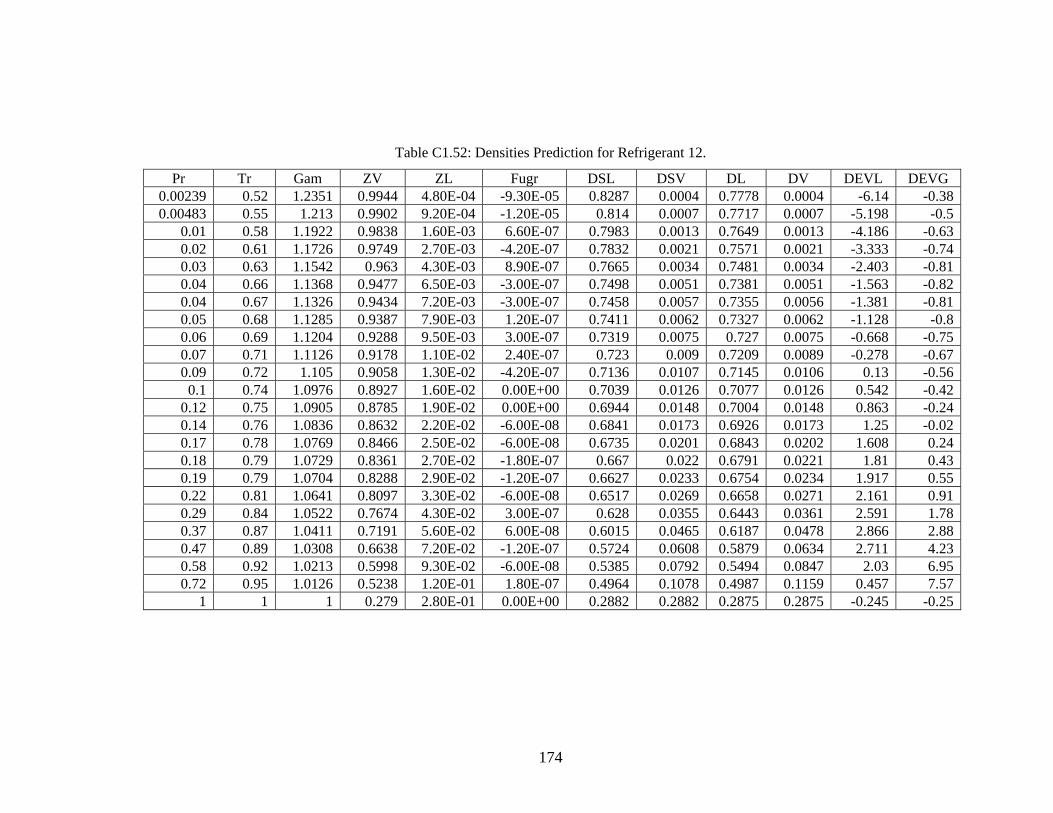
Table C1.52: Densities Prediction for Refrigerant 12.
Pr Tr Gam ZV ZL Fugr DSL DSV DL DV DEVL DEVG 0.00239 0.52 1.2351 0.9944 4.80E-04 -9.30E-05 0.8287 0.0004 0.7778 0.0004 -6.14 -0.380.00483 0.55 1.213 0.9902 9.20E-04 -1.20E-05 0.814 0.0007 0.7717 0.0007 -5.198 -0.5
0.01 0.58 1.1922 0.9838 1.60E-03 6.60E-07 0.7983 0.0013 0.7649 0.0013 -4.186 -0.630.02 0.61 1.1726 0.9749 2.70E-03 -4.20E-07 0.7832 0.0021 0.7571 0.0021 -3.333 -0.740.03 0.63 1.1542 0.963 4.30E-03 8.90E-07 0.7665 0.0034 0.7481 0.0034 -2.403 -0.810.04 0.66 1.1368 0.9477 6.50E-03 -3.00E-07 0.7498 0.0051 0.7381 0.0051 -1.563 -0.820.04 0.67 1.1326 0.9434 7.20E-03 -3.00E-07 0.7458 0.0057 0.7355 0.0056 -1.381 -0.810.05 0.68 1.1285 0.9387 7.90E-03 1.20E-07 0.7411 0.0062 0.7327 0.0062 -1.128 -0.80.06 0.69 1.1204 0.9288 9.50E-03 3.00E-07 0.7319 0.0075 0.727 0.0075 -0.668 -0.750.07 0.71 1.1126 0.9178 1.10E-02 2.40E-07 0.723 0.009 0.7209 0.0089 -0.278 -0.670.09 0.72 1.105 0.9058 1.30E-02 -4.20E-07 0.7136 0.0107 0.7145 0.0106 0.13 -0.56
0.1 0.74 1.0976 0.8927 1.60E-02 0.00E+00 0.7039 0.0126 0.7077 0.0126 0.542 -0.420.12 0.75 1.0905 0.8785 1.90E-02 0.00E+00 0.6944 0.0148 0.7004 0.0148 0.863 -0.240.14 0.76 1.0836 0.8632 2.20E-02 -6.00E-08 0.6841 0.0173 0.6926 0.0173 1.25 -0.020.17 0.78 1.0769 0.8466 2.50E-02 -6.00E-08 0.6735 0.0201 0.6843 0.0202 1.608 0.240.18 0.79 1.0729 0.8361 2.70E-02 -1.80E-07 0.667 0.022 0.6791 0.0221 1.81 0.430.19 0.79 1.0704 0.8288 2.90E-02 -1.20E-07 0.6627 0.0233 0.6754 0.0234 1.917 0.550.22 0.81 1.0641 0.8097 3.30E-02 -6.00E-08 0.6517 0.0269 0.6658 0.0271 2.161 0.910.29 0.84 1.0522 0.7674 4.30E-02 3.00E-07 0.628 0.0355 0.6443 0.0361 2.591 1.780.37 0.87 1.0411 0.7191 5.60E-02 6.00E-08 0.6015 0.0465 0.6187 0.0478 2.866 2.880.47 0.89 1.0308 0.6638 7.20E-02 -1.20E-07 0.5724 0.0608 0.5879 0.0634 2.711 4.230.58 0.92 1.0213 0.5998 9.30E-02 -6.00E-08 0.5385 0.0792 0.5494 0.0847 2.03 6.950.72 0.95 1.0126 0.5238 1.20E-01 1.80E-07 0.4964 0.1078 0.4987 0.1159 0.457 7.57
1 1 1 0.279 2.80E-01 0.00E+00 0.2882 0.2882 0.2875 0.2875 -0.245 -0.25
174
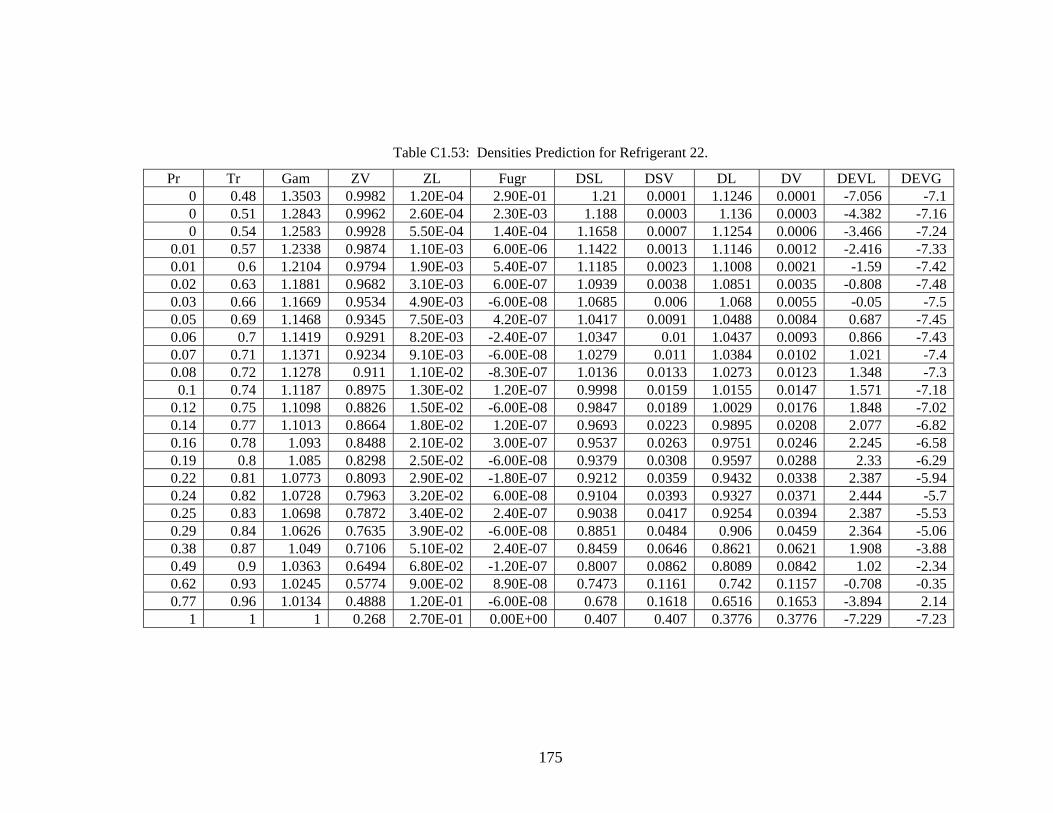
Table C1.53: Densities Prediction for Refrigerant 22.
Pr Tr Gam ZV ZL Fugr DSL DSV DL DV DEVL DEVG 0 0.48 1.3503 0.9982 1.20E-04 2.90E-01 1.21 0.0001 1.1246 0.0001 -7.056 -7.10 0.51 1.2843 0.9962 2.60E-04 2.30E-03 1.188 0.0003 1.136 0.0003 -4.382 -7.160 0.54 1.2583 0.9928 5.50E-04 1.40E-04 1.1658 0.0007 1.1254 0.0006 -3.466 -7.24
0.01 0.57 1.2338 0.9874 1.10E-03 6.00E-06 1.1422 0.0013 1.1146 0.0012 -2.416 -7.330.01 0.6 1.2104 0.9794 1.90E-03 5.40E-07 1.1185 0.0023 1.1008 0.0021 -1.59 -7.420.02 0.63 1.1881 0.9682 3.10E-03 6.00E-07 1.0939 0.0038 1.0851 0.0035 -0.808 -7.480.03 0.66 1.1669 0.9534 4.90E-03 -6.00E-08 1.0685 0.006 1.068 0.0055 -0.05 -7.50.05 0.69 1.1468 0.9345 7.50E-03 4.20E-07 1.0417 0.0091 1.0488 0.0084 0.687 -7.450.06 0.7 1.1419 0.9291 8.20E-03 -2.40E-07 1.0347 0.01 1.0437 0.0093 0.866 -7.430.07 0.71 1.1371 0.9234 9.10E-03 -6.00E-08 1.0279 0.011 1.0384 0.0102 1.021 -7.40.08 0.72 1.1278 0.911 1.10E-02 -8.30E-07 1.0136 0.0133 1.0273 0.0123 1.348 -7.3
0.1 0.74 1.1187 0.8975 1.30E-02 1.20E-07 0.9998 0.0159 1.0155 0.0147 1.571 -7.180.12 0.75 1.1098 0.8826 1.50E-02 -6.00E-08 0.9847 0.0189 1.0029 0.0176 1.848 -7.020.14 0.77 1.1013 0.8664 1.80E-02 1.20E-07 0.9693 0.0223 0.9895 0.0208 2.077 -6.820.16 0.78 1.093 0.8488 2.10E-02 3.00E-07 0.9537 0.0263 0.9751 0.0246 2.245 -6.580.19 0.8 1.085 0.8298 2.50E-02 -6.00E-08 0.9379 0.0308 0.9597 0.0288 2.33 -6.290.22 0.81 1.0773 0.8093 2.90E-02 -1.80E-07 0.9212 0.0359 0.9432 0.0338 2.387 -5.940.24 0.82 1.0728 0.7963 3.20E-02 6.00E-08 0.9104 0.0393 0.9327 0.0371 2.444 -5.70.25 0.83 1.0698 0.7872 3.40E-02 2.40E-07 0.9038 0.0417 0.9254 0.0394 2.387 -5.530.29 0.84 1.0626 0.7635 3.90E-02 -6.00E-08 0.8851 0.0484 0.906 0.0459 2.364 -5.060.38 0.87 1.049 0.7106 5.10E-02 2.40E-07 0.8459 0.0646 0.8621 0.0621 1.908 -3.880.49 0.9 1.0363 0.6494 6.80E-02 -1.20E-07 0.8007 0.0862 0.8089 0.0842 1.02 -2.340.62 0.93 1.0245 0.5774 9.00E-02 8.90E-08 0.7473 0.1161 0.742 0.1157 -0.708 -0.350.77 0.96 1.0134 0.4888 1.20E-01 -6.00E-08 0.678 0.1618 0.6516 0.1653 -3.894 2.14
1 1 1 0.268 2.70E-01 0.00E+00 0.407 0.407 0.3776 0.3776 -7.229 -7.23
175

Table C1.54: Densities Prediction for Refrigerant 32.
Pr Tr Gam ZV ZL Fugr DSL DSV DL DV DEVL DEVG 0 0.49 1.2825 0.9982 1.00E-04 7.10E-02 1.6297 0.0002 1.5104 0.0002 -7.321 -0.28
0.01 0.57 1.2076 0.9898 7.30E-04 -1.80E-07 1.5385 0.0011 1.5179 0.0011 -1.334 2.660.01 0.6 1.1855 0.9824 1.40E-03 -2.30E-06 1.4908 0.0021 1.5009 0.0021 0.678 -0.960.05 0.69 1.126 0.9372 6.10E-03 -1.20E-07 1.3736 0.0095 1.44 0.0094 4.834 -1.60.11 0.76 1.0919 0.8815 1.30E-02 -6.00E-08 1.2907 0.0212 1.3823 0.0209 7.102 -1.640.16 0.79 1.0765 0.8442 1.90E-02 -1.80E-07 1.2407 0.0303 1.346 0.0299 8.491 -1.31
0.3 0.85 1.049 0.7469 3.50E-02 1.80E-07 1.1447 0.0594 1.2509 0.0592 9.281 -0.320.4 0.88 1.0368 0.6849 4.80E-02 -4.20E-07 1.0865 0.0818 1.1865 0.0827 9.209 1.08
0.67 0.95 1.0156 0.5233 8.90E-02 3.00E-07 0.929 0.1616 0.993 0.1697 6.886 50.85 0.98 1.0065 0.409 1.30E-01 -2.20E-04 0.8013 0.2465 0.8221 0.2667 2.597 8.17
1 1 1 0.243 2.40E-01 0.00E+00 0.5156 0.5198 0.5147 0.5147 -0.174 -0.98
Table C1.55: Densities Prediction for Refrigerant 152a.
Pr Tr Gam ZV ZL Fugr DSL DSV DL DV DEVL DEVG 0.000207 0.45 1.394 0.9992 4.30E-05 1.50E+00 1.0853 0 0.9489 0 -12.571 -0.080.000799 0.55 1.177 0.9924 6.10E-04 1.50E-04 1.0223 0.0006 0.9105 0.0006 -10.932 -0.1
0.01 0.6 1.149 0.9802 1.80E-03 3.60E-07 0.9831 0.0017 0.8978 0.0017 -8.679 -0.090.05 0.69 1.1067 0.9398 6.80E-03 1.20E-07 0.9198 0.0063 0.8723 0.0063 -5.165 0.14
0.1 0.75 1.0797 0.8919 1.40E-02 1.80E-07 0.8721 0.013 0.8485 0.0131 -2.705 0.640.19 0.8 1.0548 0.8223 2.50E-02 -5.40E-07 0.8179 0.0248 0.8157 0.0252 -0.269 1.750.33 0.86 1.0333 0.7268 4.40E-02 0.00E+00 0.754 0.045 0.7682 0.0468 1.881 3.850.43 0.89 1.0241 0.6675 5.80E-02 -3.60E-07 0.7162 0.0603 0.7354 0.0636 2.686 5.440.55 0.92 1.0162 0.599 7.50E-02 0.00E+00 0.6717 0.0814 0.6933 0.0871 3.212 7.040.68 0.95 1.0097 0.5185 1.00E-01 8.90E-08 0.6167 0.1142 0.636 0.1221 3.136 6.970.76 0.96 1.007 0.472 1.20E-01 -6.00E-08 0.5821 0.152 0.5982 0.1471 2.774 -3.22
1 1 1 0.25 2.50E-01 0.00E+00 0.3486 0.3486 0.3514 0.3514 0.8 0.8
176
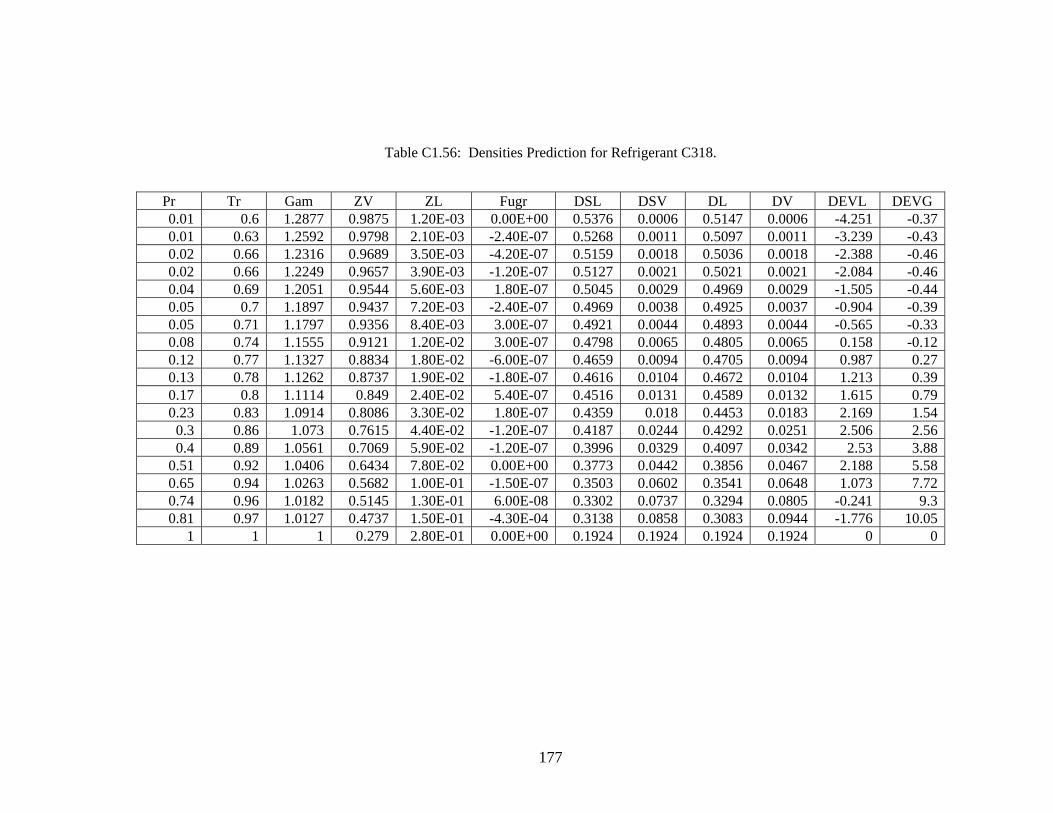
Table C1.56: Densities Prediction for Refrigerant C318.
Pr Tr Gam ZV ZL Fugr DSL DSV DL DV DEVL DEVG 0.01 0.6 1.2877 0.9875 1.20E-03 0.00E+00 0.5376 0.0006 0.5147 0.0006 -4.251 -0.370.01 0.63 1.2592 0.9798 2.10E-03 -2.40E-07 0.5268 0.0011 0.5097 0.0011 -3.239 -0.430.02 0.66 1.2316 0.9689 3.50E-03 -4.20E-07 0.5159 0.0018 0.5036 0.0018 -2.388 -0.460.02 0.66 1.2249 0.9657 3.90E-03 -1.20E-07 0.5127 0.0021 0.5021 0.0021 -2.084 -0.460.04 0.69 1.2051 0.9544 5.60E-03 1.80E-07 0.5045 0.0029 0.4969 0.0029 -1.505 -0.440.05 0.7 1.1897 0.9437 7.20E-03 -2.40E-07 0.4969 0.0038 0.4925 0.0037 -0.904 -0.390.05 0.71 1.1797 0.9356 8.40E-03 3.00E-07 0.4921 0.0044 0.4893 0.0044 -0.565 -0.330.08 0.74 1.1555 0.9121 1.20E-02 3.00E-07 0.4798 0.0065 0.4805 0.0065 0.158 -0.120.12 0.77 1.1327 0.8834 1.80E-02 -6.00E-07 0.4659 0.0094 0.4705 0.0094 0.987 0.270.13 0.78 1.1262 0.8737 1.90E-02 -1.80E-07 0.4616 0.0104 0.4672 0.0104 1.213 0.390.17 0.8 1.1114 0.849 2.40E-02 5.40E-07 0.4516 0.0131 0.4589 0.0132 1.615 0.790.23 0.83 1.0914 0.8086 3.30E-02 1.80E-07 0.4359 0.018 0.4453 0.0183 2.169 1.54
0.3 0.86 1.073 0.7615 4.40E-02 -1.20E-07 0.4187 0.0244 0.4292 0.0251 2.506 2.560.4 0.89 1.0561 0.7069 5.90E-02 -1.20E-07 0.3996 0.0329 0.4097 0.0342 2.53 3.88
0.51 0.92 1.0406 0.6434 7.80E-02 0.00E+00 0.3773 0.0442 0.3856 0.0467 2.188 5.580.65 0.94 1.0263 0.5682 1.00E-01 -1.50E-07 0.3503 0.0602 0.3541 0.0648 1.073 7.720.74 0.96 1.0182 0.5145 1.30E-01 6.00E-08 0.3302 0.0737 0.3294 0.0805 -0.241 9.30.81 0.97 1.0127 0.4737 1.50E-01 -4.30E-04 0.3138 0.0858 0.3083 0.0944 -1.776 10.05
1 1 1 0.279 2.80E-01 0.00E+00 0.1924 0.1924 0.1924 0.1924 0 0
177
C.2 Results for the Peng-Robinson Equation of State.
178
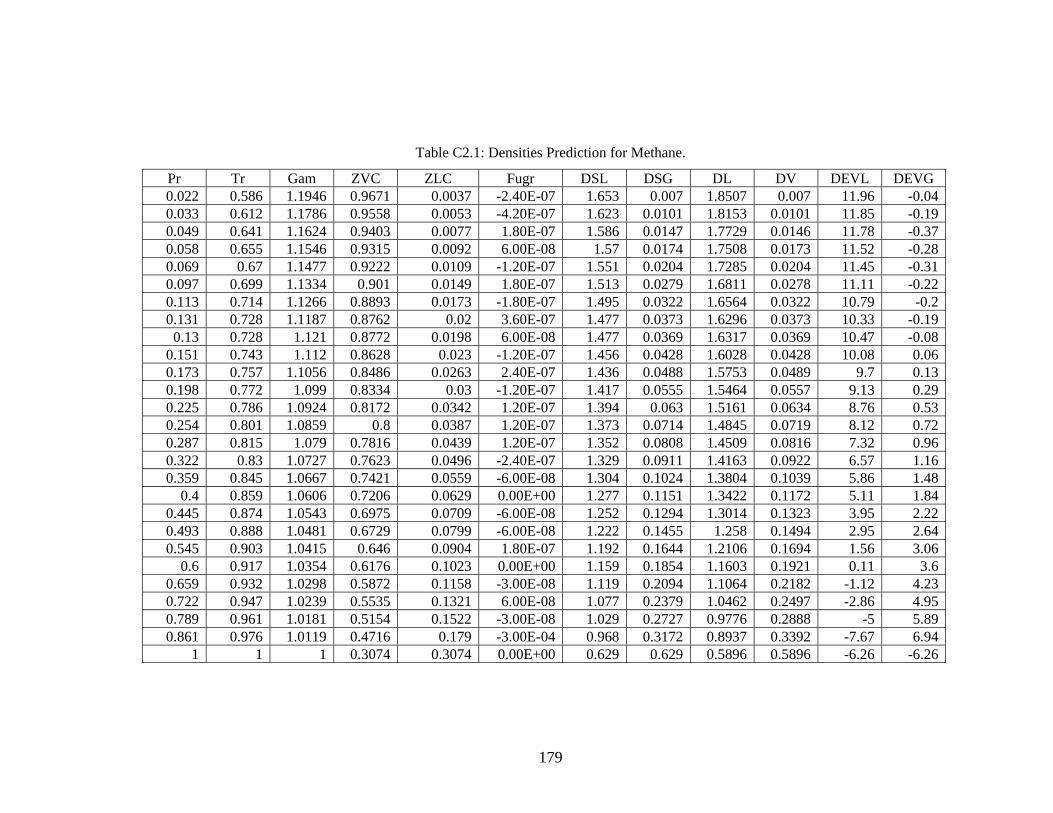
Table C2.1: Densities Prediction for Methane.
Pr Tr Gam ZVC ZLC Fugr DSL DSG DL DV DEVL DEVG0.022 0.586 1.1946 0.9671 0.0037 -2.40E-07 1.653 0.007 1.8507 0.007 11.96 -0.040.033 0.612 1.1786 0.9558 0.0053 -4.20E-07 1.623 0.0101 1.8153 0.0101 11.85 -0.190.049 0.641 1.1624 0.9403 0.0077 1.80E-07 1.586 0.0147 1.7729 0.0146 11.78 -0.370.058 0.655 1.1546 0.9315 0.0092 6.00E-08 1.57 0.0174 1.7508 0.0173 11.52 -0.280.069 0.67 1.1477 0.9222 0.0109 -1.20E-07 1.551 0.0204 1.7285 0.0204 11.45 -0.310.097 0.699 1.1334 0.901 0.0149 1.80E-07 1.513 0.0279 1.6811 0.0278 11.11 -0.220.113 0.714 1.1266 0.8893 0.0173 -1.80E-07 1.495 0.0322 1.6564 0.0322 10.79 -0.20.131 0.728 1.1187 0.8762 0.02 3.60E-07 1.477 0.0373 1.6296 0.0373 10.33 -0.190.13 0.728 1.121 0.8772 0.0198 6.00E-08 1.477 0.0369 1.6317 0.0369 10.47 -0.08
0.151 0.743 1.112 0.8628 0.023 -1.20E-07 1.456 0.0428 1.6028 0.0428 10.08 0.060.173 0.757 1.1056 0.8486 0.0263 2.40E-07 1.436 0.0488 1.5753 0.0489 9.7 0.130.198 0.772 1.099 0.8334 0.03 -1.20E-07 1.417 0.0555 1.5464 0.0557 9.13 0.290.225 0.786 1.0924 0.8172 0.0342 1.20E-07 1.394 0.063 1.5161 0.0634 8.76 0.530.254 0.801 1.0859 0.8 0.0387 1.20E-07 1.373 0.0714 1.4845 0.0719 8.12 0.720.287 0.815 1.079 0.7816 0.0439 1.20E-07 1.352 0.0808 1.4509 0.0816 7.32 0.960.322 0.83 1.0727 0.7623 0.0496 -2.40E-07 1.329 0.0911 1.4163 0.0922 6.57 1.160.359 0.845 1.0667 0.7421 0.0559 -6.00E-08 1.304 0.1024 1.3804 0.1039 5.86 1.48
0.4 0.859 1.0606 0.7206 0.0629 0.00E+00 1.277 0.1151 1.3422 0.1172 5.11 1.840.445 0.874 1.0543 0.6975 0.0709 -6.00E-08 1.252 0.1294 1.3014 0.1323 3.95 2.220.493 0.888 1.0481 0.6729 0.0799 -6.00E-08 1.222 0.1455 1.258 0.1494 2.95 2.640.545 0.903 1.0415 0.646 0.0904 1.80E-07 1.192 0.1644 1.2106 0.1694 1.56 3.06
0.6 0.917 1.0354 0.6176 0.1023 0.00E+00 1.159 0.1854 1.1603 0.1921 0.11 3.60.659 0.932 1.0298 0.5872 0.1158 -3.00E-08 1.119 0.2094 1.1064 0.2182 -1.12 4.230.722 0.947 1.0239 0.5535 0.1321 6.00E-08 1.077 0.2379 1.0462 0.2497 -2.86 4.950.789 0.961 1.0181 0.5154 0.1522 -3.00E-08 1.029 0.2727 0.9776 0.2888 -5 5.890.861 0.976 1.0119 0.4716 0.179 -3.00E-04 0.968 0.3172 0.8937 0.3392 -7.67 6.94
1 1 1 0.3074 0.3074 0.00E+00 0.629 0.629 0.5896 0.5896 -6.26 -6.26
179
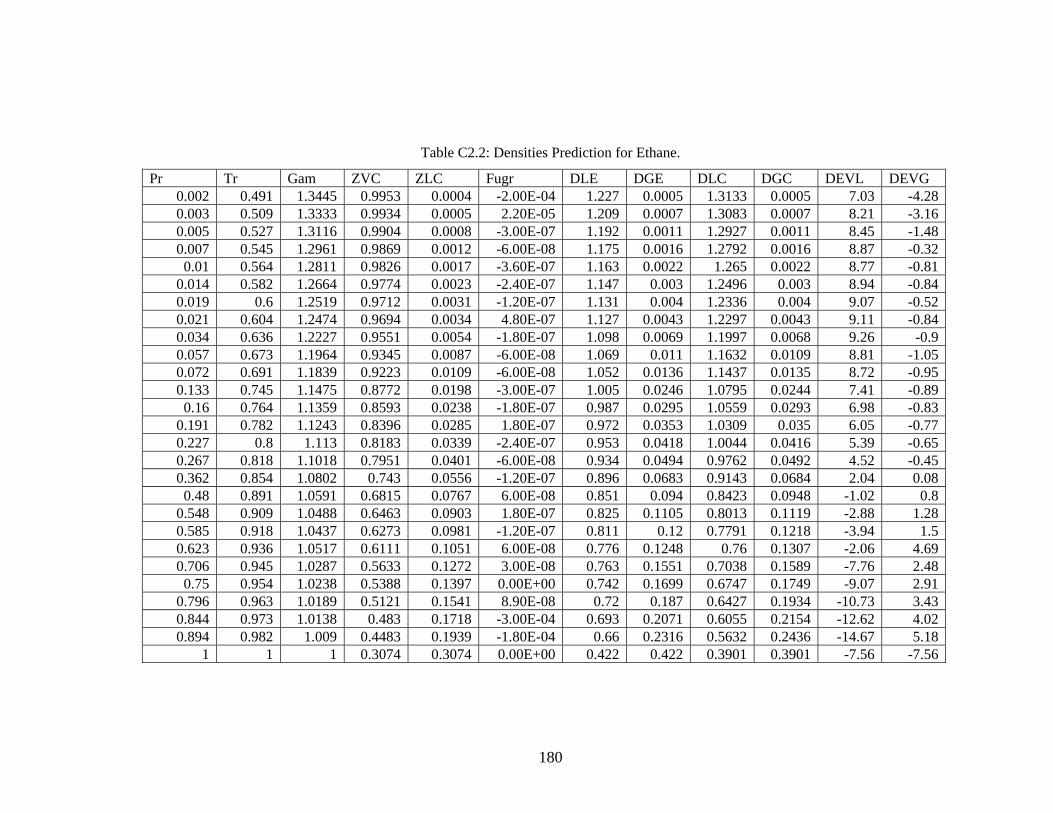
Table C2.2: Densities Prediction for Ethane.
Pr Tr Gam ZVC ZLC Fugr DLE DGE DLC DGC DEVL DEVG0.002 0.491 1.3445 0.9953 0.0004 -2.00E-04 1.227 0.0005 1.3133 0.0005 7.03 -4.280.003 0.509 1.3333 0.9934 0.0005 2.20E-05 1.209 0.0007 1.3083 0.0007 8.21 -3.160.005 0.527 1.3116 0.9904 0.0008 -3.00E-07 1.192 0.0011 1.2927 0.0011 8.45 -1.480.007 0.545 1.2961 0.9869 0.0012 -6.00E-08 1.175 0.0016 1.2792 0.0016 8.87 -0.320.01 0.564 1.2811 0.9826 0.0017 -3.60E-07 1.163 0.0022 1.265 0.0022 8.77 -0.81
0.014 0.582 1.2664 0.9774 0.0023 -2.40E-07 1.147 0.003 1.2496 0.003 8.94 -0.840.019 0.6 1.2519 0.9712 0.0031 -1.20E-07 1.131 0.004 1.2336 0.004 9.07 -0.520.021 0.604 1.2474 0.9694 0.0034 4.80E-07 1.127 0.0043 1.2297 0.0043 9.11 -0.840.034 0.636 1.2227 0.9551 0.0054 -1.80E-07 1.098 0.0069 1.1997 0.0068 9.26 -0.90.057 0.673 1.1964 0.9345 0.0087 -6.00E-08 1.069 0.011 1.1632 0.0109 8.81 -1.050.072 0.691 1.1839 0.9223 0.0109 -6.00E-08 1.052 0.0136 1.1437 0.0135 8.72 -0.950.133 0.745 1.1475 0.8772 0.0198 -3.00E-07 1.005 0.0246 1.0795 0.0244 7.41 -0.890.16 0.764 1.1359 0.8593 0.0238 -1.80E-07 0.987 0.0295 1.0559 0.0293 6.98 -0.83
0.191 0.782 1.1243 0.8396 0.0285 1.80E-07 0.972 0.0353 1.0309 0.035 6.05 -0.770.227 0.8 1.113 0.8183 0.0339 -2.40E-07 0.953 0.0418 1.0044 0.0416 5.39 -0.650.267 0.818 1.1018 0.7951 0.0401 -6.00E-08 0.934 0.0494 0.9762 0.0492 4.52 -0.450.362 0.854 1.0802 0.743 0.0556 -1.20E-07 0.896 0.0683 0.9143 0.0684 2.04 0.080.48 0.891 1.0591 0.6815 0.0767 6.00E-08 0.851 0.094 0.8423 0.0948 -1.02 0.8
0.548 0.909 1.0488 0.6463 0.0903 1.80E-07 0.825 0.1105 0.8013 0.1119 -2.88 1.280.585 0.918 1.0437 0.6273 0.0981 -1.20E-07 0.811 0.12 0.7791 0.1218 -3.94 1.50.623 0.936 1.0517 0.6111 0.1051 6.00E-08 0.776 0.1248 0.76 0.1307 -2.06 4.690.706 0.945 1.0287 0.5633 0.1272 3.00E-08 0.763 0.1551 0.7038 0.1589 -7.76 2.480.75 0.954 1.0238 0.5388 0.1397 0.00E+00 0.742 0.1699 0.6747 0.1749 -9.07 2.91
0.796 0.963 1.0189 0.5121 0.1541 8.90E-08 0.72 0.187 0.6427 0.1934 -10.73 3.430.844 0.973 1.0138 0.483 0.1718 -3.00E-04 0.693 0.2071 0.6055 0.2154 -12.62 4.020.894 0.982 1.009 0.4483 0.1939 -1.80E-04 0.66 0.2316 0.5632 0.2436 -14.67 5.18
1 1 1 0.3074 0.3074 0.00E+00 0.422 0.422 0.3901 0.3901 -7.56 -7.56
180
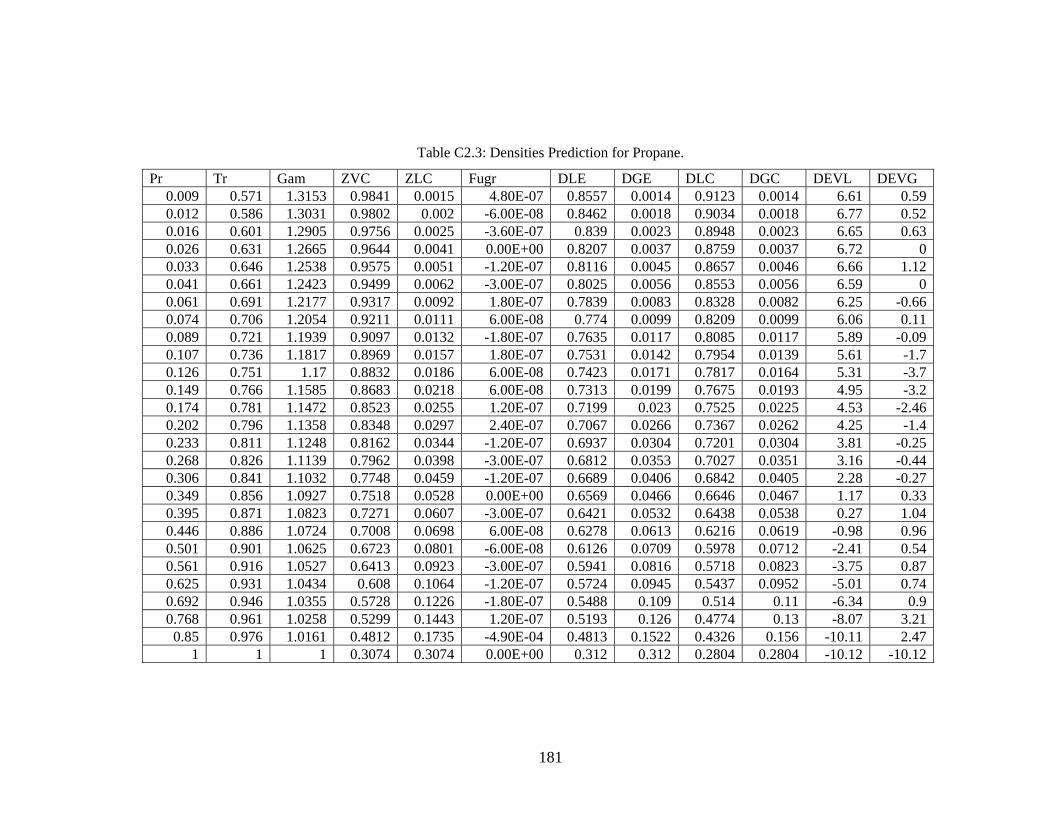
Table C2.3: Densities Prediction for Propane.
Pr Tr Gam ZVC ZLC Fugr DLE DGE DLC DGC DEVL DEVG0.009 0.571 1.3153 0.9841 0.0015 4.80E-07 0.8557 0.0014 0.9123 0.0014 6.61 0.590.012 0.586 1.3031 0.9802 0.002 -6.00E-08 0.8462 0.0018 0.9034 0.0018 6.77 0.520.016 0.601 1.2905 0.9756 0.0025 -3.60E-07 0.839 0.0023 0.8948 0.0023 6.65 0.630.026 0.631 1.2665 0.9644 0.0041 0.00E+00 0.8207 0.0037 0.8759 0.0037 6.72 00.033 0.646 1.2538 0.9575 0.0051 -1.20E-07 0.8116 0.0045 0.8657 0.0046 6.66 1.120.041 0.661 1.2423 0.9499 0.0062 -3.00E-07 0.8025 0.0056 0.8553 0.0056 6.59 00.061 0.691 1.2177 0.9317 0.0092 1.80E-07 0.7839 0.0083 0.8328 0.0082 6.25 -0.660.074 0.706 1.2054 0.9211 0.0111 6.00E-08 0.774 0.0099 0.8209 0.0099 6.06 0.110.089 0.721 1.1939 0.9097 0.0132 -1.80E-07 0.7635 0.0117 0.8085 0.0117 5.89 -0.090.107 0.736 1.1817 0.8969 0.0157 1.80E-07 0.7531 0.0142 0.7954 0.0139 5.61 -1.70.126 0.751 1.17 0.8832 0.0186 6.00E-08 0.7423 0.0171 0.7817 0.0164 5.31 -3.70.149 0.766 1.1585 0.8683 0.0218 6.00E-08 0.7313 0.0199 0.7675 0.0193 4.95 -3.20.174 0.781 1.1472 0.8523 0.0255 1.20E-07 0.7199 0.023 0.7525 0.0225 4.53 -2.460.202 0.796 1.1358 0.8348 0.0297 2.40E-07 0.7067 0.0266 0.7367 0.0262 4.25 -1.40.233 0.811 1.1248 0.8162 0.0344 -1.20E-07 0.6937 0.0304 0.7201 0.0304 3.81 -0.250.268 0.826 1.1139 0.7962 0.0398 -3.00E-07 0.6812 0.0353 0.7027 0.0351 3.16 -0.440.306 0.841 1.1032 0.7748 0.0459 -1.20E-07 0.6689 0.0406 0.6842 0.0405 2.28 -0.270.349 0.856 1.0927 0.7518 0.0528 0.00E+00 0.6569 0.0466 0.6646 0.0467 1.17 0.330.395 0.871 1.0823 0.7271 0.0607 -3.00E-07 0.6421 0.0532 0.6438 0.0538 0.27 1.040.446 0.886 1.0724 0.7008 0.0698 6.00E-08 0.6278 0.0613 0.6216 0.0619 -0.98 0.960.501 0.901 1.0625 0.6723 0.0801 -6.00E-08 0.6126 0.0709 0.5978 0.0712 -2.41 0.540.561 0.916 1.0527 0.6413 0.0923 -3.00E-07 0.5941 0.0816 0.5718 0.0823 -3.75 0.870.625 0.931 1.0434 0.608 0.1064 -1.20E-07 0.5724 0.0945 0.5437 0.0952 -5.01 0.740.692 0.946 1.0355 0.5728 0.1226 -1.80E-07 0.5488 0.109 0.514 0.11 -6.34 0.90.768 0.961 1.0258 0.5299 0.1443 1.20E-07 0.5193 0.126 0.4774 0.13 -8.07 3.210.85 0.976 1.0161 0.4812 0.1735 -4.90E-04 0.4813 0.1522 0.4326 0.156 -10.11 2.47
1 1 1 0.3074 0.3074 0.00E+00 0.312 0.312 0.2804 0.2804 -10.12 -10.12
181
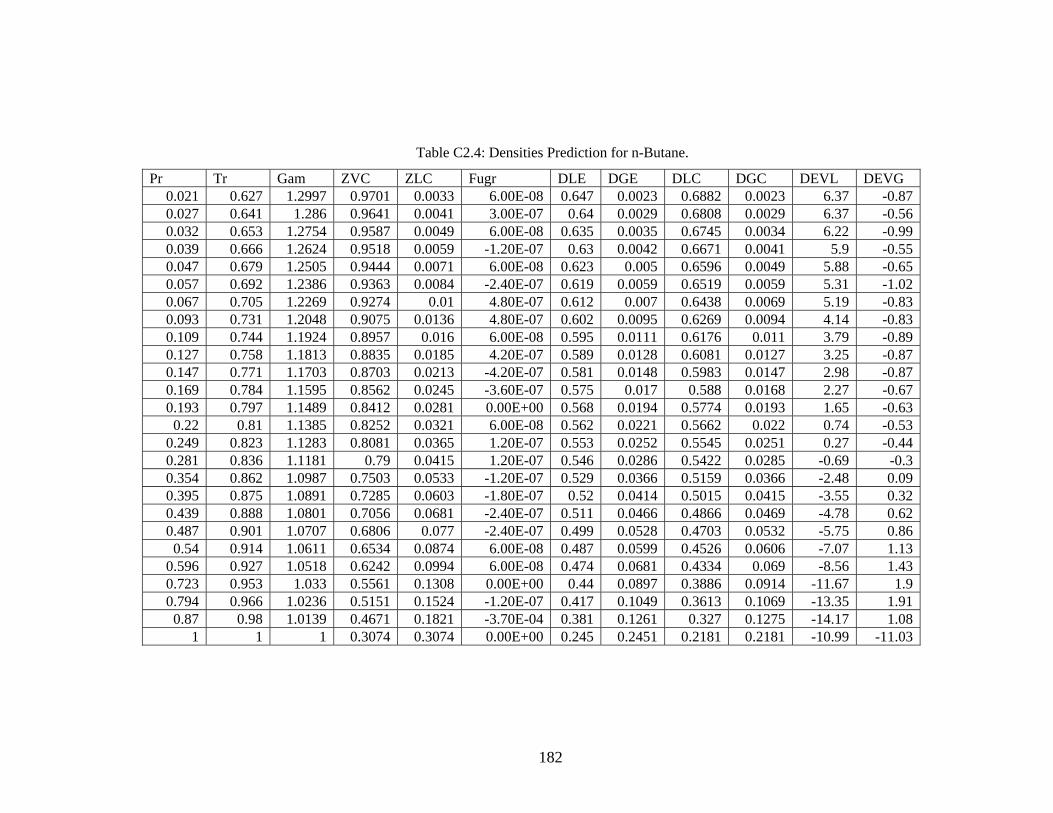
Table C2.4: Densities Prediction for n-Butane.
Pr Tr Gam ZVC ZLC Fugr DLE DGE DLC DGC DEVL DEVG0.021 0.627 1.2997 0.9701 0.0033 6.00E-08 0.647 0.0023 0.6882 0.0023 6.37 -0.870.027 0.641 1.286 0.9641 0.0041 3.00E-07 0.64 0.0029 0.6808 0.0029 6.37 -0.560.032 0.653 1.2754 0.9587 0.0049 6.00E-08 0.635 0.0035 0.6745 0.0034 6.22 -0.990.039 0.666 1.2624 0.9518 0.0059 -1.20E-07 0.63 0.0042 0.6671 0.0041 5.9 -0.550.047 0.679 1.2505 0.9444 0.0071 6.00E-08 0.623 0.005 0.6596 0.0049 5.88 -0.650.057 0.692 1.2386 0.9363 0.0084 -2.40E-07 0.619 0.0059 0.6519 0.0059 5.31 -1.020.067 0.705 1.2269 0.9274 0.01 4.80E-07 0.612 0.007 0.6438 0.0069 5.19 -0.830.093 0.731 1.2048 0.9075 0.0136 4.80E-07 0.602 0.0095 0.6269 0.0094 4.14 -0.830.109 0.744 1.1924 0.8957 0.016 6.00E-08 0.595 0.0111 0.6176 0.011 3.79 -0.890.127 0.758 1.1813 0.8835 0.0185 4.20E-07 0.589 0.0128 0.6081 0.0127 3.25 -0.870.147 0.771 1.1703 0.8703 0.0213 -4.20E-07 0.581 0.0148 0.5983 0.0147 2.98 -0.870.169 0.784 1.1595 0.8562 0.0245 -3.60E-07 0.575 0.017 0.588 0.0168 2.27 -0.670.193 0.797 1.1489 0.8412 0.0281 0.00E+00 0.568 0.0194 0.5774 0.0193 1.65 -0.630.22 0.81 1.1385 0.8252 0.0321 6.00E-08 0.562 0.0221 0.5662 0.022 0.74 -0.53
0.249 0.823 1.1283 0.8081 0.0365 1.20E-07 0.553 0.0252 0.5545 0.0251 0.27 -0.440.281 0.836 1.1181 0.79 0.0415 1.20E-07 0.546 0.0286 0.5422 0.0285 -0.69 -0.30.354 0.862 1.0987 0.7503 0.0533 -1.20E-07 0.529 0.0366 0.5159 0.0366 -2.48 0.090.395 0.875 1.0891 0.7285 0.0603 -1.80E-07 0.52 0.0414 0.5015 0.0415 -3.55 0.320.439 0.888 1.0801 0.7056 0.0681 -2.40E-07 0.511 0.0466 0.4866 0.0469 -4.78 0.620.487 0.901 1.0707 0.6806 0.077 -2.40E-07 0.499 0.0528 0.4703 0.0532 -5.75 0.860.54 0.914 1.0611 0.6534 0.0874 6.00E-08 0.487 0.0599 0.4526 0.0606 -7.07 1.13
0.596 0.927 1.0518 0.6242 0.0994 6.00E-08 0.474 0.0681 0.4334 0.069 -8.56 1.430.723 0.953 1.033 0.5561 0.1308 0.00E+00 0.44 0.0897 0.3886 0.0914 -11.67 1.90.794 0.966 1.0236 0.5151 0.1524 -1.20E-07 0.417 0.1049 0.3613 0.1069 -13.35 1.910.87 0.98 1.0139 0.4671 0.1821 -3.70E-04 0.381 0.1261 0.327 0.1275 -14.17 1.08
1 1 1 0.3074 0.3074 0.00E+00 0.245 0.2451 0.2181 0.2181 -10.99 -11.03
182

Table C2.5: Densities Prediction for i-Butane.
Pr Tr Gam ZVC ZLC Fugr DLE DGE DLC DGC DEVL DEVG0.001 0.497 1.4279 0.9968 0.0002 1.30E-03 0.702 0.0002 0.747 0.0002 6.42 0.950.004 0.537 1.3816 0.9924 0.0006 -2.10E-05 0.685 0.0005 0.7272 0.0005 6.17 0.780.005 0.551 1.3664 0.9902 0.0009 -6.00E-07 0.677 0.0006 0.7228 0.0006 6.77 0.450.009 0.578 1.3374 0.9844 0.0015 -4.80E-07 0.667 0.0011 0.7107 0.0011 6.55 -0.070.012 0.592 1.3236 0.9808 0.0019 -7.70E-07 0.662 0.0014 0.7044 0.0014 6.41 -0.750.022 0.626 1.2903 0.9691 0.0034 3.60E-07 0.647 0.0024 0.6876 0.0024 6.27 -0.810.027 0.639 1.2774 0.9633 0.0042 4.20E-07 0.64 0.003 0.6804 0.003 6.32 -0.470.034 0.653 1.2649 0.9569 0.0051 -6.00E-07 0.633 0.0036 0.6731 0.0036 6.34 -0.390.041 0.667 1.2525 0.9497 0.0062 6.00E-08 0.628 0.0044 0.6655 0.0044 5.97 -0.410.05 0.68 1.2404 0.9418 0.0075 1.80E-07 0.621 0.0053 0.6576 0.0052 5.9 -0.36
0.072 0.708 1.2169 0.9235 0.0106 1.20E-07 0.608 0.0074 0.641 0.0074 5.43 -0.240.085 0.721 1.2056 0.9132 0.0125 4.80E-07 0.6 0.0087 0.6322 0.0087 5.37 -0.160.117 0.748 1.1836 0.8901 0.0171 4.20E-07 0.585 0.0118 0.6137 0.0118 4.91 0.030.136 0.762 1.1727 0.8771 0.0199 3.60E-07 0.577 0.0136 0.6038 0.0137 4.65 0.290.181 0.789 1.1517 0.8483 0.0264 1.20E-07 0.56 0.018 0.5829 0.0181 4.09 0.680.207 0.803 1.141 0.8322 0.0303 -6.00E-08 0.551 0.0207 0.5715 0.0208 3.73 0.80.268 0.83 1.1203 0.7968 0.0396 1.20E-07 0.533 0.0269 0.5473 0.0272 2.68 1.280.342 0.857 1.1001 0.7563 0.0514 0.00E+00 0.511 0.0347 0.5203 0.0354 1.82 1.960.384 0.871 1.0902 0.7341 0.0585 -1.20E-07 0.499 0.0394 0.5056 0.0403 1.33 2.310.479 0.898 1.0706 0.6844 0.0756 -6.00E-08 0.471 0.0507 0.4732 0.0523 0.46 3.220.533 0.912 1.0609 0.6567 0.0861 -6.00E-08 0.455 0.0575 0.4551 0.0597 0.02 3.750.654 0.939 1.0418 0.5936 0.1129 1.80E-07 0.416 0.075 0.4137 0.0787 -0.55 4.970.721 0.952 1.0324 0.5569 0.1304 -6.00E-08 0.391 0.0863 0.3895 0.0912 -0.39 5.660.794 0.966 1.023 0.5149 0.1526 -6.00E-08 0.361 0.1006 0.3615 0.1071 0.13 6.450.872 0.98 1.0134 0.4658 0.1831 -3.90E-04 0.326 0.1199 0.3263 0.1282 0.08 6.94
1 1 1 0.3074 0.3074 0.00E+00 0.238 0.2377 0.2183 0.2183 -8.3 -8.16
183
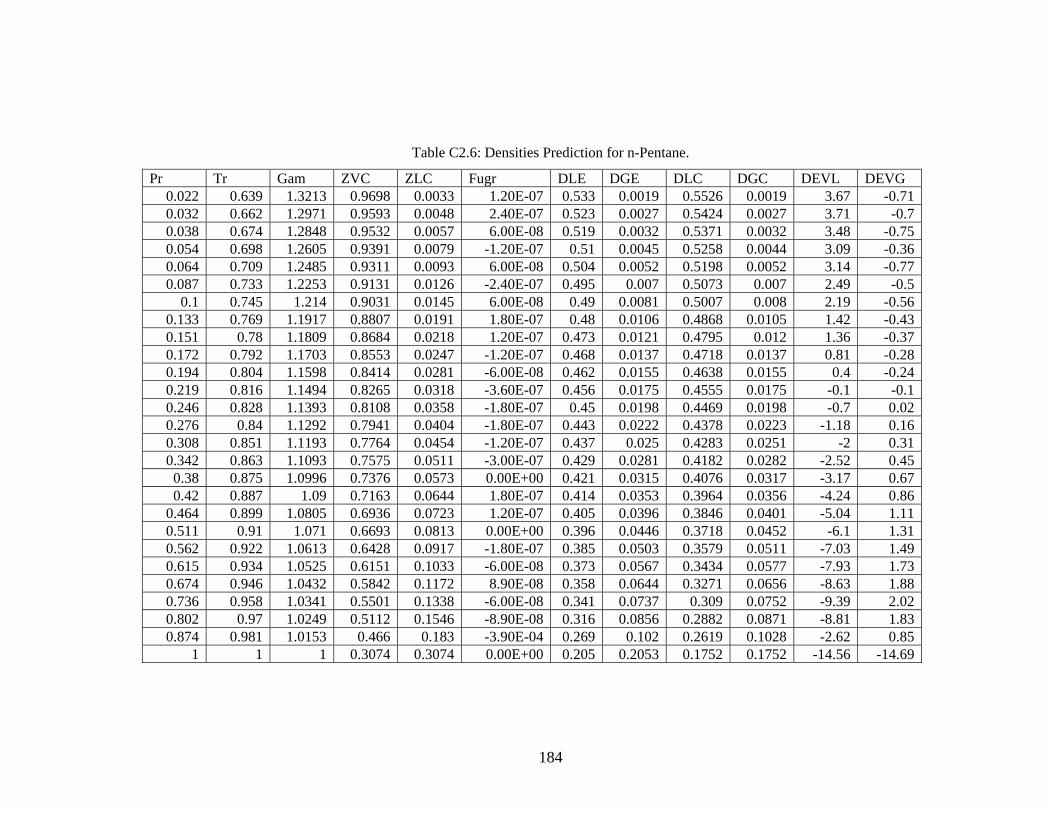
Table C2.6: Densities Prediction for n-Pentane.
Pr Tr Gam ZVC ZLC Fugr DLE DGE DLC DGC DEVL DEVG0.022 0.639 1.3213 0.9698 0.0033 1.20E-07 0.533 0.0019 0.5526 0.0019 3.67 -0.710.032 0.662 1.2971 0.9593 0.0048 2.40E-07 0.523 0.0027 0.5424 0.0027 3.71 -0.70.038 0.674 1.2848 0.9532 0.0057 6.00E-08 0.519 0.0032 0.5371 0.0032 3.48 -0.750.054 0.698 1.2605 0.9391 0.0079 -1.20E-07 0.51 0.0045 0.5258 0.0044 3.09 -0.360.064 0.709 1.2485 0.9311 0.0093 6.00E-08 0.504 0.0052 0.5198 0.0052 3.14 -0.770.087 0.733 1.2253 0.9131 0.0126 -2.40E-07 0.495 0.007 0.5073 0.007 2.49 -0.5
0.1 0.745 1.214 0.9031 0.0145 6.00E-08 0.49 0.0081 0.5007 0.008 2.19 -0.560.133 0.769 1.1917 0.8807 0.0191 1.80E-07 0.48 0.0106 0.4868 0.0105 1.42 -0.430.151 0.78 1.1809 0.8684 0.0218 1.20E-07 0.473 0.0121 0.4795 0.012 1.36 -0.370.172 0.792 1.1703 0.8553 0.0247 -1.20E-07 0.468 0.0137 0.4718 0.0137 0.81 -0.280.194 0.804 1.1598 0.8414 0.0281 -6.00E-08 0.462 0.0155 0.4638 0.0155 0.4 -0.240.219 0.816 1.1494 0.8265 0.0318 -3.60E-07 0.456 0.0175 0.4555 0.0175 -0.1 -0.10.246 0.828 1.1393 0.8108 0.0358 -1.80E-07 0.45 0.0198 0.4469 0.0198 -0.7 0.020.276 0.84 1.1292 0.7941 0.0404 -1.80E-07 0.443 0.0222 0.4378 0.0223 -1.18 0.160.308 0.851 1.1193 0.7764 0.0454 -1.20E-07 0.437 0.025 0.4283 0.0251 -2 0.310.342 0.863 1.1093 0.7575 0.0511 -3.00E-07 0.429 0.0281 0.4182 0.0282 -2.52 0.450.38 0.875 1.0996 0.7376 0.0573 0.00E+00 0.421 0.0315 0.4076 0.0317 -3.17 0.670.42 0.887 1.09 0.7163 0.0644 1.80E-07 0.414 0.0353 0.3964 0.0356 -4.24 0.86
0.464 0.899 1.0805 0.6936 0.0723 1.20E-07 0.405 0.0396 0.3846 0.0401 -5.04 1.110.511 0.91 1.071 0.6693 0.0813 0.00E+00 0.396 0.0446 0.3718 0.0452 -6.1 1.310.562 0.922 1.0613 0.6428 0.0917 -1.80E-07 0.385 0.0503 0.3579 0.0511 -7.03 1.490.615 0.934 1.0525 0.6151 0.1033 -6.00E-08 0.373 0.0567 0.3434 0.0577 -7.93 1.730.674 0.946 1.0432 0.5842 0.1172 8.90E-08 0.358 0.0644 0.3271 0.0656 -8.63 1.880.736 0.958 1.0341 0.5501 0.1338 -6.00E-08 0.341 0.0737 0.309 0.0752 -9.39 2.020.802 0.97 1.0249 0.5112 0.1546 -8.90E-08 0.316 0.0856 0.2882 0.0871 -8.81 1.830.874 0.981 1.0153 0.466 0.183 -3.90E-04 0.269 0.102 0.2619 0.1028 -2.62 0.85
1 1 1 0.3074 0.3074 0.00E+00 0.205 0.2053 0.1752 0.1752 -14.56 -14.69
184
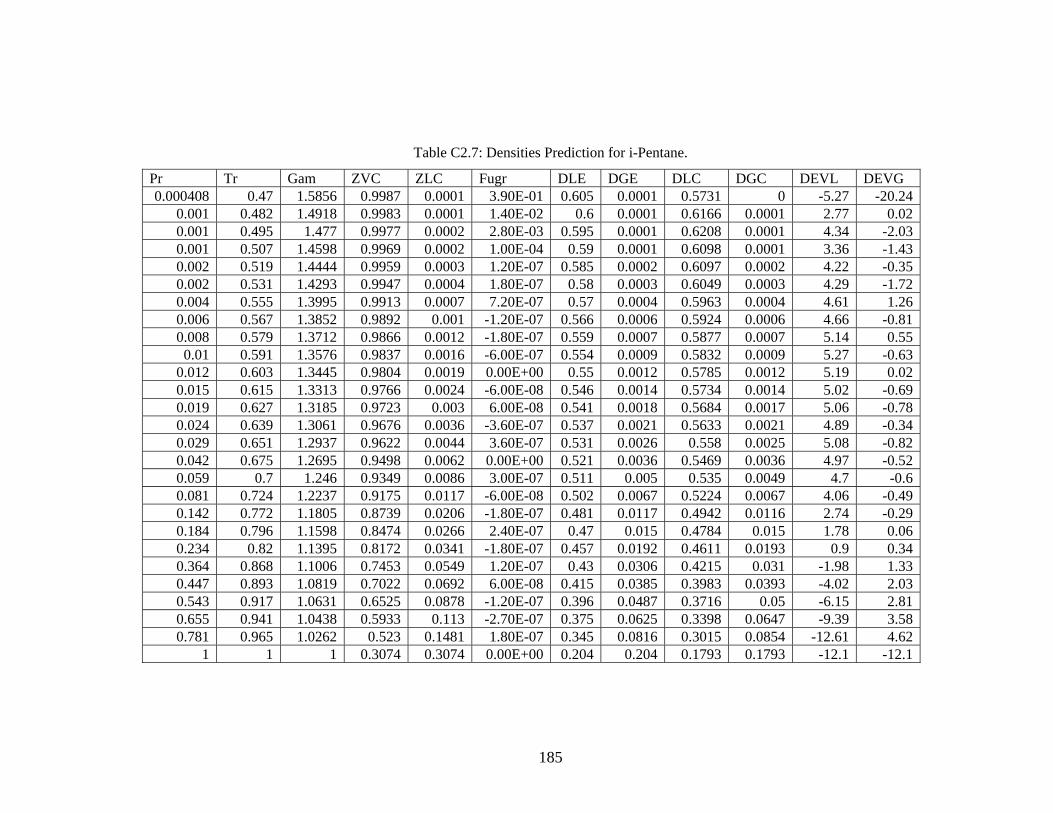
Table C2.7: Densities Prediction for i-Pentane.
Pr Tr Gam ZVC ZLC Fugr DLE DGE DLC DGC DEVL DEVG0.000408 0.47 1.5856 0.9987 0.0001 3.90E-01 0.605 0.0001 0.5731 0 -5.27 -20.24
0.001 0.482 1.4918 0.9983 0.0001 1.40E-02 0.6 0.0001 0.6166 0.0001 2.77 0.020.001 0.495 1.477 0.9977 0.0002 2.80E-03 0.595 0.0001 0.6208 0.0001 4.34 -2.030.001 0.507 1.4598 0.9969 0.0002 1.00E-04 0.59 0.0001 0.6098 0.0001 3.36 -1.430.002 0.519 1.4444 0.9959 0.0003 1.20E-07 0.585 0.0002 0.6097 0.0002 4.22 -0.350.002 0.531 1.4293 0.9947 0.0004 1.80E-07 0.58 0.0003 0.6049 0.0003 4.29 -1.720.004 0.555 1.3995 0.9913 0.0007 7.20E-07 0.57 0.0004 0.5963 0.0004 4.61 1.260.006 0.567 1.3852 0.9892 0.001 -1.20E-07 0.566 0.0006 0.5924 0.0006 4.66 -0.810.008 0.579 1.3712 0.9866 0.0012 -1.80E-07 0.559 0.0007 0.5877 0.0007 5.14 0.550.01 0.591 1.3576 0.9837 0.0016 -6.00E-07 0.554 0.0009 0.5832 0.0009 5.27 -0.63
0.012 0.603 1.3445 0.9804 0.0019 0.00E+00 0.55 0.0012 0.5785 0.0012 5.19 0.020.015 0.615 1.3313 0.9766 0.0024 -6.00E-08 0.546 0.0014 0.5734 0.0014 5.02 -0.690.019 0.627 1.3185 0.9723 0.003 6.00E-08 0.541 0.0018 0.5684 0.0017 5.06 -0.780.024 0.639 1.3061 0.9676 0.0036 -3.60E-07 0.537 0.0021 0.5633 0.0021 4.89 -0.340.029 0.651 1.2937 0.9622 0.0044 3.60E-07 0.531 0.0026 0.558 0.0025 5.08 -0.820.042 0.675 1.2695 0.9498 0.0062 0.00E+00 0.521 0.0036 0.5469 0.0036 4.97 -0.520.059 0.7 1.246 0.9349 0.0086 3.00E-07 0.511 0.005 0.535 0.0049 4.7 -0.60.081 0.724 1.2237 0.9175 0.0117 -6.00E-08 0.502 0.0067 0.5224 0.0067 4.06 -0.490.142 0.772 1.1805 0.8739 0.0206 -1.80E-07 0.481 0.0117 0.4942 0.0116 2.74 -0.290.184 0.796 1.1598 0.8474 0.0266 2.40E-07 0.47 0.015 0.4784 0.015 1.78 0.060.234 0.82 1.1395 0.8172 0.0341 -1.80E-07 0.457 0.0192 0.4611 0.0193 0.9 0.340.364 0.868 1.1006 0.7453 0.0549 1.20E-07 0.43 0.0306 0.4215 0.031 -1.98 1.330.447 0.893 1.0819 0.7022 0.0692 6.00E-08 0.415 0.0385 0.3983 0.0393 -4.02 2.030.543 0.3960.917 1.0631 0.6525 0.0878 -1.20E-07 0.0487 0.3716 0.05 -6.15 2.810.655 0.941 1.0438 0.5933 0.113 -2.70E-07 0.375 0.0625 0.3398 0.0647 -9.39 3.580.781 0.965 1.0262 0.523 0.1481 1.80E-07 0.345 0.0816 0.3015 0.0854 -12.61 4.62
1 1 1 0.3074 0.3074 0.00E+00 0.204 0.204 0.1793 0.1793 -12.1 -12.1
185

Table C2.8: Densities Prediction for n-Hexane.
Pr Tr Gam ZVC ZLC Fugr DLE DGE DLC DGC DEVL DEVG0.001 0.53 1.508 0.9965 0.0003 1.70E-03 0.502 0.0001 0.4687 0.0001 -6.64 -0.960.003 0.552 1.4759 0.9943 0.0004 1.80E-07 0.494 0.0002 0.4619 0.0002 -6.49 -0.920.006 0.585 1.4307 0.9892 0.001 2.00E-06 0.479 0.0004 0.4518 0.0004 -5.67 -0.620.008 0.596 1.4158 0.9869 0.0012 -6.00E-08 0.476 0.0006 0.4487 0.0005 -5.74 -1.940.01 0.607 1.4009 0.9842 0.0015 -6.00E-08 0.472 0.0007 0.4456 0.0007 -5.6 0.52
0.015 0.629 1.3727 0.9777 0.0023 5.40E-07 0.464 0.001 0.4386 0.001 -5.47 -0.310.018 0.64 1.359 0.9738 0.0028 -1.80E-07 0.459 0.0012 0.4352 0.0012 -5.19 -0.60.022 0.651 1.3453 0.9694 0.0034 -3.00E-07 0.455 0.0015 0.4315 0.0015 -5.16 -1.050.039 0.685 1.3058 0.9534 0.0057 -6.00E-08 0.443 0.0025 0.4198 0.0025 -5.24 -1.020.046 0.696 1.293 0.947 0.0067 6.00E-08 0.438 0.003 0.4156 0.0029 -5.11 -0.820.073 0.729 1.2555 0.9241 0.0105 -1.20E-07 0.425 0.0046 0.4023 0.0046 -5.34 -0.960.085 0.74 1.244 0.9154 0.0121 4.20E-07 0.422 0.0053 0.3977 0.0053 -5.77 -0.850.097 0.751 1.2325 0.9061 0.0139 0.00E+00 0.417 0.0061 0.3928 0.006 -5.8 -0.860.127 0.773 1.2095 0.8852 0.0181 0.00E+00 0.409 0.0079 0.3825 0.0078 -6.47 -0.80.164 0.795 1.1875 0.8615 0.0233 1.80E-07 0.399 0.0101 0.3715 0.0101 -6.9 -0.610.184 0.806 1.177 0.8487 0.0263 1.80E-07 0.395 0.0114 0.3657 0.0113 -7.41 -0.490.232 0.828 1.155 0.8199 0.0334 -3.60E-07 0.384 0.0144 0.3531 0.0144 -8.04 -0.170.289 0.85 1.1341 0.7878 0.0421 6.00E-08 0.373 0.0181 0.3394 0.0182 -9 0.220.392 0.883 1.1039 0.7324 0.059 2.40E-07 0.356 0.0252 0.3164 0.0255 -11.12 1.140.431 0.894 1.0946 0.7121 0.0658 -1.80E-07 0.35 0.028 0.3081 0.0285 -11.97 1.570.473 0.905 1.085 0.6901 0.0736 -6.00E-08 0.342 0.0313 0.2991 0.0319 -12.56 2.040.567 0.927 1.0666 0.642 0.092 0.00E+00 0.326 0.0388 0.2794 0.04 -14.3 3.30.679 0.95 1.0461 0.5826 0.118 -8.90E-08 0.305 0.0492 0.255 0.0516 -16.41 4.840.737 0.961 1.0374 0.5507 0.1335 -2.40E-07 0.292 0.0552 0.2417 0.0586 -17.23 6.180.801 0.972 1.0275 0.5144 0.154 -7.20E-04 0.274 0.0627 0.2253 0.0674 -17.78 7.510.872 0.983 1.0175 0.4682 0.1815 -4.00E-04 0.247 0.0728 0.2057 0.0797 -16.73 9.44
1 1 1 0.3074 0.3074 0.00E+00 0.139 0.139 0.1369 0.1369 -1.53 -1.53
186
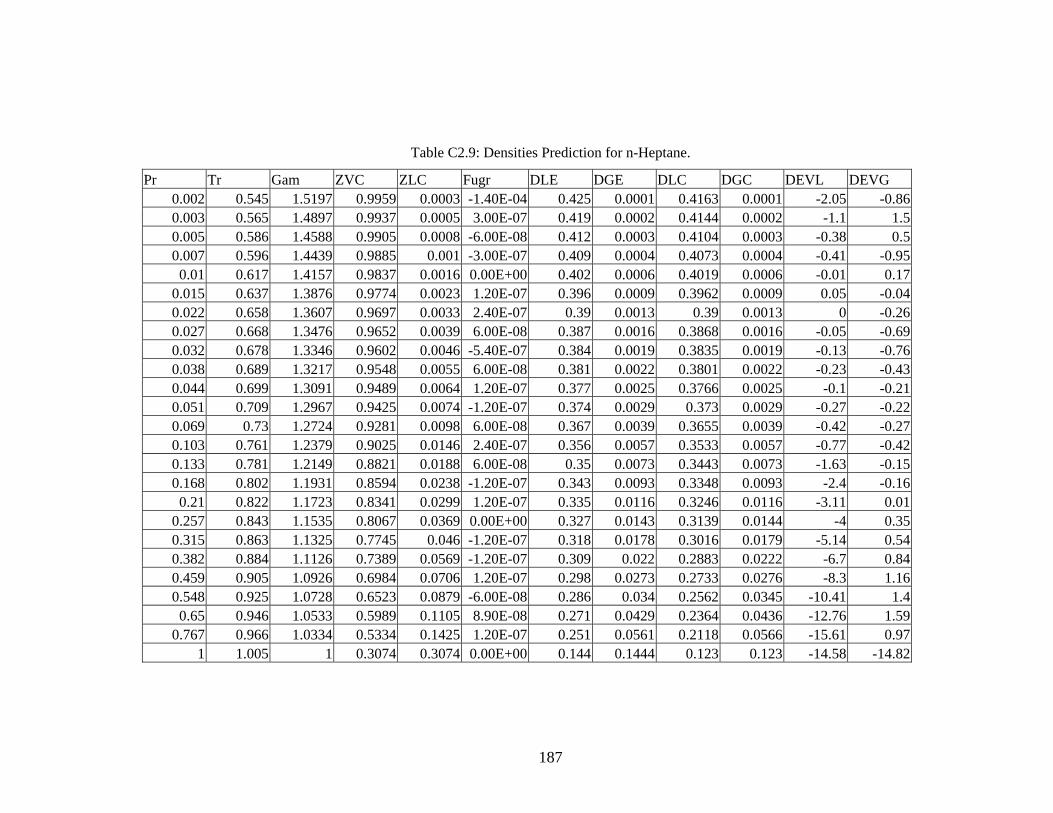
Table C2.9: Densities Prediction for n-Heptane.
Pr Tr Gam ZVC ZLC Fugr DLE DGE DLC DGC DEVL DEVG0.002 0.545 1.5197 0.9959 0.0003 -1.40E-04 0.425 0.0001 0.4163 0.0001 -2.05 -0.860.003 0.565 1.4897 0.9937 0.0005 3.00E-07 0.419 0.0002 0.4144 0.0002 -1.1 1.50.005 0.586 1.4588 0.9905 0.0008 -6.00E-08 0.412 0.0003 0.4104 0.0003 -0.38 0.50.007 0.596 1.4439 0.9885 0.001 -3.00E-07 0.409 0.0004 0.4073 0.0004 -0.41 -0.950.01 0.617 1.4157 0.9837 0.0016 0.00E+00 0.402 0.0006 0.4019 0.0006 -0.01 0.17
0.015 0.637 1.3876 0.9774 0.0023 1.20E-07 0.396 0.0009 0.3962 0.0009 0.05 -0.040.022 0.658 1.3607 0.9697 0.0033 2.40E-07 0.39 0.0013 0.39 0.0013 0 -0.260.027 0.668 1.3476 0.9652 0.0039 6.00E-08 0.387 0.0016 0.3868 0.0016 -0.05 -0.690.032 0.678 1.3346 0.9602 0.0046 -5.40E-07 0.384 0.0019 0.3835 0.0019 -0.13 -0.760.038 0.689 1.3217 0.9548 0.0055 6.00E-08 0.381 0.0022 0.3801 0.0022 -0.23 -0.430.044 0.699 1.3091 0.9489 0.0064 1.20E-07 0.377 0.0025 0.3766 0.0025 -0.1 -0.210.051 0.709 1.2967 0.9425 0.0074 -1.20E-07 0.374 0.0029 0.373 0.0029 -0.27 -0.220.069 0.73 1.2724 0.9281 0.0098 6.00E-08 0.367 0.0039 0.3655 0.0039 -0.42 -0.270.103 0.761 1.2379 0.9025 0.0146 2.40E-07 0.356 0.0057 0.3533 0.0057 -0.77 -0.420.133 0.781 1.2149 0.8821 0.0188 6.00E-08 0.35 0.0073 0.3443 0.0073 -1.63 -0.150.168 0.802 1.1931 0.8594 0.0238 -1.20E-07 0.343 0.0093 0.3348 0.0093 -2.4 -0.160.21 0.822 1.1723 0.8341 0.0299 1.20E-07 0.335 0.0116 0.3246 0.0116 -3.11 0.01
0.257 0.843 1.1535 0.8067 0.0369 0.00E+00 0.327 0.0143 0.3139 0.0144 -4 0.350.315 0.863 1.1325 0.7745 0.046 -1.20E-07 0.318 0.0178 0.3016 0.0179 -5.14 0.540.382 0.884 1.1126 0.7389 0.0569 -1.20E-07 0.309 0.022 0.2883 0.0222 -6.7 0.840.459 0.905 1.0926 0.6984 0.0706 1.20E-07 0.298 0.0273 0.2733 0.0276 -8.3 1.160.548 0.925 1.0728 0.6523 0.0879 -6.00E-08 0.286 0.034 0.2562 0.0345 -10.41 1.40.65 0.946 1.0533 0.5989 0.1105 8.90E-08 0.271 0.0429 0.2364 0.0436 -12.76 1.59
0.767 0.966 1.0334 0.5334 0.1425 1.20E-07 0.251 0.0561 0.2118 0.0566 -15.61 0.971 1.005 1 0.3074 0.3074 0.00E+00 0.144 0.1444 0.123 0.123 -14.58 -14.82
187
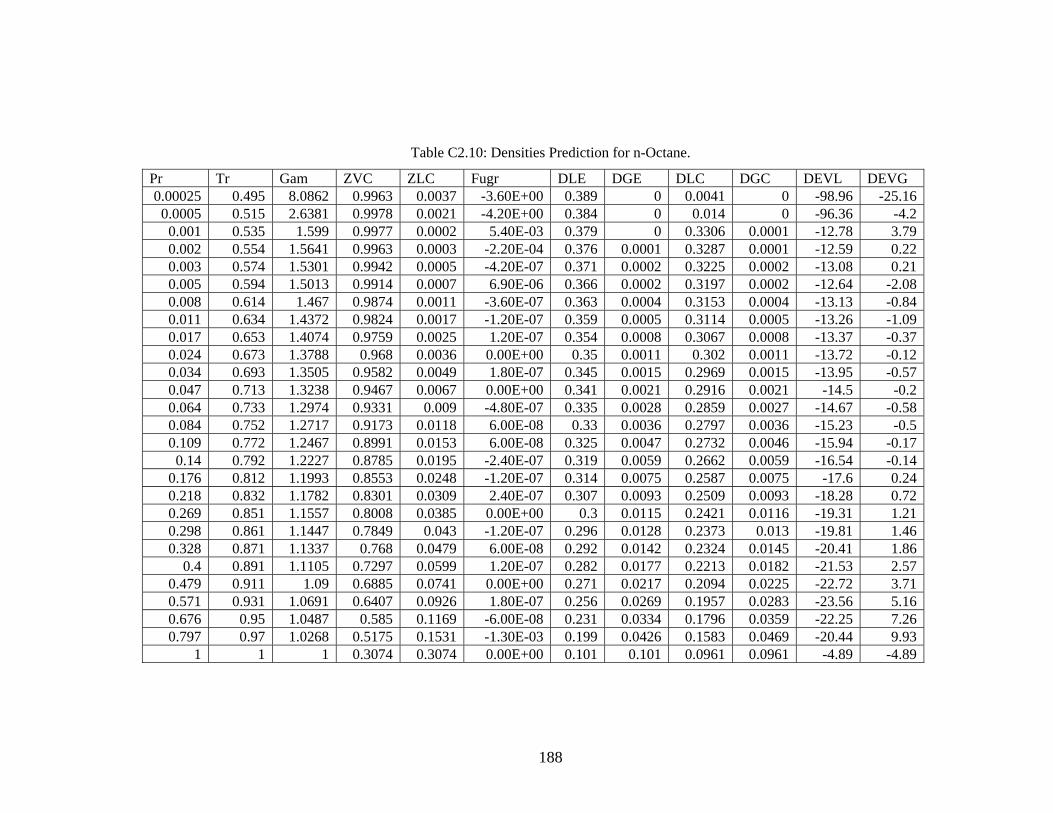
Table C2.10: Densities Prediction for n-Octane.
Pr Tr Gam ZVC ZLC Fugr DLE DGE DLC DGC DEVL DEVG0.00025 0.495 8.0862 0.9963 0.0037 -3.60E+00 0.389 0 0.0041 0 -98.96 -25.16
0.0005 0.515 2.6381 0.9978 0.0021 -4.20E+00 0.384 0 0.014 0 -96.36 -4.20.001 0.535 1.599 0.9977 0.0002 5.40E-03 0.379 0 0.3306 0.0001 -12.78 3.790.002 0.554 1.5641 0.9963 0.0003 -2.20E-04 0.376 0.0001 0.3287 0.0001 -12.59 0.220.003 0.574 1.5301 0.9942 0.0005 -4.20E-07 0.371 0.0002 0.3225 0.0002 -13.08 0.210.005 0.594 1.5013 0.9914 0.0007 6.90E-06 0.366 0.0002 0.3197 0.0002 -12.64 -2.080.008 0.614 1.467 0.9874 0.0011 -3.60E-07 0.363 0.0004 0.3153 0.0004 -13.13 -0.840.011 0.634 1.4372 0.9824 0.0017 -1.20E-07 0.359 0.0005 0.3114 0.0005 -13.26 -1.090.017 0.653 1.4074 0.9759 0.0025 1.20E-07 0.354 0.0008 0.3067 0.0008 -13.37 -0.370.024 0.673 1.3788 0.968 0.0036 0.00E+00 0.35 0.0011 0.302 0.0011 -13.72 -0.120.034 0.693 1.3505 0.9582 0.0049 1.80E-07 0.345 0.0015 0.2969 0.0015 -13.95 -0.570.047 0.713 1.3238 0.9467 0.0067 0.00E+00 0.341 0.0021 0.2916 0.0021 -14.5 -0.20.064 0.733 1.2974 0.9331 0.009 -4.80E-07 0.335 0.0028 0.2859 0.0027 -14.67 -0.580.084 0.752 1.2717 0.9173 0.0118 6.00E-08 0.33 0.0036 0.2797 0.0036 -15.23 -0.50.109 0.772 1.2467 0.8991 0.0153 6.00E-08 0.325 0.0047 0.2732 0.0046 -15.94 -0.170.14 0.792 1.2227 0.8785 0.0195 -2.40E-07 0.319 0.0059 0.2662 0.0059 -16.54 -0.14
0.176 0.812 1.1993 0.8553 0.0248 -1.20E-07 0.314 0.0075 0.2587 0.0075 -17.6 0.240.218 0.832 1.1782 0.8301 0.0309 2.40E-07 0.307 0.0093 0.2509 0.0093 -18.28 0.720.269 0.851 1.1557 0.8008 0.0385 0.00E+00 0.3 0.0115 0.2421 0.0116 -19.31 1.210.298 0.861 1.1447 0.7849 0.043 -1.20E-07 0.296 0.0128 0.2373 0.013 -19.81 1.460.328 0.871 1.1337 0.768 0.0479 6.00E-08 0.292 0.0142 0.2324 0.0145 -20.41 1.86
0.4 0.891 1.1105 0.7297 0.0599 1.20E-07 0.282 0.0177 0.2213 0.0182 -21.53 2.570.479 0.911 1.09 0.6885 0.0741 0.00E+00 0.271 0.0217 0.2094 0.0225 -22.72 3.710.571 0.931 1.0691 0.6407 0.0926 1.80E-07 0.256 0.0269 0.1957 0.0283 -23.56 5.160.676 0.95 1.0487 0.585 0.1169 -6.00E-08 0.231 0.0334 0.1796 0.0359 -22.25 7.260.797 0.97 1.0268 0.5175 0.1531 -1.30E-03 0.199 0.0426 0.1583 0.0469 -20.44 9.93
1 1 1 0.3074 0.3074 0.00E+00 0.101 0.101 0.0961 0.0961 -4.89 -4.89
188
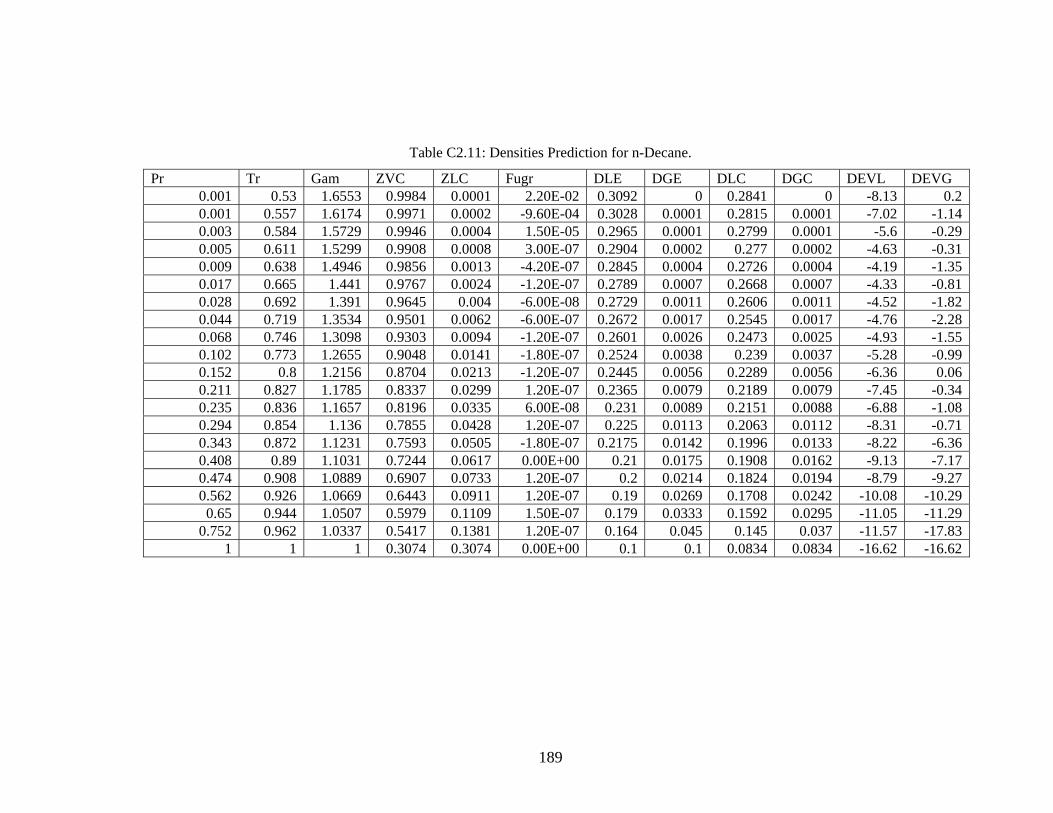
Table C2.11: Densities Prediction for n-Decane.
Pr Tr Gam ZVC ZLC Fugr DLE DGE DLC DGC DEVL DEVG0.001 0.53 1.6553 0.9984 0.0001 2.20E-02 0.3092 0 0.2841 0 -8.13 0.20.001 0.557 1.6174 0.9971 0.0002 -9.60E-04 0.3028 0.0001 0.2815 0.0001 -7.02 -1.140.003 0.584 1.5729 0.9946 0.0004 1.50E-05 0.2965 0.0001 0.2799 0.0001 -5.6 -0.290.005 0.611 1.5299 0.9908 0.0008 3.00E-07 0.2904 0.0002 0.277 0.0002 -4.63 -0.310.009 0.638 1.4946 0.9856 0.0013 -4.20E-07 0.2845 0.0004 0.2726 0.0004 -4.19 -1.350.017 0.665 1.441 0.9767 0.0024 -1.20E-07 0.2789 0.0007 0.2668 0.0007 -4.33 -0.810.028 0.692 1.391 0.9645 0.004 -6.00E-08 0.2729 0.0011 0.2606 0.0011 -4.52 -1.820.044 0.719 1.3534 0.9501 0.0062 -6.00E-07 0.2672 0.0017 0.2545 0.0017 -4.76 -2.280.068 0.746 1.3098 0.9303 0.0094 -1.20E-07 0.2601 0.0026 0.2473 0.0025 -4.93 -1.550.102 0.773 1.2655 0.9048 0.0141 -1.80E-07 0.2524 0.0038 0.239 0.0037 -5.28 -0.990.152 0.8 1.2156 0.8704 0.0213 -1.20E-07 0.2445 0.0056 0.2289 0.0056 -6.36 0.060.211 0.827 1.1785 0.8337 0.0299 1.20E-07 0.2365 0.0079 0.2189 0.0079 -7.45 -0.340.235 0.836 1.1657 0.8196 0.0335 6.00E-08 0.231 0.0089 0.2151 0.0088 -6.88 -1.080.294 0.854 1.136 0.7855 0.0428 1.20E-07 0.225 0.0113 0.2063 0.0112 -8.31 -0.710.343 0.872 1.1231 0.7593 0.0505 -1.80E-07 0.2175 0.0142 0.1996 0.0133 -8.22 -6.360.408 0.89 1.1031 0.7244 0.0617 0.00E+00 0.21 0.0175 0.1908 0.0162 -9.13 -7.170.474 0.908 1.0889 0.6907 0.0733 1.20E-07 0.2 0.0214 0.1824 0.0194 -8.79 -9.270.562 0.926 1.0669 0.6443 0.0911 1.20E-07 0.19 0.0269 0.1708 0.0242 -10.08 -10.290.65 0.944 1.0507 0.5979 0.1109 1.50E-07 0.179 0.0333 0.1592 0.0295 -11.05 -11.29
0.752 0.962 1.0337 0.5417 0.1381 1.20E-07 0.164 0.045 0.145 0.037 -11.57 -17.831 1 1 0.3074 0.3074 0.00E+00 0.1 0.1 0.0834 0.0834 -16.62 -16.62
189
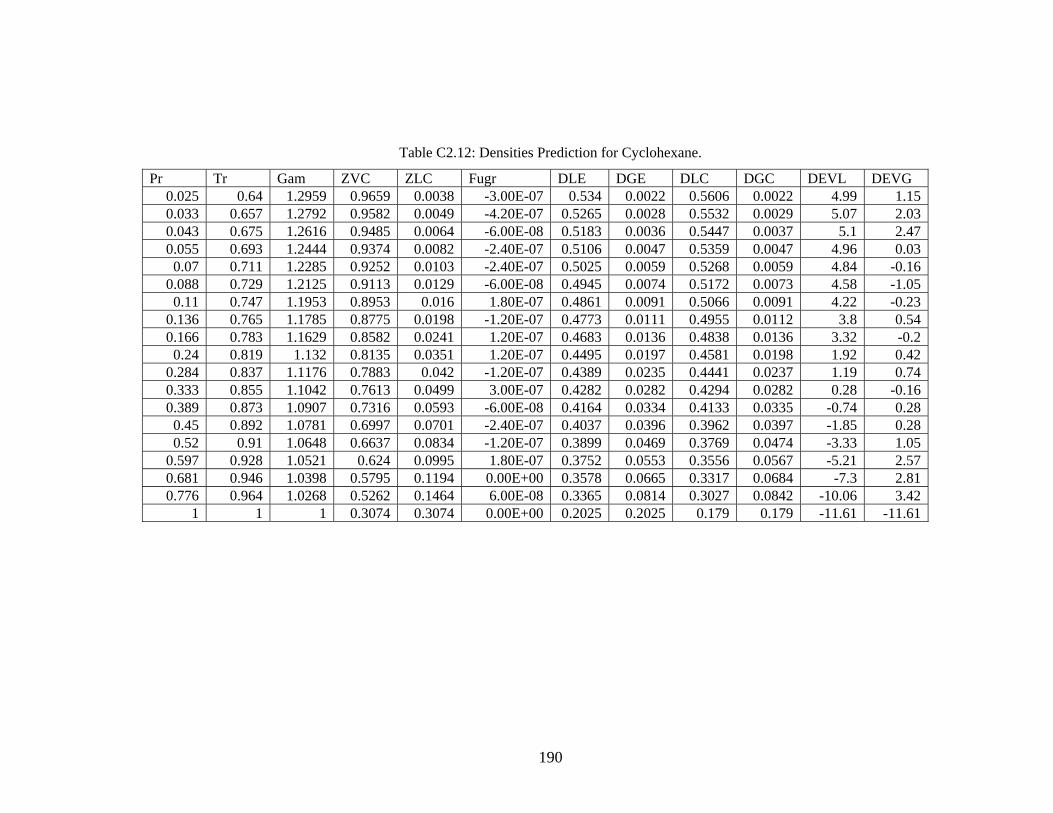
Table C2.12: Densities Prediction for Cyclohexane.
Pr Tr Gam ZVC ZLC Fugr DLE DGE DLC DGC DEVL DEVG0.025 0.64 1.2959 0.9659 0.0038 -3.00E-07 0.534 0.0022 0.5606 0.0022 4.99 1.150.033 0.657 1.2792 0.9582 0.0049 -4.20E-07 0.5265 0.0028 0.5532 0.0029 5.07 2.030.043 0.675 1.2616 0.9485 0.0064 -6.00E-08 0.5183 0.0036 0.5447 0.0037 5.1 2.470.055 0.693 1.2444 0.9374 0.0082 -2.40E-07 0.5106 0.0047 0.5359 0.0047 4.96 0.030.07 0.711 1.2285 0.9252 0.0103 -2.40E-07 0.5025 0.0059 0.5268 0.0059 4.84 -0.16
0.088 0.729 1.2125 0.9113 0.0129 -6.00E-08 0.4945 0.0074 0.5172 0.0073 4.58 -1.050.11 0.747 1.1953 0.8953 0.016 1.80E-07 0.4861 0.0091 0.5066 0.0091 4.22 -0.23
0.136 0.765 1.1785 0.8775 0.0198 -1.20E-07 0.4773 0.0111 0.4955 0.0112 3.8 0.540.166 0.783 1.1629 0.8582 0.0241 1.20E-07 0.4683 0.0136 0.4838 0.0136 3.32 -0.20.24 0.819 1.132 0.8135 0.0351 1.20E-07 0.4495 0.0197 0.4581 0.0198 1.92 0.42
0.284 0.837 1.1176 0.7883 0.042 -1.20E-07 0.4389 0.0235 0.4441 0.0237 1.19 0.740.333 0.855 1.1042 0.7613 0.0499 3.00E-07 0.4282 0.0282 0.4294 0.0282 0.28 -0.160.389 0.873 1.0907 0.7316 0.0593 -6.00E-08 0.4164 0.0334 0.4133 0.0335 -0.74 0.280.45 0.892 1.0781 0.6997 0.0701 -2.40E-07 0.4037 0.0396 0.3962 0.0397 -1.85 0.280.52 0.91 1.0648 0.6637 0.0834 -1.20E-07 0.3899 0.0469 0.3769 0.0474 -3.33 1.05
0.597 0.928 1.0521 0.624 0.0995 1.80E-07 0.3752 0.0553 0.3556 0.0567 -5.21 2.570.681 0.946 1.0398 0.5795 0.1194 0.00E+00 0.3578 0.0665 0.3317 0.0684 -7.3 2.810.776 0.964 1.0268 0.5262 0.1464 6.00E-08 0.3365 0.0814 0.3027 0.0842 -10.06 3.42
1 1 1 0.3074 0.3074 0.00E+00 0.2025 0.2025 0.179 0.179 -11.61 -11.61
190
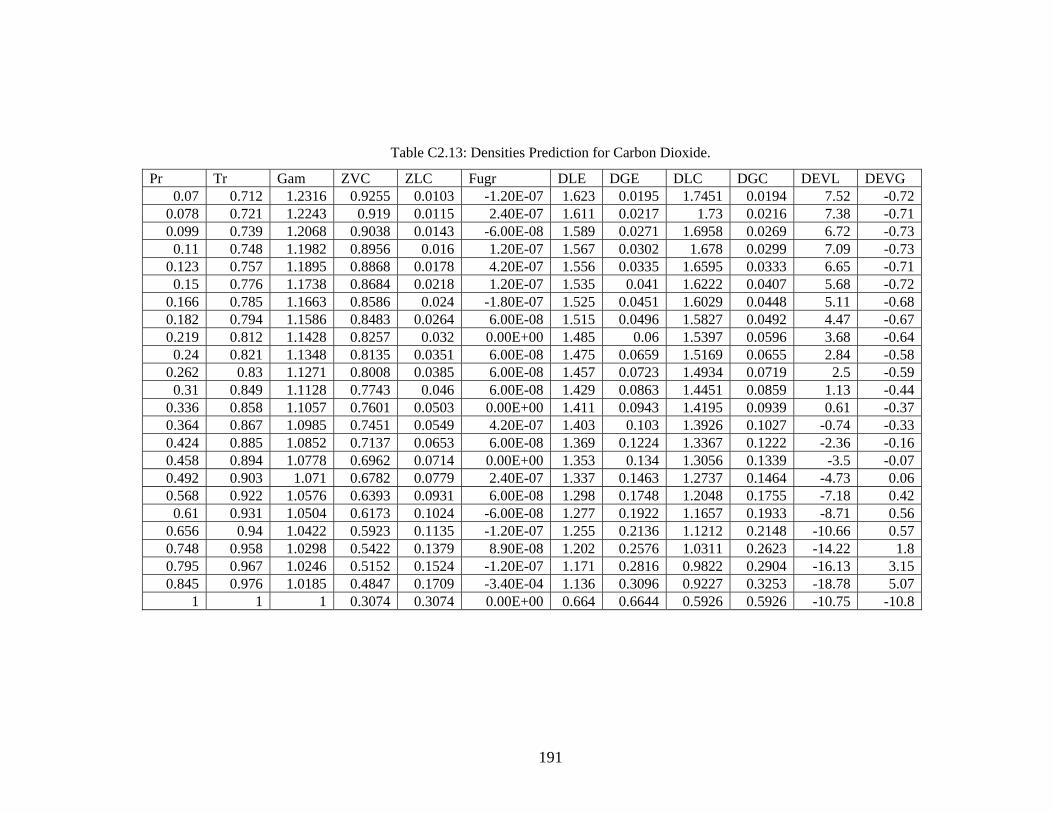
Table C2.13: Densities Prediction for Carbon Dioxide.
Pr Tr Gam ZVC ZLC Fugr DLE DGE DLC DGC DEVL DEVG0.07 0.712 1.2316 0.9255 0.0103 -1.20E-07 1.623 0.0195 1.7451 0.0194 7.52 -0.72
0.078 0.721 1.2243 0.919 0.0115 2.40E-07 1.611 0.0217 1.73 0.0216 7.38 -0.710.099 0.739 1.2068 0.9038 0.0143 -6.00E-08 1.589 0.0271 1.6958 0.0269 6.72 -0.730.11 0.748 1.1982 0.8956 0.016 1.20E-07 1.567 0.0302 1.678 0.0299 7.09 -0.73
0.123 0.757 1.1895 0.8868 0.0178 4.20E-07 1.556 0.0335 1.6595 0.0333 6.65 -0.710.15 0.776 1.1738 0.8684 0.0218 1.20E-07 1.535 0.041 1.6222 0.0407 5.68 -0.72
0.166 0.785 1.1663 0.8586 0.024 -1.80E-07 1.525 0.0451 1.6029 0.0448 5.11 -0.680.182 0.794 1.1586 0.8483 0.0264 6.00E-08 1.515 0.0496 1.5827 0.0492 4.47 -0.670.219 0.812 1.1428 0.8257 0.032 0.00E+00 1.485 0.06 1.5397 0.0596 3.68 -0.640.24 0.821 1.1348 0.8135 0.0351 6.00E-08 1.475 0.0659 1.5169 0.0655 2.84 -0.58
0.262 0.83 1.1271 0.8008 0.0385 6.00E-08 1.457 0.0723 1.4934 0.0719 2.5 -0.590.31 0.849 1.1128 0.7743 0.046 6.00E-08 1.429 0.0863 1.4451 0.0859 1.13 -0.44
0.336 0.858 1.1057 0.7601 0.0503 0.00E+00 1.411 0.0943 1.4195 0.0939 0.61 -0.370.364 0.867 1.0985 0.7451 0.0549 4.20E-07 1.403 0.103 1.3926 0.1027 -0.74 -0.330.424 0.885 1.0852 0.7137 0.0653 6.00E-08 1.369 0.1224 1.3367 0.1222 -2.36 -0.160.458 0.894 1.0778 0.6962 0.0714 0.00E+00 1.353 0.134 1.3056 0.1339 -3.5 -0.070.492 0.903 1.071 0.6782 0.0779 2.40E-07 1.337 0.1463 1.2737 0.1464 -4.73 0.060.568 0.922 1.0576 0.6393 0.0931 6.00E-08 1.298 0.1748 1.2048 0.1755 -7.18 0.420.61 0.931 1.0504 0.6173 0.1024 -6.00E-08 1.277 0.1922 1.1657 0.1933 -8.71 0.56
0.656 0.94 1.0422 0.5923 0.1135 -1.20E-07 1.255 0.2136 1.1212 0.2148 -10.66 0.570.748 0.958 1.0298 0.5422 0.1379 8.90E-08 1.202 0.2576 1.0311 0.2623 -14.22 1.80.795 0.967 1.0246 0.5152 0.1524 -1.20E-07 1.171 0.2816 0.9822 0.2904 -16.13 3.150.845 0.976 1.0185 0.4847 0.1709 -3.40E-04 1.136 0.3096 0.9227 0.3253 -18.78 5.07
1 1 1 0.3074 0.3074 0.00E+00 0.664 0.6644 0.5926 0.5926 -10.75 -10.8
191

Table C2.14: Densities Prediction for Nitrogen.
Pr Tr Gam ZVC ZLC Fugr DLE DGE DLC DGC DEVL DEVG0.094 0.703 1.147 0.9036 0.0144 -1.80E-07 1.668 0.0299 1.8786 0.0299 12.63 0.03
0.1 0.708 1.144 0.8994 0.0152 6.00E-08 1.66 0.0316 1.8685 0.0316 12.56 0.120.119 0.725 1.1347 0.8852 0.0181 -3.00E-07 1.637 0.0375 1.8354 0.0376 12.12 0.260.121 0.726 1.1339 0.884 0.0184 -2.40E-07 1.63 0.038 1.8327 0.0381 12.44 0.260.15 0.747 1.1225 0.8647 0.0226 -2.40E-07 1.601 0.0465 1.7895 0.0467 11.77 0.49
0.164 0.756 1.1174 0.8555 0.0247 0.00E+00 1.586 0.0508 1.7693 0.0511 11.56 0.570.185 0.769 1.1105 0.8421 0.0279 2.40E-07 1.566 0.0572 1.7406 0.0576 11.15 0.730.203 0.779 1.105 0.8309 0.0306 2.40E-07 1.545 0.0627 1.7171 0.0633 11.14 0.90.226 0.791 1.0987 0.8172 0.0342 0.00E+00 1.525 0.0698 1.6885 0.0706 10.72 1.080.273 0.813 1.0871 0.7899 0.0416 1.20E-07 1.487 0.0847 1.6327 0.0859 9.8 1.490.305 0.826 1.0804 0.7722 0.0466 -6.00E-08 1.463 0.0948 1.5973 0.0965 9.18 1.760.327 0.835 1.0759 0.7599 0.0503 -6.00E-08 1.451 0.1022 1.5727 0.1042 8.39 1.960.389 0.857 1.0649 0.7272 0.0607 -3.00E-07 1.405 0.1228 1.5079 0.1259 7.32 2.510.406 0.862 1.0621 0.7182 0.0637 -6.00E-08 1.394 0.1288 1.4901 0.1322 6.89 2.650.458 0.879 1.0542 0.6913 0.0731 2.40E-07 1.357 0.1475 1.4372 0.152 5.91 3.110.511 0.894 1.0469 0.664 0.0833 -1.20E-07 1.317 0.1676 1.3836 0.1736 5.06 3.60.535 0.901 1.0439 0.6517 0.0881 -1.20E-07 1.303 0.177 1.3594 0.1839 4.33 3.850.613 0.921 1.0346 0.6112 0.105 -2.40E-07 1.248 0.2101 1.2798 0.2198 2.55 4.630.62 0.923 1.0339 0.6075 0.1066 6.00E-08 1.244 0.2134 1.2724 0.2234 2.29 4.69
0.715 0.945 1.0242 0.5572 0.1303 -1.20E-07 1.17 0.2592 1.1726 0.2741 0.22 5.740.812 0.965 1.0154 0.5013 0.1602 -1.20E-07 1.092 0.317 1.0603 0.3388 -2.9 6.870.819 0.967 1.0149 0.4974 0.1625 1.50E-07 1.088 0.3216 1.0523 0.3438 -3.28 6.9
1 1 1 0.3074 0.3074 0.00E+00 0.694 0.6945 0.6567 0.6567 -5.37 -5.44
192

Table C2.15: Densities Prediction for Hydrogen Sulfide.
Pr Tr Gam ZVC ZLC Fugr DLE DGE DLC DGC DEVL DEVG0.01 0.566 1.28 0.9821 0.0017 1.20E-07 1.768 0.0034 1.8942 0.0034 7.14 0.04
0.013 0.581 1.2731 0.9784 0.0022 1.80E-07 1.747 0.0042 1.8786 0.0042 7.53 -0.110.017 0.595 1.2638 0.9738 0.0028 6.00E-08 1.726 0.0053 1.8606 0.0053 7.8 -0.060.022 0.61 1.2529 0.9684 0.0035 4.80E-07 1.706 0.0067 1.8413 0.0066 7.93 -0.150.028 0.625 1.2411 0.9621 0.0044 -1.80E-07 1.677 0.0083 1.8206 0.0083 8.56 0.180.043 0.655 1.2168 0.9468 0.0067 -6.00E-08 1.639 0.0125 1.7765 0.0126 8.39 0.20.053 0.67 1.2048 0.9378 0.0082 0.00E+00 1.621 0.0152 1.7531 0.0153 8.15 0.170.065 0.685 1.193 0.9279 0.0099 -6.00E-08 1.595 0.0183 1.7288 0.0184 8.39 0.40.078 0.7 1.1816 0.917 0.0118 -3.60E-07 1.578 0.0219 1.7036 0.022 7.96 0.520.094 0.715 1.1705 0.9052 0.0141 -2.40E-07 1.553 0.0259 1.6776 0.0261 8.02 0.740.112 0.729 1.1582 0.8919 0.0167 6.00E-08 1.536 0.0305 1.6492 0.031 7.37 1.640.153 1.4890.759 1.1394 0.8641 0.0227 1.20E-07 0.0413 1.5932 0.0419 7 1.430.177 0.774 1.1297 0.8483 0.0264 0.00E+00 1.467 0.0478 1.5629 0.0486 6.53 1.720.205 0.789 1.1202 0.8315 0.0305 0.00E+00 1.438 0.055 1.5312 0.0562 6.48 2.110.268 0.819 1.1019 0.7945 0.0403 -6.00E-08 1.391 0.072 1.4634 0.0742 5.2 2.930.305 0.834 1.093 0.7742 0.0461 0.00E+00 1.365 0.0821 1.4269 0.0849 4.53 3.440.344 0.849 1.0843 0.7526 0.0526 3.00E-07 1.334 0.0933 1.3884 0.097 4.08 3.960.388 0.863 1.0757 0.7295 0.06 -2.40E-07 1.304 0.1059 1.3476 0.1108 3.35 4.60.435 0.878 1.0672 0.7047 0.0684 0.00E+00 1.276 0.1202 1.3042 0.1265 2.21 5.280.487 0.893 1.0589 0.6782 0.0779 0.00E+00 1.243 0.1363 1.2578 0.1445 1.19 6.040.542 0.908 1.0506 0.6496 0.089 1.80E-07 1.203 0.1547 1.2077 0.1654 0.39 6.930.603 0.923 1.0424 0.6185 0.1019 6.00E-08 1.164 0.1759 1.1531 0.1899 -0.93 7.960.668 0.938 1.0343 0.5843 0.1172 1.80E-07 1.12 0.2008 1.0929 0.2192 -2.42 9.140.738 0.953 1.0262 0.546 0.1359 -1.80E-07 1.071 0.2307 1.025 0.2551 -4.29 10.60.813 0.968 1.0181 0.5019 0.1599 -6.00E-08 1.015 0.268 0.9459 0.3013 -6.81 12.420.894 0.982 1.0099 0.4486 0.1939 -2.20E-04 0.947 0.3179 0.8447 0.3651 -10.8 14.83
1 1 1 0.3074 0.3074 0.00E+00 0.639 0.6393 0.5852 0.5852 -8.42 -8.46
193
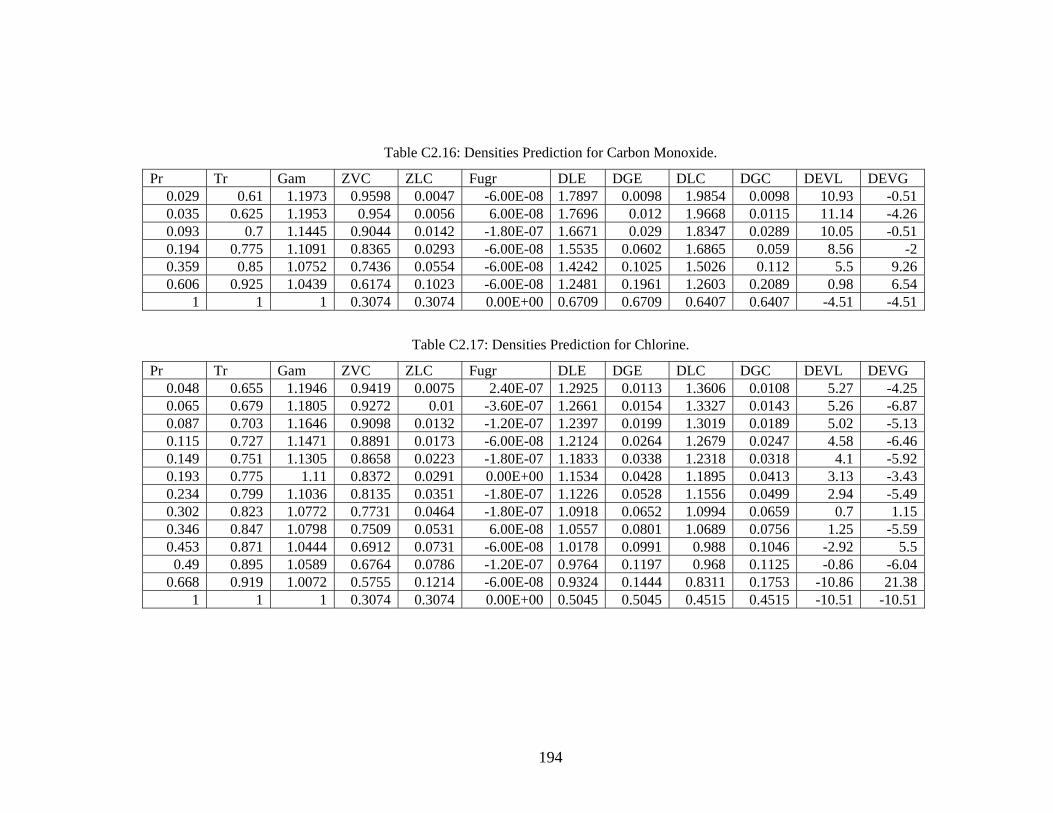
Table C2.16: Densities Prediction for Carbon Monoxide.
Pr Tr Gam ZVC ZLC Fugr DLE DGE DLC DGC DEVL DEVG0.029 0.61 1.1973 0.9598 0.0047 -6.00E-08 1.7897 0.0098 1.9854 0.0098 10.93 -0.510.035 0.625 1.1953 0.954 0.0056 6.00E-08 1.7696 0.012 1.9668 0.0115 11.14 -4.260.093 0.7 1.1445 0.9044 0.0142 -1.80E-07 1.6671 0.029 1.8347 0.0289 10.05 -0.510.194 0.775 1.1091 0.8365 0.0293 -6.00E-08 1.5535 0.0602 1.6865 0.059 8.56 -20.359 0.85 1.0752 0.7436 0.0554 -6.00E-08 1.4242 0.1025 1.5026 0.112 5.5 9.260.606 0.925 1.0439 0.6174 0.1023 -6.00E-08 1.2481 0.1961 1.2603 0.2089 0.98 6.54
1 1 1 0.3074 0.3074 0.00E+00 0.6709 0.6709 0.6407 0.6407 -4.51 -4.51
Table C2.17: Densities Prediction for Chlorine.
Pr Tr Gam ZVC ZLC Fugr DLE DGE DLC DGC DEVL DEVG0.048 0.655 1.1946 0.9419 0.0075 2.40E-07 1.2925 0.0113 1.3606 0.0108 5.27 -4.250.065 0.679 1.1805 0.9272 0.01 -3.60E-07 1.2661 0.0154 1.3327 0.0143 5.26 -6.870.087 0.703 1.1646 0.9098 0.0132 -1.20E-07 1.2397 0.0199 1.3019 0.0189 5.02 -5.130.115 0.727 1.1471 0.8891 0.0173 -6.00E-08 1.2124 0.0264 1.2679 0.0247 4.58 -6.460.149 0.751 1.1305 0.8658 0.0223 -1.80E-07 1.1833 0.0338 1.2318 0.0318 4.1 -5.920.193 0.775 1.11 0.8372 0.0291 0.00E+00 1.1534 0.0428 1.1895 0.0413 3.13 -3.430.234 0.799 1.1036 0.8135 0.0351 -1.80E-07 1.1226 0.0528 1.1556 0.0499 2.94 -5.490.302 0.823 1.0772 0.7731 0.0464 -1.80E-07 1.0918 0.0652 1.0994 0.0659 0.7 1.150.346 0.847 1.0798 0.7509 0.0531 6.00E-08 1.0557 0.0801 1.0689 0.0756 1.25 -5.590.453 0.871 1.0444 0.6912 0.0731 -6.00E-08 1.0178 0.0991 0.988 0.1046 -2.92 5.50.49 0.895 1.0589 0.6764 0.0786 -1.20E-07 0.9764 0.1197 0.968 0.1125 -0.86 -6.04
0.668 0.919 1.0072 0.5755 0.1214 -6.00E-08 0.9324 0.1444 0.8311 0.1753 -10.86 21.381 1 1 0.3074 0.3074 0.00E+00 0.5045 0.5045 0.4515 0.4515 -10.51 -10.51
194
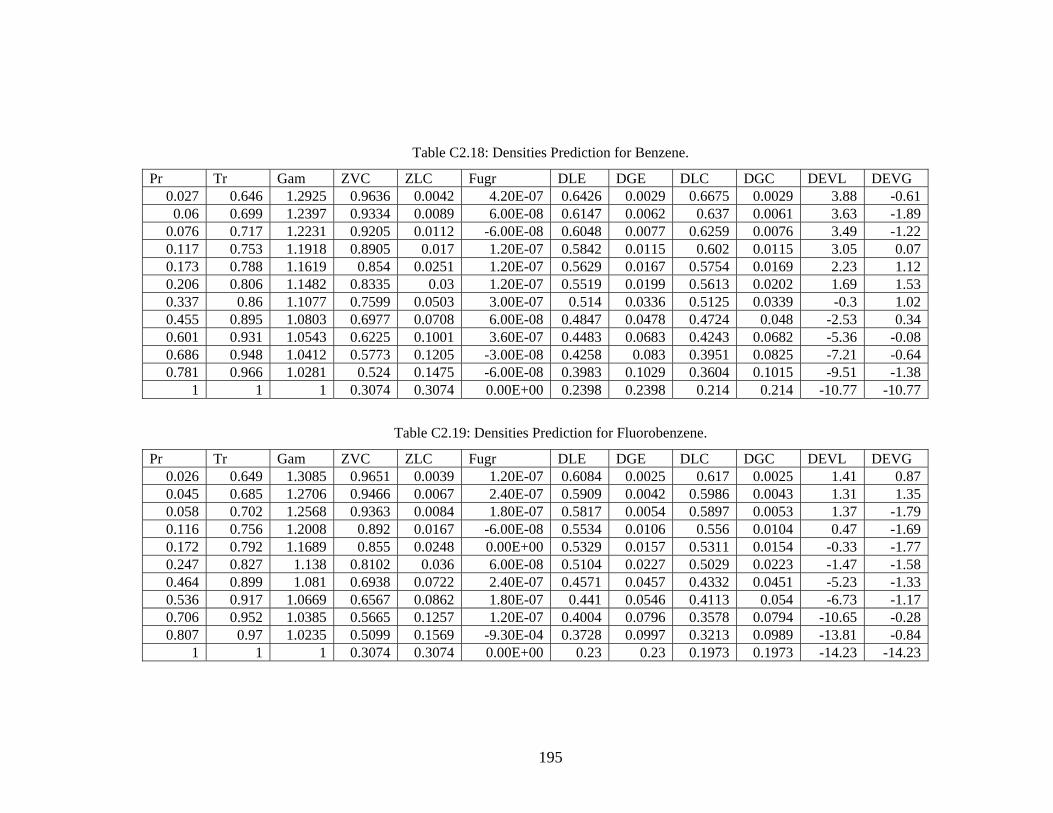
Table C2.18: Densities Prediction for Benzene.
Pr Tr Gam ZVC ZLC Fugr DLE DGE DLC DGC DEVL DEVG0.027 0.646 1.2925 0.9636 0.0042 4.20E-07 0.6426 0.0029 0.6675 0.0029 3.88 -0.610.06 0.699 1.2397 0.9334 0.0089 6.00E-08 0.6147 0.0062 0.637 0.0061 3.63 -1.89
0.076 0.717 1.2231 0.9205 0.0112 -6.00E-08 0.6048 0.0077 0.6259 0.0076 3.49 -1.220.117 0.753 1.1918 0.8905 0.017 1.20E-07 0.5842 0.0115 0.602 0.0115 3.05 0.070.173 0.788 1.1619 0.854 0.0251 1.20E-07 0.5629 0.0167 0.5754 0.0169 2.23 1.120.206 0.806 1.1482 0.8335 0.03 1.20E-07 0.5519 0.0199 0.5613 0.0202 1.69 1.530.337 0.86 1.1077 0.7599 0.0503 3.00E-07 0.514 0.0336 0.5125 0.0339 -0.3 1.020.455 0.895 1.0803 0.6977 0.0708 6.00E-08 0.4847 0.0478 0.4724 0.048 -2.53 0.340.601 0.931 1.0543 0.6225 0.1001 3.60E-07 0.4483 0.0683 0.4243 0.0682 -5.36 -0.080.686 0.948 1.0412 0.5773 0.1205 -3.00E-08 0.4258 0.083 0.3951 0.0825 -7.21 -0.640.781 0.966 1.0281 0.524 0.1475 -6.00E-08 0.3983 0.1029 0.3604 0.1015 -9.51 -1.38
1 1 1 0.3074 0.3074 0.00E+00 0.2398 0.2398 0.214 0.214 -10.77 -10.77
Table C2.19: Densities Prediction for Fluorobenzene.
Pr Tr Gam ZVC ZLC Fugr DLE DGE DLC DGC DEVL DEVG0.026 0.649 1.3085 0.9651 0.0039 1.20E-07 0.6084 0.0025 0.617 0.0025 1.41 0.870.045 00.685 1.2706 0.9466 0.0067 2.40E-07 0.5909 0.0042 .5986 0.0043 1.31 1.350.058 2 1.2568 0.93 1.80E-07 0.5817 0.0054 0.5897 0.0053 1.37 -1.790.70 63 0.00840.116 0.756 1.2008 0.892 0.0167 -6.00E-08 0.5534 0.0106 0.556 0.0104 0.47 -1.690.172 0.792 1.1689 0.855 0.0248 0.00E+00 0.5329 0.0157 0.5311 0.0154 -0.33 -1.770.247 0.827 1.138 0.8102 0.036 6.00E-08 0.5104 0.0227 0.5029 0.0223 -1.47 -1.580.464 0.899 1.081 0.6938 0.0722 2.40E-07 0.4571 0.0457 0.4332 0.0451 -5.23 -1.330.536 0.917 1.0669 0.6567 0.0862 1.80E-07 0.441 0.0546 0.4113 0.054 -6.73 -1.170.706 0.952 1.0385 0.5665 0.1257 1.20E-07 0.4004 0.0796 0.3578 0.0794 -10.65 -0.280.807 0.97 1.0235 0.5099 0.1569 -9.30E-04 0.3728 0.0997 0.3213 0.0989 -13.81 -0.84
1 1 1 0.3074 0.3074 0.00E+00 0.23 0.23 0.1973 0.1973 -14.23 -14.23
195
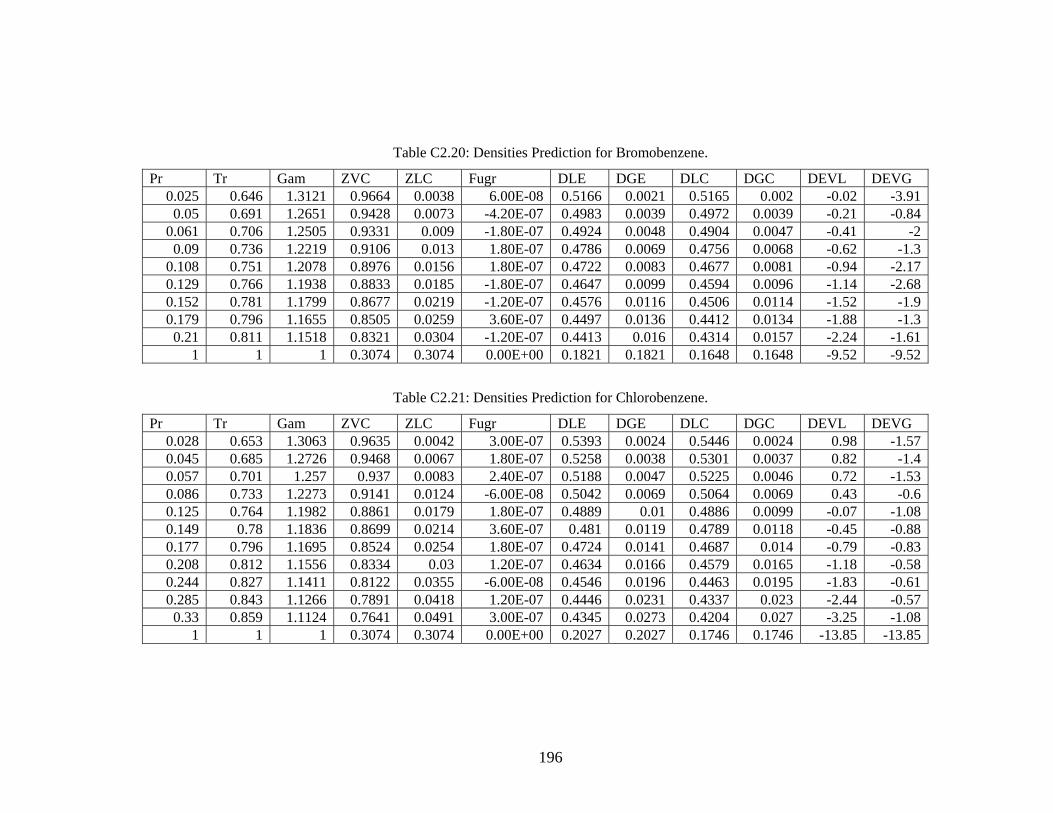
Table C2.20: Densities Prediction for Bromobenzene.
Pr Tr Gam ZVC ZLC Fugr DLE DGE DLC DGC DEVL DEVG 0.025 0.646 1.3121 0.9664 0.0038 6.00E-08 0.5166 0.0021 0.5165 0.002 -0.02 -3.910.05 0.691 1.2651 0.9428 0.0073 -4.20E-07 0.4983 0.0039 0.4972 0.0039 -0.21 -0.84
0.061 0.706 1.2505 0.9331 0.009 -1.80E-07 0.4924 0.0048 0.4904 0.0047 -0.41 -20.09 0.736 1.2219 0.9106 0.013 1.80E-07 0.4786 0.0069 0.4756 0.0068 -0.62 -1.3
0.108 0.751 1.2078 0.8976 0.0156 1.80E-07 0.4722 0.0083 0.4677 0.0081 -0.94 -2.170.129 0.766 1.1938 0.8833 0.0185 -1.80E-07 0.4647 0.0099 0.4594 0.0096 -1.14 -2.680.152 0.781 1.1799 0.8677 0.0219 -1.20E-07 0.4576 0.0116 0.4506 0.0114 -1.52 -1.90.179 0.796 1.1655 0.8505 0.0259 3.60E-07 0.4497 0.0136 0.4412 0.0134 -1.88 -1.30.21 0.811 1.1518 0.8321 0.0304 -1.20E-07 0.4413 0.016 0.4314 0.0157 -2.24 -1.61
1 1 1 0.3074 0.3074 0.00E+00 0.1821 0.1821 0.1648 0.1648 -9.52 -9.52
Table C2.21: Densities Prediction for Chlorobenzene.
Pr Tr Gam ZVC ZLC Fugr DLE DGE DLC DGC DEVL DEVG 0.028 0.653 1.3063 0.9635 0.0042 3.00E-07 0.5393 0.0024 0.5446 0.0024 0.98 -1.570.045 0.685 1.2726 0.9468 0.0067 1.80E-07 0.5258 0.0038 0.5301 0.0037 0.82 -1.40.057 0.701 1.257 0.937 0.0083 2.40E-07 0.5188 0.0047 0.5225 0.0046 0.72 -1.530.086 0.733 1.2273 0.9141 0.0124 -6.00E-08 0.5042 0.0069 0.5064 0.0069 0.43 -0.60.125 0.764 1.1982 0.8861 0.0179 1.80E-07 0.4889 0.01 0.4886 0.0099 -0.07 -1.080.149 0.78 1.1836 0.8699 0.0214 3.60E-07 0.481 0.0119 0.4789 0.0118 -0.45 -0.880.177 0.796 1.1695 0.8524 0.0254 1.80E-07 0.4724 0.0141 0.4687 0.014 -0.79 -0.830.208 0.812 1.1556 0.8334 0.03 1.20E-07 0.4634 0.0166 0.4579 0.0165 -1.18 -0.580.244 0.827 1.1411 0.8122 0.0355 -6.00E-08 0.4546 0.0196 0.4463 0.0195 -1.83 -0.610.285 0.843 1.1266 0.7891 0.0418 1.20E-07 0.4446 0.0231 0.4337 0.023 -2.44 -0.570.33 0.859 1.1124 0.7641 0.0491 3.00E-07 0.4345 0.0273 0.4204 0.027 -3.25 -1.08
1 1 1 0.3074 0.3074 0.00E+00 0.2027 0.2027 0.1746 0.1746 -13.85 -13.85
196
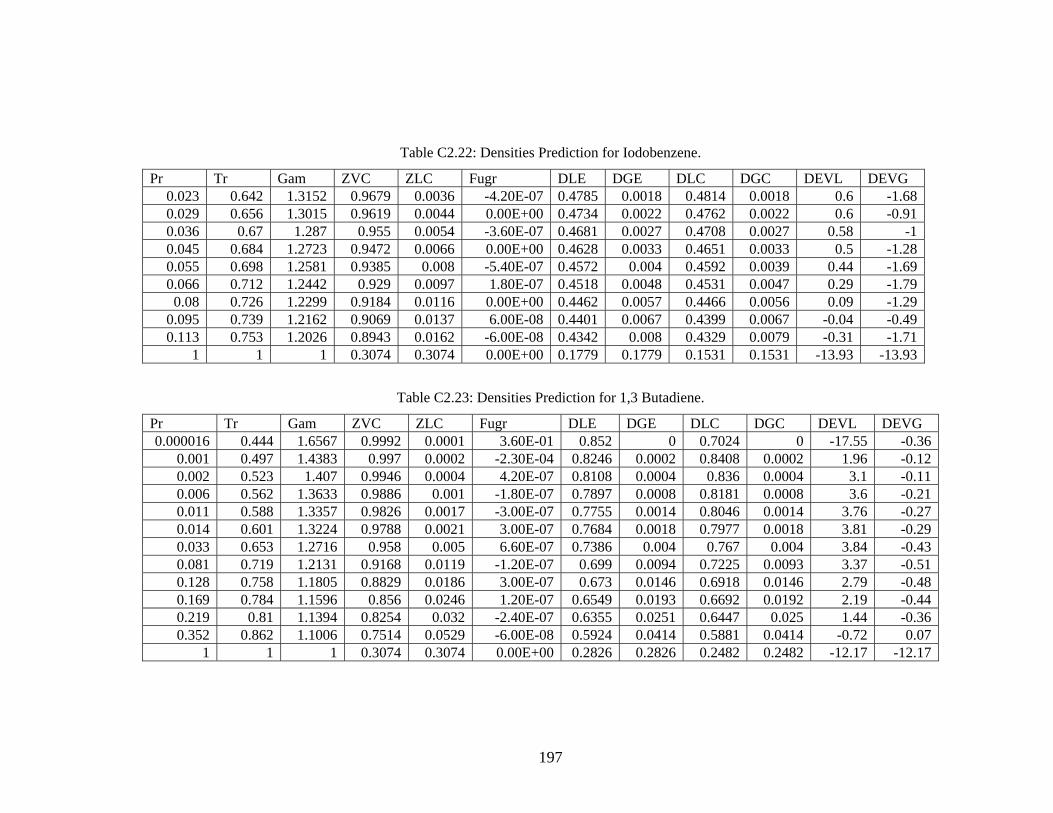
Table C2.22: Densities Prediction for Iodobenzene.
Pr Tr Gam ZVC ZLC Fugr DLE DGE DLC DGC DEVL DEVG 0.023 0.642 1.3152 0.9679 0.0036 -4.20E-07 0.4785 0.0018 0.4814 0.0018 0.6 -1.680.029 0.656 1.3015 0.9619 0.0044 0.00E+00 0.4734 0.0022 0.4762 0.0022 0.6 -0.910.036 0.67 1.287 0.955 0.0054 -3.60E-07 0.4681 0.0027 0.4708 0.0027 0.58 -10.045 0.684 1.2723 0.9472 0.0066 0.00E+00 0.4628 0.0033 0.4651 0.0033 0.5 -1.280.055 0.698 1.2581 0.9385 0.008 -5.40E-07 0.4572 0.004 0.4592 0.0039 0.44 -1.690.066 0.712 1.2442 0.929 0.0097 1.80E-07 0.4518 0.0048 0.4531 0.0047 0.29 -1.790.08 0.726 1.2299 0.9184 0.0116 0.00E+00 0.4462 0.0057 0.4466 0.0056 0.09 -1.29
0.095 0.739 1.2162 0.9069 0.0137 6.00E-08 0.4401 0.0067 0.4399 0.0067 -0.04 -0.490.113 0.753 1.2026 0.8943 0.0162 -6.00E-08 0.4342 0.008 0.4329 0.0079 -0.31 -1.71
1 1 1 0.3074 0.3074 0.00E+00 0.1779 0.1779 0.1531 0.1531 -13.93 -13.93
Table C2.23: Densities Prediction for 1,3 Butadiene.
Pr Tr Gam ZVC ZLC Fugr DLE DGE DLC DGC DEVL DEVG 0.000016 0.444 1.6567 0.9992 0.0001 3.60E-01 0.852 0 0.7024 0 -17.55 -0.36
0.001 0.497 1.4383 0.997 0.0002 -2.30E-04 0.8246 0.0002 0.8408 0.0002 1.96 -0.120.002 0.523 1.407 0.9946 0.0004 4.20E-07 0.8108 0.0004 0.836 0.0004 3.1 -0.110.006 0.562 1.3633 0.9886 0.001 -1.80E-07 0.7897 0.0008 0.8181 0.0008 3.6 -0.210.011 0.588 1.3357 0.9826 0.0017 -3.00E-07 0.7755 0.0014 0.8046 0.0014 3.76 -0.270.014 0.601 1.3224 0.9788 0.0021 3.00E-07 0.7684 0.0018 0.7977 0.0018 3.81 -0.290.033 0.653 1.2716 0.958 0.005 6.60E-07 0.7386 0.004 0.767 0.004 3.84 -0.430.081 0.719 1.2131 0.9168 0.0119 -1.20E-07 0.699 0.0094 0.7225 0.0093 3.37 -0.510.128 0.758 1.1805 0.8829 0.0186 3.00E-07 0.673 0.0146 0.6918 0.0146 2.79 -0.480.169 0.784 1.1596 0.856 0.0246 1.20E-07 0.6549 0.0193 0.6692 0.0192 2.19 -0.440.219 0.81 1.1394 0.8254 0.032 -2.40E-07 0.6355 0.0251 0.6447 0.025 1.44 -0.360.352 0.862 1.1006 0.7514 0.0529 -6.00E-08 0.5924 0.0414 0.5881 0.0414 -0.72 0.07
1 1 1 0.3074 0.3074 0.00E+00 0.2826 0.2826 0.2482 0.2482 -12.17 -12.17
197

Table C2.24: Densities Prediction for Xenon.
Pr Tr Gam ZVC ZLC Fugr DLE DGE DLC DGC DEVL DEVG 0.103 0.701 1.1226 0.8954 0.016 6.00E-08 1.3276 0.0228 1.4075 0.0252 6.02 10.390.147 0.736 1.1059 0.8648 0.0226 1.20E-07 1.2834 0.0376 1.3549 0.0354 5.57 -5.97
0.2 0.77 1.093 0.8311 0.0306 0.00E+00 1.2387 0.0514 1.3003 0.0479 4.97 -6.890.272 0.805 1.0748 0.7887 0.0419 -1.20E-07 1.194 0.0651 1.2344 0.0656 3.38 0.690.346 0.839 1.0681 0.749 0.0537 1.80E-07 1.1459 0.0856 1.1742 0.0842 2.47 -1.620.459 0.874 1.0458 0.6887 0.0741 0.00E+00 1.0898 0.1132 1.0843 0.1166 -0.51 3.010.548 0.908 1.0479 0.6461 0.0904 0.00E+00 1.0314 0.1488 1.0209 0.1428 -1.02 -4.030.708 0.943 1.0241 0.5605 0.1286 -3.60E-07 0.9448 0.2002 0.8927 0.2049 -5.52 2.34
1 1 1 0.3074 0.3074 0.00E+00 0.5487 0.5487 0.4972 0.4972 -9.39 -9.39
Table C2.25: Densities Prediction for Helium.
Pr Tr Gam ZVC ZLC Fugr DLE DGE DLC DGC DEVL DEVG 0.023 0.423 0.8098 0.9542 0.0055 -3.60E-07 2.2782 0.0192 3.2823 0.0191 44.08 -0.850.037 0.462 0.8303 0.9379 0.0081 2.40E-07 2.2644 0.0281 3.2025 0.0278 41.43 -0.980.054 0.5 0.8494 0.9192 0.0114 1.20E-07 2.2466 0.0392 3.1207 0.0388 38.91 -1.040.077 0.538 0.8671 0.898 0.0155 6.00E-07 2.2251 0.0529 3.0361 0.0524 36.45 -0.980.106 0.577 0.8835 0.8746 0.0204 1.20E-07 2.2003 0.0694 2.9481 0.0688 33.99 -0.820.141 0.615 0.8988 0.8488 0.0263 -1.20E-07 2.1721 0.089 2.8564 0.0884 31.5 -0.650.183 0.654 0.913 0.8207 0.0333 -6.00E-08 2.1406 0.1123 2.7601 0.1118 28.94 -0.440.233 0.692 0.9262 0.79 0.0415 6.00E-08 2.1051 0.1399 2.6581 0.1397 26.27 -0.130.291 0.731 0.9384 0.7568 0.0513 -1.80E-07 2.0652 0.1724 2.5498 0.1728 23.46 0.20.358 0.769 0.9498 0.7208 0.0629 0.00E+00 2.0199 0.2111 2.4337 0.2122 20.49 0.570.435 0.808 0.9603 0.6814 0.0767 6.00E-08 1.9676 0.2574 2.3078 0.2599 17.29 0.950.523 0.846 0.97 0.638 0.0937 2.40E-07 1.9059 0.3142 2.1689 0.3184 13.8 1.340.622 0.885 0.9788 0.5893 0.1149 -8.90E-08 1.8302 0.3861 2.0124 0.3923 9.95 1.6
1 1 1 0.3074 0.3074 0.00E+00 1.0862 1.0862 1.0689 1.0689 -1.59 -1.59
198
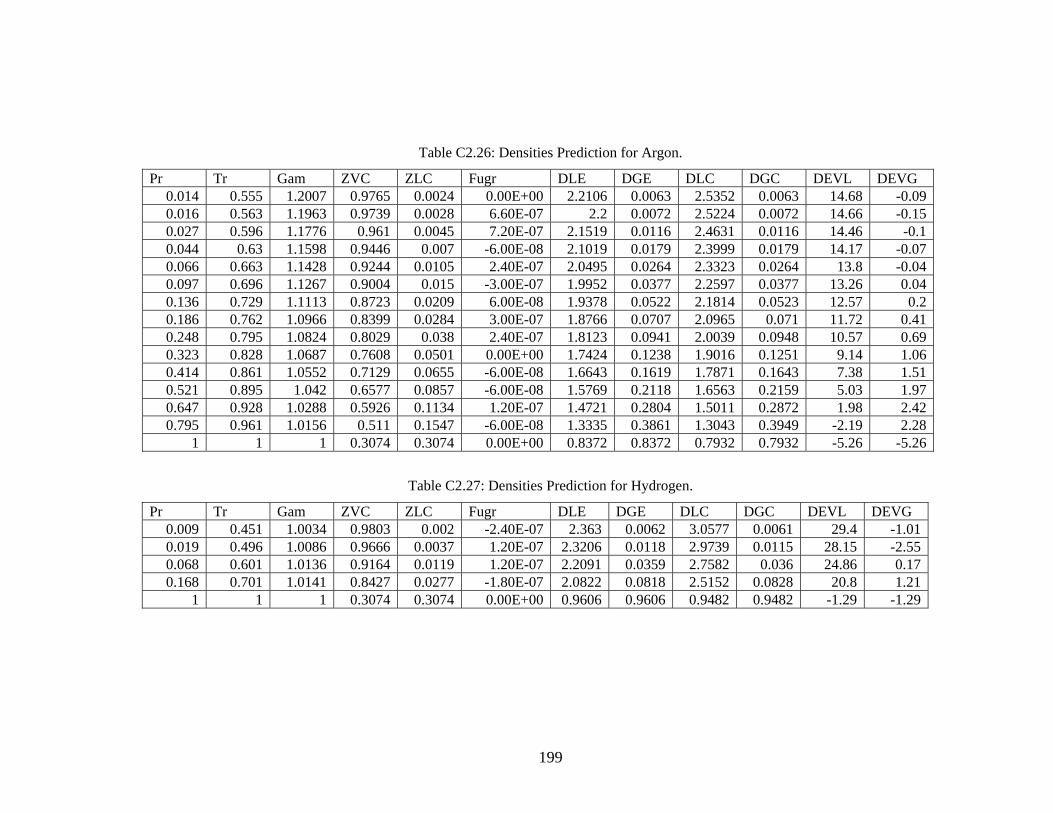
Table C2.26: Densities Prediction for Argon.
Pr Tr Gam ZVC ZLC Fugr DLE DGE DLC DGC DEVL DEVG 0.014 0.555 1.2007 0.9765 0.0024 0.00E+00 2.2106 0.0063 2.5352 0.0063 14.68 -0.090.016 0.563 1.1963 0.9739 0.0028 6.60E-07 2.2 0.0072 2.5224 0.0072 14.66 -0.150.027 0.596 1.1776 0.961 0.0045 7.20E-07 2.1519 0.0116 2.4631 0.0116 14.46 -0.10.044 0.63 1.1598 0.9446 0.007 -6.00E-08 2.1019 0.0179 2.3999 0.0179 14.17 -0.070.066 0.663 1.1428 0.9244 0.0105 2.40E-07 2.0495 0.0264 2.3323 0.0264 13.8 -0.040.097 0.696 1.1267 0.9004 0.015 -3.00E-07 1.9952 0.0377 2.2597 0.0377 13.26 0.040.136 0.729 1.1113 0.8723 0.0209 6.00E-08 1.9378 0.0522 2.1814 0.0523 12.57 0.20.186 0.762 1.0966 0.8399 0.0284 3.00E-07 1.8766 0.0707 2.0965 0.071 11.72 0.410.248 0.795 1.0824 0.8029 0.038 2.40E-07 1.8123 0.0941 2.0039 0.0948 10.57 0.690.323 0.828 1.0687 0.7608 0.0501 0.00E+00 1.7424 0.1238 1.9016 0.1251 9.14 1.060.414 0.861 1.0552 0.7129 0.0655 -6.00E-08 1.6643 0.1619 1.7871 0.1643 7.38 1.510.521 0.895 1.042 0.6577 0.0857 -6.00E-08 1.5769 0.2118 1.6563 0.2159 5.03 1.970.647 0.928 1.0288 0.5926 0.1134 1.20E-07 1.4721 0.2804 1.5011 0.2872 1.98 2.420.795 0.961 1.0156 0.511 0.1547 -6.00E-08 1.3335 0.3861 1.3043 0.3949 -2.19 2.28
1 1 1 0.3074 0.3074 0.00E+00 0.8372 0.8372 0.7932 0.7932 -5.26 -5.26
Table C2.27: Densities Prediction for Hydrogen.
Pr Tr Gam ZVC ZLC Fugr DLE DGE DLC DGC DEVL DEVG 0.009 0.451 1.0034 0.9803 0.002 -2.40E-07 2.363 0.0062 3.0577 0.0061 29.4 -1.010.019 0.496 1.0086 0.9666 0.0037 1.20E-07 2.3206 0.0118 2.9739 0.0115 28.15 -2.550.068 0.601 1.0136 0.9164 0.0119 1.20E-07 2.2091 0.0359 2.7582 0.036 24.86 0.170.168 0.701 1.0141 0.8427 0.0277 -1.80E-07 2.0822 0.0818 2.5152 0.0828 20.8 1.21
1 1 1 0.3074 0.3074 0.00E+00 0.9606 0.9606 0.9482 0.9482 -1.29 -1.29
199
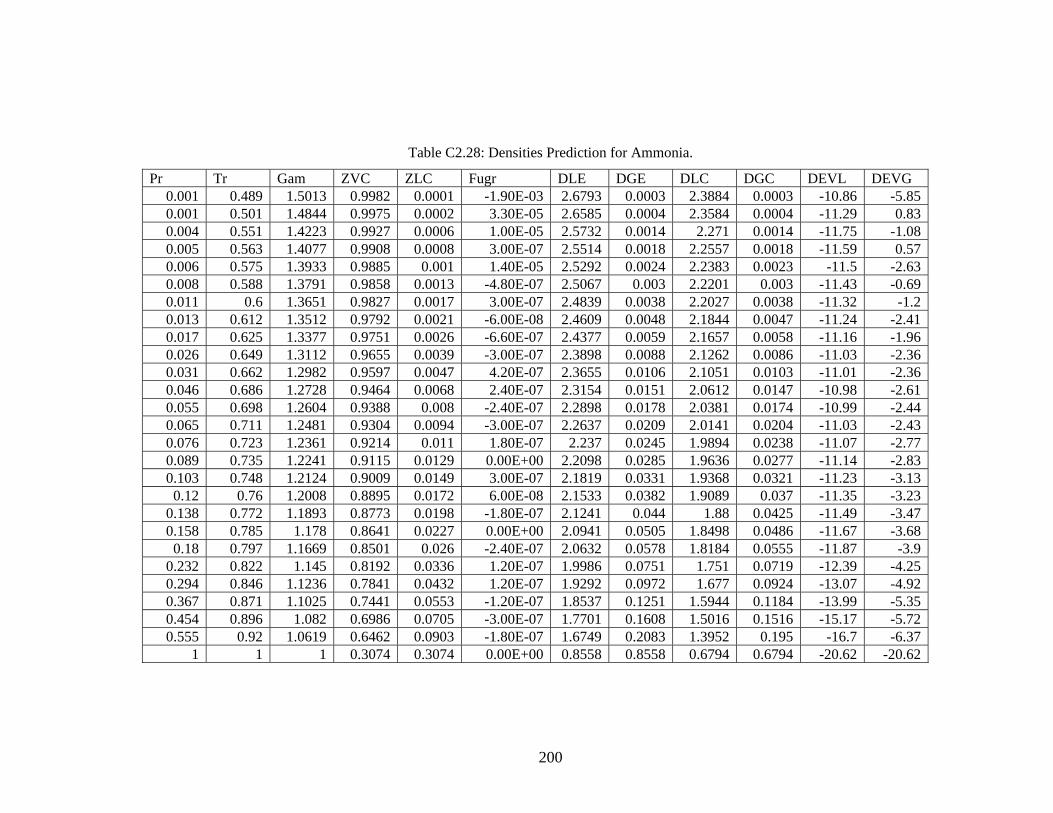
Table C2.28: Densities Prediction for Ammonia.
Pr Tr Gam ZVC ZLC Fugr DLE DGE DLC DGC DEVL DEVG 0.001 0.489 1.5013 0.9982 0.0001 -1.90E-03 2.6793 0.0003 2.3884 0.0003 -10.86 -5.850.001 0.501 1.4844 0.9975 0.0002 3.30E-05 2.6585 0.0004 2.3584 0.0004 -11.29 0.830.004 0.551 1.4223 0.9927 0.0006 1.00E-05 2.5732 0.0014 2.271 0.0014 -11.75 -1.080.005 0.563 1.4077 0.9908 0.0008 3.00E-07 2.5514 0.0018 2.2557 0.0018 -11.59 0.570.006 0.575 1.3933 0.9885 0.001 1.40E-05 2.5292 0.0024 2.2383 0.0023 -11.5 -2.630.008 0.588 1.3791 0.9858 0.0013 -4.80E-07 2.5067 0.003 2.2201 0.003 -11.43 -0.690.011 0.6 1.3651 0.9827 0.0017 3.00E-07 2.4839 0.0038 2.2027 0.0038 -11.32 -1.20.013 0.612 1.3512 0.9792 0.0021 -6.00E-08 2.4609 0.0048 2.1844 0.0047 -11.24 -2.410.017 0.625 1.3377 0.9751 0.0026 -6.60E-07 2.4377 0.0059 2.1657 0.0058 -11.16 -1.960.026 0.649 1.3112 0.9655 0.0039 -3.00E-07 2.3898 0.0088 2.1262 0.0086 -11.03 -2.360.031 0.662 1.2982 0.9597 0.0047 4.20E-07 2.3655 0.0106 2.1051 0.0103 -11.01 -2.360.046 0.686 1.2728 0.9464 0.0068 2.40E-07 2.3154 0.0151 2.0612 0.0147 -10.98 -2.610.055 0.698 1.2604 0.9388 0.008 -2.40E-07 2.2898 0.0178 2.0381 0.0174 -10.99 -2.440.065 0.711 1.2481 0.9304 0.0094 -3.00E-07 2.2637 0.0209 2.0141 0.0204 -11.03 -2.430.076 0.723 1.2361 0.9214 0.011 1.80E-07 2.237 0.0245 1.9894 0.0238 -11.07 -2.770.089 0.735 1.2241 0.9115 0.0129 0.00E+00 2.2098 0.0285 1.9636 0.0277 -11.14 -2.830.103 0.748 1.2124 0.9009 0.0149 3.00E-07 2.1819 0.0331 1.9368 0.0321 -11.23 -3.130.12 0.76 1.2008 0.8895 0.0172 6.00E-08 2.1533 0.0382 1.9089 0.037 -11.35 -3.23
0.138 0.772 1.1893 0.8773 0.0198 -1.80E-07 2.1241 0.044 1.88 0.0425 -11.49 -3.470.158 0.785 1.178 0.8641 0.0227 0.00E+00 2.0941 0.0505 1.8498 0.0486 -11.67 -3.680.18 0.797 1.1669 0.8501 0.026 -2.40E-07 2.0632 0.0578 1.8184 0.0555 -11.87 -3.9
0.232 0.822 1.145 0.8192 0.0336 1.20E-07 1.9986 0.0751 1.751 0.0719 -12.39 -4.250.294 0.846 1.1236 0.7841 0.0432 1.20E-07 1.9292 0.0972 1.677 0.0924 -13.07 -4.920.367 0.871 1.1025 0.7441 0.0553 -1.20E-07 1.8537 0.1251 1.5944 0.1184 -13.99 -5.350.454 0.896 1.082 0.6986 0.0705 -3.00E-07 1.7701 0.1608 1.5016 0.1516 -15.17 -5.720.555 0.92 1.0619 0.6462 0.0903 -1.80E-07 1.6749 0.2083 1.3952 0.195 -16.7 -6.37
1 1 1 0.3074 0.3074 0.00E+00 0.8558 0.8558 0.6794 0.6794 -20.62 -20.62
200

Table C2.29: Densities Prediction for Acetic Acid.
Pr Tr Gam ZVC ZLC Fugr DLE DGE DLC DGC DEVL DEVG 0.018 0.659 1.414 0.9755 0.0026 1.20E-07 0.9751 0.0033 0.7579 0.002 -22.27 -39.660.033 0.695 1.3638 0.9598 0.0047 4.20E-07 0.9451 0.0057 0.7364 0.0036 -22.08 -36.60.055 0.728 1.3214 0.9403 0.0077 -1.80E-07 0.9178 0.0092 0.7146 0.0059 -22.15 -36.070.135 0.796 1.2386 0.8827 0.0187 1.20E-07 0.8592 0.0213 0.662 0.014 -22.95 -34.30.288 0.863 1.1564 0.7914 0.0411 -1.20E-07 0.787 0.045 0.592 0.0308 -24.78 -31.640.342 0.88 1.1362 0.7618 0.0498 -6.00E-08 0.7655 0.0537 0.5705 0.0373 -25.48 -30.610.404 0.896 1.116 0.7287 0.0602 1.80E-07 0.7418 0.0641 0.5467 0.0452 -26.3 -29.520.555 0.93 1.0765 0.6501 0.0888 1.20E-07 0.6891 0.0918 0.4908 0.067 -28.78 -27.010.644 0.947 1.0574 0.6027 0.1088 8.90E-08 0.6584 0.1115 0.457 0.0825 -30.59 -26.040.745 0.964 1.0385 0.5469 0.1355 -8.90E-08 0.6185 0.1384 0.4169 0.1033 -32.6 -25.39
1 1 1 0.3074 0.3074 0.00E+00 0.3645 0.3645 0.2376 0.2376 -34.81 -34.81
Table C2.30: Densities Prediction for Acetone.
Pr Tr Gam ZVC ZLC Fugr DLE DGE DLC DGC DEVL DEVG 0.021 0.647 1.3448 0.9704 0.0032 -1.80E-07 0.8061 0.0021 0.7161 0.0024 -11.16 13.370.034 0.675 1.3124 0.9578 0.005 1.20E-07 0.7889 0.0032 0.7004 0.0037 -11.22 14.30.045 0.694 1.2919 0.9472 0.0066 1.80E-07 0.7728 0.0043 0.6888 0.0048 -10.87 12.110.102 0.753 1.2272 0.9029 0.0145 -4.80E-07 0.7298 0.0097 0.6481 0.0104 -11.2 7.460.162 0.793 1.1866 0.8627 0.0231 1.80E-07 0.6987 0.014 0.6163 0.0165 -11.79 17.650.298 0.852 1.128 0.7823 0.0437 6.00E-08 0.646 0.0258 0.5585 0.0312 -13.54 20.960.429 0.891 1.0905 0.7122 0.0658 1.20E-07 0.6105 0.0419 0.5104 0.0471 -16.39 12.530.511 0.911 1.0713 0.6695 0.0812 1.20E-07 0.5804 0.0537 0.4815 0.0584 -17.04 8.740.601 0.93 1.0537 0.6225 0.1002 1.20E-07 0.5525 0.0699 0.4495 0.0723 -18.64 3.480.702 0.95 1.0368 0.5682 0.1248 -6.00E-08 0.5181 0.0914 0.4125 0.0906 -20.39 -0.850.818 0.97 1.0192 0.5 0.161 6.00E-08 0.4762 0.1182 0.3652 0.1176 -23.31 -0.54
1 1 1 0.3074 0.3074 0.00E+00 0.2934 0.2934 0.2268 0.2268 -22.72 -22.72
201
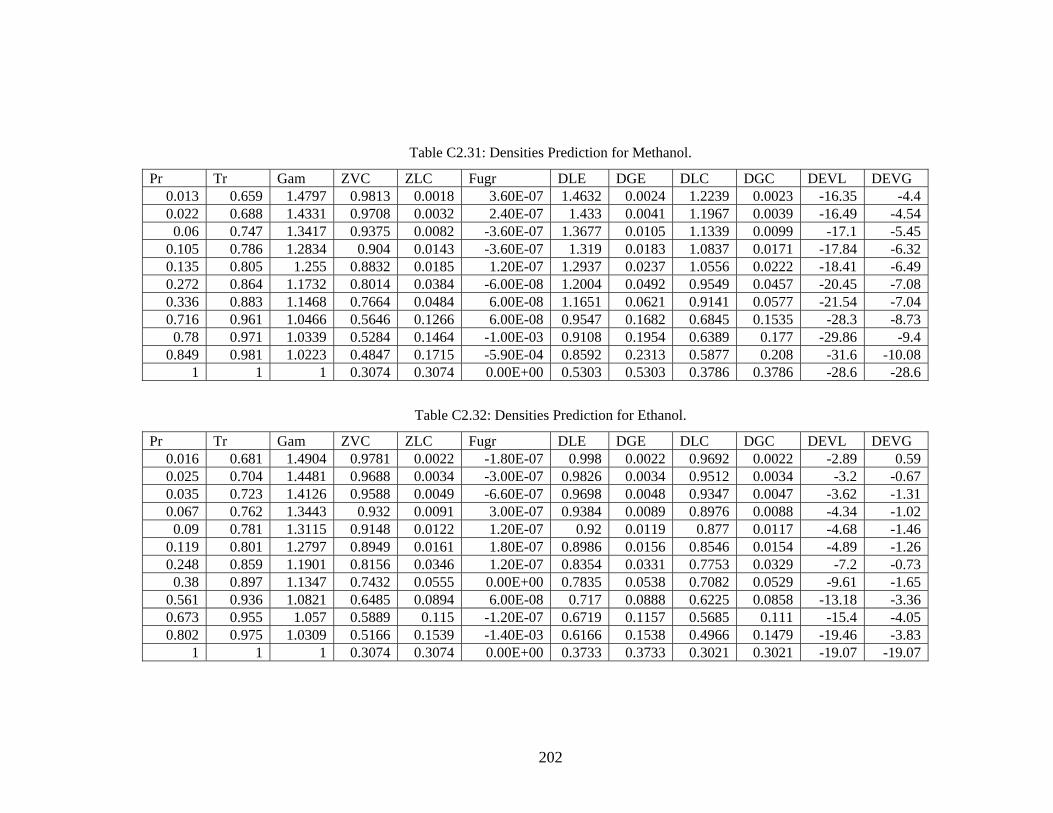
Table C2.31: Densities Prediction for Methanol.
Pr Tr Gam ZVC ZLC Fugr DLE DGE DLC DGC DEVL DEVG 0.013 0.659 1.4797 0.9813 0.0018 3.60E-07 1.4632 0.0024 1.2239 0.0023 -16.35 -4.40.022 0.688 1.4331 0.9708 0.0032 2.40E-07 1.433 0.0041 1.1967 0.0039 -16.49 -4.540.06 0.747 1.3417 0.9375 0.0082 -3.60E-07 1.3677 0.0105 1.1339 0.0099 -17.1 -5.45
0.105 0.786 1.2834 0.904 0.0143 -3.60E-07 1.319 0.0183 1.0837 0.0171 -17.84 -6.320.135 0.805 1.255 0.8832 0.0185 1.20E-07 1.2937 0.0237 1.0556 0.0222 -18.41 -6.490.272 0.864 1.1732 0.8014 0.0384 -6.00E-08 1.2004 0.0492 0.9549 0.0457 -20.45 -7.080.336 0.883 1.1468 0.7664 0.0484 6.00E-08 1.1651 0.0621 0.9141 0.0577 -21.54 -7.040.716 0.961 1.0466 0.5646 0.1266 6.00E-08 0.9547 0.1682 0.6845 0.1535 -28.3 -8.730.78 0.971 1.0339 0.5284 0.1464 -1.00E-03 0.9108 0.1954 0.6389 0.177 -29.86 -9.4
0.849 0.981 1.0223 0.4847 0.1715 -5.90E-04 0.8592 0.2313 0.5877 0.208 -31.6 -10.081 1 1 0.3074 0.3074 0.00E+00 0.5303 0.5303 0.3786 0.3786 -28.6 -28.6
Table C2.32: Densities Prediction for Ethanol.
Pr Tr Gam ZVC ZLC Fugr DLE DGE DLC DGC DEVL DEVG 0.016 0.681 1.4904 0.9781 0.0022 -1.80E-07 0.998 0.0022 0.9692 0.0022 -2.89 0.590.025 0.704 1.4481 0.9688 0.0034 -3.00E-07 0.9826 0.0034 0.9512 0.0034 -3.2 -0.670.035 0.723 1.4126 0.9588 0.0049 -6.60E-07 0.9698 0.0048 0.9347 0.0047 -3.62 -1.310.067 0.762 1.3443 0.932 0.0091 3.00E-07 0.9384 0.0089 0.8976 0.0088 -4.34 -1.020.09 0.781 1.3115 0.9148 0.0122 1.20E-07 0.92 0.0119 0.877 0.0117 -4.68 -1.46
0.119 0.801 1.2797 0.8949 0.0161 1.80E-07 0.8986 0.0156 0.8546 0.0154 -4.89 -1.260.248 0.859 1.1901 0.8156 0.0346 1.20E-07 0.8354 0.0331 0.7753 0.0329 -7.2 -0.730.38 0.897 1.1347 0.7432 0.0555 0.00E+00 0.7835 0.0538 0.7082 0.0529 -9.61 -1.65
0.561 0.936 1.0821 0.6485 0.0894 6.00E-08 0.717 0.0888 0.6225 0.0858 -13.18 -3.360.673 0.955 1.057 0.5889 0.115 -1.20E-07 0.6719 0.1157 0.5685 0.111 -15.4 -4.050.802 0.975 1.0309 0.5166 0.1539 -1.40E-03 0.6166 0.1538 0.4966 0.1479 -19.46 -3.83
1 1 1 0.3074 0.3074 0.00E+00 0.3733 0.3733 0.3021 0.3021 -19.07 -19.07
202
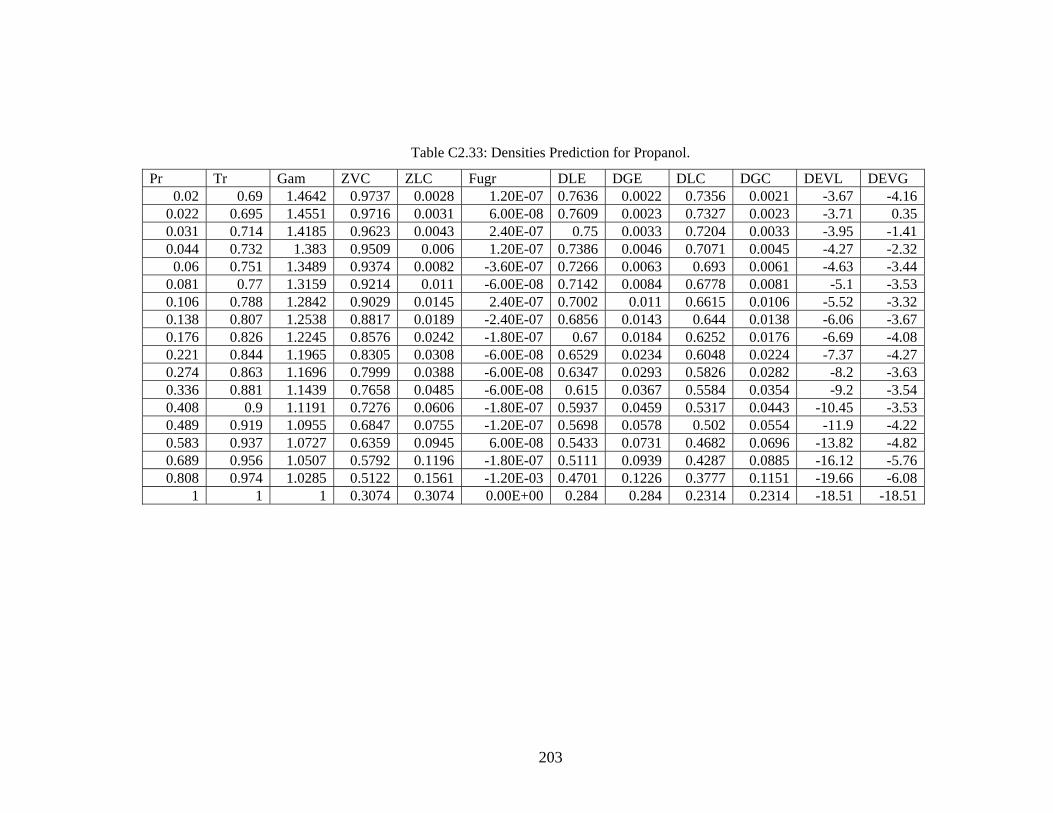
Table C2.33: Densities Prediction for Propanol.
Pr Tr Gam ZVC ZLC Fugr DLE DGE DLC DGC DEVL DEVG 0.02 0.69 1.4642 0.9737 0.0028 1.20E-07 0.7636 0.0022 0.7356 0.0021 -3.67 -4.16
0.022 0.695 1.4551 0.9716 0.0031 6.00E-08 0.7609 0.0023 0.7327 0.0023 -3.71 0.350.031 0.714 1.4185 0.9623 0.0043 2.40E-07 0.75 0.0033 0.7204 0.0033 -3.95 -1.410.044 0.732 1.383 0.9509 0.006 1.20E-07 0.7386 0.0046 0.7071 0.0045 -4.27 -2.320.06 0.751 1.3489 0.9374 0.0082 -3.60E-07 0.7266 0.0063 0.693 0.0061 -4.63 -3.44
0.081 0.77 1.3159 0.9214 0.011 -6.00E-08 0.7142 0.0084 0.6778 0.0081 -5.1 -3.530.106 0.788 1.2842 0.9029 0.0145 2.40E-07 0.7002 0.011 0.6615 0.0106 -5.52 -3.320.138 0.807 1.2538 0.8817 0.0189 -2.40E-07 0.6856 0.0143 0.644 0.0138 -6.06 -3.670.176 0.826 1.2245 0.8576 0.0242 -1.80E-07 0.67 0.0184 0.6252 0.0176 -6.69 -4.080.221 0.844 1.1965 0.8305 0.0308 -6.00E-08 0.6529 0.0234 0.6048 0.0224 -7.37 -4.270.274 0.863 1.1696 0.7999 0.0388 -6.00E-08 0.6347 0.0293 0.5826 0.0282 -8.2 -3.630.336 0.881 1.1439 0.7658 0.0485 -6.00E-08 0.615 0.0367 0.5584 0.0354 -9.2 -3.540.408 0.9 1.1191 0.7276 0.0606 -1.80E-07 0.5937 0.0459 0.5317 0.0443 -10.45 -3.530.489 0.919 1.0955 0.6847 0.0755 -1.20E-07 0.5698 0.0578 0.502 0.0554 -11.9 -4.220.583 0.937 1.0727 0.6359 0.0945 6.00E-08 0.5433 0.0731 0.4682 0.0696 -13.82 -4.820.689 0.956 1.0507 0.5792 0.1196 -1.80E-07 0.5111 0.0939 0.4287 0.0885 -16.12 -5.760.808 0.974 1.0285 0.5122 0.1561 -1.20E-03 0.4701 0.1226 0.3777 0.1151 -19.66 -6.08
1 1 1 0.3074 0.3074 0.00E+00 0.284 0.284 0.2314 0.2314 -18.51 -18.51
203
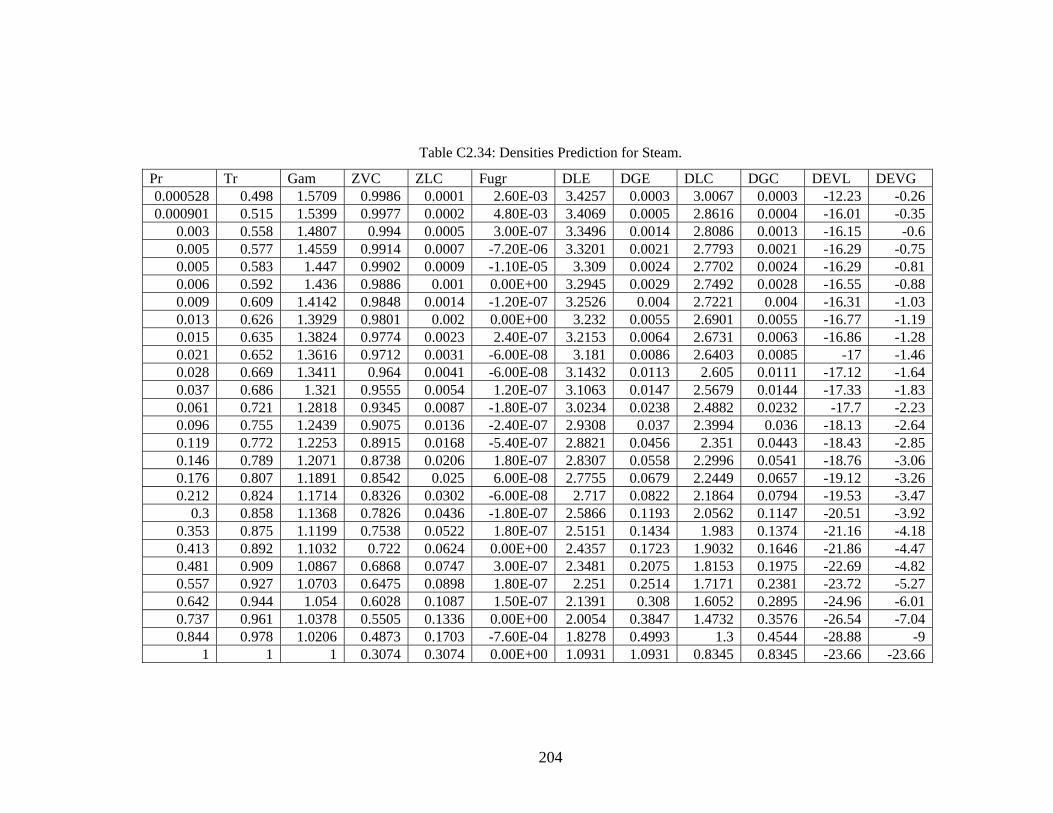
Table C2.34: Densities Prediction for Steam.
Pr Tr Gam ZVC ZLC Fugr DLE DGE DLC DGC DEVL DEVG 0.000528 0.498 1.5709 0.9986 0.0001 2.60E-03 3.4257 0.0003 3.0067 0.0003 -12.23 -0.260.000901 0.515 1.5399 0.9977 0.0002 4.80E-03 3.4069 0.0005 2.8616 0.0004 -16.01 -0.35
0.003 0.558 1.4807 0.994 0.0005 3.00E-07 3.3496 0.0014 2.8086 0.0013 -16.15 -0.60.005 0.577 1.4559 0.9914 0.0007 -7.20E-06 3.3201 0.0021 2.7793 0.0021 -16.29 -0.750.005 0.583 1.447 0.9902 0.0009 -1.10E-05 3.309 0.0024 2.7702 0.0024 -16.29 -0.810.006 0.592 1.436 0.9886 0.001 0.00E+00 3.2945 0.0029 2.7492 0.0028 -16.55 -0.880.009 0.609 1.4142 0.9848 0.0014 -1.20E-07 3.2526 0.004 2.7221 0.004 -16.31 -1.030.013 0.626 1.3929 0.9801 0.002 0.00E+00 3.232 0.0055 2.6901 0.0055 -16.77 -1.190.015 0.635 1.3824 0.9774 0.0023 2.40E-07 3.2153 0.0064 2.6731 0.0063 -16.86 -1.280.021 0.652 1.3616 0.9712 0.0031 -6.00E-08 3.181 0.0086 2.6403 0.0085 -17 -1.460.028 0.669 1.3411 0.964 0.0041 -6.00E-08 3.1432 0.0113 2.605 0.0111 -17.12 -1.640.037 0.686 1.321 0.9555 0.0054 1.20E-07 3.1063 0.0147 2.5679 0.0144 -17.33 -1.830.061 0.721 1.2818 0.9345 0.0087 -1.80E-07 3.0234 0.0238 2.4882 0.0232 -17.7 -2.230.096 0.755 1.2439 0.9075 0.0136 -2.40E-07 2.9308 0.037 2.3994 0.036 -18.13 -2.640.119 0.772 1.2253 0.8915 0.0168 -5.40E-07 2.8821 0.0456 2.351 0.0443 -18.43 -2.850.146 0.789 1.2071 0.8738 0.0206 1.80E-07 2.8307 0.0558 2.2996 0.0541 -18.76 -3.060.176 0.807 1.1891 0.8542 0.025 6.00E-08 2.7755 0.0679 2.2449 0.0657 -19.12 -3.260.212 0.824 1.1714 0.8326 0.0302 -6.00E-08 2.717 0.0822 2.1864 0.0794 -19.53 -3.47
0.3 0.858 1.1368 0.7826 0.0436 -1.80E-07 2.5866 0.1193 2.0562 0.1147 -20.51 -3.920.353 0.875 1.1199 0.7538 0.0522 1.80E-07 2.5151 0.1434 1.983 0.1374 -21.16 -4.180.413 0.892 1.1032 0.722 0.0624 0.00E+00 2.4357 0.1723 1.9032 0.1646 -21.86 -4.470.481 0.909 1.0867 0.6868 0.0747 3.00E-07 2.3481 0.2075 1.8153 0.1975 -22.69 -4.820.557 0.927 1.0703 0.6475 0.0898 1.80E-07 2.251 0.2514 1.7171 0.2381 -23.72 -5.270.642 0.944 1.054 0.6028 0.1087 1.50E-07 2.1391 0.308 1.6052 0.2895 -24.96 -6.010.737 0.961 1.0378 0.5505 0.1336 0.00E+00 2.0054 0.3847 1.4732 0.3576 -26.54 -7.040.844 0.978 1.0206 0.4873 0.1703 -7.60E-04 1.8278 0.4993 1.3 0.4544 -28.88 -9
1 1 1 0.3074 0.3074 0.00E+00 1.0931 1.0931 0.8345 0.8345 -23.66 -23.66
204
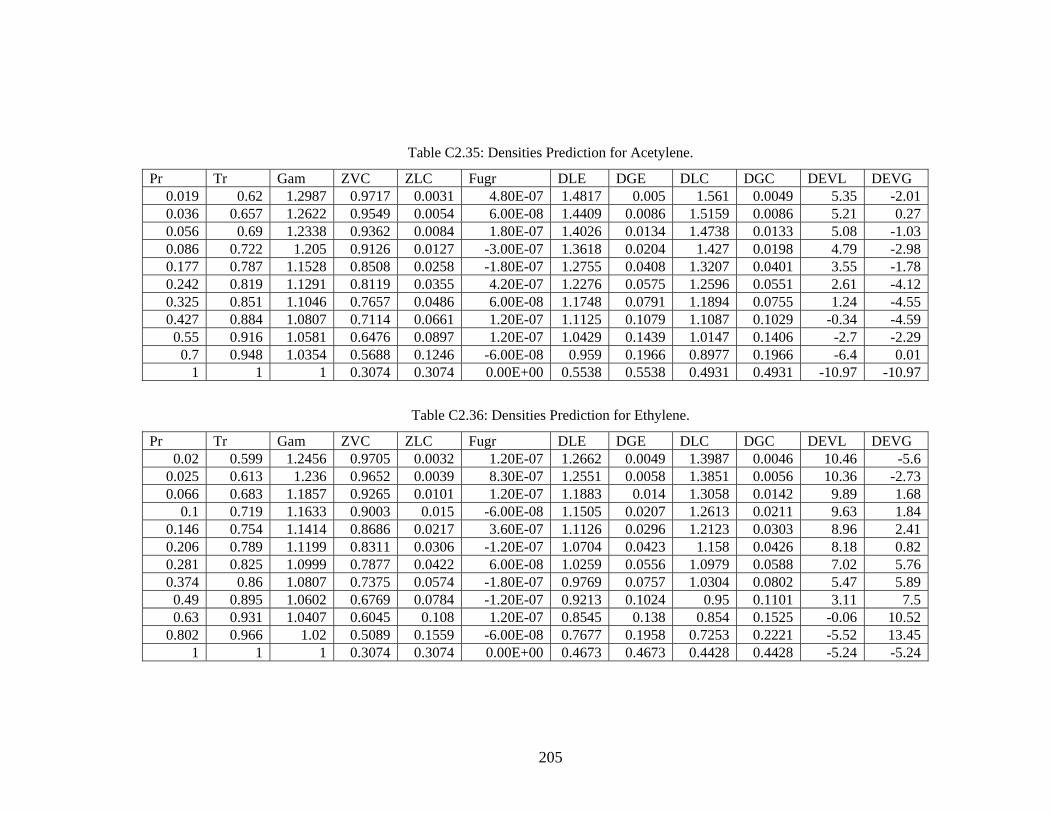
Table C2.35: Densities Prediction for Acetylene.
Pr Tr Gam ZVC ZLC Fugr DLE DGE DLC DGC DEVL DEVG 0.019 0.62 1.2987 0.9717 0.0031 4.80E-07 1.4817 0.005 1.561 0.0049 5.35 -2.010.036 0.657 1.2622 0.9549 0.0054 6.00E-08 1.4409 0.0086 1.5159 0.0086 5.21 0.270.056 0.69 1.2338 0.9362 0.0084 1.80E-07 1.4026 0.0134 1.4738 0.0133 5.08 -1.030.086 0.722 1.205 0.9126 0.0127 -3.00E-07 1.3618 0.0204 1.427 0.0198 4.79 -2.980.177 0.787 1.1528 0.8508 0.0258 -1.80E-07 1.2755 0.0408 1.3207 0.0401 3.55 -1.780.242 0.819 1.1291 0.8119 0.0355 4.20E-07 1.2276 0.0575 1.2596 0.0551 2.61 -4.120.325 0.851 1.1046 0.7657 0.0486 6.00E-08 1.1748 0.0791 1.1894 0.0755 1.24 -4.550.427 0.884 1.0807 0.7114 0.0661 1.20E-07 1.1125 0.1079 1.1087 0.1029 -0.34 -4.590.55 0.916 1.0581 0.6476 0.0897 1.20E-07 1.0429 0.1439 1.0147 0.1406 -2.7 -2.29
0.7 0.948 1.0354 0.5688 0.1246 -6.00E-08 0.959 0.1966 0.8977 0.1966 -6.4 0.011 1 1 0.3074 0.3074 0.00E+00 0.5538 0.5538 0.4931 0.4931 -10.97 -10.97
Table C2.36: Densities Prediction for Ethylene.
Pr Tr Gam ZVC ZLC Fugr DLE DGE DLC DGC DEVL DEVG 0.02 0.599 1.2456 0.9705 0.0032 1.20E-07 1.2662 0.0049 1.3987 0.0046 10.46 -5.6
0.025 0.613 1.236 0.9652 0.0039 8.30E-07 1.2551 0.0058 1.3851 0.0056 10.36 -2.730.066 0.683 1.1857 0.9265 0.0101 1.20E-07 1.1883 0.014 1.3058 0.0142 9.89 1.68
0.1 0.719 1.1633 0.9003 0.015 -6.00E-08 1.1505 0.0207 1.2613 0.0211 9.63 1.840.146 0.754 1.1414 0.8686 0.0217 3.60E-07 1.1126 0.0296 1.2123 0.0303 8.96 2.410.206 0.789 1.1199 0.8311 0.0306 -1.20E-07 1.0704 0.0423 1.158 0.0426 8.18 0.820.281 0.825 1.0999 0.7877 0.0422 6.00E-08 1.0259 0.0556 1.0979 0.0588 7.02 5.760.374 0.86 1.0807 0.7375 0.0574 -1.80E-07 0.9769 0.0757 1.0304 0.0802 5.47 5.890.49 0.895 1.0602 0.6769 0.0784 -1.20E-07 0.9213 0.1024 0.95 0.1101 3.11 7.50.63 0.931 1.0407 0.6045 0.108 1.20E-07 0.8545 0.138 0.854 0.1525 -0.06 10.52
0.802 0.966 1.02 0.5089 0.1559 -6.00E-08 0.7677 0.1958 0.7253 0.2221 -5.52 13.451 1 1 0.3074 0.3074 0.00E+00 0.4673 0.4673 0.4428 0.4428 -5.24 -5.24
205

Table C2.37: Densities Prediction for Oxygen.
Pr Tr Gam ZVC ZLC Fugr DLE DGE DLC DGC DEVL DEVG 0.001 0.452 1.2932 0.9967 0.0002 -4.70E-04 2.4091 0.0007 2.768 0.0007 14.9 -0.380.006 0.517 1.2463 0.9881 0.0011 2.40E-07 2.3198 0.0029 2.6394 0.0029 13.78 0.010.02 0.581 1.2051 0.97 0.0033 -6.00E-08 2.2268 0.0086 2.5311 0.0086 13.67 -0.140.02 0.583 1.2043 0.9696 0.0033 1.20E-07 2.2256 0.0087 2.5292 0.0087 13.64 -0.110.05 0.646 1.1675 0.9392 0.0079 -1.80E-07 2.1275 0.0204 2.4078 0.0203 13.17 -0.12
0.107 0.711 1.133 0.8936 0.0164 -1.20E-07 2.0189 0.0415 2.2656 0.0415 12.22 0.020.201 0.775 1.101 0.8316 0.0305 -1.80E-07 1.8984 0.0766 2.0991 0.0769 10.57 0.380.344 0.84 1.071 0.7506 0.0532 -1.20E-07 1.7586 0.1332 1.8984 0.1345 7.95 0.990.489 0.905 1.0748 0.6808 0.077 1.80E-07 1.5844 0.2274 1.7302 0.1957 9.2 -13.97
1 1 1 0.3074 0.3074 0.00E+00 0.8322 0.8322 0.8021 0.8021 -3.61 -3.61
Table C2.38: Densities Prediction for Bromine.
Pr Tr Gam ZVC ZLC Fugr DLE DGE DLC DGC DEVL DEVG 0.000406 0.445 1.4229 0.9987 0.0001 1.60E-02 1.2577 0.0001 1.5391 0.0001 22.38 -0.68
0.003 0.514 1.3457 0.9934 0.0005 -1.20E-07 1.2087 0.0008 1.4474 0.0008 19.75 -0.010.013 0.582 1.2834 0.9791 0.0021 -2.40E-07 1.154 0.003 1.3896 0.003 20.42 0.510.023 0.616 1.2563 0.9672 0.0037 -3.60E-07 1.1277 0.0051 1.357 0.0051 20.33 0.940.039 0.65 1.2297 0.9512 0.006 1.20E-07 1.1004 0.0082 1.3213 0.0083 20.07 1.610.062 0.685 1.2037 0.9308 0.0094 -3.60E-07 1.0711 0.0126 1.2823 0.0129 19.71 2.480.138 0.753 1.1535 0.8746 0.0204 -3.00E-07 1.0055 0.0264 1.1923 0.0278 18.58 5.320.195 0.787 1.1297 0.8381 0.0289 -1.80E-07 0.971 0.0366 1.1401 0.0393 17.41 7.290.36 0.856 1.0842 0.7448 0.055 -6.00E-08 0.8923 0.0664 1.0155 0.075 13.81 13.01
0.472 0.89 1.0628 0.6861 0.075 1.20E-07 0.845 0.0878 0.9393 0.1027 11.16 17.030.607 0.924 1.0422 0.6161 0.1029 1.20E-07 0.7911 0.1159 0.8488 0.1417 7.29 22.250.768 0.959 1.0226 0.5288 0.145 -6.00E-08 0.7277 0.1559 0.7344 0.2013 0.91 29.16
1 1 1 0.3074 0.3074 0.00E+00 0.4609 0.4607 0.4323 0.4323 -6.22 -6.16
206
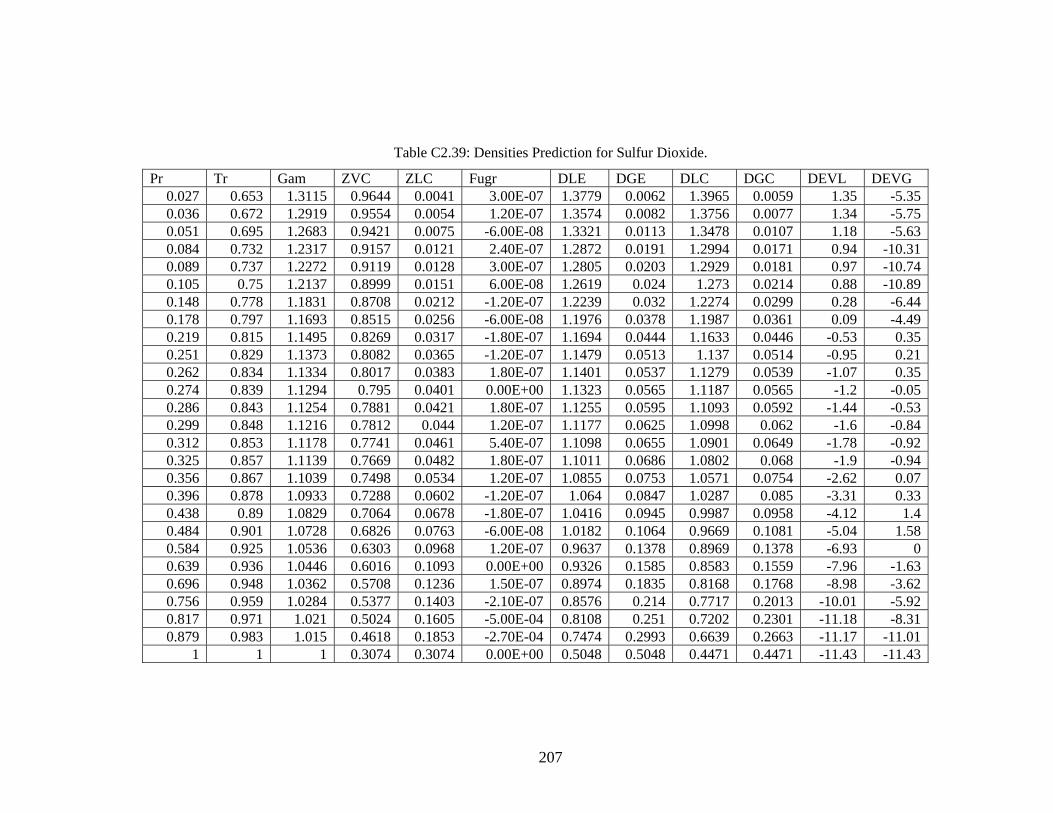
Table C2.39: Densities Prediction for Sulfur Dioxide.
Pr Tr Gam ZVC ZLC Fugr DLE DGE DLC DGC DEVL DEVG 0.027 0.653 1.3115 0.9644 0.0041 3.00E-07 1.3779 0.0062 1.3965 0.0059 1.35 -5.350.036 0.672 1.2919 0.9554 0.0054 1.20E-07 1.3574 0.0082 1.3756 0.0077 1.34 -5.750.051 0.695 1.2683 0.9421 0.0075 -6.00E-08 1.3321 0.0113 1.3478 0.0107 1.18 -5.630.084 0.732 1.2317 0.9157 0.0121 2.40E-07 1.2872 0.0191 1.2994 0.0171 0.94 -10.310.089 0.737 1.2272 0.9119 0.0128 3.00E-07 1.2805 0.0203 1.2929 0.0181 0.97 -10.740.105 0.75 1.2137 0.8999 0.0151 6.00E-08 1.2619 0.024 1.273 0.0214 0.88 -10.890.148 0.778 1.1831 0.8708 0.0212 -1.20E-07 1.2239 0.032 1.2274 0.0299 0.28 -6.440.178 0.797 1.1693 0.8515 0.0256 -6.00E-08 1.1976 0.0378 1.1987 0.0361 0.09 -4.490.219 0.815 1.1495 0.8269 0.0317 -1.80E-07 1.1694 0.0444 1.1633 0.0446 -0.53 0.350.251 0.829 1.1373 0.8082 0.0365 -1.20E-07 1.1479 0.0513 1.137 0.0514 -0.95 0.210.262 0.834 1.1334 0.8017 0.0383 1.80E-07 1.1401 0.0537 1.1279 0.0539 -1.07 0.350.274 0.839 1.1294 0.795 0.0401 0.00E+00 1.1323 0.0565 1.1187 0.0565 -1.2 -0.050.286 0.843 1.1254 0.7881 0.0421 1.80E-07 1.1255 0.0595 1.1093 0.0592 -1.44 -0.530.299 0.848 1.1216 0.7812 0.044 1.20E-07 1.1177 0.0625 1.0998 0.062 -1.6 -0.840.312 0.853 1.1178 0.7741 0.0461 5.40E-07 1.1098 0.0655 1.0901 0.0649 -1.78 -0.920.325 0.857 1.1139 0.7669 0.0482 1.80E-07 1.1011 0.0686 1.0802 0.068 -1.9 -0.940.356 0.867 1.1039 0.7498 0.0534 1.20E-07 1.0855 0.0753 1.0571 0.0754 -2.62 0.070.396 0.878 1.0933 0.7288 0.0602 -1.20E-07 1.064 0.0847 1.0287 0.085 -3.31 0.330.438 0.89 1.0829 0.7064 0.0678 -1.80E-07 1.0416 0.0945 0.9987 0.0958 -4.12 1.40.484 0.901 1.0728 0.6826 0.0763 -6.00E-08 1.0182 0.1064 0.9669 0.1081 -5.04 1.580.584 0.925 1.0536 0.6303 0.0968 1.20E-07 0.9637 0.1378 0.8969 0.1378 -6.93 00.639 0.936 1.0446 0.6016 0.1093 0.00E+00 0.9326 0.1585 0.8583 0.1559 -7.96 -1.630.696 0.948 1.0362 0.5708 0.1236 1.50E-07 0.8974 0.1835 0.8168 0.1768 -8.98 -3.620.756 0.959 1.0284 0.5377 0.1403 -2.10E-07 0.8576 0.214 0.7717 0.2013 -10.01 -5.920.817 0.971 1.021 0.5024 0.1605 -5.00E-04 0.8108 0.251 0.7202 0.2301 -11.18 -8.310.879 0.983 1.015 0.4618 0.1853 -2.70E-04 0.7474 0.2993 0.6639 0.2663 -11.17 -11.01
1 1 1 0.3074 0.3074 0.00E+00 0.5048 0.5048 0.4471 0.4471 -11.43 -11.43
207

Table C2.40: Densities Prediction for Methyl Propionate.
Pr Tr Gam ZVC ZLC Fugr DLE DGE DLC DGC DEVL DEVG 0.025 0.665 1.3517 0.9666 0.0037 -3.60E-07 0.596 0.0022 0.5755 0.0022 -3.44 1.380.062 0.722 1.2813 0.9337 0.0089 -6.00E-08 0.5666 0.0053 0.5466 0.0052 -3.54 -2.090.103 0.76 1.2376 0.9028 0.0145 4.20E-07 0.5459 0.0086 0.5245 0.0085 -3.93 -1.740.161 0.798 1.1961 0.8636 0.0228 6.00E-08 0.5236 0.0135 0.4994 0.0132 -4.62 -2.160.292 0.854 1.1376 0.7866 0.0425 1.20E-07 0.4858 0.0252 0.4545 0.0245 -6.45 -2.60.416 0.892 1.1004 0.7201 0.0631 1.20E-07 0.4567 0.03 0.4175 0.0366 -8.59 21.920.673 0.948 1.047 0.5859 0.1164 8.90E-08 0.3993 0.0685 0.3437 0.0683 -13.93 -0.310.78 0.967 1.0297 0.525 0.147 6.00E-08 0.3699 0.0876 0.3097 0.0867 -16.28 -1.03
0.839 0.977 1.0207 0.4897 0.1683 -5.20E-04 0.3526 0.1005 0.2881 0.099 -18.3 -1.50.901 0.986 1.0123 0.4454 0.1961 -2.30E-04 0.3298 0.1187 0.263 0.1158 -20.26 -2.47
1 1 1 0.3074 0.3074 0.00E+00 0.2214 0.2214 0.1835 0.1835 -17.11 -17.11
Table C2.41: Densities Prediction for Ethyl Propionate.
Pr Tr Gam ZVC ZLC Fugr DLE DGE DLC DGC DEVL DEVG 0.03 0.682 1.3526 0.962 0.0044 1.80E-07 0.4868 0.0021 0.4657 0.0021 -4.33 1.18
0.042 0.702 1.3266 0.9512 0.006 0.00E+00 0.4782 0.0029 0.4576 0.0029 -4.31 -0.460.055 0.72 1.3029 0.9396 0.0079 -1.80E-07 0.4702 0.0038 0.4497 0.0038 -4.37 -0.940.092 0.757 1.2578 0.911 0.013 6.00E-08 0.4531 0.0063 0.4324 0.0061 -4.56 -2.40.145 0.793 1.2154 0.8748 0.0204 0.00E+00 0.4349 0.0099 0.413 0.0096 -5.03 -2.90.264 0.848 1.1551 0.8032 0.0379 -1.20E-07 0.4049 0.0184 0.3784 0.0178 -6.54 -30.377 0.885 1.1173 0.7419 0.056 1.80E-07 0.3816 0.0273 0.3504 0.0264 -8.18 -3.20.446 0.903 1.0985 0.7057 0.068 1.20E-07 0.3684 0.0332 0.3341 0.0322 -9.3 -3.010.715 0.958 1.0427 0.5635 0.1271 -2.40E-07 0.3167 0.063 0.2702 0.061 -14.68 -3.240.83 0.976 1.0234 0.4974 0.1645 -9.50E-04 0.29 0.0817 0.2377 0.0786 -18.04 -3.78
0.893 0.986 1.0145 0.453 0.1913 -2.90E-04 0.2726 0.0955 0.2179 0.092 -20.06 -3.651 1 1 0.3074 0.3074 0.00E+00 0.1812 0.1812 0.1497 0.1497 -17.37 -17.37
208

Table C2.42: Densities Prediction for Methyl n-Butirate.
Pr Tr Gam ZVC ZLC Fugr DLE DGE DLC DGC DEVL DEVG 0.029 0.678 1.3525 0.963 0.0042 -3.60E-07 0.4911 0.0022 0.4771 0.0021 -2.84 -4.480.063 0.727 1.2893 0.9335 0.0089 -6.00E-08 0.4697 0.0045 0.4559 0.0043 -2.94 -3.490.102 0.763 1.2466 0.904 0.0143 -1.20E-07 0.4532 0.0071 0.4383 0.0069 -3.3 -2.30.127 0.781 1.2261 0.8864 0.0179 -2.40E-07 0.4444 0.0089 0.4286 0.0086 -3.55 -2.950.157 0.799 1.2061 0.8669 0.0221 0.00E+00 0.4353 0.011 0.4183 0.0107 -3.9 -3.040.233 0.835 1.1673 0.8211 0.0331 -3.60E-07 0.4156 0.0165 0.3956 0.016 -4.82 -3.210.334 0.871 1.1298 0.7649 0.0488 1.20E-07 0.3941 0.0243 0.369 0.0236 -6.36 -3.080.395 0.889 1.1114 0.7322 0.0591 2.40E-07 0.3821 0.0295 0.3539 0.0286 -7.38 -3.220.545 0.926 1.075 0.6543 0.0871 -1.20E-07 0.3529 0.0437 0.3182 0.0424 -9.84 -3.090.736 0.962 1.0391 0.5516 0.1331 1.20E-07 0.3158 0.0667 0.2708 0.0653 -14.24 -2.07
1 1 1 0.3074 0.3074 0.00E+00 0.1835 0.1835 0.1531 0.1531 -16.56 -16.56
Table C2.43: Densities Prediction for Methyl i-Butirate.
Pr Tr Gam ZVC ZLC Fugr DLE DGE DLC DGC DEVL DEVG 0.029 0.676 1.3452 0.9626 0.0043 -1.80E-07 0.4914 0.0022 0.4832 0.0022 -1.68 -1.70.037 0.69 1.3278 0.9554 0.0054 -3.60E-07 0.4856 0.0027 0.4774 0.0027 -1.68 -0.640.106 0.764 1.2386 0.9008 0.0149 3.00E-07 0.4521 0.0075 0.4423 0.0073 -2.16 -2.220.133 0.783 1.2179 0.8824 0.0187 -2.40E-07 0.443 0.0094 0.4322 0.0092 -2.44 -2.520.201 0.82 1.1782 0.8392 0.0286 1.80E-07 0.4238 0.0143 0.4099 0.014 -3.29 -2.360.294 0.857 1.1403 0.7862 0.0426 1.20E-07 0.403 0.0213 0.3841 0.0208 -4.69 -2.30.351 0.875 1.1218 0.7553 0.0517 2.40E-07 0.3919 0.0258 0.3695 0.0253 -5.72 -1.890.416 0.894 1.1036 0.721 0.0628 6.00E-08 0.379 0.0314 0.3534 0.0308 -6.74 -20.573 0.931 1.0678 0.6393 0.0931 1.20E-07 0.3478 0.0472 0.3155 0.046 -9.29 -2.630.668 0.949 1.0501 0.5892 0.1149 -6.00E-08 0.3292 0.0588 0.2921 0.057 -11.27 -3.10.774 0.968 1.0325 0.5293 0.1447 -3.00E-08 0.3069 0.0744 0.2639 0.0721 -14.01 -3.06
1 1 1 0.3074 0.3074 0.00E+00 0.1841 0.1841 0.1552 0.1552 -15.71 -15.71
209

Table C2.44: Densities Prediction for Methyl Acetate.
Pr Tr Gam ZVC ZLC Fugr DLE DGE DLC DGC DEVL DEVG 0.022 0.652 1.354 0.9704 0.0032 1.80E-07 0.745 0.0024 0.7141 0.0024 -4.14 -1.120.045 0.697 1.2989 0.9477 0.0066 3.00E-07 0.7179 0.0047 0.6874 0.0048 -4.25 1.170.079 0.736 1.2536 0.92 0.0113 0.00E+00 0.6928 0.0081 0.6609 0.0081 -4.6 0.110.162 0.795 1.1904 0.8625 0.0231 2.40E-07 0.6502 0.0166 0.6145 0.0165 -5.49 -0.84
0.3 0.855 1.1316 0.7821 0.0438 -6.00E-08 0.6011 0.0314 0.5568 0.0312 -7.36 -0.720.361 0.874 1.1128 0.749 0.0537 4.20E-07 0.5821 0.0387 0.5341 0.0383 -8.25 -1.030.431 0.894 1.0943 0.7121 0.0658 -6.00E-08 0.5622 0.0479 0.509 0.047 -9.46 -1.80.703 0.953 1.041 0.5689 0.1245 -6.00E-08 0.4838 0.0919 0.4118 0.0901 -14.87 -1.940.819 0.973 1.0226 0.5031 0.1611 -9.70E-04 0.445 0.1193 0.3631 0.1163 -18.39 -2.52
1 1 1 0.3074 0.3074 0.00E+00 0.2741 0.2741 0.2261 0.2261 -17.5 -17.5
Table C2.45: Densities Prediction for Ethyl Acetate.
Pr Tr Gam ZVC ZLC Fugr DLE DGE DLC DGC DEVL DEVG 0.026 0.67 1.3536 0.9656 0.0039 1.80E-07 0.5869 0.0023 0.5597 0.0022 -4.64 -2.220.04 0.694 1.3225 0.9531 0.0057 -1.80E-07 0.5748 0.0033 0.5482 0.0033 -4.64 -0.510.07 0.732 1.2755 0.9278 0.0099 -2.40E-07 0.5549 0.0057 0.5282 0.0056 -4.82 -1.260.09 0.751 1.2528 0.9122 0.0127 2.40E-07 0.5444 0.0073 0.5172 0.0072 -4.99 -1.08
0.144 0.79 1.2094 0.8746 0.0204 2.40E-07 0.5228 0.0117 0.4932 0.0115 -5.66 -1.730.18 0.809 1.1886 0.8524 0.0254 -6.00E-08 0.5109 0.0147 0.4799 0.0143 -6.07 -2.58
0.325 0.866 1.1286 0.7692 0.0476 6.00E-08 0.4714 0.0275 0.4332 0.0268 -8.1 -2.610.388 0.885 1.1095 0.7351 0.0581 -3.00E-07 0.4564 0.0337 0.4148 0.0328 -9.12 -2.660.462 0.904 1.0904 0.6967 0.0712 0.00E+00 0.44 0.0411 0.3942 0.0403 -10.4 -2.010.545 0.923 1.0719 0.6537 0.0873 -6.00E-08 0.4212 0.0505 0.3712 0.0496 -11.87 -1.780.639 0.942 1.0536 0.6042 0.1081 0.00E+00 0.4002 0.0631 0.3447 0.0617 -13.87 -2.270.745 0.962 1.0356 0.5459 0.136 6.00E-08 0.3742 0.0801 0.3131 0.078 -16.33 -2.61
1 1 1 0.3074 0.3074 0.00E+00 0.218 0.218 0.1788 0.1788 -17.98 -17.98
210

Table C2.46: Densities Prediction for Propyl Acetate.
Pr Tr Gam ZVC ZLC Fugr DLE DGE DLC DGC DEVL DEVG 0.03 0.682 1.353 0.9619 0.0044 2.40E-07 0.4878 0.0021 0.4612 0.0021 -5.46 0.51
0.039 0.698 1.333 0.9538 0.0056 0.00E+00 0.4786 0.0027 0.4551 0.0027 -4.92 -1.030.087 0.752 1.2636 0.9151 0.0122 -4.20E-07 0.4545 0.0058 0.4306 0.0057 -5.27 -1.080.137 0.789 1.2203 0.8798 0.0193 1.80E-07 0.437 0.0091 0.4116 0.009 -5.81 -0.890.302 0.861 1.1403 0.782 0.0438 2.40E-07 0.3966 0.0207 0.3651 0.0205 -7.95 -1.190.36 0.88 1.1213 0.7505 0.0532 0.00E+00 0.3851 0.0252 0.3509 0.0249 -8.88 -1.26
0.427 0.898 1.1025 0.7155 0.0647 0.00E+00 0.3721 0.0307 0.3352 0.0303 -9.91 -1.310.685 0.952 1.0473 0.58 0.1192 3.00E-08 0.3233 0.0574 0.275 0.0565 -14.94 -1.530.794 0.971 1.0282 0.5194 0.1519 -1.30E-03 0.3 0.0737 0.2455 0.0718 -18.18 -2.58
1 1 1 0.3074 0.3074 0.00E+00 0.1807 0.1807 0.1483 0.1483 -17.94 -17.94
Table C2.47: Densities Prediction for Methyl Chloride.
Pr Tr Gam ZVC ZLC Fugr DLE DGE DLC DGC DEVL DEVG 0.015 0.599 1.2945 0.9765 0.0024 7.70E-07 1.2328 0.0032 1.2526 0.0031 1.61 -2.310.038 0.656 1.2474 0.9525 0.0058 -6.00E-08 1.1808 0.0074 1.2 0.0073 1.63 -1.240.053 0.68 1.2284 0.9389 0.008 1.80E-07 1.1586 0.0101 1.1757 0.01 1.48 -1.150.126 0.752 1.173 0.8833 0.0185 -6.00E-08 1.0856 0.0234 1.0925 0.0229 0.63 -2.110.162 0.776 1.156 0.8597 0.0237 -1.80E-07 1.0584 0.0299 1.0611 0.0293 0.25 -2.010.206 0.8 1.1382 0.8325 0.0303 -1.20E-07 1.0288 0.0396 1.0264 0.0373 -0.23 -5.80.322 0.848 1.1025 0.7669 0.0482 6.00E-08 0.9682 0.0606 0.9466 0.0595 -2.23 -1.730.393 0.872 1.0863 0.7288 0.0602 0.00E+00 0.9348 0.0742 0.9016 0.0744 -3.55 0.320.476 0.897 1.0698 0.6855 0.0753 1.20E-07 0.8965 0.0927 0.8507 0.0934 -5.11 0.740.574 0.921 1.053 0.6353 0.0948 1.20E-07 0.8532 0.1162 0.7918 0.1181 -7.19 1.670.683 0.945 1.0372 0.5777 0.1203 8.90E-08 0.8 0.1484 0.724 0.1507 -9.5 1.560.807 0.969 1.0216 0.5069 0.157 -1.20E-07 0.732 0.1966 0.6393 0.1981 -12.66 0.74
1 1 1 0.3074 0.3074 0.00E+00 0.4365 0.4365 0.3918 0.3918 -10.24 -10.24
211

Table C2.48: Densities Prediction for Ethyl Chloride.
Pr Tr Gam ZVC ZLC Fugr DLE DGE DLC DGC DEVL DEVG 0.019 0.62 1.2994 0.9718 0.003 -4.80E-07 0.8767 0.0028 0.8787 0.0027 0.23 -2.040.036 0.659 1.2632 0.9547 0.0055 -1.80E-07 0.8506 0.005 0.8526 0.0049 0.23 -2.230.066 0.702 1.2242 0.9281 0.0098 4.20E-07 0.8198 0.0089 0.8199 0.0087 0.01 -2.550.144 0.767 1.1695 0.8722 0.0209 3.60E-07 0.7701 0.0184 0.7629 0.0183 -0.93 -0.540.18 0.789 1.152 0.8487 0.0263 4.80E-07 0.7519 0.0228 0.7412 0.023 -1.42 0.79
0.275 0.832 1.1177 0.7929 0.0407 -1.20E-07 0.7132 0.0339 0.6923 0.0356 -2.93 4.90.401 0.876 1.0858 0.7248 0.0615 1.80E-07 0.6687 0.0503 0.635 0.0539 -5.04 7.140.479 0.898 1.07 0.6844 0.0756 3.00E-07 0.6435 0.0619 0.6015 0.0665 -6.53 7.350.566 0.919 1.0549 0.6394 0.0931 -6.00E-08 0.6154 0.0764 0.5641 0.0821 -8.33 7.460.665 0.941 1.0399 0.5875 0.1157 6.00E-08 0.5825 0.0958 0.5208 0.1025 -10.59 7.030.777 0.963 1.0247 0.5247 0.1471 -6.00E-08 0.5409 0.1239 0.4679 0.1312 -13.5 5.89
1 1 1 0.3074 0.3074 0.00E+00 0.3203 0.3203 0.2774 0.2774 -13.39 -13.39
Table C2.49: Densities Prediction for Methyl Ether.
Pr Tr Gam ZVC ZLC Fugr DLE DGE DLC DGC DEVL DEVG 0.028 0.659 1.3167 0.9633 0.0042 2.40E-07 0.5864 0.0027 0.5883 0.0026 0.32 -4.970.047 0.692 1.2789 0.9454 0.0069 4.20E-07 0.5697 0.0043 0.5716 0.0042 0.33 -2.70.085 0.735 1.2341 0.9149 0.0122 -1.80E-07 0.5501 0.0075 0.5478 0.0073 -0.42 -2.40.142 0.778 1.1919 0.8749 0.0203 -1.80E-07 0.5264 0.0124 0.5206 0.0121 -1.1 -2.420.18 0.799 1.1715 0.8509 0.0258 0.00E+00 0.5142 0.0157 0.5055 0.0153 -1.69 -2.42
0.277 0.842 1.132 0.7938 0.0405 -6.00E-08 0.4855 0.0247 0.4714 0.024 -2.91 -2.670.41 0.885 1.0941 0.7222 0.0624 -1.80E-07 0.4535 0.0378 0.4304 0.0372 -5.08 -1.66
0.584 0.928 1.058 0.6315 0.0963 0.00E+00 0.4166 0.0582 0.3792 0.0579 -8.98 -0.60.809 0.97 1.0226 0.5085 0.158 -1.10E-03 0.3595 0.0956 0.3061 0.0951 -14.85 -0.490.874 0.981 1.0148 0.4651 0.1833 -3.30E-04 0.3384 0.1112 0.2819 0.1111 -16.69 -0.07
1 1 1 0.3074 0.3074 0.00E+00 0.2223 0.2223 0.1887 0.1887 -15.12 -15.12
212
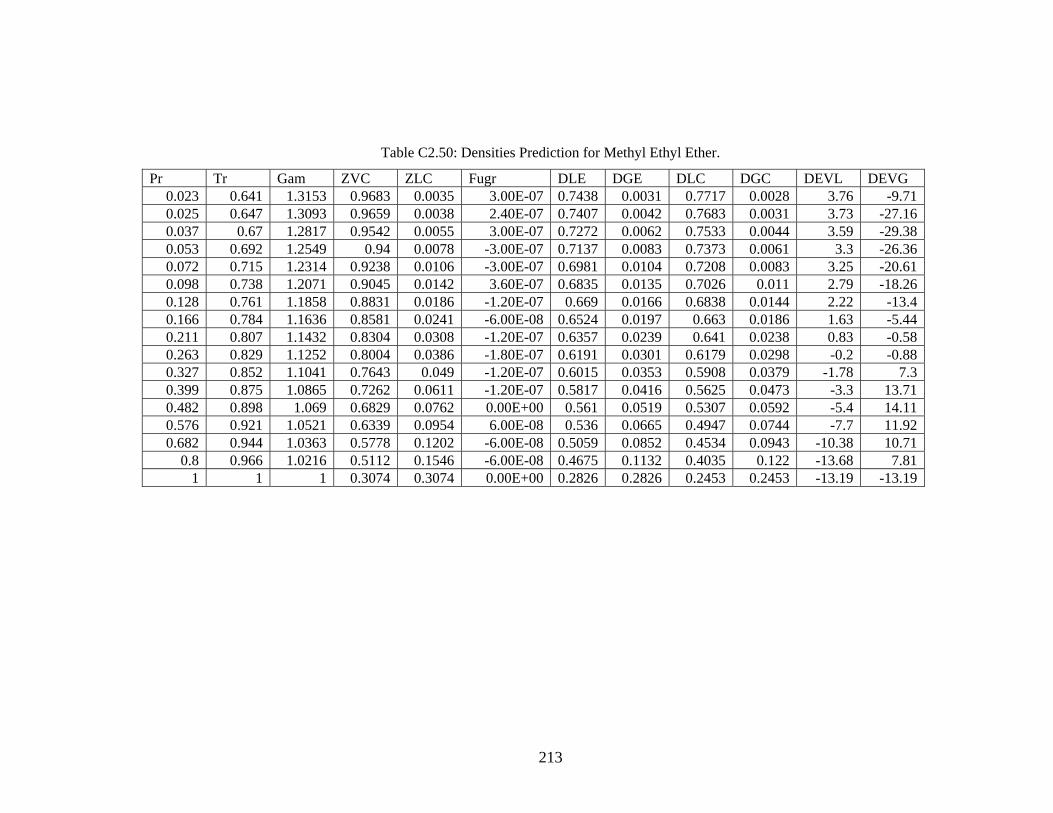
Table C2.50: Densities Prediction for Methyl Ethyl Ether.
Pr Tr Gam ZVC ZLC Fugr DLE DGE DLC DGC DEVL DEVG 0.023 0.641 1.3153 0.9683 0.0035 3.00E-07 0.7438 0.0031 0.7717 0.0028 3.76 -9.710.025 0.647 1.3093 0.9659 0.0038 2.40E-07 0.7407 0.0042 0.7683 0.0031 3.73 -27.160.037 0.67 1.2817 0.9542 0.0055 3.00E-07 0.7272 0.0062 0.7533 0.0044 3.59 -29.380.053 0.692 1.2549 0.94 0.0078 -3.00E-07 0.7137 0.0083 0.7373 0.0061 3.3 -26.360.072 0.715 1.2314 0.9238 0.0106 -3.00E-07 0.6981 0.0104 0.7208 0.0083 3.25 -20.610.098 0.738 1.2071 0.9045 0.0142 3.60E-07 0.6835 0.0135 0.7026 0.011 2.79 -18.260.128 0.761 1.1858 0.8831 0.0186 -1.20E-07 0.669 0.0166 0.6838 0.0144 2.22 -13.40.166 0.784 1.1636 0.8581 0.0241 -6.00E-08 0.6524 0.0197 0.663 0.0186 1.63 -5.440.211 0.807 1.1432 0.8304 0.0308 -1.20E-07 0.6357 0.0239 0.641 0.0238 0.83 -0.580.263 0.829 1.1252 0.8004 0.0386 -1.80E-07 0.6191 0.0301 0.6179 0.0298 -0.2 -0.880.327 0.852 1.1041 0.7643 0.049 -1.20E-07 0.6015 0.0353 0.5908 0.0379 -1.78 7.30.399 0.875 1.0865 0.7262 0.0611 -1.20E-07 0.5817 0.0416 0.5625 0.0473 -3.3 13.710.482 0.898 1.069 0.6829 0.0762 0.00E+00 0.561 0.0519 0.5307 0.0592 -5.4 14.110.576 0.921 1.0521 0.6339 0.0954 6.00E-08 0.536 0.0665 0.4947 0.0744 -7.7 11.920.682 0.944 1.0363 0.5778 0.1202 -6.00E-08 0.5059 0.0852 0.4534 0.0943 -10.38 10.71
0.8 0.966 1.0216 0.5112 0.1546 -6.00E-08 0.4675 0.1132 0.4035 0.122 -13.68 7.811 1 1 0.3074 0.3074 0.00E+00 0.2826 0.2826 0.2453 0.2453 -13.19 -13.19
213
C.3 Results for the Soave-Redlich-Kwong Equation of State.
214
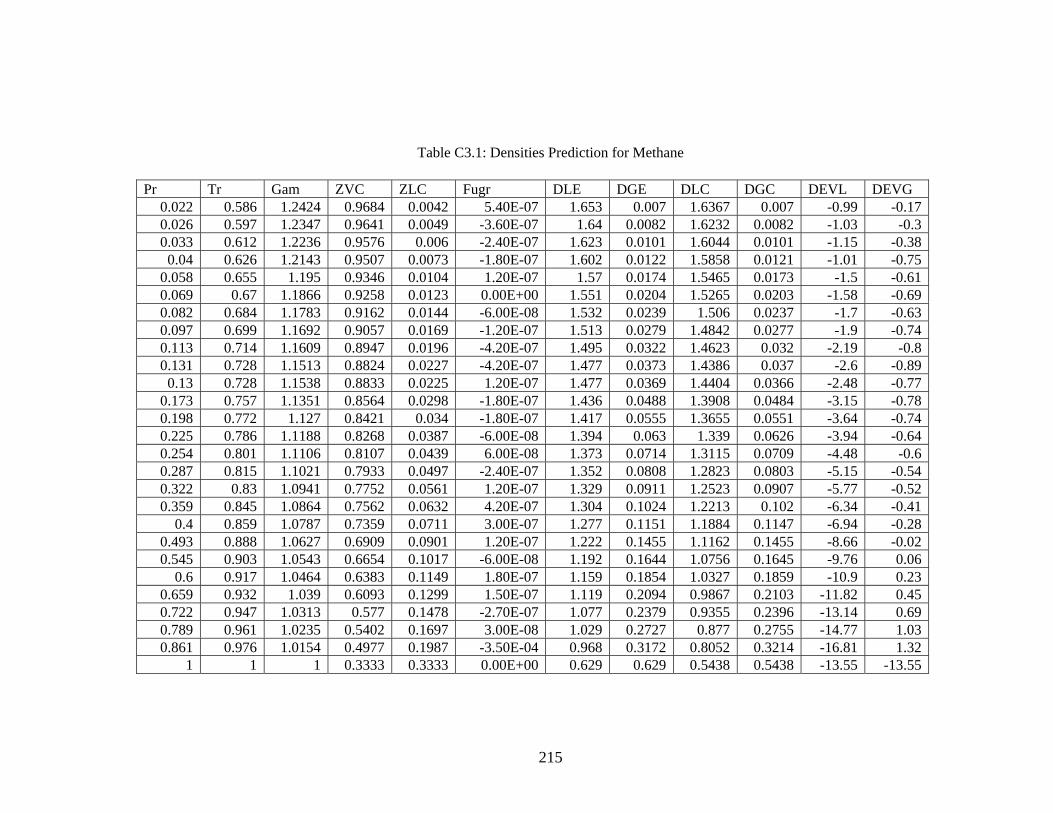
Table C3.1: Densities Prediction for Methane
Pr Tr Gam ZVC ZLC Fugr DLE DGE DLC DGC DEVL DEVG0.022 0.586 1.2424 0.9684 0.0042 5.40E-07 1.653 0.007 1.6367 0.007 -0.99 -0.170.026 0.597 1.2347 0.9641 0.0049 -3.60E-07 1.64 0.0082 1.6232 0.0082 -1.03 -0.30.033 0.612 1.2236 0.9576 0.006 -2.40E-07 1.623 0.0101 1.6044 0.0101 -1.15 -0.380.04 0.626 1.2143 0.9507 0.0073 -1.80E-07 1.602 0.0122 1.5858 0.0121 -1.01 -0.75
0.058 0.655 1.195 0.9346 0.0104 1.20E-07 1.57 0.0174 1.5465 0.0173 -1.5 -0.610.069 0.67 1.1866 0.9258 0.0123 0.00E+00 1.551 0.0204 1.5265 0.0203 -1.58 -0.690.082 0.684 1.1783 0.9162 0.0144 -6.00E-08 1.532 0.0239 1.506 0.0237 -1.7 -0.630.097 0.699 1.1692 0.9057 0.0169 -1.20E-07 1.513 0.0279 1.4842 0.0277 -1.9 -0.740.113 0.714 1.1609 0.8947 0.0196 -4.20E-07 1.495 0.0322 1.4623 0.032 -2.19 -0.80.131 0.728 1.1513 0.8824 0.0227 -4.20E-07 1.477 0.0373 1.4386 0.037 -2.6 -0.890.13 0.728 1.1538 0.8833 0.0225 1.20E-07 1.477 0.0369 1.4404 0.0366 -2.48 -0.77
0.173 0.757 1.1351 0.8564 0.0298 -1.80E-07 1.436 0.0488 1.3908 0.0484 -3.15 -0.780.198 0.772 1.127 0.8421 0.034 -1.80E-07 1.417 0.0555 1.3655 0.0551 -3.64 -0.740.225 0.786 1.1188 0.8268 0.0387 -6.00E-08 1.394 0.063 1.339 0.0626 -3.94 -0.640.254 0.801 1.1106 0.8107 0.0439 6.00E-08 1.373 0.0714 1.3115 0.0709 -4.48 -0.60.287 0.815 1.1021 0.7933 0.0497 -2.40E-07 1.352 0.0808 1.2823 0.0803 -5.15 -0.540.322 0.83 1.0941 0.7752 0.0561 1.20E-07 1.329 0.0911 1.2523 0.0907 -5.77 -0.520.359 0.845 1.0864 0.7562 0.0632 4.20E-07 1.304 0.1024 1.2213 0.102 -6.34 -0.41
0.4 0.859 1.0787 0.7359 0.0711 3.00E-07 1.277 0.1151 1.1884 0.1147 -6.94 -0.280.493 0.888 1.0627 0.6909 0.0901 1.20E-07 1.222 0.1455 1.1162 0.1455 -8.66 -0.020.545 0.903 1.0543 0.6654 0.1017 -6.00E-08 1.192 0.1644 1.0756 0.1645 -9.76 0.06
0.6 0.917 1.0464 0.6383 0.1149 1.80E-07 1.159 0.1854 1.0327 0.1859 -10.9 0.230.659 0.932 1.039 0.6093 0.1299 1.50E-07 1.119 0.2094 0.9867 0.2103 -11.82 0.450.722 0.947 1.0313 0.577 0.1478 -2.70E-07 1.077 0.2379 0.9355 0.2396 -13.14 0.690.789 0.961 1.0235 0.5402 0.1697 3.00E-08 1.029 0.2727 0.877 0.2755 -14.77 1.030.861 0.976 1.0154 0.4977 0.1987 -3.50E-04 0.968 0.3172 0.8052 0.3214 -16.81 1.32
1 1 1 0.3333 0.3333 0.00E+00 0.629 0.629 0.5438 0.5438 -13.55 -13.55
215
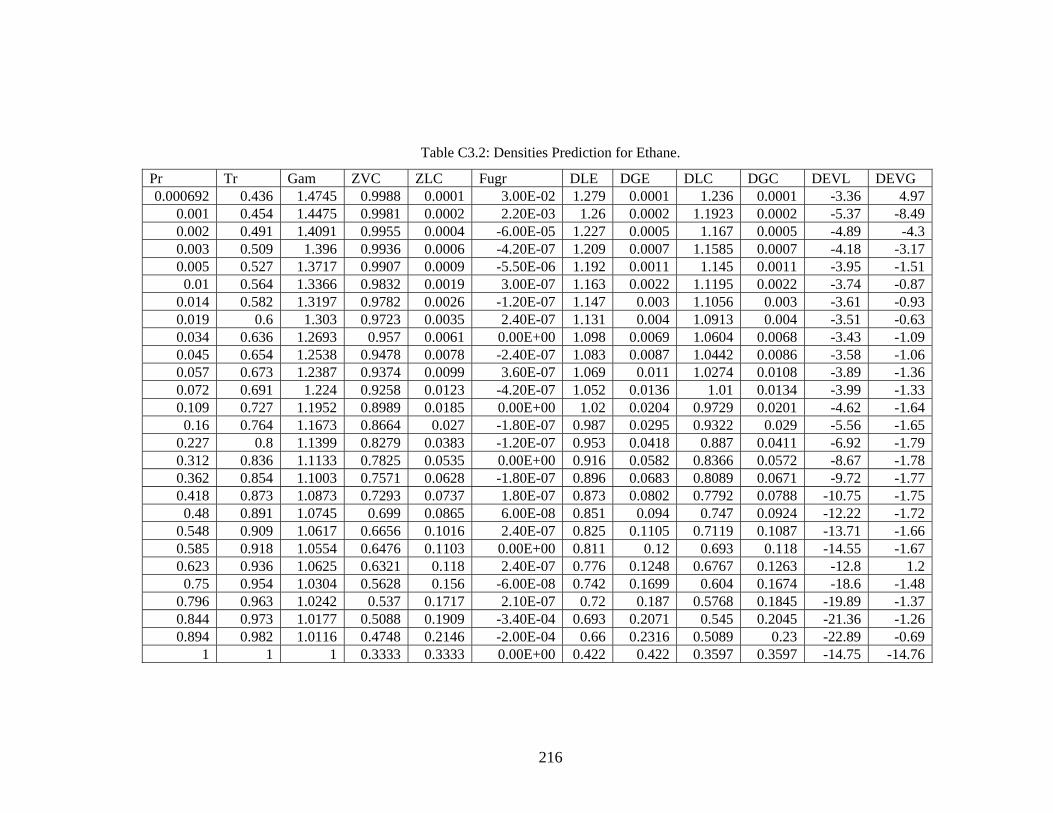
Table C3.2: Densities Prediction for Ethane.
Pr Tr Gam ZVC ZLC Fugr DLE DGE DLC DGC DEVL DEVG0.000692 0.436 1.4745 0.9988 0.0001 3.00E-02 1.279 0.0001 1.236 0.0001 -3.36 4.97
0.001 0.454 1.4475 0.9981 0.0002 2.20E-03 1.26 0.0002 1.1923 0.0002 -5.37 -8.490.002 0.491 1.4091 0.9955 0.0004 -6.00E-05 1.227 0.0005 1.167 0.0005 -4.89 -4.30.003 0.509 1.396 0.9936 0.0006 -4.20E-07 1.209 0.0007 1.1585 0.0007 -4.18 -3.170.005 0.527 1.3717 0.9907 0.0009 -5.50E-06 1.192 0.0011 1.145 0.0011 -3.95 -1.510.01 0.564 1.3366 0.9832 0.0019 3.00E-07 1.163 0.0022 1.1195 0.0022 -3.74 -0.87
0.014 0.582 1.3197 0.9782 0.0026 -1.20E-07 1.147 0.003 1.1056 0.003 -3.61 -0.930.019 0.6 1.303 0.9723 0.0035 2.40E-07 1.131 0.004 1.0913 0.004 -3.51 -0.630.034 0.636 1.2693 0.957 0.0061 0.00E+00 1.098 0.0069 1.0604 0.0068 -3.43 -1.090.045 0.654 1.2538 0.9478 0.0078 -2.40E-07 1.083 0.0087 1.0442 0.0086 -3.58 -1.060.057 0.673 1.2387 0.9374 0.0099 3.60E-07 1.069 0.011 1.0274 0.0108 -3.89 -1.360.072 0.691 1.224 0.9258 0.0123 -4.20E-07 1.052 0.0136 1.01 0.0134 -3.99 -1.330.109 0.727 1.1952 0.8989 0.0185 0.00E+00 1.02 0.0204 0.9729 0.0201 -4.62 -1.640.16 0.764 1.1673 0.8664 0.027 -1.80E-07 0.987 0.0295 0.9322 0.029 -5.56 -1.65
0.227 0.8 1.1399 0.8279 0.0383 -1.20E-07 0.953 0.0418 0.887 0.0411 -6.92 -1.790.312 0.836 1.1133 0.7825 0.0535 0.00E+00 0.916 0.0582 0.8366 0.0572 -8.67 -1.780.362 0.854 1.1003 0.7571 0.0628 -1.80E-07 0.896 0.0683 0.8089 0.0671 -9.72 -1.770.418 0.873 1.0873 0.7293 0.0737 1.80E-07 0.873 0.0802 0.7792 0.0788 -10.75 -1.750.48 0.891 1.0745 0.699 0.0865 6.00E-08 0.851 0.094 0.747 0.0924 -12.22 -1.72
0.548 0.909 1.0617 0.6656 0.1016 2.40E-07 0.825 0.1105 0.7119 0.1087 -13.71 -1.660.585 0.918 1.0554 0.6476 0.1103 0.00E+00 0.811 0.12 0.693 0.118 -14.55 -1.670.623 0.936 1.0625 0.6321 0.118 2.40E-07 0.776 0.1248 0.6767 0.1263 -12.8 1.20.75 0.954 1.0304 0.5628 0.156 -6.00E-08 0.742 0.1699 0.604 0.1674 -18.6 -1.48
0.796 0.963 1.0242 0.537 0.1717 2.10E-07 0.72 0.187 0.5768 0.1845 -19.89 -1.370.844 0.973 1.0177 0.5088 0.1909 -3.40E-04 0.693 0.2071 0.545 0.2045 -21.36 -1.260.894 0.982 1.0116 0.4748 0.2146 -2.00E-04 0.66 0.2316 0.5089 0.23 -22.89 -0.69
1 1 1 0.3333 0.3333 0.00E+00 0.422 0.422 0.3597 0.3597 -14.75 -14.76
216
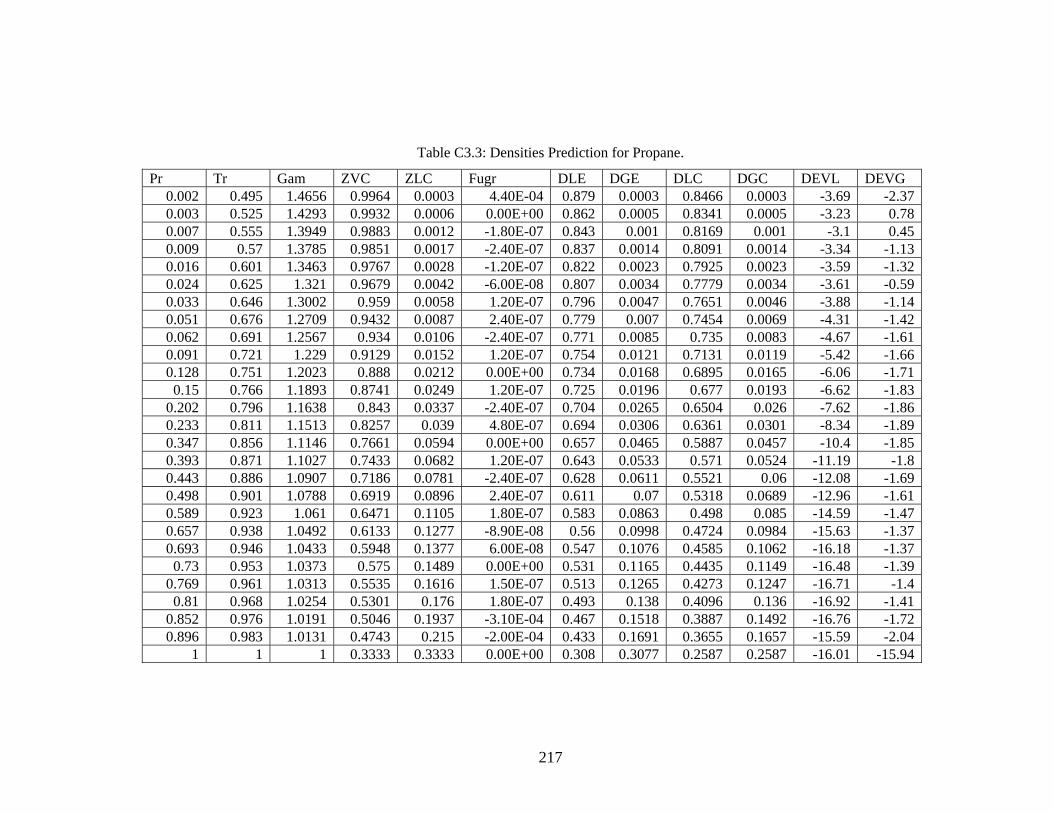
Table C3.3: Densities Prediction for Propane.
Pr Tr Gam ZVC ZLC Fugr DLE DGE DLC DGC DEVL DEVG0.002 0.495 1.4656 0.9964 0.0003 4.40E-04 0.879 0.0003 0.8466 0.0003 -3.69 -2.370.003 0.525 1.4293 0.9932 0.0006 0.00E+00 0.862 0.0005 0.8341 0.0005 -3.23 0.780.007 0.555 1.3949 0.9883 0.0012 -1.80E-07 0.843 0.001 0.8169 0.001 -3.1 0.450.009 0.57 1.3785 0.9851 0.0017 -2.40E-07 0.837 0.0014 0.8091 0.0014 -3.34 -1.130.016 0.601 1.3463 0.9767 0.0028 -1.20E-07 0.822 0.0023 0.7925 0.0023 -3.59 -1.320.024 0.625 1.321 0.9679 0.0042 -6.00E-08 0.807 0.0034 0.7779 0.0034 -3.61 -0.590.033 0.646 1.3002 0.959 0.0058 1.20E-07 0.796 0.0047 0.7651 0.0046 -3.88 -1.140.051 0.676 1.2709 0.9432 0.0087 2.40E-07 0.779 0.007 0.7454 0.0069 -4.31 -1.420.062 0.691 1.2567 0.934 0.0106 -2.40E-07 0.771 0.0085 0.735 0.0083 -4.67 -1.610.091 0.721 1.229 0.9129 0.0152 1.20E-07 0.754 0.0121 0.7131 0.0119 -5.42 -1.660.128 0.751 1.2023 0.888 0.0212 0.00E+00 0.734 0.0168 0.6895 0.0165 -6.06 -1.710.15 0.766 1.1893 0.8741 0.0249 1.20E-07 0.725 0.0196 0.677 0.0193 -6.62 -1.83
0.202 0.796 1.1638 0.843 0.0337 -2.40E-07 0.704 0.0265 0.6504 0.026 -7.62 -1.860.233 0.811 1.1513 0.8257 0.039 4.80E-07 0.694 0.0306 0.6361 0.0301 -8.34 -1.890.347 0.856 1.1146 0.7661 0.0594 0.00E+00 0.657 0.0465 0.5887 0.0457 -10.4 -1.850.393 0.871 1.1027 0.7433 0.0682 1.20E-07 0.643 0.0533 0.571 0.0524 -11.19 -1.80.443 0.886 1.0907 0.7186 0.0781 -2.40E-07 0.628 0.0611 0.5521 0.06 -12.08 -1.690.498 0.901 1.0788 0.6919 0.0896 2.40E-07 0.611 0.07 0.5318 0.0689 -12.96 -1.610.589 0.923 1.061 0.6471 0.1105 1.80E-07 0.583 0.0863 0.498 0.085 -14.59 -1.470.657 0.938 1.0492 0.6133 0.1277 -8.90E-08 0.56 0.0998 0.4724 0.0984 -15.63 -1.370.693 0.946 1.0433 0.5948 0.1377 6.00E-08 0.547 0.1076 0.4585 0.1062 -16.18 -1.370.73 0.953 1.0373 0.575 0.1489 0.00E+00 0.531 0.1165 0.4435 0.1149 -16.48 -1.39
0.769 0.961 1.0313 0.5535 0.1616 1.50E-07 0.513 0.1265 0.4273 0.1247 -16.71 -1.40.81 0.968 1.0254 0.5301 0.176 1.80E-07 0.493 0.138 0.4096 0.136 -16.92 -1.41
0.852 0.976 1.0191 0.5046 0.1937 -3.10E-04 0.467 0.1518 0.3887 0.1492 -16.76 -1.720.896 0.983 1.0131 0.4743 0.215 -2.00E-04 0.433 0.1691 0.3655 0.1657 -15.59 -2.04
1 1 1 0.3333 0.3333 0.00E+00 0.308 0.3077 0.2587 0.2587 -16.01 -15.94
217
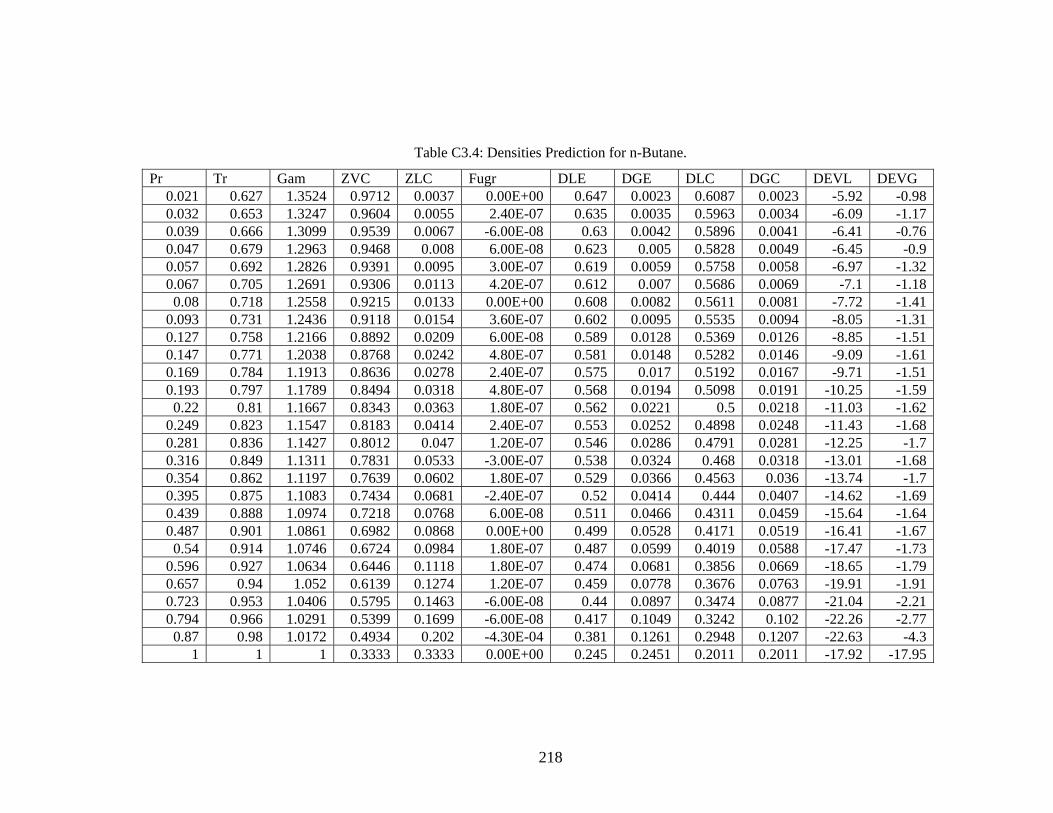
Table C3.4: Densities Prediction for n-Butane.
Pr Tr Gam ZVC ZLC Fugr DLE DGE DLC DGC DEVL DEVG0.021 0.627 1.3524 0.9712 0.0037 0.00E+00 0.647 0.0023 0.6087 0.0023 -5.92 -0.980.032 0.653 1.3247 0.9604 0.0055 2.40E-07 0.635 0.0035 0.5963 0.0034 -6.09 -1.170.039 0.666 1.3099 0.9539 0.0067 -6.00E-08 0.63 0.0042 0.5896 0.0041 -6.41 -0.760.047 0.679 1.2963 0.9468 0.008 6.00E-08 0.623 0.005 0.5828 0.0049 -6.45 -0.90.057 0.692 1.2826 0.9391 0.0095 3.00E-07 0.619 0.0059 0.5758 0.0058 -6.97 -1.320.067 0.705 1.2691 0.9306 0.0113 4.20E-07 0.612 0.007 0.5686 0.0069 -7.1 -1.180.08 0.718 1.2558 0.9215 0.0133 0.00E+00 0.608 0.0082 0.5611 0.0081 -7.72 -1.41
0.093 0.731 1.2436 0.9118 0.0154 3.60E-07 0.602 0.0095 0.5535 0.0094 -8.05 -1.310.127 0.758 1.2166 0.8892 0.0209 6.00E-08 0.589 0.0128 0.5369 0.0126 -8.85 -1.510.147 0.771 1.2038 0.8768 0.0242 4.80E-07 0.581 0.0148 0.5282 0.0146 -9.09 -1.610.169 0.784 1.1913 0.8636 0.0278 2.40E-07 0.575 0.017 0.5192 0.0167 -9.71 -1.510.193 0.797 1.1789 0.8494 0.0318 4.80E-07 0.568 0.0194 0.5098 0.0191 -10.25 -1.590.22 0.81 1.1667 0.8343 0.0363 1.80E-07 0.562 0.0221 0.5 0.0218 -11.03 -1.62
0.249 0.823 1.1547 0.8183 0.0414 2.40E-07 0.553 0.0252 0.4898 0.0248 -11.43 -1.680.281 0.836 1.1427 0.8012 0.047 1.20E-07 0.546 0.0286 0.4791 0.0281 -12.25 -1.70.316 0.849 1.1311 0.7831 0.0533 -3.00E-07 0.538 0.0324 0.468 0.0318 -13.01 -1.680.354 0.862 1.1197 0.7639 0.0602 1.80E-07 0.529 0.0366 0.4563 0.036 -13.74 -1.70.395 0.875 1.1083 0.7434 0.0681 -2.40E-07 0.52 0.0414 0.444 0.0407 -14.62 -1.690.439 0.888 1.0974 0.7218 0.0768 6.00E-08 0.511 0.0466 0.4311 0.0459 -15.64 -1.640.487 0.901 1.0861 0.6982 0.0868 0.00E+00 0.499 0.0528 0.4171 0.0519 -16.41 -1.670.54 0.914 1.0746 0.6724 0.0984 1.80E-07 0.487 0.0599 0.4019 0.0588 -17.47 -1.73
0.596 0.927 1.0634 0.6446 0.1118 1.80E-07 0.474 0.0681 0.3856 0.0669 -18.65 -1.790.657 0.94 1.052 0.6139 0.1274 1.20E-07 0.459 0.0778 0.3676 0.0763 -19.91 -1.910.723 0.953 1.0406 0.5795 0.1463 -6.00E-08 0.44 0.0897 0.3474 0.0877 -21.04 -2.210.794 0.966 1.0291 0.5399 0.1699 -6.00E-08 0.417 0.1049 0.3242 0.102 -22.26 -2.770.87 0.98 1.0172 0.4934 0.202 -4.30E-04 0.381 0.1261 0.2948 0.1207 -22.63 -4.3
1 1 1 0.3333 0.3333 0.00E+00 0.245 0.2451 0.2011 0.2011 -17.92 -17.95
218
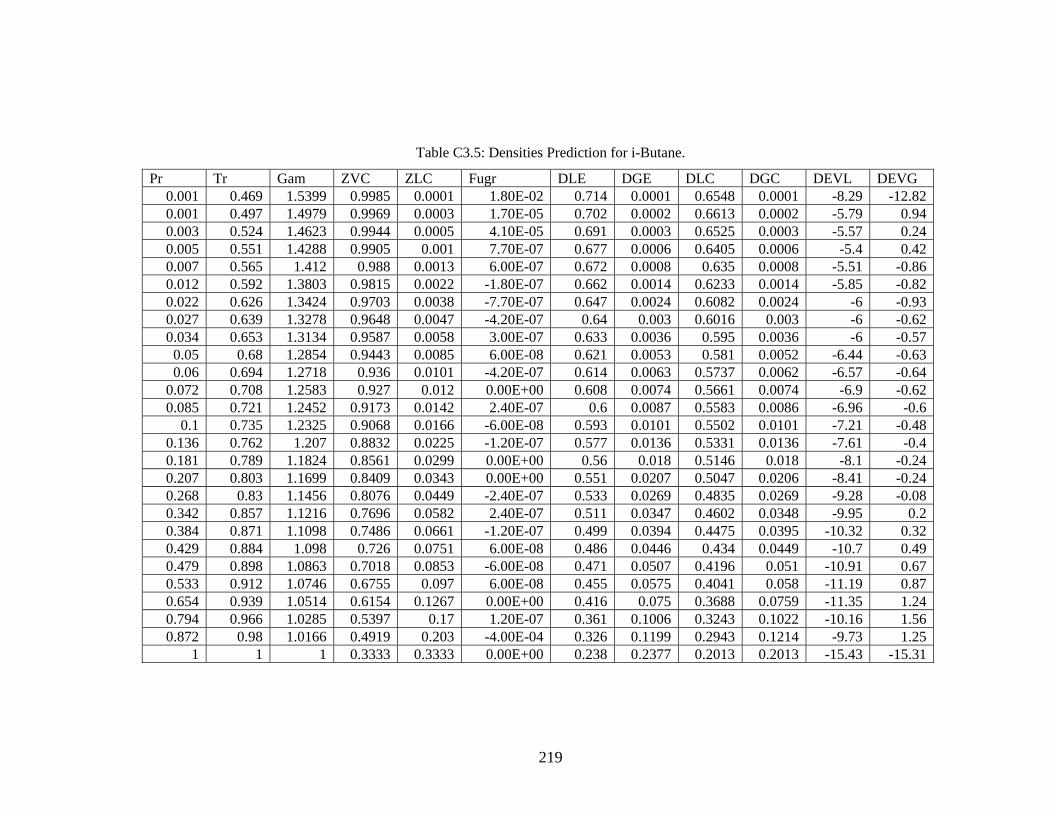
Table C3.5: Densities Prediction for i-Butane.
Pr Tr Gam ZVC ZLC Fugr DLE DGE DLC DGC DEVL DEVG0.001 0.469 1.5399 0.9985 0.0001 1.80E-02 0.714 0.0001 0.6548 0.0001 -8.29 -12.820.001 0.497 1.4979 0.9969 0.0003 1.70E-05 0.702 0.0002 0.6613 0.0002 -5.79 0.940.003 0.524 1.4623 0.9944 0.0005 4.10E-05 0.691 0.0003 0.6525 0.0003 -5.57 0.240.005 0.551 1.4288 0.9905 0.001 7.70E-07 0.677 0.0006 0.6405 0.0006 -5.4 0.420.007 0.565 1.412 0.988 0.0013 6.00E-07 0.672 0.0008 0.635 0.0008 -5.51 -0.860.012 0.592 1.3803 0.9815 0.0022 -1.80E-07 0.662 0.0014 0.6233 0.0014 -5.85 -0.820.022 0.626 1.3424 0.9703 0.0038 -7.70E-07 0.647 0.0024 0.6082 0.0024 -6 -0.930.027 0.639 1.3278 0.9648 0.0047 -4.20E-07 0.64 0.003 0.6016 0.003 -6 -0.620.034 0.653 1.3134 0.9587 0.0058 3.00E-07 0.633 0.0036 0.595 0.0036 -6 -0.570.05 0.68 1.2854 0.9443 0.0085 6.00E-08 0.621 0.0053 0.581 0.0052 -6.44 -0.630.06 0.694 1.2718 0.936 0.0101 -4.20E-07 0.614 0.0063 0.5737 0.0062 -6.57 -0.64
0.072 0.708 1.2583 0.927 0.012 0.00E+00 0.608 0.0074 0.5661 0.0074 -6.9 -0.620.085 0.721 1.2452 0.9173 0.0142 2.40E-07 0.6 0.0087 0.5583 0.0086 -6.96 -0.6
0.1 0.735 1.2325 0.9068 0.0166 -6.00E-08 0.593 0.0101 0.5502 0.0101 -7.21 -0.480.136 0.762 1.207 0.8832 0.0225 -1.20E-07 0.577 0.0136 0.5331 0.0136 -7.61 -0.40.181 0.789 1.1824 0.8561 0.0299 0.00E+00 0.56 0.018 0.5146 0.018 -8.1 -0.240.207 0.803 1.1699 0.8409 0.0343 0.00E+00 0.551 0.0207 0.5047 0.0206 -8.41 -0.240.268 0.83 1.1456 0.8076 0.0449 -2.40E-07 0.533 0.0269 0.4835 0.0269 -9.28 -0.080.342 0.857 1.1216 0.7696 0.0582 2.40E-07 0.511 0.0347 0.4602 0.0348 -9.95 0.20.384 0.871 1.1098 0.7486 0.0661 -1.20E-07 0.499 0.0394 0.4475 0.0395 -10.32 0.320.429 0.884 1.098 0.726 0.0751 6.00E-08 0.486 0.0446 0.434 0.0449 -10.7 0.490.479 0.898 1.0863 0.7018 0.0853 -6.00E-08 0.471 0.0507 0.4196 0.051 -10.91 0.670.533 0.912 1.0746 0.6755 0.097 6.00E-08 0.455 0.0575 0.4041 0.058 -11.19 0.870.654 0.939 1.0514 0.6154 0.1267 0.00E+00 0.416 0.075 0.3688 0.0759 -11.35 1.240.794 0.966 1.0285 0.5397 0.17 1.20E-07 0.361 0.1006 0.3243 0.1022 -10.16 1.560.872 0.98 1.0166 0.4919 0.203 -4.00E-04 0.326 0.1199 0.2943 0.1214 -9.73 1.25
1 1 1 0.3333 0.3333 0.00E+00 0.238 0.2377 0.2013 0.2013 -15.43 -15.31
219

Table C3.6: Densities Prediction for n-Pentane.
Pr Tr Gam ZVC ZLC Fugr DLE DGE DLC DGC DEVL DEVG0.022 0.639 1.3749 0.9709 0.0037 -6.00E-07 0.533 0.0019 0.4886 0.0019 -8.32 -0.830.03 0.659 1.3515 0.9627 0.0051 6.00E-07 0.525 0.0026 0.481 0.0026 -8.39 -0.95
0.032 0.662 1.3473 0.961 0.0054 -1.20E-07 0.523 0.0027 0.4795 0.0027 -8.32 -0.870.046 0.686 1.3194 0.9488 0.0076 6.00E-08 0.513 0.0038 0.4696 0.0038 -8.45 -0.870.054 0.698 1.3057 0.9418 0.009 -5.40E-07 0.51 0.0045 0.4645 0.0044 -8.93 -0.650.064 0.709 1.2921 0.9342 0.0105 5.40E-07 0.504 0.0052 0.4591 0.0052 -8.9 -1.10.087 0.733 1.2656 0.9172 0.0142 -1.20E-07 0.495 0.007 0.448 0.0069 -9.5 -0.940.116 0.757 1.2397 0.8975 0.0189 -6.60E-07 0.485 0.0093 0.436 0.0092 -10.1 -1.020.133 0.769 1.227 0.8866 0.0216 -1.80E-07 0.48 0.0106 0.4297 0.0105 -10.47 -1.090.151 0.78 1.2145 0.875 0.0247 1.80E-07 0.473 0.0121 0.4233 0.0119 -10.52 -1.130.172 0.792 1.2023 0.8627 0.028 -6.00E-08 0.468 0.0137 0.4165 0.0135 -11 -1.130.194 0.804 1.1901 0.8495 0.0318 1.80E-07 0.462 0.0155 0.4095 0.0153 -11.35 -1.20.219 0.816 1.178 0.8356 0.036 1.20E-07 0.456 0.0175 0.4023 0.0173 -11.78 -1.190.246 0.828 1.1661 0.8208 0.0406 1.20E-07 0.45 0.0198 0.3947 0.0195 -12.29 -1.20.308 0.851 1.1427 0.7885 0.0514 3.00E-07 0.437 0.025 0.3785 0.0247 -13.38 -1.220.342 0.863 1.1311 0.7707 0.0578 2.40E-07 0.429 0.0281 0.3698 0.0277 -13.79 -1.270.38 0.875 1.1196 0.7519 0.0648 1.20E-07 0.421 0.0315 0.3607 0.0311 -14.32 -1.250.42 0.887 1.1083 0.7318 0.0727 -2.40E-07 0.414 0.0353 0.3511 0.0349 -15.2 -1.28
0.464 0.899 1.097 0.7104 0.0816 -4.20E-07 0.405 0.0396 0.3409 0.0391 -15.83 -1.290.511 0.91 1.0857 0.6874 0.0916 -1.80E-07 0.396 0.0446 0.33 0.044 -16.68 -1.360.562 0.922 1.0741 0.6623 0.1032 0.00E+00 0.385 0.0503 0.3181 0.0496 -17.38 -1.50.615 0.934 1.0635 0.636 0.116 -6.00E-08 0.373 0.0567 0.3057 0.0558 -18.05 -1.610.674 0.946 1.0523 0.6065 0.1314 6.00E-08 0.358 0.0644 0.2918 0.0632 -18.5 -1.850.736 0.958 1.0413 0.5737 0.1496 -2.40E-07 0.341 0.0737 0.2764 0.0721 -18.96 -2.180.802 0.97 1.0302 0.5361 0.1722 1.20E-07 0.316 0.0856 0.2586 0.0831 -18.16 -2.90.874 0.981 1.0186 0.4922 0.2029 -4.10E-04 0.269 0.102 0.2362 0.0974 -12.18 -4.52
1 1 1 0.3333 0.3333 0.00E+00 0.205 0.2053 0.1615 0.1615 -21.2 -21.33
220
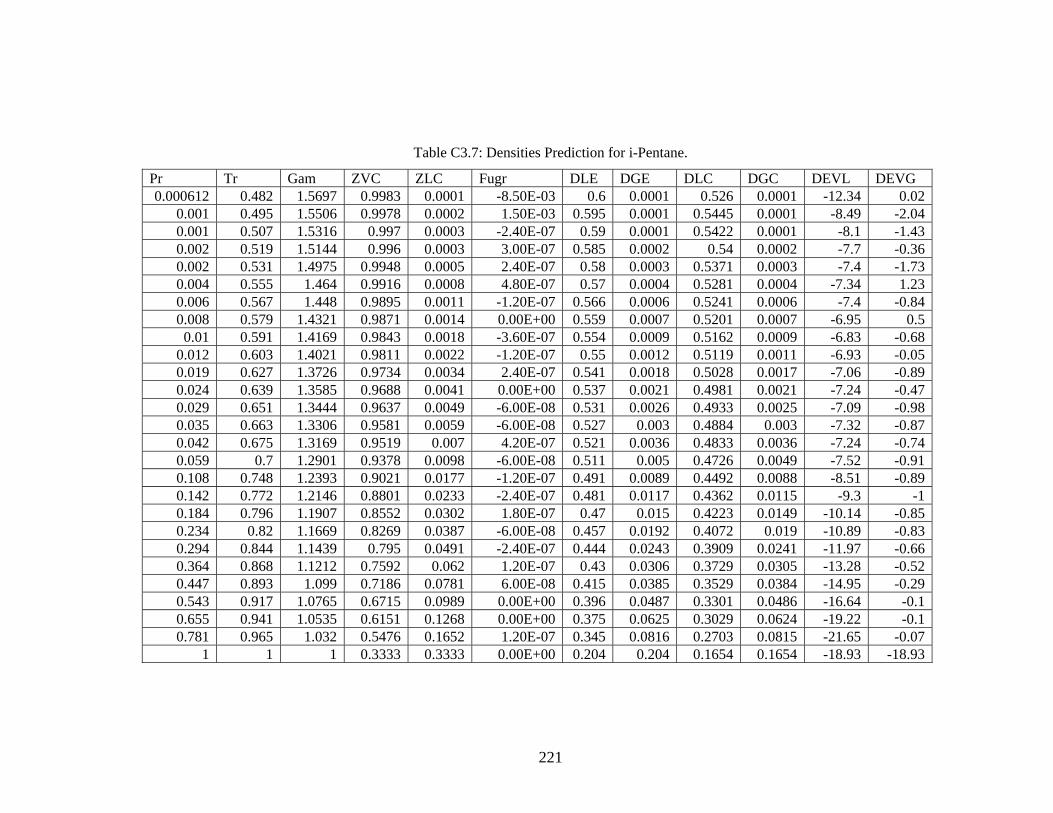
Table C3.7: Densities Prediction for i-Pentane.
Pr Tr Gam ZVC ZLC Fugr DLE DGE DLC DGC DEVL DEVG0.000612 0.482 1.5697 0.9983 0.0001 -8.50E-03 0.6 0.0001 0.526 0.0001 -12.34 0.02
0.001 0.495 1.5506 0.9978 0.0002 1.50E-03 0.595 0.0001 0.5445 0.0001 -8.49 -2.040.001 0.507 1.5316 0.997 0.0003 -2.40E-07 0.59 0.0001 0.5422 0.0001 -8.1 -1.430.002 0.519 1.5144 0.996 0.0003 3.00E-07 0.585 0.0002 0.54 0.0002 -7.7 -0.360.002 0.531 1.4975 0.9948 0.0005 2.40E-07 0.58 0.0003 0.5371 0.0003 -7.4 -1.730.004 0.555 1.464 0.9916 0.0008 4.80E-07 0.57 0.0004 0.5281 0.0004 -7.34 1.230.006 0.567 1.448 0.9895 0.0011 -1.20E-07 0.566 0.0006 0.5241 0.0006 -7.4 -0.840.008 0.579 1.4321 0.9871 0.0014 0.00E+00 0.559 0.0007 0.5201 0.0007 -6.95 0.50.01 0.591 1.4169 0.9843 0.0018 -3.60E-07 0.554 0.0009 0.5162 0.0009 -6.83 -0.68
0.012 0.603 1.4021 0.9811 0.0022 -1.20E-07 0.55 0.0012 0.5119 0.0011 -6.93 -0.050.019 0.627 1.3726 0.9734 0.0034 2.40E-07 0.541 0.0018 0.5028 0.0017 -7.06 -0.890.024 0.639 1.3585 0.9688 0.0041 0.00E+00 0.537 0.0021 0.4981 0.0021 -7.24 -0.470.029 0.651 1.3444 0.9637 0.0049 -6.00E-08 0.531 0.0026 0.4933 0.0025 -7.09 -0.980.035 0.663 1.3306 0.9581 0.0059 -6.00E-08 0.527 0.003 0.4884 0.003 -7.32 -0.870.042 0.675 1.3169 0.9519 0.007 4.20E-07 0.521 0.0036 0.4833 0.0036 -7.24 -0.740.059 0.7 1.2901 0.9378 0.0098 -6.00E-08 0.511 0.005 0.4726 0.0049 -7.52 -0.910.108 0.748 1.2393 0.9021 0.0177 -1.20E-07 0.491 0.0089 0.4492 0.0088 -8.51 -0.890.142 0.772 1.2146 0.8801 0.0233 -2.40E-07 0.481 0.0117 0.4362 0.0115 -9.3 -10.184 0.796 1.1907 0.8552 0.0302 1.80E-07 0.47 0.015 0.4223 0.0149 -10.14 -0.850.234 0.82 1.1669 0.8269 0.0387 -6.00E-08 0.457 0.0192 0.4072 0.019 -10.89 -0.830.294 0.844 1.1439 0.795 0.0491 -2.40E-07 0.444 0.0243 0.3909 0.0241 -11.97 -0.660.364 0.03050.868 1.1212 0.7592 0.062 1.20E-07 0.43 0.0306 0.3729 -13.28 -0.520.447 0.893 1.099 0.7186 0.0781 6.00E-08 0.415 0.0385 0.3529 0.0384 -14.95 -0.290.543 0.917 1.0765 0.6715 0.0989 0.00E+00 0.396 0.0487 0.3301 0.0486 -16.64 -0.10.655 0.941 1.0535 0.6151 0.1268 0.00E+00 0.375 0.0625 0.3029 0.0624 -19.22 -0.10.781 0.965 1.032 0.5476 0.1652 1.20E-07 0.345 0.0816 0.2703 0.0815 -21.65 -0.07
1 1 1 0.3333 0.3333 0.00E+00 0.204 0.204 0.1654 0.1654 -18.93 -18.93
221

Table C3.8: Densities Prediction for n-Hexane.
Pr Tr Gam ZVC ZLC Fugr DLE DGE DLC DGC DEVL DEVG0.001 0.53 1.5815 0.9966 0.0003 2.30E-04 0.502 0.0001 0.4126 0.0001 -17.8 -0.970.004 0.563 1.5296 0.9931 0.0007 -4.80E-07 0.49 0.0003 0.4064 0.0003 -17.07 -0.50.006 0.585 1.4955 0.9896 0.0011 1.80E-07 0.479 0.0004 0.4004 0.0004 -16.42 -0.650.008 0.596 1.4788 0.9873 0.0014 -2.40E-07 0.476 0.0006 0.3974 0.0005 -16.51 -1.990.015 0.629 1.4305 0.9785 0.0026 6.00E-08 0.464 0.001 0.3882 0.001 -16.34 -0.390.022 0.651 1.3998 0.9706 0.0038 0.00E+00 0.455 0.0015 0.3816 0.0015 -16.13 -1.170.024 0.658 1.3969 0.9686 0.0041 -3.00E-07 0.453 0.0016 0.3801 0.0016 -16.09 -0.350.039 0.685 1.3553 0.9553 0.0064 4.20E-07 0.443 0.0025 0.371 0.0025 -16.25 -1.220.046 0.696 1.3407 0.9492 0.0075 -1.20E-07 0.438 0.003 0.3673 0.0029 -16.15 -1.050.073 0.729 1.2983 0.9276 0.0119 0.00E+00 0.425 0.0046 0.3553 0.0046 -16.4 -1.330.097 0.751 1.2721 0.9105 0.0157 6.00E-08 0.417 0.0061 0.3468 0.006 -16.83 -1.340.127 0.773 1.2458 0.8908 0.0205 -1.80E-07 0.409 0.0079 0.3377 0.0078 -17.43 -1.430.164 0.795 1.2205 0.8685 0.0264 6.00E-08 0.399 0.0101 0.328 0.01 -17.8 -1.420.184 0.806 1.2085 0.8565 0.0298 6.00E-08 0.395 0.0114 0.3229 0.0112 -18.25 -1.390.232 0.828 1.1832 0.8294 0.0379 0.00E+00 0.384 0.0144 0.3119 0.0142 -18.79 -1.310.289 0.85 1.1588 0.7992 0.0477 -3.00E-07 0.373 0.0181 0.3 0.0179 -19.58 -1.210.321 0.861 1.1467 0.7826 0.0534 3.00E-07 0.368 0.0203 0.2936 0.02 -20.22 -1.160.392 0.883 1.1236 0.747 0.0667 1.80E-07 0.356 0.0252 0.28 0.025 -21.33 -0.840.519 0.916 1.09 0.6849 0.0927 1.20E-07 0.334 0.0348 0.2569 0.0348 -23.09 -0.110.621 0.939 1.0672 0.6346 0.1167 1.20E-07 0.316 0.0436 0.2384 0.0439 -24.57 0.60.679 0.95 1.0551 0.6049 0.1322 0.00E+00 0.305 0.0492 0.2275 0.0497 -25.43 0.980.737 0.961 1.0447 0.5743 0.1493 -1.80E-07 0.292 0.0552 0.2162 0.0562 -25.97 1.820.801 0.972 1.0328 0.5394 0.1716 -7.90E-04 0.274 0.0627 0.2021 0.0643 -26.23 2.530.872 0.983 1.0209 0.4944 0.2013 -4.30E-04 0.247 0.0728 0.1854 0.0755 -24.93 3.65
1 1 1 0.3333 0.3333 0.00E+00 0.139 0.139 0.1262 0.1262 -9.19 -9.19
222
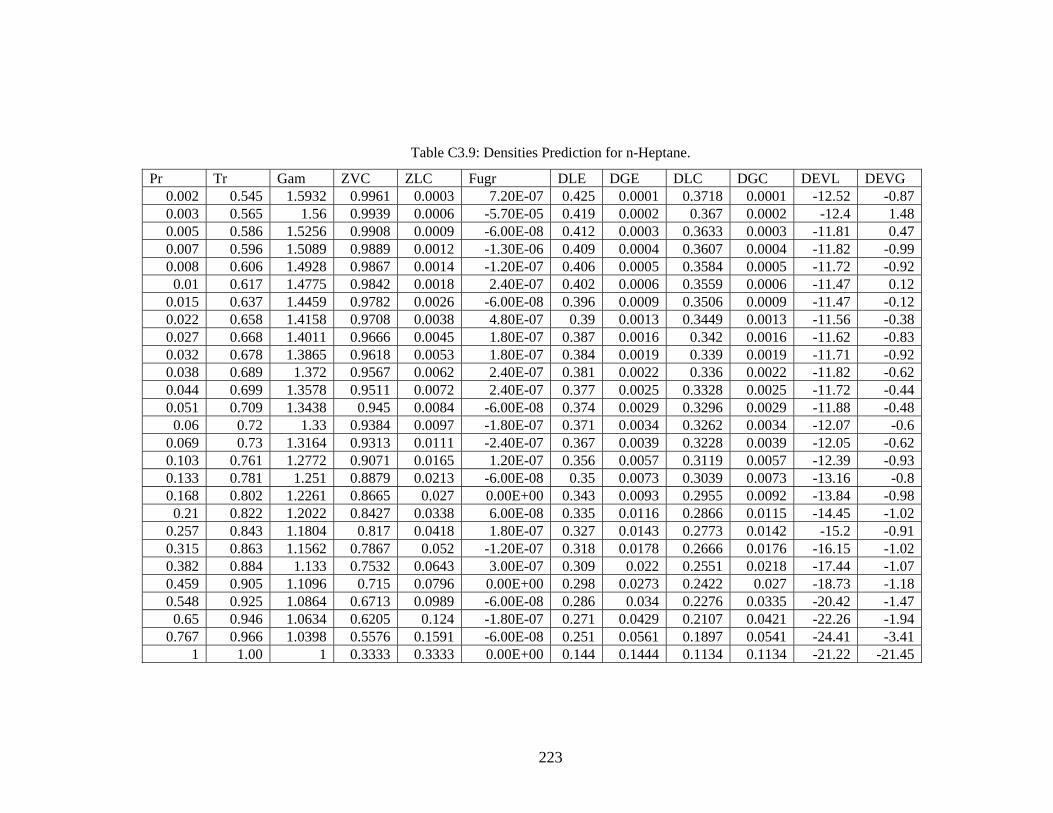
Table C3.9: Densities Prediction for n-Heptane.
Pr Tr Gam ZVC ZLC Fugr DLE DGE DLC DGC DEVL DEVG0.002 0.545 1.5932 0.9961 0.0003 7.20E-07 0.425 0.0001 0.3718 0.0001 -12.52 -0.870.003 0.565 1.56 0.9939 0.0006 -5.70E-05 0.419 0.0002 0.367 0.0002 -12.4 1.480.005 0.586 1.5256 0.9908 0.0009 -6.00E-08 0.412 0.0003 0.3633 0.0003 -11.81 0.470.007 0.596 1.5089 0.9889 0.0012 -1.30E-06 0.409 0.0004 0.3607 0.0004 -11.82 -0.990.008 0.606 1.4928 0.9867 0.0014 -1.20E-07 0.406 0.0005 0.3584 0.0005 -11.72 -0.920.01 0.617 1.4775 0.9842 0.0018 2.40E-07 0.402 0.0006 0.3559 0.0006 -11.47 0.12
0.015 0.637 1.4459 0.9782 0.0026 -6.00E-08 0.396 0.0009 0.3506 0.0009 -11.47 -0.120.022 0.658 1.4158 0.9708 0.0038 4.80E-07 0.39 0.0013 0.3449 0.0013 -11.56 -0.380.027 0.668 1.4011 0.9666 0.0045 1.80E-07 0.387 0.0016 0.342 0.0016 -11.62 -0.830.032 0.678 1.3865 0.9618 0.0053 1.80E-07 0.384 0.0019 0.339 0.0019 -11.71 -0.920.038 0.689 1.372 0.9567 0.0062 2.40E-07 0.381 0.0022 0.336 0.0022 -11.82 -0.620.044 0.699 1.3578 0.9511 0.0072 2.40E-07 0.377 0.0025 0.3328 0.0025 -11.72 -0.440.051 0.709 1.3438 0.945 0.0084 -6.00E-08 0.374 0.0029 0.3296 0.0029 -11.88 -0.480.06 0.72 1.33 0.9384 0.0097 -1.80E-07 0.371 0.0034 0.3262 0.0034 -12.07 -0.6
0.069 0.73 1.3164 0.9313 0.0111 -2.40E-07 0.367 0.0039 0.3228 0.0039 -12.05 -0.620.103 0.761 1.2772 0.9071 0.0165 1.20E-07 0.356 0.0057 0.3119 0.0057 -12.39 -0.930.133 0.781 1.251 0.8879 0.0213 -6.00E-08 0.35 0.0073 0.3039 0.0073 -13.16 -0.80.168 0.802 1.2261 0.8665 0.027 0.00E+00 0.343 0.0093 0.2955 0.0092 -13.84 -0.980.21 0.822 1.2022 0.8427 0.0338 6.00E-08 0.335 0.0116 0.2866 0.0115 -14.45 -1.02
0.257 0.843 1.1804 0.817 0.0418 1.80E-07 0.327 0.0143 0.2773 0.0142 -15.2 -0.910.315 0.863 1.1562 0.7867 0.052 -1.20E-07 0.318 0.0178 0.2666 0.0176 -16.15 -1.020.382 0.884 1.133 0.7532 0.0643 3.00E-07 0.309 0.022 0.2551 0.0218 -17.44 -1.070.459 0.905 1.1096 0.715 0.0796 0.00E+00 0.298 0.0273 0.2422 0.027 -18.73 -1.180.548 0.925 1.0864 0.6713 0.0989 -6.00E-08 0.286 0.034 0.2276 0.0335 -20.42 -1.470.65 0.946 1.0634 0.6205 0.124 -1.80E-07 0.271 0.0429 0.2107 0.0421 -22.26 -1.94
0.767 0.966 1.0398 0.5576 0.1591 -6.00E-08 0.251 0.0561 0.1897 0.0541 -24.41 -3.411 1.00 1 0.3333 0.3333 0.00E+00 0.144 0.1444 0.1134 0.1134 -21.22 -21.45
223

Table C3.10: Densities Prediction for n-Octane.
Pr Tr Gam ZVC ZLC Fugr DLE DGE DLC DGC DEVL DEVG0.00025 0.495 1.8181 0.9993 0.0001 -3.30E-01 0.389 0 0.235 0 -39.59 -25.39
0.0005 0.515 1.7207 0.9987 0.0001 3.50E-02 0.384 0 0.294 0 -23.45 -4.290.000938 0.535 1.6782 0.9978 0.0002 2.60E-05 0.379 0 0.2951 0.0001 -22.14 3.78
0.002 0.554 1.6403 0.9964 0.0003 1.50E-04 0.376 0.0001 0.2909 0.0001 -22.64 0.210.003 0.574 1.6027 0.9944 0.0005 -3.00E-07 0.371 0.0002 0.2861 0.0002 -22.88 0.190.005 0.594 1.5706 0.9917 0.0008 2.40E-07 0.366 0.0002 0.283 0.0002 -22.67 -2.110.008 0.614 1.5326 0.9878 0.0013 0.00E+00 0.363 0.0004 0.2792 0.0004 -23.08 -0.890.017 0.653 1.4662 0.9768 0.0028 -3.60E-07 0.354 0.0008 0.2714 0.0008 -23.34 -0.460.024 0.673 1.4343 0.9692 0.004 6.60E-07 0.35 0.0011 0.267 0.0011 -23.7 -0.250.034 0.693 1.4026 0.9599 0.0056 1.80E-07 0.345 0.0015 0.2624 0.0015 -23.93 -0.750.047 0.713 1.3726 0.949 0.0076 -6.00E-08 0.341 0.0021 0.2576 0.0021 -24.45 -0.440.064 0.733 1.343 0.9361 0.0101 3.00E-07 0.335 0.0028 0.2525 0.0027 -24.63 -0.90.084 0.752 1.3141 0.9211 0.0133 -6.00E-08 0.33 0.0036 0.247 0.0036 -25.14 -0.910.109 0.772 1.2858 0.9039 0.0173 3.60E-07 0.325 0.0047 0.2412 0.0046 -25.78 -0.710.14 0.792 1.2586 0.8846 0.0221 6.00E-08 0.319 0.0059 0.235 0.0059 -26.32 -0.81
0.176 0.812 1.232 0.8627 0.028 1.80E-07 0.314 0.0075 0.2284 0.0074 -27.26 -0.610.218 0.832 1.2078 0.8389 0.0349 1.80E-07 0.307 0.0093 0.2215 0.0092 -27.83 -0.340.269 0.851 1.1821 0.8114 0.0436 0.00E+00 0.3 0.0115 0.2138 0.0115 -28.72 -0.120.298 0.861 1.1694 0.7964 0.0486 0.00E+00 0.296 0.0128 0.2098 0.0128 -29.14 -0.010.328 0.871 1.1568 0.7806 0.0542 -6.00E-08 0.292 0.0142 0.2055 0.0143 -29.64 0.22
0.4 0.891 1.1301 0.7445 0.0677 6.00E-08 0.282 0.0177 0.1959 0.0178 -30.55 0.530.479 0.911 1.1063 0.7056 0.0836 -4.20E-07 0.271 0.0217 0.1857 0.022 -31.48 1.20.571 0.931 1.0819 0.6603 0.1041 0.00E+00 0.256 0.0269 0.1739 0.0274 -32.06 2.040.676 0.95 1.0579 0.6072 0.131 -1.20E-07 0.231 0.0334 0.1602 0.0346 -30.65 3.340.797 0.97 1.0321 0.5425 0.1707 -1.40E-03 0.199 0.0426 0.142 0.0447 -28.63 4.86
1 1 1 0.3333 0.3333 0.00E+00 0.101 0.101 0.0886 0.0886 -12.29 -12.29
224
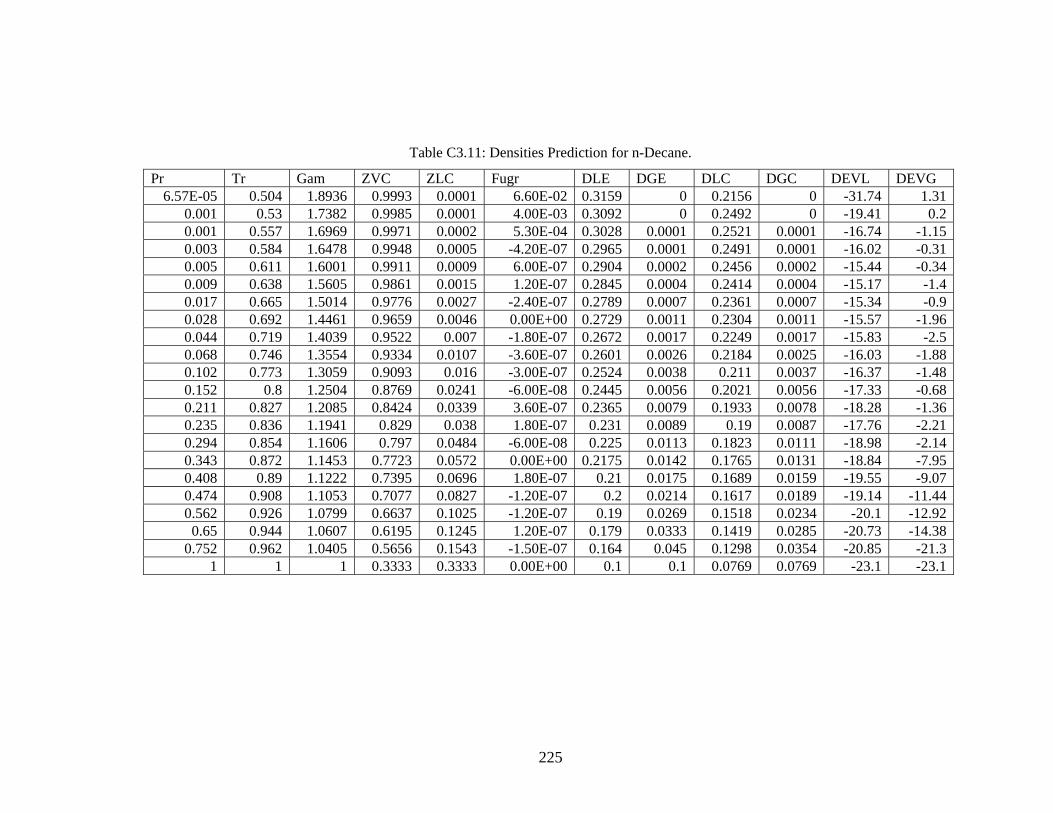
Table C3.11: Densities Prediction for n-Decane.
Pr Tr Gam ZVC ZLC Fugr DLE DGE DLC DGC DEVL DEVG6.57E-05 0.504 1.8936 0.9993 0.0001 6.60E-02 0.3159 0 0.2156 0 -31.74 1.31
0.001 0.53 1.7382 0.9985 0.0001 4.00E-03 0.3092 0 0.2492 0 -19.41 0.20.001 0.557 1.6969 0.9971 0.0002 5.30E-04 0.3028 0.0001 0.2521 0.0001 -16.74 -1.150.003 0.584 1.6478 0.9948 0.0005 -4.20E-07 0.2965 0.0001 0.2491 0.0001 -16.02 -0.310.005 0.611 1.6001 0.9911 0.0009 6.00E-07 0.2904 0.0002 0.2456 0.0002 -15.44 -0.340.009 0.638 1.5605 0.9861 0.0015 1.20E-07 0.2845 0.0004 0.2414 0.0004 -15.17 -1.40.017 0.665 1.5014 0.9776 0.0027 -2.40E-07 0.2789 0.0007 0.2361 0.0007 -15.34 -0.90.028 0.692 1.4461 0.9659 0.0046 0.00E+00 0.2729 0.0011 0.2304 0.0011 -15.57 -1.960.044 0.719 1.4039 0.9522 0.007 -1.80E-07 0.2672 0.0017 0.2249 0.0017 -15.83 -2.50.068 0.746 1.3554 0.9334 0.0107 -3.60E-07 0.2601 0.0026 0.2184 0.0025 -16.03 -1.880.102 0.773 1.3059 0.9093 0.016 -3.00E-07 0.2524 0.0038 0.211 0.0037 -16.37 -1.480.152 0.8 1.2504 0.8769 0.0241 -6.00E-08 0.2445 0.0056 0.2021 0.0056 -17.33 -0.680.211 0.827 1.2085 0.8424 0.0339 3.60E-07 0.2365 0.0079 0.1933 0.0078 -18.28 -1.360.235 0.836 1.1941 0.829 0.038 1.80E-07 0.231 0.0089 0.19 0.0087 -17.76 -2.210.294 0.854 1.1606 0.797 0.0484 -6.00E-08 0.225 0.0113 0.1823 0.0111 -18.98 -2.140.343 0.872 1.1453 0.7723 0.0572 0.00E+00 0.2175 0.0142 0.1765 0.0131 -18.84 -7.950.408 0.89 1.1222 0.7395 0.0696 1.80E-07 0.21 0.0175 0.1689 0.0159 -19.55 -9.070.474 0.908 1.1053 0.7077 0.0827 -1.20E-07 0.2 0.0214 0.1617 0.0189 -19.14 -11.440.562 0.926 1.0799 0.6637 0.1025 -1.20E-07 0.19 0.0269 0.1518 0.0234 -20.1 -12.920.65 0.944 1.0607 0.6195 0.1245 1.20E-07 0.179 0.0333 0.1419 0.0285 -20.73 -14.38
0.752 0.962 1.0405 0.5656 0.1543 -1.50E-07 0.164 0.045 0.1298 0.0354 -20.85 -21.31 1 1 0.3333 0.3333 0.00E+00 0.1 0.1 0.0769 0.0769 -23.1 -23.1
225

Table C3.12: Densities Prediction for Cyclohexane.
Pr Tr Gam ZVC ZLC Fugr DLE DGE DLC DGC DEVL DEVG0.025 0.64 1.3475 0.9673 0.0043 -1.20E-07 0.534 0.0022 0.4957 0.0022 -7.17 1.010.033 0.657 1.3286 0.9599 0.0056 5.40E-07 0.5265 0.0028 0.489 0.0029 -7.12 1.850.043 0.675 1.3085 0.9507 0.0073 -1.80E-07 0.5183 0.0036 0.4814 0.0037 -7.12 2.240.055 0.693 1.2887 0.9402 0.0093 1.80E-07 0.5106 0.0047 0.4734 0.0047 -7.28 -0.260.07 0.711 1.2705 0.9286 0.0117 -1.20E-07 0.5025 0.0059 0.4653 0.0059 -7.41 -0.53
0.088 0.729 1.252 0.9154 0.0146 2.40E-07 0.4945 0.0074 0.4566 0.0073 -7.66 -1.50.11 0.747 1.2323 0.9003 0.0182 1.80E-07 0.4861 0.0091 0.4473 0.009 -7.99 -0.79
0.136 0.765 1.213 0.8836 0.0224 -1.80E-07 0.4773 0.0111 0.4374 0.0111 -8.36 -0.150.166 0.783 1.1949 0.8654 0.0273 2.40E-07 0.4683 0.0136 0.4271 0.0135 -8.79 -1.030.24 0.819 1.159 0.8233 0.0398 -1.20E-07 0.4495 0.0197 0.4046 0.0195 -9.98 -0.78
0.284 0.837 1.1421 0.7996 0.0475 1.80E-07 0.4389 0.0235 0.3925 0.0233 -10.58 -0.70.333 0.855 1.1262 0.7742 0.0565 -6.00E-08 0.4282 0.0282 0.3797 0.0277 -11.33 -1.830.389 0.873 1.1101 0.7463 0.067 0.00E+00 0.4164 0.0334 0.3658 0.0328 -12.15 -1.70.45 0.892 1.095 0.7162 0.0791 -1.80E-07 0.4037 0.0396 0.3511 0.0388 -13.03 -2.030.52 0.91 1.079 0.6821 0.094 1.80E-07 0.3899 0.0469 0.3346 0.0461 -14.19 -1.68
0.597 0.928 1.0636 0.6444 0.1119 1.80E-07 0.3752 0.0553 0.3164 0.0549 -15.67 -0.680.681 0.946 1.0486 0.6019 0.1339 8.90E-08 0.3578 0.0665 0.296 0.0658 -17.28 -1.030.776 0.964 1.0328 0.5506 0.1633 1.80E-07 0.3365 0.0814 0.2713 0.0804 -19.39 -1.17
1 1 1 0.3333 0.3333 0.00E+00 0.2025 0.2025 0.1651 0.1651 -18.49 -18.49
226
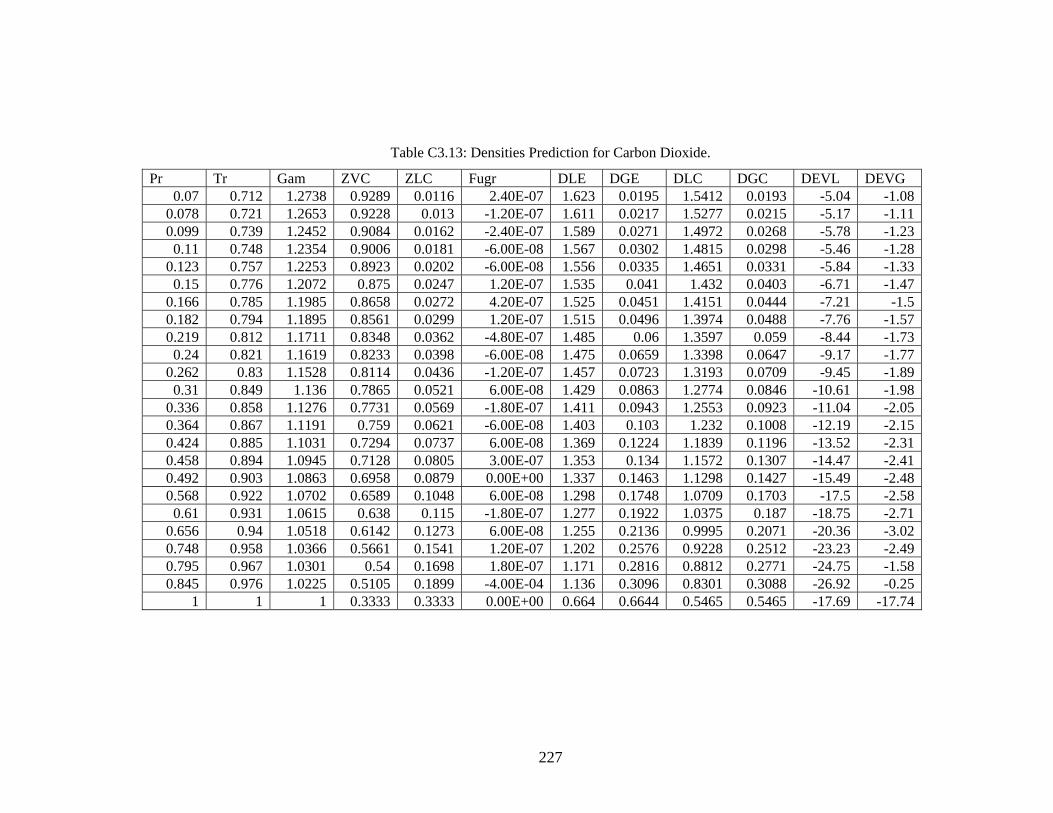
Table C3.13: Densities Prediction for Carbon Dioxide.
Pr Tr Gam ZVC ZLC Fugr DLE DGE DLC DGC DEVL DEVG0.07 0.712 1.2738 0.9289 0.0116 2.40E-07 1.623 0.0195 1.5412 0.0193 -5.04 -1.08
0.078 0.721 1.2653 0.9228 0.013 -1.20E-07 1.611 0.0217 1.5277 0.0215 -5.17 -1.110.099 0.739 1.2452 0.9084 0.0162 -2.40E-07 1.589 0.0271 1.4972 0.0268 -5.78 -1.230.11 0.748 1.2354 0.9006 0.0181 -6.00E-08 1.567 0.0302 1.4815 0.0298 -5.46 -1.28
0.123 0.757 1.2253 0.8923 0.0202 -6.00E-08 1.556 0.0335 1.4651 0.0331 -5.84 -1.330.15 0.776 1.2072 0.875 0.0247 1.20E-07 1.535 0.041 1.432 0.0403 -6.71 -1.47
0.166 0.785 1.1985 0.8658 0.0272 4.20E-07 1.525 0.0451 1.4151 0.0444 -7.21 -1.50.182 0.794 1.1895 0.8561 0.0299 1.20E-07 1.515 0.0496 1.3974 0.0488 -7.76 -1.570.219 0.812 1.1711 0.8348 0.0362 -4.80E-07 1.485 0.06 1.3597 0.059 -8.44 -1.730.24 0.821 1.1619 0.8233 0.0398 -6.00E-08 1.475 0.0659 1.3398 0.0647 -9.17 -1.77
0.262 0.83 1.1528 0.8114 0.0436 -1.20E-07 1.457 0.0723 1.3193 0.0709 -9.45 -1.890.31 0.849 1.136 0.7865 0.0521 6.00E-08 1.429 0.0863 1.2774 0.0846 -10.61 -1.98
0.336 0.858 1.1276 0.7731 0.0569 -1.80E-07 1.411 0.0943 1.2553 0.0923 -11.04 -2.050.364 0.867 1.1191 0.759 0.0621 -6.00E-08 1.403 0.103 1.232 0.1008 -12.19 -2.150.424 0.885 1.1031 0.7294 0.0737 6.00E-08 1.369 0.1224 1.1839 0.1196 -13.52 -2.310.458 0.894 1.0945 0.7128 0.0805 3.00E-07 1.353 0.134 1.1572 0.1307 -14.47 -2.410.492 0.903 1.0863 0.6958 0.0879 0.00E+00 1.337 0.1463 1.1298 0.1427 -15.49 -2.480.568 0.922 1.0702 0.6589 0.1048 6.00E-08 1.298 0.1748 1.0709 0.1703 -17.5 -2.580.61 0.931 1.0615 0.638 0.115 -1.80E-07 1.277 0.1922 1.0375 0.187 -18.75 -2.71
0.656 0.94 1.0518 0.6142 0.1273 6.00E-08 1.255 0.2136 0.9995 0.2071 -20.36 -3.020.748 0.958 1.0366 0.5661 0.1541 1.20E-07 1.202 0.2576 0.9228 0.2512 -23.23 -2.490.795 0.967 1.0301 0.54 0.1698 1.80E-07 1.171 0.2816 0.8812 0.2771 -24.75 -1.580.845 0.976 1.0225 0.5105 0.1899 -4.00E-04 1.136 0.3096 0.8301 0.3088 -26.92 -0.25
1 1 1 0.3333 0.3333 0.00E+00 0.664 0.6644 0.5465 0.5465 -17.69 -17.74
227
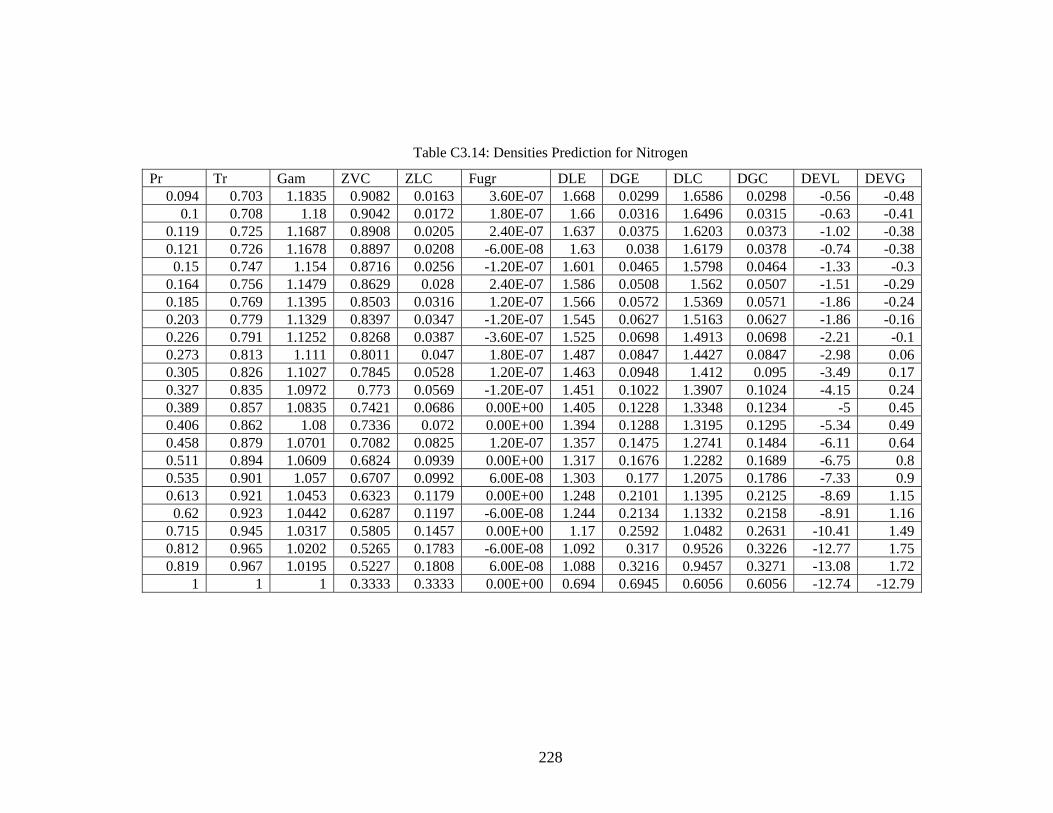
Table C3.14: Densities Prediction for Nitrogen
Pr Tr Gam ZVC ZLC Fugr DLE DGE DLC DGC DEVL DEVG0.094 0.703 1.1835 0.9082 0.0163 3.60E-07 1.668 0.0299 1.6586 0.0298 -0.56 -0.48
0.1 0.708 1.18 0.9042 0.0172 1.80E-07 1.66 0.0316 1.6496 0.0315 -0.63 -0.410.119 0.725 1.1687 0.8908 0.0205 2.40E-07 1.637 0.0375 1.6203 0.0373 -1.02 -0.380.121 0.726 1.1678 0.8897 0.0208 -6.00E-08 1.63 0.038 1.6179 0.0378 -0.74 -0.380.15 0.747 1.154 0.8716 0.0256 -1.20E-07 1.601 0.0465 1.5798 0.0464 -1.33 -0.3
0.164 0.756 1.1479 0.8629 0.028 2.40E-07 1.586 0.0508 1.562 0.0507 -1.51 -0.290.185 0.769 1.1395 0.8503 0.0316 1.20E-07 1.566 0.0572 1.5369 0.0571 -1.86 -0.240.203 0.779 1.1329 0.8397 0.0347 -1.20E-07 1.545 0.0627 1.5163 0.0627 -1.86 -0.160.226 0.791 1.1252 0.8268 0.0387 -3.60E-07 1.525 0.0698 1.4913 0.0698 -2.21 -0.10.273 0.813 1.111 0.8011 0.047 1.80E-07 1.487 0.0847 1.4427 0.0847 -2.98 0.060.305 0.826 1.1027 0.7845 0.0528 1.20E-07 1.463 0.0948 1.412 0.095 -3.49 0.170.327 0.835 1.0972 0.773 0.0569 -1.20E-07 1.451 0.1022 1.3907 0.1024 -4.15 0.240.389 0.857 1.0835 0.7421 0.0686 0.00E+00 1.405 0.1228 1.3348 0.1234 -5 0.450.406 0.862 1.08 0.7336 0.072 0.00E+00 1.394 0.1288 1.3195 0.1295 -5.34 0.490.458 0.879 1.0701 0.7082 0.0825 1.20E-07 1.357 0.1475 1.2741 0.1484 -6.11 0.640.511 0.894 1.0609 0.6824 0.0939 0.00E+00 1.317 0.1676 1.2282 0.1689 -6.75 0.80.535 0.901 1.057 0.6707 0.0992 6.00E-08 1.303 0.177 1.2075 0.1786 -7.33 0.90.613 0.921 1.0453 0.6323 0.1179 0.00E+00 1.248 0.2101 1.1395 0.2125 -8.69 1.150.62 0.923 1.0442 0.6287 0.1197 -6.00E-08 1.244 0.2134 1.1332 0.2158 -8.91 1.16
0.715 0.945 1.0317 0.5805 0.1457 0.00E+00 1.17 0.2592 1.0482 0.2631 -10.41 1.490.812 0.965 1.0202 0.5265 0.1783 -6.00E-08 1.092 0.317 0.9526 0.3226 -12.77 1.750.819 0.967 1.0195 0.5227 0.1808 6.00E-08 1.088 0.3216 0.9457 0.3271 -13.08 1.72
1 1 1 0.3333 0.3333 0.00E+00 0.694 0.6945 0.6056 0.6056 -12.74 -12.79
228
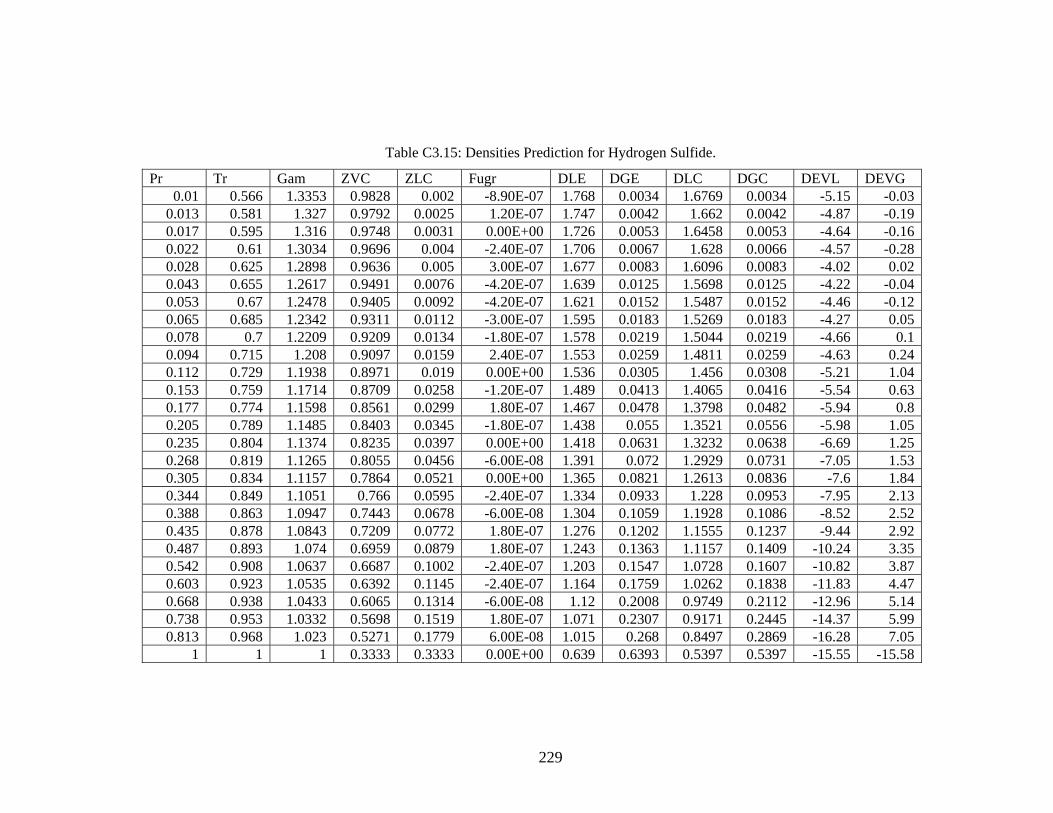
Table C3.15: Densities Prediction for Hydrogen Sulfide.
Pr Tr Gam ZVC ZLC Fugr DLE DGE DLC DGC DEVL DEVG0.01 0.566 1.3353 0.9828 0.002 -8.90E-07 1.768 0.0034 1.6769 0.0034 -5.15 -0.03
0.013 0.581 1.327 0.9792 0.0025 1.20E-07 1.747 0.0042 1.662 0.0042 -4.87 -0.190.017 0.595 1.316 0.9748 0.0031 0.00E+00 1.726 0.0053 1.6458 0.0053 -4.64 -0.160.022 0.61 1.3034 0.9696 0.004 -2.40E-07 1.706 0.0067 1.628 0.0066 -4.57 -0.280.028 0.625 1.2898 0.9636 0.005 3.00E-07 1.677 0.0083 1.6096 0.0083 -4.02 0.020.043 0.655 1.2617 0.9491 0.0076 -4.20E-07 1.639 0.0125 1.5698 0.0125 -4.22 -0.040.053 0.67 1.2478 0.9405 0.0092 -4.20E-07 1.621 0.0152 1.5487 0.0152 -4.46 -0.120.065 0.685 1.2342 0.9311 0.0112 -3.00E-07 1.595 0.0183 1.5269 0.0183 -4.27 0.050.078 0.7 1.2209 0.9209 0.0134 -1.80E-07 1.578 0.0219 1.5044 0.0219 -4.66 0.10.094 0.02590.715 1.208 0.9097 0.0159 2.40E-07 1.553 0.0259 1.4811 -4.63 0.240.112 0.729 1.1938 0.8971 0.019 0.00E+00 1.536 0.0305 1.456 0.0308 -5.21 1.040.153 0.759 1.1714 0.8709 0.0258 -1.20E-07 1.489 0.0413 1.4065 0.0416 -5.54 0.630.177 0.774 1.1598 0.8561 0.0299 1.80E-07 1.467 0.0478 1.3798 0.0482 -5.94 0.80.205 0.789 1.1485 0.8403 0.0345 -1.80E-07 1.438 0.055 1.3521 0.0556 -5.98 1.050.235 0.804 1.1374 0.8235 0.0397 0.00E+00 1.418 0.0631 1.3232 0.0638 -6.69 1.250.268 0.819 1.1265 0.8055 0.0456 -6.00E-08 1.391 0.072 1.2929 0.0731 -7.05 1.530.305 0.834 1.1157 0.7864 0.0521 0.00E+00 1.365 0.0821 1.2613 0.0836 -7.6 1.840.344 0.849 1.1051 0.766 0.0595 -2.40E-07 1.334 0.0933 1.228 0.0953 -7.95 2.130.388 0.863 1.0947 0.7443 0.0678 -6.00E-08 1.304 0.1059 1.1928 0.1086 -8.52 2.520.435 0.878 1.0843 0.7209 0.0772 1.80E-07 1.276 0.1202 1.1555 0.1237 -9.44 2.920.487 0.893 1.074 0.6959 0.0879 1.80E-07 1.243 0.1363 1.1157 0.1409 -10.24 3.350.542 0.908 1.0637 0.6687 0.1002 -2.40E-07 1.203 0.1547 1.0728 0.1607 -10.82 3.870.603 0.923 1.0535 0.6392 0.1145 -2.40E-07 1.164 0.1759 1.0262 0.1838 -11.83 4.470.668 0.938 1.0433 0.6065 0.1314 -6.00E-08 1.12 0.2008 0.9749 0.2112 -12.96 5.140.738 0.953 1.0332 0.5698 0.1519 1.80E-07 1.071 0.2307 0.9171 0.2445 -14.37 5.990.813 0.968 1.023 0.5271 0.1779 6.00E-08 1.015 0.268 0.8497 0.2869 -16.28 7.05
1 1 1 0.3333 0.3333 0.00E+00 0.639 0.6393 0.5397 0.5397 -15.55 -15.58
229
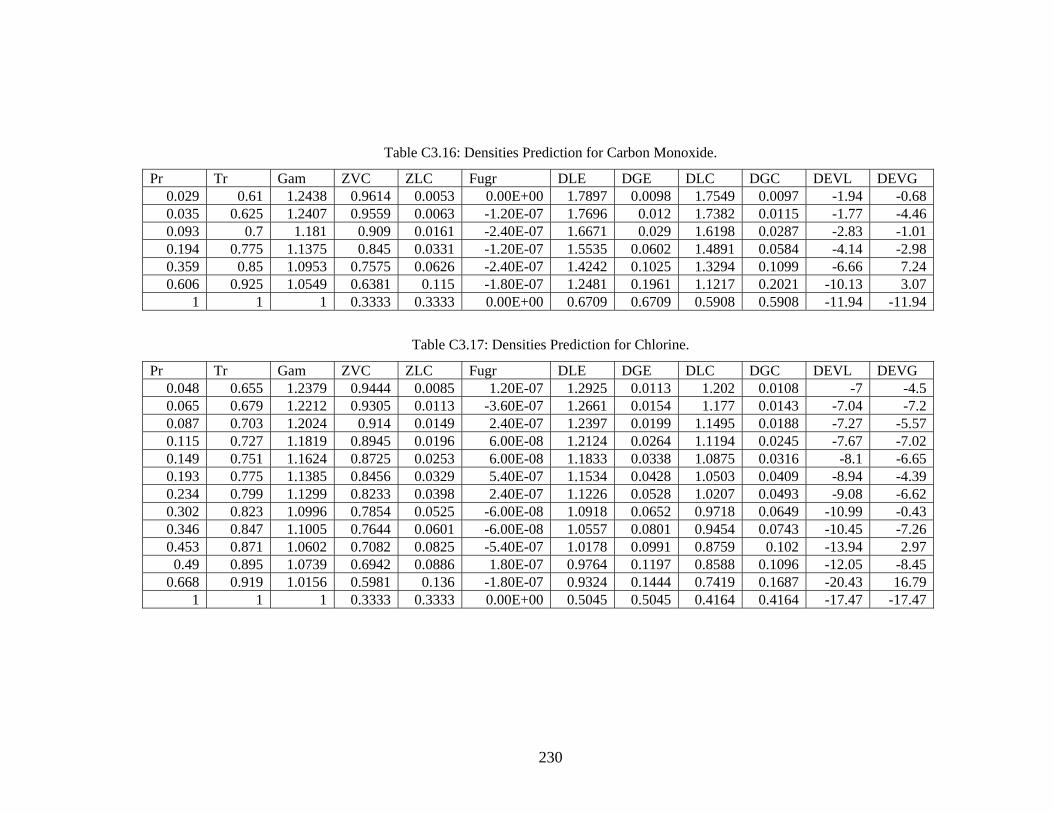
Table C3.16: Densities Prediction for Carbon Monoxide.
Pr Tr Gam ZVC ZLC Fugr DLE DGE DLC DGC DEVL DEVG0.029 0.61 1.2438 0.9614 0.0053 0.00E+00 1.7897 0.0098 1.7549 0.0097 -1.94 -0.680.035 0.625 1.2407 0.9559 0.0063 -1.20E-07 1.7696 0.012 1.7382 0.0115 -1.77 -4.460.093 0.7 1.181 0.909 0.0161 -2.40E-07 1.6671 0.029 1.6198 0.0287 -2.83 -1.010.194 0.775 1.1375 0.845 0.0331 -1.20E-07 1.5535 0.0602 1.4891 0.0584 -4.14 -2.980.359 0.85 1.0953 0.7575 0.0626 -2.40E-07 1.4242 0.1025 1.3294 0.1099 -6.66 7.240.606 0.925 1.0549 0.6381 0.115 -1.80E-07 1.2481 0.1961 1.1217 0.2021 -10.13 3.07
1 1 1 0.3333 0.3333 0.00E+00 0.6709 0.6709 0.5908 0.5908 -11.94 -11.94
Table C3.17: Densities Prediction for Chlorine.
Pr Tr Gam ZVC ZLC Fugr DLE DGE DLC DGC DEVL DEVG0.048 0.655 1.2379 0.9444 0.0085 1.20E-07 1.2925 0.0113 1.202 0.0108 -7 -4.50.065 0.679 1.2212 0.9305 0.0113 -3.60E-07 1.2661 0.0154 1.177 0.0143 -7.04 -7.20.087 0.703 1.2024 0.914 0.0149 2.40E-07 1.2397 0.0199 1.1495 0.0188 -7.27 -5.570.115 0.727 1.1819 0.8945 0.0196 6.00E-08 1.2124 0.0264 1.1194 0.0245 -7.67 -7.020.149 0.751 1.1624 0.8725 0.0253 6.00E-08 1.1833 0.0338 1.0875 0.0316 -8.1 -6.650.193 0.775 1.1385 0.8456 0.0329 5.40E-07 1.1534 0.0428 1.0503 0.0409 -8.94 -4.390.234 0.799 1.1299 0.8233 0.0398 2.40E-07 1.1226 0.0528 1.0207 0.0493 -9.08 -6.620.302 0.823 1.0996 0.7854 0.0525 -6.00E-08 1.0918 0.0652 0.9718 0.0649 -10.99 -0.430.346 0.847 1.1005 0.7644 0.0601 -6.00E-08 1.0557 0.0801 0.9454 0.0743 -10.45 -7.260.453 0.871 1.0602 0.7082 0.0825 -5.40E-07 1.0178 0.0991 0.8759 0.102 -13.94 2.970.49 0.895 1.0739 0.6942 0.0886 1.80E-07 0.9764 0.1197 0.8588 0.1096 -12.05 -8.45
0.668 0.919 1.0156 0.5981 0.136 -1.80E-07 0.9324 0.1444 0.7419 0.1687 -20.43 16.791 1 1 0.3333 0.3333 0.00E+00 0.5045 0.5045 0.4164 0.4164 -17.47 -17.47
230
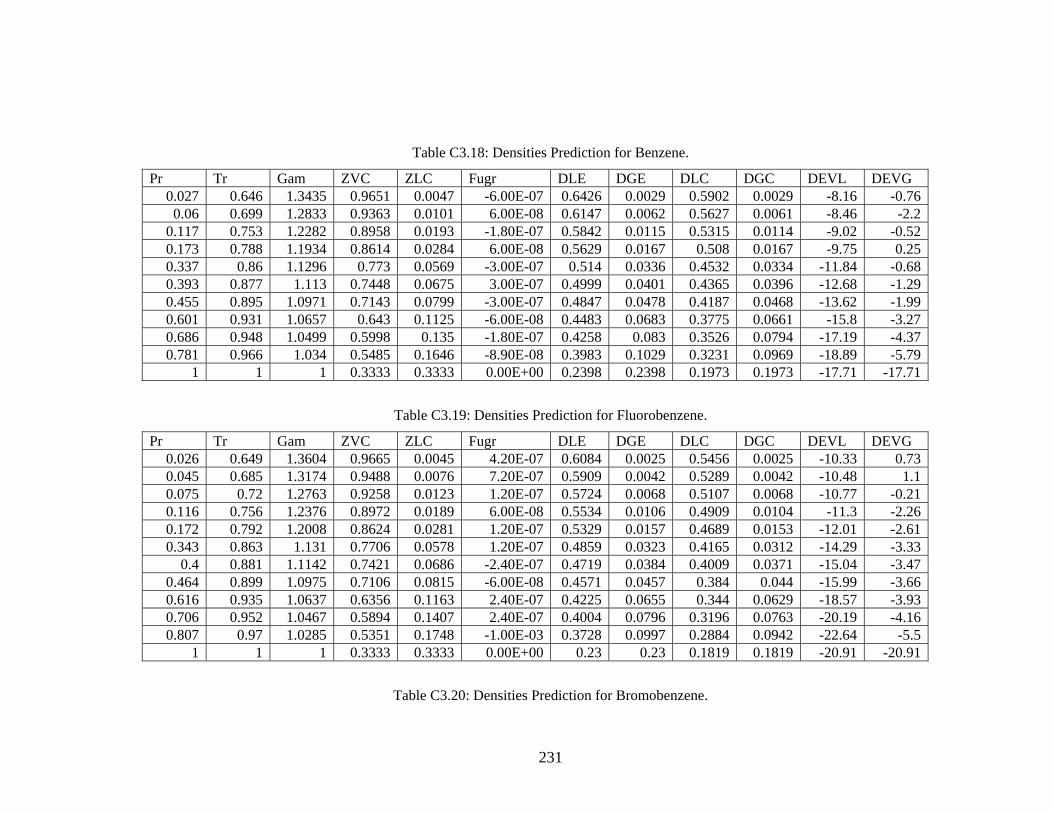
Table C3.18: Densities Prediction for Benzene.
Pr Tr Gam ZVC ZLC Fugr DLE DGE DLC DGC DEVL DEVG0.027 0.646 1.3435 0.9651 0.0047 -6.00E-07 0.6426 0.0029 0.5902 0.0029 -8.16 -0.760.06 0.699 1.2833 0.9363 0.0101 6.00E-08 0.6147 0.0062 0.5627 0.0061 -8.46 -2.2
0.117 0.753 1.2282 0.8958 0.0193 -1.80E-07 0.5842 0.0115 0.5315 0.0114 -9.02 -0.520.173 0.788 1.1934 0.8614 0.0284 6.00E-08 0.5629 0.0167 0.508 0.0167 -9.75 0.250.337 0.86 1.1296 0.773 0.0569 -3.00E-07 0.514 0.0336 0.4532 0.0334 -11.84 -0.680.393 0.877 1.113 0.7448 0.0675 3.00E-07 0.4999 0.0401 0.4365 0.0396 -12.68 -1.290.455 0.895 1.0971 0.7143 0.0799 -3.00E-07 0.4847 0.0478 0.4187 0.0468 -13.62 -1.990.601 0.931 1.0657 0.643 0.1125 -6.00E-08 0.4483 0.0683 0.3775 0.0661 -15.8 -3.270.686 0.948 1.0499 0.5998 0.135 -1.80E-07 0.4258 0.083 0.3526 0.0794 -17.19 -4.370.781 0.966 1.034 0.5485 0.1646 -8.90E-08 0.3983 0.1029 0.3231 0.0969 -18.89 -5.79
1 1 1 0.3333 0.3333 0.00E+00 0.2398 0.2398 0.1973 0.1973 -17.71 -17.71
Table C3.19: Densities Prediction for Fluorobenzene.
Pr Tr Gam ZVC ZLC Fugr DLE DGE DLC DGC DEVL DEVG0.026 0.649 1.3604 0.9665 0.0045 4.20E-07 0.6084 0.0025 56 250.54 0.00 -10.33 0.730.045 5 1.3174 0.94 0.0042 0.5289 0.0042 -10.48 1.10.68 88 0.0076 7.20E-07 0.59090.075 0.72 1.2763 0.9258 0.0123 1.20E-07 0.5724 0.0068 0.5107 0.0068 -10.77 -0.210.116 0.756 1.2376 0.8972 0.0189 6.00E-08 0.5534 0.0106 0.4909 0.0104 -11.3 -2.260.172 0.792 1.2008 0.8624 0.0281 1.20E-07 0.5329 0.0157 0.4689 0.0153 -12.01 -2.610.343 0.863 1.131 0.7706 0.0578 1.20E-07 0.4859 0.0323 0.4165 0.0312 -14.29 -3.33
0.4 0.881 1.1142 0.7421 0.0686 -2.40E-07 0.4719 0.0384 0.4009 0.0371 -15.04 -3.470.464 0.899 1.0975 0.7106 0.0815 -6.00E-08 0.4571 0.0457 0.384 0.044 -15.99 -3.660.616 0.935 1.0637 0.6356 0.1163 2.40E-07 0.4225 0.0655 0.344 0.0629 -18.57 -3.930.706 0.952 1.0467 0.5894 0.1407 2.40E-07 0.4004 0.0796 0.3196 0.0763 -20.19 -4.160.807 0.97 1.0285 0.5351 0.1748 -1.00E-03 0.3728 0.0997 0.2884 0.0942 -22.64 -5.5
1 1 1 0.3333 0.3333 0.00E+00 0.23 0.23 0.1819 0.1819 -20.91 -20.91
Table C3.20: Densities Prediction for Bromobenzene.
231
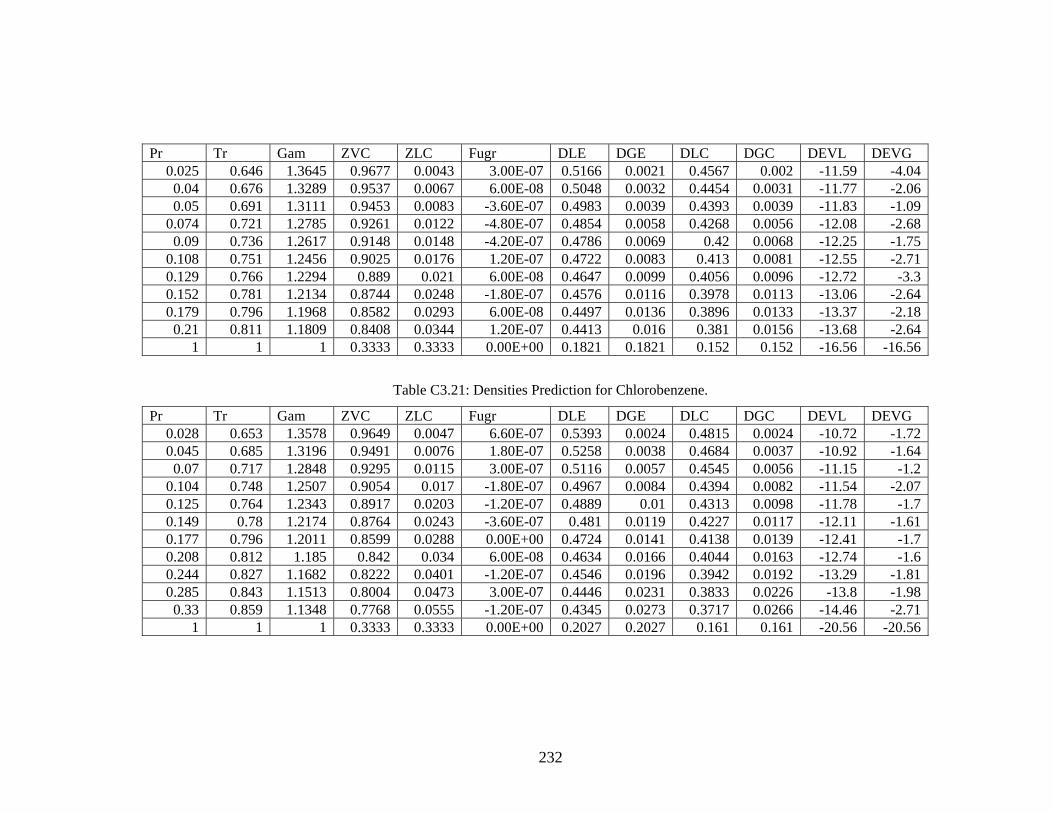
Pr Tr Gam ZVC ZLC Fugr DLE DGE DLC DGC DEVL DEVG 0.025 0.646 1.3645 0.9677 0.0043 3.00E-07 0.5166 0.0021 0.4567 0.002 -11.59 -4.040.04 0.676 1.3289 0.9537 0.0067 6.00E-08 0.5048 0.0032 0.4454 0.0031 -11.77 -2.060.05 0.691 1.3111 0.9453 0.0083 -3.60E-07 0.4983 0.0039 0.4393 0.0039 -11.83 -1.09
0.074 0.721 1.2785 0.9261 0.0122 -4.80E-07 0.4854 0.0058 0.4268 0.0056 -12.08 -2.680.09 0.736 1.2617 0.9148 0.0148 -4.20E-07 0.4786 0.0069 0.42 0.0068 -12.25 -1.75
0.108 0.751 1.2456 0.9025 0.0176 1.20E-07 0.4722 0.0083 0.413 0.0081 -12.55 -2.710.129 0.766 1.2294 0.889 0.021 6.00E-08 0.4647 0.0099 0.4056 0.0096 -12.72 -3.30.152 0.781 1.2134 0.8744 0.0248 -1.80E-07 0.4576 0.0116 0.3978 0.0113 -13.06 -2.640.179 0.796 1.1968 0.8582 0.0293 6.00E-08 0.4497 0.0136 0.3896 0.0133 -13.37 -2.180.21 0.811 1.1809 0.8408 0.0344 1.20E-07 0.4413 0.016 0.381 0.0156 -13.68 -2.64
1 1 1 0.3333 0.3333 0.00E+00 0.1821 0.1821 0.152 0.152 -16.56 -16.56
Table C3.21: Densities Prediction for Chlorobenzene.
Pr Tr Gam ZVC ZLC Fugr DLE DGE DLC DGC DEVL DEVG 0.028 0.653 1.3578 0.9649 0.0047 6.60E-07 0.5393 0.0024 0.4815 0.0024 -10.72 -1.720.045 0.685 1.3196 0.9491 0.0076 1.80E-07 0.5258 0.0038 0.4684 0.0037 -10.92 -1.640.07 0.717 1.2848 0.9295 0.0115 3.00E-07 0.5116 0.0057 0.4545 0.0056 -11.15 -1.2
0.104 0.748 1.2507 0.9054 0.017 -1.80E-07 0.4967 0.0084 0.4394 0.0082 -11.54 -2.070.125 0.764 1.2343 0.8917 0.0203 -1.20E-07 0.4889 0.01 0.4313 0.0098 -11.78 -1.70.149 0.78 1.2174 0.8764 0.0243 -3.60E-07 0.481 0.0119 0.4227 0.0117 -12.11 -1.610.177 0.796 1.2011 0.8599 0.0288 0.00E+00 0.4724 0.0141 0.4138 0.0139 -12.41 -1.70.208 0.812 1.185 0.842 0.034 6.00E-08 0.4634 0.0166 0.4044 0.0163 -12.74 -1.60.244 0.827 1.1682 0.8222 0.0401 -1.20E-07 0.4546 0.0196 0.3942 0.0192 -13.29 -1.810.285 0.843 1.1513 0.8004 0.0473 3.00E-07 0.4446 0.0231 0.3833 0.0226 -13.8 -1.980.33 0.859 1.1348 0.7768 0.0555 -1.20E-07 0.4345 0.0273 0.3717 0.0266 -14.46 -2.71
1 1 1 0.3333 0.3333 0.00E+00 0.2027 0.2027 0.161 0.161 -20.56 -20.56
232
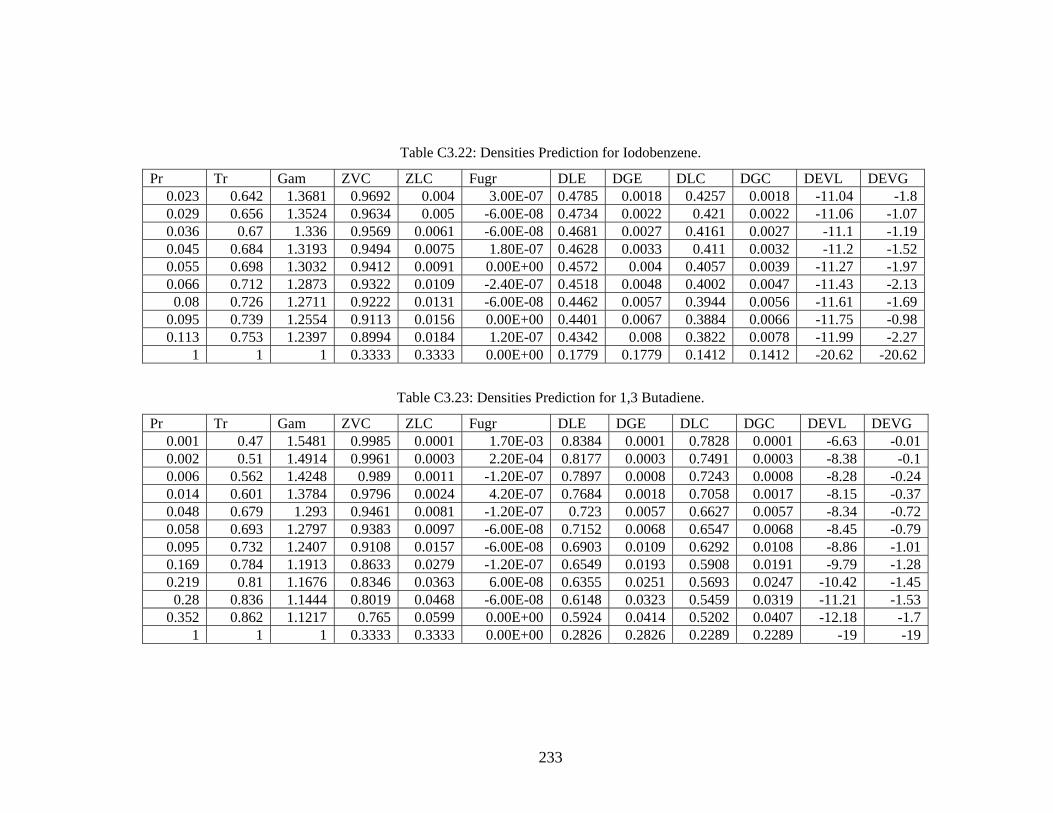
Table C3.22: Densities Prediction for Iodobenzene.
Pr Tr Gam ZVC ZLC Fugr DLE DGE DLC DGC DEVL DEVG 0.023 0.642 1.3681 0.9692 0.004 3.00E-07 0.4785 0.0018 0.4257 0.0018 -11.04 -1.80.029 0.656 1.3524 0.9634 0.005 -6.00E-08 0.4734 0.0022 0.421 0.0022 -11.06 -1.070.036 0.67 1.336 0.9569 0.0061 -6.00E-08 0.4681 0.0027 0.4161 0.0027 -11.1 -1.190.045 0.684 1.3193 0.9494 0.0075 1.80E-07 0.4628 0.0033 0.411 0.0032 -11.2 -1.520.055 0.698 1.3032 0.9412 0.0091 0.00E+00 0.4572 0.004 0.4057 0.0039 -11.27 -1.970.066 0.712 1.2873 0.9322 0.0109 -2.40E-07 0.4518 0.0048 0.4002 0.0047 -11.43 -2.130.08 0.726 1.2711 0.9222 0.0131 -6.00E-08 0.4462 0.0057 0.3944 0.0056 -11.61 -1.69
0.095 0.739 1.2554 0.9113 0.0156 0.00E+00 0.4401 0.0067 0.3884 0.0066 -11.75 -0.980.113 0.753 1.2397 0.8994 0.0184 1.20E-07 0.4342 0.008 0.3822 0.0078 -11.99 -2.27
1 1 1 0.3333 0.3333 0.00E+00 0.1779 0.1779 0.1412 0.1412 -20.62 -20.62
Table C3.23: Densities Prediction for 1,3 Butadiene.
Pr Tr Gam ZVC ZLC Fugr DLE DGE DLC DGC DEVL DEVG 0.001 0.47 1.5481 0.9985 0.0001 1.70E-03 0.8384 0.0001 0.7828 0.0001 -6.63 -0.010.002 0.51 1.4914 0.9961 0.0003 2.20E-04 0.8177 0.0003 0.7491 0.0003 -8.38 -0.10.006 0.562 1.4248 0.989 0.0011 -1.20E-07 0.7897 0.0008 0.7243 0.0008 -8.28 -0.240.014 0.601 1.3784 0.9796 0.0024 4.20E-07 0.7684 0.0018 0.7058 0.0017 -8.15 -0.370.048 0.679 1.293 0.9461 0.0081 -1.20E-07 0.723 0.0057 0.6627 0.0057 -8.34 -0.720.058 0.693 1.2797 0.9383 0.0097 -6.00E-08 0.7152 0.0068 0.6547 0.0068 -8.45 -0.790.095 0.732 1.2407 0.9108 0.0157 -6.00E-08 0.6903 0.0109 0.6292 0.0108 -8.86 -1.010.169 0.784 1.1913 0.8633 0.0279 -1.20E-07 0.6549 0.0193 0.5908 0.0191 -9.79 -1.280.219 0.81 1.1676 0.8346 0.0363 6.00E-08 0.6355 0.0251 0.5693 0.0247 -10.42 -1.450.28 0.836 1.1444 0.8019 0.0468 -6.00E-08 0.6148 0.0323 0.5459 0.0319 -11.21 -1.53
0.352 0.862 1.1217 0.765 0.0599 0.00E+00 0.5924 0.0414 0.5202 0.0407 -12.18 -1.71 1 1 0.3333 0.3333 0.00E+00 0.2826 0.2826 0.2289 0.2289 -19 -19
233
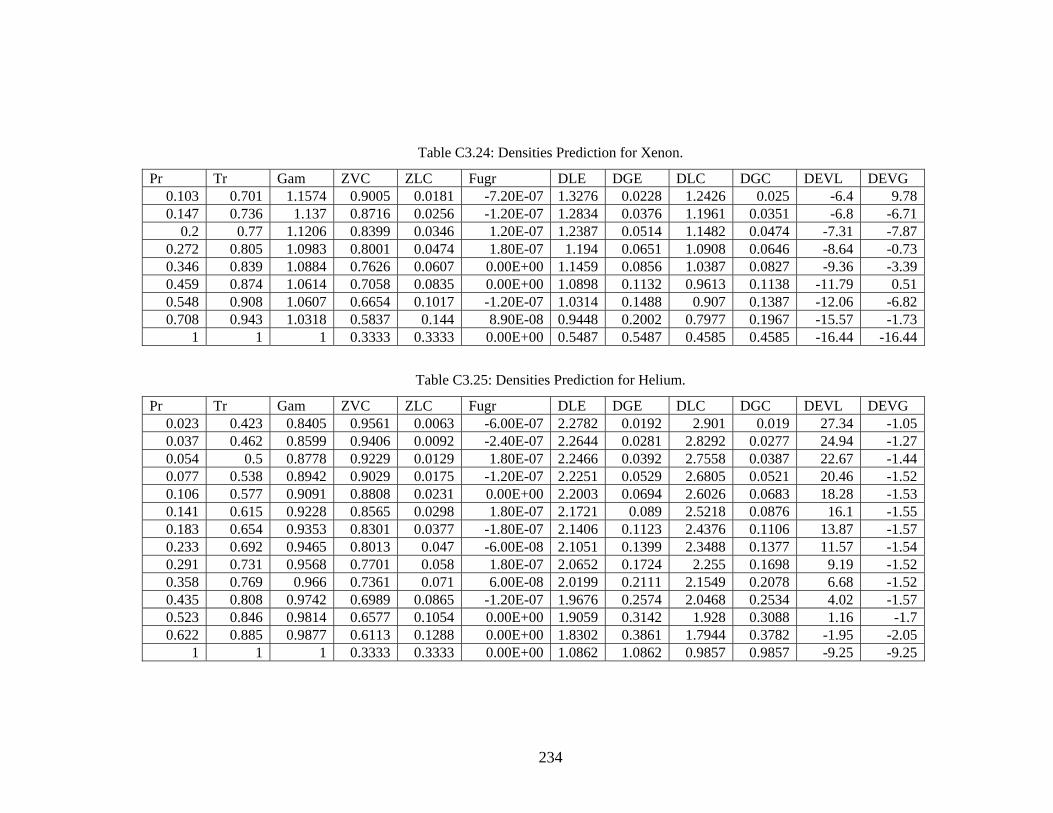
Table C3.24: Densities Prediction for Xenon.
Pr Tr Gam ZVC ZLC Fugr DLE DGE DLC DGC DEVL DEVG 0.103 0.701 1.1574 0.9005 0.0181 -7.20E-07 1.3276 0.0228 1.2426 0.025 -6.4 9.780.147 0.736 1.137 0.8716 0.0256 -1.20E-07 1.2834 0.0376 1.1961 0.0351 -6.8 -6.71
0.2 0.77 1.1206 0.8399 0.0346 1.20E-07 1.2387 0.0514 1.1482 0.0474 -7.31 -7.870.272 0.805 1.0983 0.8001 0.0474 1.80E-07 1.194 0.0651 1.0908 0.0646 -8.64 -0.730.346 0.839 1.0884 0.7626 0.0607 0.00E+00 1.1459 0.0856 1.0387 0.0827 -9.36 -3.390.459 0.874 1.0614 0.7058 0.0835 0.00E+00 1.0898 0.1132 0.9613 0.1138 -11.79 0.510.548 0.908 1.0607 0.6654 0.1017 -1.20E-07 1.0314 0.1488 0.907 0.1387 -12.06 -6.820.708 0.943 1.0318 0.5837 0.144 8.90E-08 0.9448 0.2002 0.7977 0.1967 -15.57 -1.73
1 1 1 0.3333 0.3333 0.00E+00 0.5487 0.5487 0.4585 0.4585 -16.44 -16.44
Table C3.25: Densities Prediction for Helium.
Pr Tr Gam ZVC ZLC Fugr DLE DGE DLC DGC DEVL DEVG 0.023 0.423 0.8405 0.9561 0.0063 -6.00E-07 2.2782 0.0192 2.901 0.019 27.34 -1.050.037 0.462 0.8599 0.9406 0.0092 -2.40E-07 2.2644 0.0281 2.8292 0.0277 24.94 -1.270.054 0.5 0.8778 0.9229 0.0129 1.80E-07 2.2466 0.0392 2.7558 0.0387 22.67 -1.440.077 0.538 0.8942 0.9029 0.0175 -1.20E-07 2.2251 0.0529 2.6805 0.0521 20.46 -1.520.106 0.577 0.9091 0.8808 0.0231 0.00E+00 2.2003 0.0694 2.6026 0.0683 18.28 -1.530.141 0.615 0.9228 0.8565 0.0298 1.80E-07 2.1721 0.089 2.5218 0.0876 16.1 -1.550.183 0.654 0.9353 0.8301 0.0377 -1.80E-07 2.1406 0.1123 2.4376 0.1106 13.87 -1.570.233 0.692 0.9465 0.8013 0.047 -6.00E-08 2.1051 0.1399 2.3488 0.1377 11.57 -1.540.291 0.731 0.9568 0.7701 0.058 1.80E-07 2.0652 0.1724 2.255 0.1698 9.19 -1.520.358 0.769 0.966 0.7361 0.071 6.00E-08 2.0199 0.2111 2.1549 0.2078 6.68 -1.520.435 0.808 0.9742 0.6989 0.0865 -1.20E-07 1.9676 0.2574 2.0468 0.2534 4.02 -1.570.523 0.846 0.9814 0.6577 0.1054 0.00E+00 1.9059 0.3142 1.928 0.3088 1.16 -1.70.622 0.885 0.9877 0.6113 0.1288 0.00E+00 1.8302 0.3861 1.7944 0.3782 -1.95 -2.05
1 1 1 0.3333 0.3333 0.00E+00 1.0862 1.0862 0.9857 0.9857 -9.25 -9.25
234

Table C3.26: Densities Prediction for Argon.
Pr Tr Gam ZVC ZLC Fugr DLE DGE DLC DGC DEVL DEVG 0.014 0.555 1.251 0.9773 0.0028 -6.00E-08 2.2106 0.0063 2.2437 0.0063 1.5 -0.170.016 0.563 1.2457 0.9749 0.0031 0.00E+00 2.2 0.0072 2.2313 0.0072 1.42 -0.250.027 0.596 1.2235 0.9626 0.0051 -2.40E-07 2.1519 0.0116 2.1775 0.0116 1.19 -0.260.044 0.63 1.2022 0.947 0.008 -7.20E-07 2.1019 0.0179 2.1204 0.0179 0.88 -0.320.066 0.663 1.1818 0.9279 0.0119 2.40E-07 2.0495 0.0264 2.0597 0.0263 0.5 -0.410.097 0.696 1.1622 0.9052 0.017 -1.20E-07 1.9952 0.0377 1.9951 0.0375 -0.01 -0.490.136 0.729 1.1433 0.8786 0.0237 -1.20E-07 1.9378 0.0522 1.9258 0.0519 -0.62 -0.530.186 0.762 1.125 0.8481 0.0322 1.20E-07 1.8766 0.0707 1.8511 0.0703 -1.36 -0.570.248 0.795 1.1073 0.8133 0.043 6.00E-08 1.8123 0.0941 1.7702 0.0936 -2.32 -0.60.323 0.828 1.0899 0.7738 0.0566 3.60E-07 1.7424 0.1238 1.6815 0.123 -3.49 -0.630.414 0.861 1.0727 0.7286 0.074 1.20E-07 1.6643 0.1619 1.5828 0.1608 -4.9 -0.690.521 0.895 1.0556 0.6765 0.0966 0.00E+00 1.5769 0.2118 1.4707 0.2099 -6.74 -0.860.647 0.928 1.0383 0.6144 0.1272 -6.00E-08 1.4721 0.2804 1.3382 0.2769 -9.09 -1.220.795 0.961 1.0209 0.5359 0.1724 -3.00E-08 1.3335 0.3861 1.1706 0.3765 -12.21 -2.48
1 1 1 0.3333 0.3333 0.00E+00 0.8372 0.8372 0.7314 0.7314 -12.63 -12.63
Table C3.27: Densities Prediction for Hydrogen.
Pr Tr Gam ZVC ZLC Fugr DLE DGE DLC DGC DEVL DEVG 0.009 0.451 1.0463 0.981 0.0022 3.00E-07 2.363 0.0062 2.7061 0.0061 14.52 -1.090.019 0.496 1.0489 0.9679 0.0042 -1.20E-07 2.3206 0.0118 2.6297 0.0115 13.32 -2.690.068 0.601 1.0472 0.9202 0.0135 2.40E-07 2.2091 0.0359 2.4356 0.0358 10.25 -0.250.168 0.701 1.0407 0.8508 0.0314 1.20E-07 2.0822 0.0818 2.2208 0.082 6.65 0.24
1 1 1 0.3333 0.3333 0.00E+00 0.9606 0.9606 0.8745 0.8745 -8.97 -8.97
235
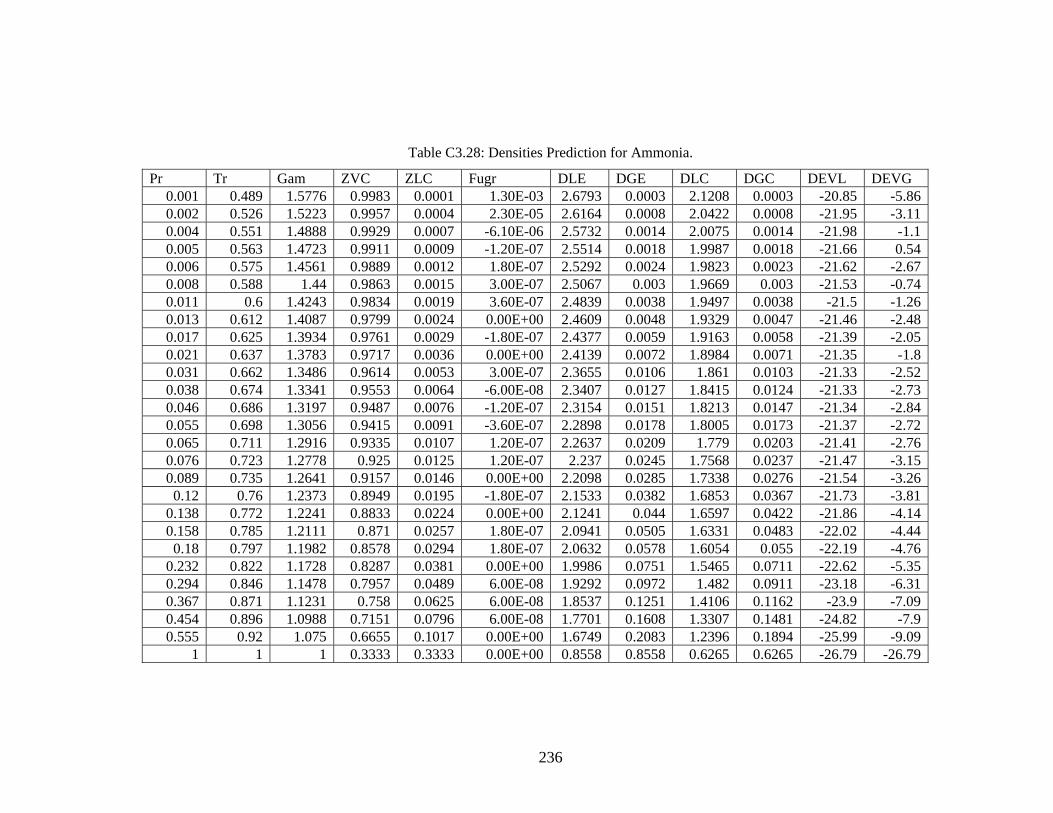
Table C3.28: Densities Prediction for Ammonia.
Pr Tr Gam ZVC ZLC Fugr DLE DGE DLC DGC DEVL DEVG 0.001 0.489 1.5776 0.9983 0.0001 1.30E-03 2.6793 0.0003 2.1208 0.0003 -20.85 -5.860.002 0.526 1.5223 0.9957 0.0004 2.30E-05 2.6164 0.0008 2.0422 0.0008 -21.95 -3.110.004 0.551 1.4888 0.9929 0.0007 -6.10E-06 2.5732 0.0014 2.0075 0.0014 -21.98 -1.10.005 0.563 1.4723 0.9911 0.0009 -1.20E-07 2.5514 0.0018 1.9987 0.0018 -21.66 0.540.006 0.575 1.4561 0.9889 0.0012 1.80E-07 2.5292 0.0024 1.9823 0.0023 -21.62 -2.670.008 0.588 1.44 0.9863 0.0015 3.00E-07 2.5067 0.003 1.9669 0.003 -21.53 -0.740.011 0.6 1.4243 0.9834 0.0019 3.60E-07 2.4839 0.0038 1.9497 0.0038 -21.5 -1.260.013 0.612 1.4087 0.9799 0.0024 0.00E+00 2.4609 0.0048 1.9329 0.0047 -21.46 -2.480.017 0.625 1.3934 0.9761 0.0029 -1.80E-07 2.4377 0.0059 1.9163 0.0058 -21.39 -2.050.021 0.637 1.3783 0.9717 0.0036 0.00E+00 2.4139 0.0072 1.8984 0.0071 -21.35 -1.80.031 0.662 1.3486 0.9614 0.0053 3.00E-07 2.3655 0.0106 1.861 0.0103 -21.33 -2.520.038 0.674 1.3341 0.9553 0.0064 -6.00E-08 2.3407 0.0127 1.8415 0.0124 -21.33 -2.730.046 0.686 1.3197 0.9487 0.0076 -1.20E-07 2.3154 0.0151 1.8213 0.0147 -21.34 -2.840.055 0.698 1.3056 0.9415 0.0091 -3.60E-07 2.2898 0.0178 1.8005 0.0173 -21.37 -2.720.065 0.711 1.2916 0.9335 0.0107 1.20E-07 2.2637 0.0209 1.779 0.0203 -21.41 -2.760.076 0.723 1.2778 0.925 0.0125 1.20E-07 2.237 0.0245 1.7568 0.0237 -21.47 -3.150.089 0.735 1.2641 0.9157 0.0146 0.00E+00 2.2098 0.0285 1.7338 0.0276 -21.54 -3.260.12 0.76 1.2373 0.8949 0.0195 -1.80E-07 2.1533 0.0382 1.6853 0.0367 -21.73 -3.81
0.138 0.772 1.2241 0.8833 0.0224 0.00E+00 2.1241 0.044 1.6597 0.0422 -21.86 -4.140.158 0.785 1.2111 0.871 0.0257 1.80E-07 2.0941 0.0505 1.6331 0.0483 -22.02 -4.440.18 0.797 1.1982 0.8578 0.0294 1.80E-07 2.0632 0.0578 1.6054 0.055 -22.19 -4.76
0.232 0.822 1.1728 0.8287 0.0381 0.00E+00 1.9986 0.0751 1.5465 0.0711 -22.62 -5.350.294 0.846 1.1478 0.7957 0.0489 6.00E-08 1.9292 0.0972 1.482 0.0911 -23.18 -6.310.367 0.871 1.1231 0.758 0.0625 6.00E-08 1.8537 0.1251 1.4106 0.1162 -23.9 -7.090.454 0.896 1.0988 0.7151 0.0796 6.00E-08 1.7701 0.1608 1.3307 0.1481 -24.82 -7.90.555 0.92 1.075 0.6655 0.1017 0.00E+00 1.6749 0.2083 1.2396 0.1894 -25.99 -9.09
1 1 1 0.3333 0.3333 0.00E+00 0.8558 0.8558 0.6265 0.6265 -26.79 -26.79
236

Table C3.29: Densities Prediction for Acetic Acid.
Pr Tr Gam ZVC ZLC Fugr DLE DGE DLC DGC DEVL DEVG 0.018 0.659 1.4729 0.9764 0.0029 -6.00E-08 0.9751 0.0033 0.6707 0.002 -31.22 -39.720.033 0.695 1.4168 0.9614 0.0053 -3.00E-07 0.9451 0.0057 0.651 0.0036 -31.12 -36.710.055 0.728 1.3691 0.9429 0.0088 1.80E-07 0.9178 0.0092 0.6312 0.0059 -31.22 -36.240.088 0.762 1.3222 0.919 0.0138 1.80E-07 0.8893 0.0142 0.6093 0.0092 -31.49 -35.490.135 0.796 1.2755 0.8884 0.0211 -6.00E-08 0.8592 0.0213 0.5845 0.0139 -31.98 -34.720.288 0.863 1.182 0.8026 0.0465 1.80E-07 0.787 0.045 0.5231 0.0303 -33.54 -32.590.342 0.88 1.1588 0.7747 0.0563 -2.40E-07 0.7655 0.0537 0.5044 0.0366 -34.11 -31.760.404 0.896 1.1357 0.7436 0.068 6.00E-08 0.7418 0.0641 0.4839 0.0443 -34.76 -30.930.555 0.93 1.09 0.6692 0.0999 -1.20E-07 0.6891 0.0918 0.436 0.0651 -36.73 -29.090.644 0.947 1.0678 0.6241 0.1221 -6.00E-08 0.6584 0.1115 0.4071 0.0796 -38.16 -28.580.745 0.964 1.0456 0.5706 0.1514 -2.10E-07 0.6185 0.1384 0.3729 0.099 -39.7 -28.49
1 1 1 0.3333 0.3333 0.00E+00 0.3645 0.3645 0.2191 0.2191 -39.88 -39.88
Table C3.30: Densities Prediction for Acetone.
Pr Tr Gam ZVC ZLC Fugr DLE DGE DLC DGC DEVL DEVG 0.021 0.647 1.3995 0.9715 0.0036 -1.80E-07 0.8061 0.0021 0.6334 0.0024 -21.42 13.240.045 0.694 1.3397 0.9495 0.0075 3.00E-07 0.7728 0.0043 0.6086 0.0048 -21.24 11.840.079 0.734 1.2911 0.9236 0.0128 2.40E-07 0.7449 0.0075 0.5852 0.0081 -21.43 8.010.129 0.773 1.2429 0.8897 0.0208 0.00E+00 0.7148 0.0118 0.5586 0.0131 -21.85 10.780.162 0.793 1.2198 0.8696 0.0261 -1.80E-07 0.6987 0.014 0.5441 0.0163 -22.13 16.710.247 0.832 1.1729 0.8212 0.0404 -3.60E-07 0.6643 0.0215 0.5112 0.0252 -23.04 17.10.429 0.891 1.1085 0.7279 0.0743 1.20E-07 0.6105 0.0419 0.4521 0.0461 -25.95 10.090.601 0.93 1.0652 0.643 0.1126 -6.00E-08 0.5525 0.0699 0.4 0.07 -27.61 0.180.702 0.95 1.045 0.5911 0.1398 3.00E-08 0.5181 0.0914 0.3684 0.0871 -28.9 -4.690.818 0.97 1.024 0.5252 0.1792 1.20E-07 0.4762 0.1182 0.3281 0.1119 -31.1 -5.32
1 1 1 0.3333 0.3333 0.00E+00 0.2934 0.2934 0.2091 0.2091 -28.73 -28.73
237
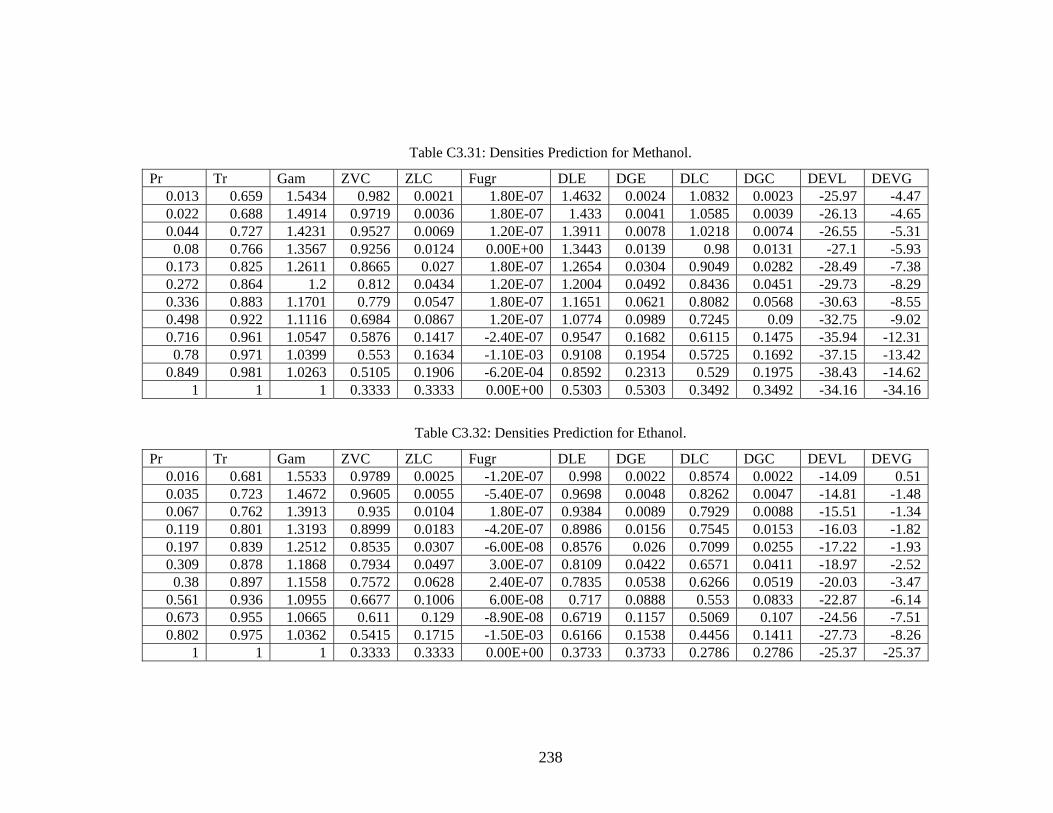
Table C3.31: Densities Prediction for Methanol.
Pr Tr Gam ZVC ZLC Fugr DLE DGE DLC DGC DEVL DEVG 0.013 0.659 1.5434 0.982 0.0021 1.80E-07 1.4632 0.0024 1.0832 0.0023 -25.97 -4.470.022 0.688 1.4914 0.9719 0.0036 1.80E-07 1.433 0.0041 1.0585 0.0039 -26.13 -4.650.044 0.727 1.4231 0.9527 0.0069 1.20E-07 1.3911 0.0078 1.0218 0.0074 -26.55 -5.310.08 0.766 1.3567 0.9256 0.0124 0.00E+00 1.3443 0.0139 0.98 0.0131 -27.1 -5.93
0.173 0.825 1.2611 0.8665 0.027 1.80E-07 1.2654 0.0304 0.9049 0.0282 -28.49 -7.380.272 0.864 1.2 0.812 0.0434 1.20E-07 1.2004 0.0492 0.8436 0.0451 -29.73 -8.290.336 0.883 1.1701 0.779 0.0547 1.80E-07 1.1651 0.0621 0.8082 0.0568 -30.63 -8.550.498 0.922 1.1116 0.6984 0.0867 1.20E-07 1.0774 0.0989 0.7245 0.09 -32.75 -9.020.716 0.961 1.0547 0.5876 0.1417 -2.40E-07 0.9547 0.1682 0.6115 0.1475 -35.94 -12.310.78 0.971 1.0399 0.553 0.1634 -1.10E-03 0.9108 0.1954 0.5725 0.1692 -37.15 -13.42
0.849 0.981 1.0263 0.5105 0.1906 -6.20E-04 0.8592 0.2313 0.529 0.1975 -38.43 -14.621 1 1 0.3333 0.3333 0.00E+00 0.5303 0.5303 0.3492 0.3492 -34.16 -34.16
Table C3.32: Densities Prediction for Ethanol.
Pr Tr Gam ZVC ZLC Fugr DLE DGE DLC DGC DEVL DEVG 0.016 0.681 1.5533 0.9789 0.0025 -1.20E-07 0.998 0.0022 0.8574 0.0022 -14.09 0.510.035 0.723 1.4672 0.9605 0.0055 -5.40E-07 0.9698 0.0048 0.8262 0.0047 -14.81 -1.480.067 0.762 1.3913 0.935 0.0104 1.80E-07 0.9384 0.0089 0.7929 0.0088 -15.51 -1.340.119 0.801 1.3193 0.8999 0.0183 -4.20E-07 0.8986 0.0156 0.7545 0.0153 -16.03 -1.820.197 0.839 1.2512 0.8535 0.0307 -6.00E-08 0.8576 0.026 0.7099 0.0255 -17.22 -1.930.309 0.878 1.1868 0.7934 0.0497 3.00E-07 0.8109 0.0422 0.6571 0.0411 -18.97 -2.520.38 0.897 1.1558 0.7572 0.0628 2.40E-07 0.7835 0.0538 0.6266 0.0519 -20.03 -3.47
0.561 0.936 1.0955 0.6677 0.1006 6.00E-08 0.717 0.0888 0.553 0.0833 -22.87 -6.140.673 0.955 1.0665 0.611 0.129 -8.90E-08 0.6719 0.1157 0.5069 0.107 -24.56 -7.510.802 0.975 1.0362 0.5415 0.1715 -1.50E-03 0.6166 0.1538 0.4456 0.1411 -27.73 -8.26
1 1 1 0.3333 0.3333 0.00E+00 0.3733 0.3733 0.2786 0.2786 -25.37 -25.37
238

Table C3.33: Densities Prediction for Propanol.
Pr Tr Gam ZVC ZLC Fugr DLE DGE DLC DGC DEVL DEVG 0.02 0.69 1.5247 0.9747 0.0032 0.00E+00 0.7636 0.0022 0.6508 0.0021 -14.77 -4.26
0.022 0.695 1.5146 0.9727 0.0035 -1.80E-07 0.7609 0.0023 0.6481 0.0023 -14.83 0.240.031 0.714 1.4741 0.9638 0.0049 2.40E-07 0.75 0.0033 0.6368 0.0032 -15.09 -1.560.044 0.732 1.4348 0.953 0.0068 1.80E-07 0.7386 0.0046 0.6249 0.0045 -15.4 -2.530.06 0.751 1.397 0.9402 0.0093 -2.40E-07 0.7266 0.0063 0.6122 0.0061 -15.75 -3.73
0.081 0.77 1.3603 0.925 0.0125 -5.40E-07 0.7142 0.0084 0.5986 0.0081 -16.19 -3.90.106 0.788 1.325 0.9076 0.0164 -1.80E-07 0.7002 0.011 0.5841 0.0106 -16.59 -3.820.138 0.807 1.291 0.8876 0.0214 3.00E-07 0.6856 0.0143 0.5686 0.0137 -17.07 -4.310.176 0.826 1.2582 0.8648 0.0274 -1.20E-07 0.67 0.0184 0.5519 0.0175 -17.62 -4.880.221 0.844 1.2267 0.8393 0.0348 -5.40E-07 0.6529 0.0234 0.5341 0.0222 -18.2 -5.280.274 0.863 1.1963 0.8106 0.0439 0.00E+00 0.6347 0.0293 0.5147 0.0279 -18.9 -4.90.336 0.881 1.167 0.7785 0.0549 -6.00E-08 0.615 0.0367 0.4937 0.0348 -19.72 -5.120.408 0.9 1.1387 0.7425 0.0685 0.00E+00 0.5937 0.0459 0.4706 0.0434 -20.73 -5.460.489 0.919 1.1116 0.702 0.0852 -6.00E-08 0.5698 0.0578 0.4451 0.054 -21.88 -6.580.583 0.937 1.0852 0.6558 0.1063 -6.00E-08 0.5433 0.0731 0.4162 0.0675 -23.39 -7.70.689 0.956 1.0596 0.6017 0.134 0.00E+00 0.5111 0.0939 0.3826 0.0852 -25.15 -9.280.808 0.974 1.0336 0.5372 0.174 -1.30E-03 0.4701 0.1226 0.339 0.1098 -27.88 -10.46
1 1 1 0.3333 0.3333 0.00E+00 0.284 0.284 0.2134 0.2134 -24.85 -24.85
239

Table C3.34: Densities Prediction for Steam.
Pr Tr Gam ZVC ZLC Fugr DLE DGE DLC DGC DEVL DEVG 0.001159 0.523 1.6033 0.9973 0.0002 1.90E-03 3.3965 0.0006 2.5517 0.0006 -24.87 -0.380.001478 0.532 1.5898 0.9967 0.0003 -5.30E-04 3.3857 0.0007 2.4997 0.0007 -26.17 -0.46
0.002 0.549 1.5637 0.9952 0.0004 1.40E-04 3.3622 0.0011 2.4937 0.0011 -25.83 -0.560.003 0.558 1.5508 0.9942 0.0005 -5.50E-06 3.3496 0.0014 2.4824 0.0013 -25.89 -0.620.004 0.566 1.5381 0.9931 0.0007 3.60E-07 3.3365 0.0017 2.4728 0.0016 -25.89 -0.690.004 0.575 1.5255 0.9919 0.0008 0.00E+00 3.3229 0.002 2.4616 0.002 -25.92 -0.760.006 0.592 1.5007 0.989 0.0012 3.60E-07 3.2945 0.0029 2.4373 0.0028 -26.02 -0.920.009 0.609 1.4763 0.9853 0.0016 -2.40E-07 3.2526 0.004 2.4087 0.004 -25.95 -1.090.011 0.618 1.4643 0.9832 0.0019 -1.20E-07 3.2482 0.0047 2.3951 0.0047 -26.27 -1.170.015 0.635 1.4405 0.9782 0.0026 2.40E-07 3.2153 0.0064 2.3657 0.0063 -26.43 -1.360.021 0.652 1.4171 0.9723 0.0035 -6.60E-07 3.181 0.0086 2.3349 0.0085 -26.6 -1.570.028 0.669 1.3941 0.9654 0.0047 -3.00E-07 3.1432 0.0113 2.3032 0.0111 -26.73 -1.790.037 0.686 1.3714 0.9573 0.0061 2.40E-07 3.1063 0.0147 2.2697 0.0144 -26.93 -2.020.048 0.704 1.3491 0.948 0.0078 -3.00E-07 3.0651 0.0188 2.2347 0.0183 -27.09 -2.270.061 0.721 1.3271 0.9374 0.0099 -1.20E-07 3.0234 0.0238 2.1979 0.0232 -27.3 -2.530.096 0.755 1.284 0.9119 0.0154 6.00E-08 2.9308 0.037 2.1185 0.0359 -27.71 -3.110.119 0.772 1.2629 0.8968 0.019 1.80E-07 2.8821 0.0456 2.0755 0.0441 -27.99 -3.420.146 0.789 1.242 0.8801 0.0233 -2.40E-07 2.8307 0.0558 2.0301 0.0537 -28.28 -3.750.176 0.807 1.2214 0.8616 0.0283 6.00E-08 2.7755 0.0679 1.9819 0.0651 -28.59 -4.1
0.3 0.858 1.1612 0.7943 0.0494 -1.20E-07 2.5866 0.1193 1.8172 0.113 -29.75 -5.340.353 0.875 1.1415 0.7672 0.059 -1.20E-07 2.5151 0.1434 1.7539 0.135 -30.27 -5.860.413 0.892 1.1221 0.7373 0.0705 1.80E-07 2.4357 0.1723 1.6851 0.1612 -30.82 -6.450.481 0.909 1.1028 0.704 0.0843 0.00E+00 2.3481 0.2075 1.6096 0.1927 -31.45 -7.140.557 0.927 1.0835 0.6668 0.1011 -1.20E-07 2.251 0.2514 1.5255 0.2313 -32.23 -8.010.642 0.944 1.0643 0.6242 0.122 6.00E-08 2.1391 0.308 1.43 0.2796 -33.15 -9.230.737 0.961 1.045 0.5741 0.1494 0.00E+00 2.0054 0.3847 1.3175 0.3429 -34.3 -10.86
1 1 1 0.3333 0.3333 0.00E+00 1.0931 1.0931 0.7696 0.7696 -29.6 -29.6
240

Table C3.35: Densities Prediction for Acetylene.
Pr Tr Gam ZVC ZLC Fugr DLE DGE DLC DGC DEVL DEVG 0.021 0.623 1.3484 0.9717 0.0036 6.00E-08 1.462 0.0052 1.3814 0.0052 -5.51 -0.760.032 0.651 1.3162 0.9598 0.0056 -1.20E-07 1.4518 0.008 1.3507 0.0079 -6.96 -0.860.049 0.678 1.2874 0.9455 0.0083 -3.60E-07 1.422 0.0116 1.3186 0.0115 -7.27 -0.240.081 0.717 1.2498 0.9203 0.0135 -1.20E-07 1.3751 0.019 1.27 0.0187 -7.64 -1.610.162 0.78 1.1943 0.8674 0.0267 -1.20E-07 1.2898 0.0377 1.1829 0.0365 -8.29 -3.410.324 0.852 1.1281 0.7786 0.0549 -3.00E-07 1.1735 0.0776 1.0549 0.0743 -10.1 -4.270.406 0.88 1.1078 0.7384 0.0701 -1.20E-07 1.1248 0.0997 0.9999 0.0949 -11.1 -4.860.487 0.903 1.0898 0.6991 0.0865 -6.00E-08 1.0763 0.1241 0.947 0.1171 -12.02 -5.640.568 0.923 1.0719 0.6593 0.1046 1.20E-07 1.0353 0.1508 0.8939 0.1418 -13.65 -5.950.649 0.941 1.0564 0.619 0.1248 0.00E+00 0.9925 0.181 0.8403 0.1694 -15.34 -6.40.811 0.972 1.0285 0.5334 0.1764 -1.30E-03 0.8893 0.2569 0.7191 0.2378 -19.14 -7.43
1 1.002 1 0.3333 0.3333 0.00E+00 0.5529 0.5525 0.4551 0.4551 -17.7 -17.63
Table C3.36: Densities Prediction for Ethylene.
Pr Tr Gam ZVC ZLC Fugr DLE DGE DLC DGC DEVL DEVG 0.02 0.599 1.2951 0.9716 0.0036 -3.00E-07 1.2649 0.0046 1.2333 0.0046 -2.5 -0.62
0.031 0.628 1.2699 0.9599 0.0056 -5.40E-07 1.239 0.0071 1.206 0.007 -2.66 -1.210.054 0.667 1.2373 0.9394 0.0095 -1.20E-07 1.2026 0.0119 1.1664 0.0117 -3.01 -1.60.088 0.706 1.2053 0.9132 0.0151 -3.00E-07 1.1418 0.019 1.1228 0.0186 -1.66 -1.990.136 0.745 1.1754 0.8811 0.023 1.80E-07 1.1213 0.0206 1.0753 0.0281 -4.1 36.58
0.2 0.785 1.147 0.8427 0.0338 -1.80E-07 1.0776 0.0416 1.0232 0.041 -5.05 -1.320.278 0.824 1.1251 0.8006 0.0472 -1.20E-07 1.0278 0.0601 0.9691 0.0572 -5.71 -4.870.391 0.863 1.0922 0.7427 0.0684 -1.20E-07 0.9734 0.0851 0.8979 0.0827 -7.75 -2.810.523 0.902 1.0663 0.6781 0.0958 0.00E+00 0.9112 0.1184 0.8205 0.1159 -9.95 -2.10.684 0.942 1.041 0.5981 0.1359 2.40E-07 0.8305 0.1681 0.7255 0.1649 -12.65 -1.94
1 1 1 0.3333 0.3333 0.00E+00 0.5092 0.5092 0.4071 0.4071 -20.05 -20.05
241

Table C3.37: Densities Prediction for Oxygen.
Pr Tr Gam ZVC ZLC Fugr DLE DGE DLC DGC DEVL DEVG 0.001 0.452 1.3565 0.9968 0.0003 1.10E-03 2.4091 0.0007 2.4381 0.0007 1.2 -0.390.006 0.517 1.3023 0.9885 0.0012 1.80E-07 2.3198 0.0029 2.3381 0.0029 0.79 -0.030.02 0.581 1.254 0.9712 0.0037 -3.00E-07 2.2268 0.0086 2.2389 0.0085 0.54 -0.260.02 0.583 1.2531 0.9707 0.0038 7.20E-07 2.2256 0.0087 2.2369 0.0087 0.51 -0.240.05 0.646 1.2094 0.9418 0.009 4.80E-07 2.1275 0.0204 2.1271 0.0203 -0.02 -0.41
0.107 0.711 1.168 0.8988 0.0186 0.00E+00 2.0189 0.0415 2.0002 0.0413 -0.93 -0.550.201 0.775 1.1289 0.8404 0.0345 2.40E-07 1.8984 0.0766 1.8535 0.0761 -2.36 -0.660.344 0.84 1.0914 0.7642 0.0601 0.00E+00 1.7586 0.1332 1.6792 0.1321 -4.52 -0.810.489 0.905 1.0903 0.6983 0.0868 -2.40E-07 1.5844 0.2274 1.5345 0.1907 -3.15 -16.13
1 1 1 0.3333 0.3333 0.00E+00 0.8322 0.8322 0.7397 0.7397 -11.11 -11.11
Table C3.38: Densities Prediction for Bromine.
Pr Tr Gam ZVC ZLC Fugr DLE DGE DLC DGC DEVL DEVG 0.000406 0.445 1.4939 0.9988 0.0001 1.80E-05 1.2577 0.0001 1.2944 0.0001 2.92 -0.69
0.001 0.479 1.4488 0.997 0.0003 1.10E-03 1.2331 0.0003 1.3094 0.0003 6.19 -0.20.007 0.548 1.3715 0.9881 0.0013 0.00E+00 1.1798 0.0016 1.2577 0.0016 6.6 0.230.013 0.582 1.3379 0.9798 0.0024 0.00E+00 1.154 0.003 1.2298 0.003 6.56 0.430.039 0.65 1.2759 0.9533 0.0068 -1.80E-07 1.1004 0.0082 1.1676 0.0083 6.11 1.390.062 0.685 1.2457 0.9339 0.0106 -6.00E-08 1.0711 0.0126 1.1326 0.0128 5.74 2.140.138 0.753 1.187 0.8809 0.0231 0.00E+00 1.0055 0.0264 1.0526 0.0276 4.68 4.580.195 0.787 1.1588 0.8464 0.0327 1.80E-07 0.971 0.0366 1.0067 0.0389 3.67 6.230.36 0.856 1.1045 0.7587 0.0622 6.00E-08 0.8923 0.0664 0.8984 0.0736 0.68 10.93
0.472 0.89 1.0785 0.7033 0.0846 -2.40E-07 0.845 0.0878 0.8329 0.1002 -1.43 14.170.607 0.924 1.0532 0.6369 0.1156 -6.00E-08 0.7911 0.1159 0.7555 0.1371 -4.5 18.260.768 0.959 1.0287 0.5531 0.1618 0.00E+00 0.7277 0.1559 0.658 0.1925 -9.58 23.47
1 1 1 0.3333 0.3333 0.00E+00 0.4609 0.4607 0.3986 0.3986 -13.52 -13.46
242
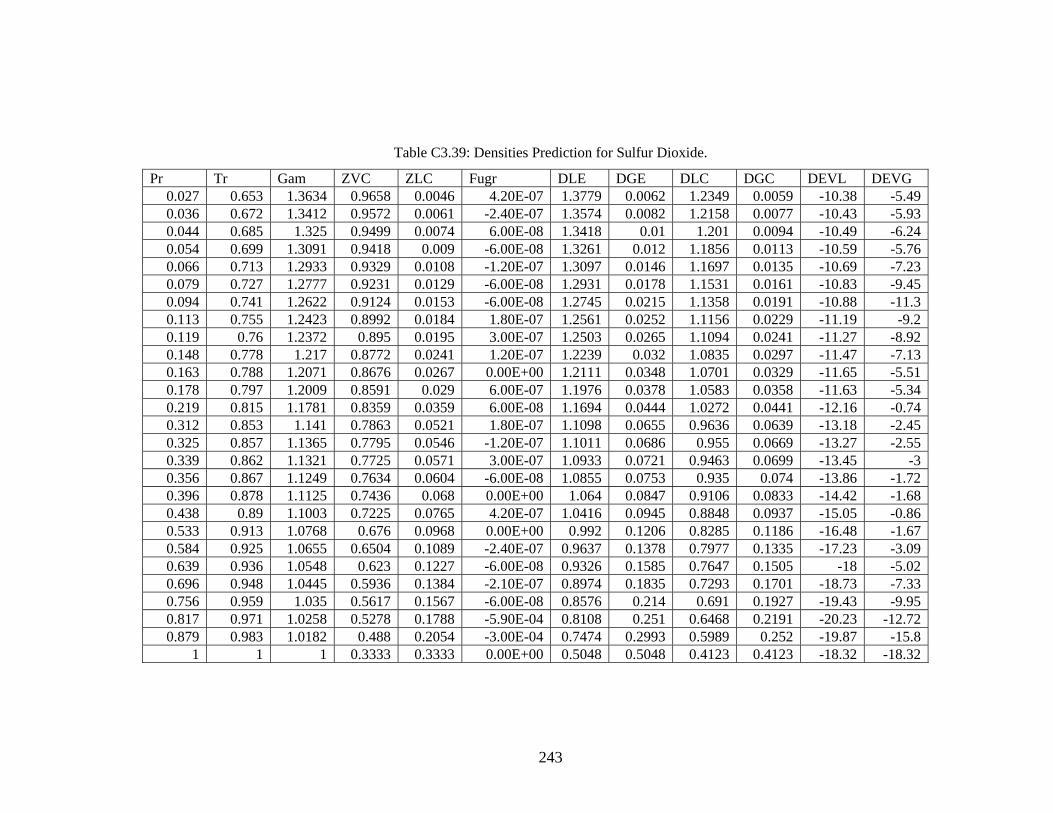
Table C3.39: Densities Prediction for Sulfur Dioxide.
Pr Tr Gam ZVC ZLC Fugr DLE DGE DLC DGC DEVL DEVG 0.027 0.653 1.3634 0.9658 0.0046 4.20E-07 1.3779 0.0062 1.2349 0.0059 -10.38 -5.490.036 0.672 1.3412 0.9572 0.0061 -2.40E-07 1.3574 0.0082 1.2158 0.0077 -10.43 -5.930.044 0.685 1.325 0.9499 0.0074 6.00E-08 1.3418 0.01 1.201 0.0094 -10.49 -6.240.054 0.699 1.3091 0.9418 0.009 -6.00E-08 1.3261 0.012 1.1856 0.0113 -10.59 -5.760.066 0.713 1.2933 0.9329 0.0108 -1.20E-07 1.3097 0.0146 1.1697 0.0135 -10.69 -7.230.079 0.727 1.2777 0.9231 0.0129 -6.00E-08 1.2931 0.0178 1.1531 0.0161 -10.83 -9.450.094 0.741 1.2622 0.9124 0.0153 -6.00E-08 1.2745 0.0215 1.1358 0.0191 -10.88 -11.30.113 0.755 1.2423 0.8992 0.0184 1.80E-07 1.2561 0.0252 1.1156 0.0229 -11.19 -9.20.119 0.76 1.2372 0.895 0.0195 3.00E-07 1.2503 0.0265 1.1094 0.0241 -11.27 -8.920.148 0.778 1.217 0.8772 0.0241 1.20E-07 1.2239 0.032 1.0835 0.0297 -11.47 -7.130.163 0.788 1.2071 0.8676 0.0267 0.00E+00 1.2111 0.0348 1.0701 0.0329 -11.65 -5.510.178 0.797 1.2009 0.8591 0.029 6.00E-07 1.1976 0.0378 1.0583 0.0358 -11.63 -5.340.219 0.815 1.1781 0.8359 0.0359 6.00E-08 1.1694 0.0444 1.0272 0.0441 -12.16 -0.740.312 0.853 1.141 0.7863 0.0521 1.80E-07 1.1098 0.0655 0.9636 0.0639 -13.18 -2.450.325 0.857 1.1365 0.7795 0.0546 -1.20E-07 1.1011 0.0686 0.955 0.0669 -13.27 -2.550.339 0.862 1.1321 0.7725 0.0571 3.00E-07 1.0933 0.0721 0.9463 0.0699 -13.45 -30.356 0.867 1.1249 0.7634 0.0604 -6.00E-08 1.0855 0.0753 0.935 0.074 -13.86 -1.720.396 0.878 1.1125 0.7436 0.068 0.00E+00 1.064 0.0847 0.9106 0.0833 -14.42 -1.680.438 0.89 1.1003 0.7225 0.0765 4.20E-07 1.0416 0.0945 0.8848 0.0937 -15.05 -0.860.533 0.913 1.0768 0.676 0.0968 0.00E+00 0.992 0.1206 0.8285 0.1186 -16.48 -1.670.584 0.925 1.0655 0.6504 0.1089 -2.40E-07 0.9637 0.1378 0.7977 0.1335 -17.23 -3.090.639 0.936 1.0548 0.623 0.1227 -6.00E-08 0.9326 0.1585 0.7647 0.1505 -18 -5.020.696 0.948 1.0445 0.5936 0.1384 -2.10E-07 0.8974 0.1835 0.7293 0.1701 -18.73 -7.330.756 0.959 1.035 0.5617 0.1567 -6.00E-08 0.8576 0.214 0.691 0.1927 -19.43 -9.950.817 0.971 1.0258 0.5278 0.1788 -5.90E-04 0.8108 0.251 0.6468 0.2191 -20.23 -12.720.879 0.983 1.0182 0.488 0.2054 -3.00E-04 0.7474 0.2993 0.5989 0.252 -19.87 -15.8
1 1 1 0.3333 0.3333 0.00E+00 0.5048 0.5048 0.4123 0.4123 -18.32 -18.32
243
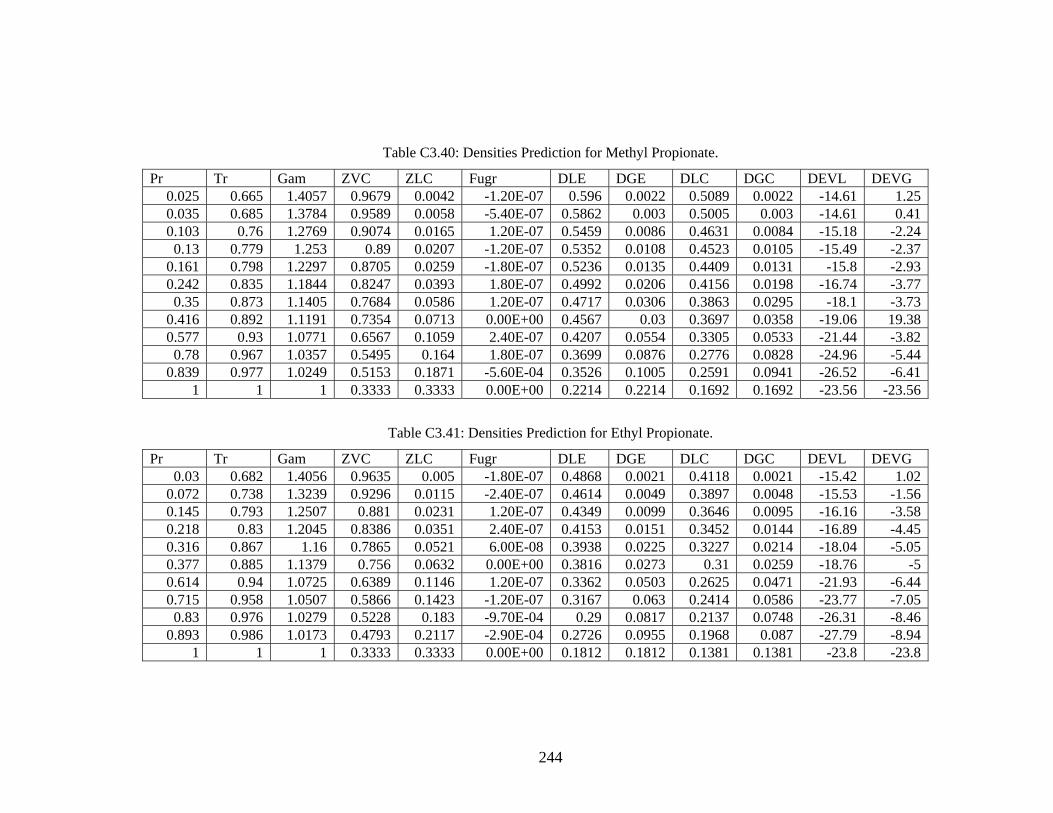
Table C3.40: Densities Prediction for Methyl Propionate.
Pr Tr Gam ZVC ZLC Fugr DLE DGE DLC DGC DEVL DEVG 0.025 0.665 1.4057 0.9679 0.0042 -1.20E-07 0.596 0.0022 0.5089 0.0022 -14.61 1.250.035 0.685 1.3784 0.9589 0.0058 -5.40E-07 0.5862 0.003 0.5005 0.003 -14.61 0.410.103 0.76 1.2769 0.9074 0.0165 1.20E-07 0.5459 0.0086 0.4631 0.0084 -15.18 -2.240.13 0.779 1.253 0.89 0.0207 -1.20E-07 0.5352 0.0108 0.4523 0.0105 -15.49 -2.37
0.161 0.798 1.2297 0.8705 0.0259 -1.80E-07 0.5236 0.0135 0.4409 0.0131 -15.8 -2.930.242 0.835 1.1844 0.8247 0.0393 1.80E-07 0.4992 0.0206 0.4156 0.0198 -16.74 -3.770.35 0.873 1.1405 0.7684 0.0586 1.20E-07 0.4717 0.0306 0.3863 0.0295 -18.1 -3.73
0.416 0.892 1.1191 0.7354 0.0713 0.00E+00 0.4567 0.03 0.3697 0.0358 -19.06 19.380.577 0.93 1.0771 0.6567 0.1059 2.40E-07 0.4207 0.0554 0.3305 0.0533 -21.44 -3.820.78 0.967 1.0357 0.5495 0.164 1.80E-07 0.3699 0.0876 0.2776 0.0828 -24.96 -5.44
0.839 0.977 1.0249 0.5153 0.1871 -5.60E-04 0.3526 0.1005 0.2591 0.0941 -26.52 -6.411 1 1 0.3333 0.3333 0.00E+00 0.2214 0.2214 0.1692 0.1692 -23.56 -23.56
Table C3.41: Densities Prediction for Ethyl Propionate.
Pr Tr Gam ZVC ZLC Fugr DLE DGE DLC DGC DEVL DEVG 0.03 0.682 1.4056 0.9635 0.005 -1.80E-07 0.4868 0.0021 0.4118 0.0021 -15.42 1.02
0.072 0.738 1.3239 0.9296 0.0115 -2.40E-07 0.4614 0.0049 0.3897 0.0048 -15.53 -1.560.145 0.793 1.2507 0.881 0.0231 1.20E-07 0.4349 0.0099 0.3646 0.0095 -16.16 -3.580.218 0.83 1.2045 0.8386 0.0351 2.40E-07 0.4153 0.0151 0.3452 0.0144 -16.89 -4.450.316 0.867 1.16 0.7865 0.0521 6.00E-08 0.3938 0.0225 0.3227 0.0214 -18.04 -5.050.377 0.885 1.1379 0.756 0.0632 0.00E+00 0.3816 0.0273 0.31 0.0259 -18.76 -50.614 0.94 1.0725 0.6389 0.1146 1.20E-07 0.3362 0.0503 0.2625 0.0471 -21.93 -6.440.715 0.958 1.0507 0.5866 0.1423 -1.20E-07 0.3167 0.063 0.2414 0.0586 -23.77 -7.050.83 0.976 1.0279 0.5228 0.183 -9.70E-04 0.29 0.0817 0.2137 0.0748 -26.31 -8.46
0.893 0.986 1.0173 0.4793 0.2117 -2.90E-04 0.2726 0.0955 0.1968 0.087 -27.79 -8.941 1 1 0.3333 0.3333 0.00E+00 0.1812 0.1812 0.1381 0.1381 -23.8 -23.8
244
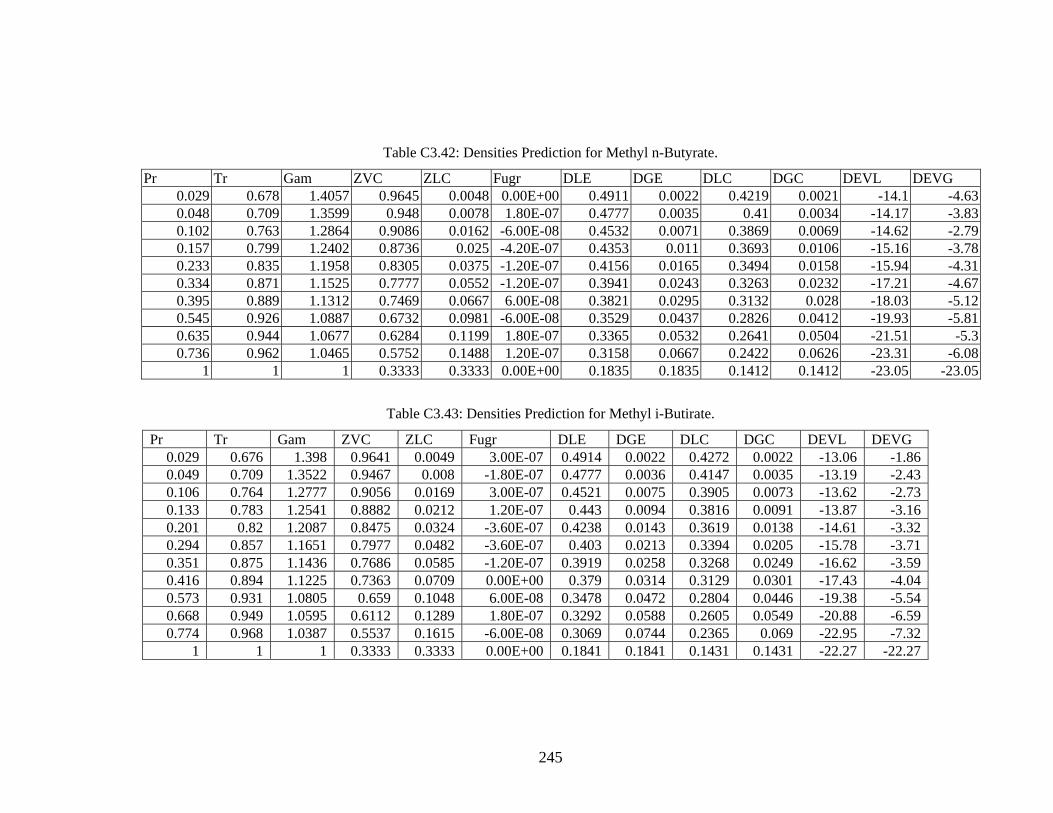
Table C3.42: Densities Prediction for Methyl n-Butyrate.
Pr Tr Gam ZVC ZLC Fugr DLE DGE DLC DGC DEVL DEVG 0.029 0.678 1.4057 0.9645 0.0048 0.00E+00 0.4911 0.0022 0.4219 0.0021 -14.1 -4.630.048 0.709 1.3599 0.948 0.0078 1.80E-07 0.4777 0.0035 0.41 0.0034 -14.17 -3.830.102 0.763 1.2864 0.9086 0.0162 -6.00E-08 0.4532 0.0071 0.3869 0.0069 -14.62 -2.790.157 0.799 1.2402 0.8736 0.025 -4.20E-07 0.4353 0.011 0.3693 0.0106 -15.16 -3.780.233 0.835 1.1958 0.8305 0.0375 -1.20E-07 0.4156 0.0165 0.3494 0.0158 -15.94 -4.310.334 0.871 1.1525 0.7777 0.0552 -1.20E-07 0.3941 0.0243 0.3263 0.0232 -17.21 -4.670.395 0.889 1.1312 0.7469 0.0667 6.00E-08 0.3821 0.0295 0.3132 0.028 -18.03 -5.120.545 0.926 1.0887 0.6732 0.0981 -6.00E-08 0.3529 0.0437 0.2826 0.0412 -19.93 -5.810.635 0.944 1.0677 0.6284 0.1199 1.80E-07 0.3365 0.0532 0.2641 0.0504 -21.51 -5.30.736 0.962 1.0465 0.5752 0.1488 1.20E-07 0.3158 0.0667 0.2422 0.0626 -23.31 -6.08
1 1 1 0.3333 0.3333 0.00E+00 0.1835 0.1835 0.1412 0.1412 -23.05 -23.05
Table C3.43: Densities Prediction for Methyl i-Butirate.
Pr Tr Gam ZVC ZLC Fugr DLE DGE DLC DGC DEVL DEVG 0.029 0.676 1.398 0.9641 0.0049 3.00E-07 0.4914 0.0022 0.4272 0.0022 -13.06 -1.860.049 0.709 1.3522 0.9467 0.008 -1.80E-07 0.4777 0.0036 0.4147 0.0035 -13.19 -2.430.106 0.764 1.2777 0.9056 0.0169 3.00E-07 0.4521 0.0075 0.3905 0.0073 -13.62 -2.730.133 0.783 1.2541 0.8882 0.0212 1.20E-07 0.443 0.0094 0.3816 0.0091 -13.87 -3.160.201 0.82 1.2087 0.8475 0.0324 -3.60E-07 0.4238 0.0143 0.3619 0.0138 -14.61 -3.320.294 0.857 1.1651 0.7977 0.0482 -3.60E-07 0.403 0.0213 0.3394 0.0205 -15.78 -3.710.351 0.875 1.1436 0.7686 0.0585 -1.20E-07 0.3919 0.0258 0.3268 0.0249 -16.62 -3.590.416 0.894 1.1225 0.7363 0.0709 0.00E+00 0.379 0.0314 0.3129 0.0301 -17.43 -4.040.573 0.931 1.0805 0.659 0.1048 6.00E-08 0.3478 0.0472 0.2804 0.0446 -19.38 -5.540.668 0.949 1.0595 0.6112 0.1289 1.80E-07 0.3292 0.0588 0.2605 0.0549 -20.88 -6.590.774 0.968 1.0387 0.5537 0.1615 -6.00E-08 0.3069 0.0744 0.2365 0.069 -22.95 -7.32
1 1 1 0.3333 0.3333 0.00E+00 0.1841 0.1841 0.1431 0.1431 -22.27 -22.27
245

Table C3.44: Densities Prediction for Methyl Acetate.
Pr Tr Gam ZVC ZLC Fugr DLE DGE DLC DGC DEVL DEVG 0.022 0.652 1.4091 0.9715 0.0036 4.20E-07 0.745 0.0024 0.6317 0.0024 -15.21 -1.230.033 0.677 1.3736 0.9604 0.0055 -1.20E-07 0.73 0.0035 0.6184 0.0035 -15.28 1.350.045 0.697 1.3469 0.9499 0.0074 3.00E-07 0.7179 0.0047 0.6074 0.0047 -15.39 0.930.13 0.776 1.2471 0.8896 0.0208 -1.80E-07 0.6652 0.0132 0.5571 0.013 -16.26 -1.17
0.162 0.795 1.2236 0.8694 0.0262 1.80E-07 0.6502 0.0166 0.5425 0.0163 -16.57 -1.630.247 0.835 1.1781 0.8217 0.0403 6.00E-08 0.6185 0.0255 0.5102 0.025 -17.51 -1.930.431 0.894 1.1124 0.7279 0.0743 6.00E-08 0.5622 0.0479 0.4508 0.046 -19.81 -3.930.601 0.934 1.07 0.644 0.112 -1.20E-07 0.5141 0.073 0.3995 0.0695 -22.28 -4.780.703 0.953 1.0493 0.5918 0.1394 1.80E-07 0.4838 0.0919 0.3678 0.0866 -23.98 -5.720.819 0.973 1.0273 0.5285 0.1794 -1.10E-03 0.445 0.1193 0.3262 0.1107 -26.7 -7.21
1 1 1 0.3333 0.3333 0.00E+00 0.2741 0.2741 0.2085 0.2085 -23.92 -23.92
Table C3.45: Densities Prediction for Ethyl Acetate
Pr Tr Gam ZVC ZLC Fugr DLE DGE DLC DGC DEVL DEVG 0.026 0.67 1.4074 0.967 0.0044 1.20E-07 0.5869 0.0023 0.4949 0.0022 -15.67 -2.360.04 0.694 1.3725 0.9551 0.0065 -4.20E-07 0.5748 0.0033 0.4844 0.0033 -15.72 -0.710.07 0.732 1.3195 0.931 0.0112 -6.00E-08 0.5549 0.0057 0.4665 0.0056 -15.94 -1.60.09 0.751 1.2938 0.9163 0.0144 -6.00E-08 0.5444 0.0073 0.4567 0.0072 -16.11 -1.52
0.144 0.79 1.2445 0.8809 0.0231 -6.00E-08 0.5228 0.0117 0.4354 0.0114 -16.72 -2.420.221 0.828 1.1973 0.8366 0.0357 6.00E-08 0.4983 0.0183 0.4111 0.0175 -17.49 -4.210.325 0.866 1.1516 0.7817 0.0538 1.80E-07 0.4714 0.0275 0.383 0.0264 -18.75 -4.170.388 0.885 1.1295 0.7496 0.0657 -6.00E-08 0.4564 0.0337 0.3671 0.0322 -19.57 -4.540.545 0.923 1.0856 0.6726 0.0983 -6.00E-08 0.4212 0.0505 0.3297 0.0482 -21.73 -4.550.639 0.942 1.064 0.6256 0.1214 -2.40E-07 0.4002 0.0631 0.307 0.0596 -23.28 -5.610.745 0.962 1.0427 0.5696 0.152 -3.00E-08 0.3742 0.0801 0.2801 0.0748 -25.14 -6.67
1 1 1 0.3333 0.3333 0.00E+00 0.218 0.218 0.1649 0.1649 -24.36 -24.36
246

Table C3.46: Densities Prediction for Propyl Acetate
Pr Tr Gam ZVC ZLC Fugr DLE DGE DLC DGC DEVL DEVG 0.03 0.682 1.406 0.9635 0.005 1.20E-07 0.4878 0.0021 0.4077 0.0021 -16.41 0.35
0.039 0.698 1.3836 0.9557 0.0063 -6.00E-08 0.4786 0.0027 0.4022 0.0027 -15.96 -1.230.052 0.716 1.3567 0.9451 0.0083 -1.80E-07 0.4708 0.0035 0.3952 0.0035 -16.05 -0.40.068 0.734 1.3304 0.9328 0.0108 6.00E-08 0.4628 0.0045 0.3879 0.0045 -16.19 -0.060.087 0.752 1.3053 0.919 0.0138 -1.80E-07 0.4545 0.0058 0.3802 0.0057 -16.35 -1.510.11 0.77 1.2806 0.9033 0.0174 -3.00E-07 0.446 0.0073 0.372 0.0072 -16.58 -1.55
0.137 0.789 1.2563 0.8857 0.0218 -3.00E-07 0.437 0.0091 0.3634 0.009 -16.85 -1.550.17 0.807 1.2329 0.8662 0.027 -1.80E-07 0.4277 0.0113 0.3542 0.0111 -17.18 -2.11
0.208 0.825 1.2096 0.8444 0.0333 -1.80E-07 0.4178 0.0139 0.3444 0.0136 -17.57 -2.270.251 0.843 1.1871 0.8204 0.0407 6.00E-08 0.4075 0.017 0.334 0.0166 -18.05 -2.520.302 0.861 1.1647 0.7937 0.0496 -4.20E-07 0.3966 0.0207 0.3226 0.0202 -18.65 -2.650.36 0.88 1.1428 0.7641 0.0602 -1.80E-07 0.3851 0.0252 0.3104 0.0244 -19.4 -3.01
0.427 0.898 1.1209 0.7311 0.073 -6.00E-08 0.3721 0.0307 0.2969 0.0297 -20.21 -3.420.503 0.916 1.0992 0.6939 0.0887 -6.00E-08 0.3579 0.0376 0.2819 0.036 -21.23 -4.140.588 0.934 1.0776 0.6516 0.1083 1.80E-07 0.3414 0.0463 0.265 0.0441 -22.38 -4.860.685 0.952 1.0562 0.6024 0.1336 1.80E-07 0.3233 0.0574 0.2454 0.0544 -24.1 -5.20.794 0.971 1.0336 0.5443 0.1694 -1.40E-03 0.3 0.0737 0.2201 0.0685 -26.62 -7.04
1 1 1 0.3333 0.3333 0.00E+00 0.1807 0.1807 0.1367 0.1367 -24.33 -24.33
247

Table C3.47: Densities Prediction for Methyl Chloride.
Pr Tr Gam ZVC ZLC Fugr DLE DGE DLC DGC DEVL DEVG 0.015 0.599 1.3487 0.9773 0.0028 6.00E-08 1.2328 0.0032 1.1082 0.0031 -10.11 -2.40.038 0.656 1.2944 0.9545 0.0066 0.00E+00 1.1808 0.0074 1.0605 0.0073 -10.19 -1.440.053 0.68 1.2724 0.9416 0.009 0.00E+00 1.1586 0.0101 1.0387 0.01 -10.35 -1.430.096 0.728 1.2294 0.9091 0.0161 -4.20E-07 1.1104 0.0179 0.9908 0.0175 -10.77 -2.080.126 0.752 1.208 0.8891 0.021 -1.80E-07 1.0856 0.0234 0.9645 0.0228 -11.16 -2.740.206 0.8 1.1671 0.8412 0.0343 1.80E-07 1.0288 0.0396 0.9063 0.0369 -11.9 -6.780.259 0.824 1.1456 0.812 0.0434 3.00E-07 1.0003 0.0482 0.873 0.0467 -12.73 -3.150.393 0.872 1.1054 0.7437 0.068 0.00E+00 0.9348 0.0742 0.7981 0.073 -14.63 -1.680.476 0.897 1.0855 0.7027 0.0849 -1.20E-07 0.8965 0.0927 0.7543 0.0911 -15.86 -1.730.683 0.945 1.0459 0.6002 0.1348 -3.60E-07 0.8 0.1484 0.6461 0.1451 -19.23 -2.240.807 0.969 1.0267 0.5319 0.1749 6.00E-08 0.732 0.1966 0.574 0.1887 -21.58 -4
1 1 1 0.3333 0.3333 0.00E+00 0.4365 0.4365 0.3613 0.3613 -17.22 -17.22
Table C3.48: Densities Prediction for Ethyl Chloride.
Pr Tr Gam ZVC ZLC Fugr DLE DGE DLC DGC DEVL DEVG 0.019 0.62 1.3526 0.9729 0.0034 1.20E-07 0.8767 0.0028 0.7771 0.0027 -11.36 -2.150.049 0.68 1.2885 0.9449 0.0084 -1.20E-07 0.8354 0.0067 0.7392 0.0066 -11.52 -2.140.087 0.724 1.2449 0.9159 0.0145 6.00E-08 0.8037 0.0116 0.7082 0.0112 -11.88 -3.290.144 0.767 1.2032 0.8786 0.0237 -1.80E-07 0.7701 0.0184 0.6735 0.0182 -12.54 -1.260.18 0.789 1.1828 0.8564 0.0298 -2.40E-07 0.7519 0.0228 0.6544 0.0228 -12.97 -0.12
0.275 0.832 1.1425 0.8039 0.0461 -1.20E-07 0.7132 0.0339 0.6117 0.0351 -14.23 3.450.401 0.876 1.1047 0.7399 0.0695 1.20E-07 0.6687 0.0503 0.5621 0.0528 -15.93 4.960.479 0.898 1.0857 0.7018 0.0853 -3.60E-07 0.6435 0.0619 0.5334 0.0648 -17.12 4.70.665 0.941 1.0492 0.6096 0.1297 1.50E-07 0.5825 0.0958 0.4645 0.0988 -20.26 3.150.777 0.963 1.0306 0.5492 0.1642 0.00E+00 0.5409 0.1239 0.4194 0.1253 -22.47 1.17
1 1 1 0.3333 0.3333 0.00E+00 0.3203 0.3203 0.2558 0.2558 -20.13 -20.13
248
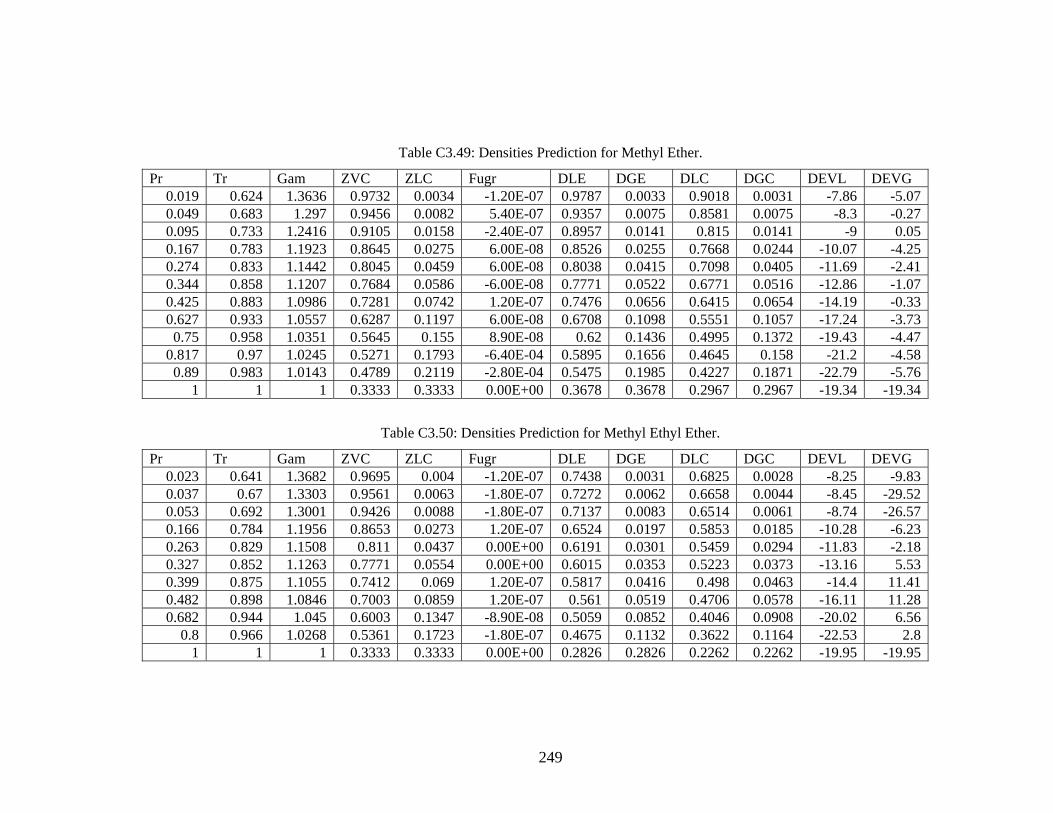
Table C3.49: Densities Prediction for Methyl Ether.
Pr Tr Gam ZVC ZLC Fugr DLE DGE DLC DGC DEVL DEVG 0.019 0.624 1.3636 0.9732 0.0034 -1.20E-07 0.9787 0.0033 0.9018 0.0031 -7.86 -5.070.049 0.683 1.297 0.9456 0.0082 5.40E-07 0.9357 0.0075 0.8581 0.0075 -8.3 -0.270.095 0.733 1.2416 0.9105 0.0158 -2.40E-07 0.8957 0.0141 0.815 0.0141 -9 0.050.167 0.783 1.1923 0.8645 0.0275 6.00E-08 0.8526 0.0255 0.7668 0.0244 -10.07 -4.250.274 0.833 1.1442 0.8045 0.0459 6.00E-08 0.8038 0.0415 0.7098 0.0405 -11.69 -2.410.344 0.858 1.1207 0.7684 0.0586 -6.00E-08 0.7771 0.0522 0.6771 0.0516 -12.86 -1.070.425 0.883 1.0986 0.7281 0.0742 1.20E-07 0.7476 0.0656 0.6415 0.0654 -14.19 -0.330.627 0.933 1.0557 0.6287 0.1197 6.00E-08 0.6708 0.1098 0.5551 0.1057 -17.24 -3.730.75 0.958 1.0351 0.5645 0.155 8.90E-08 0.62 0.1436 0.4995 0.1372 -19.43 -4.47
0.817 0.97 1.0245 0.5271 0.1793 -6.40E-04 0.5895 0.1656 0.4645 0.158 -21.2 -4.580.89 0.983 1.0143 0.4789 0.2119 -2.80E-04 0.5475 0.1985 0.4227 0.1871 -22.79 -5.76
1 1 1 0.3333 0.3333 0.00E+00 0.3678 0.3678 0.2967 0.2967 -19.34 -19.34
Table C3.50: Densities Prediction for Methyl Ethyl Ether.
Pr Tr Gam ZVC ZLC Fugr DLE DGE DLC DGC DEVL DEVG 0.023 0.641 1.3682 0.9695 0.004 -1.20E-07 0.7438 0.0031 0.6825 0.0028 -8.25 -9.830.037 0.67 1.3303 0.9561 0.0063 -1.80E-07 0.7272 0.0062 0.6658 0.0044 -8.45 -29.520.053 0.692 1.3001 0.9426 0.0088 -1.80E-07 0.7137 0.0083 0.6514 0.0061 -8.74 -26.570.166 0.784 1.1956 0.8653 0.0273 1.20E-07 0.6524 0.0197 0.5853 0.0185 -10.28 -6.230.263 0.829 1.1508 0.811 0.0437 0.00E+00 0.6191 0.0301 0.5459 0.0294 -11.83 -2.180.327 0.852 1.1263 0.7771 0.0554 0.00E+00 0.6015 0.0353 0.5223 0.0373 -13.16 5.530.399 0.875 1.1055 0.7412 0.069 1.20E-07 0.5817 0.0416 0.498 0.0463 -14.4 11.410.482 0.898 1.0846 0.7003 0.0859 1.20E-07 0.561 0.0519 0.4706 0.0578 -16.11 11.280.682 0.944 1.045 0.6003 0.1347 -8.90E-08 0.5059 0.0852 0.4046 0.0908 -20.02 6.56
0.8 0.966 1.0268 0.5361 0.1723 -1.80E-07 0.4675 0.1132 0.3622 0.1164 -22.53 2.81 1 1 0.3333 0.3333 0.00E+00 0.2826 0.2826 0.2262 0.2262 -19.95 -19.95
249

PERMISSION TO COPY
In presenting this thesis in partial fulfillment of the requirements for a master’s
degree at Texas Tech University or Texas Tech University Health Sciences Center, I
agree that the Library and my major department shall make it freely available for
research purposes. Permission to copy this thesis for scholarly purposes may be granted
by the Director of the Library or my major professor. It is understood that any copying
or publication of this thesis for financial gain shall not be allowed without my further
written permission and that any user may be liable for copyright infringement.
Agree (Permission is granted.)
Andreas Soefajin 4-6-2005 Student Signature Date Disagree (Permission is not granted.) _______________________________________________ _________________ Student Signature Date
Related Documents


![1. INTRODUCTION - Materials Technology pressure [9]. ... parameters fitted to vapor pressures and liquid densities along with a ... a maximum concentration of methane in the product](https://static.cupdf.com/doc/110x72/5b1d5bfa7f8b9a64508b5aeb/1-introduction-materials-pressure-9-parameters-fitted-to-vapor-pressures.jpg)