Predicting Visual Importance Across Graphic Design Types Camilo Fosco 1 , Vincent Casser 1 , Amish Kumar Bedi 2 , Peter O’Donovan 2 , Aaron Hertzmann 3 , Zoya Bylinskii 3 , 1 MIT 2 Adobe Inc. 3 Adobe Research {camilolu, vcasser}@mit.edu {ambedi, podonova, hertzman, bylinski}@adobe.com ABSTRACT This paper introduces a Unified Model of Saliency and Impor- tance (UMSI), which learns to predict visual importance in input graphic designs, and saliency in natural images, along with a new dataset and applications. Previous methods for pre- dicting saliency or visual importance are trained individually on specialized datasets, making them limited in application and leading to poor generalization on novel image classes, while requiring a user to know which model to apply to which input. UMSI is a deep learning-based model simultaneously trained on images from different design classes, including posters, infographics, mobile UIs, as well as natural images, and includes an automatic classification module to classify the input. This allows the model to work more effectively without requiring a user to label the input. We also introduce Imp1k, a new dataset of designs annotated with importance information. We demonstrate two new design interfaces that use importance prediction, including a tool for adjusting the relative impor- tance of design elements, and a tool for reflowing designs to new aspect ratios while preserving visual importance. 1 ACM Classification Keywords H.5.1 Information Interfaces and Presentation: Multimedia Author Keywords Graphic Designs; Importance; Saliency; Human Attention; Automated Design; User Interface for Design; Deep Learning INTRODUCTION Where a viewer looks on a poster or advertisement can de- termine whether the design is effective in communicating its message to the viewer, or if the viewer misses important concepts or details. Indeed, numerous companies offer eye tracking analyses of graphic designs, providing insight into the effectiveness of the design, but these typically depend on a separate eye tracking study for each design. Establishing vi- sual hierarchy and importance is a common task for designers, ideally guiding the reader through the design from elements of 1 The model, code, and importance dataset are available at: http://predimportance.mit.edu. Note: This is the author’s preprint copy. This is not the official ACM pub- lished version, which will appear at UIST 2020. Figure 1. Our Unified Model of Saliency and Importance, UMSI, is able to predict human attention on both natural images and graphic de- signs. Its performance is comparable to state-of-the-art models specifi- cally built for natural image saliency [13] and it outperforms the existing visual importance models [6, 28]. higher to lesser importance. Methods that predict visual impor- tance accurately in real-time could thus be used in a number of UI applications, including providing real-time feedback to designers, as well as automatic reflow. Prior approaches have tackled various aspects of attention modeling on graphic designs, including saliency on visual- izations [26] and mobile UIs [15], visual flow on comics [9] and webpages [29], and importance prediction on visualiza- tions [6] and posters [6, 28]. Unlike saliency or visual flow which model eye fixations and trajectories, respectively, im- portance identifies design elements of interest/relevance to the viewer. This makes it more practical as a building block for downstream design applications. Moreover, the narrow focus of prior work on particular design types, datasets, and tasks makes the models difficult to adapt to other problems and generalize to broader sets of design classes. Graphic de- signs in domains such as advertising, art and education show significant differences in terms of content, layout and appear- ance, which means that a designer would need to find a model trained specifically for their class of design. 1 arXiv:2008.02912v1 [cs.CV] 7 Aug 2020

Welcome message from author
This document is posted to help you gain knowledge. Please leave a comment to let me know what you think about it! Share it to your friends and learn new things together.
Transcript
Predicting Visual Importance Across Graphic Design Types
Camilo Fosco1, Vincent Casser1, Amish Kumar Bedi2,Peter O’Donovan2, Aaron Hertzmann3, Zoya Bylinskii3,
1MIT 2Adobe Inc. 3Adobe Research{camilolu, vcasser}@mit.edu {ambedi, podonova, hertzman, bylinski}@adobe.com
ABSTRACTThis paper introduces a Unified Model of Saliency and Impor-tance (UMSI), which learns to predict visual importance ininput graphic designs, and saliency in natural images, alongwith a new dataset and applications. Previous methods for pre-dicting saliency or visual importance are trained individuallyon specialized datasets, making them limited in applicationand leading to poor generalization on novel image classes,while requiring a user to know which model to apply to whichinput. UMSI is a deep learning-based model simultaneouslytrained on images from different design classes, includingposters, infographics, mobile UIs, as well as natural images,and includes an automatic classification module to classify theinput. This allows the model to work more effectively withoutrequiring a user to label the input. We also introduce Imp1k, anew dataset of designs annotated with importance information.We demonstrate two new design interfaces that use importanceprediction, including a tool for adjusting the relative impor-tance of design elements, and a tool for reflowing designs tonew aspect ratios while preserving visual importance.1
ACM Classification KeywordsH.5.1 Information Interfaces and Presentation: Multimedia
Author KeywordsGraphic Designs; Importance; Saliency; Human Attention;Automated Design; User Interface for Design; Deep Learning
INTRODUCTIONWhere a viewer looks on a poster or advertisement can de-termine whether the design is effective in communicatingits message to the viewer, or if the viewer misses importantconcepts or details. Indeed, numerous companies offer eyetracking analyses of graphic designs, providing insight intothe effectiveness of the design, but these typically depend on aseparate eye tracking study for each design. Establishing vi-sual hierarchy and importance is a common task for designers,ideally guiding the reader through the design from elements of1The model, code, and importance dataset are available at:http://predimportance.mit.edu.
Note: This is the author’s preprint copy. This is not the official ACM pub-lished version, which will appear at UIST 2020.
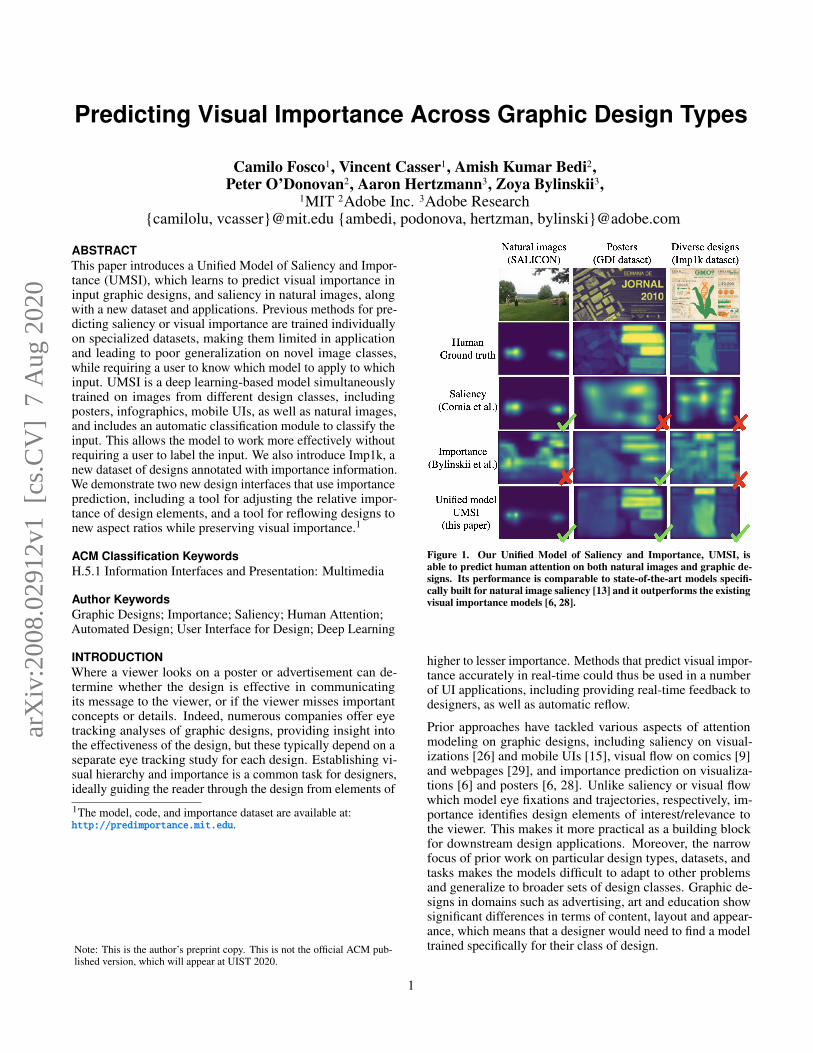
Figure 1. Our Unified Model of Saliency and Importance, UMSI, isable to predict human attention on both natural images and graphic de-signs. Its performance is comparable to state-of-the-art models specifi-cally built for natural image saliency [13] and it outperforms the existingvisual importance models [6, 28].
higher to lesser importance. Methods that predict visual impor-tance accurately in real-time could thus be used in a numberof UI applications, including providing real-time feedback todesigners, as well as automatic reflow.
Prior approaches have tackled various aspects of attentionmodeling on graphic designs, including saliency on visual-izations [26] and mobile UIs [15], visual flow on comics [9]and webpages [29], and importance prediction on visualiza-tions [6] and posters [6, 28]. Unlike saliency or visual flowwhich model eye fixations and trajectories, respectively, im-portance identifies design elements of interest/relevance tothe viewer. This makes it more practical as a building blockfor downstream design applications. Moreover, the narrowfocus of prior work on particular design types, datasets, andtasks makes the models difficult to adapt to other problemsand generalize to broader sets of design classes. Graphic de-signs in domains such as advertising, art and education showsignificant differences in terms of content, layout and appear-ance, which means that a designer would need to find a modeltrained specifically for their class of design.
1
arX
iv:2
008.
0291
2v1
[cs
.CV
] 7
Aug
202
0
This paper proposes a unified model for predicting importancein graphic designs from multiple design classes, as well as forpredicting saliency in natural images. Our model, the UnifiedModel of Saliency and Importance (UMSI), is a deep neu-ral network that automatically classifies the input design intoone of five design classes before predicting the importance orsaliency of the input image. Moreover, we introduce a newdataset, Imp1k, that contains 1000 annotated designs, cover-ing webpages, movie posters, mobile UIs, infographics andadvertisements. We show that our model either outperforms orremains competitive with state-of-the-art approaches on previ-ous datasets of graphic designs and natural images (Figure 1).We also show that current state-of-the-art models struggle onImp1k, highlighting a lack of generalization to diverse designclasses. Our model successfully generalizes to the attentionpatterns that are unique to these different design classes.
This approach offers several benefits. First, our model can takemany different kinds of designs and images as input, withouthaving to train a separate model for each. A user does notneed to explicitly label or classify the input design. Second,the model leverages training data more effectively by usinga shared representation, learning what is both common andunique across datasets. Indeed, we show that our unified modelgives superior performance on individual tasks as comparedto models trained on individual tasks. Third, design repre-sents a spectrum, and our model can generalize accordingly.Since our model trains on both designs and natural images,it works well on designs that include photographs, whetherthe photograph dominates the design or represents a smallportion of it. While our method is already suitable for real ap-plications, our training procedure can be generalized to moredesign categories in the future, simply by adding more classes.
Furthermore, we introduce two new interactive applicationsenabled by this model. In our first application, a designer canspecify the target importance of an element in an existing de-sign, and the algorithm updates the layout to achieve this goal.Second, we show a reflow application that converts a vectordesign into a new size and aspect ratio while maintaining therelative importance of design elements. Reflow is a criticalproblem for modern designers, who are typically tasked toretarget designs to a wide variety of display sizes and formfactors. We show that using UMSI in these applications givessubstantially better results than with existing baselines.
To summarize, our contributions include: UMSI, a unifiedmodel for predicting importance in different kinds of designs,and saliency in natural images; the Imp1k dataset, containingimportance annotations for 1000 designs from 5 classes; a toolfor revising a design to match target importance values; and areflow application that uses UMSI to preserve importance.
RELATED WORKMany previous studies analyze design perception, understand-ing, and memorability, e.g., [1, 2, 3, 17], including the useof eye tracking as an analysis tool. However, obtaining reli-able eye movement data is typically far too costly and time-consuming to be used in most design scenarios.
Most prior work on automatic saliency prediction has focusedon eye movements in natural images. Lately, these effortshave progressed significantly with the help of deep learning [4,12, 13, 19, 22, 23]. When applied to graphic designs, modelstrained on natural images perform poorly [6, 16]. Specializedsaliency models have been designed for visualizations [26],mobile UIs [9] and webpages [29, 31], but with limited gener-alization ability outside each design class.
In contrast to saliency, O’Donovan et al. [28] introducedthe first approach using importance: they collected the GDIdataset, a crowdsourced dataset where people were asked tomanually label what they thought was important in a design.With this data, they trained a model for importance predictionon graphic designs. Their method, however, requires annota-tion of design element position and alignment to generalizeto new designs. Bylinskii et al. [6] followed up with the firstend-to-end deep learning approach for importance prediction.Their model predicts importance from the original image usinga Fully Convolutional Network [25], with pre-trained weightsfrom semantic segmentation, fine-tuned on the GDI dataset.As in prior work [6, 28], we are using a viewer-identifiednotion of importance rather than a designer-specified notion.We are not explicitly taking into account aesthetics or designheuristics, but are focused on modeling the behavior of theviewer of the content.
Importance and saliency have previously been used for taskssuch as retargeting [6, 28] and thumbnailing [20, 30]. For thedesign process, however, recent work focused on visualizingpredicted importance as passive feedback for the designer [6].In this work, we introduce applications of our model withininteractive interfaces where the user can more actively engagewith the importance model during the design process. Fur-thermore, our retargeting application works on vector designs,and is thus more practical for design applications, comparedto image-based retargeting [6], and without requiring manualannotations as in prior work [28].
IMP1K DATASETThe previously available graphic design dataset with impor-tance annotations is limited to posters and advertisements [28].However, the structure of other types of designs like web-pages and mobile UIs is quite different, and a model trainedto predict importance on posters alone will not generalize. Atthe same time, there is great interest in predicting attentionpatterns on webpages and mobile UIs due to their widespreaduse and commercial impacts. Towards expanding the general-izability of an importance model, we collected a new graphicdesign dataset covering five diverse design classes and usecases: infographics representing design for knowledge trans-fer, webpages and mobile UIs representing design for utility,and advertisements and movie posters representing design forpromotion. While prior work addresses importance for data vi-sualizations [6], we omit them because their highly structuredlayouts (axes, data marks, etc.) make them less amenable tothe design applications that are the focus of this work. The de-tails of the data collection and annotation are provided below,along with an analysis of the importance patterns common to,and differing between, the design classes.
2
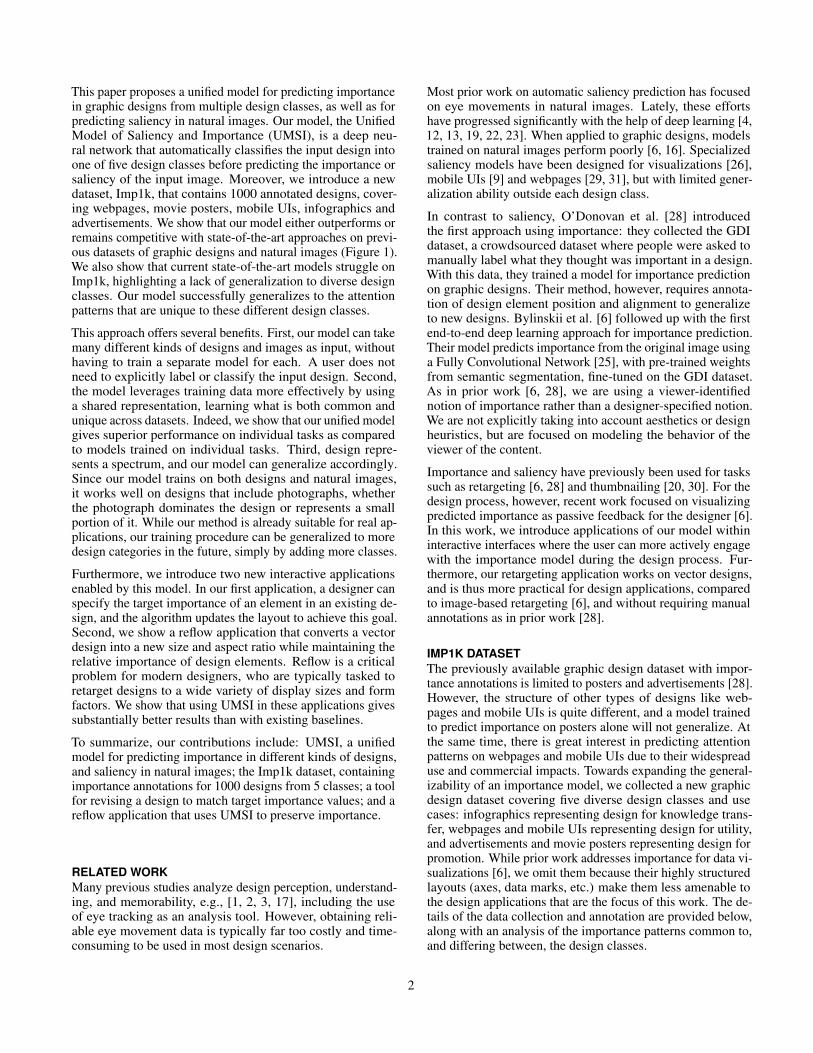
Dataset collectionWe collected designs from existing research datasets so thatthe stimuli and annotations may be shared broadly with theresearch community. Infographics were sourced from Visu-ally29k [33], webpages from ClueWeb09 [7], movie postersfrom Chu et al.’s movie poster dataset [11], mobile UIs fromRICO [14], and advertisements from the Pitt Image Ads [18].To compose our multi-class importance dataset, Imp1k (Fig. 2),we randomly sampled 200 designs per design class, after fil-tering out designs that had too few elements, skewed aspectratios, or that were outliers among their design class.
For annotating the importance in each of the 1000 designsfrom our Imp1k dataset, we used the ImportAnnots UI [27].Based on the original implementation of O’Donovan et al. [28],this UI provides participants with three options for annota-tion: (i) "regular stroke" involves painting with paintbrush-like strokes with the mouse button held down, (ii) "polygonstroke" allows drawing polygons through connecting vertices,and (iii) "fill stroke" fills an area delimited by the initial mouseclick position and the most recent mouse position, allowingsmooth tracing over continuous contours of a shape. Usingany of these tools, a participant can produce a binary mask toannotate the most important design elements.
We deployed the ImportAnnots UI on Amazon’s MechanicalTurk (MTurk) to collect importance data on all 1000 designs,splitting them into 10 designs of the same class per task (HIT),and requesting 30 participants per HIT. Participants couldcomplete several HITs. Data from 249 individual participantswas collected. To ensure good data quality, we additionallyincluded 3 sentinels per HIT. These are simple, artificial de-signs where the importance annotation is expected to coverthe only visible element in the design. We designed 40 suchsentinels, which we manually annotated with ground truthimportance. For the task to proceed, we automatically ver-ified that participant annotations matched the ground truthannotations (with a computed intersection over union valueover 0.6) for at least 2/3 of the sentinels. Participants werepaid $1.00 for completing the task. For each of the 1000 de-signs collected, we computed an associated importance mapby averaging the 25-30 individual binary annotations. Whileeach participant’s importance annotation is subjective, priorwork has reported that the average over participants producesheatmaps that approximate attention maps [6, 21, 28].
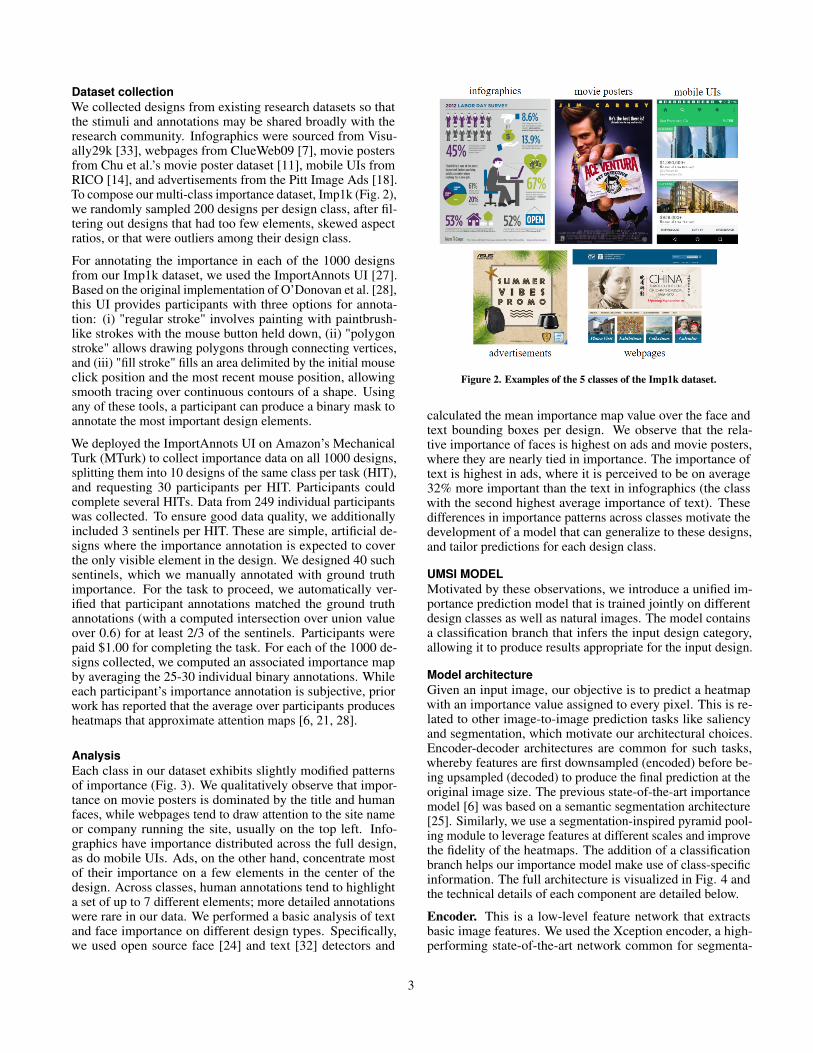
AnalysisEach class in our dataset exhibits slightly modified patternsof importance (Fig. 3). We qualitatively observe that impor-tance on movie posters is dominated by the title and humanfaces, while webpages tend to draw attention to the site nameor company running the site, usually on the top left. Info-graphics have importance distributed across the full design,as do mobile UIs. Ads, on the other hand, concentrate mostof their importance on a few elements in the center of thedesign. Across classes, human annotations tend to highlighta set of up to 7 different elements; more detailed annotationswere rare in our data. We performed a basic analysis of textand face importance on different design types. Specifically,we used open source face [24] and text [32] detectors and
Figure 2. Examples of the 5 classes of the Imp1k dataset.
calculated the mean importance map value over the face andtext bounding boxes per design. We observe that the rela-tive importance of faces is highest on ads and movie posters,where they are nearly tied in importance. The importance oftext is highest in ads, where it is perceived to be on average32% more important than the text in infographics (the classwith the second highest average importance of text). Thesedifferences in importance patterns across classes motivate thedevelopment of a model that can generalize to these designs,and tailor predictions for each design class.
UMSI MODELMotivated by these observations, we introduce a unified im-portance prediction model that is trained jointly on differentdesign classes as well as natural images. The model containsa classification branch that infers the input design category,allowing it to produce results appropriate for the input design.
Model architectureGiven an input image, our objective is to predict a heatmapwith an importance value assigned to every pixel. This is re-lated to other image-to-image prediction tasks like saliencyand segmentation, which motivate our architectural choices.Encoder-decoder architectures are common for such tasks,whereby features are first downsampled (encoded) before be-ing upsampled (decoded) to produce the final prediction at theoriginal image size. The previous state-of-the-art importancemodel [6] was based on a semantic segmentation architecture[25]. Similarly, we use a segmentation-inspired pyramid pool-ing module to leverage features at different scales and improvethe fidelity of the heatmaps. The addition of a classificationbranch helps our importance model make use of class-specificinformation. The full architecture is visualized in Fig. 4 andthe technical details of each component are detailed below.
Encoder. This is a low-level feature network that extractsbasic image features. We used the Xception encoder, a high-performing state-of-the-art network common for segmenta-
3
Figure 3. General importance trends on Imp1k across ground truthmaps and our predicted maps. Our model captures the trends correctly,evidencing a pronounced class specialization. This is further supportedby UMSI’s high classification accuracy: our model learns to recognizethe input’s class and tailor its output to the particularities of that class.
tion [10] and saliency [8] tasks. It is composed of depthwiseseparable convolutions, which come with great computationalsavings at a minimal cost on accuracy. We modified this net-work to output feature maps by removing the final globalaverage pooling and fully-connected layers. To obtain higherresolution maps, we reduced the strides of both the 1x1 resid-ual connection and the last two max pooling layers to one.
Atrous Separable Pyramid Pooling (ASPP). To aggregateimage information at multiple scales, we used an ASPP mod-ule [10] after our encoding module. This module appliesseveral dilated convolutions with different dilation rates in par-allel to a given set of feature maps. The output maps are thenconcatenated and passed through a projecting convolutionallayer to reduce the channel dimensionality of the feature block.We used an ASPP module with 4 parallel convolutional layerswith 256 filters, with dilation rates of 1, 6, 12 and 18.
Decoder. Our decoder is a set of convolutions followed byupsampling layers and dropout. This allows the feature mapsto be scaled up to the original image size, without a significantincrease in parameters. We use three different blocks: the firsttwo composed of two convolutional layers followed by a 2x2upsampling layer, and the last composed of one convolutionaland one upsampling layer. A 1x1 convolutional layer thentransforms the feature maps into our final importance map.The convolutional layers have kernels of size 3 and the dropoutapplied is 0.3. We use ReLU activations throughout.
Classification. The output of our encoder is also passed inparallel to a classification submodule. It is composed of two3x3 convolutional layers, followed by a convolutional layerwith stride 3 to reduce dimensionality, then another 3x3 convo-lutional layer. The resulting feature maps are globally pooledand a dense layer with dropout transforms the maps into a1x1x256 feature vector C f . This vector is used both (i) fordirectly outputting the predicted image class, and (ii) for intro-
ducing class-specific information for importance prediction. Inthe first case, C f is fed to a dense layer with 6 outputs and soft-max activation, to produce a 1x6 vector of class probabilities.In the second case, C f is resized to the required dimensionsand concatenated with the output from the ASPP module alongthe channel dimension as part of the Concatenation layer.
Model trainingOur challenge is to produce a model with good performanceboth on natural images and graphic designs, which tend tohave quite different layouts and attributes (e.g., graphic el-ements, text regions, etc.). Moreover, the available groundtruth attention data on natural images and graphic designs hasbeen collected using different means, producing differences informats and data quantity. The largest available dataset com-monly used for training saliency models on natural images isSALICON, containing 20K images with mouse movementsaggregated into saliency maps [19]. The only available impor-tance dataset for graphic designs until this paper was GDI [28],containing 1000 designs with binary annotations aggregatedinto importance maps. Our Imp1k dataset also contains 1000designs, but split across 5 distinct classes, while GDI is com-posed mainly of ads and posters from Flickr. Training a modelto learn the attention patterns on both natural images andgraphic designs, while using differently sized and formatteddatasets, involved a specialized procedure, detailed below.
Training procedure. We first pre-train our model on SALI-CON for 10-15 epochs. This allows our model to learn aboutimage features broadly relevant to saliency. We then fine-tuneon a graphic design importance dataset - which is either GDIor Imp1k, depending on the particular evaluation (next sec-tion). To prevent the network from “forgetting" saliency whilelearning design importance, we mix in 160 new SALICONimages during each fine-tuning epoch. This number maintainsclass balance when training on Imp1k, since the training setconsists of 80% of 200 designs per class.
Training details. We use the 10K training, 5K validation, and5K test splits from SALICON [19]. For GDI, we use the sametraining/testing split as in [6]. For Imp1k, we define a test setby randomly selecting 20% of images from each class. Wetrain with KL and CC losses, with coefficients of 10 and -3,respectively. A binary cross-entropy loss with a weight of 5is used for the classification submodule. The learning rate is1e−4, and is decreased by a factor of 10 every 3 epochs. Tolimit overfitting, we use a dropout of 0.3 on all layers. Wetrain with a batch size of 8 using the Adam optimizer.
MODEL EVALUATIONWe next compare with existing methods, on our dataset aswell as previous importance datasets. We compare differentvariants, including retraining previous models on our data, andtraining subsets of our model (e.g., without classification), inorder to evaluate each element of our method separately.
Importance predictionWe evaluated our model on two importance datasets, GDIand Imp1k, the results of which can be found in Tables 1 and2, respectively. On both datasets we compare against, and
4
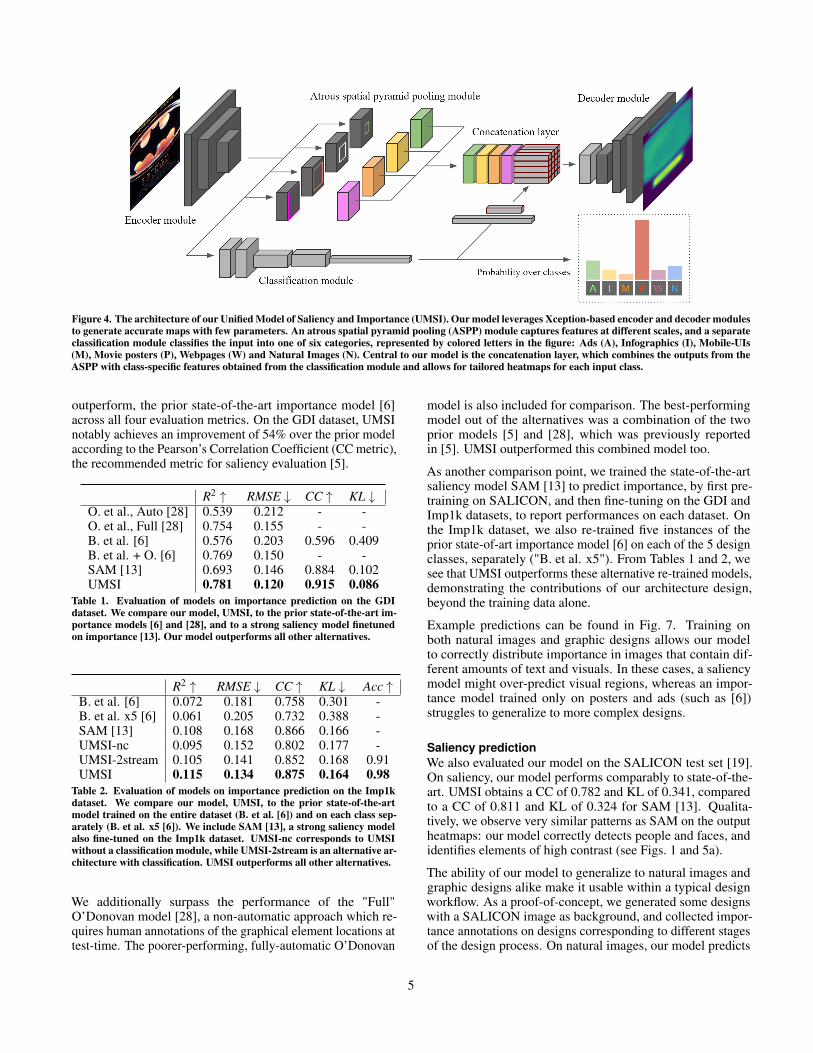
Figure 4. The architecture of our Unified Model of Saliency and Importance (UMSI). Our model leverages Xception-based encoder and decoder modulesto generate accurate maps with few parameters. An atrous spatial pyramid pooling (ASPP) module captures features at different scales, and a separateclassification module classifies the input into one of six categories, represented by colored letters in the figure: Ads (A), Infographics (I), Mobile-UIs(M), Movie posters (P), Webpages (W) and Natural Images (N). Central to our model is the concatenation layer, which combines the outputs from theASPP with class-specific features obtained from the classification module and allows for tailored heatmaps for each input class.
outperform, the prior state-of-the-art importance model [6]across all four evaluation metrics. On the GDI dataset, UMSInotably achieves an improvement of 54% over the prior modelaccording to the Pearson’s Correlation Coefficient (CC metric),the recommended metric for saliency evaluation [5].
R2 ↑ RMSE ↓ CC ↑ KL ↓O. et al., Auto [28] 0.539 0.212 - -O. et al., Full [28] 0.754 0.155 - -B. et al. [6] 0.576 0.203 0.596 0.409B. et al. + O. [6] 0.769 0.150 - -SAM [13] 0.693 0.146 0.884 0.102UMSI 0.781 0.120 0.915 0.086
Table 1. Evaluation of models on importance prediction on the GDIdataset. We compare our model, UMSI, to the prior state-of-the-art im-portance models [6] and [28], and to a strong saliency model finetunedon importance [13]. Our model outperforms all other alternatives.
R2 ↑ RMSE ↓ CC ↑ KL ↓ Acc ↑B. et al. [6] 0.072 0.181 0.758 0.301 -B. et al. x5 [6] 0.061 0.205 0.732 0.388 -SAM [13] 0.108 0.168 0.866 0.166 -UMSI-nc 0.095 0.152 0.802 0.177 -UMSI-2stream 0.105 0.141 0.852 0.168 0.91UMSI 0.115 0.134 0.875 0.164 0.98
Table 2. Evaluation of models on importance prediction on the Imp1kdataset. We compare our model, UMSI, to the prior state-of-the-artmodel trained on the entire dataset (B. et al. [6]) and on each class sep-arately (B. et al. x5 [6]). We include SAM [13], a strong saliency modelalso fine-tuned on the Imp1k dataset. UMSI-nc corresponds to UMSIwithout a classification module, while UMSI-2stream is an alternative ar-chitecture with classification. UMSI outperforms all other alternatives.
We additionally surpass the performance of the "Full"O’Donovan model [28], a non-automatic approach which re-quires human annotations of the graphical element locations attest-time. The poorer-performing, fully-automatic O’Donovan
model is also included for comparison. The best-performingmodel out of the alternatives was a combination of the twoprior models [5] and [28], which was previously reportedin [5]. UMSI outperformed this combined model too.
As another comparison point, we trained the state-of-the-artsaliency model SAM [13] to predict importance, by first pre-training on SALICON, and then fine-tuning on the GDI andImp1k datasets, to report performances on each dataset. Onthe Imp1k dataset, we also re-trained five instances of theprior state-of-art importance model [6] on each of the 5 designclasses, separately ("B. et al. x5"). From Tables 1 and 2, wesee that UMSI outperforms these alternative re-trained models,demonstrating the contributions of our architecture design,beyond the training data alone.
Example predictions can be found in Fig. 7. Training onboth natural images and graphic designs allows our modelto correctly distribute importance in images that contain dif-ferent amounts of text and visuals. In these cases, a saliencymodel might over-predict visual regions, whereas an impor-tance model trained only on posters and ads (such as [6])struggles to generalize to more complex designs.
Saliency predictionWe also evaluated our model on the SALICON test set [19].On saliency, our model performs comparably to state-of-the-art. UMSI obtains a CC of 0.782 and KL of 0.341, comparedto a CC of 0.811 and KL of 0.324 for SAM [13]. Qualita-tively, we observe very similar patterns as SAM on the outputheatmaps: our model correctly detects people and faces, andidentifies elements of high contrast (see Figs. 1 and 5a).
The ability of our model to generalize to natural images andgraphic designs alike make it usable within a typical designworkflow. As a proof-of-concept, we generated some designswith a SALICON image as background, and collected impor-tance annotations on designs corresponding to different stagesof the design process. On natural images, our model predicts
5
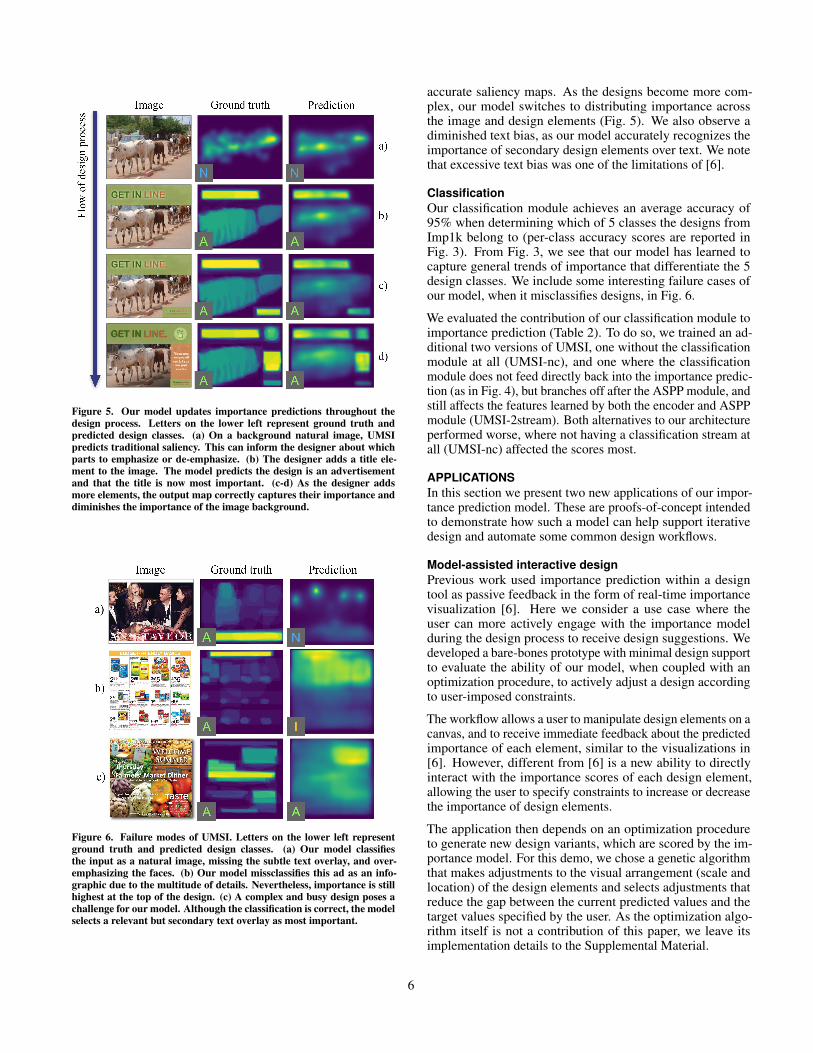
Figure 5. Our model updates importance predictions throughout thedesign process. Letters on the lower left represent ground truth andpredicted design classes. (a) On a background natural image, UMSIpredicts traditional saliency. This can inform the designer about whichparts to emphasize or de-emphasize. (b) The designer adds a title ele-ment to the image. The model predicts the design is an advertisementand that the title is now most important. (c-d) As the designer addsmore elements, the output map correctly captures their importance anddiminishes the importance of the image background.
Figure 6. Failure modes of UMSI. Letters on the lower left representground truth and predicted design classes. (a) Our model classifiesthe input as a natural image, missing the subtle text overlay, and over-emphasizing the faces. (b) Our model missclassifies this ad as an info-graphic due to the multitude of details. Nevertheless, importance is stillhighest at the top of the design. (c) A complex and busy design poses achallenge for our model. Although the classification is correct, the modelselects a relevant but secondary text overlay as most important.
accurate saliency maps. As the designs become more com-plex, our model switches to distributing importance acrossthe image and design elements (Fig. 5). We also observe adiminished text bias, as our model accurately recognizes theimportance of secondary design elements over text. We notethat excessive text bias was one of the limitations of [6].
ClassificationOur classification module achieves an average accuracy of95% when determining which of 5 classes the designs fromImp1k belong to (per-class accuracy scores are reported inFig. 3). From Fig. 3, we see that our model has learned tocapture general trends of importance that differentiate the 5design classes. We include some interesting failure cases ofour model, when it misclassifies designs, in Fig. 6.
We evaluated the contribution of our classification module toimportance prediction (Table 2). To do so, we trained an ad-ditional two versions of UMSI, one without the classificationmodule at all (UMSI-nc), and one where the classificationmodule does not feed directly back into the importance predic-tion (as in Fig. 4), but branches off after the ASPP module, andstill affects the features learned by both the encoder and ASPPmodule (UMSI-2stream). Both alternatives to our architectureperformed worse, where not having a classification stream atall (UMSI-nc) affected the scores most.
APPLICATIONSIn this section we present two new applications of our impor-tance prediction model. These are proofs-of-concept intendedto demonstrate how such a model can help support iterativedesign and automate some common design workflows.
Model-assisted interactive designPrevious work used importance prediction within a designtool as passive feedback in the form of real-time importancevisualization [6]. Here we consider a use case where theuser can more actively engage with the importance modelduring the design process to receive design suggestions. Wedeveloped a bare-bones prototype with minimal design supportto evaluate the ability of our model, when coupled with anoptimization procedure, to actively adjust a design accordingto user-imposed constraints.
The workflow allows a user to manipulate design elements on acanvas, and to receive immediate feedback about the predictedimportance of each element, similar to the visualizations in[6]. However, different from [6] is a new ability to directlyinteract with the importance scores of each design element,allowing the user to specify constraints to increase or decreasethe importance of design elements.
The application then depends on an optimization procedureto generate new design variants, which are scored by the im-portance model. For this demo, we chose a genetic algorithmthat makes adjustments to the visual arrangement (scale andlocation) of the design elements and selects adjustments thatreduce the gap between the current predicted values and thetarget values specified by the user. As the optimization algo-rithm itself is not a contribution of this paper, we leave itsimplementation details to the Supplemental Material.
6
(a)
(b)
(c)
(d)
(e)
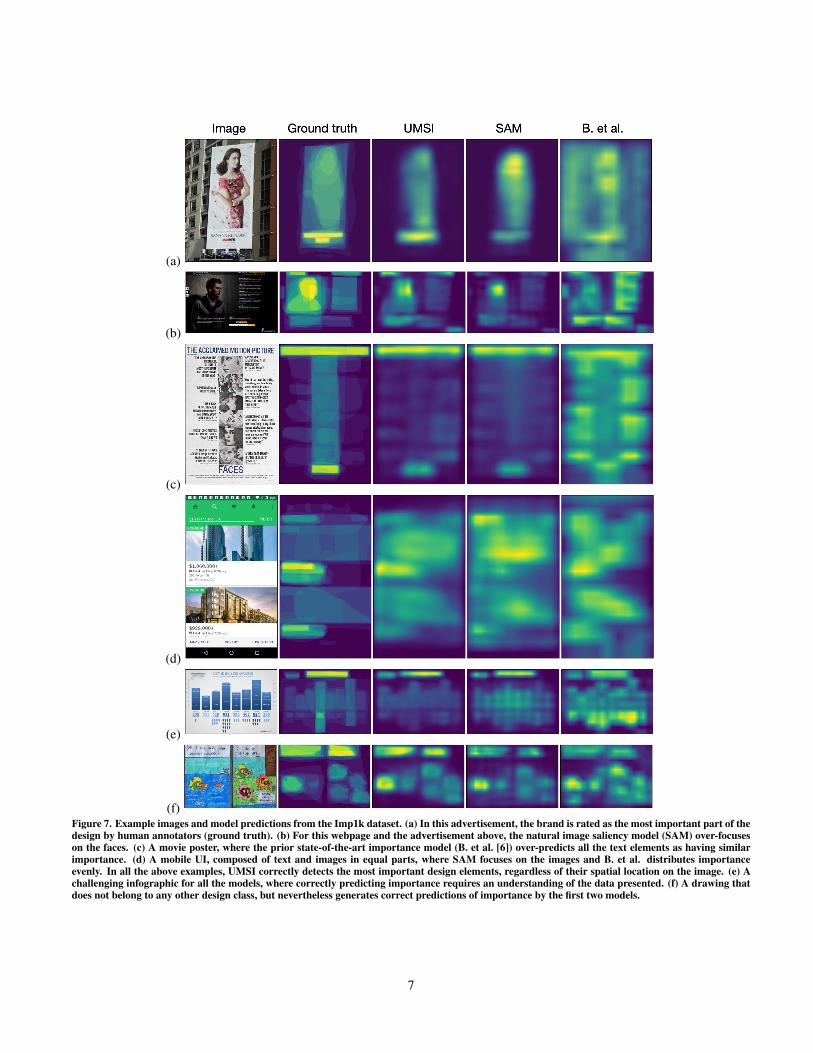
(f)Figure 7. Example images and model predictions from the Imp1k dataset. (a) In this advertisement, the brand is rated as the most important part of thedesign by human annotators (ground truth). (b) For this webpage and the advertisement above, the natural image saliency model (SAM) over-focuseson the faces. (c) A movie poster, where the prior state-of-the-art importance model (B. et al. [6]) over-predicts all the text elements as having similarimportance. (d) A mobile UI, composed of text and images in equal parts, where SAM focuses on the images and B. et al. distributes importanceevenly. In all the above examples, UMSI correctly detects the most important design elements, regardless of their spatial location on the image. (e) Achallenging infographic for all the models, where correctly predicting importance requires an understanding of the data presented. (f) A drawing thatdoes not belong to any other design class, but nevertheless generates correct predictions of importance by the first two models.
7
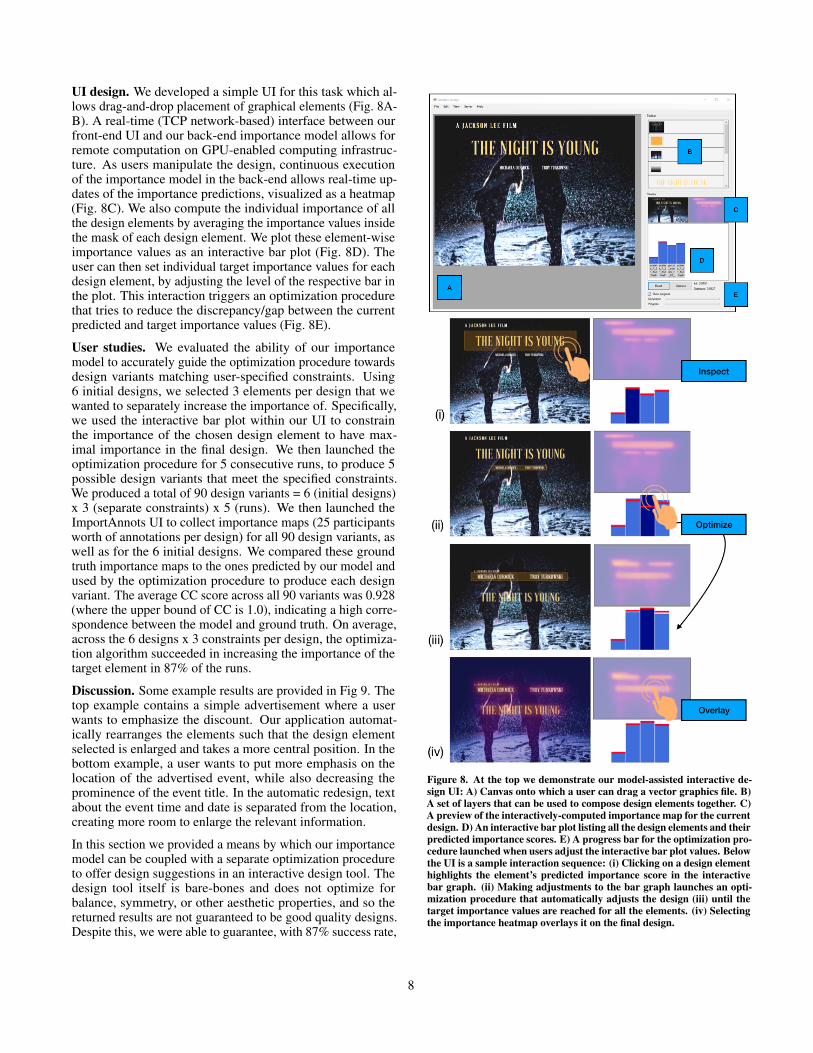
UI design. We developed a simple UI for this task which al-lows drag-and-drop placement of graphical elements (Fig. 8A-B). A real-time (TCP network-based) interface between ourfront-end UI and our back-end importance model allows forremote computation on GPU-enabled computing infrastruc-ture. As users manipulate the design, continuous executionof the importance model in the back-end allows real-time up-dates of the importance predictions, visualized as a heatmap(Fig. 8C). We also compute the individual importance of allthe design elements by averaging the importance values insidethe mask of each design element. We plot these element-wiseimportance values as an interactive bar plot (Fig. 8D). Theuser can then set individual target importance values for eachdesign element, by adjusting the level of the respective bar inthe plot. This interaction triggers an optimization procedurethat tries to reduce the discrepancy/gap between the currentpredicted and target importance values (Fig. 8E).
User studies. We evaluated the ability of our importancemodel to accurately guide the optimization procedure towardsdesign variants matching user-specified constraints. Using6 initial designs, we selected 3 elements per design that wewanted to separately increase the importance of. Specifically,we used the interactive bar plot within our UI to constrainthe importance of the chosen design element to have max-imal importance in the final design. We then launched theoptimization procedure for 5 consecutive runs, to produce 5possible design variants that meet the specified constraints.We produced a total of 90 design variants = 6 (initial designs)x 3 (separate constraints) x 5 (runs). We then launched theImportAnnots UI to collect importance maps (25 participantsworth of annotations per design) for all 90 design variants, aswell as for the 6 initial designs. We compared these groundtruth importance maps to the ones predicted by our model andused by the optimization procedure to produce each designvariant. The average CC score across all 90 variants was 0.928(where the upper bound of CC is 1.0), indicating a high corre-spondence between the model and ground truth. On average,across the 6 designs x 3 constraints per design, the optimiza-tion algorithm succeeded in increasing the importance of thetarget element in 87% of the runs.
Discussion. Some example results are provided in Fig 9. Thetop example contains a simple advertisement where a userwants to emphasize the discount. Our application automat-ically rearranges the elements such that the design elementselected is enlarged and takes a more central position. In thebottom example, a user wants to put more emphasis on thelocation of the advertised event, while also decreasing theprominence of the event title. In the automatic redesign, textabout the event time and date is separated from the location,creating more room to enlarge the relevant information.
In this section we provided a means by which our importancemodel can be coupled with a separate optimization procedureto offer design suggestions in an interactive design tool. Thedesign tool itself is bare-bones and does not optimize forbalance, symmetry, or other aesthetic properties, and so thereturned results are not guaranteed to be good quality designs.Despite this, we were able to guarantee, with 87% success rate,
Figure 8. At the top we demonstrate our model-assisted interactive de-sign UI: A) Canvas onto which a user can drag a vector graphics file. B)A set of layers that can be used to compose design elements together. C)A preview of the interactively-computed importance map for the currentdesign. D) An interactive bar plot listing all the design elements and theirpredicted importance scores. E) A progress bar for the optimization pro-cedure launched when users adjust the interactive bar plot values. Belowthe UI is a sample interaction sequence: (i) Clicking on a design elementhighlights the element’s predicted importance score in the interactivebar graph. (ii) Making adjustments to the bar graph launches an opti-mization procedure that automatically adjusts the design (iii) until thetarget importance values are reached for all the elements. (iv) Selectingthe importance heatmap overlays it on the final design.
8
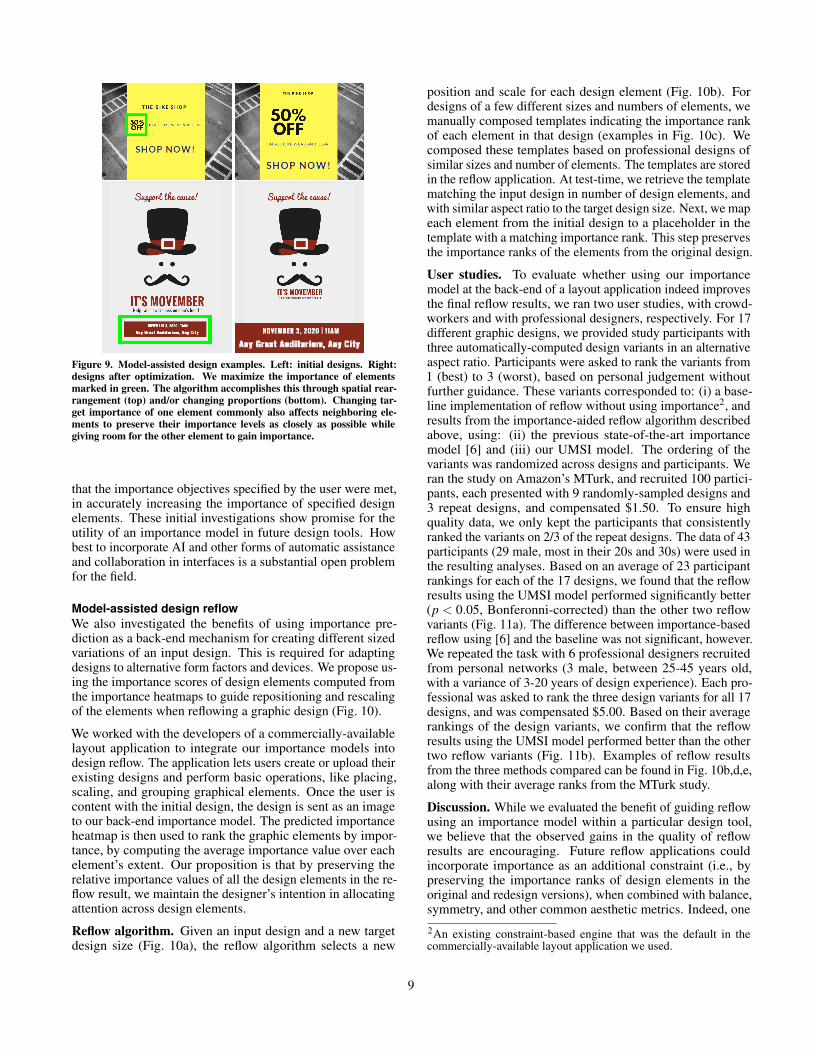
Figure 9. Model-assisted design examples. Left: initial designs. Right:designs after optimization. We maximize the importance of elementsmarked in green. The algorithm accomplishes this through spatial rear-rangement (top) and/or changing proportions (bottom). Changing tar-get importance of one element commonly also affects neighboring ele-ments to preserve their importance levels as closely as possible whilegiving room for the other element to gain importance.
that the importance objectives specified by the user were met,in accurately increasing the importance of specified designelements. These initial investigations show promise for theutility of an importance model in future design tools. Howbest to incorporate AI and other forms of automatic assistanceand collaboration in interfaces is a substantial open problemfor the field.
Model-assisted design reflowWe also investigated the benefits of using importance pre-diction as a back-end mechanism for creating different sizedvariations of an input design. This is required for adaptingdesigns to alternative form factors and devices. We propose us-ing the importance scores of design elements computed fromthe importance heatmaps to guide repositioning and rescalingof the elements when reflowing a graphic design (Fig. 10).
We worked with the developers of a commercially-availablelayout application to integrate our importance models intodesign reflow. The application lets users create or upload theirexisting designs and perform basic operations, like placing,scaling, and grouping graphical elements. Once the user iscontent with the initial design, the design is sent as an imageto our back-end importance model. The predicted importanceheatmap is then used to rank the graphic elements by impor-tance, by computing the average importance value over eachelement’s extent. Our proposition is that by preserving therelative importance values of all the design elements in the re-flow result, we maintain the designer’s intention in allocatingattention across design elements.
Reflow algorithm. Given an input design and a new targetdesign size (Fig. 10a), the reflow algorithm selects a new
position and scale for each design element (Fig. 10b). Fordesigns of a few different sizes and numbers of elements, wemanually composed templates indicating the importance rankof each element in that design (examples in Fig. 10c). Wecomposed these templates based on professional designs ofsimilar sizes and number of elements. The templates are storedin the reflow application. At test-time, we retrieve the templatematching the input design in number of design elements, andwith similar aspect ratio to the target design size. Next, we mapeach element from the initial design to a placeholder in thetemplate with a matching importance rank. This step preservesthe importance ranks of the elements from the original design.
User studies. To evaluate whether using our importancemodel at the back-end of a layout application indeed improvesthe final reflow results, we ran two user studies, with crowd-workers and with professional designers, respectively. For 17different graphic designs, we provided study participants withthree automatically-computed design variants in an alternativeaspect ratio. Participants were asked to rank the variants from1 (best) to 3 (worst), based on personal judgement withoutfurther guidance. These variants corresponded to: (i) a base-line implementation of reflow without using importance2, andresults from the importance-aided reflow algorithm describedabove, using: (ii) the previous state-of-the-art importancemodel [6] and (iii) our UMSI model. The ordering of thevariants was randomized across designs and participants. Weran the study on Amazon’s MTurk, and recruited 100 partici-pants, each presented with 9 randomly-sampled designs and3 repeat designs, and compensated $1.50. To ensure highquality data, we only kept the participants that consistentlyranked the variants on 2/3 of the repeat designs. The data of 43participants (29 male, most in their 20s and 30s) were used inthe resulting analyses. Based on an average of 23 participantrankings for each of the 17 designs, we found that the reflowresults using the UMSI model performed significantly better(p < 0.05, Bonferonni-corrected) than the other two reflowvariants (Fig. 11a). The difference between importance-basedreflow using [6] and the baseline was not significant, however.We repeated the task with 6 professional designers recruitedfrom personal networks (3 male, between 25-45 years old,with a variance of 3-20 years of design experience). Each pro-fessional was asked to rank the three design variants for all 17designs, and was compensated $5.00. Based on their averagerankings of the design variants, we confirm that the reflowresults using the UMSI model performed better than the othertwo reflow variants (Fig. 11b). Examples of reflow resultsfrom the three methods compared can be found in Fig. 10b,d,e,along with their average ranks from the MTurk study.
Discussion. While we evaluated the benefit of guiding reflowusing an importance model within a particular design tool,we believe that the observed gains in the quality of reflowresults are encouraging. Future reflow applications couldincorporate importance as an additional constraint (i.e., bypreserving the importance ranks of design elements in theoriginal and redesign versions), when combined with balance,symmetry, and other common aesthetic metrics. Indeed, one
2An existing constraint-based engine that was the default in thecommercially-available layout application we used.
9
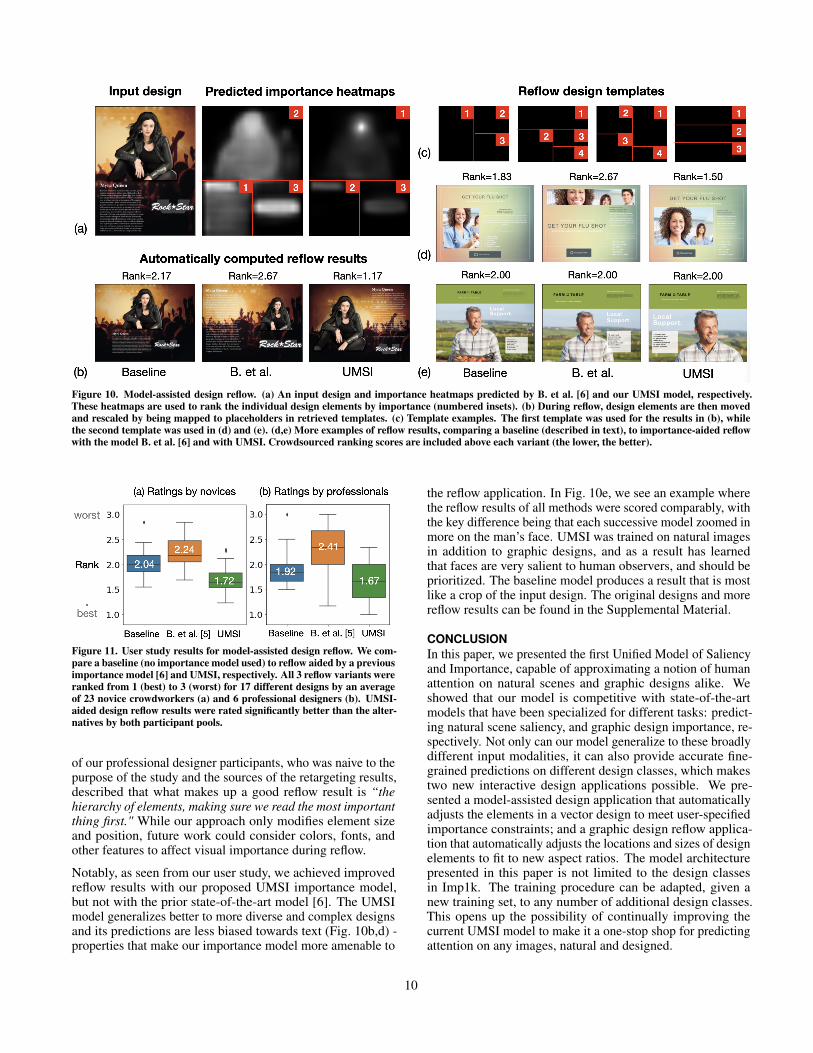
Figure 10. Model-assisted design reflow. (a) An input design and importance heatmaps predicted by B. et al. [6] and our UMSI model, respectively.These heatmaps are used to rank the individual design elements by importance (numbered insets). (b) During reflow, design elements are then movedand rescaled by being mapped to placeholders in retrieved templates. (c) Template examples. The first template was used for the results in (b), whilethe second template was used in (d) and (e). (d,e) More examples of reflow results, comparing a baseline (described in text), to importance-aided reflowwith the model B. et al. [6] and with UMSI. Crowdsourced ranking scores are included above each variant (the lower, the better).
Figure 11. User study results for model-assisted design reflow. We com-pare a baseline (no importance model used) to reflow aided by a previousimportance model [6] and UMSI, respectively. All 3 reflow variants wereranked from 1 (best) to 3 (worst) for 17 different designs by an averageof 23 novice crowdworkers (a) and 6 professional designers (b). UMSI-aided design reflow results were rated significantly better than the alter-natives by both participant pools.
of our professional designer participants, who was naive to thepurpose of the study and the sources of the retargeting results,described that what makes up a good reflow result is “thehierarchy of elements, making sure we read the most importantthing first." While our approach only modifies element sizeand position, future work could consider colors, fonts, andother features to affect visual importance during reflow.
Notably, as seen from our user study, we achieved improvedreflow results with our proposed UMSI importance model,but not with the prior state-of-the-art model [6]. The UMSImodel generalizes better to more diverse and complex designsand its predictions are less biased towards text (Fig. 10b,d) -properties that make our importance model more amenable to
the reflow application. In Fig. 10e, we see an example wherethe reflow results of all methods were scored comparably, withthe key difference being that each successive model zoomed inmore on the man’s face. UMSI was trained on natural imagesin addition to graphic designs, and as a result has learnedthat faces are very salient to human observers, and should beprioritized. The baseline model produces a result that is mostlike a crop of the input design. The original designs and morereflow results can be found in the Supplemental Material.
CONCLUSIONIn this paper, we presented the first Unified Model of Saliencyand Importance, capable of approximating a notion of humanattention on natural scenes and graphic designs alike. Weshowed that our model is competitive with state-of-the-artmodels that have been specialized for different tasks: predict-ing natural scene saliency, and graphic design importance, re-spectively. Not only can our model generalize to these broadlydifferent input modalities, it can also provide accurate fine-grained predictions on different design classes, which makestwo new interactive design applications possible. We pre-sented a model-assisted design application that automaticallyadjusts the elements in a vector design to meet user-specifiedimportance constraints; and a graphic design reflow applica-tion that automatically adjusts the locations and sizes of designelements to fit to new aspect ratios. The model architecturepresented in this paper is not limited to the design classesin Imp1k. The training procedure can be adapted, given anew training set, to any number of additional design classes.This opens up the possibility of continually improving thecurrent UMSI model to make it a one-stop shop for predictingattention on any images, natural and designed.
10
REFERENCES1. Michelle A Borkin, Zoya Bylinskii, Nam Wook Kim,
Constance May Bainbridge, Chelsea S Yeh, DanielBorkin, Hanspeter Pfister, and Aude Oliva. 2016. Beyondmemorability: Visualization recognition and recall. IEEEtransactions on visualization and computer graphics 22,1 (2016), 519–528.
2. Michelle A Borkin, Azalea A Vo, Zoya Bylinskii, PhillipIsola, Shashank Sunkavalli, Aude Oliva, and HanspeterPfister. 2013. What makes a visualization memorable?IEEE Transactions on Visualization and ComputerGraphics 19, 12 (2013), 2306–2315.
3. Zoya Bylinskii, Michelle A Borkin, Nam Wook Kim,Hanspeter Pfister, and Aude Oliva. 2015a. Eye fixationmetrics for large scale evaluation and comparison ofinformation visualizations. In Workshop on Eye Trackingand Visualization. Springer, 235–255.
4. Zoya Bylinskii, Tilke Judd, Ali Borji, Laurent Itti, FrédoDurand, Aude Oliva, and Antonio Torralba. 2015b. Mitsaliency benchmark. (2015).
5. Zoya Bylinskii, Tilke Judd, Aude Oliva, AntonioTorralba, and Frédo Durand. 2019. What do differentevaluation metrics tell us about saliency models? IEEEtransactions on pattern analysis and machine intelligence41, 3 (2019), 740–757.
6. Zoya Bylinskii, Nam Wook Kim, Peter O’Donovan, SamiAlsheikh, Spandan Madan, Hanspeter Pfister, FredoDurand, Bryan Russell, and Aaron Hertzmann. 2017.Learning visual importance for graphic designs and datavisualizations. In Proceedings of the 30th Annual ACMSymposium on User Interface Software and Technology.ACM, 57–69.
7. Jamie Callan, Mark Hoy, Changkuk Yoo, and Le Zhao.2009. Clueweb09 data set. (2009).
8. Pat Sukhum Yun Bin Zhang Nanxuan Zhao Aude OlivaZoya Bylinskii Camilo Fosco, Anelise Newman. 2020.How much time do you have? Modeling multi-durationsaliency. Proceedings of the IEEE conference oncomputer vision and pattern recognition (2020).
9. Y. Cao, R. Lau, and A. B. Chan. 2014. Look Over Here:Attention-Directing Composition of Manga Elements.ACM Transactions on Graphics (Proc. of SIGGRAPH2014) 33 (2014). Issue 4.
10. Liang-Chieh Chen, George Papandreou, Florian Schroff,and Hartwig Adam. 2017. Rethinking atrous convolutionfor semantic image segmentation. arXiv preprintarXiv:1706.05587 (2017).
11. Wei-Ta Chu and Hung-Jui Guo. 2017. Movie GenreClassification based on Poster Images with Deep NeuralNetworks. (2017).
12. Marcella Cornia, Lorenzo Baraldi, Giuseppe Serra, andRita Cucchiara. 2016. A deep multi-level network forsaliency prediction. In 2016 23rd International
Conference on Pattern Recognition (ICPR). IEEE,3488–3493.
13. Marcella Cornia, Lorenzo Baraldi, Giuseppe Serra, andRita Cucchiara. 2018. Predicting human eye fixations viaan lstm-based saliency attentive model. IEEETransactions on Image Processing 27, 10 (2018),5142–5154.
14. Biplab Deka, Zifeng Huang, Chad Franzen, JoshuaHibschman, Daniel Afergan, Yang Li, Jeffrey Nichols,and Ranjitha Kumar. 2017. Rico: A mobile app datasetfor building data-driven design applications. InProceedings of the 30th Annual ACM Symposium on UserInterface Software and Technology. ACM, 845–854.
15. Prakhar Gupta, Shubh Gupta, Ajaykrishnan Jayagopal,Sourav Pal, and Ritwik Sinha. 2018. Saliency Predictionfor Mobile User Interfaces. In 2018 IEEE WinterConference on Applications of Computer Vision (WACV).IEEE, 1529–1538.
16. Michael J Haass, Andrew T Wilson, Laura E Matzen, andKristin M Divis. 2016. Modeling human comprehensionof data visualizations. In International Conference onVirtual, Augmented and Mixed Reality. Springer,125–134.
17. Lane Harrison, Katharina Reinecke, and Remco Chang.2015. Infographic aesthetics: Designing for the firstimpression. In Proceedings of the 33rd Annual ACMConference on Human Factors in Computing Systems.ACM, 1187–1190.
18. Zaeem Hussain, Mingda Zhang, Xiaozhong Zhang,Keren Ye, Christopher Thomas, Zuha Agha, Nathan Ong,and Adriana Kovashka. 2017. Automatic understandingof image and video advertisements. In Proceedings of theIEEE Conference on Computer Vision and PatternRecognition. 1705–1715.
19. Ming Jiang, Shengsheng Huang, Juanyong Duan, and QiZhao. 2015. Salicon: Saliency in context. In Proceedingsof the IEEE conference on computer vision and patternrecognition. 1072–1080.
20. Binxing Jiao, Linjun Yang, Jizheng Xu, and Feng Wu.2010. Visual summarization of web pages. InProceedings of the 33rd international ACM SIGIRconference on Research and development in informationretrieval. ACM, 499–506.
21. Nam Wook Kim, Zoya Bylinskii, Michelle A Borkin,Krzysztof Z Gajos, Aude Oliva, Fredo Durand, andHanspeter Pfister. 2017. BubbleView: an interface forcrowdsourcing image importance maps and trackingvisual attention. ACM Transactions on Computer-HumanInteraction (TOCHI) 24, 5 (2017), 36.
22. Matthias Kümmerer, Lucas Theis, and Matthias Bethge.2014. Deep gaze i: Boosting saliency prediction withfeature maps trained on imagenet. arXiv preprintarXiv:1411.1045 (2014).
11
23. Matthias Kümmerer, Thomas SA Wallis, and MatthiasBethge. 2016. DeepGaze II: Reading fixations from deepfeatures trained on object recognition. arXiv preprintarXiv:1610.01563 (2016).
24. Wei Liu, Dragomir Anguelov, Dumitru Erhan, ChristianSzegedy, Scott Reed, Cheng-Yang Fu, and Alexander CBerg. 2016. Ssd: Single shot multibox detector. InEuropean conference on computer vision. Springer,21–37.
25. Jonathan Long, Evan Shelhamer, and Trevor Darrell.2015. Fully convolutional networks for semanticsegmentation. In Proceedings of the IEEE conference oncomputer vision and pattern recognition. 3431–3440.
26. Laura E Matzen, Michael J Haass, Kristin M Divis,Zhiyuan Wang, and Andrew T Wilson. 2017. Datavisualization saliency model: A tool for evaluatingabstract data visualizations. IEEE transactions onvisualization and computer graphics 24, 1 (2017),563–573.
27. Anelise Newman, Barry McNamara, Camilo Fosco,Yun Bin Zhang, Pat Sukhum, Matthew Tancik,Nam Wook Kim, and Zoya Bylinskii. 2020. TurkEyes: AWeb-Based Toolbox for Crowdsourcing Attention Data.Proceedings of the 2020 CHI Conference on HumanFactors in Computing Systems (2020).
28. Peter O’Donovan, Aseem Agarwala, and AaronHertzmann. 2014. Learning layouts for single-page
graphic designs. IEEE transactions on visualization andcomputer graphics 20, 8 (2014), 1200–1213.
29. Chengyao Shen and Qi Zhao. 2014. Webpage saliency. InEuropean conference on computer vision. Springer,33–46.
30. Jaime Teevan, Edward Cutrell, Danyel Fisher, Steven MDrucker, Gonzalo Ramos, Paul André, and Chang Hu.2009. Visual snippets: summarizing web pages for searchand revisitation. In Proceedings of the SIGCHIConference on Human Factors in Computing Systems.ACM, 2023–2032.
31. Quanlong Zheng, Jianbo Jiao, Ying Cao, and Rynson WHLau. 2018. Task-driven webpage saliency. In Proceedingsof the European Conference on Computer Vision (ECCV).287–302.
32. Xinyu Zhou, Cong Yao, He Wen, Yuzhi Wang, ShuchangZhou, Weiran He, and Jiajun Liang. 2017. East: anefficient and accurate scene text detector. In Proceedingsof the IEEE conference on Computer Vision and PatternRecognition. 5551–5560.
33. Spandan Madan* Adria Recasens* Kimberli ZhongHanspeter Pfister Fredo Durand Aude OlivaZoya Bylinskii*, Sami Alsheikh*. 2017. Understandinginfographics through textual and visual tag prediction. InarXiv preprint arXiv:1709.09215.https://arxiv.org/pdf/1709.09215
12
Related Documents


![graphic-arts printing presses and workshops...will increase in importance and digital impression will grow in relation with other printing processes. [4] Safety guide graphic-arts](https://static.cupdf.com/doc/110x72/60013a26de049d36c217be5b/graphic-arts-printing-presses-and-workshops-will-increase-in-importance-and.jpg)