PERIOPERATIVE MEDICINE Anesthesiology 2010; 112:41–9 Copyright © 2009, the American Society of Anesthesiologists, Inc. Lippincott Williams & Wilkins Predicting the Unpredictable A New Prediction Model for Operating Room Times Using Individual Characteristics and the Surgeon’s Estimate Marinus J. C. Eijkemans, Ph.D.,* Mark van Houdenhoven, Ph.D.,† Tien Nguyen, M.Sc.,‡ Eric Boersma, Ph.D.,§ Ewout W. Steyerberg, Ph.D., Geert Kazemier, Ph.D.# ABSTRACT Background: Routine predictions made by surgeons or historical mean durations have only limited capacity to predict operating room (OR) time. The authors aimed to devise a prediction model using the surgeon’s estimate and characteristics of the surgical team, the operation, and the patient. Methods: Seventeen thousand four hundred twelve consecutive, elective operations from the general surgical department in an academic hospital were analyzed. The outcome was OR time, and the potential predictive factors were surgeon’s estimate, number of planned procedures, number and experience of sur- geons and anesthesiologists, patient’s age and sex, number of previous hospital admissions, body mass index, and eight cardio- vascular risk factors. Linear mixed modeling on the logarithm of the total OR time was performed. Results: Characteristics of the operation and the team had the largest predictive performance, whereas patient characteristics had a modest but distinct effect on OR time: operations were shorter for patients older than 60 yr, and higher body mass index was associated with longer OR times. The surgeon’s estimate had an independent and substantial contribution to the prediction, and the final model explained 27% of the residual variation in log (OR time). Using the prediction model instead of the surgeon’s prediction based on historical averages would reduce shorter-than-predicted and longer-than-predicted OR time by 2.8 and 6.6 min per case (a relative reduction of 12 and 25%, respectively), assessed on independent validation data. Conclusions: Detailed information on the operative session, the team, and the patient substantially improves the prediction of OR times, but the surgeon’s estimate remains important. The prediction model may be used in OR scheduling. O PERATING rooms (ORs) are of pivotal importance to a hospital, consuming a considerable part of its total budget. 1 Typically, more than 60% of patients admitted to a hospital are treated in the OR. Patient management, that is, the decision to treat a patient and the timing of treatment, is often constrained by limitations in the OR capacity or in the availability of surgeons and qualified OR personnel. For this reason, and for cost containment, the planning of care, that is, planning which patient to operate on when, is crucial. 2,3 Emergency procedures, large diversity in processes, depen- dency on limited capacity in other parts of the care process such as intensive care units, and a large number of specialties competing for limited OR facilities make planning complex. Optimal planning can be achieved only when reliable predictions are available about the time needed for elective operations. When an operation takes longer than predicted, subsequent operations may need to be postponed or even Supplemental digital content is available for this article. Direct URL citations appear in the printed text and are available in both the HTML and PDF versions of this article. Links to the digital files are provided in the HTML text of this article on the Journals Web site (www.anesthesiology.org). * Associate Professor, Department of Public Health, Center for Med- ical Decision Sciences, Erasmus MC University Medical Center, and Julius Center, Center for Biostatistics, University Medical Centre Utrecht, Utrecht, The Netherlands. † Manager, Department of Operating Rooms, ‡ Ph.D. Student, Department of Public Health, Center for Medical Decision Sciences and Department of Operating Rooms, § Professor, Department of Cardiology, Professor, Department of Public Health, Center for Medical Decision Sciences, # Associate Professor, Departments of Operating Rooms and of Surgery, Erasmus MC University Medical Center. Received from the Department of Public Health, Center for Medical Decision Sciences, Erasmus MC University Medical Center, Rotterdam, The Netherlands. Submitted for publication March 13, 2008. Accepted for publication September 1, 2009. Supported by Erasmus MC Doel- matigheid, Erasmus Medical Center, Rotterdam, The Netherlands. Address correspondence to Dr. Eijkemans: Julius Center, Center for Biostatistics, University Medical Centre Utrecht, 3508 GA Utrecht, The Netherlands. [email protected]. Information on purchasing reprints may be found at www.anesthesiology.org or on the masthead page at the beginning of this issue. ANESTHESIOLOGY’s articles are made freely accessible to all readers, for personal use only, 6 months from the cover date of the issue. What We Already Know about This Topic ❖ Efficient use of the operating room requires accurate esti- mates of procedure time ❖ Surgeon estimates of procedure duration are poorly predic- tive, and models have focused on specific procedures without including individual patient characteristics What This Article Tells Us That Is New ❖ Using more than 17,000 cases in an academic practice, pro- cedure, operating team, and patient characteristics added to the predictive value of surgeon estimate of duration ❖ Surgeon and anesthesiologist age in this teaching setting af- fected procedure duration Anesthesiology, V 112 • No 1 41 January 2010

Welcome message from author
This document is posted to help you gain knowledge. Please leave a comment to let me know what you think about it! Share it to your friends and learn new things together.
Transcript
PERIOPERATIVE MEDICINE Anesthesiology 2010; 112:41–9
Copyright © 2009, the American Society of Anesthesiologists, Inc. Lippincott Williams & Wilkins
Predicting the Unpredictable
A New Prediction Model for Operating Room Times Using Individual Characteristics and theSurgeon’s Estimate
Marinus J. C. Eijkemans, Ph.D.,* Mark van Houdenhoven, Ph.D.,† Tien Nguyen, M.Sc.,‡Eric Boersma, Ph.D.,§ Ewout W. Steyerberg, Ph.D.,� Geert Kazemier, Ph.D.#
ABSTRACTBackground: Routine predictions made by surgeons or historicalmean durations have only limited capacity to predict operating room(OR) time. The authors aimed to devise a prediction model using thesurgeon’s estimate and characteristics of the surgical team, theoperation, and the patient.Methods: Seventeen thousand four hundred twelve consecutive,elective operations from the general surgical department in anacademic hospital were analyzed. The outcome was OR time,and the potential predictive factors were surgeon’s estimate,number of planned procedures, number and experience of sur-geons and anesthesiologists, patient’s age and sex, number ofprevious hospital admissions, body mass index, and eight cardio-vascular risk factors. Linear mixed modeling on the logarithm ofthe total OR time was performed.Results: Characteristics of the operation and the team had the largestpredictive performance, whereas patient characteristics had a modestbut distinct effect on OR time: operations were shorter for patients olderthan 60 yr, and higher body mass index was associated with longer ORtimes. The surgeon’s estimate had an independent and substantialcontribution to the prediction, and the final model explained 27% of theresidual variation in log (OR time). Using the prediction model instead ofthe surgeon’s prediction based on historical averages would reduceshorter-than-predicted and longer-than-predicted OR time by 2.8 and6.6 min per case (a relative reduction of 12 and 25%, respectively),assessed on independent validation data.
Conclusions: Detailed information on the operative session, theteam, and the patient substantially improves the prediction of ORtimes, but the surgeon’s estimate remains important. The predictionmodel may be used in OR scheduling.
OPERATING rooms (ORs) are of pivotal importance toa hospital, consuming a considerable part of its total
budget.1 Typically, more than 60% of patients admitted to ahospital are treated in the OR. Patient management, that is,the decision to treat a patient and the timing of treatment, isoften constrained by limitations in the OR capacity or in theavailability of surgeons and qualified OR personnel. For thisreason, and for cost containment, the planning of care, thatis, planning which patient to operate on when, is crucial.2,3
Emergency procedures, large diversity in processes, depen-dency on limited capacity in other parts of the care processsuch as intensive care units, and a large number of specialtiescompeting for limited OR facilities make planning complex.
Optimal planning can be achieved only when reliablepredictions are available about the time needed for electiveoperations. When an operation takes longer than predicted,subsequent operations may need to be postponed or even
Supplemental digital content is available for this article. DirectURL citations appear in the printed text and are available in boththe HTML and PDF versions of this article. Links to the digitalfiles are provided in the HTML text of this article on the Journal�sWeb site (www.anesthesiology.org).
�
* Associate Professor, Department of Public Health, Center for Med-ical Decision Sciences, Erasmus MC University Medical Center, andJulius Center, Center for Biostatistics, University Medical Centre Utrecht,Utrecht, The Netherlands. † Manager, Department of Operating Rooms,‡ Ph.D. Student, Department of Public Health, Center for Medical DecisionSciences andDepartment ofOperatingRooms, § Professor,Department ofCardiology, � Professor, Department of Public Health, Center for MedicalDecision Sciences, # Associate Professor, Departments of OperatingRooms and of Surgery, Erasmus MC University Medical Center.
Received from the Department of Public Health, Center for MedicalDecision Sciences, Erasmus MC University Medical Center, Rotterdam,The Netherlands. Submitted for publication March 13, 2008. Acceptedfor publication September 1, 2009. Supported by Erasmus MC Doel-matigheid, Erasmus Medical Center, Rotterdam, The Netherlands.
Address correspondence to Dr. Eijkemans: Julius Center, Centerfor Biostatistics, University Medical Centre Utrecht, 3508 GA Utrecht,The Netherlands. [email protected]. Information onpurchasing reprints may be found at www.anesthesiology.org or onthe masthead page at the beginning of this issue. ANESTHESIOLOGY’sarticles are made freely accessible to all readers, for personal useonly, 6 months from the cover date of the issue.
What We Already Know about This Topic
❖ Efficient use of the operating room requires accurate esti-mates of procedure time
❖ Surgeon estimates of procedure duration are poorly predic-tive, and models have focused on specific procedures withoutincluding individual patient characteristics
What This Article Tells Us That Is New
❖ Using more than 17,000 cases in an academic practice, pro-cedure, operating team, and patient characteristics added tothe predictive value of surgeon estimate of duration
❖ Surgeon and anesthesiologist age in this teaching setting af-fected procedure duration
Anesthesiology, V 112 • No 1 41 January 2010
cancelled. When the actual time is shorter than predicted andplanned, the OR remains unused for a while. Both are un-desirable and could lead to suboptimal use of the OR.4 Fur-thermore, in the absence of reliable predictions, the use ofadvanced planning techniques makes no sense. Althoughmuch progress has been made in the planning methodology,particularly for planning on the day of surgery, there remainsopportunity for additional improvement through a betterpreoperative prediction of OR times for individual cases.
In some hospitals, the surgeons make a routine prediction ofthe OR time needed, and in others, historical times are taken asa reference.5,6 However, the accuracy of these predictions islimited.7 If it would be possible to make more accurate predic-tions of the OR time for individual patients, planning will beimproved, and potential benefits would be twofold: (1) the pre-diction for an individual patient will be more accurate than theaverage prediction for the group of patients undergoing thesame operation, and (2) the variation around the prediction willbe smaller than the variation for the group as a whole. Previousstudies have aimed to develop predictive tools by statistical mod-eling of operation times.5,8–11 However, none of them aimed tomake predictions for individual patients covering all operationsfrom one surgical department. Selected operations from varioussurgical specialities were taken into account,8 or only one par-ticular type of operation was considered.9 Silber et al.,11 usingMedicare claims data, developed a prediction model to explainthe differences between subgroups of patients and between hos-pitals, not to develop a tool for planning. The role of the pre-diction made by the surgeon is ignored, or it is compared withthe predictions made by an automated planning software.5
We aim to predict the total OR time by using the sur-geon’s estimate of operative time and procedure, team, andpatient characteristics of individually specified operations ofa general surgical department.
Materials and Methods
SubjectsAll operative sessions at the Erasmus Medical Center (Rot-terdam, The Netherlands) are registered electronically sinceJanuary 1993. For the purpose of this study, data from theoperation database (OPERA, operation administration)were matched with global patient data from the general elec-tronic hospital information system and with more detailedpatient data from a previous study on risk factors for com-plications of surgery.12 For use of these data sources, ap-proval of the Institutional Review Board of the ErasmusMedical Center was obtained. We initially selected 18,838consecutive elective operations performed by the Department ofGeneral Surgery until June 2005. Emergency operations werenot considered. Operations that had not been performed duringthe last 3 yr (n � 1,338), operative sessions for which no match-ing between the databases could be obtained (n � 21), andoperations that were wrongly assigned to the Department ofGeneral Surgery (n � 67) were excluded. This left 17,412 op-erations for analysis. Operations were classified into 253 catego-
ries, according to the main procedure during the operation.These operations are typical for a surgical department in anacademic, tertiary referral center.
The outcome to be predicted was total OR time, defined asthe time from entry of the patient into the OR until leaving it.We will systematically use the term “operation” to characterize asession and use “surgical procedure” for the possibly multiplesurgical activities that are part of an operation.
Operation characteristics were the number of separateprocedures within the operation and whether it was a lapa-roscopic procedure. In case of multiple procedures, the op-eration was coded according to the main procedure, whichwas determined from a priority list that was constructed bysurgeons from the general surgical department. We preferredthis method over the statistical determination of the longestprocedure from single procedure cases,13 because we ob-served that a number of procedures were never performed inisolation. Team characteristics were the total of the ages ofthe surgical team as a measure of combined experience, age ofthe youngest and oldest surgeon, the number of surgeons,and the ages and number of anesthesiologists.
Patient characteristics were age and sex, the number ofadmissions to the hospital before the operation, and thelength of the current hospital admission. For patients whowere operated before 2001, additional data were available onthe presence or absence of the following cardiovascular riskfactors: diabetes, hypercholesterolemia, hypertension, his-tory of heart failure, history of cerebrovascular accident, his-tory of chronic obstructive pulmonary disease, history ofrenal insufficiency, and history of coronary artery disease.12
Body mass index (kg/m2) of the patient was known in 1,491(8.6%) of the operations, as assessed during a previous study.
Prediction by the SurgeonBefore each operation, the surgeon’s prediction of the totalsurgical time was routinely registered in the database andused for planning the operation. In an internal evaluation in2002, it became evident that the time planned in this waysystematically underestimated the total OR time, becauseanesthetic time was not taken into account. Starting in 2004,a computerized planning system was used, providing the sur-geon with the mean duration of previous operations of thesame type. Surgeons made a subjective adjustment when nec-essary, which was used in planning. We assessed whether thisplanning system had improved the accuracy by comparingthe pre-2004 with the 2004–2005 data. For further analysis,the bias in the surgeon’s estimates in the pre-2004 data wereremoved by adding to it the median deviation between thisestimate and the actual OR time.
Recoding of the OperationsThe operation and team characteristics were entered in thedatabase after finishing the operation as they had turned outto be and not as they had been intended preoperatively. Someoperations evolve differently than initially intended andplanned. Examples are oncological operations with curative
42 Predicting Surgical Operating Room Times
Anesthesiology, V 112 • No 1 • January 2010 Eijkemans et al.

intent: the patient may seem to be inoperable only during theoperation. This may lead to less procedures being performedthan those intended and shorter OR time than what is typicalfor such an operation. Further, operations that are plannedlaparoscopically may be changed to an open procedure dur-ing the operation. Finally, in case of complications during anoperation, an experienced surgeon may be called in, who isafterward added to the list of surgeons performing the oper-ation. This makes the data unsuited for prediction modeling,where only factors that are preoperatively known may betaken into account. Two of the authors (M.J.C.E. and G.K.)have gone through the list of operations, recoding when nec-essary the postoperative code as entered in the database to thepreoperative code that was most likely initially planned andadjusting the number of procedures and the number of sur-geons to the usual number for each specific operation. Pro-cedure codes that had been changed over time, in particular,the coding for laparoscopic procedures, were reassigned to aunique coding. The recoded data were used in all subsequentanalysis.
StatisticsWe used imputation of missing data, as this is recommendedas less biased than dropping cases with missing values whendeveloping multivariable models.14 The multiple imputa-tion technique, implemented by Harrell’s AregImpute func-tion in the Hmisc library in Splus, was used to properlyadjust standard errors and confidence intervals after imputa-tion. Linear mixed modeling was used to build the predictionmodel, with the logarithm of the total OR time as the depen-dent variable. The 253-level variable indicating the type ofoperation was used as a random effect; all other variables wereanalyzed as fixed effects. From the random effects part of themixed model, one can calculate empirical Bayes estimates,which are equivalent to the Bayesian estimates obtained bythe method of Dexter et al.15 This approach allows for theinclusion of very infrequent operations, even operations thathave been performed only once. The total OR time variablewas log transformed because of its right skewness16 and be-cause the log-normal distribution fits better to the data ofmultiple procedure operations.13 First, a base model was fit-ted, containing only the type of operation as a random effect.As a screening step before further model building, the non-linearity of the association between the continuous predictorvariables and the log (total OR time) was assessed by fitting arestricted cubic spline function, with knots at the 5th, 35th,65th, and 95th percentiles of the predictor’s distribution, asan extension to the base model. In this way, learning-curve-like nonlinear patterns, e.g., for the ages of the surgeons, maybe detected and incorporated into the prediction model, us-ing only two extra parameters in the model.17 In the follow-ing step, a test for interaction between the predictor and thetype of operation was performed to assess whether the effectof the predictor depended on the type of operation. To keepthis analysis manageable, we tested for interaction with acondensed version of the operation code into 40 categories,
corresponding to the organ or anatomical site involved. Forexample, when testing for interaction between type of oper-ation and number of surgeons, we entered the operation codein 253 categories; the main effect of number of surgeons andthe interaction between the number of surgeons and thecondensed code was entered in 40 categories.
The surgeon’s estimate and the operation, team, and pa-tient characteristics were subsequently added to the model,and the improvement in predictive ability was assessed, usingthe nonlinear patterns and interactions when statistically andclinically significant. Selection of variables was applied con-servatively to minimize the risk of over fitting: all predictorswith a univariable P � 0.30 were included into the model.18
The predictive ability of the resulting extended models wasexpressed as a percentage of variation in log (OR time) that isexplained by the model and measured by the model’s ad-justed R2. To quantify the improvement in comparison withthe base model, the gain in R2 of the extended model wasexpressed as a percentage relative to the variation left unex-plained by the base model: (R2
model � R2base)/(1 � R2
base).The final model contained the type of operation as a randomeffect and the surgeon’s estimate together with operation,team, and patient characteristics as fixed effects. The modelpredictions on the log (OR time) were back transformed tothe original time scale, applying a correction for back-trans-formation bias, a smearing factor computed as the meanvalue of the exponentiated residuals of the model.19
To assess the potential impact of using the final model inplanning, we split the data according to the date in 2004 atwhich the planning was changed from the surgeon’s estimateof operative time to the surgeon’s estimate based on the meanduration of all previous operations of the same kind. Thepre-2004 data were used to reestimate the final predictionmodel, which was subsequently used to predict the durationsof operations from 2004 onward. The difference between theobserved and predicted OR times was assessed and comparedwith the difference between the observed and the actually
Fig. 1. Difference between the surgeon’s preoperative estimate ofoperative time (expected) and the postoperatively observed sessionduration (observed), against calendar time. Data of 17,412 opera-tions of 253 different types.
43PERIOPERATIVE MEDICINE
Eijkemans et al. Anesthesiology, V 112 • No 1 • January 2010
planned durations. Analyses were performed with S-plus 7.0(Insightful Corp, Seattle, WA).
ResultsThere were 11,243 operations consisting of one surgical pro-cedure, 3,580 of two surgical procedures, 1,289 of threesurgical procedures, and 1,300 operations of four or more
surgical procedures (see table, Supplemental Digital Content1, which shows the list of operations, together with theirfrequency of occurrence and descriptive statistics of theirduration, http://links.lww.com/ALN/A560). The OR timesshow considerable variation between operations withthe median ranging from 42.5 to 504 min. The coefficient ofvariation illustrates that the variability within the same type
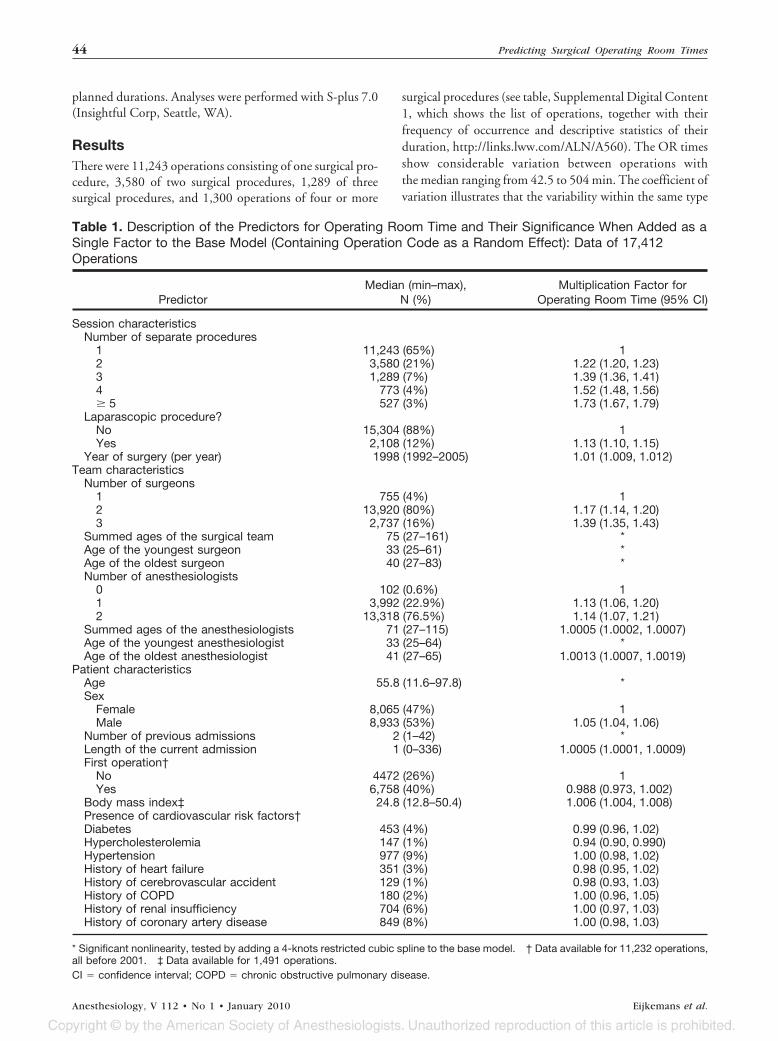
Table 1. Description of the Predictors for Operating Room Time and Their Significance When Added as aSingle Factor to the Base Model (Containing Operation Code as a Random Effect): Data of 17,412Operations
PredictorMedian (min–max),
N (%)Multiplication Factor for
Operating Room Time (95% CI)
Session characteristicsNumber of separate procedures
1 11,243 (65%) 12 3,580 (21%) 1.22 (1.20, 1.23)3 1,289 (7%) 1.39 (1.36, 1.41)4 773 (4%) 1.52 (1.48, 1.56)� 5 527 (3%) 1.73 (1.67, 1.79)
Laparascopic procedure?No 15,304 (88%) 1Yes 2,108 (12%) 1.13 (1.10, 1.15)
Year of surgery (per year) 1998 (1992–2005) 1.01 (1.009, 1.012)Team characteristics
Number of surgeons1 755 (4%) 12 13,920 (80%) 1.17 (1.14, 1.20)3 2,737 (16%) 1.39 (1.35, 1.43)
Summed ages of the surgical team 75 (27–161) *Age of the youngest surgeon 33 (25–61) *Age of the oldest surgeon 40 (27–83) *Number of anesthesiologists
0 102 (0.6%) 11 3,992 (22.9%) 1.13 (1.06, 1.20)2 13,318 (76.5%) 1.14 (1.07, 1.21)
Summed ages of the anesthesiologists 71 (27–115) 1.0005 (1.0002, 1.0007)Age of the youngest anesthesiologist 33 (25–64) *Age of the oldest anesthesiologist 41 (27–65) 1.0013 (1.0007, 1.0019)
Patient characteristicsAge 55.8 (11.6–97.8) *Sex
Female 8,065 (47%) 1Male 8,933 (53%) 1.05 (1.04, 1.06)
Number of previous admissions 2 (1–42) *Length of the current admission 1 (0–336) 1.0005 (1.0001, 1.0009)First operation†
No 4472 (26%) 1Yes 6,758 (40%) 0.988 (0.973, 1.002)
Body mass index‡ 24.8 (12.8–50.4) 1.006 (1.004, 1.008)Presence of cardiovascular risk factors†Diabetes 453 (4%) 0.99 (0.96, 1.02)Hypercholesterolemia 147 (1%) 0.94 (0.90, 0.990)Hypertension 977 (9%) 1.00 (0.98, 1.02)History of heart failure 351 (3%) 0.98 (0.95, 1.02)History of cerebrovascular accident 129 (1%) 0.98 (0.93, 1.03)History of COPD 180 (2%) 1.00 (0.96, 1.05)History of renal insufficiency 704 (6%) 1.00 (0.97, 1.03)History of coronary artery disease 849 (8%) 1.00 (0.98, 1.03)
* Significant nonlinearity, tested by adding a 4-knots restricted cubic spline to the base model. † Data available for 11,232 operations,all before 2001. ‡ Data available for 1,491 operations.CI � confidence interval; COPD � chronic obstructive pulmonary disease.
44 Predicting Surgical Operating Room Times
Anesthesiology, V 112 • No 1 • January 2010 Eijkemans et al.

of operation may also be considerable. The operation withthe highest consistency in duration was nervous system—sympathectomy thoracal (coefficient of variation � 0.12),whereas trachea—tracheotomy—had the relatively most un-predictable duration (coefficient of variation � 0.95). Afteraccounting for the operation code (the base model), the pre-dicted OR time had a 95% prediction interval with relative
bounds between 0.52 and 1.91. For any specific operation,this implies that the OR time may be from nearly half as shortup to almost twice as long as the median for that operation.
The historical pattern in the difference between the sur-geon’s expectation of operative time and the observed totalOR time is depicted in figure 1. A systematic underestima-tion is evident until 2004; the median difference was 31 min.
Age of the youngest surgeon (years)
pred
icte
d to
tal O
pera
ting
Roo
m ti
me
(min
utes
)
25 30 35 40 45 50 55
9010
011
012
013
0
A
Age of the oldest surgeon (years)
pred
icte
d to
tal O
pera
ting
Roo
m ti
me
(min
utes
)
30 35 40 45 50 55 60 6590
100
110
120
130
B
Summed ages of surgeons (years)
pred
icte
d to
tal O
pera
ting
Roo
m ti
me
(min
utes
)
20 40 60 80 100 120 140 160
8010
012
014
018
0
C
Age of the youngest anestesiologist (years)
pred
icte
d to
tal O
pera
ting
Roo
m ti
me
(min
utes
)
20 30 40 50 60 70
9010
011
012
013
0
D
Age of the patient (years)
pred
icte
d to
tal O
pera
ting
Roo
m ti
me
(min
utes
)
0 20 40 60 80 100
9010
011
012
013
0
E
Number of previous hospital admissions
pred
icte
d to
tal O
pera
ting
Roo
m ti
me
(min
utes
)
0 5 10 15 20 25 30
9010
011
012
013
0
F
Fig. 2. Graphs of the significant nonlinear associations between predictor variables and the total operating room time. Assessment ofnonlinearity was performed with a 4-knot restricted cubic spline function, in a regression model for the log (session time) that already containedthe operation code as a predictive factor. Graphs are shown for (A) age of the youngest surgeon, (B) age of the oldest surgeon, (C) summedage of the surgeons, (D) age of the youngest anesthesiologist, (E) age of the patient, and (F) the number of previous hospital admissions. Dataof 17,412 operations of 253 different types.
45PERIOPERATIVE MEDICINE
Eijkemans et al. Anesthesiology, V 112 • No 1 • January 2010
The use of a computerized planning system providing thesurgeon with the mean of previous operations, introduced inplanning in 2004, clearly resulted in improved correspon-dence between expectations and observations. The bias per8 h of used OR time, as calculated per 4-week period, was onaverage 114 min (SD � 18) before 2004 and �2 min (SD �11) from 2004 onward.
Table 1 shows the operation, team, and patient character-istics in our study population. On average, patients were56-yr old, ranging from 11 to 98 yr, and the sex distributionwas about equal. The predictive effects of the characteristicson the log (total OR time) are also shown in table 1, inaddition to the significance of the nonlinearity in this asso-ciation, as tested by the spline function. Figure 2 shows thesix parameters that had a nonlinear association with the log(total OR time): age of the youngest surgeon, age of the oldestsurgeon, summed age of the surgeons, age of the youngest an-esthesiologist, patient’s age, and number of previous hospitaladmissions of the patient. Further, the predictive effects of fivevariables were different for different types of operation, accord-ing to tests for interaction: the age of the youngest surgeon,summed ages of the surgeons, age of the patient, number ofprevious hospital admissions, and length of the current admis-sion (all P � 0.0001). Most notably, for patients older than 60yr, operations seemed to last shorter with increasing age,whereas they lasted longer with increasing age for abdominalsurgery and for general vascular surgery.
Table 2 summarizes the contribution to the model of thepredictive factors. When the expected OR time (i.e., thesurgeon’s estimate) was added as a single factor to the basemodel, 76.4% of the variation was explained, an absoluteimprovement of 4.3%, corresponding to 15.3% of the vari-ation left unexplained by the base model. The next largestimprovement in adjusted R2 is due to the session character-istics (the number of separate procedures within the opera-tion, indicating the relative complexity of the operation andthe year of surgery), and lesser so the team characteristics.
Patient characteristics have only a limited influence. Themodel extension with session, team, and patient characteris-tics combined, explained 77.2% of the total variation or18.3% of the variation left unexplained by the base model.Finally, the model containing all factors, including the sur-geon’s estimate, explains almost 80% of the total variation inlog (OR times), which corresponds to 27.4% of the variationleft unexplained by the base model. For any specific opera-tion, the OR time predicted by the final model has a 95%prediction interval with relative bounds from 0.60 to 1.70.
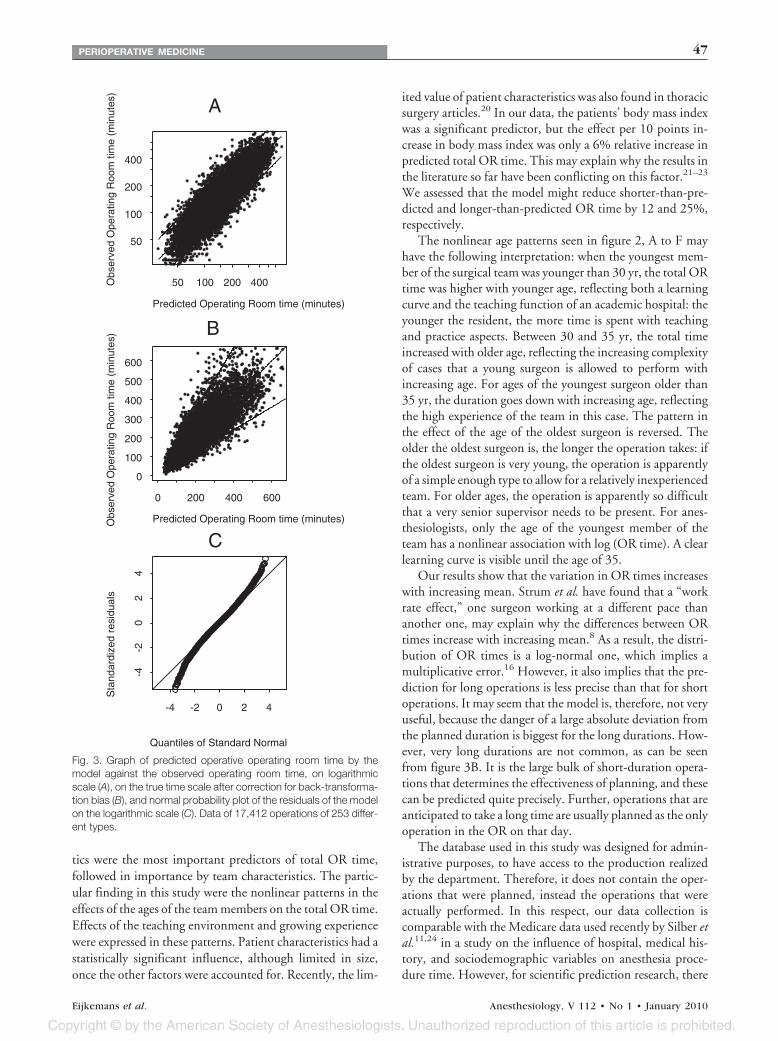
The goodness-of-fit of the model is shown graphically infigure 3A on the log-transformed scale. No substantial devi-ation from a symmetrical scatter around the regression line ispresent. Figure 3B shows the data on the original scale, wherea correction has been used for the back-transformation bias19
(smearing factor: 1.04). Figure 3C shows the correspondingnormal probability plot of the log-transformed data. Theresiduals of the model follow the diagonal line, except at thefar ends of the normal scale, beyond a quantile (or: z-score)of �2.
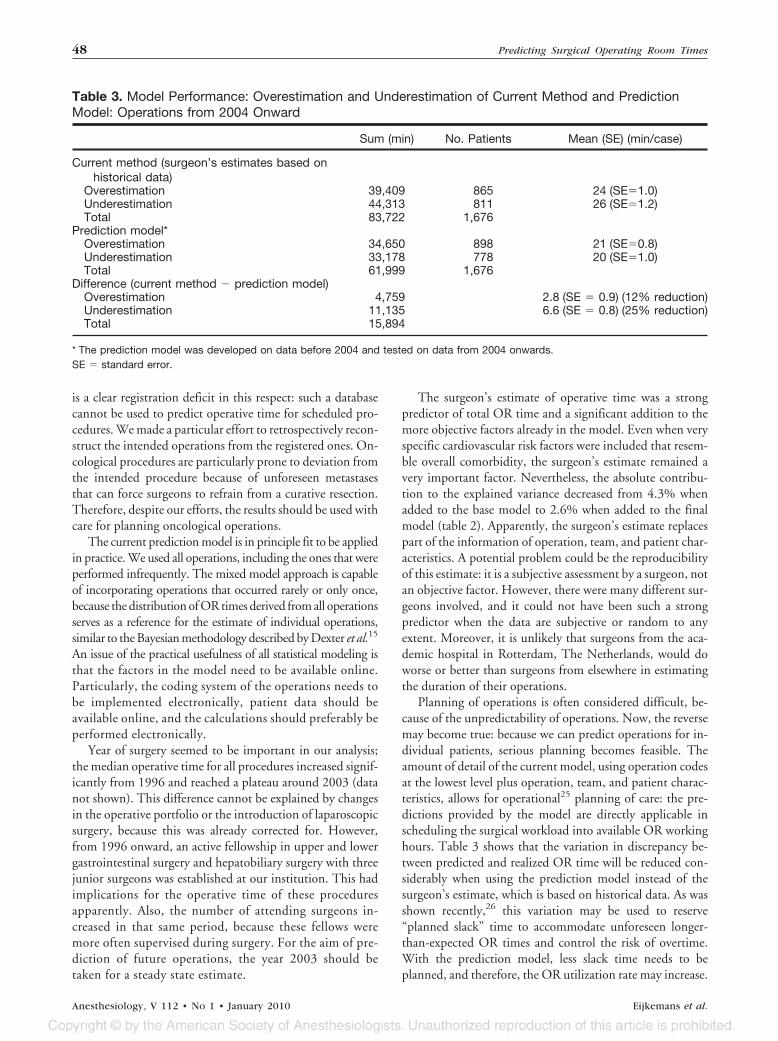
The potential added value of the model in daily planningis illustrated in table 3. The total amount of shorter-than-predicted and longer-than-predicted OR time is substan-tially reduced when using the model predictions, includingthe—bias corrected—surgeon’s estimate, instead of the sur-geon’s prediction based on historical data. The absolute re-duction was on average 2.8 and 6.6 min per case, correspond-ing to a relative reduction of 12 and 25%, respectively.
Discussion
We have studied the influence of operation, team, and pa-tient characteristics on the duration of operations from ageneral surgical department in an academic hospital, and wehave assessed whether the surgeon’s estimate had a predictiveeffect independent of the other factors. Given an individualoperation, the surgeon’s estimate and operation characteris-
Table 2. Predictive Models for Total Operative Session Time: Adjusted Model R2 of the Base ModelContaining Only the Operation Code and Subsequent Extensions*
Parameters in the ModelAdjusted R2
(%)†Adjusted R2 Gain, Relative to
the Base Model (%)‡
Base model 72.1 0� Expected operating room time§ 76.4 15.3� Session characteristics 75.6 12.3� Team characteristics 73.0 6.4� Patient characteristics 72.6 1.7� Session � team 76.8 16.9� Session � team � patient 77.2 18.3� Expected � session 78.4 22.7� Expected � session � team 79.4 26.0� Expected � session � team � patient 79.8 27.4
* Model extensions contain variables that had a univariable P value � 0.30 (from table 1). † Adjusted R2: R2 with adjustment for degreeof freedom, i.e., the number of free parameters, in the model. ‡ Adjusted R2 gain is defined as the part of the variance left unexplainedby the base model that is explained by the model of interest. The base model leaves 27.9% (� 100 � 72.1) of variance unexplained.The “� session characteristics” explains an additional 3.5% of total variation, which is 12.3% (�3.5/27.9) of the variance leftunexplained by the base model. § Subjective preoperative expectation of the surgeon of the operating room time.
46 Predicting Surgical Operating Room Times
Anesthesiology, V 112 • No 1 • January 2010 Eijkemans et al.
tics were the most important predictors of total OR time,followed in importance by team characteristics. The partic-ular finding in this study were the nonlinear patterns in theeffects of the ages of the team members on the total OR time.Effects of the teaching environment and growing experiencewere expressed in these patterns. Patient characteristics had astatistically significant influence, although limited in size,once the other factors were accounted for. Recently, the lim-
ited value of patient characteristics was also found in thoracicsurgery articles.20 In our data, the patients’ body mass indexwas a significant predictor, but the effect per 10 points in-crease in body mass index was only a 6% relative increase inpredicted total OR time. This may explain why the results inthe literature so far have been conflicting on this factor.21–23
We assessed that the model might reduce shorter-than-pre-dicted and longer-than-predicted OR time by 12 and 25%,respectively.
The nonlinear age patterns seen in figure 2, A to F mayhave the following interpretation: when the youngest mem-ber of the surgical team was younger than 30 yr, the total ORtime was higher with younger age, reflecting both a learningcurve and the teaching function of an academic hospital: theyounger the resident, the more time is spent with teachingand practice aspects. Between 30 and 35 yr, the total timeincreased with older age, reflecting the increasing complexityof cases that a young surgeon is allowed to perform withincreasing age. For ages of the youngest surgeon older than35 yr, the duration goes down with increasing age, reflectingthe high experience of the team in this case. The pattern inthe effect of the age of the oldest surgeon is reversed. Theolder the oldest surgeon is, the longer the operation takes: ifthe oldest surgeon is very young, the operation is apparentlyof a simple enough type to allow for a relatively inexperiencedteam. For older ages, the operation is apparently so difficultthat a very senior supervisor needs to be present. For anes-thesiologists, only the age of the youngest member of theteam has a nonlinear association with log (OR time). A clearlearning curve is visible until the age of 35.
Our results show that the variation in OR times increaseswith increasing mean. Strum et al. have found that a “workrate effect,” one surgeon working at a different pace thananother one, may explain why the differences between ORtimes increase with increasing mean.8 As a result, the distri-bution of OR times is a log-normal one, which implies amultiplicative error.16 However, it also implies that the pre-diction for long operations is less precise than that for shortoperations. It may seem that the model is, therefore, not veryuseful, because the danger of a large absolute deviation fromthe planned duration is biggest for the long durations. How-ever, very long durations are not common, as can be seenfrom figure 3B. It is the large bulk of short-duration opera-tions that determines the effectiveness of planning, and thesecan be predicted quite precisely. Further, operations that areanticipated to take a long time are usually planned as the onlyoperation in the OR on that day.
The database used in this study was designed for admin-istrative purposes, to have access to the production realizedby the department. Therefore, it does not contain the oper-ations that were planned, instead the operations that wereactually performed. In this respect, our data collection iscomparable with the Medicare data used recently by Silber etal.11,24 in a study on the influence of hospital, medical his-tory, and sociodemographic variables on anesthesia proce-dure time. However, for scientific prediction research, there
Predicted Operating Room time (minutes)
Obs
erve
d O
pera
ting
Roo
m ti
me
(min
utes
)
50 100 200 400
50
100
200
400
A
Predicted Operating Room time (minutes)Obs
erve
d O
pera
ting
Roo
m ti
me
(min
utes
)
0 200 400 600
0
100
200
300
400
500
600
B
Quantiles of Standard Normal
Sta
ndar
dize
d re
sidu
als
-4 -2 0 2 4
-4-2
02
4
C
Fig. 3. Graph of predicted operative operating room time by themodel against the observed operating room time, on logarithmicscale (A), on the true time scale after correction for back-transforma-tion bias (B), and normal probability plot of the residuals of the modelon the logarithmic scale (C). Data of 17,412 operations of 253 differ-ent types.
47PERIOPERATIVE MEDICINE
Eijkemans et al. Anesthesiology, V 112 • No 1 • January 2010
is a clear registration deficit in this respect: such a databasecannot be used to predict operative time for scheduled pro-cedures. We made a particular effort to retrospectively recon-struct the intended operations from the registered ones. On-cological procedures are particularly prone to deviation fromthe intended procedure because of unforeseen metastasesthat can force surgeons to refrain from a curative resection.Therefore, despite our efforts, the results should be used withcare for planning oncological operations.
The current prediction model is in principle fit to be appliedin practice. We used all operations, including the ones that wereperformed infrequently. The mixed model approach is capableof incorporating operations that occurred rarely or only once,because the distribution of OR times derived from all operationsserves as a reference for the estimate of individual operations,similar to the Bayesian methodology described by Dexter et al.15
An issue of the practical usefulness of all statistical modeling isthat the factors in the model need to be available online.Particularly, the coding system of the operations needs tobe implemented electronically, patient data should beavailable online, and the calculations should preferably beperformed electronically.
Year of surgery seemed to be important in our analysis;the median operative time for all procedures increased signif-icantly from 1996 and reached a plateau around 2003 (datanot shown). This difference cannot be explained by changesin the operative portfolio or the introduction of laparoscopicsurgery, because this was already corrected for. However,from 1996 onward, an active fellowship in upper and lowergastrointestinal surgery and hepatobiliary surgery with threejunior surgeons was established at our institution. This hadimplications for the operative time of these proceduresapparently. Also, the number of attending surgeons in-creased in that same period, because these fellows weremore often supervised during surgery. For the aim of pre-diction of future operations, the year 2003 should betaken for a steady state estimate.
The surgeon’s estimate of operative time was a strongpredictor of total OR time and a significant addition to themore objective factors already in the model. Even when veryspecific cardiovascular risk factors were included that resem-ble overall comorbidity, the surgeon’s estimate remained avery important factor. Nevertheless, the absolute contribu-tion to the explained variance decreased from 4.3% whenadded to the base model to 2.6% when added to the finalmodel (table 2). Apparently, the surgeon’s estimate replacespart of the information of operation, team, and patient char-acteristics. A potential problem could be the reproducibilityof this estimate: it is a subjective assessment by a surgeon, notan objective factor. However, there were many different sur-geons involved, and it could not have been such a strongpredictor when the data are subjective or random to anyextent. Moreover, it is unlikely that surgeons from the aca-demic hospital in Rotterdam, The Netherlands, would doworse or better than surgeons from elsewhere in estimatingthe duration of their operations.
Planning of operations is often considered difficult, be-cause of the unpredictability of operations. Now, the reversemay become true: because we can predict operations for in-dividual patients, serious planning becomes feasible. Theamount of detail of the current model, using operation codesat the lowest level plus operation, team, and patient charac-teristics, allows for operational25 planning of care: the pre-dictions provided by the model are directly applicable inscheduling the surgical workload into available OR workinghours. Table 3 shows that the variation in discrepancy be-tween predicted and realized OR time will be reduced con-siderably when using the prediction model instead of thesurgeon’s estimate, which is based on historical data. As wasshown recently,26 this variation may be used to reserve“planned slack” time to accommodate unforeseen longer-than-expected OR times and control the risk of overtime.With the prediction model, less slack time needs to beplanned, and therefore, the OR utilization rate may increase.
Table 3. Model Performance: Overestimation and Underestimation of Current Method and PredictionModel: Operations from 2004 Onward
Sum (min) No. Patients Mean (SE) (min/case)
Current method (surgeon’s estimates based onhistorical data)
Overestimation 39,409 865 24 (SE�1.0)Underestimation 44,313 811 26 (SE�1.2)Total 83,722 1,676
Prediction model*Overestimation 34,650 898 21 (SE�0.8)Underestimation 33,178 778 20 (SE�1.0)Total 61,999 1,676
Difference (current method � prediction model)Overestimation 4,759 2.8 (SE � 0.9) (12% reduction)Underestimation 11,135 6.6 (SE � 0.8) (25% reduction)Total 15,894
* The prediction model was developed on data before 2004 and tested on data from 2004 onwards.SE � standard error.
48 Predicting Surgical Operating Room Times
Anesthesiology, V 112 • No 1 • January 2010 Eijkemans et al.
The risk of overtime is usually constrained by the hospitalboard and may be controlled by optimal planning of the startof the last operation relative to the end of the workday.27
Reduced variability may allow certain operations to bestarted on a day, which otherwise, without precise predic-tion, would run a too high risk of resulting in overtime.4 Notall anticipated gains will be realized in practice though, as ithas been shown that flexible planning on the day of surgery,moving cases and add-on cases, will minimize the impact ofuncertainty in case prediction on the amount of overtime.28
Previous studies on predictive factors for total OR timehad aims that were different from ours: Strum et al.8 devel-oped a regression model similar to our model, but applied itto only 40 procedure codes. Their aim was not to devise aprediction model but to assess the effect of surgeon and an-esthesiologist on surgical and on OR time, accounting forother predictive factors. A further difference was that theyfitted a separate model to each one of the 40 procedure codes.The analysis of Silber et al.,11 although very interesting froma methodological point, cannot be used for case predictionfor daily planning because of the administrative post hoc na-ture of their data. A recent study from Dexter et al.29 showedthat their Bayesian methodology15 may be used to estimatethe remaining time from an already ongoing case. Althoughit was not the aim of this study, we note that our mixedeffects model with its associated empirical Bayes estimatesmight also be used for this purpose.
We conclude that a prediction model could be developedcontaining detailed procedure codes and operation, team,and patient characteristics. The surgeon’s estimate togetherwith specific aspects of the operation and the experience ofthe surgical team are the best predictors of the OR time of agiven operation. Use of prediction models can improve theplanning of ORs.
References
1. Gordon T, Paul S, Lyles A, Fountain J: Surgical unit timeutilization review: Resource utilization and managementimplications. J Med Syst 1988; 12:169 –79
2. Young A: The empty theatre. BMJ 1990; 300:1288 –93. Eaton L: Trusts cancel 10% of operating theatre sessions.
BMJ 2002; 324:11744. Strum DP, Vargas LG, May JH, Bashein G: Surgical suite
utilization and capacity planning: A minimal cost analysismodel. J Med Syst 1997; 21:309 –22
5. Wright IH, Kooperberg C, Bonar BA, Bashein G: Statisticalmodeling to predict elective surgery time. Comparisonwith a computer scheduling system and surgeon-providedestimates ANESTHESIOLOGY 1996; 85:1235– 45
6. Zhou J, Dexter F, Macario A, Lubarsky DA: Relying solelyon historical surgical times to estimate accurately futuresurgical times is unlikely to reduce the average length oftime cases finish late. J Clin Anesth 1999; 11:601–5
7. Pandit JJ, Carey A: Estimating the duration of commonelective operations: Implications for operating list manage-ment. Anaesthesia 2006; 61:768 –76
8. Strum DP, Sampson AR, May JH, Vargas LG: Surgeon andtype of anesthesia predict variability in surgical proceduretimes. ANESTHESIOLOGY 2000; 92:1454 – 66
9. Ammori BJ, Larvin M, McMahon MJ: Elective laparoscopiccholecystectomy: Preoperative prediction of duration ofsurgery. Surg Endosc 2001; 15:297–300
10. Spangler WE, Strum DP, Vargas LG, May JH: Estimatingprocedure times for surgeries by determining locationparameters for the lognormal model. Health Care ManagSci 2004; 7:97–104
11. Silber JH, Rosenbaum PR, Zhang X, Even-Shoshan O: In-fluence of patient and hospital characteristics on anesthe-sia time in medicare patients undergoing general and or-thopedic surgery. ANESTHESIOLOGY 2007; 106:356 – 64
12. Boersma E, Kertai MD, Schouten O, Bax JJ, Noordzij P,Steyerberg EW, Schinkel AF, van Santen M, Simoons ML,Thomson IR, Klein J, van Urk H, Poldermans D: Perioper-ative cardiovascular mortality in noncardiac surgery: Vali-dation of the Lee cardiac risk index. Am J Med 2005;118:1134 – 41
13. Strum DP, May JH, Sampson AR, Vargas LG, Spangler WE:Estimating times of surgeries with two component proce-dures: Comparison of the lognormal and normal models.ANESTHESIOLOGY 2003; 98:232– 40
14. Harrell FE Jr, Lee KL, Mark DB: Multivariable prognosticmodels: Issues in developing models, evaluating assump-tions and adequacy, and measuring and reducing errors.Stat Med 1996; 15:361– 87
15. Dexter F, Ledolter J: Bayesian prediction bounds and com-parisons of operating room times even for procedureswith few or no historic data. ANESTHESIOLOGY 2005; 103:1259 – 67
16. Strum DP, May JH, Vargas LG: Modeling the uncertainty ofsurgical procedure times: Comparison of log-normal andnormal models. ANESTHESIOLOGY 2000; 92:1160 –7
17. Harrell FE Jr, Lee KL, Pollock BG: Regression models inclinical studies: Determining relationships between pre-dictors and response. J Natl Cancer Inst 1988; 80:1198 –202
18. Steyerberg EW, Eijkemans MJ, Habbema JD: Stepwise se-lection in small data sets: A simulation study of bias inlogistic regression analysis. J Clin Epidemiol 1999; 52:935– 42
19. Duan N: Smearing estimate: A nonparametric retransfor-mation method. J Am Stat Assoc 1983; 78:605–10
20. Dexter F, Dexter EU, Masursky D, Nussmeier NA: System-atic review of general thoracic surgery articles to identifypredictors of operating room case durations. Anesth Analg2008; 106:1232– 41
21. Dindo D, Muller MK, Weber M, Clavien PA: Obesity ingeneral elective surgery. Lancet 2003; 361:2032–5
22. Lee CT, Dunn RL, Chen BT, Joshi DP, Sheffield J, MontieJE: Impact of body mass index on radical cystectomy.J Urol 2004; 172:1281–5
23. Chang SS, Jacobs B, Wells N, Smith JA Jr, Cookson MS:Increased body mass index predicts increased blood lossduring radical cystectomy. J Urol 2004; 171:1077–9
24. Silber JH, Rosenbaum PR, Zhang X, Even-Shoshan O: Esti-mating anesthesia and surgical procedure times from medi-care anesthesia claims. ANESTHESIOLOGY 2007; 106:346 –55
25. Hax AC, Meal HC: Hierarchical Integration of ProductionPlanning and Scheduling. Amsterdam/New York, North-Holland/American Elsevier, 1975
26. Van Houdenhoven M, van Oostrum JM, Hans EW, WullinkG, Kazemier G: Improving operating room efficiency byapplying bin-packing and portfolio techniques to surgicalcase scheduling. Anesth Analg 2007; 105:707–14
27. Dexter F, Yue JC, Dow AJ: Predicting anesthesia times fordiagnostic and interventional radiological procedures.Anesth Analg 2006; 102:1491–500
28. Dexter F, Epstein RH, Traub RD, Xiao Y: Making manage-ment decisions on the day of surgery based on operatingroom efficiency and patient waiting times. ANESTHESIOLOGY
2004; 101:1444 –5329. Dexter F, Epstein RH, Lee JD, Ledolter J: Automatic updat-
ing of times remaining in surgical cases using bayesiananalysis of historical case duration data and “instant mes-saging” updates from anesthesia providers. Anesth Analg2009; 108:929 – 40
49PERIOPERATIVE MEDICINE
Eijkemans et al. Anesthesiology, V 112 • No 1 • January 2010
Related Documents