INTERNATIONAL JOURNAL OF MICROSIMULATION (2009) 2(2) 27-42 Predicting The Need For Aged Care Services At The Small Area Level: The CAREMOD Spatial Microsimulation Model Sharyn Lymer, Laurie Brown, Ann Harding and Mandy Yap University of Canberra ACT 2601 Australia; email: [email protected] ABSTRACT: Most industrialised societies face rapid population ageing over the next two decades, including sharp increases in the number of people aged 85 years and over. As a result, the supply of and demand for aged care services has assumed increasing policy prominence. The likely spatial distribution of the need for aged care services is critical for planners and policy makers. This article describes the development of a regional microsimulation model of the need for aged care in New South Wales, a state of Australia. It details the methods involved in reweighting the 1998 Survey of Disability, Ageing and Carers, a national level dataset, against the 2001 Census to produce synthetic small area estimates at the statistical local area level. Validation shows that survey variables not constrained in the weighting process can provide unreliable local estimates. A proposed solution to this problem is outlined, involving record cloning, value imputation and alignment. Indicative disability estimates arising from this process are then discussed. Key Words: Disability, ageing, spatial analysis, aged care, cloning; imputation; alignment; NATSEM INTRODUCTION In Australia, the very large baby boom cohort born in the aftermath of World War 2 will begin to reach 65 years of age from 2011 onwards, resulting in a sharp increase in the proportion of the population aged 65 plus during the subsequent 20 years. By 2021, there will be some 4.2 million ‗aged‘ Australians - 500,000 of whom will be aged 85 years and over (AIHW, 2002). The magnitude of this demographic shift has prompted several major government reports within Australia on the likely fiscal impacts and policy challenges associated with population ageing, the most recent being the second Intergenerational Report (Treasury, 2007). There is intense and widespread interest in the future socio-economic profile of the older population in Australia and the likely economic resources available to the ageing baby boomers (see, for example, the Myer Foundation Report (Allen Consulting Group, 2002) on aged care to 2020). While researchers differ in their assessment of the likely budgetary impact of population ageing, it is already clear that population ageing will place increased pressure upon the social security, health and aged care budgets. Older Australians will require access to services that support them in their later life and help alleviate or slow the health and disabling effects of ageing. In the face of projected longer life-spans — but life years not necessarily free from disability — two key issues are critical: who will pay for the care and support that will be demanded; and who will provide it? Australia has not previously had adequate strategic planning and decision-support tools for understanding the demand for care services by older Australians; the likely cost of such services; and the financial capacity of older Australians to bear a greater share of those costs. In addition, such forecasts have not been available at a detailed small area or regional level. Despite this, geographical and financial access to and equity in care services are key political considerations (AIHW, 2002; Allen Consulting Group, 2002). The issue of unequal distribution of care needs and funding of services across geographical areas has been a policy concern for some decades (Gibson et al., 2000). Access to care in regional Australia continues to be one of the most important areas of social policy, as there are already major concerns about difficulties in attracting medical and allied health professional staff to rural/remote areas and about lower service standards. Pressures placed on the overall health and aged care budgets by ever-increasing costs will limit the extent that special regional needs can be met in the future. These issues underline the need for more sophisticated databases and analytical tools that can be used to project the future need for services in rural/remote areas, as well as within the rest of Australia. During the past two decades, microsimulation models have revolutionised the quality of information about the distributional and revenue impacts of policy changes available to policy makers in industrialised countries. Microsimulation is a means of modelling real life events by simulating the actions of the individual units that make up the system where the events occur (Brown and Harding, 2005). Microsimulation models are based on microdata (i.e. ―low-level‖ population data) – typically the records of individuals from either a national sample survey conducted by a national Bureau of Statistics or large administrative databases (Brown and Harding, 2002). Being based on unit records, it is possible to examine the effects of policy changes for narrowly defined ranges of individuals or demographic groups (Creedy, 2001). Further, by avoiding data aggregation the models‘ databases mirror the heterogeneity in the population. Thus, microsimulation techniques bring a range of

Welcome message from author
This document is posted to help you gain knowledge. Please leave a comment to let me know what you think about it! Share it to your friends and learn new things together.
Transcript
INTERNATIONAL JOURNAL OF MICROSIMULATION (2009) 2(2) 27-42
Predicting The Need For Aged Care Services At The Small Area
Level: The CAREMOD Spatial Microsimulation Model Sharyn Lymer, Laurie Brown, Ann Harding and Mandy Yap University of Canberra ACT 2601 Australia; email: [email protected] ABSTRACT: Most industrialised societies face rapid population ageing over the next two decades, including sharp increases in the number of people aged 85 years and over. As a result, the supply of and
demand for aged care services has assumed increasing policy prominence. The likely spatial distribution of the need for aged care services is critical for planners and policy makers. This article describes the development of a regional microsimulation model of the need for aged care in New South Wales, a state of Australia. It details the methods involved in reweighting the 1998 Survey of Disability, Ageing and Carers, a national level dataset, against the 2001 Census to produce synthetic small area estimates at the statistical local area level. Validation shows that survey variables not constrained in the weighting process can provide unreliable local estimates. A proposed solution to this problem is outlined, involving
record cloning, value imputation and alignment. Indicative disability estimates arising from this process are then discussed. Key Words: Disability, ageing, spatial analysis, aged care, cloning; imputation; alignment; NATSEM
INTRODUCTION
In Australia, the very large baby boom cohort born in the aftermath of World War 2 will begin to reach 65 years of age from 2011 onwards, resulting in a sharp increase in the proportion of the population aged 65 plus during the subsequent 20 years. By 2021, there will be some
4.2 million ‗aged‘ Australians - 500,000 of whom will be aged 85 years and over (AIHW, 2002). The magnitude of this demographic shift has prompted several major government reports within Australia on the likely fiscal impacts and policy challenges associated with population ageing, the most recent being the second Intergenerational Report
(Treasury, 2007). There is intense and widespread interest in the future socio-economic profile of the older population in Australia and the likely economic resources available to the ageing baby boomers (see, for example, the Myer Foundation Report
(Allen Consulting Group, 2002) on aged care to 2020). While researchers differ in their assessment of the likely budgetary impact of population ageing, it is already clear that population ageing will place increased pressure upon the social security, health and aged care
budgets. Older Australians will require access to services that support them in their later life and help alleviate or slow the health and disabling effects of ageing. In the face of projected longer
life-spans — but life years not necessarily free from disability — two key issues are critical: who will pay for the care and support that will be
demanded; and who will provide it? Australia has not previously had adequate strategic planning and decision-support tools for understanding the demand for care services by older Australians; the likely cost of such services; and the financial capacity of older Australians to
bear a greater share of those costs. In addition, such forecasts have not been available at a detailed small area or regional level. Despite this,
geographical and financial access to and equity in care services are key political considerations (AIHW, 2002; Allen Consulting Group, 2002).
The issue of unequal distribution of care needs
and funding of services across geographical areas has been a policy concern for some decades (Gibson et al., 2000). Access to care in regional Australia continues to be one of the most important areas of social policy, as there are already major concerns about difficulties in attracting medical and allied health professional
staff to rural/remote areas and about lower service standards. Pressures placed on the overall health and aged care budgets by ever-increasing
costs will limit the extent that special regional needs can be met in the future. These issues underline the need for more sophisticated databases and analytical tools that can be used to
project the future need for services in rural/remote areas, as well as within the rest of Australia. During the past two decades, microsimulation models have revolutionised the quality of
information about the distributional and revenue impacts of policy changes available to policy makers in industrialised countries. Microsimulation is a means of modelling real life events by simulating the actions of the individual units that make up the system where the events occur (Brown and Harding, 2005). Microsimulation
models are based on microdata (i.e. ―low-level‖ population data) – typically the records of individuals from either a national sample survey conducted by a national Bureau of Statistics or large administrative databases (Brown and Harding, 2002). Being based on unit records, it is possible to examine the effects of policy changes
for narrowly defined ranges of individuals or demographic groups (Creedy, 2001). Further, by avoiding data aggregation the models‘ databases mirror the heterogeneity in the population. Thus, microsimulation techniques bring a range of
LYMER, BROWN, HARDING AND YAP Predicting the need for aged care: CAREMOD 28
benefits to social policy modelling, including the
ability to change a greater variety of parameters independently and the capacity to provide
considerably more accurate estimates and detailed projections of the distributional effects of changes. Two key strengths of microsimulation models are that: 1) they can replicate the complexity of the
policy structures, transfers, and settings; and 2) they can be used to forecast the outcomes of policy changes and ‗what if‘ scenarios (i.e. the counterfactual where the results describe what, under specified conditions, may happen to particular individuals and groups).
During the past few years the National Centre for Spatial and Economic Modelling (NATSEM) has been creating spatial microsimulation models, using small area estimation techniques to transform the national weights included by the Australian Bureau of Statistics (ABS) with the
1998-99 Household Expenditure Survey unit
record file into sets of weights for each small area in Australia, based on data from the 2001 Australian Population Census. This approach builds upon earlier work on spatial microsimulation that has occurred mainly in Europe (for examples see Huang and Williamson, 2001; Voas and
Williamson, 2000, Ballas and Clarke, 1999). At NATSEM these spatial microsimulation modelling techniques are used to reweight sample survey data to the Census data for Statistical Local Areas, thus creating a synthetic unit record file of households for every small area of interest (Chin et al., 2006; Chin and Harding, 2006b). The
characteristics of interest unavailable in the census but available in the survey are synthesised at small area level by utilising both data sources. Validation to date suggests that the method has
produced good estimates of housing stress, tax paid and poverty rates for each small area (Chin and Harding, 2006a; Chin et al., 2005).
Traditionally, microsimulation models have been used in tax and social security policy (for examples see Harding 1996; Gupta and Kapur 2000; Harding and Gupta 2007), and it has only been in more recent years that they have been
extended to the health and aged care fields (Gupta and Harding, 2007). Internationally, modelling of aged care systems has looked mainly at the fiscal implications of care provision, such as in the UK, where the CARESIM microsimulation model, at a national level, simulates long-term care charges by simulating the incomes and
assets of future cohorts of older people and their
ability to contribute towards care home fees or the costs of home-based care (Hancock et al., 2007). Earlier work in the UK, by Williamson, looked at regional aged care needs (1996) whilst, in Sweden, Lagergren (2007) constructed a simulation model to simulate the future needs of
long-term care of elderly persons. Within Australia, Access Economics has developed a microsimulation model of Residential Aged Care to consider policy implications. However this model does not consider those living in the community and does not have regional capacity. Access
Economics has a second model, which is a
dynamic cohort model, to look at the demand, supply and financing of aged care services.
CAREMOD is a static spatial microsimulation model designed to analyse the need for care amongst the aged population of New South Wales
(NSW), the largest state in Australia. The development of CAREMOD represents a further step in the attempt to develop reliable spatial microsimulation models for policy makers, involving the ‗regionalisation‘ of the ABS 1998 Survey of Disability, Aging and Carers (SDAC) (rather than the household expenditure survey, as
in earlier NATSEM work). It is the first model within Australia that looks at the potential regional need for aged care services and has the capacity to be developed into a model that also considers unmet need regionally.
The structure of the remainder of this paper is as
follows. First we introduce the construction of the base file underpinning CAREMOD. Then we explain how this base file is ‗regionalised‘ to create synthetic datasets for each Statistical Local Area in New South Wales. This is followed by an evaluation of the regionalised data generated.
Validation shows that survey variables not constrained in the weighting process can provide unreliable local estimates of disability. A proposed solution to this problem is outlined, involving record cloning, value imputation and alignment. Indicative estimates of need for care arising from this process are then discussed. Finally, we
summarise the limitations of our current approach, and review the key achievements of CAREMOD to-date.
THE CAREMOD BASE FILE
The version of CAREMOD reported in this paper is based on the confidentialised unit records file (CURF) from the 1998 Survey of Disability, Aging and Carers (SDAC), covering all Australia, which was combined with data from the 2001 Australian 2001 Census about NSW Statistical Local Areas.
The 1998 SDAC had a sample of just over 42,000 persons to represent the Australian population and a sample size of just over 10,000 persons from New South Wales. The ABS does not release state geographic information on a CURF, except through remote access data laboratory (RADL). Survey data via RADL is not of use for microsimulation as
it does not make available the unit records which
are required for microsimulation. Thus, all records from the 1998 SDAC CURF were used in the CAREMOD simulation, as the specific records for NSW could not be identified. The advantages offered by using SDAC as the base file were that it contained information about the aged population
living in non-private dwellings and about the disability status of the population living in private dwellings; it included a greater number of records of older people compared to other national surveys; and it provided greater information at a finer level of age groups in the older ages (such as
LYMER, BROWN, HARDING AND YAP Predicting the need for aged care: CAREMOD 29
85+ years). These features were regarded as
being of critical importance to the base data for a model for aged care.
The complete population of each region of New South Wales was modelled on the base file. The base file retained the person, income unit, family
and household structures present in the SDAC. Data on socio-demographic variables (such as age, sex and education), functional status (i.e. disability levels and core areas with restriction), and availability of informal care (i.e. family structure) were based on the SDAC records. Information about economic factors was obtained
from several sources. Income was based on the SDAC information, whilst wealth components were imputed from the Survey of Income and Housing Costs (SIHC) (for superannuation) and administrative data (for housing values). A representation of the structure of the CAREMOD
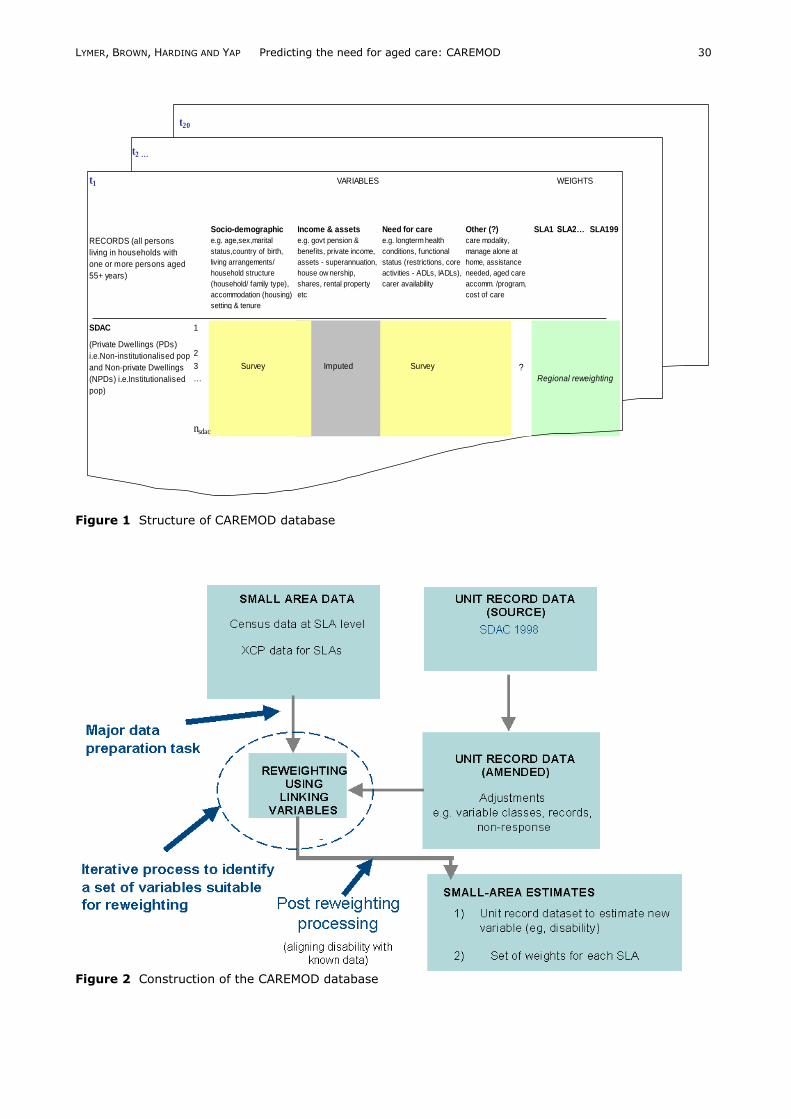
database is shown in Figure 1. Figure 2 provides
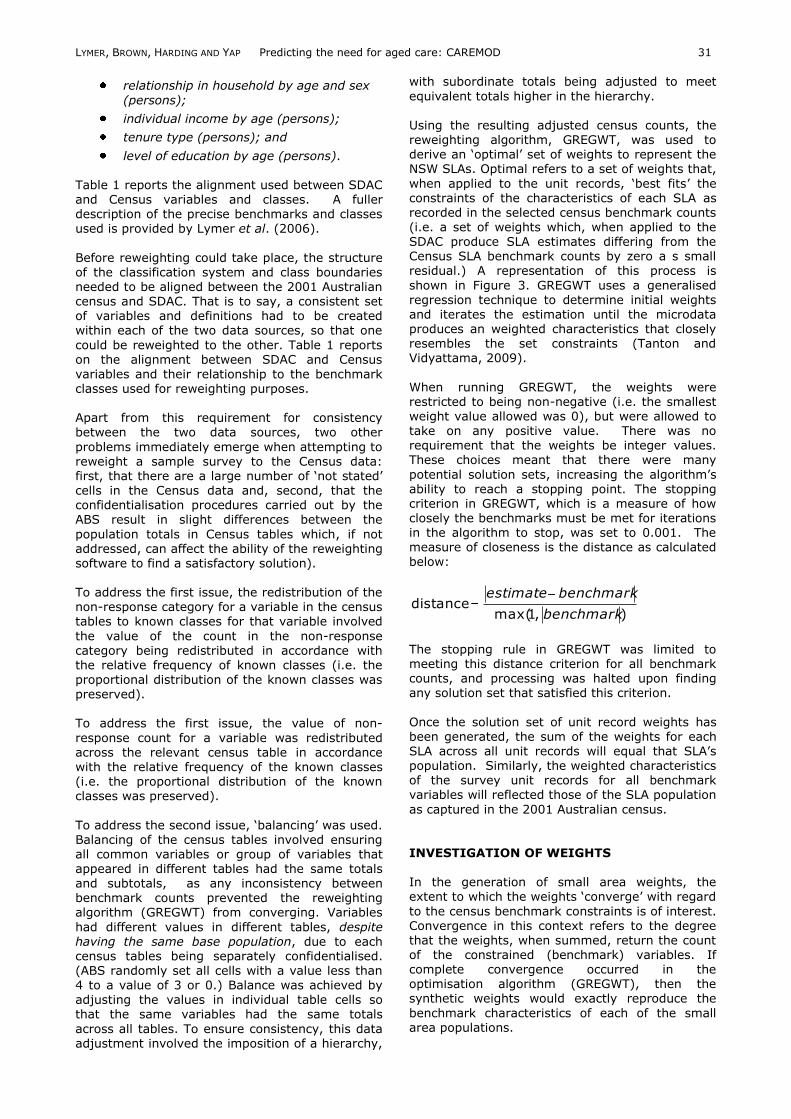
an overview of the process used to construct the database. A detailed discussion of the elements of this process is presented in the next section. REGIONALISATION
The generation of small area estimates was fundamental to the construction of CAREMOD. The 2001 Australian census provides detailed regional socio-demographic information. However, as is the nature of a census, it did not collect detailed information about any one specific topic but collected limited information over a wide
range of topics. Consequently, there was a lack of detailed data on health status, disability level,
expenditure and income at a regional level. In contrast, SDAC contained very detailed information about disability and ageing but is lacking with regard to detailed geographic information. A small sample from each geographic
area is taken to make up the complete SDAC sample so that, even if the location of the respondent was known, the calculation of direct estimates for SLAs would be unreliable due to large sampling error.
Small area estimates were produced by reweighting the SDAC unit record file for Australia, to create synthetic datasets for each Statistical Local Area (SLA) in NSW (the most populous state in Australia). A statistical local area is an administrative spatial unit based on the boundaries of incorporated bodies of local
government where these exist (ABS, 2001). In CAREMOD an iterative generalised regression algorithm was used to reweight the SDAC file. This method uses regression to determine an initial weight for the survey record and then iterates the regression until the difference between the
estimated benchmark and the actual benchmark for the area from the census are within a set limit, or a set number of iterations are made, at which time the iterations stop. The SDAC was reweighted against a range of benchmarks
(including age, sex, relationship in household,
tenure type, income and education) using tables from the 2001 Australian census. These
benchmarks were selected from the set of variables common to both the SDAC and the 2001 Australian census. The reweighting variables were limited to those that were felt to adequately
represent the socio-economic attributes of each SLA and address the main issues of concern – namely, the drivers of the need for care and the income and assets of older Australians, particularly functional status, need and ability to pay for care in terms of their income and assets (either directly or by being strongly correlated).
From a search of the literature, it was found that socio-economic variables strongly related to the need for care included: age (Bridge et al., 2002; Wang et al., 2001 ; McCallum et al., 2003; Percival and Lloyd, 2000), income (Madge, 2000;
Allen Consulting Group, 2002), wealth (Madge,
2000; Allen Consulting Group, 2002), family composition (Comas-Herra et al., 2003), household type (McCallum et al., 2003; Comas-Herra et al. 2003), home ownership (Wang et al. 2001), gender (McCallum et al., 2003; Percival and Lloyd, 2000), mobility and transport (AIHW,
2002), concentration of aged in the region (DHA, 2003) and ethnic background (AIHW, 2003). Whilst these variables are not direct determinants of need for care they are proxy variables that have been found to be related to functional status. Using the 1998 SDAC, modelling was done to confirm which socioeconomic variables available
on both SDAC and census were most strongly related to functional status. Logistic regression was used in the modelling. It was found that age, income, education and birthplace (significant at
0.01 level) were strongly related to living in a non-private dwelling. Similarly, age, education, birthplace and income (significant at 0.01 level)
were strongly related to presence of moderate core areas restrictions. For reweighting purposes the structure of the classification system and class boundaries needed to be aligned between the 2001 Australian census
and SDAC. (That is, a consistent set of variables and definitions had to be created within each of the two data sources, so that one could be reweighted to the other.) As a result the number of benchmarks (census counts) available for use in the reweighting process was in part limited by the nature of the alignment achievable between the
census and SDAC. It was further limited by the
need to ensure convergence of the reweighting algorithm. (Too many benchmarks can lead to non-convergence.) The result was a compromise between including sufficient benchmark variables and cross tabulations to adequately address the issues of aged care, and still being able to achieve
convergence in the reweighting algorithm. Ultimately, 5 benchmarks tabulations were selected, which jointly covered 109 benchmark counts:
age by sex (persons);
LYMER, BROWN, HARDING AND YAP Predicting the need for aged care: CAREMOD 30
Figure 1 Structure of CAREMOD database
Figure 2 Construction of the CAREMOD database
t20
t2 …
t1 VARIABLES WEIGHTS
Socio-demographic Income & assets Need for care Other (?) SLA1
SLA2… SLA199
RECORDS (all persons
living in households with
one or more persons aged
55+ years)
e.g. age,sex,marital
status,country of birth,
living arrangements/
household structure
(household/ family type),
accommodation (housing)
setting & tenure
e.g. govt pension &
benefits, private income,
assets - superannuation,
house ow nership,
shares, rental property
etc
e.g. longterm health
conditions, functional
status (restrictions, core
activities - ADLs, IADLs),
carer availability
care modality,
manage alone at
home, assistance
needed, aged care
accomm. /program,
cost of care
SDAC 1
2
3 Survey Imputed Survey
…
nsdac
Regional reweighting
(Private Dwellings (PDs)
i.e.Non-institutionalised pop
and Non-private Dwellings
(NPDs) i.e.Institutionalised
pop)
?
LYMER, BROWN, HARDING AND YAP Predicting the need for aged care: CAREMOD 31
relationship in household by age and sex
(persons);
individual income by age (persons);
tenure type (persons); and
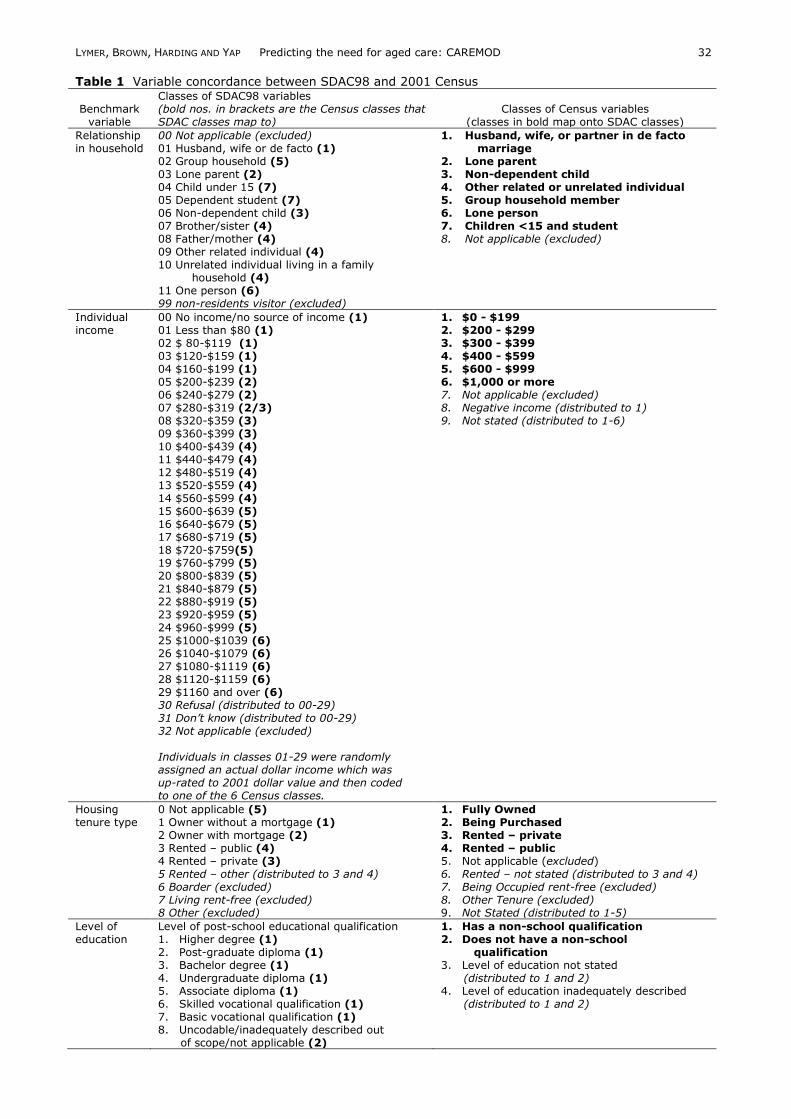
level of education by age (persons). Table 1 reports the alignment used between SDAC and Census variables and classes. A fuller description of the precise benchmarks and classes used is provided by Lymer et al. (2006).
Before reweighting could take place, the structure of the classification system and class boundaries needed to be aligned between the 2001 Australian census and SDAC. That is to say, a consistent set of variables and definitions had to be created within each of the two data sources, so that one
could be reweighted to the other. Table 1 reports on the alignment between SDAC and Census
variables and their relationship to the benchmark classes used for reweighting purposes. Apart from this requirement for consistency between the two data sources, two other
problems immediately emerge when attempting to reweight a sample survey to the Census data: first, that there are a large number of ‗not stated‘ cells in the Census data and, second, that the confidentialisation procedures carried out by the ABS result in slight differences between the
population totals in Census tables which, if not addressed, can affect the ability of the reweighting software to find a satisfactory solution). To address the first issue, the redistribution of the non-response category for a variable in the census tables to known classes for that variable involved
the value of the count in the non-response category being redistributed in accordance with the relative frequency of known classes (i.e. the proportional distribution of the known classes was preserved). To address the first issue, the value of non-
response count for a variable was redistributed across the relevant census table in accordance with the relative frequency of the known classes (i.e. the proportional distribution of the known classes was preserved).
To address the second issue, ‗balancing‘ was used. Balancing of the census tables involved ensuring all common variables or group of variables that appeared in different tables had the same totals
and subtotals, as any inconsistency between benchmark counts prevented the reweighting algorithm (GREGWT) from converging. Variables
had different values in different tables, despite having the same base population, due to each census tables being separately confidentialised. (ABS randomly set all cells with a value less than 4 to a value of 3 or 0.) Balance was achieved by adjusting the values in individual table cells so that the same variables had the same totals
across all tables. To ensure consistency, this data adjustment involved the imposition of a hierarchy,
with subordinate totals being adjusted to meet
equivalent totals higher in the hierarchy.
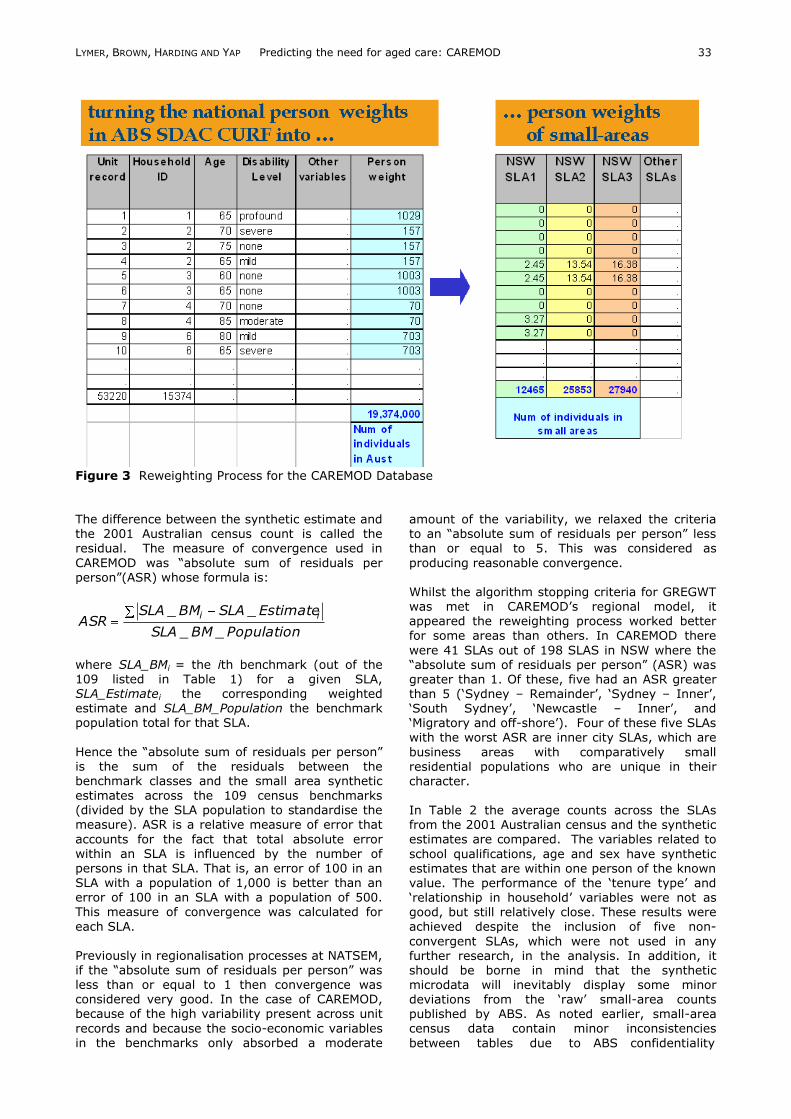
Using the resulting adjusted census counts, the reweighting algorithm, GREGWT, was used to derive an ‗optimal‘ set of weights to represent the NSW SLAs. Optimal refers to a set of weights that,
when applied to the unit records, ‗best fits‘ the constraints of the characteristics of each SLA as recorded in the selected census benchmark counts (i.e. a set of weights which, when applied to the SDAC produce SLA estimates differing from the Census SLA benchmark counts by zero a s small residual.) A representation of this process is
shown in Figure 3. GREGWT uses a generalised regression technique to determine initial weights and iterates the estimation until the microdata produces an weighted characteristics that closely resembles the set constraints (Tanton and Vidyattama, 2009).
When running GREGWT, the weights were restricted to being non-negative (i.e. the smallest weight value allowed was 0), but were allowed to take on any positive value. There was no requirement that the weights be integer values. These choices meant that there were many
potential solution sets, increasing the algorithm‘s ability to reach a stopping point. The stopping criterion in GREGWT, which is a measure of how closely the benchmarks must be met for iterations in the algorithm to stop, was set to 0.001. The measure of closeness is the distance as calculated below:
),1max(distance
benchmark
benchmarkestimate
The stopping rule in GREGWT was limited to meeting this distance criterion for all benchmark counts, and processing was halted upon finding any solution set that satisfied this criterion.
Once the solution set of unit record weights has been generated, the sum of the weights for each SLA across all unit records will equal that SLA‘s population. Similarly, the weighted characteristics of the survey unit records for all benchmark variables will reflected those of the SLA population
as captured in the 2001 Australian census. INVESTIGATION OF WEIGHTS
In the generation of small area weights, the extent to which the weights ‗converge‘ with regard
to the census benchmark constraints is of interest. Convergence in this context refers to the degree that the weights, when summed, return the count of the constrained (benchmark) variables. If complete convergence occurred in the optimisation algorithm (GREGWT), then the synthetic weights would exactly reproduce the
benchmark characteristics of each of the small area populations.
LYMER, BROWN, HARDING AND YAP Predicting the need for aged care: CAREMOD 32
Table 1 Variable concordance between SDAC98 and 2001 Census
Benchmark variable
Classes of SDAC98 variables (bold nos. in brackets are the Census classes that SDAC classes map to)
Classes of Census variables (classes in bold map onto SDAC classes)
Relationship in household
00 Not applicable (excluded) 01 Husband, wife or de facto (1) 02 Group household (5) 03 Lone parent (2) 04 Child under 15 (7) 05 Dependent student (7) 06 Non-dependent child (3) 07 Brother/sister (4) 08 Father/mother (4) 09 Other related individual (4) 10 Unrelated individual living in a family household (4) 11 One person (6) 99 non-residents visitor (excluded)
1. Husband, wife, or partner in de facto marriage 2. Lone parent 3. Non-dependent child 4. Other related or unrelated individual 5. Group household member 6. Lone person 7. Children <15 and student 8. Not applicable (excluded)
Individual income
00 No income/no source of income (1) 01 Less than $80 (1) 02 $ 80-$119 (1) 03 $120-$159 (1) 04 $160-$199 (1) 05 $200-$239 (2) 06 $240-$279 (2) 07 $280-$319 (2/3) 08 $320-$359 (3) 09 $360-$399 (3) 10 $400-$439 (4) 11 $440-$479 (4) 12 $480-$519 (4) 13 $520-$559 (4) 14 $560-$599 (4) 15 $600-$639 (5) 16 $640-$679 (5) 17 $680-$719 (5) 18 $720-$759(5) 19 $760-$799 (5) 20 $800-$839 (5) 21 $840-$879 (5) 22 $880-$919 (5) 23 $920-$959 (5) 24 $960-$999 (5) 25 $1000-$1039 (6) 26 $1040-$1079 (6) 27 $1080-$1119 (6) 28 $1120-$1159 (6) 29 $1160 and over (6) 30 Refusal (distributed to 00-29) 31 Don’t know (distributed to 00-29) 32 Not applicable (excluded) Individuals in classes 01-29 were randomly assigned an actual dollar income which was up-rated to 2001 dollar value and then coded to one of the 6 Census classes.
1. $0 - $199 2. $200 - $299 3. $300 - $399 4. $400 - $599 5. $600 - $999 6. $1,000 or more 7. Not applicable (excluded) 8. Negative income (distributed to 1) 9. Not stated (distributed to 1-6)
Housing tenure type
0 Not applicable (5) 1 Owner without a mortgage (1) 2 Owner with mortgage (2) 3 Rented – public (4) 4 Rented – private (3) 5 Rented – other (distributed to 3 and 4) 6 Boarder (excluded) 7 Living rent-free (excluded) 8 Other (excluded)
1. Fully Owned 2. Being Purchased 3. Rented – private 4. Rented – public 5. Not applicable (excluded) 6. Rented – not stated (distributed to 3 and 4) 7. Being Occupied rent-free (excluded) 8. Other Tenure (excluded) 9. Not Stated (distributed to 1-5)
Level of education
Level of post-school educational qualification 1. Higher degree (1) 2. Post-graduate diploma (1) 3. Bachelor degree (1) 4. Undergraduate diploma (1) 5. Associate diploma (1) 6. Skilled vocational qualification (1) 7. Basic vocational qualification (1) 8. Uncodable/inadequately described out of scope/not applicable (2)
1. Has a non-school qualification 2. Does not have a non-school qualification 3. Level of education not stated (distributed to 1 and 2) 4. Level of education inadequately described (distributed to 1 and 2)
LYMER, BROWN, HARDING AND YAP Predicting the need for aged care: CAREMOD 33
Figure 3 Reweighting Process for the CAREMOD Database The difference between the synthetic estimate and the 2001 Australian census count is called the residual. The measure of convergence used in
CAREMOD was ―absolute sum of residuals per person‖(ASR) whose formula is:
PopulationBMSLA
EstimateSLABMSLAASR
ii
__
__
where SLA_BMi = the ith benchmark (out of the 109 listed in Table 1) for a given SLA, SLA_Estimatei the corresponding weighted estimate and SLA_BM_Population the benchmark population total for that SLA.
Hence the ―absolute sum of residuals per person‖ is the sum of the residuals between the benchmark classes and the small area synthetic estimates across the 109 census benchmarks (divided by the SLA population to standardise the measure). ASR is a relative measure of error that
accounts for the fact that total absolute error within an SLA is influenced by the number of persons in that SLA. That is, an error of 100 in an
SLA with a population of 1,000 is better than an error of 100 in an SLA with a population of 500. This measure of convergence was calculated for
each SLA. Previously in regionalisation processes at NATSEM, if the ―absolute sum of residuals per person‖ was less than or equal to 1 then convergence was considered very good. In the case of CAREMOD, because of the high variability present across unit
records and because the socio-economic variables in the benchmarks only absorbed a moderate
amount of the variability, we relaxed the criteria to an ―absolute sum of residuals per person‖ less than or equal to 5. This was considered as
producing reasonable convergence. Whilst the algorithm stopping criteria for GREGWT was met in CAREMOD‘s regional model, it appeared the reweighting process worked better
for some areas than others. In CAREMOD there
were 41 SLAs out of 198 SLAS in NSW where the ―absolute sum of residuals per person‖ (ASR) was greater than 1. Of these, five had an ASR greater than 5 (‗Sydney – Remainder‘, ‗Sydney – Inner‘, ‗South Sydney‘, ‗Newcastle – Inner‘, and ‗Migratory and off-shore‘). Four of these five SLAs with the worst ASR are inner city SLAs, which are
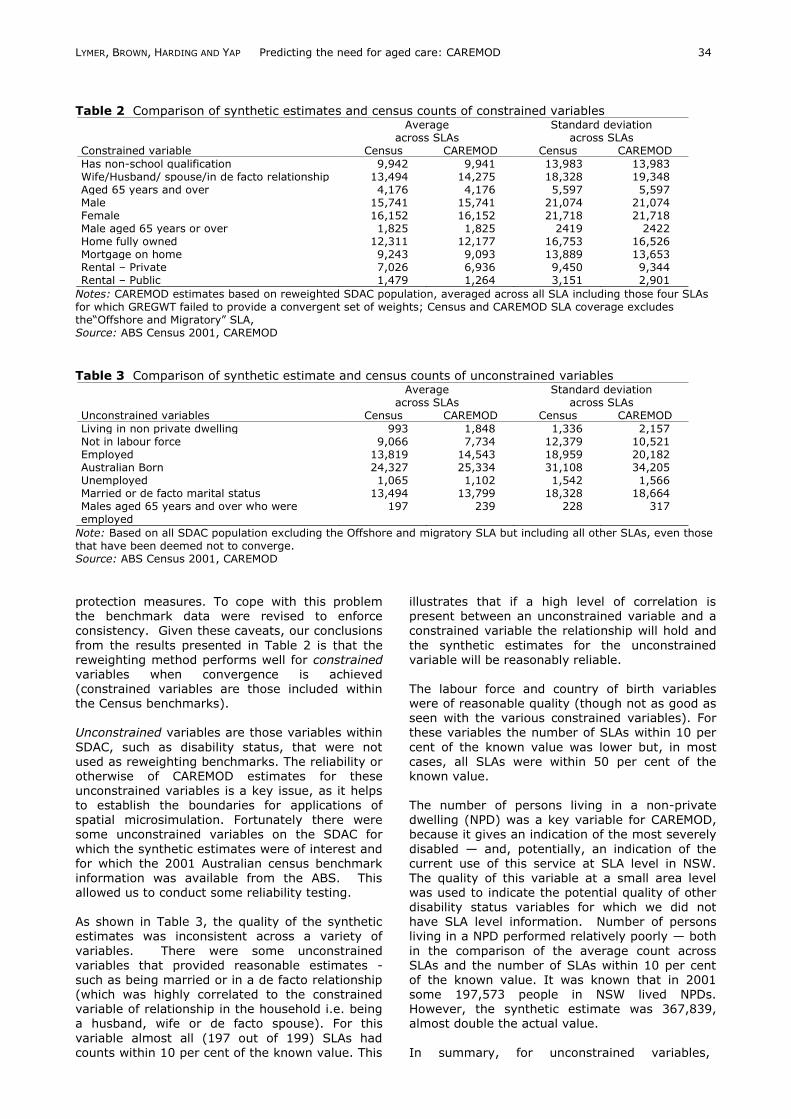
business areas with comparatively small residential populations who are unique in their character. In Table 2 the average counts across the SLAs from the 2001 Australian census and the synthetic estimates are compared. The variables related to
school qualifications, age and sex have synthetic estimates that are within one person of the known
value. The performance of the ‗tenure type‘ and ‗relationship in household‘ variables were not as good, but still relatively close. These results were achieved despite the inclusion of five non-
convergent SLAs, which were not used in any further research, in the analysis. In addition, it should be borne in mind that the synthetic microdata will inevitably display some minor deviations from the ‗raw‘ small-area counts published by ABS. As noted earlier, small-area census data contain minor inconsistencies
between tables due to ABS confidentiality
LYMER, BROWN, HARDING AND YAP Predicting the need for aged care: CAREMOD 34
Table 2 Comparison of synthetic estimates and census counts of constrained variables
Average across SLAs
Standard deviation across SLAs
Constrained variable Census CAREMOD Census CAREMOD
Has non-school qualification 9,942 9,941 13,983 13,983 Wife/Husband/ spouse/in de facto relationship 13,494 14,275 18,328 19,348 Aged 65 years and over 4,176 4,176 5,597 5,597 Male 15,741 15,741 21,074 21,074 Female 16,152 16,152 21,718 21,718 Male aged 65 years or over 1,825 1,825 2419 2422 Home fully owned 12,311 12,177 16,753 16,526 Mortgage on home 9,243 9,093 13,889 13,653 Rental – Private 7,026 6,936 9,450 9,344 Rental – Public 1,479 1,264 3,151 2,901
Notes: CAREMOD estimates based on reweighted SDAC population, averaged across all SLA including those four SLAs for which GREGWT failed to provide a convergent set of weights; Census and CAREMOD SLA coverage excludes the―Offshore and Migratory‖ SLA, Source: ABS Census 2001, CAREMOD
Table 3 Comparison of synthetic estimate and census counts of unconstrained variables
Average across SLAs
Standard deviation across SLAs
Unconstrained variables Census CAREMOD Census CAREMOD
Living in non private dwelling 993 1,848 1,336 2,157 Not in labour force 9,066 7,734 12,379 10,521 Employed 13,819 14,543 18,959 20,182 Australian Born 24,327 25,334 31,108 34,205 Unemployed 1,065 1,102 1,542 1,566 Married or de facto marital status 13,494 13,799 18,328 18,664 Males aged 65 years and over who were employed
197 239 228 317
Note: Based on all SDAC population excluding the Offshore and migratory SLA but including all other SLAs, even those that have been deemed not to converge. Source: ABS Census 2001, CAREMOD protection measures. To cope with this problem the benchmark data were revised to enforce
consistency. Given these caveats, our conclusions
from the results presented in Table 2 is that the reweighting method performs well for constrained variables when convergence is achieved (constrained variables are those included within the Census benchmarks). Unconstrained variables are those variables within
SDAC, such as disability status, that were not used as reweighting benchmarks. The reliability or otherwise of CAREMOD estimates for these unconstrained variables is a key issue, as it helps to establish the boundaries for applications of spatial microsimulation. Fortunately there were some unconstrained variables on the SDAC for
which the synthetic estimates were of interest and for which the 2001 Australian census benchmark
information was available from the ABS. This allowed us to conduct some reliability testing. As shown in Table 3, the quality of the synthetic estimates was inconsistent across a variety of
variables. There were some unconstrained variables that provided reasonable estimates - such as being married or in a de facto relationship (which was highly correlated to the constrained variable of relationship in the household i.e. being a husband, wife or de facto spouse). For this
variable almost all (197 out of 199) SLAs had counts within 10 per cent of the known value. This
illustrates that if a high level of correlation is present between an unconstrained variable and a
constrained variable the relationship will hold and
the synthetic estimates for the unconstrained variable will be reasonably reliable. The labour force and country of birth variables were of reasonable quality (though not as good as seen with the various constrained variables). For these variables the number of SLAs within 10 per
cent of the known value was lower but, in most cases, all SLAs were within 50 per cent of the known value. The number of persons living in a non-private dwelling (NPD) was a key variable for CAREMOD, because it gives an indication of the most severely
disabled — and, potentially, an indication of the current use of this service at SLA level in NSW.
The quality of this variable at a small area level was used to indicate the potential quality of other disability status variables for which we did not have SLA level information. Number of persons living in a NPD performed relatively poorly — both
in the comparison of the average count across SLAs and the number of SLAs within 10 per cent of the known value. It was known that in 2001 some 197,573 people in NSW lived NPDs. However, the synthetic estimate was 367,839, almost double the actual value.
In summary, for unconstrained variables,
LYMER, BROWN, HARDING AND YAP Predicting the need for aged care: CAREMOD 35
especially rare events such as the presence of a
disability, it was found that the reweighting had led to overestimation of the occurrence of the
event at the SLA level. A novel approach to addressing this problem is outlined in the following section.
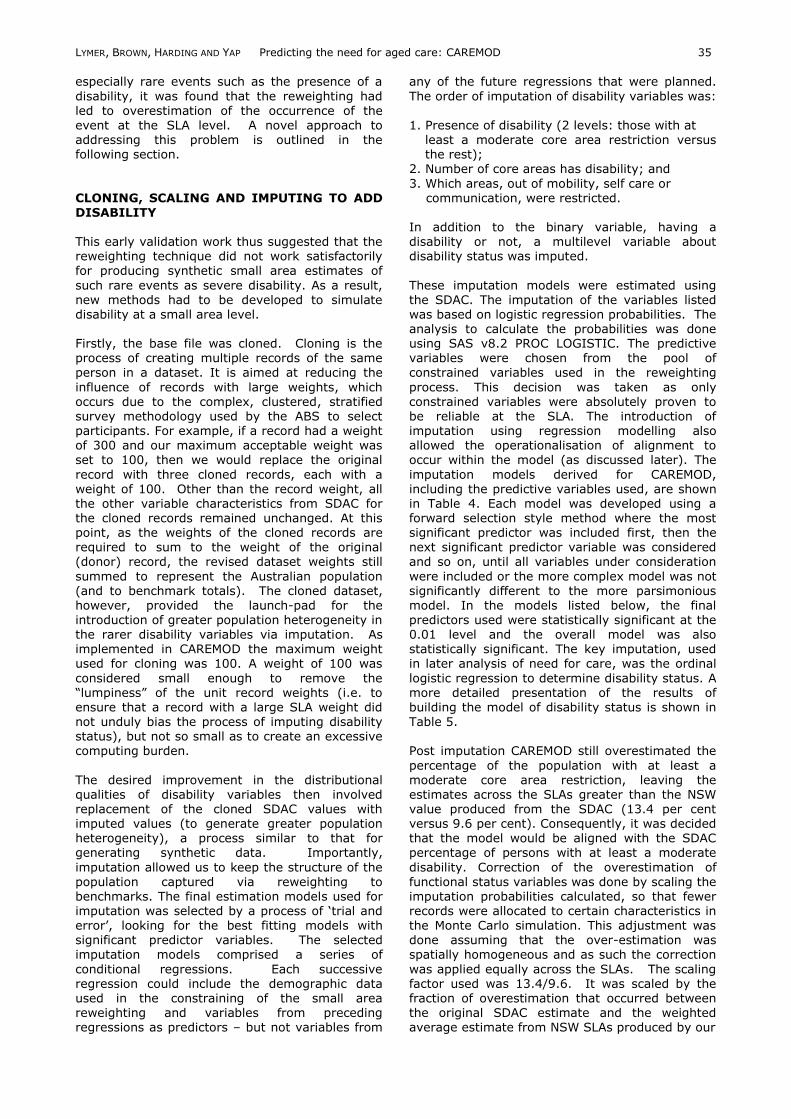
CLONING, SCALING AND IMPUTING TO ADD DISABILITY This early validation work thus suggested that the reweighting technique did not work satisfactorily for producing synthetic small area estimates of
such rare events as severe disability. As a result, new methods had to be developed to simulate disability at a small area level. Firstly, the base file was cloned. Cloning is the process of creating multiple records of the same
person in a dataset. It is aimed at reducing the
influence of records with large weights, which occurs due to the complex, clustered, stratified survey methodology used by the ABS to select participants. For example, if a record had a weight of 300 and our maximum acceptable weight was set to 100, then we would replace the original
record with three cloned records, each with a weight of 100. Other than the record weight, all the other variable characteristics from SDAC for the cloned records remained unchanged. At this point, as the weights of the cloned records are required to sum to the weight of the original (donor) record, the revised dataset weights still
summed to represent the Australian population (and to benchmark totals). The cloned dataset, however, provided the launch-pad for the introduction of greater population heterogeneity in
the rarer disability variables via imputation. As implemented in CAREMOD the maximum weight used for cloning was 100. A weight of 100 was
considered small enough to remove the ―lumpiness‖ of the unit record weights (i.e. to ensure that a record with a large SLA weight did not unduly bias the process of imputing disability status), but not so small as to create an excessive computing burden.
The desired improvement in the distributional qualities of disability variables then involved replacement of the cloned SDAC values with imputed values (to generate greater population heterogeneity), a process similar to that for generating synthetic data. Importantly,
imputation allowed us to keep the structure of the
population captured via reweighting to benchmarks. The final estimation models used for imputation was selected by a process of ‗trial and error‘, looking for the best fitting models with significant predictor variables. The selected imputation models comprised a series of
conditional regressions. Each successive regression could include the demographic data used in the constraining of the small area reweighting and variables from preceding regressions as predictors – but not variables from
any of the future regressions that were planned.
The order of imputation of disability variables was:
1. Presence of disability (2 levels: those with at least a moderate core area restriction versus the rest);
2. Number of core areas has disability; and
3. Which areas, out of mobility, self care or communication, were restricted. In addition to the binary variable, having a disability or not, a multilevel variable about disability status was imputed.
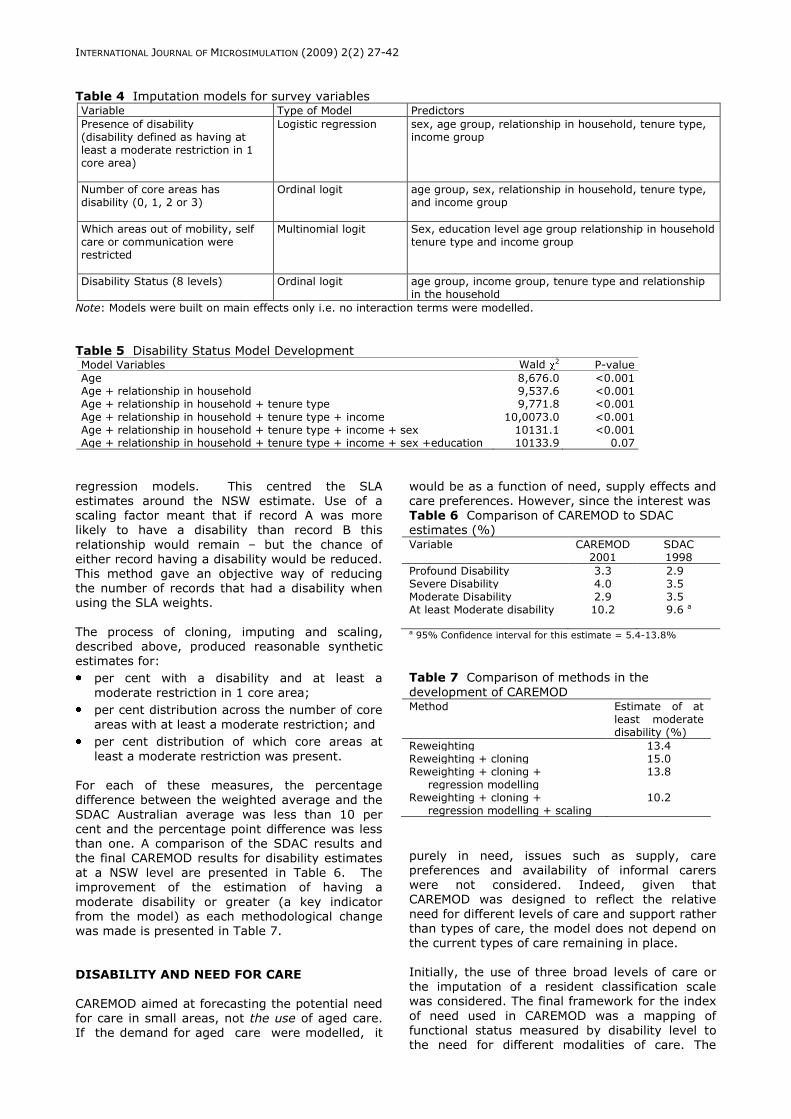
These imputation models were estimated using the SDAC. The imputation of the variables listed was based on logistic regression probabilities. The analysis to calculate the probabilities was done using SAS v8.2 PROC LOGISTIC. The predictive variables were chosen from the pool of
constrained variables used in the reweighting
process. This decision was taken as only constrained variables were absolutely proven to be reliable at the SLA. The introduction of imputation using regression modelling also allowed the operationalisation of alignment to occur within the model (as discussed later). The
imputation models derived for CAREMOD, including the predictive variables used, are shown in Table 4. Each model was developed using a forward selection style method where the most significant predictor was included first, then the next significant predictor variable was considered and so on, until all variables under consideration
were included or the more complex model was not significantly different to the more parsimonious model. In the models listed below, the final predictors used were statistically significant at the
0.01 level and the overall model was also statistically significant. The key imputation, used in later analysis of need for care, was the ordinal
logistic regression to determine disability status. A more detailed presentation of the results of building the model of disability status is shown in Table 5. Post imputation CAREMOD still overestimated the
percentage of the population with at least a moderate core area restriction, leaving the estimates across the SLAs greater than the NSW value produced from the SDAC (13.4 per cent versus 9.6 per cent). Consequently, it was decided that the model would be aligned with the SDAC percentage of persons with at least a moderate
disability. Correction of the overestimation of
functional status variables was done by scaling the imputation probabilities calculated, so that fewer records were allocated to certain characteristics in the Monte Carlo simulation. This adjustment was done assuming that the over-estimation was spatially homogeneous and as such the correction
was applied equally across the SLAs. The scaling factor used was 13.4/9.6. It was scaled by the fraction of overestimation that occurred between the original SDAC estimate and the weighted average estimate from NSW SLAs produced by our
INTERNATIONAL JOURNAL OF MICROSIMULATION (2009) 2(2) 27-42
Table 4 Imputation models for survey variables Variable Type of Model Predictors
Presence of disability (disability defined as having at least a moderate restriction in 1 core area)
Logistic regression sex, age group, relationship in household, tenure type, income group
Number of core areas has disability (0, 1, 2 or 3)
Ordinal logit age group, sex, relationship in household, tenure type, and income group
Which areas out of mobility, self care or communication were restricted
Multinomial logit Sex, education level age group relationship in household tenure type and income group
Disability Status (8 levels) Ordinal logit age group, income group, tenure type and relationship in the household
Note: Models were built on main effects only i.e. no interaction terms were modelled. Table 5 Disability Status Model Development Model Variables Wald 2 P-value
Age 8,676.0 <0.001 Age + relationship in household 9,537.6 <0.001 Age + relationship in household + tenure type 9,771.8 <0.001
Age + relationship in household + tenure type + income 10,0073.0 <0.001 Age + relationship in household + tenure type + income + sex 10131.1 <0.001 Age + relationship in household + tenure type + income + sex +education 10133.9 0.07
regression models. This centred the SLA estimates around the NSW estimate. Use of a scaling factor meant that if record A was more likely to have a disability than record B this
relationship would remain – but the chance of either record having a disability would be reduced. This method gave an objective way of reducing the number of records that had a disability when using the SLA weights.
The process of cloning, imputing and scaling, described above, produced reasonable synthetic estimates for:
per cent with a disability and at least a
moderate restriction in 1 core area;
per cent distribution across the number of core
areas with at least a moderate restriction; and
per cent distribution of which core areas at
least a moderate restriction was present. For each of these measures, the percentage difference between the weighted average and the
SDAC Australian average was less than 10 per cent and the percentage point difference was less than one. A comparison of the SDAC results and the final CAREMOD results for disability estimates
at a NSW level are presented in Table 6. The improvement of the estimation of having a
moderate disability or greater (a key indicator from the model) as each methodological change was made is presented in Table 7. DISABILITY AND NEED FOR CARE
CAREMOD aimed at forecasting the potential need for care in small areas, not the use of aged care. If the demand for aged care were modelled, it
would be as a function of need, supply effects and care preferences. However, since the interest was Table 6 Comparison of CAREMOD to SDAC estimates (%) Variable CAREMOD
2001 SDAC 1998
Profound Disability 3.3 2.9 a Severe Disability 4.0 3.5 a Moderate Disability 2.9 3.5 a At least Moderate disability 10.2 9.6 a
a 95% Confidence interval for this estimate = 5.4-13.8%
Table 7 Comparison of methods in the
development of CAREMOD Method Estimate of at
least moderate disability (%)
Reweighting 13.4 Reweighting + cloning 15.0 Reweighting + cloning + regression modelling
13.8
Reweighting + cloning + regression modelling + scaling
10.2
purely in need, issues such as supply, care preferences and availability of informal carers
were not considered. Indeed, given that CAREMOD was designed to reflect the relative
need for different levels of care and support rather than types of care, the model does not depend on the current types of care remaining in place. Initially, the use of three broad levels of care or the imputation of a resident classification scale was considered. The final framework for the index
of need used in CAREMOD was a mapping of functional status measured by disability level to the need for different modalities of care. The
LYMER, BROWN, HARDING AND YAP Predicting the need for aged care: CAREMOD 37
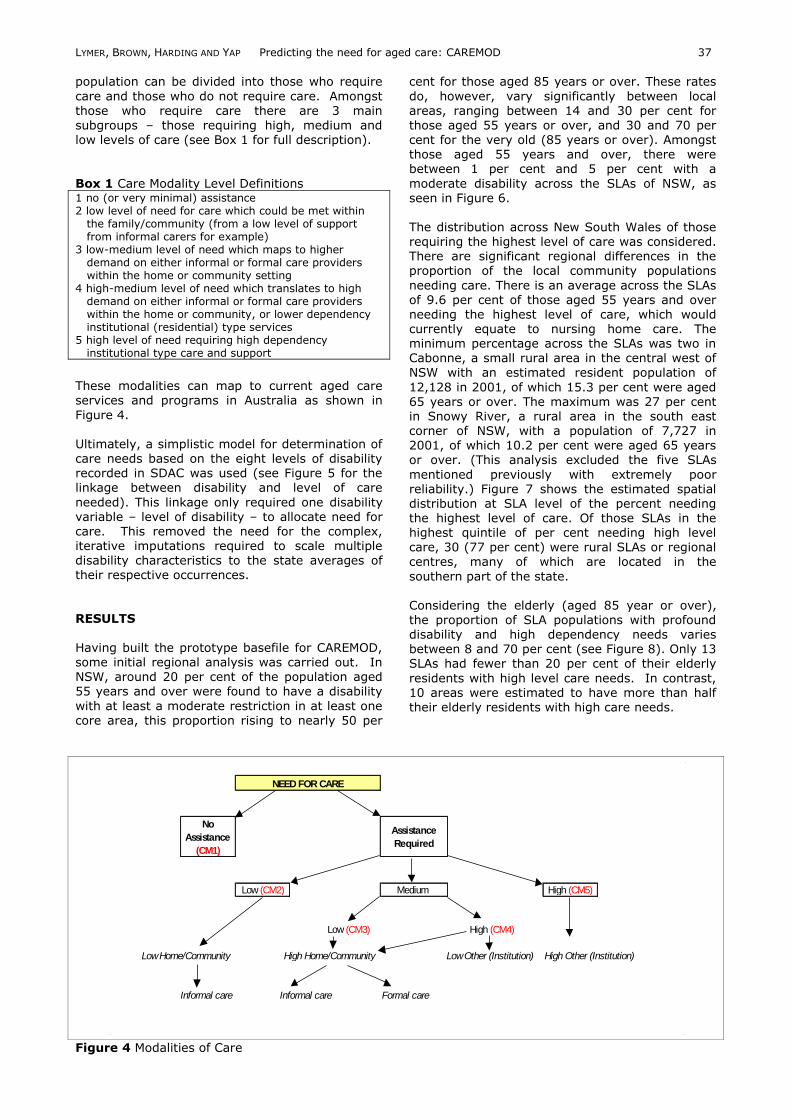
population can be divided into those who require
care and those who do not require care. Amongst those who require care there are 3 main
subgroups – those requiring high, medium and low levels of care (see Box 1 for full description).
Box 1 Care Modality Level Definitions 1 no (or very minimal) assistance 2 low level of need for care which could be met within
the family/community (from a low level of support from informal carers for example)
3 low-medium level of need which maps to higher demand on either informal or formal care providers within the home or community setting
4 high-medium level of need which translates to high demand on either informal or formal care providers within the home or community, or lower dependency institutional (residential) type services
5 high level of need requiring high dependency institutional type care and support
These modalities can map to current aged care services and programs in Australia as shown in
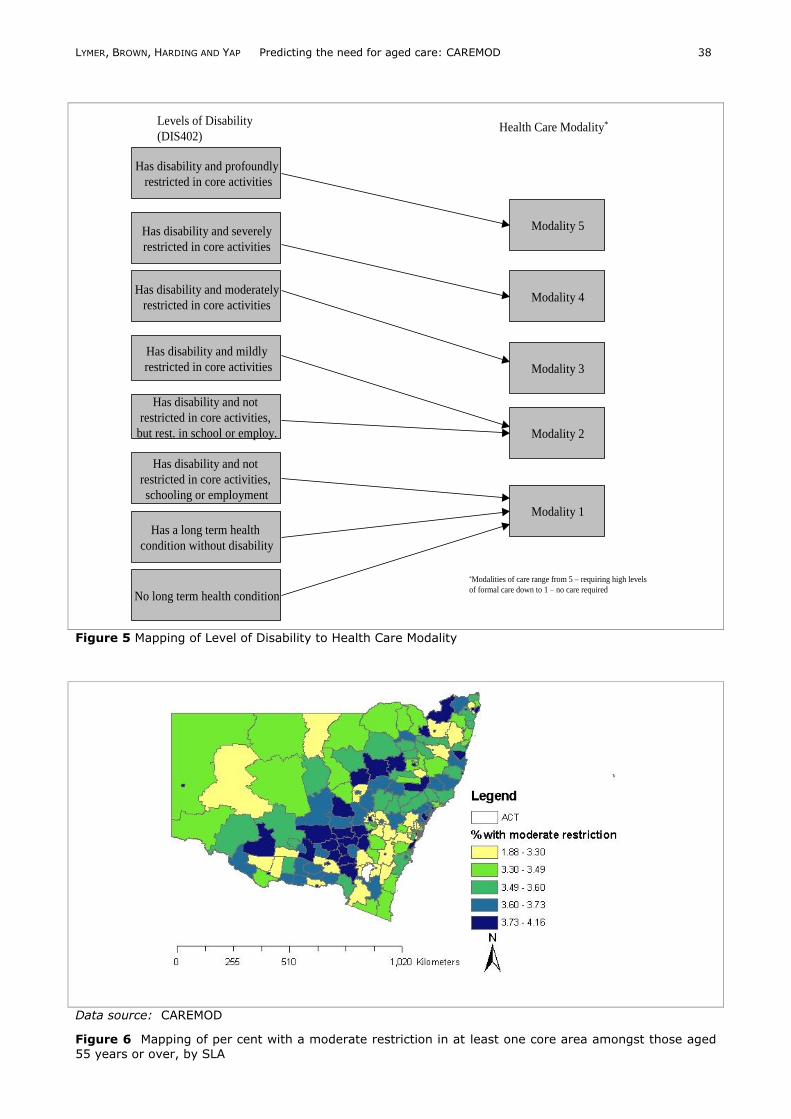
Figure 4. Ultimately, a simplistic model for determination of care needs based on the eight levels of disability recorded in SDAC was used (see Figure 5 for the linkage between disability and level of care
needed). This linkage only required one disability variable – level of disability – to allocate need for care. This removed the need for the complex, iterative imputations required to scale multiple disability characteristics to the state averages of their respective occurrences.
RESULTS
Having built the prototype basefile for CAREMOD, some initial regional analysis was carried out. In NSW, around 20 per cent of the population aged 55 years and over were found to have a disability
with at least a moderate restriction in at least one core area, this proportion rising to nearly 50 per
cent for those aged 85 years or over. These rates
do, however, vary significantly between local areas, ranging between 14 and 30 per cent for
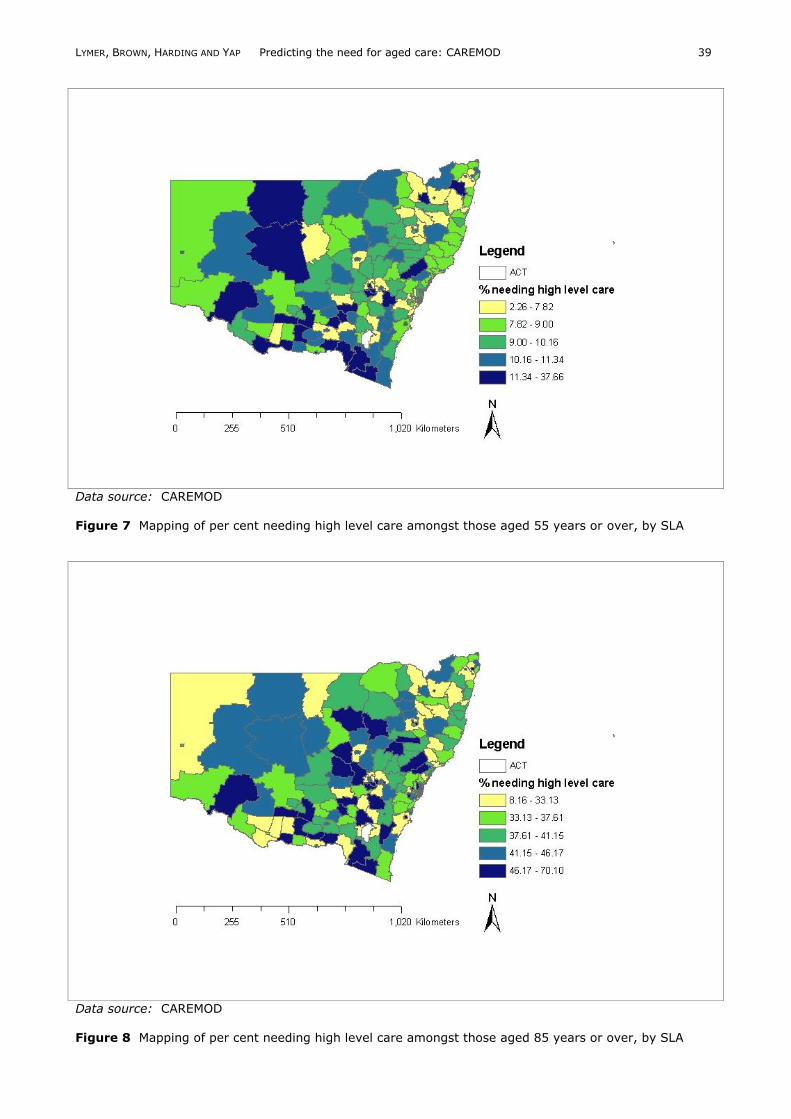
those aged 55 years or over, and 30 and 70 per cent for the very old (85 years or over). Amongst those aged 55 years and over, there were between 1 per cent and 5 per cent with a
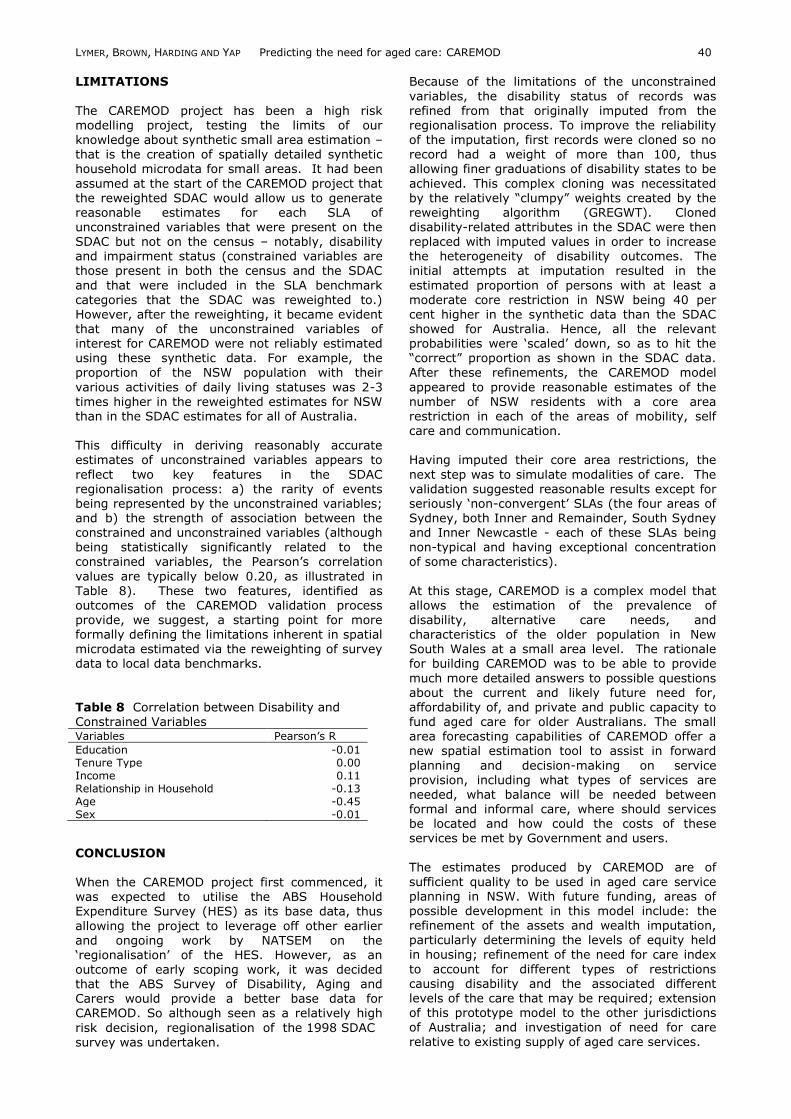
moderate disability across the SLAs of NSW, as seen in Figure 6. The distribution across New South Wales of those requiring the highest level of care was considered. There are significant regional differences in the proportion of the local community populations
needing care. There is an average across the SLAs of 9.6 per cent of those aged 55 years and over needing the highest level of care, which would currently equate to nursing home care. The minimum percentage across the SLAs was two in Cabonne, a small rural area in the central west of
NSW with an estimated resident population of
12,128 in 2001, of which 15.3 per cent were aged 65 years or over. The maximum was 27 per cent in Snowy River, a rural area in the south east corner of NSW, with a population of 7,727 in 2001, of which 10.2 per cent were aged 65 years or over. (This analysis excluded the five SLAs
mentioned previously with extremely poor reliability.) Figure 7 shows the estimated spatial distribution at SLA level of the percent needing the highest level of care. Of those SLAs in the highest quintile of per cent needing high level care, 30 (77 per cent) were rural SLAs or regional centres, many of which are located in the
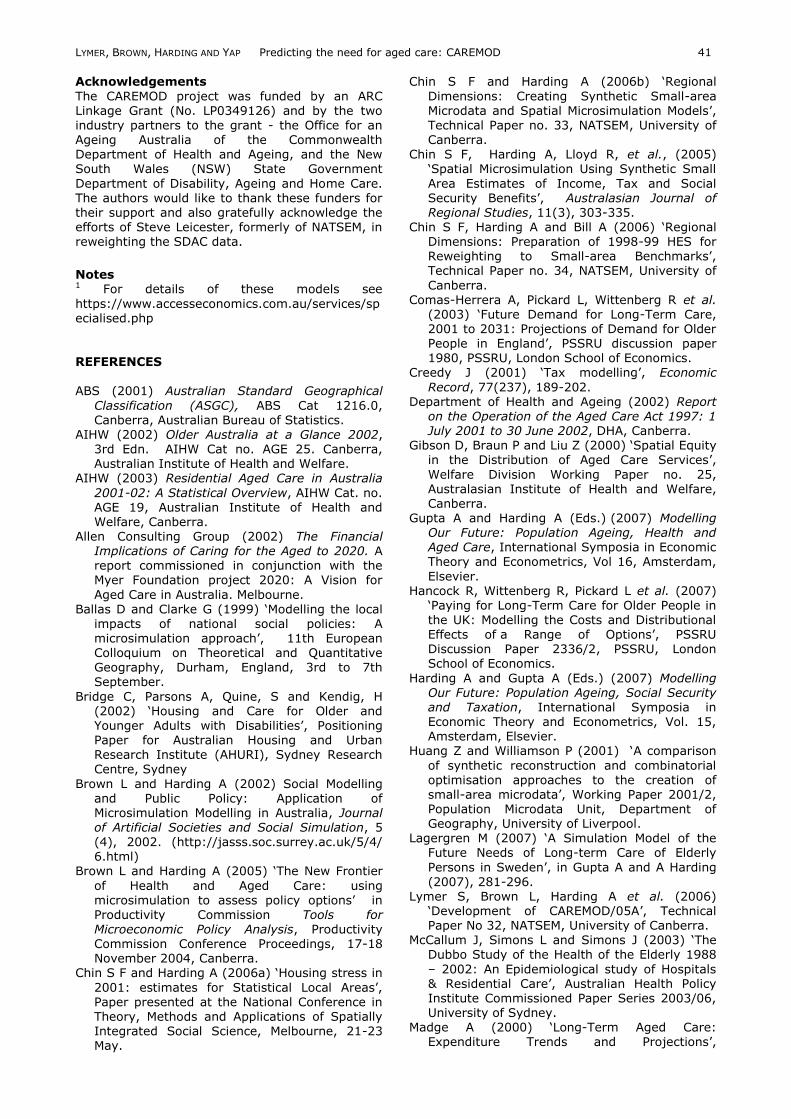
southern part of the state. Considering the elderly (aged 85 year or over), the proportion of SLA populations with profound
disability and high dependency needs varies between 8 and 70 per cent (see Figure 8). Only 13 SLAs had fewer than 20 per cent of their elderly
residents with high level care needs. In contrast, 10 areas were estimated to have more than half their elderly residents with high care needs.
Figure 4 Modalities of Care
No
Assistance
(CM1)
Assistance
Required
Low (CM2) Medium High (CM5)
Low (CM3) High (CM4)
High Other (Institution)
Informal care Informal care Formal care
NEED FOR CARE
Low Other (Institution)High Home/Community Low Home/Community
LYMER, BROWN, HARDING AND YAP Predicting the need for aged care: CAREMOD 38
Figure 5 Mapping of Level of Disability to Health Care Modality
Data source: CAREMOD
Figure 6 Mapping of per cent with a moderate restriction in at least one core area amongst those aged
55 years or over, by SLA
Has disability and profoundly
restricted in core activities
Has disability and severely
restricted in core activities
Has disability and moderately
restricted in core activities
Has disability and mildly
restricted in core activities
Has disability and not
restricted in core activities,
but rest. in school or employ.
Has disability and not
restricted in core activities,
schooling or employment
Has a long term health
condition without disability
No long term health condition
Levels of Disability
(DIS402)
Modality 5
Modality 4
Modality 3
Modality 2
Modality 1
Health Care Modality*
*Modalities of care range from 5 – requiring high levels
of formal care down to 1 – no care required
LYMER, BROWN, HARDING AND YAP Predicting the need for aged care: CAREMOD 39
Data source: CAREMOD Figure 7 Mapping of per cent needing high level care amongst those aged 55 years or over, by SLA
Data source: CAREMOD Figure 8 Mapping of per cent needing high level care amongst those aged 85 years or over, by SLA
LYMER, BROWN, HARDING AND YAP Predicting the need for aged care: CAREMOD 40
LIMITATIONS
The CAREMOD project has been a high risk
modelling project, testing the limits of our knowledge about synthetic small area estimation – that is the creation of spatially detailed synthetic household microdata for small areas. It had been
assumed at the start of the CAREMOD project that the reweighted SDAC would allow us to generate reasonable estimates for each SLA of unconstrained variables that were present on the SDAC but not on the census – notably, disability and impairment status (constrained variables are those present in both the census and the SDAC
and that were included in the SLA benchmark categories that the SDAC was reweighted to.) However, after the reweighting, it became evident that many of the unconstrained variables of interest for CAREMOD were not reliably estimated using these synthetic data. For example, the
proportion of the NSW population with their
various activities of daily living statuses was 2-3 times higher in the reweighted estimates for NSW than in the SDAC estimates for all of Australia. This difficulty in deriving reasonably accurate estimates of unconstrained variables appears to
reflect two key features in the SDAC regionalisation process: a) the rarity of events being represented by the unconstrained variables; and b) the strength of association between the constrained and unconstrained variables (although being statistically significantly related to the constrained variables, the Pearson‘s correlation
values are typically below 0.20, as illustrated in Table 8). These two features, identified as outcomes of the CAREMOD validation process provide, we suggest, a starting point for more
formally defining the limitations inherent in spatial microdata estimated via the reweighting of survey data to local data benchmarks.
Table 8 Correlation between Disability and Constrained Variables Variables Pearson‘s R
Education -0.01 Tenure Type 0.00 Income 0.11 Relationship in Household -0.13 Age -0.45 Sex -0.01
CONCLUSION
When the CAREMOD project first commenced, it was expected to utilise the ABS Household Expenditure Survey (HES) as its base data, thus
allowing the project to leverage off other earlier and ongoing work by NATSEM on the ‗regionalisation‘ of the HES. However, as an outcome of early scoping work, it was decided that the ABS Survey of Disability, Aging and Carers would provide a better base data for CAREMOD. So although seen as a relatively high
risk decision, regionalisation of the 1998 SDAC survey was undertaken.
Because of the limitations of the unconstrained
variables, the disability status of records was refined from that originally imputed from the
regionalisation process. To improve the reliability of the imputation, first records were cloned so no record had a weight of more than 100, thus allowing finer graduations of disability states to be
achieved. This complex cloning was necessitated by the relatively ―clumpy‖ weights created by the reweighting algorithm (GREGWT). Cloned disability-related attributes in the SDAC were then replaced with imputed values in order to increase the heterogeneity of disability outcomes. The initial attempts at imputation resulted in the
estimated proportion of persons with at least a moderate core restriction in NSW being 40 per cent higher in the synthetic data than the SDAC showed for Australia. Hence, all the relevant probabilities were ‗scaled‘ down, so as to hit the ―correct‖ proportion as shown in the SDAC data.
After these refinements, the CAREMOD model
appeared to provide reasonable estimates of the number of NSW residents with a core area restriction in each of the areas of mobility, self care and communication. Having imputed their core area restrictions, the
next step was to simulate modalities of care. The validation suggested reasonable results except for seriously ‗non-convergent‘ SLAs (the four areas of Sydney, both Inner and Remainder, South Sydney and Inner Newcastle - each of these SLAs being non-typical and having exceptional concentration of some characteristics).
At this stage, CAREMOD is a complex model that allows the estimation of the prevalence of disability, alternative care needs, and
characteristics of the older population in New South Wales at a small area level. The rationale for building CAREMOD was to be able to provide
much more detailed answers to possible questions about the current and likely future need for, affordability of, and private and public capacity to fund aged care for older Australians. The small area forecasting capabilities of CAREMOD offer a new spatial estimation tool to assist in forward
planning and decision-making on service provision, including what types of services are needed, what balance will be needed between formal and informal care, where should services be located and how could the costs of these services be met by Government and users.
The estimates produced by CAREMOD are of
sufficient quality to be used in aged care service planning in NSW. With future funding, areas of possible development in this model include: the refinement of the assets and wealth imputation, particularly determining the levels of equity held in housing; refinement of the need for care index
to account for different types of restrictions causing disability and the associated different levels of the care that may be required; extension of this prototype model to the other jurisdictions of Australia; and investigation of need for care relative to existing supply of aged care services.
LYMER, BROWN, HARDING AND YAP Predicting the need for aged care: CAREMOD 41
Acknowledgements
The CAREMOD project was funded by an ARC Linkage Grant (No. LP0349126) and by the two
industry partners to the grant - the Office for an Ageing Australia of the Commonwealth Department of Health and Ageing, and the New South Wales (NSW) State Government
Department of Disability, Ageing and Home Care. The authors would like to thank these funders for their support and also gratefully acknowledge the efforts of Steve Leicester, formerly of NATSEM, in reweighting the SDAC data.
Notes 1 For details of these models see
https://www.accesseconomics.com.au/services/specialised.php REFERENCES
ABS (2001) Australian Standard Geographical
Classification (ASGC), ABS Cat 1216.0, Canberra, Australian Bureau of Statistics.
AIHW (2002) Older Australia at a Glance 2002, 3rd Edn. AIHW Cat no. AGE 25. Canberra, Australian Institute of Health and Welfare.
AIHW (2003) Residential Aged Care in Australia
2001-02: A Statistical Overview, AIHW Cat. no. AGE 19, Australian Institute of Health and Welfare, Canberra.
Allen Consulting Group (2002) The Financial Implications of Caring for the Aged to 2020. A report commissioned in conjunction with the Myer Foundation project 2020: A Vision for
Aged Care in Australia. Melbourne. Ballas D and Clarke G (1999) ‗Modelling the local
impacts of national social policies: A microsimulation approach‘, 11th European Colloquium on Theoretical and Quantitative Geography, Durham, England, 3rd to 7th September.
Bridge C, Parsons A, Quine, S and Kendig, H (2002) ‗Housing and Care for Older and Younger Adults with Disabilities‘, Positioning Paper for Australian Housing and Urban Research Institute (AHURI), Sydney Research Centre, Sydney
Brown L and Harding A (2002) Social Modelling and Public Policy: Application of Microsimulation Modelling in Australia, Journal of Artificial Societies and Social Simulation, 5 (4), 2002. (http://jasss.soc.surrey.ac.uk/5/4/ 6.html)
Brown L and Harding A (2005) ‗The New Frontier
of Health and Aged Care: using microsimulation to assess policy options‘ in Productivity Commission Tools for Microeconomic Policy Analysis, Productivity Commission Conference Proceedings, 17-18 November 2004, Canberra.
Chin S F and Harding A (2006a) ‗Housing stress in
2001: estimates for Statistical Local Areas‘, Paper presented at the National Conference in Theory, Methods and Applications of Spatially Integrated Social Science, Melbourne, 21-23 May.
Chin S F and Harding A (2006b) ‗Regional
Dimensions: Creating Synthetic Small-area Microdata and Spatial Microsimulation Models‘,
Technical Paper no. 33, NATSEM, University of Canberra.
Chin S F, Harding A, Lloyd R, et al., (2005) ‗Spatial Microsimulation Using Synthetic Small
Area Estimates of Income, Tax and Social Security Benefits‘, Australasian Journal of Regional Studies, 11(3), 303-335.
Chin S F, Harding A and Bill A (2006) ‗Regional Dimensions: Preparation of 1998-99 HES for Reweighting to Small-area Benchmarks‘, Technical Paper no. 34, NATSEM, University of
Canberra. Comas-Herrera A, Pickard L, Wittenberg R et al.
(2003) ‗Future Demand for Long-Term Care, 2001 to 2031: Projections of Demand for Older People in England‘, PSSRU discussion paper 1980, PSSRU, London School of Economics.
Creedy J (2001) ‗Tax modelling‘, Economic
Record, 77(237), 189-202. Department of Health and Ageing (2002) Report
on the Operation of the Aged Care Act 1997: 1 July 2001 to 30 June 2002, DHA, Canberra.
Gibson D, Braun P and Liu Z (2000) ‗Spatial Equity in the Distribution of Aged Care Services‘,
Welfare Division Working Paper no. 25, Australasian Institute of Health and Welfare, Canberra.
Gupta A and Harding A (Eds.) (2007) Modelling Our Future: Population Ageing, Health and Aged Care, International Symposia in Economic Theory and Econometrics, Vol 16, Amsterdam,
Elsevier. Hancock R, Wittenberg R, Pickard L et al. (2007)
‗Paying for Long-Term Care for Older People in the UK: Modelling the Costs and Distributional
Effects of a Range of Options‘, PSSRU Discussion Paper 2336/2, PSSRU, London School of Economics.
Harding A and Gupta A (Eds.) (2007) Modelling Our Future: Population Ageing, Social Security and Taxation, International Symposia in Economic Theory and Econometrics, Vol. 15, Amsterdam, Elsevier.
Huang Z and Williamson P (2001) ‗A comparison
of synthetic reconstruction and combinatorial optimisation approaches to the creation of small-area microdata‘, Working Paper 2001/2, Population Microdata Unit, Department of Geography, University of Liverpool.
Lagergren M (2007) ‗A Simulation Model of the Future Needs of Long-term Care of Elderly
Persons in Sweden‘, in Gupta A and A Harding
(2007), 281-296. Lymer S, Brown L, Harding A et al. (2006)
‗Development of CAREMOD/05A‘, Technical Paper No 32, NATSEM, University of Canberra.
McCallum J, Simons L and Simons J (2003) ‗The Dubbo Study of the Health of the Elderly 1988
– 2002: An Epidemiological study of Hospitals & Residential Care‘, Australian Health Policy Institute Commissioned Paper Series 2003/06, University of Sydney.
Madge A (2000) ‗Long-Term Aged Care: Expenditure Trends and Projections‘,
LYMER, BROWN, HARDING AND YAP Predicting the need for aged care: CAREMOD 42
Productivity Commission Staff Research Paper,
Canberra. Percival R and Lloyd R (2000) ‗Projecting the
Impact of Changes to the Health of Older Australians‘, NATSEM Report for the Department of Health and Aged Care, National Centre for Social and Economic Modelling,
University of Canberra. Tanton R and Vidyattama Y (2009) ‗Pushing them
to the edge: an assessment of spatial microsimulation methods‘, Paper presented at the 2nd General Conference of the International Microsimulation Association, Ottawa, 8-10 June.
Treasury (2007) Intergenerational Report 2007, Treasury, Commonwealth of Australia, April. Accessed August 2007 at www.treasury.gov.au/igr
Voas D and Williamson P (2000) ‗An Evaluation of the Combinatorial Optimisation Approach to the
Creation of Synthetic Microdata‘, International
Journal of Population Geography, 6(5), 348-366.
Wang J, Mitchell P, Smith W, et al. (2001), ‗Incidence of Nursing Home Placement in a Defined Community‘, Medical Journal of Australia, 174, 271-275.
Williamson P (1996) ‗Community care policies for the elderly, 1981 and 1991: a microsimulation approach‘ in Clarke G [ed] Microsimulation for urban and regional policy analysis, Pion, London, 64-87.
Related Documents