Predicting the impacts of mutations on protein-ligand binding affinity based on molecular dynamics simulations and machine learning methods Wang, Debby D.; Ou-Yang, Le; Xie, Haoran; Zhu, Mengxu; Yan, Hong Published in: Computational and Structural Biotechnology Journal Published: 01/01/2020 Document Version: Final Published version, also known as Publisher’s PDF, Publisher’s Final version or Version of Record License: CC BY-NC-ND Publication record in CityU Scholars: Go to record Published version (DOI): 10.1016/j.csbj.2020.02.007 Publication details: Wang, D. D., Ou-Yang, L., Xie, H., Zhu, M., & Yan, H. (2020). Predicting the impacts of mutations on protein- ligand binding affinity based on molecular dynamics simulations and machine learning methods. Computational and Structural Biotechnology Journal, 18, 439-454. https://doi.org/10.1016/j.csbj.2020.02.007 Citing this paper Please note that where the full-text provided on CityU Scholars is the Post-print version (also known as Accepted Author Manuscript, Peer-reviewed or Author Final version), it may differ from the Final Published version. When citing, ensure that you check and use the publisher's definitive version for pagination and other details. General rights Copyright for the publications made accessible via the CityU Scholars portal is retained by the author(s) and/or other copyright owners and it is a condition of accessing these publications that users recognise and abide by the legal requirements associated with these rights. Users may not further distribute the material or use it for any profit-making activity or commercial gain. Publisher permission Permission for previously published items are in accordance with publisher's copyright policies sourced from the SHERPA RoMEO database. Links to full text versions (either Published or Post-print) are only available if corresponding publishers allow open access. Take down policy Contact [email protected] if you believe that this document breaches copyright and provide us with details. We will remove access to the work immediately and investigate your claim. Download date: 10/01/2022

Welcome message from author
This document is posted to help you gain knowledge. Please leave a comment to let me know what you think about it! Share it to your friends and learn new things together.
Transcript
Predicting the impacts of mutations on protein-ligand binding affinity based on moleculardynamics simulations and machine learning methods
Wang, Debby D.; Ou-Yang, Le; Xie, Haoran; Zhu, Mengxu; Yan, Hong
Published in:Computational and Structural Biotechnology Journal
Published: 01/01/2020
Document Version:Final Published version, also known as Publisher’s PDF, Publisher’s Final version or Version of Record
License:CC BY-NC-ND
Publication record in CityU Scholars:Go to record
Published version (DOI):10.1016/j.csbj.2020.02.007
Publication details:Wang, D. D., Ou-Yang, L., Xie, H., Zhu, M., & Yan, H. (2020). Predicting the impacts of mutations on protein-ligand binding affinity based on molecular dynamics simulations and machine learning methods. Computationaland Structural Biotechnology Journal, 18, 439-454. https://doi.org/10.1016/j.csbj.2020.02.007
Citing this paperPlease note that where the full-text provided on CityU Scholars is the Post-print version (also known as Accepted AuthorManuscript, Peer-reviewed or Author Final version), it may differ from the Final Published version. When citing, ensure thatyou check and use the publisher's definitive version for pagination and other details.
General rightsCopyright for the publications made accessible via the CityU Scholars portal is retained by the author(s) and/or othercopyright owners and it is a condition of accessing these publications that users recognise and abide by the legalrequirements associated with these rights. Users may not further distribute the material or use it for any profit-making activityor commercial gain.Publisher permissionPermission for previously published items are in accordance with publisher's copyright policies sourced from the SHERPARoMEO database. Links to full text versions (either Published or Post-print) are only available if corresponding publishersallow open access.
Take down policyContact [email protected] if you believe that this document breaches copyright and provide us with details. We willremove access to the work immediately and investigate your claim.
Download date: 10/01/2022
Computational and Structural Biotechnology Journal 18 (2020) 439–454
journal homepage: www.elsevier .com/locate /csbj
Predicting the impacts of mutations on protein-ligand binding affinitybased on molecular dynamics simulations and machine learningmethods
https://doi.org/10.1016/j.csbj.2020.02.0072001-0370/� 2020 The Authors. Published by Elsevier B.V. on behalf of Research Network of Computational and Structural Biotechnology.This is an open access article under the CC BY-NC-ND license (http://creativecommons.org/licenses/by-nc-nd/4.0/).
Abbreviations: aacomp, amino acid composition descriptors; CNN, convolutionalneural network; const, constitutional descriptors; ctd, composition transition anddistribution descriptors; HMM, hidden Markov model; kappa, Kappa shape indices;LSTM, long short-term memory; MD, molecular dynamics; MM/GBSA, molecularmechanics/generalized born surface area; MM/PBSA, molecular mechanics/Poisson-Boltzmann surface area; paacomp, type 1 pseudo amino acid composition descrip-tors; RF, random forest; RMSD, root-mean-square deviation; RNN, recurrent neuralnetwork; SASA, solvent accessible surface area; top, topological descriptors; WTP,wildtype protein.⇑ Corresponding author at: Institute of Medical Information Engineering, School
of Medical Instrument and Food Engineering, University of Shanghai for Science andTechnology, 516 Jungong Rd, Shanghai 200093, China.
E-mail addresses: [email protected] (D.D. Wang), [email protected](L. Ou-Yang).
Debby D. Wang a,⇑, Le Ou-Yang c,⇑, Haoran Xie d, Mengxu Zhu b, Hong Yan b
a Institute of Medical Information Engineering, School of Medical Instrument and Food Engineering, University of Shanghai for Science and Technology, 516 Jungong Rd,Shanghai 200093, ChinabDepartment of Electrical Engineering, City University of Hong Kong, Tat Chee Avenue, Kowloon, Hong KongcGuangdong Key Laboratory of Intelligent Information Processing and Shenzhen Key Laboratory of Media Security, College of Electronics and Information Engineering,Shenzhen University, 3688 Nanhai Ave, Shenzhen 518060, ChinadDepartment of Computing and Decision Sciences, Lingnan University, 8 Castle Peak Rd, Tuen Mun, Hong Kong
a r t i c l e i n f o
Article history:Received 6 September 2019Received in revised form 31 January 2020Accepted 11 February 2020Available online 20 February 2020
Keywords:Missense mutationMutation impactProtein-ligand binding affinityMolecular dynamics (MD) simulationsLocal geometrical featuresTime series featuresDeep learning
a b s t r a c t
Purpose: Mutation-induced variation of protein-ligand binding affinity is the key to many genetic dis-eases and the emergence of drug resistance, and therefore predicting such mutation impacts is of greatimportance. In this work, we aim to predict the mutation impacts on protein-ligand binding affinity usingefficient structure-based, computational methods.Methods: Relying on consolidated databases of experimentally determined data we characterize theaffinity change upon mutation based on a number of local geometrical features and monitor such featuredifferences upon mutation during molecular dynamics (MD) simulations. The differences are quantifiedaccording to average difference, trajectory-wise distance or time-vary differences. Machine-learningmethods are employed to predict the mutation impacts using the resulting conventional or time-seriesfeatures. Predictions based on estimation of energy and based on investigation of molecular descriptorswere conducted as benchmarks.Results: Our method (machine-learning techniques using time-series features) outperformed the bench-mark methods, especially in terms of the balanced F1 score. Particularly, deep-learning models led to thebest prediction performance with distinct improvements in balanced F1 score and a sustained accuracy.Conclusion: Our work highlights the effectiveness of the characterization of affinity change upon muta-tions. Furthermore, deep-learning techniques are well designed for handling the extracted time-seriesfeatures. This study can lead to a deeper understanding of mutation-induced diseases and resistance,and further guide the development of innovative drug design.
� 2020 The Authors. Published by Elsevier B.V. on behalf of Research Network of Computational andStructural Biotechnology. This is an open access article under the CC BY-NC-ND license (http://creative-
commons.org/licenses/by-nc-nd/4.0/).
1. Introduction
As exposed by the next-generation sequencing (NGS) tech-niques, a wide variety of genetic mutations exist in different organ-isms [38]. Such genetic mutations, particularly missensemutations, can cause proteins to malfunction by modulating theirstability as well as altering their affinity with other biologicalmolecules [38,44,22,43]. The stability changes (thermodynamic)upon mutations can be quantified by the change of folding freeenergy (DDGfold), which is a result of collective contributions frommultiple structural features (e.g. hydrogen bonds, etc.) andphysico-chemical properties (e.g. polarity, solvation energy, etc.)
440 D.D. Wang et al. / Computational and Structural Biotechnology Journal 18 (2020) 439–454
[26]. Besides experimental measurements, various computationalmethods have been developed to decipher DDG, which fall intosequence-based machine-learning approaches and structure-based approaches involving statistical potentials, biophysicsknowledge or intensive sampling (e.g. free energy perturbation,thermodynamic integration, etc.) [50]. Disease-causing mutationsfrequently destabilize proteins (DDGfold < 0) with accompaniedstructural changes [31]. However, local changes of geometry with-out necessarily affecting the folding free energy (DDGfold ¼ 0) canstill be disease-causing [26]. This reflects the importance of localgeometrical changes upon mutations, and makes predicting theimpact and associated phenotypes of mutations a challengingproblem. Arguably, the phenotypes of mutations depend princi-pally on the changes in protein-partner binding affinity, whichcan be measured by the binding free energy changes (DDGbind)and determines the magnitude of physiological effect. In general,any mutation-induced affinity change may be disease-causing withhigh risk [45,56]. Aside from experimental investigation, computa-tional methods designed for deciphering binding free energychanges can be categorized similarly to those determining the fold-ing free energy changes [26].
Particularly, the effects of missense mutations on small mole-cule ligand binding to proteins can respond to many genetic dis-eases and the emergence of drug resistance [44,43]. Decipheringthe protein-ligand affinity changes upon mutations has thereforebeen an essential step towards more innovative and personalizedtherapeutic interventions. Although high-throughput DNAsequencing allows vast amounts of mutations to be identifiedrapidly, determining the mutation impacts often requires time-consuming and expensive experiments (e.g. isothermal titrationcalorimetry [13], FRET [42], surface plasmon resonance [34], etc.).To computationally decode the impacts of mutations on protein-ligand binding affinity, efforts have also been made, mostly basedon molecular dynamics (MD) simulations. These works eitherfocused on the direct estimation of binding free energy (DGbind)or employed machine-learning techniques to monitor specificstructural/physico-chemical features in protein dynamics. For apair of wild-type type 1 human immunodeficiency virus (HIV-1)protease and its drug-resistant mutant, Perryman et al. imple-mented all-atom MD simulations in explicit solvent and examinedthe structural properties sampled during the simulations, whichdemonstrated decreased binding affinities of inhibitors to themutant [39]. In [21], for a group of homologically modeled mutantsof HIV-1 protease, implicit-solvent MD simulations were con-ducted, based on which the free energy decomposition analysiscoupled with machine-learning techniques was applied to quanti-tatively estimate the protease-drug binding affinity for differentmutations. Similarly, by incorporating binding free energy compo-nents extracted from explicit-solvent MD simulations and person-alized characteristics, drug-resistant epidermal growth factorreceptor (EGFR) mutations or EGFR-mutated lung cancer patientswere recognized using machine-learning approaches in [53]. Maet al. predicted drug-resistant EGFR mutants that generally havelower binding affinity with inhibitors by combining MD simula-tions and local surface geometrical properties, represented by thecurvature of atoms in drug-binding pockets [33]. Zou et al. investi-gated the relationships between mutations and EGFR-inhibitorinteractions by investigating atom connectivity dynamics, whichindicate longitudinal distance changes between an inhibitor andits target [62]. Aside from these MD simulation-based studies,molecular descriptors can also be a potential alternative for deduc-ing molecular affinity or its change upon mutation [7,57]. Molecu-lar descriptors can be used to encode useful molecular informationas numerical features by characterizing the structural and physico-chemical properties of molecules according to distinct aspects of
molecular topology. In the past decades, a variety of descriptorsranging from simple constitutional/count descriptors to compli-cated steric/quantum-chemical descriptors have been developedfor chemical structures [1,1,8,18,10,2,9] and proteins[29,11,55,6,37]. Chemical-protein interaction descriptors can bedesigned on top of them by a simple concatenation or tensor pro-duct [10]. Such descriptors can easily be adopted by the machine-learning community for determining the impact of mutations onprotein-ligand binding affinity.
To mitigate the limitations in these studies, such as scarcity ofsamples, unavailability of experimentally-determined mutantstructures and lack of experimental affinity measurements for ver-ification, attempts have been made over the past decades to estab-lish comprehensive databases that link missense mutations withexperimentally measured affinity changes of protein-partner bind-ing systems [43,27,3,35]. Among them, Platinum [43] is a manuallycurated and literature-derived database that compiles ligand-affinity measurements (experimental) for wild-type proteins(WTPs) and their mutants under the same experiment conditions,and links such protein-ligand complexes to their three-dimensional structural information deposited in the Protein DataBank (PDB) [4]. This provides a valid resource for designingstructure-guided, computational approaches to predict the impactsof mutations on protein-ligand binding affinity. Standing on theseconsolidated databases and the importance of local geometricalchanges upon mutations, we proposed a number of local geomet-rical/structural features (closeness, local surface area, orientation,contacts and interfacial hydrogen bonds) and monitored their dif-ferences between the WTP-ligand and mutant-ligand systems inthe dynamics simulations. Such feature differences were furtheremployed by machine-learning methods to predict the mutationimpact on protein-ligand binding affinity. To compromise on thediscrepancy among different experiment conditions for derivingthe ligand-affinity measurements, we only learned an increasedor decreased affinity upon mutation (categorical). The energy-based and descriptor-based predictions were performed as bench-marks for our method. An overall framework of this study is shownin Fig. 1.
2. Material and methods
2.1. Data collection
In this work, we mainly adopted the protein-ligand affinityinformation in Platinum [43] and the associated crystallographicstructures in PDB [4] for a supervised study of mutation impactson protein-ligand binding affinity. Specifically, we filtered themutations using criteria that (1) the molecular structures of boththe WTP and mutant have been released in PDB, avoiding struc-tural modeling with no ground truth, (2) the structures shouldhave a high resolution (< 3 angstrom (Å)), guaranteeing high-quality data, and (3) the involved ligands belong to the ligandlibrary of AMBER software suite, leading to accurate MD simula-tions. For the impacts of mutations on protein-ligand binding affin-ity, ‘decreased affinity’ (D) and ‘increased affinity’ (I) comprise thetwo types. The impact of each mutation on protein-ligand bindingaffinity is defined on the triplet WTP;mutant; ligandf g.
2.2. Molecular dynamics (MD) simulations
For a triplet WTP;mutant; ligandf g, the mutation impact onprotein-ligand binding affinity is highly associated with the dis-crepancy between the WTP-ligand and the mutant-ligand bindingsystems in their dynamics. For each mutation, the WTP and mutant
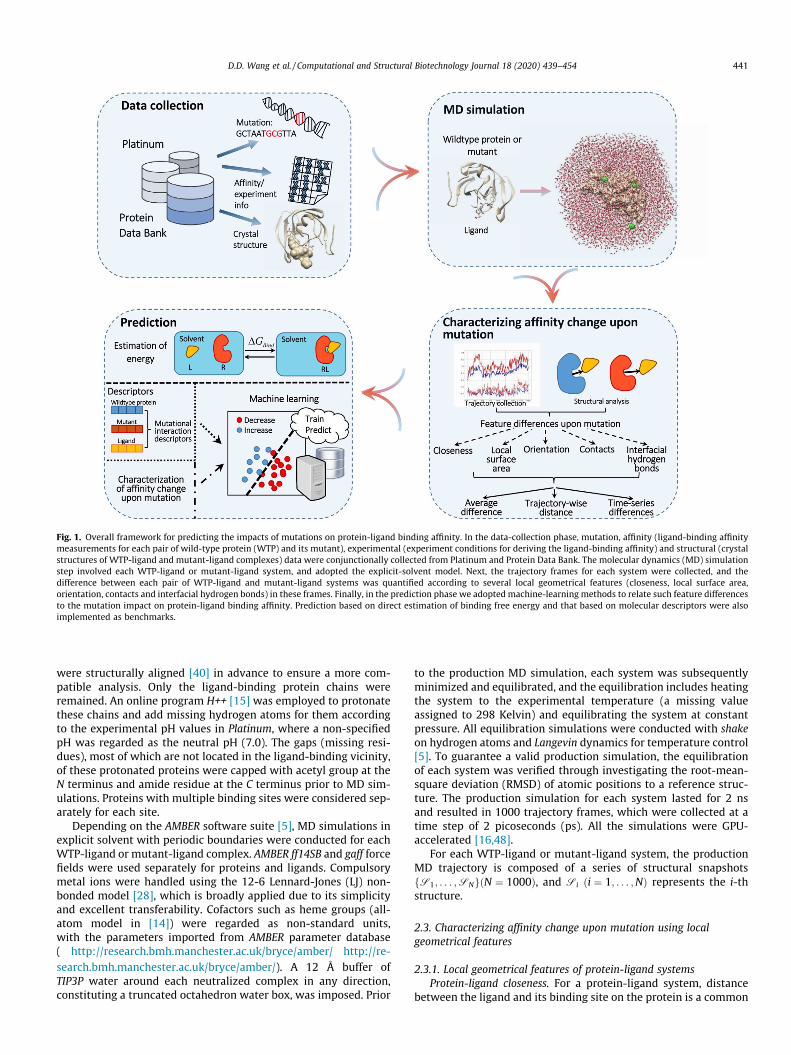
Fig. 1. Overall framework for predicting the impacts of mutations on protein-ligand binding affinity. In the data-collection phase, mutation, affinity (ligand-binding affinitymeasurements for each pair of wild-type protein (WTP) and its mutant), experimental (experiment conditions for deriving the ligand-binding affinity) and structural (crystalstructures of WTP-ligand and mutant-ligand complexes) data were conjunctionally collected from Platinum and Protein Data Bank. The molecular dynamics (MD) simulationstep involved each WTP-ligand or mutant-ligand system, and adopted the explicit-solvent model. Next, the trajectory frames for each system were collected, and thedifference between each pair of WTP-ligand and mutant-ligand systems was quantified according to several local geometrical features (closeness, local surface area,orientation, contacts and interfacial hydrogen bonds) in these frames. Finally, in the prediction phase we adopted machine-learning methods to relate such feature differencesto the mutation impact on protein-ligand binding affinity. Prediction based on direct estimation of binding free energy and that based on molecular descriptors were alsoimplemented as benchmarks.
D.D. Wang et al. / Computational and Structural Biotechnology Journal 18 (2020) 439–454 441
were structurally aligned [40] in advance to ensure a more com-patible analysis. Only the ligand-binding protein chains wereremained. An online program H++ [15] was employed to protonatethese chains and add missing hydrogen atoms for them accordingto the experimental pH values in Platinum, where a non-specifiedpH was regarded as the neutral pH (7.0). The gaps (missing resi-dues), most of which are not located in the ligand-binding vicinity,of these protonated proteins were capped with acetyl group at theN terminus and amide residue at the C terminus prior to MD sim-ulations. Proteins with multiple binding sites were considered sep-arately for each site.
Depending on the AMBER software suite [5], MD simulations inexplicit solvent with periodic boundaries were conducted for eachWTP-ligand or mutant-ligand complex. AMBER ff14SB and gaff forcefields were used separately for proteins and ligands. Compulsorymetal ions were handled using the 12-6 Lennard-Jones (LJ) non-bonded model [28], which is broadly applied due to its simplicityand excellent transferability. Cofactors such as heme groups (all-atom model in [14]) were regarded as non-standard units,with the parameters imported from AMBER parameter database( http://research.bmh.manchester.ac.uk/bryce/amber/ http://re-search.bmh.manchester.ac.uk/bryce/amber/). A 12 Å buffer ofTIP3P water around each neutralized complex in any direction,constituting a truncated octahedron water box, was imposed. Prior
to the production MD simulation, each system was subsequentlyminimized and equilibrated, and the equilibration includes heatingthe system to the experimental temperature (a missing valueassigned to 298 Kelvin) and equilibrating the system at constantpressure. All equilibration simulations were conducted with shakeon hydrogen atoms and Langevin dynamics for temperature control[5]. To guarantee a valid production simulation, the equilibrationof each system was verified through investigating the root-mean-square deviation (RMSD) of atomic positions to a reference struc-ture. The production simulation for each system lasted for 2 nsand resulted in 1000 trajectory frames, which were collected at atime step of 2 picoseconds (ps). All the simulations were GPU-accelerated [16,48].
For each WTP-ligand or mutant-ligand system, the productionMD trajectory is composed of a series of structural snapshotsS1; . . . ;SNf g N ¼ 1000ð Þ, and Si i ¼ 1; . . . ;Nð Þ represents the i-thstructure.
2.3. Characterizing affinity change upon mutation using localgeometrical features
2.3.1. Local geometrical features of protein-ligand systemsProtein-ligand closeness. For a protein-ligand system, distance
between the ligand and its binding site on the protein is a common
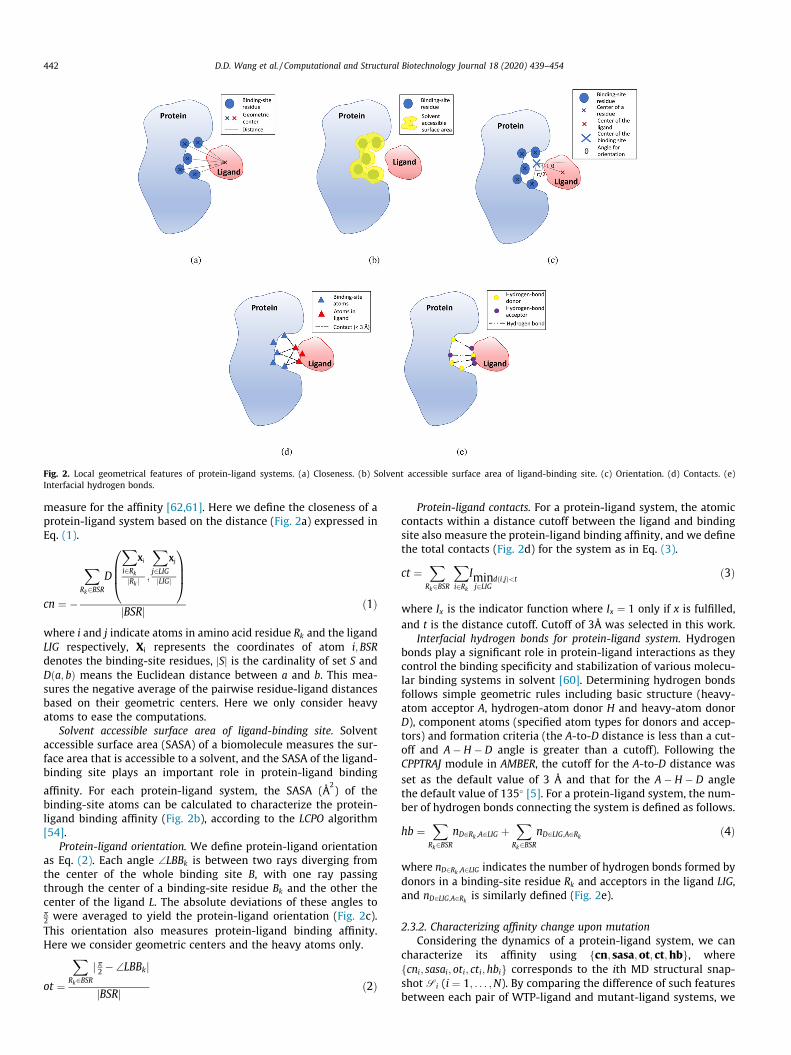
Fig. 2. Local geometrical features of protein-ligand systems. (a) Closeness. (b) Solvent accessible surface area of ligand-binding site. (c) Orientation. (d) Contacts. (e)Interfacial hydrogen bonds.
442 D.D. Wang et al. / Computational and Structural Biotechnology Journal 18 (2020) 439–454
measure for the affinity [62,61]. Here we define the closeness of aprotein-ligand system based on the distance (Fig. 2a) expressed inEq. (1).
cn ¼ �
XRk2BSR
D
Xi2Rk
Xi
jRk j ;
Xj2LIG
Xj
jLIGj
0BB@1CCA
jBSRj ð1Þ
where i and j indicate atoms in amino acid residue Rk and the ligandLIG respectively, Xi represents the coordinates of atom i;BSRdenotes the binding-site residues, jSj is the cardinality of set S andD a; bð Þ means the Euclidean distance between a and b. This mea-sures the negative average of the pairwise residue-ligand distancesbased on their geometric centers. Here we only consider heavyatoms to ease the computations.
Solvent accessible surface area of ligand-binding site. Solventaccessible surface area (SASA) of a biomolecule measures the sur-face area that is accessible to a solvent, and the SASA of the ligand-binding site plays an important role in protein-ligand binding
affinity. For each protein-ligand system, the SASA (Å2) of the
binding-site atoms can be calculated to characterize the protein-ligand binding affinity (Fig. 2b), according to the LCPO algorithm[54].
Protein-ligand orientation. We define protein-ligand orientationas Eq. (2). Each angle \LBBk is between two rays diverging fromthe center of the whole binding site B, with one ray passingthrough the center of a binding-site residue Bk and the other thecenter of the ligand L. The absolute deviations of these angles top2 were averaged to yield the protein-ligand orientation (Fig. 2c).This orientation also measures protein-ligand binding affinity.Here we consider geometric centers and the heavy atoms only.
ot ¼
XRk2BSR
j p2 � \LBBkj
jBSRj ð2Þ
Protein-ligand contacts. For a protein-ligand system, the atomiccontacts within a distance cutoff between the ligand and bindingsite also measure the protein-ligand binding affinity, and we definethe total contacts (Fig. 2d) for the system as in Eq. (3).
ct ¼X
Rk2BSR
Xi2Rk
Iminj2LIG
d i;jð Þ<tð3Þ
where Ix is the indicator function where Ix ¼ 1 only if x is fulfilled,and t is the distance cutoff. Cutoff of 3Å was selected in this work.
Interfacial hydrogen bonds for protein-ligand system. Hydrogenbonds play a significant role in protein-ligand interactions as theycontrol the binding specificity and stabilization of various molecu-lar binding systems in solvent [60]. Determining hydrogen bondsfollows simple geometric rules including basic structure (heavy-atom acceptor A, hydrogen-atom donor H and heavy-atom donorD), component atoms (specified atom types for donors and accep-tors) and formation criteria (the A-to-D distance is less than a cut-off and A� H � D angle is greater than a cutoff). Following theCPPTRAJ module in AMBER, the cutoff for the A-to-D distance wasset as the default value of 3 Å and that for the A� H � D anglethe default value of 135� [5]. For a protein-ligand system, the num-ber of hydrogen bonds connecting the system is defined as follows.
hb ¼X
Rk2BSRnD2Rk ;A2LIG þ
XRk2BSR
nD2LIG;A2Rk ð4Þ
where nD2Rk ;A2LIG indicates the number of hydrogen bonds formed bydonors in a binding-site residue Rk and acceptors in the ligand LIG,and nD2LIG;A2Rk is similarly defined (Fig. 2e).
2.3.2. Characterizing affinity change upon mutationConsidering the dynamics of a protein-ligand system, we can
characterize its affinity using cn; sasa;ot; ct;hbf g, wherecni; sasai; oti; cti;hbif g corresponds to the ith MD structural snap-shot Si (i ¼ 1; . . . ;N). By comparing the difference of such featuresbetween each pair of WTP-ligand and mutant-ligand systems, we
D.D. Wang et al. / Computational and Structural Biotechnology Journal 18 (2020) 439–454 443
can characterize the affinity change upon mutation. Such differ-ence can be defined using following strategies.
First, it can be defined as the average difference over all the MDsnapshots of each feature (Eq. (5)).
vm ¼ �mmt�l � �mwtp�l ð5Þwhere m 2 cn; sasa;ot; ct;hbf g, and mt � l and wtp� l indicate themutant-ligand and WTP-ligand systems respectively.
Another strategy is to calculate the trajectory-wise distancebetween a pair of WTP-ligand and mutant-ligand systems basedon each feature (Eq. (6)).
vDm ¼ D mmt�l;mwtp�l
� � ð6Þwhere D a;bð Þ is the distance between two time series a and b, andcan be the Euclidean, correlation, cosine or Dynamic Time Warping(DTW) distance (Eq. (7)). The correlation distance is calculatedbased on the Pearson correlation coefficient. The DTW distance iscomputed as the Euclidean distance between the two aligned timeseries according to the alignment path P.
DEuclidean a;bð Þ ¼ ka� bk2DCorrelation a;bð Þ ¼ 1� cov a;bð Þ
rarb¼ 1� a��að Þ� b��bð Þ
k a��að Þk2k b��bð Þk2DCosine a;bð Þ ¼ 1� a�b
kak2kbk2
DDTW a;bð Þ ¼ffiffiffiffiffiffiffiffiffiffiffiffiffiffiffiffiffiffiffiffiffiffiffiffiffiffiffiffiffiXi;jð Þ2P
ai � bj� �2s
8>>>>>>>>><>>>>>>>>>:ð7Þ
An alternative strategy is to simply use the trajectory of featuredifferences between a pair of WTP-ligand and mutant-ligand sys-tems (Eq. (8)).
vm ¼ mmt�l �mwtp�l ð8ÞAccordingly, the affinity change upon mutation can be charac-
terized by vcn;v sasa;vot ;vct; vhbf g; vDistcn ; vDist
sasa;vDistot ;vDist
ct ; vDisthb
� �or
vcn;vsasa;vot ;vct;vhbf g (time series).
2.4. Prediction of mutation impact on protein-ligand binding affinity
2.4.1. Prediction based on machine-learning techniquesBased on the extracted features, we can apply machine-learning
techniques to the prediction of mutation impacts on protein-ligandbinding affinity. We used a simple train-test mechanism with arandom half-half partition. Features were standardized to zeromean and unit variance before fed to the training machines. Foreach setting, we repeated the experiments 10 times and averagedthe performance. As we face an imbalanced classification problem,the performance was evaluated by both the accuracy and balancedF1 score. The balanced F1 score is simply computed as the averageof the F1 scores concerning the two mutation impacts (D and I)separately, as shown in Eq. (9).
Fb1 ¼ FD1þFI1
2
¼ precisionD �recallDprecisionDþrecallD
þ precisionI �recallIprecisionIþrecallI
ð9Þ
Conventional features. For conventional features likevcn;v sasa;vot ;vct;vhbf g or vDist
cn ;vDistsasa;vDist
ot ;vDistct ;vDist
hb
� �, we employed
traditional random forests (RFs) [20], which have been successfullyapplied to extensive machine-learning tasks [58]. RFs are anensemble learning method that depends on a multitude ofdecision-tree learners in training and outputs the averaged predic-tion from individual tree learners. RFs have mitigated the overfit-ting problem of individual decision trees in the training phase.Specifically, RFs apply the general bagging technique to tree learn-ers, which repeatedly selects a random sample from the training
set, fits trees to those samples, and finally averages the prediction(or takes the majority vote). In addition, RFs adopt feature bagging(a random subset of features) in the learning process to reduce thecorrelated trees in the original bagging algorithm. Normally theoptimal number of trees can be determined by cross validationor observing the out-of-bag error. For simplicity in this work, wefix this parameter as 50 for handling our medium-sized dataset,with the maximum depth of each tree set as 2.
Single time-series features. Aside from conventional features, thetime-series features ( vcn;vsasa;vot;vct ;vhbf g) should have high clas-sification power. It is well acknowledged that hidden Markov mod-els (HMMs) are designed for analyzing time-series data, althoughthey can merely cope with individual sequences. Here use HMMsto deal with single time-series features (vcn;vsasa;vot;vct or vhb).Specifically, an HMM is a probabilistic model for learning systemsthat can be assumed as a Markov process with hidden states, andeach state can independently generate observations according toemission probabilities [46]. An HMM is commonly composed ofthe hidden-state space S ¼ S1; . . . ; SNf g (state at time t denoted asht), the set of distinct observation symbols generated from thestates V ¼ V1; . . . ;VMf g (observation at time t denoted as ot), tran-sition probabilities between hidden states A ¼ aij
� �(considering
first-order Markov chains only), emission probabilities for thestates to produce observations E ¼ ei kð Þf g and probabilities of ini-tial hidden states p ¼ pif g. These probabilities are defined in Eq.(10). Emissions for continuous observations can come from distri-butions such as a Gaussian, and we merely consider univariateemission probabilities in this work.
aij ¼ P htþ1 ¼ Sjjht ¼ Si� �
; 1 6 i; j 6 N
ei kð Þ ¼ P ot ¼ Vkjht ¼ Si½ �; 1 6 i 6 N; 1 6 k 6 M
pi ¼ P h1 ¼ Si½ �; 1 6 i 6 N
8><>: ð10Þ
An HMM can thereupon determined by h ¼ A;E;pf g. Givenobservations O ¼ o1 . . . oT ; h can be trained by the Baum-Welchalgorithm to maximize P Ojhð Þ. For a given observation sequenceO ¼ o1 . . . oT and multiple HMMs H ¼ h1; . . . ; hlf g, the model thatbest matches the observations can be determined byargmax
h2HP Ojhð Þ, where P Ojhð Þ can be computed through the Viterbi
algorithm. In this work, we separately trained HMMs for the twomutation impacts (D and I) using the training set, based on singletime-series features. The cardinality of the state space is assumedto be 3, which is commonly used in speech recognition [46]. Gaus-sian emissions were adopted. A test trajectory is assigned with anHMM if it corresponds to a higher P Ojhð Þ.
Multiple time-series features. To deal with multiple time-seriesfeatures ( vcn;vsasa;vot ;vct ;vhbf g), we adopted several machine-learning and deep-learning models. The first model is a simpledensely connected neural network (multilayer perceptron - MLP),which is composed of an input layer that flattens the times seriesinto a vector, a densely connected layer, a dropout layer and anoutput layer. Specifically, we employed 50 nodes in the denselyconnected layer, with the ReLU activation function. The sigmoidfunction was used as the activation function for the output layer.A dropout layer [49] was added between the densely connectedand output layers to mitigate the overfitting issues, and weadopted a dropout ratio of 25%. During the training process, thebinary cross-entropy function was selected to calculate the loss,and the efficient Adam optimizer [23] was adopted for updatingthe network parameters. In addition, we set the class weight ofthe minority class the two times as that of the majority duringtraining, to balance the samples.
An alternative model is the convolutional neural networks(CNNs), which have been successfully applied to abundant applica-tions such as image classification and speech recognition [30].
444 D.D. Wang et al. / Computational and Structural Biotechnology Journal 18 (2020) 439–454
CNNs are well designed for image classification due to their consid-eration of spatial structure of the images [25], where neighboringpixels are correlated. The essence of CNNs includes local receptivefields, shared weights and pooling. Local receptive fields corre-spond to localized regions of the input image that are connectedto different hidden neurons. A map of hidden neurons connectedto their local receptive fields share the same weights and bias,implying the detection of the same feature (such as a horizontaledge) by these neurons. This highlights the translation invariancenature of images. Accordingly, the shared weights and bias definea specific kernel of filter for the input image, corresponding to afeature map in the hidden layer. For a filter of size k� k withweights w and bias b, a hidden neuron in the feature map will out-put as follows,
yi;j ¼ rXkm¼0
Xkn¼0
wm;nxiþm;jþn þ b
!ð11Þ
where x ¼ xi;j� �
denotes the inputs and r �ð Þ is an activation func-tion (ReLU in most CNNs). This corresponds to a convolution oper-ation. A full convolution layer in a CNN normally consists ofmultiple feature maps (filters), to learn different types of features.A pooling layer frequently follows a convolutional layer, which con-denses each feature map in the convolutional layer into a smallerone by summarizing regions of the map as the max or averagevalue. Overall, a complete CNN is composed of an input layer, con-secutive convolutional and pooling layers, a layer for flattening thefeature maps, a densely connected layer and a final output layer. Forinputs of multiple time-series features, it may differ from the orig-inal spatial structures of images as the order of the time series mayvary. However, such data still possess the sequential structuresalong the time axis, which can be beneficial from the convolutionallayers. Specifically in this work, we implemented both two-dimensional (2D) and one-dimensional (1D) convolutions in CNNmodels. For a 2D case, we assembled a CNN with a convolutionallayer including 50 filters of size 5� 5 (5 types of time seriesvcn;vsasa;vot ;vct ;vhbf g), a 1D pooling layer of size 2 that maximizesfeature-map regions and the following layers. In the 1D case, wereplaced the 2D convolution filters with 1D filters of size 3. Simi-larly, two dropout layers, one after the pooling layer and the otherafter the densely connected layer, were inserted to mitigate theoverfitting problem. The optimizer, loss function, class weights,dropout ratio and activation functions for training were set thesame as aforementioned.
The third model is the recurrent neural networks (RNNs) wherethe activation of hidden/output neurons is determined by both thecurrent and earlier inputs (time-varying behavior), thus perfectlydesigned for time-series features. RNNs are extremely useful inspeech recognition [17]. Basic RNNs organize neuron-like nodesinto successive layers, with each node having a time-varying acti-vation. Unfortunately, RNNs suffer from short-term memory andthe vanishing gradient problem during back propagation. Longshort-term memory (LSTM) has been broadly incorporated as asolution to the short-term memory. LSTM uses gates to regulatethe flow of information, which can deliver relevant informationalong the sequences to make prediction. Specifically, in an LSTMcell its state carries the relevant information throughout the pro-cessing of the sequences, and it adds information to the state orremoves from it via different gates. Three types of gates, namelythe forget gate, input gate and output gate, are used in an LSTMcell. A forget gate gforget decides what memory (previous hiddenstate c t � 1ð Þ) to keep or forget. An input gate gin handles thenew coming information c tð Þ and decides how much to memorizeit. The cell state c tð Þ is then defined as the combination of theremaining memory and the processed new information. The out-put gate gout then decides the next hidden state. Practically, many
LSTM cells will be used in an application, and the network can besummarized as follows,
C tð Þ ¼ gforget � C t � 1ð Þ þ gin � bC tð ÞbC tð Þ ¼ tanh W � x tð Þ þ V � h t � 1ð Þð Þh tð Þ ¼ gout � tanh C tð Þð Þy tð Þ ¼ h tð Þ
8>>>><>>>>: ð12Þ
where C tð Þ denotes the overall state of many LSTM cells,gforget; gin;gout
� �are the gates to regulate different LSTM cells, �
means pointwise multiplication, and x tð Þ;h tð Þ and y tð Þ representthe input, hidden state and the output respectively. tanh is the acti-vation function for the new coming information and the hiddenstate. The gates gforget;gin;gout
� �are normally controlled by the cur-
rent input x t � 1ð Þ, the previous hidden state h t � 1ð Þ and the sig-moid activation function. For RNNs in this work, we simply setthe number of hidden units in the LSTM cell as 50 and collectedthe hidden state outputs for each time step in the LSTM. To avoidoverfitting, dropout layers between recurrent layers were embed-ded. LSTM is then followed by a feature-flattening layer and an out-put layer. Parameters like optimizer, loss function, class weights,dropout ratio and activation functions for training were similarlyselected as earlier. In addition, we also attempted to combineCNN and RNN models. CNNs are good at learning the spatial struc-ture in the inputs, and we applied convolutional layers to extractinvariant features of the time-series data before feeding them intoan LSTM layer. Here 1D convolutional and max pooling layers wereused, with all the other parameters set the same as above.
2.4.2. Prediction based on energy estimationBased on MD simulations, computational estimation of binding
free energies can be used to uncover the mutation impacts onprotein-ligand binding affinity [53,32,52]. The assembly of molec-ular mechanics (MM) energies, Poisson-Boltzmann (PB) or general-ized Born (GB) models, and surface area (SA) continuum solvationyields popular MM/PBSA or MM/GBSA method to estimate the freeenergy of binding of a ligand to a protein [12]. In these methods,the free energy G of a state is estimated as follows.
G ¼ EMM þ Epolarsolv þ Enonpolar
solv � TS ð13Þwhere EMM is the MM energy term contributed by bonded, electro-
static and van der Waals interactions. Epolarsolv and Enonpolar
solv are the polar
and non-polar contributions to the solvation free energies. Epolarsolv can
be estimated by the PB equation or the GB model [12]. The non-polar contribution is typically obtained based on the SASA. T indi-cates the temperature of the system and S is the entropy contribu-tion, which is frequently ignored because of its high computationalcost. Additionally, for similar systems like a WTP and its mutant,such contributions can be quite similar and therefore ignored. It iscommon to only simulate the dynamics of the protein-ligand com-plex (PL) and extract the dynamics of free ligand (L) and protein (P)respectively, leading to the estimation of the free energy of binding
DGbind as Eq. (12), where �iPL
indicates the energies are averagedfrom the simulation of the complex.
DGbind ¼ GPL � GL � GPiPL ð14Þ
To predict the mutation impacts on protein-ligand bindingaffinity, we computed the difference of binding free energybetween each pair of WTP-ligand and mutant-ligand complexes(Eq. (13)). As a largely negative binding free energy indicates ahigher affinity, a negative difference represents type I and other-wise type D. MM/PBSA or MM/GBSA calculates relative bindingfree energies with the ignorance of conformational rearrangementupon binding, therefore considering the sign of the difference

D.D. Wang et al. / Computational and Structural Biotechnology Journal 18 (2020) 439–454 445
DGmt�l � DGwtp�l instead of the value can compromise on the dis-crepancy among different pairs of WTP-ligand and mutant-ligandsystems.
y ¼ I; if DGmt�l � DGwtp�l < 0D; otherwise
ð15Þ
2.4.3. Prediction based on molecular descriptorsMolecular descriptors, which play an important role in chemin-
formatics and bioinformatics, are a potential alternative for deduc-ing the affinity change upon mutation. For chemical structures,commonly used structural and physicochemical descriptorsinclude constitutional descriptors [1], topological descriptors[1,8], Kappa shape indices [18], charge descriptors [10], Basakinformation indices [2], autocorrelation descriptors [9], etc. Thosefor proteins and peptides incorporate amino acid compositiondescriptors [29], composition, translation and distribution (CTD)of various structural and physicochemical properties [11], autocor-relation descriptors [55], pseudo amino acid composition descrip-tors [6,37], etc. Chemical-protein interaction descriptors can bedefined on top of these chemical and protein descriptors by a sim-ple concatenation or tensor product [10].
We attempted to decode the mutation impacts on protein-ligand binding affinity from the perspective of molecular descrip-tors. A number of widely-used descriptors for the ligands and pro-teins were employed in this study. For ligands, the followingdescriptors were adopted.
� Constitutional descriptors (const): 30 features including molec-ular weight, average molecular weight, count of all atoms,counts of different types of atoms (hydrogen, halogen, Carbon,nitrogen, etc.), number of rings, number of different types of
FTP1 ¼ Fmt � Flig ;Fwtp � Flig� �
whereFmt � Flig ¼ F kð Þ ¼ Fmt ið Þ � Flig jð Þ; i ¼ 1; . . . ; npro; j ¼ 1; . . . ;nlig ; k ¼ i� 1ð Þ � npro þ j
� �Fwtp � Flig ¼ F kð Þ ¼ Fwtp ið Þ � Flig jð Þ; i ¼ 1; . . . ;npro; j ¼ 1; . . . ;nlig ; k ¼ i� 1ð Þ � npro þ j
� �( ð18Þ
bonds (rotatable, single, aromatic, etc.), number of hydrogenbond acceptors/donors and molecular path counts (length of1 6). The full list can be found in [10]).
� Kappa shape indices (kappa): 7 features including first-, second-and third-order topological shape descriptors, Kier molecularflexibility index, and first-, second- and third-order Kieralpha-modified shape descriptors [51].
� Topological descriptors (top): 30 topological features including(average) Weiner index, Balaban’s J index, Schiultz index, graphdistance index, Xu index, Pogliani index, Ipc index, BertzCT,Gutman molecular topological index, Zagreb index with order1 2, quadratic index, topological indices proposed by Narumi,Harary number, Platt number, Polarity number, maximumvalue in distance matrix, topological radius and topologicalPetitjean [10]).
For proteins and peptides, we calculated the following descrip-tors based on the sequences.
� Amino acid composition descriptors (aacomp): 20 features indi-cating the fractions of each type of amino acid in the whole pro-tein sequence.
� CTD descriptors (ctd): 147 features. The amino acids are firstencoded according to each of the attributes includinghydrophobicity, normalized van der Waals volume, polarity,polarizability, etc. For each encoded class, the composition(fractions in the whole sequence), transition (frequency of beingneighbors to another encoded class) and distribution (quantile-based) descriptors can be calculated [11]).
� Type 1 pseudo amino acid composition descriptors (paacomp):50 features. On the basis of normalized attribute values (hy-drophobicity, hydrophilicity, side chain mass, etc.) of each typeof amino acids, a set of sequence order-correlated factors (first-tier, second-tier, . . . ; k-tier) can be calculated. The pseudo aminoacid composition descriptors can be derived depending on suchfactors, the normalized frequency of amino acids and someweight factors (w) for the sequence-order effect [6]. Defaultparameters in [10] were used in our study.
Depending on sequential information or structural topology,these descriptors are invariant to structural deformation. Basedon each pair of descriptors respectively for the ligands and pro-teins, we can construct several mutational interaction descriptors(MIDs) to characterize the protein-ligand binding affinity changeupon mutation. As an example, using the constitutional descriptorsfor the ligands (Flig ¼ Flig ið Þ; i ¼ 1; . . . ;nlig
� �) and the amino acid
composition descriptors for the proteins (wtp: Fwtp ¼ Fwtp ið Þ; i ¼�1; . . . ;nproÞ and mutant: Fmt ¼ Fmt ið Þ; i ¼ 1; . . . ;npro
� �) leads to the
following types of MIDs.
FC1 ¼ Fmt; Fwtp;Flig
� � ð16Þ
FC2 ¼ Fmt � Fwtp;Flig
� � ð17Þ
FTP2 ¼ Fmt � Fwtp� �� Flig ð19Þ
We also trained RFs to deal with such MIDs and evaluatedthe performance using the accuracy and balanced F1 score (9).For a given pair of descriptors (such as const for ligands and aa-comp for proteins), we only reported the best performanceamong the four types of MIDs (Eqs. (16)–(19)). Additionally,we combined all descriptors for the liand (const, kappa andtop) and those for the proteins (aacomp, ctd and paacomp), fora further prediction.
3. Results
3.1. Collected data
110 protein mutations, corresponding to 160 wildtype ormutant proteins in PDB, passed this filter. The statistics for thesemutations are presented in Supplementary Table S1. Among them,94 are single-point mutations and the rest double- or multi-pointmutations. Majority of the proteins belong to classes of oxidore-ductase (54), hydrolase (25), transferase (9) and plasma protein
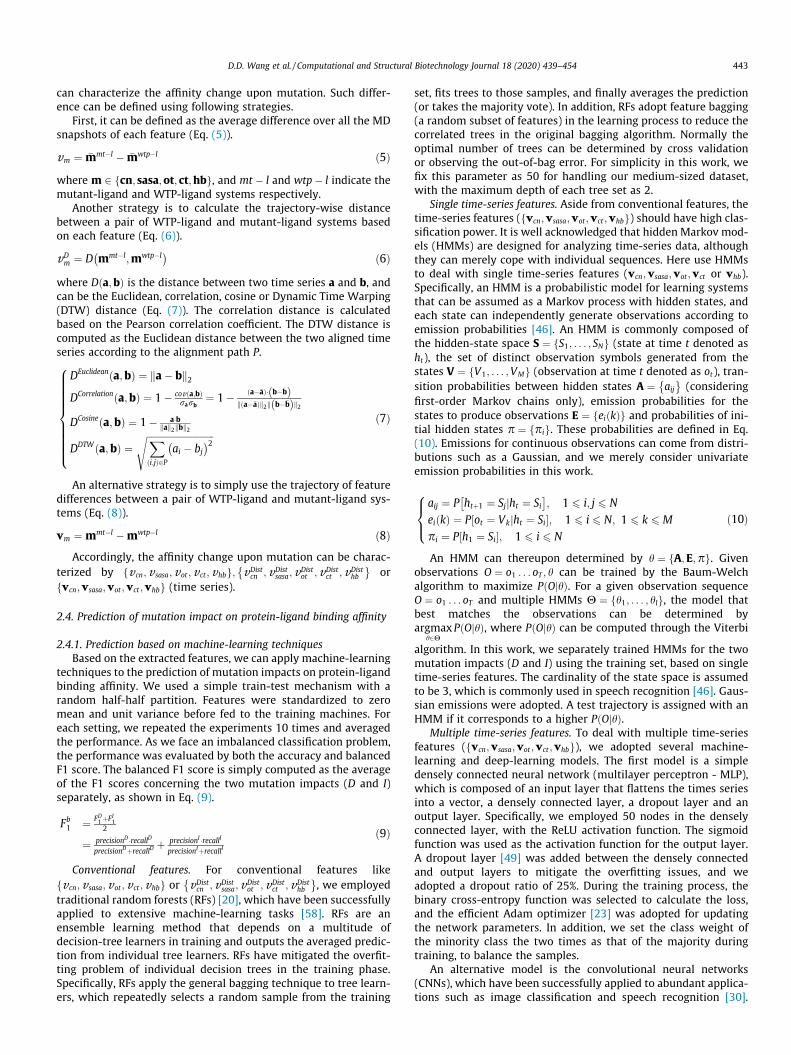
Fig. 3. Statistics of mutations. (a) Lengths of mutant proteins that cause a decreased ligand-binding affinity or an increased one. (b) Organisms where the proteins belong. (c)The density of the mutations inducing an absolute affinity fold change (jfcj) larger or equal to a threshold (t). Results for t ¼ 1:05; t ¼ 1:2; t ¼ 2 and t ¼ 3:6 have been furthermarked.
446 D.D. Wang et al. / Computational and Structural Biotechnology Journal 18 (2020) 439–454
(9). A wide range of organisms are involved, belonging to animaliakingdom (58, including human), viral (26), bacterium (19), protistkingdom (4) and fungi kingdom (2). As affected by the mutations,85 mutants had decreased binding affinities (D) with the associ-ated ligands compared to the WTPs, and 25 ones corresponded toincreased affinities (I). For these two groups of mutations, statisticson the lengths of proteins and the organisms where the proteinsbelong are presented in Figs. 3a and 3b. A further investigation ofthe affinity changes was conducted in case of trivial changes. Gen-erally, protein-ligand affinities are experimentally measured by
inhibitor constant (Ki), and Ki can be associated to DGbind via
DGbind ¼ RTln KiC (R: ideal gas constant, T: temperature, C: quotient
of activity coefficients). A smaller Ki indicates a higher bindingaffinity. Considering the WTP-ligand and mutant-ligand affinities
(Awtp�l and Amt�l), the fold change fc ¼� Amt�l
Awtp�lAwtp�l < Amt�l
Awtp�l
Amt�lotherwise
(can
be used to evaluate the affinity change, where a value > 1 repre-sents an increased affinity and a value < �1 an decreased affinity.The density of the mutations inducing an absolute affinity foldchange larger or equal to a threshold (Pjfcj>¼t) is shown in Fig. 3c,where we can see that 98.2% mutations have induced >¼ 5% affin-ity changes (t ¼ 1:05) and 86.4% mutations >¼ 100% affinitychanges (t ¼ 2). This guarantees that the majority of our mutationsamples correspond to nontrivial affinity changes.
3.2. MD simulations with verification of the equilibration
For each WTP-ligand or mutant-ligand system, the explicit-solvent MD simulations were implemented. For each solvated
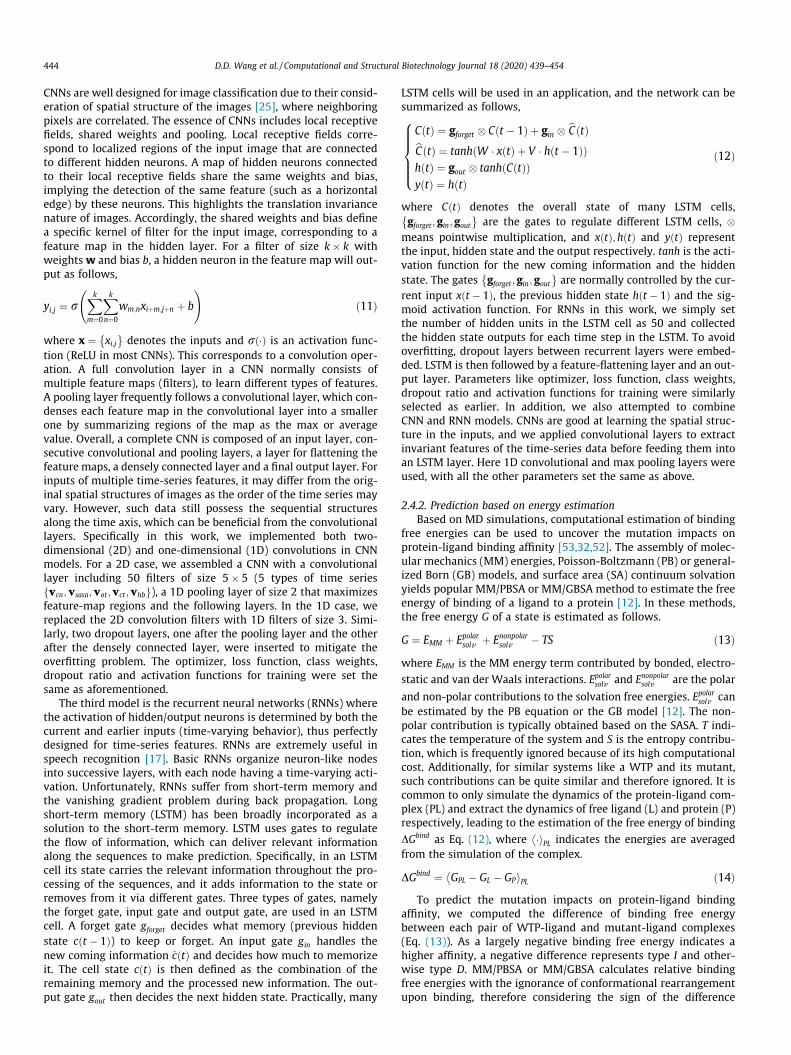
Fig. 4. Equilibration verification of several protein-ligand systems using backbone RMSDboth the wildtype protein (WTP)-ligand and mutant-ligand systems are displayed. (a) Mulength: 99). (b) 1J3K (mutant-ligand, protein length: 231) and 1J3I (WTP-ligand, proteinprotein length: 329).
and neutralized system, we carried out a short minimization,heated the system to the experimental temperature, equilibratedthe system at constant pressure, and implemented a productionsimulation that produced the trajectory for analysis. To guaranteereliable production simulations, we investigated the backboneRMSD curves of the protein-ligand systems, referring to their start-ing structures. Fig. 4 shows the backbone RMSD curves, at an inter-val of 2 ps in the equilibration period, of several examples. Aspresented in Fig. 4, equilibration of these systems can be verifiedby the stable RMSD curves, and mutant-ligand systems mostlyhave a larger RMSD than WTP-ligand systems. For computationalloads, a solvated complex comprising a protein of 311 residuesand a ligand in explicit solvent costed 2.65 h for running a 2 ns pro-duction simulation on our server (NVIDIA Tesla K40c GPU).
3.3. Local geometrical features for characterizing protein-ligandbinding affinity change upon mutation
Based on a number of local geometrical features includingcloseness, SASA of ligand-binding site, orientation, contacts andinterfacial hydrogen bonds, we characterized the differencebetween each pair of WTP-ligand and mutant-ligand systems usingaverage difference, trajectory-wise distance and difference trajec-tory (Section 2.3.2). For the two groups of mutations (D and I),the distributions of the features extracted as average differencesare presented in Fig. 5a. Upon mutations, the average closeness dif-ferences in group I are slightly higher than those in group D, indi-cating that the increase in closeness from the WTP-ligand systemsto the mutant-ligand systems is higher in group I. Upon mutations,group I has a lower negative average difference in binding-site
curves referring to their starting structures. RMSD curves at an interval of 2 ps oftant-ligand: PDB ID of 2IEO (protein length: 99), andWTP-ligand: ID of 2IEN (proteinlength: 233). (c) 1E2L (mutant-ligand, protein length: 329) and 1E2K (WTP-ligand,
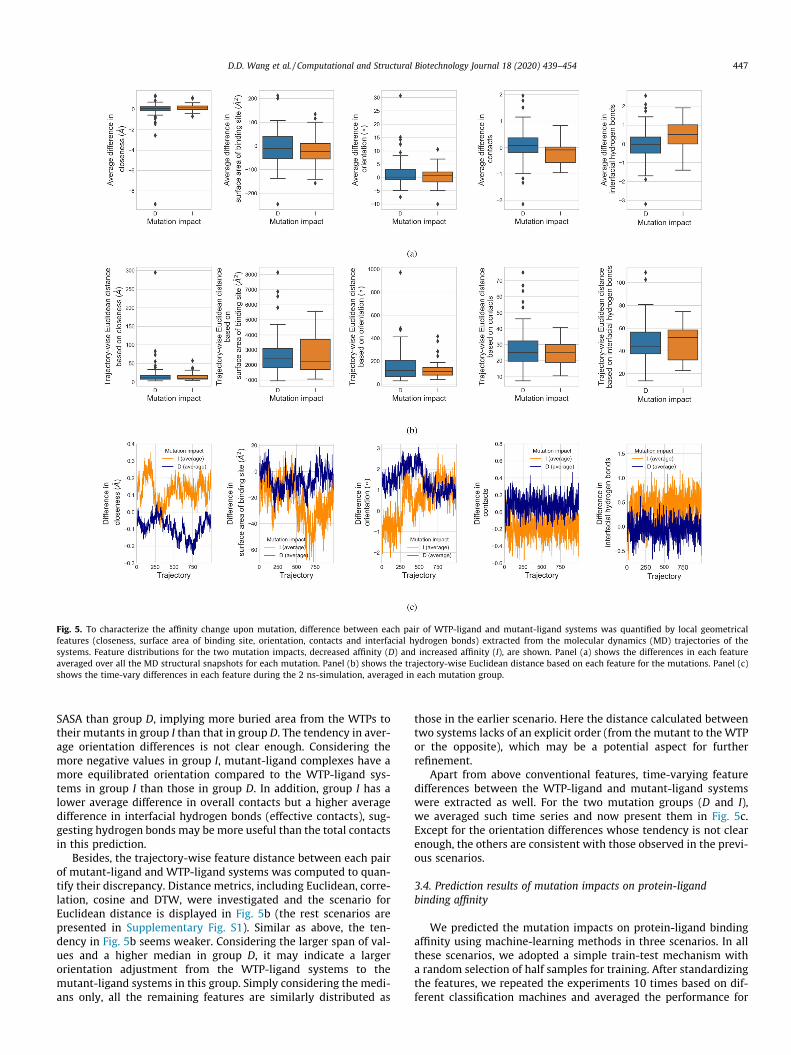
Fig. 5. To characterize the affinity change upon mutation, difference between each pair of WTP-ligand and mutant-ligand systems was quantified by local geometricalfeatures (closeness, surface area of binding site, orientation, contacts and interfacial hydrogen bonds) extracted from the molecular dynamics (MD) trajectories of thesystems. Feature distributions for the two mutation impacts, decreased affinity (D) and increased affinity (I), are shown. Panel (a) shows the differences in each featureaveraged over all the MD structural snapshots for each mutation. Panel (b) shows the trajectory-wise Euclidean distance based on each feature for the mutations. Panel (c)shows the time-vary differences in each feature during the 2 ns-simulation, averaged in each mutation group.
D.D. Wang et al. / Computational and Structural Biotechnology Journal 18 (2020) 439–454 447
SASA than group D, implying more buried area from the WTPs totheir mutants in group I than that in group D. The tendency in aver-age orientation differences is not clear enough. Considering themore negative values in group I, mutant-ligand complexes have amore equilibrated orientation compared to the WTP-ligand sys-tems in group I than those in group D. In addition, group I has alower average difference in overall contacts but a higher averagedifference in interfacial hydrogen bonds (effective contacts), sug-gesting hydrogen bonds may be more useful than the total contactsin this prediction.
Besides, the trajectory-wise feature distance between each pairof mutant-ligand and WTP-ligand systems was computed to quan-tify their discrepancy. Distance metrics, including Euclidean, corre-lation, cosine and DTW, were investigated and the scenario forEuclidean distance is displayed in Fig. 5b (the rest scenarios arepresented in Supplementary Fig. S1). Similar as above, the ten-dency in Fig. 5b seems weaker. Considering the larger span of val-ues and a higher median in group D, it may indicate a largerorientation adjustment from the WTP-ligand systems to themutant-ligand systems in this group. Simply considering the medi-ans only, all the remaining features are similarly distributed as
those in the earlier scenario. Here the distance calculated betweentwo systems lacks of an explicit order (from the mutant to the WTPor the opposite), which may be a potential aspect for furtherrefinement.
Apart from above conventional features, time-varying featuredifferences between the WTP-ligand and mutant-ligand systemswere extracted as well. For the two mutation groups (D and I),we averaged such time series and now present them in Fig. 5c.Except for the orientation differences whose tendency is not clearenough, the others are consistent with those observed in the previ-ous scenarios.
3.4. Prediction results of mutation impacts on protein-ligandbinding affinity
We predicted the mutation impacts on protein-ligand bindingaffinity using machine-learning methods in three scenarios. In allthese scenarios, we adopted a simple train-test mechanism witha random selection of half samples for training. After standardizingthe features, we repeated the experiments 10 times based on dif-ferent classification machines and averaged the performance for
448 D.D. Wang et al. / Computational and Structural Biotechnology Journal 18 (2020) 439–454
evaluation. Evaluation was based on the overall accuracy and bal-anced F1 score. Energy-based prediction (MD simulation-dependent) and descriptor-based prediction were also performedas benchmarks. Both MM/PBSA and MM/GBSA protocols for theenergy calculations were employed. As descriptors for affinitychange upon mutation, MIDs (Eqs. (16)–(19)) were constructedbased on descriptors for ligands and proteins (lig:const, pro:aa-comp; lig:kappa, pro:aacomp; lig:top, pro:aacomp; lig:const, pro:ctd;lig:kappa, pro:ctd; lig:top, pro:ctd; lig:const, pro:paacomp; lig:kappa,pro:paacomp; lig:top, pro:paacomp or lig:all, pro:all), and handled
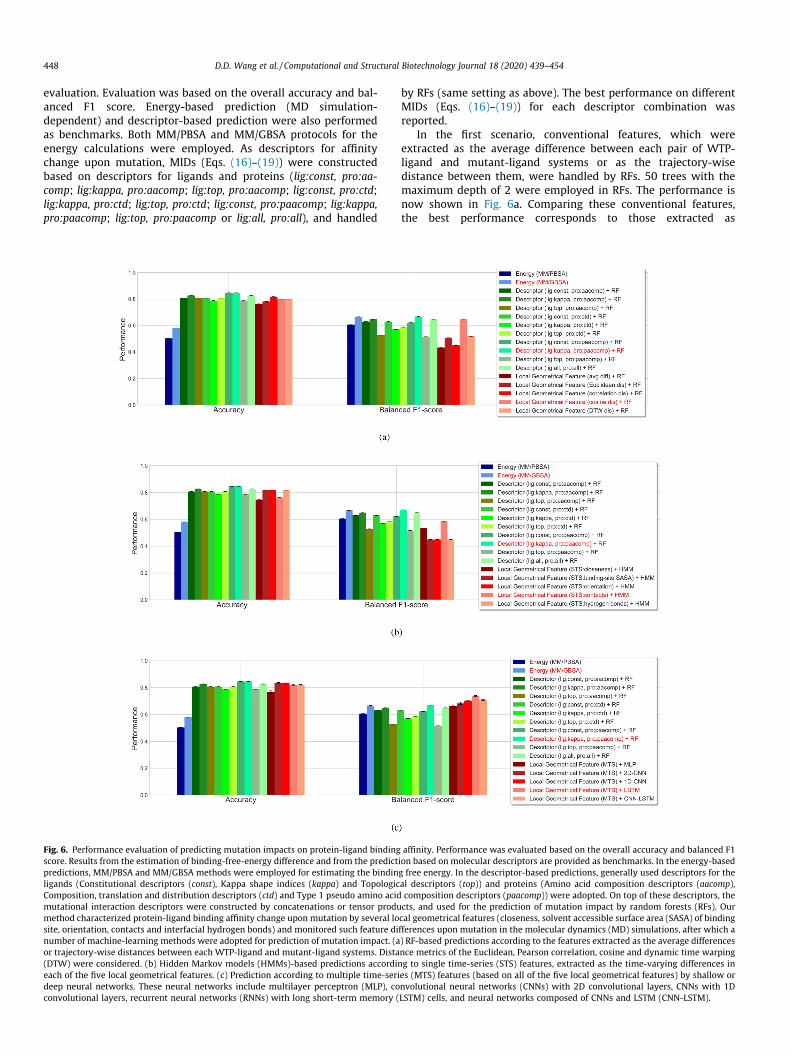
Fig. 6. Performance evaluation of predicting mutation impacts on protein-ligand bindingscore. Results from the estimation of binding-free-energy difference and from the predictpredictions, MM/PBSA and MM/GBSA methods were employed for estimating the bindinligands (Constitutional descriptors (const), Kappa shape indices (kappa) and TopologicComposition, translation and distribution descriptors (ctd) and Type 1 pseudo amino acidmutational interaction descriptors were constructed by concatenations or tensor produmethod characterized protein-ligand binding affinity change upon mutation by several losite, orientation, contacts and interfacial hydrogen bonds) and monitored such feature dinumber of machine-learning methods were adopted for prediction of mutation impact. (aor trajectory-wise distances between each WTP-ligand and mutant-ligand systems. Dista(DTW) were considered. (b) Hidden Markov models (HMMs)-based predictions accordineach of the five local geometrical features. (c) Prediction according to multiple time-serideep neural networks. These neural networks include multilayer perceptron (MLP), coconvolutional layers, recurrent neural networks (RNNs) with long short-term memory (
by RFs (same setting as above). The best performance on differentMIDs (Eqs. (16)–(19)) for each descriptor combination wasreported.
In the first scenario, conventional features, which wereextracted as the average difference between each pair of WTP-ligand and mutant-ligand systems or as the trajectory-wisedistance between them, were handled by RFs. 50 trees with themaximum depth of 2 were employed in RFs. The performance isnow shown in Fig. 6a. Comparing these conventional features,the best performance corresponds to those extracted as
affinity. Performance was evaluated based on the overall accuracy and balanced F1ion based on molecular descriptors are provided as benchmarks. In the energy-basedg free energy. In the descriptor-based predictions, generally used descriptors for theal descriptors (top)) and proteins (Amino acid composition descriptors (aacomp),composition descriptors (paacomp)) were adopted. On top of these descriptors, thects, and used for the prediction of mutation impact by random forests (RFs). Ourcal geometrical features (closeness, solvent accessible surface area (SASA) of bindingfferences upon mutation in the molecular dynamics (MD) simulations, after which a) RF-based predictions according to the features extracted as the average differencesnce metrics of the Euclidean, Pearson correlation, cosine and dynamic time warpingg to single time-series (STS) features, extracted as the time-varying differences ines (MTS) features (based on all of the five local geometrical features) by shallow ornvolutional neural networks (CNNs) with 2D convolutional layers, CNNs with 1DLSTM) cells, and neural networks composed of CNNs and LSTM (CNN-LSTM).

D.D. Wang et al. / Computational and Structural Biotechnology Journal 18 (2020) 439–454 449
trajectory-wise cosine distance (accuracy: 0.8, balanced F1 score:0.650). Using such conventional features generally resulted in abetter accuracy than energy-based prediction (MM/GBSA: 0.581,MM/PBSA: 0.505) while a lower or comparable balanced F1 score(MM/GBSA: 0.667, MM/PBSA: 0.606). Additionally, it underper-formed the descriptor-based prediction in both accuracy andbalanced F1 score (best descriptor-based prediction: lig:kappa,pro:paacomp; accuracy: 0.846, F1 score: 0.670). Although theprediction depending on average difference or trajectory-wisedistance was barely satisfactory, they can still provide some clueson the importance of involved local geometrical features in theprediction, which can be quantified by a tree ensemble like RFs.Here we used the best performer (trajectory-wise cosinedistance + RF) to measure the relative importance of these features.As shown in Fig. 7a, SASA of the binding site has the highest impor-tance in this prediction, followed by interfacial hydrogen bonds,contacts, orientation and closeness. In this prediction, we imposeda relatively stringent threshold (3Å) on the contacts features. Tofurther investigate the effects of thresholds on such features, wemeasured the importance of contacts features extracted based ondifferent thresholds (3 Å to 7 Å) using the best performer(Fig. 7b). It partly shows a higher importance of closer protein-ligand contacts in such prediction.
Single time-series features outputted as the time-varying differ-ence upon mutation in the MD simulations were considered in thesecond scenario. HMMs were applied with the number of hiddenstates set as 3, the emissions assumed to be Gaussian, and themodel parameters randomly initiated and trained using theBaum-Welch algorithm. Concerning the five time-series featuresgenerated based on the local geometrical features, the predictionperformance is shown in Fig. 6b. Similar as in the first scenario,combining single time-series features and HMMs failed to refinethe balanced F1 score. The best performance was derived whenemploying the time-series contacts differences, corresponding toan accuracy of 0.764 and a balanced F1 score of 0.586. This failedto mitigate the imbalanced classification problem; therefore, wecombined all the time-series features and attempted to handlethem using deep-learning techniques in what follows.
In the third scenario, we combined all the time-series featuresas two-dimensional features and employed shallow or deep neuralnetworks to predict the mutation impacts. The binary cross-entropy loss function and Adam optimizer were used in each train-ing process, and a higher class-weight was assigned to the minority
Fig. 7. Feature importance evaluated by the random forest model, with the features extrfeatures. (a) The relative importance of five local geometrical features was evaluated(3 Å;4 Å;5 Å;6 Å;7Å), was evaluated.
class (I) to balance the samples. MLP with a feature-flatteninglayer, a densely connected layer (50 hidden nodes, ReLU activa-tion), a dropout layer (ratio of 25%) and an output layer (sigmoidactivation) was first constructed. We then applied CNNs with a2D (5� 5) or 1D (3� 1) convolutional layer, a 1D max poolinglayer (2� 1), a dropout layer, a densely connected layer, a dropoutlayer and an output layer. The other parameters were similarlyassigned. Additionally, RNNs with LSTMwere assembled to processthe time-series features. The LSTM model contains recurrent LSTMlayers (50 hidden units, combined outputs for each time step),dropout layers between the recurrent layers, a feature-flatteninglayer, a densely connected layer and an output layer. Lastly, weassembled an CNN-LSTM model that is composed of a 1D CNN partand an LSTM part for the prediction, with all the other parametersset the same as above. The prediction performance is now shownin Fig. 6c. Aside from the shallow neural networks (MLP), all theother deep learning models improved both the accuracy(0.820 0.836) and balanced F1 score (0.683 0.738), comparedto the energy estimation methods. Compared to the descriptor-based predictions (best performance: lig:kappa, pro:paacomp, accu-racy: 0.846, F1 score: 0.670), these deep learning models improvedthe balanced F1 score (0.683 0.738). Especially for the LSTMmodel, the best performance (accuracy: 0.820, balanced F1 score:0.738) was obtained, guaranteeing its capacity for analyzing suchtime-series data. CNNs resulted in a slightly weaker performance(in balanced F1 score), which is due in part to the lack of spatialstructures of our input data.
4. Discussion
4.1. Sampling frequency in MD simulations
In our study, the trajectory frames were collected every 2 ps inthe MD simulations for feature extraction. Here, we investigatedwhether the sampling frequency of trajectory frames will influencethe prediction performance. Specifically, based on the multipletime-series features (Section 2.3.2) and LSTM model, we used dif-ferent sampling frequencies (per 2;4; . . . ;50ps) for collecting tra-jectory frames. The prediction results corresponding to differentsampling frequencies are plotted in Fig. 8, where a gradual declineof performance is exhibited and a higher sampling frequency (suchas < per 10 ps) should be used to guarantee a fair performance.
acted as trajectory-wise Cosine distances upon mutation based on local geometrical. (b) The relative importance of contacts features, based on different thresholds
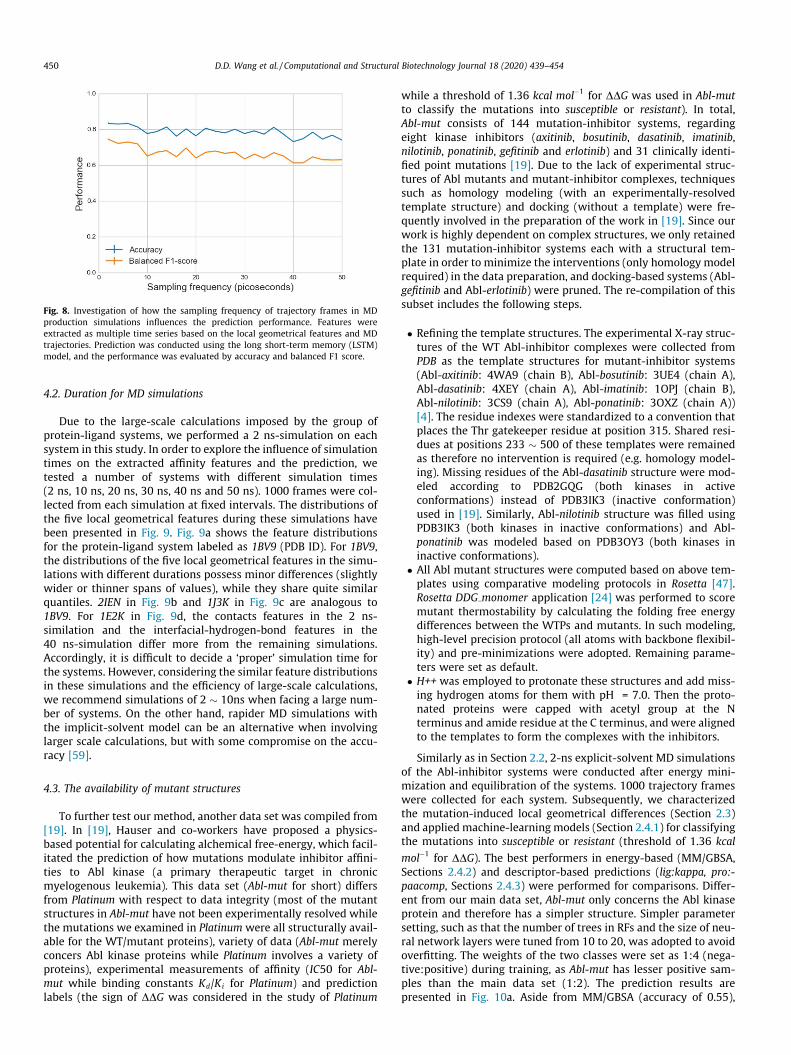
Fig. 8. Investigation of how the sampling frequency of trajectory frames in MDproduction simulations influences the prediction performance. Features wereextracted as multiple time series based on the local geometrical features and MDtrajectories. Prediction was conducted using the long short-term memory (LSTM)model, and the performance was evaluated by accuracy and balanced F1 score.
450 D.D. Wang et al. / Computational and Structural Biotechnology Journal 18 (2020) 439–454
4.2. Duration for MD simulations
Due to the large-scale calculations imposed by the group ofprotein-ligand systems, we performed a 2 ns-simulation on eachsystem in this study. In order to explore the influence of simulationtimes on the extracted affinity features and the prediction, wetested a number of systems with different simulation times(2 ns, 10 ns, 20 ns, 30 ns, 40 ns and 50 ns). 1000 frames were col-lected from each simulation at fixed intervals. The distributions ofthe five local geometrical features during these simulations havebeen presented in Fig. 9. Fig. 9a shows the feature distributionsfor the protein-ligand system labeled as 1BV9 (PDB ID). For 1BV9,the distributions of the five local geometrical features in the simu-lations with different durations possess minor differences (slightlywider or thinner spans of values), while they share quite similarquantiles. 2IEN in Fig. 9b and 1J3K in Fig. 9c are analogous to1BV9. For 1E2K in Fig. 9d, the contacts features in the 2 ns-similation and the interfacial-hydrogen-bond features in the40 ns-simulation differ more from the remaining simulations.Accordingly, it is difficult to decide a ‘proper’ simulation time forthe systems. However, considering the similar feature distributionsin these simulations and the efficiency of large-scale calculations,we recommend simulations of 2 10ns when facing a large num-ber of systems. On the other hand, rapider MD simulations withthe implicit-solvent model can be an alternative when involvinglarger scale calculations, but with some compromise on the accu-racy [59].
4.3. The availability of mutant structures
To further test our method, another data set was compiled from[19]. In [19], Hauser and co-workers have proposed a physics-based potential for calculating alchemical free-energy, which facil-itated the prediction of how mutations modulate inhibitor affini-ties to Abl kinase (a primary therapeutic target in chronicmyelogenous leukemia). This data set (Abl-mut for short) differsfrom Platinum with respect to data integrity (most of the mutantstructures in Abl-mut have not been experimentally resolved whilethe mutations we examined in Platinum were all structurally avail-able for the WT/mutant proteins), variety of data (Abl-mut merelyconcers Abl kinase proteins while Platinum involves a variety ofproteins), experimental measurements of affinity (IC50 for Abl-mut while binding constants Kd/Ki for Platinum) and predictionlabels (the sign of DDG was considered in the study of Platinum
while a threshold of 1.36 kcal mol�1 for DDG was used in Abl-mutto classify the mutations into susceptible or resistant). In total,Abl-mut consists of 144 mutation-inhibitor systems, regardingeight kinase inhibitors (axitinib, bosutinib, dasatinib, imatinib,nilotinib, ponatinib, gefitinib and erlotinib) and 31 clinically identi-fied point mutations [19]. Due to the lack of experimental struc-tures of Abl mutants and mutant-inhibitor complexes, techniquessuch as homology modeling (with an experimentally-resolvedtemplate structure) and docking (without a template) were fre-quently involved in the preparation of the work in [19]. Since ourwork is highly dependent on complex structures, we only retainedthe 131 mutation-inhibitor systems each with a structural tem-plate in order to minimize the interventions (only homology modelrequired) in the data preparation, and docking-based systems (Abl-gefitinib and Abl-erlotinib) were pruned. The re-compilation of thissubset includes the following steps.
� Refining the template structures. The experimental X-ray struc-tures of the WT Abl-inhibitor complexes were collected fromPDB as the template structures for mutant-inhibitor systems(Abl-axitinib: 4WA9 (chain B), Abl-bosutinib: 3UE4 (chain A),Abl-dasatinib: 4XEY (chain A), Abl-imatinib: 1OPJ (chain B),Abl-nilotinib: 3CS9 (chain A), Abl-ponatinib: 3OXZ (chain A))[4]. The residue indexes were standardized to a convention thatplaces the Thr gatekeeper residue at position 315. Shared resi-dues at positions 233 500 of these templates were remainedas therefore no intervention is required (e.g. homology model-ing). Missing residues of the Abl-dasatinib structure were mod-eled according to PDB2GQG (both kinases in activeconformations) instead of PDB3IK3 (inactive conformation)used in [19]. Similarly, Abl-nilotinib structure was filled usingPDB3IK3 (both kinases in inactive conformations) and Abl-ponatinib was modeled based on PDB3OY3 (both kinases ininactive conformations).
� All Abl mutant structures were computed based on above tem-plates using comparative modeling protocols in Rosetta [47].Rosetta DDG monomer application [24] was performed to scoremutant thermostability by calculating the folding free energydifferences between the WTPs and mutants. In such modeling,high-level precision protocol (all atoms with backbone flexibil-ity) and pre-minimizations were adopted. Remaining parame-ters were set as default.
� H++ was employed to protonate these structures and add miss-ing hydrogen atoms for them with pH = 7.0. Then the proto-nated proteins were capped with acetyl group at the Nterminus and amide residue at the C terminus, and were alignedto the templates to form the complexes with the inhibitors.
Similarly as in Section 2.2, 2-ns explicit-solvent MD simulationsof the Abl-inhibitor systems were conducted after energy mini-mization and equilibration of the systems. 1000 trajectory frameswere collected for each system. Subsequently, we characterizedthe mutation-induced local geometrical differences (Section 2.3)and applied machine-learning models (Section 2.4.1) for classifyingthe mutations into susceptible or resistant (threshold of 1.36 kcal
mol�1 for DDG). The best performers in energy-based (MM/GBSA,Sections 2.4.2) and descriptor-based predictions (lig:kappa, pro:-paacomp, Sections 2.4.3) were performed for comparisons. Differ-ent from our main data set, Abl-mut only concerns the Abl kinaseprotein and therefore has a simpler structure. Simpler parametersetting, such as that the number of trees in RFs and the size of neu-ral network layers were tuned from 10 to 20, was adopted to avoidoverfitting. The weights of the two classes were set as 1:4 (nega-tive:positive) during training, as Abl-mut has lesser positive sam-ples than the main data set (1:2). The prediction results arepresented in Fig. 10a. Aside from MM/GBSA (accuracy of 0.55),
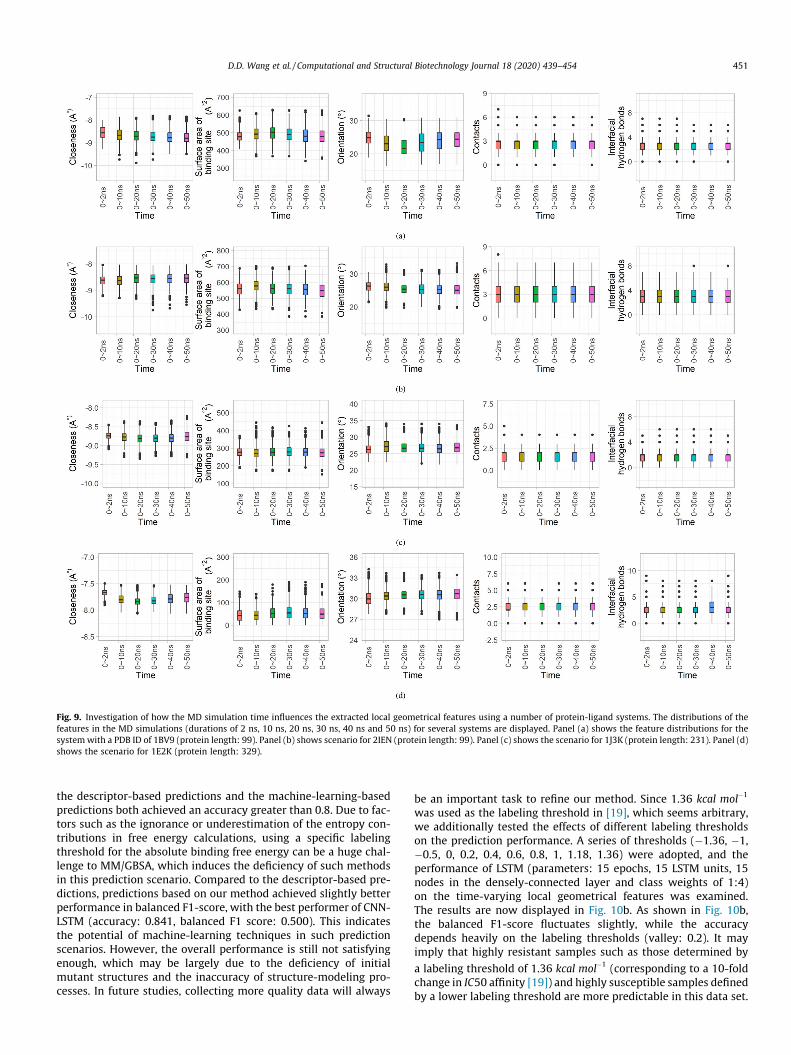
Fig. 9. Investigation of how the MD simulation time influences the extracted local geometrical features using a number of protein-ligand systems. The distributions of thefeatures in the MD simulations (durations of 2 ns, 10 ns, 20 ns, 30 ns, 40 ns and 50 ns) for several systems are displayed. Panel (a) shows the feature distributions for thesystemwith a PDB ID of 1BV9 (protein length: 99). Panel (b) shows scenario for 2IEN (protein length: 99). Panel (c) shows the scenario for 1J3K (protein length: 231). Panel (d)shows the scenario for 1E2K (protein length: 329).
D.D. Wang et al. / Computational and Structural Biotechnology Journal 18 (2020) 439–454 451
the descriptor-based predictions and the machine-learning-basedpredictions both achieved an accuracy greater than 0.8. Due to fac-tors such as the ignorance or underestimation of the entropy con-tributions in free energy calculations, using a specific labelingthreshold for the absolute binding free energy can be a huge chal-lenge to MM/GBSA, which induces the deficiency of such methodsin this prediction scenario. Compared to the descriptor-based pre-dictions, predictions based on our method achieved slightly betterperformance in balanced F1-score, with the best performer of CNN-LSTM (accuracy: 0.841, balanced F1 score: 0.500). This indicatesthe potential of machine-learning techniques in such predictionscenarios. However, the overall performance is still not satisfyingenough, which may be largely due to the deficiency of initialmutant structures and the inaccuracy of structure-modeling pro-cesses. In future studies, collecting more quality data will always
be an important task to refine our method. Since 1.36 kcal mol�1
was used as the labeling threshold in [19], which seems arbitrary,we additionally tested the effects of different labeling thresholdson the prediction performance. A series of thresholds (�1.36, �1,�0.5, 0, 0.2, 0.4, 0.6, 0.8, 1, 1.18, 1.36) were adopted, and theperformance of LSTM (parameters: 15 epochs, 15 LSTM units, 15nodes in the densely-connected layer and class weights of 1:4)on the time-varying local geometrical features was examined.The results are now displayed in Fig. 10b. As shown in Fig. 10b,the balanced F1-score fluctuates slightly, while the accuracydepends heavily on the labeling thresholds (valley: 0.2). It mayimply that highly resistant samples such as those determined by
a labeling threshold of 1.36 kcal mol�1 (corresponding to a 10-foldchange in IC50 affinity [19]) and highly susceptible samples definedby a lower labeling threshold are more predictable in this data set.

Fig. 10. Performance evaluation of predicting mutation impacts on protein-ligand binding affinity for the Abl-mut data set. Performance was evaluated based on the overallaccuracy and balanced F1 score. (a) Results of our method, which uses machine-learning techniques to monitor the time-varying local geometrical feature differences uponmutation in the molecular dynamics (MD) simulations, are displayed. Shallow or deep neural networks include multilayer perceptron (MLP), convolutional neural networks(CNNs) with 2D convolutional layers, CNNs with 1D convolutional layers, recurrent neural networks (RNNs) with long short-term memory (LSTM) cells, and neural networkscomposed of CNNs and LSTM (CNN-LSTM) were used. Results from the estimation of binding-free-energy difference (MM/GBSA) and from the prediction based on moleculardescriptors (Kappa shape indices (kappa) for ligands and Type 1 pseudo amino acid composition descriptors (paacomp) for proteins, and random forests (RFs) for predictions)are provided for comparisons. (b) Evaluation of the effects of different labeling cutoffs on the prediction performance. Prediction performance was evaluated based on LSTM.
452 D.D. Wang et al. / Computational and Structural Biotechnology Journal 18 (2020) 439–454
4.4. pH-dependence and protonation states in protein-ligand binding
Practically, all biological processes in different compartments ofthe cell are pH-dependent, and macromolecules normally maintainspecific pH-dependent characteristics to function properly andinteract with the partners [50]. The pH-dependence in receptor-ligand interactions is principally due to the protonation-statechanges of some titratable groups (with unusual pKa’s) upon bind-ing, which may involve proton uptake/release [41]. These protona-tion states must be properly predicted prior to or after binding,which can be accomplished accurately with the unbound or com-plex structures provided and with the pH of binding known. How-ever, the modeling becomes more complicated if the unbound orcomplex structures are not available or if the pH of binding isunknown (frequently true). Additionally, predicting the protona-tion states during the binding process, involving factors such asbinding-induced conformational changes, becomes much morecomplicated. We focused on characterizing the bound protein-ligand complexes in their MD simulations, and therefore thechanges of protonation states upon binding were not consideredhere. For accurately assigning the protonation states to the boundcomplexes, we employed H++ [15] based on the experimental pHvalues in the Platinum database. For any experiment with a non-specific pH value, a default value of 7.0 was used. For these exper-iments, such setting may affect the assignments of protonationstates to the complexes, which may also downgrade our followingprediction performance. As a potential refinement of our work,non-standard MD simulations, such as those based on constant-pH protocols [36], can be explored to more carefully monitor theprotonation-state changes of titratable groups during thedynamics.
5. Conclusion
In this paper we have described our study on predicting theimpacts of mutations on protein-ligand binding affinity based onMD simulations and local geometrical features. Different frommany computational studies in this field that lack of experimentalvalidation, we initiated our study based on consolidated databasesof experimentally determined data (from Platinum and PDB). For
evaluating affinity change upon mutation, we measured the fea-ture differences between each pair of WTP-ligand and mutant-ligand systems in their dynamics simulations. Such differenceswere quantified according to average difference over all structuralsnapshots, trajectory-wise distance or time-vary differences. Forthe resulting conventional or time-series features, we employeda number of machine-learning methods to predict the impacts ofmutations. Compared to the benchmark performances yielded bythe energy estimation and by the molecular-descriptor investiga-tion, our method induced an improved balanced F1 score whilesustained the accuracy. Especially, deep-learning (LSTM) modelswell handled the extracted time-series features, resulting in thebest prediction performance in balanced F1 score. This highlightsthe effectiveness of the extracted features and the deep-learningtechniques in this problem.
In future studies, more efficient methods to evaluate theprotein-ligand binding affinity and to longitudinally analyze suchaffinity measures in molecular dynamics will be explored. Addi-tionally, sophisticated strategies such as generative models formitigating the imbalance of samples will be investigated. Overall,such studies will contribute to a better understanding of theprotein-ligand recognition and of the role of missense mutationsin genetic diseases and the emergence of drug resistance.
CRediT authorship contribution statement
Debby D. Wang: Conceptualization, Methodology, Software,Formal analysis, Writing - original draft. Le Ou-Yang: Methodol-ogy, Formal analysis, Visualization. Haoran Xie: Software,Resources, Writing - review & editing. Mengxu Zhu: Data curation,Investigation. Hong Yan: Supervision, Writing - review & editing.
Acknowledgment
This work was support by the Hong Kong Research GrantsCouncil [Project CityU 11200818]; City University of Hong Kong[Projects 9610034 and 9610460]; the Shenzhen FundamentalResearch Program [Grant JCYJ20170817095210760]; National Nat-ural Science Foundation of China [Grant 61602309]; GuangdongBasic and Applied Basic Research Foundation [Grant
D.D. Wang et al. / Computational and Structural Biotechnology Journal 18 (2020) 439–454 453
2019A1515011384]; the Interdisciplinary Research Scheme of theDean’s Research Fund 2018-19 [FLASS/DRF/IDS-3] and Departmen-tal Collaborative Research Fund 2019 [MIT/DCRF-R2/18-19] of TheEducation University of Hong Kong.
Appendix A. Supplementary data
Supplementary data associated with this article can be found, inthe online version, at https://doi.org/10.1016/j.csbj.2020.02.007.
References
[1] Agatonovic-Kustrin S, Beresford R, Yusof APM. Theoretically-derived moleculardescriptors important in human intestinal absorption. J Pharm Biomed Anal2001;25:227–37.
[2] Basak SC, Balaban AT, Grunwald GD, Gute BD. Topological indices: their natureand mutual relatedness. J Chem Inf Comput Sci 2000;40:891–8.
[3] Bava KA, Gromiha MM, Uedaira H, Kitajima K, Sarai A. Protherm, version 4.0:thermodynamic database for proteins and mutants. Nucleic Acids Res2004;32:D120–1.
[4] Berman HM, Bourne PE, Westbrook J, Zardecki C. The protein data bank. In:Protein structure. CRC Press; 2003. p. 394–410.
[5] Case D, Ben-Shalom I, Brozell S, Cerutti D, Cheatham III, T, Cruzeiro V, Darden T,Duke R, Ghoreishi D, Gilson M, et al. Amber 2018: San francisco; 2018..
[6] Chou K-C. Prediction of protein cellular attributes using pseudo-amino acidcomposition. Proteins: Struct Funct Bioinf 2001;43:246–55.
[7] Deng W, Breneman C, Embrechts MJ. Predicting protein- ligand bindingaffinities using novel geometrical descriptors and machine-learning methods. JChem Inf Comput Sci 2004;44:699–703.
[8] Devillers J, Balaban AT. Topological indices and related descriptors in QSAR andQSPAR. CRC Press; 2000.
[9] Devillers J, Domine D, Guillon C, Bintein S, Karcher W. Prediction of partitioncoefficients (log p oct) using autocorrelation descriptors. SAR QSAR EnvironRes 1997;7:151–72.
[10] Dong J, Yao Z-J, Zhang L, Luo F, Lin Q, Lu A-P, Chen AF, Cao D-S. Pybiomed: apython library for various molecular representations of chemicals, proteinsand dnas and their interactions. J Cheminf 2018;10:16.
[11] Dubchak I, Muchnik I, Holbrook SR, Kim S-H. Prediction of protein folding classusing global description of amino acid sequence. Proc Natl Acad Sci1995;92:8700–4.
[12] Genheden S, Ryde U. The mm/pbsa and mm/gbsa methods to estimate ligand-binding affinities. Expert Opin Drug Discov 2015;10:449–61.
[13] Ghai R, Falconer RJ, Collins BM. Applications of isothermal titrationcalorimetry in pure and applied research-survey of the literature from 2010.J Mol Recogn 2012;25:32–52.
[14] Giammona DA. An examination of conformational flexibility in porphyrins andbulky-ligand binding in myoglobin; 1984..
[15] Gordon JC, Myers JB, Folta T, Shoja V, Heath LS, Onufriev A. H++: a server forestimating p k as and adding missing hydrogens to macromolecules. NucleicAcids Res 2005;33:W368–71.
[16] Gotz AW, Williamson MJ, Xu D, Poole D, Le Grand S, Walker RC. Routinemicrosecond molecular dynamics simulations with amber on gpus. 1.Generalized born. J Chem Theory Comput 2012;8:1542–55.
[17] Graves A, Mohamed A-r, Hinton G. Speech recognition with deep recurrentneural networks. In 2013 IEEE international conference on acoustics, speechand signal processing. IEEE; 2013. pp. 6645–6649..
[18] Hall LH, Kier LB. The molecular connectivity chi indexes and kappa shapeindexes in structure-property modeling. Rev Comput Chem 1991;5:367–422.
[19] Hauser K, Negron C, Albanese SK, Ray S, Steinbrecher T, Abel R, Chodera JD,Wang L. Predicting resistance of clinical abl mutations to targeted kinaseinhibitors using alchemical free-energy calculations. Commun Biol 2018;1:70.
[20] Ho TK. Random decision forests. In Proceedings of 3rd international conferenceon document analysis and recognition. IEEE. vol. 1; 1995. pp. 278–282.
[21] Hou T, Zhang W, Wang J, Wang W. Predicting drug resistance of the hiv-1protease using molecular interaction energy components. Proteins: StructFunct Bioinf 2009;74:837–46.
[22] Jubb HC, Pandurangan AP, Turner MA, Ochoa-Montano B, Blundell TL, AscherDB. Mutations at protein-protein interfaces: small changes over big surfaceshave large impacts on human health. Prog Biophys Mol Biol 2017;128:3–13.
[23] Kingma DP, Ba J. Adam: a method for stochastic optimization. arXiv:1412.6980; 2014..
[24] Kortemme T, Baker D. A simple physical model for binding energy hot spots inprotein–protein complexes. Proc Natl Acad Sci 2002;99:14116–21.
[25] Krizhevsky A, Sutskever I, Hinton GE. Imagenet classification with deepconvolutional neural networks. In Advances in neural information processingsystems; 2012. pp. 1097–1105..
[26] Kucukkal TG, Petukh M, Li L, Alexov E. Structural and physico-chemical effectsof disease and non-disease nssnps on proteins. Curr Opin Struct Biol2015;32:18–24.
[27] Kumar MS, Bava KA, Gromiha MM, Prabakaran P, Kitajima K, Uedaira H, SaraiA. Protherm and pronit: thermodynamic databases for proteins and protein–nucleic acid interactions. Nucleic Acids Res 2006;34:D204–6.
[28] Li P, Roberts BP, Chakravorty DK, Merz Jr KM. Rational design of particle meshewald compatible lennard-jones parameters for+ 2 metal cations in explicitsolvent. J Chem Theory Comput 2013;9:2733–48.
[29] Li Z-R, Lin HH, Han L, Jiang L, Chen X, Chen YZ. Profeat: a web server forcomputing structural and physicochemical features of proteins and peptidesfrom amino acid sequence. Nucleic Acids Res 2006;34:W32–7.
[30] Liu W, Wang Z, Liu X, Zeng N, Liu Y, Alsaadi FE. A survey of deep neuralnetwork architectures and their applications. Neurocomputing2017;234:11–26.
[31] Lori C, Lantella A, Pasquo A, Alexander LT, Knapp S, Chiaraluce R, Consalvi V.Effect of single amino acid substitution observed in cancer on pim-1 kinasethermodynamic stability and structure. PloS One 2013;8:e64824.
[32] Ma L, Wang DD, Huang Y, Yan H, Wong MP, Lee VH. Egfr mutantstructural database: computationally predicted 3d structures and thecorresponding binding free energies with gefitinib and erlotinib. BMCBioinf 2015;16:85.
[33] Ma L, Zou B, Yan H. Identifying egfr mutation-induced drug resistance basedon alpha shape model analysis of the dynamics. Proteome Sci 2016;14:12.
[34] Masi A, Cicchi R, Carloni A, Pavone FS, Arcangeli A. Optical methods in thestudy of protein-protein interactions. In: Integrins and Ion Channels. Springer;2010. p. 33–42.
[35] Moal IH, Fernández-Recio J. Skempi: a structural kinetic and energeticdatabase of mutant protein interactions and its use in empirical models.Bioinformatics 2012;28:2600–7.
[36] Mongan J, Case DA, McCAMMON JA. Constant ph molecular dynamics ingeneralized born implicit solvent. J Comput Chem 2004;25:2038–48.
[37] Nanni L, Brahnam S, Lumini A. Prediction of protein structure classes byincorporating different protein descriptors into general chou’s pseudo aminoacid composition. J Theor Biol 2014;360:109–16.
[38] Pandurangan AP, Ochoa-Monta no B, Ascher DB, Blundell TL. Sdm: a server forpredicting effects of mutations on protein stability. Nucleic Acids Res 2017;45:W229–35.
[39] Perryman AL, Lin J-H, McCammon JA. Hiv-1 protease molecular dynamics of awild-type and of the v82f/i84v mutant: possible contributions to drugresistance and a potential new target site for drugs. Protein Sci2004;13:1108–23.
[40] Pettersen EF, Goddard TD, Huang CC, Couch GS, Greenblatt DM, Meng EC,Ferrin TE. Ucsf chimera-a visualization system for exploratory research andanalysis. J Comput Chem 2004;25:1605–12.
[41] Petukh M, Stefl S, Alexov E. The role of protonation states in ligand-receptorrecognition and binding. Curr Pharmaceutical Design 2013;19:4182–90.
[42] Phillip Y, Kiss V, Schreiber G. Protein-binding dynamics imaged in a living cell.Proc Natl Acad Sci 2012;109:1461–6.
[43] Pires DE, Blundell TL, Ascher DB. Platinum: a database of experimentallymeasured effects of mutations on structurally defined protein–ligandcomplexes. Nucleic Acids Res 2014;43:D387–91.
[44] Pires DE, Blundell TL, Ascher DB. mcsm-lig: quantifying the effects ofmutations on protein-small molecule affinity in genetic disease andemergence of drug resistance. Scientific Rep 2016;6:29575.
[45] Placone J, He L, Del Piccolo N, Hristova K. Strong dimerization of wild-typeerbb2/neu transmembrane domain and the oncogenic val664glu mutant inmammalian plasma membranes. Biochim Biophys Acta 2014;1838:2326–30.
[46] Rabiner LR. A tutorial on hidden markov models and selected applications inspeech recognition. Proc IEEE 1989;77:257–86.
[47] Rohl CA, Strauss CE, Misura KM, Baker D. Protein structure prediction usingrosetta. In Methods in enzymology. Elsevier. vol. 383; 2004. pp. 66–93..
[48] Salomon-Ferrer R, Gotz AW, Poole D, Le Grand S, Walker RC. Routinemicrosecond molecular dynamics simulations with amber on gpus. 2.explicit solvent particle mesh ewald. J Chem Theory Comput 2013;9:3878–88.
[49] Srivastava N, Hinton G, Krizhevsky A, Sutskever I, Salakhutdinov R. Dropout: asimple way to prevent neural networks from overfitting. J Mach Learn Res2014;15:1929–58.
[50] Stefl S, Nishi H, Petukh M, Panchenko AR, Alexov E. Molecular mechanisms ofdisease-causing missense mutations. J Mol Biol 2013;425:3919–36.
[51] Todeschini R, Consonni V. Handbook of molecular descriptors, vol. 11. JohnWiley & Sons; 2008.
[52] Wang DD, Lee VH, Zhu G, Zou B, Ma L, Yan H. Selectivity profile of afatinib foregfr-mutated non-small-cell lung cancer. Mol BioSyst 2016;12:1552–63.
[53] Wang DD, Zhou W, Yan H, Wong M, Lee V. Personalized prediction of egfrmutation-induced drug resistance in lung cancer. Scientific Rep2013;3:2855.
[54] Weiser J, Shenkin PS, Still WC. Approximate atomic surfaces from linearcombinations of pairwise overlaps (lcpo). J Comput Chem 1999;20:217–30.
[55] Xia J-F, Han K, Huang D-S. Sequence-based prediction of protein-proteininteractions by means of rotation forest and autocorrelation descriptor.Protein Peptide Lett 2010;17:137–45.
[56] Yang F, Wu M, Li Y, Zheng G-Y, Cao H-Q, Sun W, Yang R, Zhang H, Sheng Y-H,Kong X-Q, et al. Mutation p. s335x in gata4 reduces its dna binding affinity andenhances cell apoptosis associated with ventricular septal defect. Curr MolMed 2013;13:993–9.

454 D.D. Wang et al. / Computational and Structural Biotechnology Journal 18 (2020) 439–454
[57] Zamora I, Oprea T, Cruciani G, Pastor M, Ungell A-L. Surface descriptors forprotein- ligand affinity prediction. J Med Chem 2003;46:25–33.
[58] Zhang C, Ma Y. Ensemble machine learning: methods andapplications. Springer; 2012.
[59] Zhang J, Zhang H, Wu T, Wang Q, van der Spoel D. Comparison of implicit andexplicit solvent models for the calculation of solvation free energy in organicsolvents. J Chem Theory Comput 2017;13:1034–43.
[60] Zhou W, Wang DD, Yan H, Wong M, Lee V. Prediction of anti-egfr drugresistance base on binding free energy and hydrogen bond analysis. In 2013
IEEE Symposium on Computational Intelligence in Bioinformatics andComputational Biology (CIBCB). IEEE; 2013. pp. 193–197..
[61] Zou B, Lee VH, Chen L, Ma L, Wang DD, Yan H. Deciphering mechanisms ofacquired t790m mutation after egfr inhibitors for nsclc by computationalsimulations. Scientific Rep 2017;7:6595.
[62] Zou B, Wang DD, Ma L, Chen L, Yan H. Analysis of the relationshipbetween lung cancer drug response level and atom connectivitydynamics based on trimmed delaunay triangulation. Chem Phys Lett2016;652:117–22.
Related Documents