International Scholarly Research Network ISRN Software Engineering Volume 2012, Article ID 823437, 8 pages doi:10.5402/2012/823437 Research Article Predicting Software Projects Cost Estimation Based on Mining Historical Data Hassan Najadat, 1 Izzat Alsmadi, 2 and Yazan Shboul 1 1 Computer Information Systems Department, Jordan University of Science and Technology, P.O. Box 3030, Irbid 22110, Jordan 2 Computer Information Systems Department, Yarmouk University, P.O. Box 566, Irbid 21163, Jordan Correspondence should be addressed to Izzat Alsmadi, [email protected] Received 18 November 2011; Accepted 16 January 2012 Academic Editors: J. Cao and O. Greevy Copyright © 2012 Hassan Najadat et al. This is an open access article distributed under the Creative Commons Attribution License, which permits unrestricted use, distribution, and reproduction in any medium, provided the original work is properly cited. In this research, a hybrid cost estimation model is proposed to produce a realistic prediction model that takes into consideration software project, product, process, and environmental elements. A cost estimation dataset is built from a large number of open source projects. Those projects are divided into three domains: communication, finance, and game projects. Several data mining techniques are used to classify software projects in terms of their development complexity. Data mining techniques are also used to study association between different software attributes and their relation to cost estimation. Results showed that finance metrics are usually the most complex in terms of code size and some other complexity metrics. Results showed also that games applications have higher values of the SLOCmath, coupling, cyclomatic complexity, and MCDC metrics. Information gain is used in order to evaluate the ability of object-oriented metrics to predict software complexity. MCDC metric is shown to be the first metric in deciding a software project complexity. A software project effort equation is created based on clustering and based on all software projects’ attributes. According to the software metrics weights values developed in this project, we can notice that MCDC, LOC, and cyclomatic complexity of the traditional metrics are still the dominant metrics that affect our classification process, while number of children and depth of inheritance are the dominant from the object-oriented metrics as a second level. 1. Introduction Software companies are interested in determining the soft- ware development cost in the early stages to control and plan software tasks, risks, budgets, and schedules. In order to an- alyze software cost, we have to gather metrics from the cur- rent and the previous projects and draw similarities and an- alogies to be able to come up with predictions regarding the current project. It is important for software companies to benefit from the company historical software data in order to use it to estimate the cost and the schedule of the new ordered projects. So they can manage the budget, the development staff, and the schedules for the work process. It is essential for both developers and customers to get accurate software cost estimation by accurately estimating the new project cost. Project managers can provide the customers with an accurate deadline for their projects and debate some of the contract negotiation’s issues, so that customers can expect actual development costs to be in line with estimated cost, and these estimations can be used by de- velopers to generate reports and proposals and to determine what resources are needed to commit to the project and how well these resources will be used. Accurate software cost esti- mation makes projects management easier to be managed and controlled as resources are better matched to the real needs. Many researchers in software engineering field have stud- ied in depth how to predict the software project cost which is important for the project managers and software develop- ment organizations. Cost estimation or what is called by other researchers “effort prediction” is the process of estima- ting the cost of the software system development. This esti- mation can generally be estimated through three methods: experts’ judgment, algorithmic model, and by analogy [1].

Welcome message from author
This document is posted to help you gain knowledge. Please leave a comment to let me know what you think about it! Share it to your friends and learn new things together.
Transcript
International Scholarly Research NetworkISRN Software EngineeringVolume 2012, Article ID 823437, 8 pagesdoi:10.5402/2012/823437
Research Article
Predicting Software Projects Cost Estimation Based onMining Historical Data
Hassan Najadat,1 Izzat Alsmadi,2 and Yazan Shboul1
1 Computer Information Systems Department, Jordan University of Science and Technology, P.O. Box 3030, Irbid 22110, Jordan2 Computer Information Systems Department, Yarmouk University, P.O. Box 566, Irbid 21163, Jordan
Correspondence should be addressed to Izzat Alsmadi, [email protected]
Received 18 November 2011; Accepted 16 January 2012
Academic Editors: J. Cao and O. Greevy
Copyright © 2012 Hassan Najadat et al. This is an open access article distributed under the Creative Commons AttributionLicense, which permits unrestricted use, distribution, and reproduction in any medium, provided the original work is properlycited.
In this research, a hybrid cost estimation model is proposed to produce a realistic prediction model that takes into considerationsoftware project, product, process, and environmental elements. A cost estimation dataset is built from a large number of opensource projects. Those projects are divided into three domains: communication, finance, and game projects. Several data miningtechniques are used to classify software projects in terms of their development complexity. Data mining techniques are also usedto study association between different software attributes and their relation to cost estimation. Results showed that finance metricsare usually the most complex in terms of code size and some other complexity metrics. Results showed also that games applicationshave higher values of the SLOCmath, coupling, cyclomatic complexity, and MCDC metrics. Information gain is used in order toevaluate the ability of object-oriented metrics to predict software complexity. MCDC metric is shown to be the first metric indeciding a software project complexity. A software project effort equation is created based on clustering and based on all softwareprojects’ attributes. According to the software metrics weights values developed in this project, we can notice that MCDC, LOC,and cyclomatic complexity of the traditional metrics are still the dominant metrics that affect our classification process, whilenumber of children and depth of inheritance are the dominant from the object-oriented metrics as a second level.
1. Introduction
Software companies are interested in determining the soft-ware development cost in the early stages to control and plansoftware tasks, risks, budgets, and schedules. In order to an-alyze software cost, we have to gather metrics from the cur-rent and the previous projects and draw similarities and an-alogies to be able to come up with predictions regarding thecurrent project.
It is important for software companies to benefit from thecompany historical software data in order to use it to estimatethe cost and the schedule of the new ordered projects. Sothey can manage the budget, the development staff, and theschedules for the work process.
It is essential for both developers and customers to getaccurate software cost estimation by accurately estimatingthe new project cost. Project managers can provide thecustomers with an accurate deadline for their projects and
debate some of the contract negotiation’s issues, so thatcustomers can expect actual development costs to be in linewith estimated cost, and these estimations can be used by de-velopers to generate reports and proposals and to determinewhat resources are needed to commit to the project and howwell these resources will be used. Accurate software cost esti-mation makes projects management easier to be managedand controlled as resources are better matched to the realneeds.
Many researchers in software engineering field have stud-ied in depth how to predict the software project cost whichis important for the project managers and software develop-ment organizations. Cost estimation or what is called byother researchers “effort prediction” is the process of estima-ting the cost of the software system development. This esti-mation can generally be estimated through three methods:experts’ judgment, algorithmic model, and by analogy [1].
2 ISRN Software Engineering
A
B
C D
E
F
Pseudocode
// pseudocode for the McCabe graph
Source lines of node A
If (· · · ) then source lines of node A
Else source lines of node B
If (· · · ) then source lines of node C
Else source lines of node D
Source lines of node E
Source lines of node F
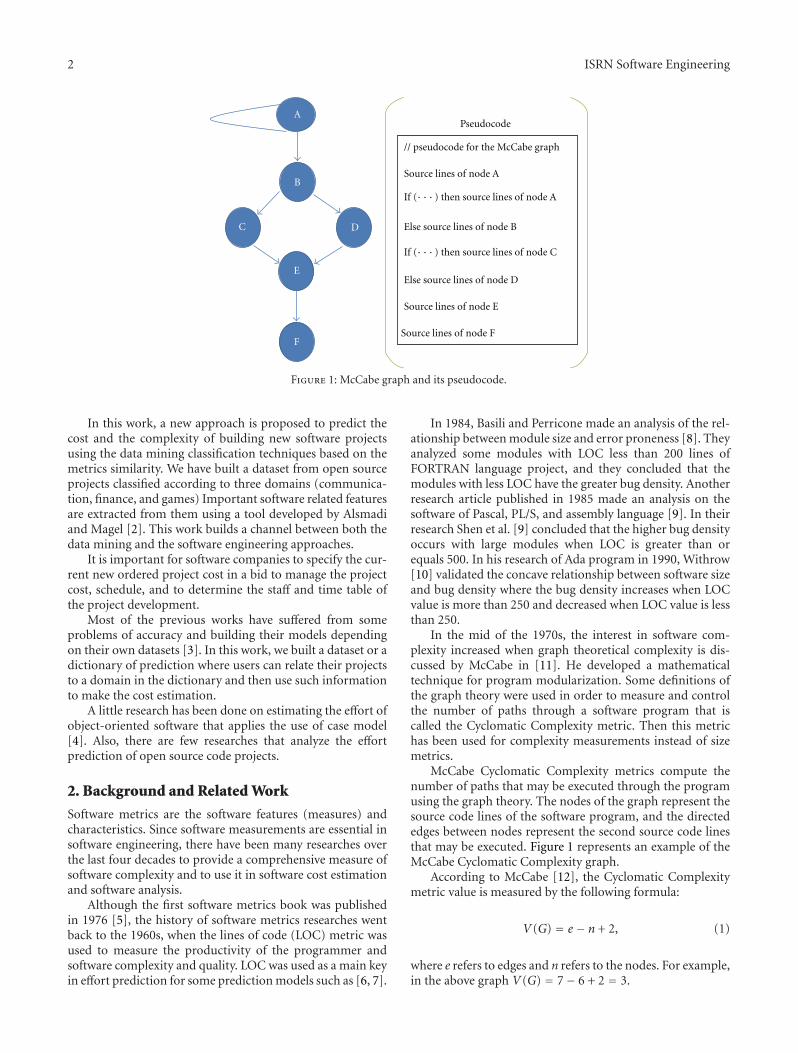
Figure 1: McCabe graph and its pseudocode.
In this work, a new approach is proposed to predict thecost and the complexity of building new software projectsusing the data mining classification techniques based on themetrics similarity. We have built a dataset from open sourceprojects classified according to three domains (communica-tion, finance, and games) Important software related featuresare extracted from them using a tool developed by Alsmadiand Magel [2]. This work builds a channel between both thedata mining and the software engineering approaches.
It is important for software companies to specify the cur-rent new ordered project cost in a bid to manage the projectcost, schedule, and to determine the staff and time table ofthe project development.
Most of the previous works have suffered from someproblems of accuracy and building their models dependingon their own datasets [3]. In this work, we built a dataset or adictionary of prediction where users can relate their projectsto a domain in the dictionary and then use such informationto make the cost estimation.
A little research has been done on estimating the effort ofobject-oriented software that applies the use of case model[4]. Also, there are few researches that analyze the effortprediction of open source code projects.
2. Background and Related Work
Software metrics are the software features (measures) andcharacteristics. Since software measurements are essential insoftware engineering, there have been many researches overthe last four decades to provide a comprehensive measure ofsoftware complexity and to use it in software cost estimationand software analysis.
Although the first software metrics book was publishedin 1976 [5], the history of software metrics researches wentback to the 1960s, when the lines of code (LOC) metric wasused to measure the productivity of the programmer andsoftware complexity and quality. LOC was used as a main keyin effort prediction for some prediction models such as [6, 7].
In 1984, Basili and Perricone made an analysis of the rel-ationship between module size and error proneness [8]. Theyanalyzed some modules with LOC less than 200 lines ofFORTRAN language project, and they concluded that themodules with less LOC have the greater bug density. Anotherresearch article published in 1985 made an analysis on thesoftware of Pascal, PL/S, and assembly language [9]. In theirresearch Shen et al. [9] concluded that the higher bug densityoccurs with large modules when LOC is greater than orequals 500. In his research of Ada program in 1990, Withrow[10] validated the concave relationship between software sizeand bug density where the bug density increases when LOCvalue is more than 250 and decreased when LOC value is lessthan 250.
In the mid of the 1970s, the interest in software com-plexity increased when graph theoretical complexity is dis-cussed by McCabe in [11]. He developed a mathematicaltechnique for program modularization. Some definitions ofthe graph theory were used in order to measure and controlthe number of paths through a software program that iscalled the Cyclomatic Complexity metric. Then this metrichas been used for complexity measurements instead of sizemetrics.
McCabe Cyclomatic Complexity metrics compute thenumber of paths that may be executed through the programusing the graph theory. The nodes of the graph represent thesource code lines of the software program, and the directededges between nodes represent the second source code linesthat may be executed. Figure 1 represents an example of theMcCabe Cyclomatic Complexity graph.
According to McCabe [12], the Cyclomatic Complexitymetric value is measured by the following formula:
V(G) = e − n + 2, (1)
where e refers to edges and n refers to the nodes. For example,in the above graph V(G) = 7− 6 + 2 = 3.
ISRN Software Engineering 3
In their research in 1984, Basili and Perricone [8] founda correlation between McCabe Cyclomatic Complexity andmodule sizes. They discovered that large modules have highcomplexity.
Halstead introduced other software metrics in 1977 [13].These metrics have been developed in order to estimatethe programming effort. The Halstead metrics are measuredusing some statistic numbers. These statistics are
(i) n1 = number of unique or distinct operators whichappear in that implementation;
(ii) n2 = number of unique or distinct operands whichappear in that implementation;
(iii) N1 = total usage of all of the operators which appearin that implementation;
(iv) N2 = total usage of all of the operands which appearin that implementation.
The above statistics contain operators and operands. Theoperators are used to specify the manipulation to be per-formed while the operands are used as logic units to be oper-ated. From the above statistics Halstead complexity metricsare defined as
(i) the vocabulary n = n1 + n2,
(ii) the program length N = N1 + N2.
In 2004, Fei et al. in their article [14] proposed an im-provement on the Halstead complexity metrics. They addedweights to the Halstead metrics. They gave different opera-tors and operands different weights.
Six object-oriented design metrics were developed andevaluated by Chidamber and Kemerer in 1994 [15]. Theseobject-oriented metrics are called CK metrics. The CK me-trics that resulted from Chidamber and Kemerer are weigh-ted methods per class (WMC), depth of inheritance tree(DIT), number of children (NOC), coupling between objectclasses (CBO), response for a class (RFC), and lack of co-hesion in methods (LCOM).
2.1. Cost Estimation. Software systems and applications arethe most expensive part of the computer systems due to thehuman effort that is used in producing software systems. Thisreason (expansive software development) motivated manyresearchers to focus on this aspect of research.
Software cost estimation or what is called by other re-searchers “effort prediction” is the process of estimating soft-ware cost accurately. Over the past 30 years, many studieshave been conducted in the software cost estimation field[16] where two main types of cost estimation methods havebeen discussed including the algorithmic and nonalgorith-mic methods. Some cost estimation models use data fromprevious projects in order to derive cost formulas; thesemodels are called empirical models like COCOMO model[17], while other models depend on global assumptions toderive their cost formulas. These models are called analyticalmodels; for example, Putnam in his paper [7] proposed anapproach to accurately estimate effort, cost, and time of soft-ware projects. Leung and Fan in their article [16] gave an
overview of the software cost estimation, and they high-lighted the importance of the accuracy in estimating the costof the software.
2.2. Cost Estimation Models. Cost estimation models can beclassified into two categories according to the approach andthe procedures used to measure the software cost. There aretwo major categories which are algorithmic and nonalgorith-mic models.
2.2.1. Nonalgorithmic Models. There are many non-algo-rithmic models used in software cost estimation. The fol-lowing are some of these models used in the literature.
(i) Analogy Model. Prediction by analogy is one of the mostnon-algorithmic methods used in effort prediction. Usinganalogy prediction depends on previous completed projectswhere we can predict efforts using actual existing projectscost values. In prediction by analogy, the software project ischaracterized through variables, and then Euclidean distanceis measured in n-dimensional space. A prediction tool to findan analogous of the current software project from the set ofcompleted projects called ANGEL is developed, where it isflexible to return three analogous [1].
(ii) Expert Judgment. Usually, more than one expert’s opin-ions are involved in the estimation process. Therefore, deri-ving the software cost estimation is neither explicit nor re-peatable. In fact, experts consider some techniques such asDelphi technique or PERT [18, 19] mechanisms in a bidto reach a consensus between each other resolve the inconsis-tencies in the estimation. In the Delphi mechanisms, a co-ordinator asks each expert to fill a form to record estimations,and then the coordinator prepares a summary of all the esti-smations from the experts [16].
Parkinson Model. The cost is determined by the available re-sources rather than based on an objective assessment accord-ing to Parkinson’s principle [20].
Algorithmic models. The algorithmic model estimates thesoftware cost through some formulas that depend mainly onthe size of the project which is measured in terms of functionpoint, object point, and lines of code (LOC). Beside the sizeof the project, there are a number of variables that are in-volved in the algorithmic model function such as:
Effort = f(y1, y2, y3, . . . , yn
), (2)
where Effort is a cost estimation measure that is usually mea-sured by (person-month), and f refers to the function form,and (y1, y2, y3, . . . , yn) refers to the cost factors.
Boehm introduced the first version of COCOMO as amodel for estimating the effort, cost, and schedule; thisCOCOMO version was called COCOMO 81 [6] where 63projects ranging from 2000 to 100000 lines of code are usedin that study. In 1997, Boehm enhanced his first version ofCOCOMO and introduced another model called COCOMO2 [21]. This model provides more support for modern
4 ISRN Software Engineering
software development processes. In COCOMO models, LOCis used as a software code size and given in thousands tomeasure the effort which is measured in person-month.
3. Goals and Approaches
A software metrics tool called CodeMetrics is built in orderto extract software metrics from source codes which are usedto build software metrics data set. CodeMetrics is extendedfrom SWMetrics which was built by Alsmadi and Megal[2]. This tool can extract metrics from C#, C++, and Javasource code. CodeMetrics can build and classify the softwaredata set according to their domains (e.g., communication,finance, and games). CodeMetrics can extract some selectedCK metrics as well as the traditional metrics like the metricsextracted from SWMetrics [15]. The metrics extracted are(Lines, LOC, SLOC, SLOCmath, MCDC, MaxNest, CCom-plexity, Averaged method per class, averaged method CCom-plexity, Max Inheritance, Coupling, and Number of Chil-dren).
Our metrics tool parses all the source code files of theselected language only. For example, for C#, C++, and Javalanguages projects, CodeMetrics parses all the files of theextension types ∗∗∗.cs, ∗∗∗.cpp, and ∗∗∗.java, respectively.Through the parsing process, a counter for each softwaremetrics is used to compute the metric value.
Before parsing the source code we should select the lang-uage; after completing the metrics counting we can specifythe project domain and save it under that domain class.CodeMetrics can be extended to more than three domainstypes within the domains list such as educational and scie-ntific systems which can be added to the domains list.
3.1. Open Source Code Dataset. We have built our data setusing open source projects collected from different opensource web sites which are
(i) http://www.codeproject.com/,
(ii) http://www.codeplex.com/,
(iii) http://www.sourceforge.com/.
We have classified our source code projects into commun-ication, finance, and games domains. All collected projectsare of C# code language only. Table 1 shows the number ofprojects for each domain, 38.1% of the gathered projects arefrom the games domain, 35.7% of the projects are Financeapplications, and 26.2% of the projects are from commu-nication domain. Communication applications are relatedto email, file transfer, client-server, and chat applications.Finance applications are related to stock and billing systemsand so forth. An example of such projects is NopCommerceand LinqCommerce. NopCommerce is an open source e-commerce solution with comprehensive features that is easyto use for new online businesses and is included within fin-ance domain. LinqCommerce was created by JMA WebTechnologies Inc. in order to be a part of e-commerce sol-utions.
Table 1: Source code projects domain.
Domain Number of application percentage
Communication 33 26.2%
Finance 45 35.7%
Game 48 38.1%
3.2. Data Mining for Cost Estimation. We have used infor-mation gain method as a subset selection method in order toknow the best subset of the metrics that play a major role inthe classification process. A decision tree method (J48) isused as a classification method for the software data set de-pending on the software metrics. A clustering technique (K-mean) is used to classify the data set and grouping the similarprojects within the same cluster.
3.3. Attribute Selection. There are many methods used forattribute subset selection such as information gain, gain ra-tio, and gini index methods. An attribute subset selectionmethod is used to select the best separates of the attributes. Inthis work, we have used information gain method to deter-mine the best splitting attributes. This method computes theinformation gain value for each attributes, and the attributewith the highest information gain is the best attribute thatcan identify the class label of a tuple in the data set. Thefollowing formulas are used to compute the information gainvalues:
Info(D) = −n∑
i=0
pi∗ log(pi), (3)
where Info(D) is the average amount of information neededto identify the class label and pi is the probability that an tuplein the data set belongs to a class label
InfoA(D) =n∑
k=0
|Dk||D| ∗ Info(Dk), (4)
where the InfoA(D) is the expected information needed toclassify a tuple based on an attribute A |Dk|/|D| is the weightof the k partition
Gain(A) = Info(D)− InfoA(D), (5)
where Gain (A) refers to the amount of information requiredto classify the data set of attribute A.
3.4. J48 Decision Tree. J48 decision tree is one of the classi-fication methods that construct a decision tree classifier. J48classifier works as follows.
(1) Take the data set, attribute list, and the attribute se-lection method as input.
(2) Check if the tuples in the data set are all with the sameclass label or not.
(3) Check if the attribute list is empty or not.
(4) Apply attribute selection method to find the best se-parate attribute.
ISRN Software Engineering 5
(5) Remove the splitting attribute from the attribute list.
(6) For each outcomes of the tree, grow subtrees for eachpartition.
We have used decision tree classifier as a knowledge discoverymethod because it can handle high-dimensional data like thedata type of our data set. Another reason to use the decisiontree classifier is that the construction of the decision tree doesnot need any domain knowledge.
3.5. Clustering by K-mean. Clustering techniques used to putthe similar data object within the same cluster and the dis-similar objects in other clusters. We used K-mean clusteringmethod to put the similar projects within the same cluster. Inthe K-mean clustering method we first select the number ofclusters (K) and the distance method. K-means methodworks as follows
(1) Randomly select K of the object, which represents acluster center.
(2) Assign each object to the cluster to which the objectis the most similar.
(3) Calculate the mean value of the objects for eachcluster.
(4) Reassign each object to the cluster to which the objectis the most similar.
(5) Repeat steps 3-4 until no changes.
(6) Assign the cluster number as a class label for each ob-ject.
After applying the K-mean clustering method, each projectsof the data set is labeled with the cluster number which refersto a complexity level for each project as will be describedlater.
3.6. Using WEKA Data Mining Tool. In order to analyze ourdata set using data mining techniques, we used one of themost data mining tools that contain implementations of thedata mining techniques. We used WEKA 3.6 version tool.WEKA is one of the most popular tools that are used bymany researchers to analyze their data. WEKA supports datamining tasks such as data preprocessing, data classification,data clustering, and attributes selection.
4. Implementation and Experimental Work
We first analyzed our dataset considering the domain types ofthe projects and concluding general characteristics for eachdomain type. We also grouped the projects using K-meanclustering method that is implemented through WEKA tooland concluding some analysis data.
4.1. Source Code Domains Analysis. This section discussessoftware source code according to their domains. We haveanalyzed software metrics within each domain and have ex-tracted some information about each domain and made acomparison between the studied domains applications. In
this work, we have studied three types of software applicationdomains which are the communication, the finance, and thegames applications. The following two sections analyze thetraditional metrics and the object-oriented metrics withindomains.
4.1.1. Traditional Metrics Analysis. Collected traditional me-trics show different values for each domain application. Tra-ditional metrics collected using the developed tool includesLOC, SLOCmath, MCDC, MaxNesting, and CyclomaticComplexity. The following graphs show some characteristicsfor each domain application.
The size metrics are lines, LOC, SLOC, MCDC, Sloc-math, Maxnest, and Cyclomatic complexity. We have foundthat finance applications have higher source size codes thanthe other application types.
Results showed that finance applications have higher nes-ting values than other applications domains. Results showedalso that games applications have higher values of the SLOC-math and MCDC metrics, while lower values of these threemetrics are measured within communication source code ap-plications. It clearly shows that games applications have morecomplex source code than finance and communication ap-plications, while the finance applications are the least com-plex applications.
The above analysis and graphs conclude that these soft-ware application domains have some differences and thateach application type has general characteristics. The analysisof our data set that is gathered from open sources softwareand classified into three domains (communication, finance,and games) showed that finance applications require thelargest number of software size which is measured by com-puting source code lines of code. Finance applications havethe deepest nesting levels which increase the complexity ofthe source codes.
Games applications have higher values of SLOCmathand MCDC metrics. This result is expected for the gamesapplications because these types of software applicationsdeal with the players’ choices and the players’ probabilitiesthrough playing the game. Also games applications havethe highest complexity values of the Cyclomatic Complexitymetric which means that games applications have largernumber of execution paths relative to communication andfinance applications. Results showed also that finance appli-cations have limited number of execution paths. This resultrefers to the stability of the finance applications whichdepend on clear and static business rules.
4.1.2. Object-Oriented Metrics Analysis. Object-oriented me-trics information measures the quality of the software appli-cation and helps in accurately estimating the software cost.Results for “Average Cyclomatic Complexity for methodswithin a class” metric showed that games applications me-thods are more complex than other domains applicationsmethods, while lower complexity levels appeared withincommunication source code methods. In terms of the metric“average number of methods per class”, results showed alsothat games applications classes have much more methods
6 ISRN Software Engineering
than other classes at other domains, while finance applica-tion’s classes are the lowest ones.
We analyzed the inheritance depth of the classes withinthe three domains, and we found that the depth of inheri-tance for the finance applications is deeper than that of com-munication applications, while the depth of inheritance forthe games applications is the deepest of the three.
Coupling of a class measures how many methods andmethod calls exist in a call to all other classes. In coupling, re-sults showed that games objects within any class are invokedmany times by methods in different classes more than thosein finance or communication applications. Results showedalso the average number of children classes over the threeanalyzed domains (i.e., Games, Finance, and communica-tion). It is clearly noticed that games application’s classeshave much more children classes than applications in otherdomains.
The above analysis shows that applications of the gamedomain are more complex than other software applicationswithin other domains. Average Cyclomatic Complexity permethods shows that games applications have the highest val-ues of this metrics which can increase the software cost (i.e.,building and maintenance effort) for games applications.Games programs require to interact with the player’s optionsand reactions, so games programmers need to include all theprobabilities of the game and the interactions with the gamesplayers’ options which explain the high values of object-oriented metrics for the game source codes.
4.2. Software Metrics Selection. In this section, we have an-alyzed the software metrics and have assigned weights forthe software metrics in order to specify the metrics thatdetermine the software domain (the dominant metric). At-tribute subset selection method from data mining is usedin a bid to find the dominant metrics that specify the soft-ware domain. In order to know each metric weight, we haveused the information gain method (InfoGain) that is im-plemented by WEKA tool. In a bid to know the effects ofobject-oriented metrics on the analysis, we have made twomethods of analysis: on the traditional metrics only (i.e.,without object-oriented metrics) and on all available soft-ware metrics.
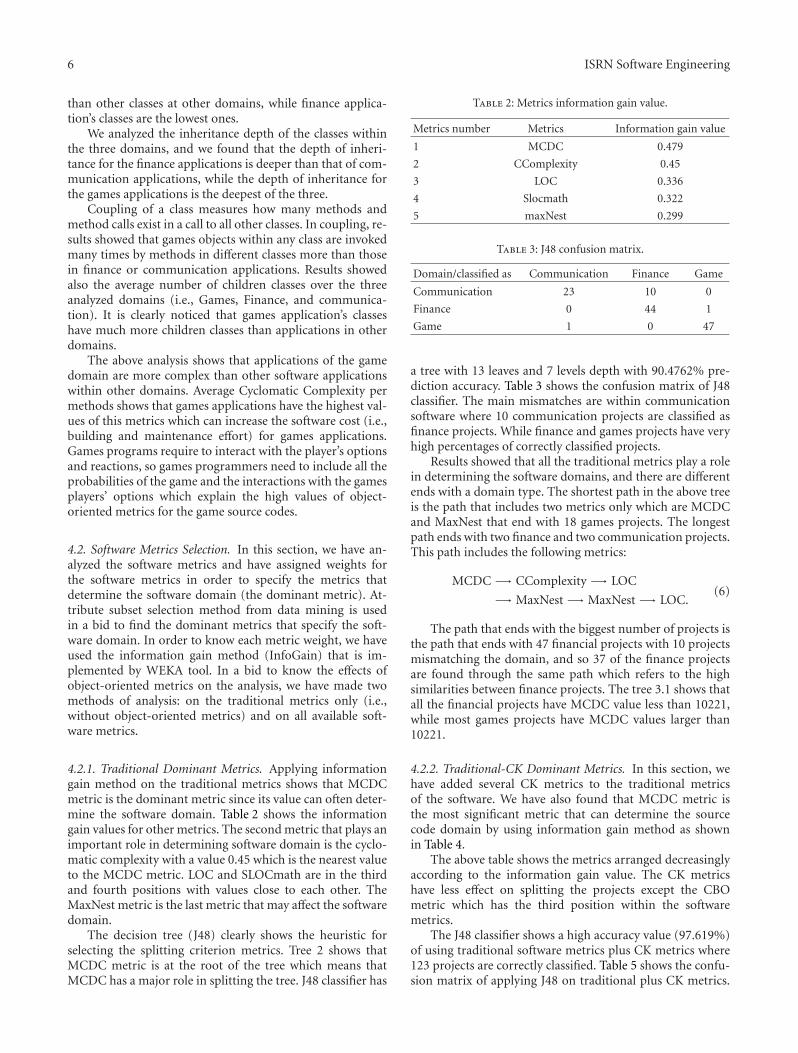
4.2.1. Traditional Dominant Metrics. Applying informationgain method on the traditional metrics shows that MCDCmetric is the dominant metric since its value can often deter-mine the software domain. Table 2 shows the informationgain values for other metrics. The second metric that plays animportant role in determining software domain is the cyclo-matic complexity with a value 0.45 which is the nearest valueto the MCDC metric. LOC and SLOCmath are in the thirdand fourth positions with values close to each other. TheMaxNest metric is the last metric that may affect the softwaredomain.
The decision tree (J48) clearly shows the heuristic forselecting the splitting criterion metrics. Tree 2 shows thatMCDC metric is at the root of the tree which means thatMCDC has a major role in splitting the tree. J48 classifier has
Table 2: Metrics information gain value.
Metrics number Metrics Information gain value
1 MCDC 0.479
2 CComplexity 0.45
3 LOC 0.336
4 Slocmath 0.322
5 maxNest 0.299
Table 3: J48 confusion matrix.
Domain/classified as Communication Finance Game
Communication 23 10 0
Finance 0 44 1
Game 1 0 47
a tree with 13 leaves and 7 levels depth with 90.4762% pre-diction accuracy. Table 3 shows the confusion matrix of J48classifier. The main mismatches are within communicationsoftware where 10 communication projects are classified asfinance projects. While finance and games projects have veryhigh percentages of correctly classified projects.
Results showed that all the traditional metrics play a rolein determining the software domains, and there are differentends with a domain type. The shortest path in the above treeis the path that includes two metrics only which are MCDCand MaxNest that end with 18 games projects. The longestpath ends with two finance and two communication projects.This path includes the following metrics:
MCDC −→ CComplexity −→ LOC
−→ MaxNest −→ MaxNest −→ LOC.(6)
The path that ends with the biggest number of projects isthe path that ends with 47 financial projects with 10 projectsmismatching the domain, and so 37 of the finance projectsare found through the same path which refers to the highsimilarities between finance projects. The tree 3.1 shows thatall the financial projects have MCDC value less than 10221,while most games projects have MCDC values larger than10221.
4.2.2. Traditional-CK Dominant Metrics. In this section, wehave added several CK metrics to the traditional metricsof the software. We have also found that MCDC metric isthe most significant metric that can determine the sourcecode domain by using information gain method as shownin Table 4.
The above table shows the metrics arranged decreasinglyaccording to the information gain value. The CK metricshave less effect on splitting the projects except the CBOmetric which has the third position within the softwaremetrics.
The J48 classifier shows a high accuracy value (97.619%)of using traditional software metrics plus CK metrics where123 projects are correctly classified. Table 5 shows the confu-sion matrix of applying J48 on traditional plus CK metrics.
ISRN Software Engineering 7
Table 4: Traditional-CK metric information gain value.
Metrics number Metric Information gain value
1 MCDC 0.479
2 CComplexity 0.45
3 CBO 0.363
4 LOC 0.336
5 SLOCmath 0.322
6 MaxNest 0.299
7 avgMethod per class 0.151
8 Childern 0.147
Table 5: Traditional CK metrics confusion matrix.
Domain/classified as Communication Finance Game
Communication 33 0 0
Finance 1 43 1
Game 1 0 47
This high accuracy value when adding CK metrics refers tothe enhancement of the prediction process when consideringCK-metrics in addition to the traditional metrics. Resultsshowed that traditional CK metrics has 97.619% of accuracywhile traditional metrics only has 90.4762% of accuracy.
5. Assumptions
(i) Grouping the software projects into 3 groups usingdata mining clustering methods, each group repre-sents a cost factor for the projects within each groupwhere we assume (Low, Mid, and High) for the threegrouping approach.
(ii) Using one of the attribute subset selection methodsin order to get metrics weights, we have used the in-formation gain method and have assumed our effortformula according to the linear approach divided by1000.
Our collected data set contains traditional metrics as well assome CK metrics. All of these metrics are numerical, and soin order to cluster the data set into similar groups we usedone of the data mining approaches. We used K-mean methodwhich is one of the known clustering techniques. In the fol-lowing sections, K-means is applied on our data set in a bid toput the collected software projects within clusters accordingto the similarity between clustered projects.
6. Conclusion
Cost estimation remains a complex problem that attracts re-searchers to study and to try different approaches and me-thodologies to solve it. In this thesis, a new cost estimationapproach for analyzing software projects is presented inorder to help project managers to take their decisions. Ourapproach utilizes data mining techniques in the analysisprocess, and we have used K-mean in a bid to classify
the gathered projects into clusters and find the similaritiesbetween each cluster’s projects. In order to gather the data forour dataset a software metric tool called CodeMetrics is builtto extract traditional metrics as well as some of the object-oriented metrics (CK metrics).
A dataset of software metrics is established according tothe projects domain types, and, to our knowledge, there isnot any datasets that contain software metrics classifiedaccording to the domain type.
The following points refer to the final experimentalresults of this work.
(1) Finance projects require a larger number of lines andnesting relative to games and communication proj-ects.
(2) Slocmath, mcdc, and complexity metrics for gamesprojects have higher values relative to finance andcommunication projects, while the complexity of thecommunication projects is larger than finance pro-jects.
(3) Applications of games type have higher values ofobject-oriented metrics relative to the other projects(method CComplexity, averaged method per class,inheritance depth, coupling, children).
(4) Using data mining techniques for attribute subset sel-ection we have found that MCDC plays a big role indetermining source code domains more than LOCmetric as all cost estimation models depend on it.
(5) Adding object-oriented metrics to the metrics listincreases the prediction accuracy where the accuracybecomes (97.619%) instead of (90.4762%) (using J48classifier).
(6) Our results conclude that MCDC, LOC, MaxNets arethe major metrics that affect the classification of thesoftware projects while most of the previous studiesconsider LOC metric as the major metric that plays arole in effort estimation.
(7) Adding object-oriented metrics to the metrics listincreases the correlation between our model andCOCOMO model where the correlation becomes0.958219 for effort instead of 0.939904104, andthe correlation of the development time becomes0.995454 instead of 0.985798364.
References
[1] M. Shepperd, C. Schofield, and B. Kitchenham, “Effort esti-mation using analogy,” in Proceedings of the 18th InternationalConference on Software Engineering, pp. 170–178, Berlin,Germany, 1996.
[2] I. Alsmadi and K. Magel, “Open source evolution analysis,”in Proceedings of the 22nd IEEE International Conference onSoftware Maintenance (ICSM ’06), Philadelphia, Pa, USA,2006.
[3] B. Boehm, B. Clark, E. Horowitz, R. Madachy, R. Shelby,and C. Westland, “Cost models for future software life cycleprocess: COCOMO 2.0,” in Annals of Software EngineeringSpecial Volume on Software Process and Product Measurement,
8 ISRN Software Engineering
J. D. Arther and S. M. Henry, Eds., vol. 1, pp. 45–60, J.C. Bal-tzer AG, Science Publishers, Amsterdam, The Netherlands,1995.
[4] K. Ribu, Estimating Object-Oriented Software Projects with UseCases, M.S. thesis, University of Oslo Department of Informat-ics, 2001.
[5] T. Gilb, Software Metrics, Chartwell-Bratt, 1976.[6] B. W. Boehm, Software Engineering Economics, Prentice-Hall,
Englewood Cliffs, NJ, USA, 1981.[7] L. H. Putnam, “A general empirical solution to the macro
software sizing and estimating problem,” IEEE Transactions onSoftware Engineering, vol. 4, no. 4, pp. 345–361, 1978.
[8] V. R. Basili and B. T. Perricone, “Software errors and com-plexity: an empirical investigation,” Communications of theACM, vol. 27, no. 1, pp. 42–52, 1984.
[9] V. Y. Shen, T. J. Yu, S. M. Thebaut, and L. R. Paulsen, “Iden-tifying error-prone software—an empirical study,” IEEE Tran-sactions on Software Engineering, vol. 11, no. 4, pp. 317–324,1985.
[10] C. Withrow, “Error density and size in Ada software,” IEEESoftware, vol. 7, no. 1, pp. 26–30, 1990.
[11] T. J. McCabe, “A complexity measure,” IEEE Transactions onSoftware Engineering, vol. SE-2, no. 4, pp. 308–320, 1976.
[12] J. Han and M. Kamber, Data Mining: Concepts and Techniques,Morgan Kaufmann, San Francisco, Calif, USA, 2th edition,2006.
[13] M. H. Halstead, Elements of Software Science, Elsevier NorthHolland, 1977.
[14] Y. Y. Fei, Z. Zhi, and Z. S. Chao, “Improvements about Hal-stead model in software science,” Journal of Computer Applica-tions, pp. 130–132, 2004.
[15] S. R. Chidamber and C. F. Kemerer, “Metrics suite for objectoriented design,” IEEE Transactions on Software Engineering,vol. 20, no. 6, pp. 476–493, 1994.
[16] H. Leung and Z. Fan, Software Cost Estimation, Department ofComputing, The Hong Kong Polytechnic University, 2002.
[17] T. Xie, S. Thummalapenta, D. Lo, and C. Liu, “Data miningfor software engineering,” Computer, vol. 42, no. 8, pp. 55–62,2009.
[18] H. Leung and Z. Fan, Software Cost Estimation, Department ofComputing, The Hong Kong Polytechnic University, 2002.
[19] J. D. Aron, “Estimating Resource for Large ProgrammingSystems,” NATO Science Committee, Rome, Italy; October1969.
[20] G. N. Parkinson, Parkinson’s Law and Other Studies in Ad-ministration, Houghton-Miffin, Boston, Mass, USA, 1957.
[21] B. W. Boehm et al., The COCOMO 2.0 Software Cost Esti-mation Model, American Programmer, 1996.

Submit your manuscripts athttp://www.hindawi.com
International Journal ofComputer GamesTechnologyHindawi Publishing Corporationhttp://www.hindawi.com Volume 2014
Hindawi Publishing Corporationhttp://www.hindawi.com Volume 2014
DistributedSensor Networks
International Journal of
Advances in
FuzzySystems
Hindawi Publishing Corporationhttp://www.hindawi.com
Volume 2014
International Journal of
ReconfigurableComputing
Hindawi Publishing Corporation http://www.hindawi.com Volume 2014
Hindawi Publishing Corporationhttp://www.hindawi.com Volume 2014
Applied Computational Intelligence and Soft Computing
Advances in
Artificial Intelligence
Hindawi Publishing Corporationhttp://www.hindawi.com Volume 2014
Advances in Software Engineering
Hindawi Publishing Corporationhttp://www.hindawi.com Volume 2014
Hindawi Publishing Corporationhttp://www.hindawi.com Volume 2014
Electrical and Computer Engineering
Journal of
Journal of
Computer Networks and Communications
Hindawi Publishing Corporationhttp://www.hindawi.com Volume 2014
Hindawi Publishing Corporation
http://www.hindawi.com Volume 2014
Advances in
Multimedia
International Journal of
Biomedical Imaging
Hindawi Publishing Corporationhttp://www.hindawi.com Volume 2014
ArtificialNeural Systems
Advances in
Hindawi Publishing Corporationhttp://www.hindawi.com Volume 2014
RoboticsJournal of
Hindawi Publishing Corporationhttp://www.hindawi.com Volume 2014
ComputationalIntelligence &Neuroscience
Hindawi Publishing Corporationhttp://www.hindawi.com Volume 2014
Industrial EngineeringJournal of
Hindawi Publishing Corporationhttp://www.hindawi.com Volume 2014
Modelling & Simulation in EngineeringHindawi Publishing Corporation http://www.hindawi.com Volume 2014
The Scientific World JournalHindawi Publishing Corporation http://www.hindawi.com Volume 2014
Hindawi Publishing Corporationhttp://www.hindawi.com Volume 2014
Human-ComputerInteraction
Advances in
Computer EngineeringAdvances in
Hindawi Publishing Corporationhttp://www.hindawi.com Volume 2014
Related Documents