University of Wisconsin-Madison ECE/CS/ME 539 Introduction to Artificial Neural Networks and Fuzzy Systems Predicting Results of Brazilian Soccer League Matches Student: Alberto Trindade Tavares Email: [email protected] Instructor: Yu Hen Hu I authorize the public release of my source code for this Project. Both the Data Extractor, written in Python, and the Classifiers, written in MATLAB.

Welcome message from author
This document is posted to help you gain knowledge. Please leave a comment to let me know what you think about it! Share it to your friends and learn new things together.
Transcript
University of Wisconsin-Madison
ECE/CS/ME 539 Introduction to Artificial Neural
Networks and Fuzzy Systems
Predicting Results of Brazilian
Soccer League Matches
Student: Alberto Trindade Tavares
Email: [email protected]
Instructor: Yu Hen Hu
I authorize the public release of my source code for this Project. Both the Data
Extractor, written in Python, and the Classifiers, written in MATLAB.
2
Contents
1. Introduction ........................................................................................................................................................... 3
2. Feature Vector ....................................................................................................................................................... 4
3. Data Extraction ..................................................................................................................................................... 6
4. Maximum Likelihood Classifier .................................................................................................................... 6
5. Multi-Layer Perceptron .................................................................................................................................... 9
6. Related Work ...................................................................................................................................................... 12
7. Conclusions .......................................................................................................................................................... 12
References ..................................................................................................................................................................... 13
3
1. Introduction
The most popular sport in Brazil is the soccer, being part of its culture identity [1]. As well as in
England and Spanish, many Brazilians support a favorite soccer club, and they monitor results of
its matches in competitions. The main soccer championship in Brazil is the Campeonato Brasileiro Serie A1, known as the Brazilian Soccer League. The format of this league has changed
over the last decades, migrating from a knockout games system to a league system.
Since 2003, the Brazilian Soccer League has 20 participating clubs, the current best teams of the
nation. Each club faces every other club twice in the season, once at their home stadium, and once
at that of their opponents. Therefore, for each season, we have a total of 380 matches (20 teams
x 19 opponents for each one x 2 matches). A season is divided into two parts:
First half: 190 matches, from May to August;
Second half: 190 matches, from September-December.
For each one of these matches, there are three possible outcomes:
Win of the home team (i.e., loss of the visiting team);
Draw;
Loss of the home team (i.e., win of the visiting team);
These results are worth, respectively, 3 points, 1 point, and 0 point. At the end, the club that has
the greatest amount of points is the league champion. Therefore, for a given match, there is a big
interest in figuring out the most likely result among these three possibilities, regardless of the
score.
The goal of this project is predict the outcome (win of the home team, draw, or loss of the home
team) of every game of the second half for the current season, the 2013 one. For the training
process, let us use the game results of the first half of 2013 season as training data. All the matches
have occurred until the beginning of December 2013, so every result is available.
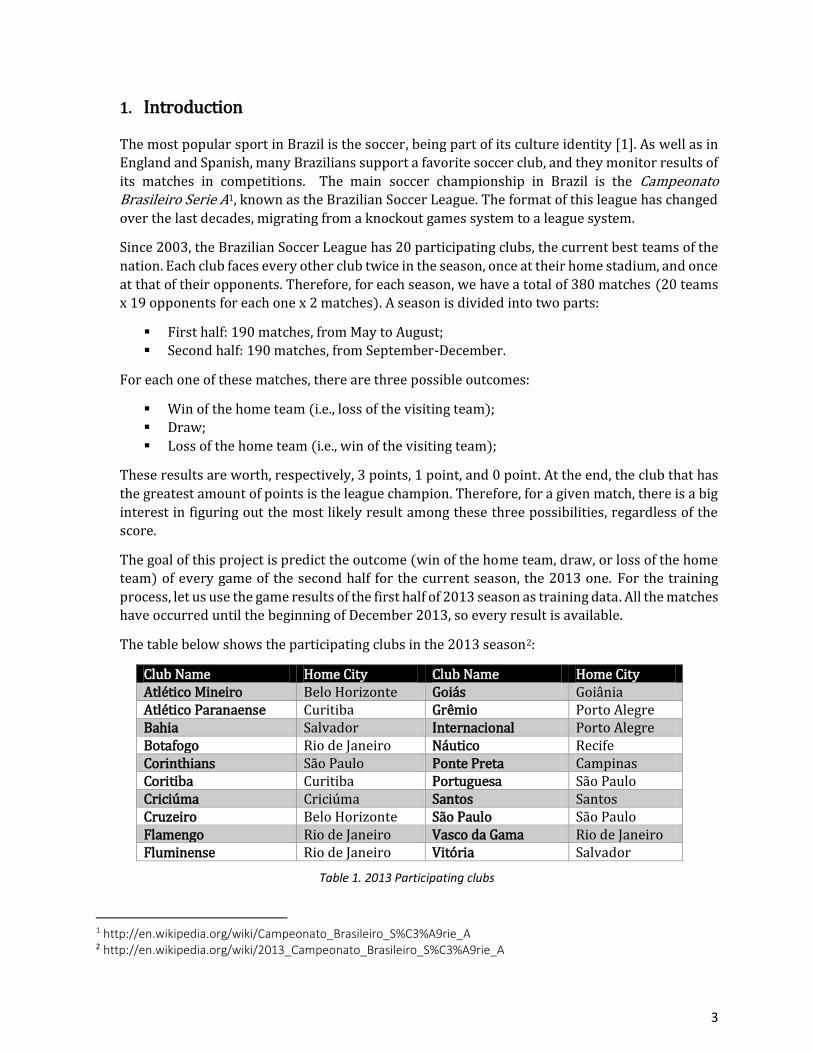
The table below shows the participating clubs in the 2013 season2:
Club Name Home City Club Name Home City Atlético Mineiro Belo Horizonte Goiás Goiânia Atlético Paranaense Curitiba Grêmio Porto Alegre Bahia Salvador Internacional Porto Alegre Botafogo Rio de Janeiro Náutico Recife Corinthians São Paulo Ponte Preta Campinas Coritiba Curitiba Portuguesa São Paulo Criciúma Criciúma Santos Santos Cruzeiro Belo Horizonte São Paulo São Paulo Flamengo Rio de Janeiro Vasco da Gama Rio de Janeiro Fluminense Rio de Janeiro Vitória Salvador
Table 1. 2013 Participating clubs
1 http://en.wikipedia.org/wiki/Campeonato_Brasileiro_S%C3%A9rie_A 2 http://en.wikipedia.org/wiki/2013_Campeonato_Brasileiro_S%C3%A9rie_A
4
As the main task for this project, I have developed two classifiers for performing the prediction
of the 2013 second half’s games, by using the programming language MATLAB. The first one is a
Maximum Likelihood Classifier, and the second one is a Multi-Layer Perceptron.
Another goal of this work is comparing their results between themselves, allowing us to conclude
which model is more suitable for soccer predictions. Moreover, let us compare their results to
other work which was published in a scientific journal.
2. Feature Vector
For representing a match, which involves two teams (home team versus visiting team), let us
design a feature vector. Given this feature vector, the classifier will yield one of these three labels
as prediction for the corresponding match: 1) win of home team, 2) draw, and 3) loss of home
team.
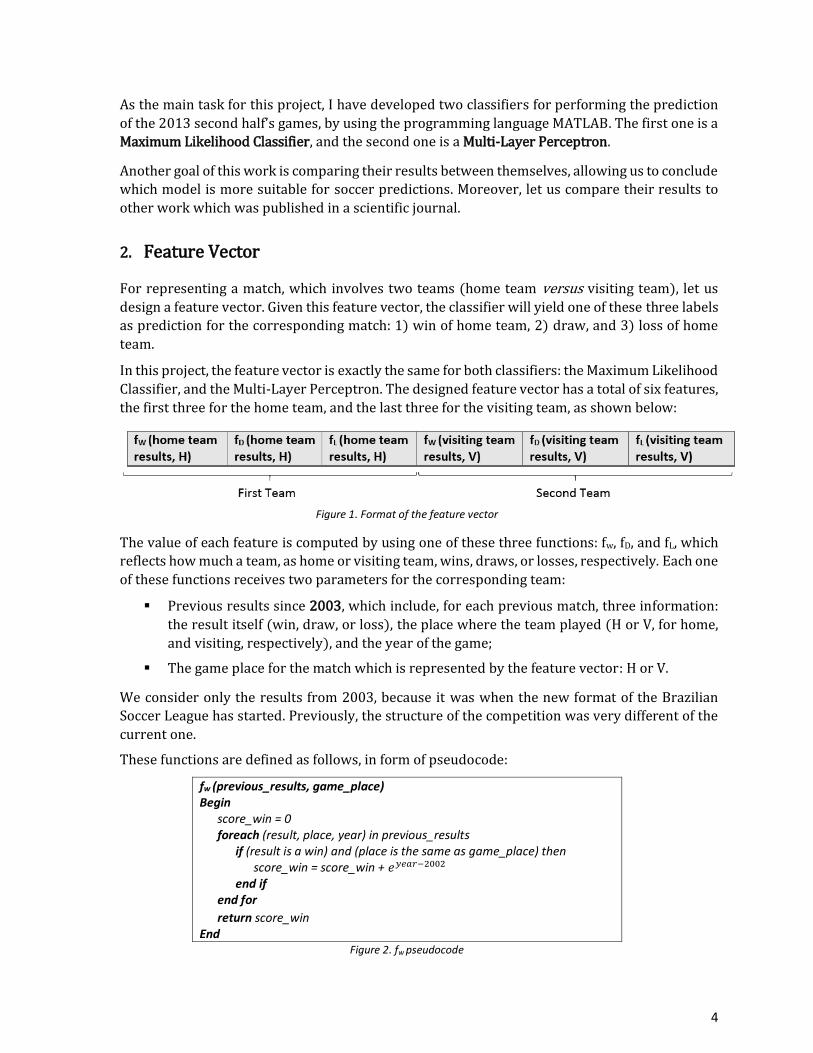
In this project, the feature vector is exactly the same for both classifiers: the Maximum Likelihood
Classifier, and the Multi-Layer Perceptron. The designed feature vector has a total of six features,
the first three for the home team, and the last three for the visiting team, as shown below:
Figure 1. Format of the feature vector
The value of each feature is computed by using one of these three functions: fw, fD, and fL, which
reflects how much a team, as home or visiting team, wins, draws, or losses, respectively. Each one
of these functions receives two parameters for the corresponding team:
Previous results since 2003, which include, for each previous match, three information:
the result itself (win, draw, or loss), the place where the team played (H or V, for home,
and visiting, respectively), and the year of the game;
The game place for the match which is represented by the feature vector: H or V.
We consider only the results from 2003, because it was when the new format of the Brazilian
Soccer League has started. Previously, the structure of the competition was very different of the
current one.
These functions are defined as follows, in form of pseudocode:
fw (previous_results, game_place) Begin score_win = 0 foreach (result, place, year) in previous_results if (result is a win) and (place is the same as game_place) then score_win = score_win + 𝑒𝑦𝑒𝑎𝑟−2002 end if end for
return score_win End
Figure 2. fw pseudocode
5
fD (previous_results, game_place) Begin score_draw = 0 foreach (result, place, year) in previous_results if (result is a draw) and (place is the same as game_place) then score_ draw = score_ draw + 𝑒𝑦𝑒𝑎𝑟−2002 end if end for
return score_ draw End
Figure 3. fD pseudocode
fL (previous_results, game_place) Begin score_loss = 0 foreach (result, place, year) in previous_results if (result is a loss) and (place is the same as game_place) then score_ loss = score_ loss + 𝑒𝑦𝑒𝑎𝑟−2002 end if end for
return score_ loss End
Figure 4. fL pseudocode
These functions compute a score, considering a specific class label (win, draw, or loss), for the
team, in a way in which the more recent results are worth much more. In soccer, as well as in
almost every sport, the time factor is very important, because the team squad changes over the
years.
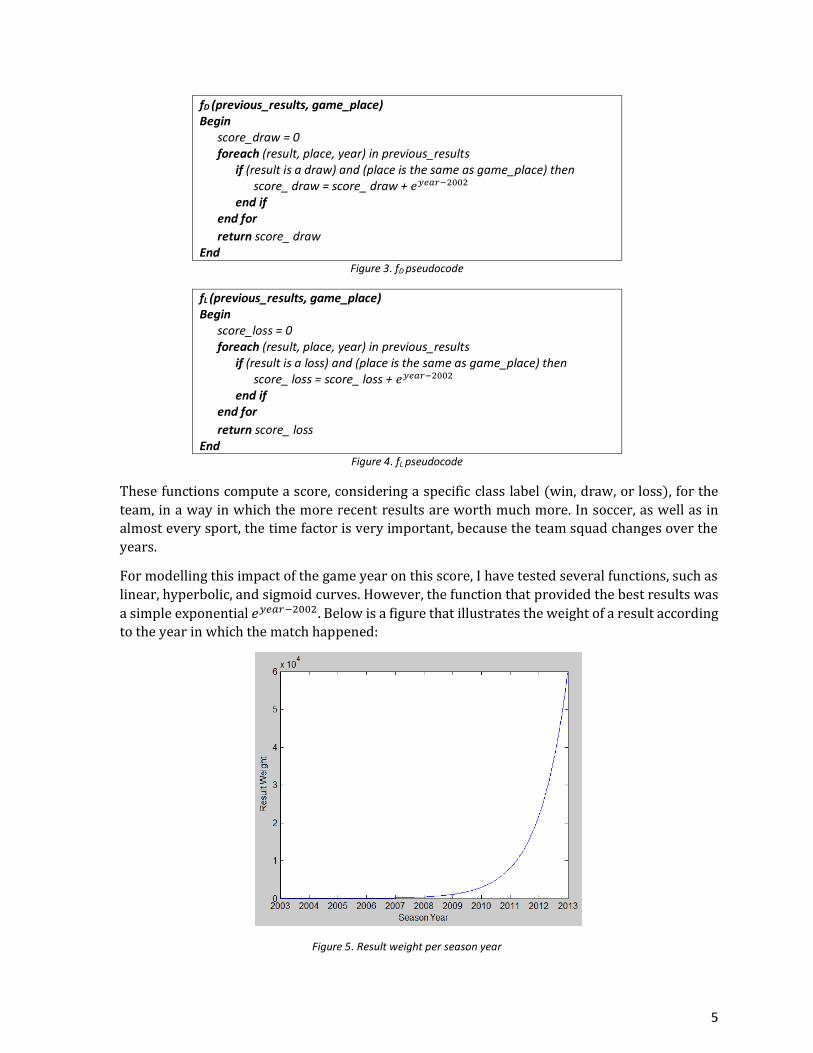
For modelling this impact of the game year on this score, I have tested several functions, such as
linear, hyperbolic, and sigmoid curves. However, the function that provided the best results was
a simple exponential 𝑒𝑦𝑒𝑎𝑟−2002. Below is a figure that illustrates the weight of a result according
to the year in which the match happened:
Figure 5. Result weight per season year
6
3. Data Extraction
There are three components of my work in which we need results of previous Brazilian Soccer
League matches:
1) Generation of feature vectors for a given match: we need the results of all the games of
both teams, since 2003 until last match for the current season;
2) Preparation of the training data: in this step, we generate a feature vector for each single
match of the first half of 2013 season (a total of 190 matches), where the actual result is
a class label. Thus, we need every result of 2013 first-half games;
3) Preparation of the testing data: in this step, we have a feature vector for each single match
of the second half of 2013 season (also, a total of 190 matches), with the corresponding
results in order to calculate the accuracy of predictions. Therefore, we need every result
of 2013 second-half games.
For performing the experiments in this work, we need to extract the results of the 20
participating clubs, specified in Table 1, from the 2003 season to the 2013 season. I have used
two Brazilian web sites in order to get these data:
Games of 2003-2004 seasons: http://www.bolanaarea.com/gal_brasileirao.htm
Games of 2005-2013 seasons: http://www.campeoesdofutebol.com.br
I have developed a Python program for extracting the results from 2003 to 2013, by using
powerful tools which the programming language Python provides for parsing HTML pages. This
program has stored all the extracted results into text files, one for each participating club. For
instance, we have a file entitled “Flamengo.txt” for the club Flamengo.
One of the most difficult task in this project was to develop this program, because there are
several problems with respect to lack of standardization in the format of pages. Unfortunately,
there is no structured data of Brazilian Soccer League results available publically.
Thus, my work may bring great positive impacts for future researchers by making available the
data that I have collected. An instance is the usage of my data, in his project, by one of my
classmates, Henrique Couto, who helped me to define the requirements and strategies for
extracting these data.
4. Maximum Likelihood Classifier
The first classifier that I have developed was a Maximum Likelihood Classifier. In this method, we
define a likelihood function for each class label:
pW(x): probability of the match represented by feature vector x to have a result of win of
home team;
pD(x): probability of the match represented by feature vector x to have a result of draw;
pL(x): probability of the match represented by feature vector x to have a result of loss of
home team.
7
For defining these likelihood functions, we assume that each one of them follows a univariate
Gaussian model:
pW,(x) ~ N(μw, ΣW)
pD,(x) ~ N(μD, ΣD)
pL,(x) ~ N(μL, ΣL)
Where μw is the mean of the training data feature vectors which have win as result, and ΣW is the
corresponding covariance matrix; μD is the mean of the training data feature vectors which have
draw as result, and ΣD is the corresponding covariance matrix; and μL is the mean of the training
data feature vectors which have loss as result, and ΣL is the corresponding covariance matrix.
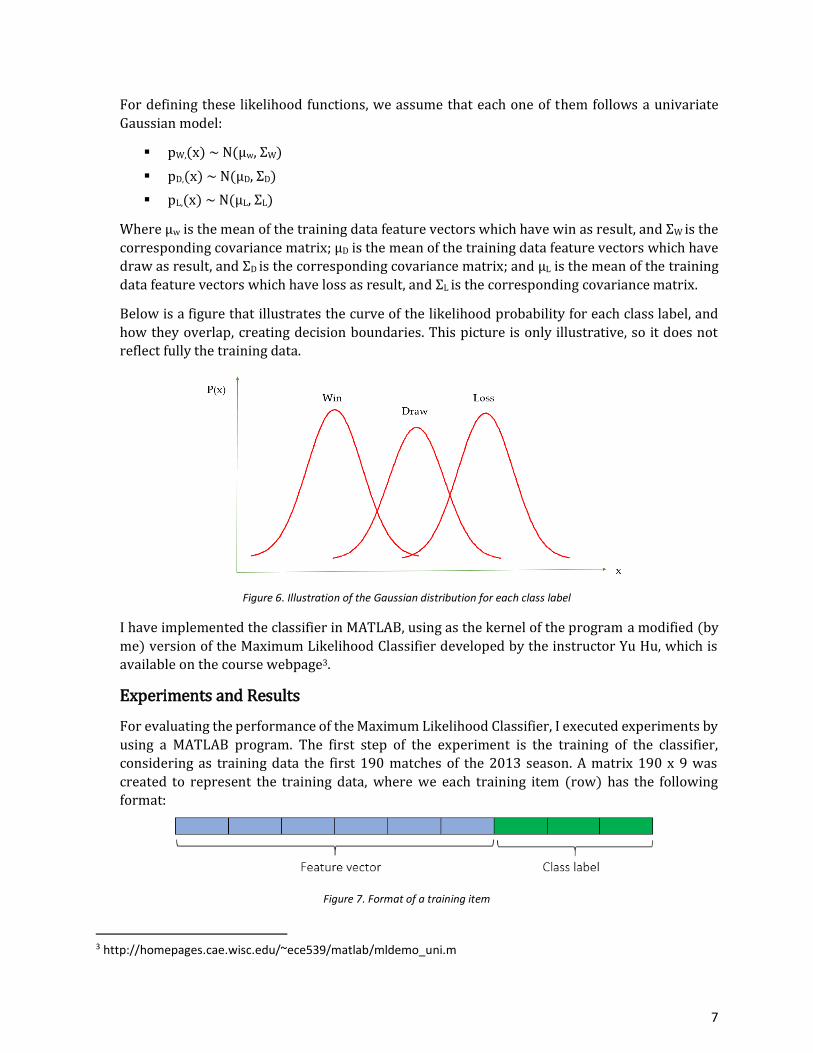
Below is a figure that illustrates the curve of the likelihood probability for each class label, and
how they overlap, creating decision boundaries. This picture is only illustrative, so it does not
reflect fully the training data.
Figure 6. Illustration of the Gaussian distribution for each class label
I have implemented the classifier in MATLAB, using as the kernel of the program a modified (by
me) version of the Maximum Likelihood Classifier developed by the instructor Yu Hu, which is
available on the course webpage3.
Experiments and Results
For evaluating the performance of the Maximum Likelihood Classifier, I executed experiments by
using a MATLAB program. The first step of the experiment is the training of the classifier,
considering as training data the first 190 matches of the 2013 season. A matrix 190 x 9 was
created to represent the training data, where we each training item (row) has the following
format:
Figure 7. Format of a training item
3 http://homepages.cae.wisc.edu/~ece539/matlab/mldemo_uni.m
8
Each label is encoded into 3 bits according to this:
Win of the home team: [1 0 0];
Draw: [0 1 0];
Loss of the home team: [0 0 1];
The training of the Maximum Likelihood classifier consists in computing a negative log-likelihood
matrix, by using the means and covariance matrices. We can compute the output label of an input
vector through this negative log-likelihood matrix.
The testing data are the last 190 matches of the 2013 season. These 190 matches are divided into
19 rounds, each one with ten matches, involving all the participating clubs. The rounds of the
second half are numbered from 20 to 38. The prediction of these matches will occur round by
round. In each round, the feature vector for the corresponding games will use the results from
2003 to the result of the last round. Thus, for instance, the feature scores of a team in the round
#20 will be different of the round #21.
The testing data is represented by a matrix 190 x 9, according to the same format as the training
data, where we have one line for each instance, and the first six columns for the feature vector,
and the last three for encoding the actual class label.
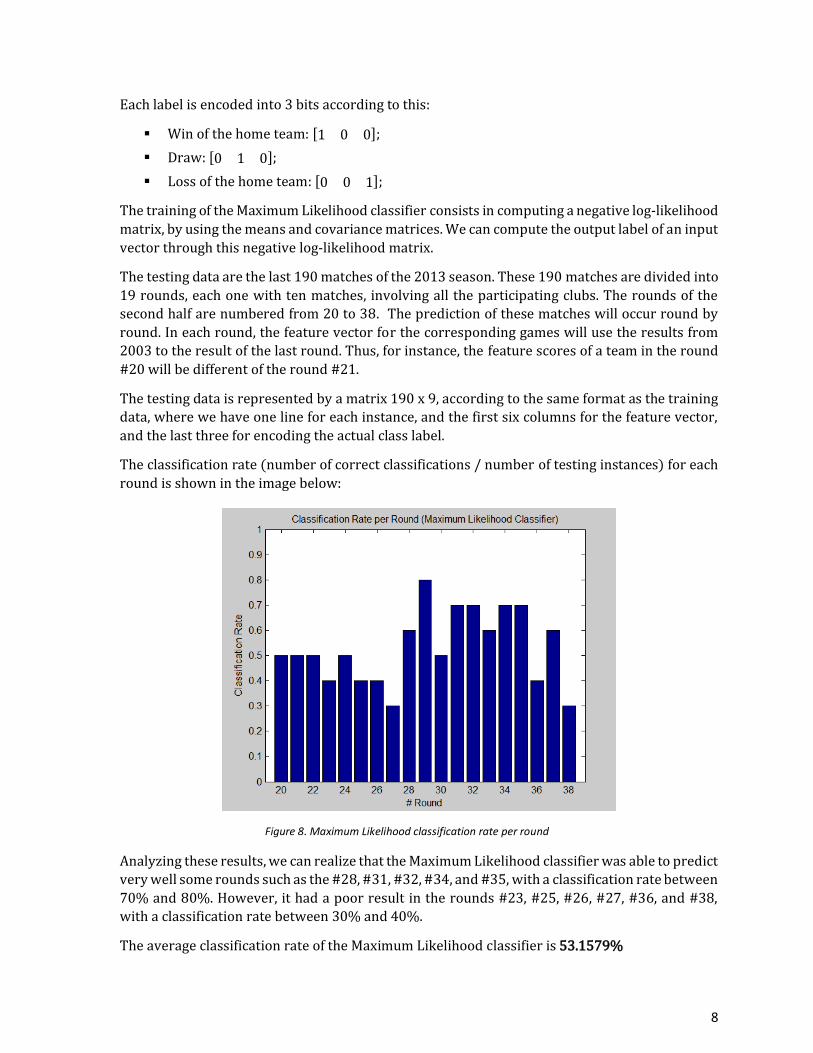
The classification rate (number of correct classifications / number of testing instances) for each
round is shown in the image below:
Figure 8. Maximum Likelihood classification rate per round
Analyzing these results, we can realize that the Maximum Likelihood classifier was able to predict
very well some rounds such as the #28, #31, #32, #34, and #35, with a classification rate between
70% and 80%. However, it had a poor result in the rounds #23, #25, #26, #27, #36, and #38,
with a classification rate between 30% and 40%.
The average classification rate of the Maximum Likelihood classifier is 53.1579%
9
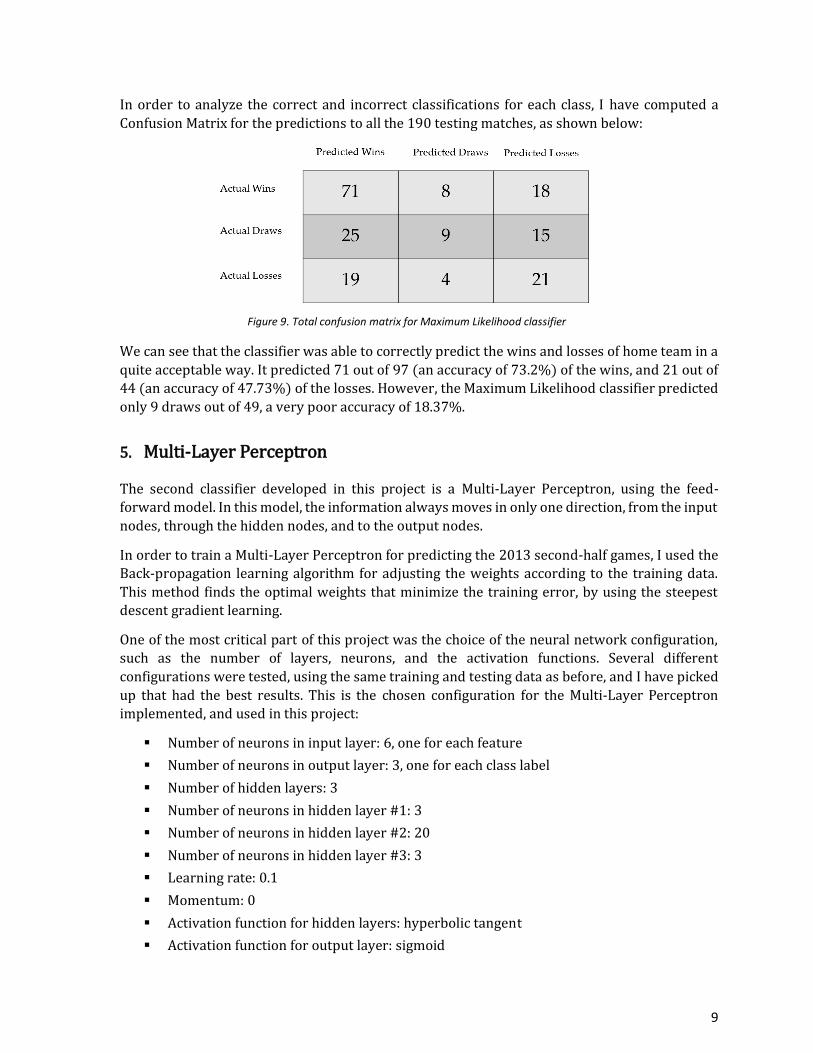
In order to analyze the correct and incorrect classifications for each class, I have computed a
Confusion Matrix for the predictions to all the 190 testing matches, as shown below:
Figure 9. Total confusion matrix for Maximum Likelihood classifier
We can see that the classifier was able to correctly predict the wins and losses of home team in a
quite acceptable way. It predicted 71 out of 97 (an accuracy of 73.2%) of the wins, and 21 out of
44 (an accuracy of 47.73%) of the losses. However, the Maximum Likelihood classifier predicted
only 9 draws out of 49, a very poor accuracy of 18.37%.
5. Multi-Layer Perceptron
The second classifier developed in this project is a Multi-Layer Perceptron, using the feed-
forward model. In this model, the information always moves in only one direction, from the input
nodes, through the hidden nodes, and to the output nodes.
In order to train a Multi-Layer Perceptron for predicting the 2013 second-half games, I used the
Back-propagation learning algorithm for adjusting the weights according to the training data.
This method finds the optimal weights that minimize the training error, by using the steepest
descent gradient learning.
One of the most critical part of this project was the choice of the neural network configuration,
such as the number of layers, neurons, and the activation functions. Several different
configurations were tested, using the same training and testing data as before, and I have picked
up that had the best results. This is the chosen configuration for the Multi-Layer Perceptron
implemented, and used in this project:
Number of neurons in input layer: 6, one for each feature
Number of neurons in output layer: 3, one for each class label
Number of hidden layers: 3
Number of neurons in hidden layer #1: 3
Number of neurons in hidden layer #2: 20
Number of neurons in hidden layer #3: 3
Learning rate: 0.1
Momentum: 0
Activation function for hidden layers: hyperbolic tangent
Activation function for output layer: sigmoid

10
Below is a figure that illustrates the Multi-Layer Perceptron architecture used in this project:
Figure 10. Multi-Layer Perceptron architecture
As well as in the Maximum Likelihood classifier, I have implemented this classifier in MATLAB. I
have employed – modifying them according to my needs, and the chosen configuration – the
Multi-Layer Perceptron, and Back-propagation learning developed by the instructor Yu Hu,
which is available on the course webpage4.
Experiment and Results
The performance tests for the MLP were executed by using a MATLAB program, which loads the
data files, one for each club. Moreover, this program trains the network, using as training data
the first 190 matches of 2013 season, and uses the network to predict the result of the last 190
matches.
The training and testing data follow the same format as in the Maximum Likelihood experiments.
We represent each training and testing instance as a vector of length nine, the first six positions
for the feature vector, and the last three to encode the label, as shown in the last section.
Different of the Maximum Likelihood classifier, the results of the MLP are stochastic, due to
randomization process in generation of the initial weights. Thus, in each execution of the tester
program, the accuracy should vary. In order to get an overall result, I have executed the tests for
ten times, and I will present the average of their results.
4 http://homepages.cae.wisc.edu/~ece539/matlab/bp.m
11
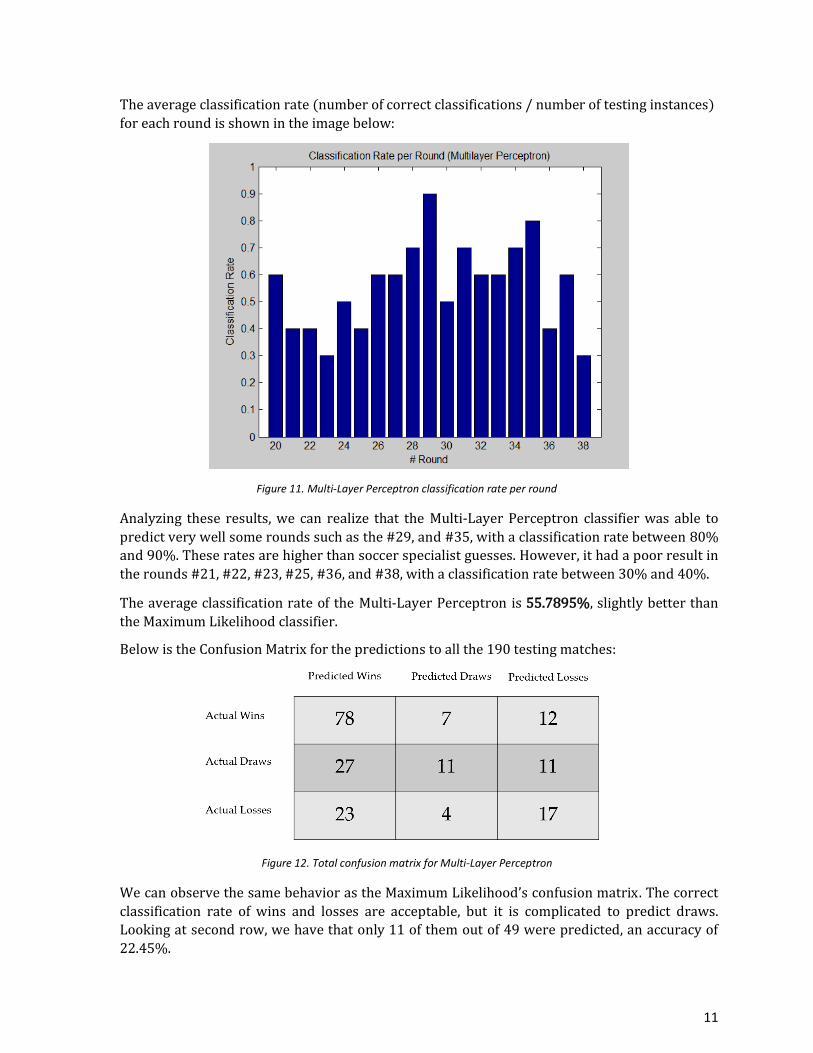
The average classification rate (number of correct classifications / number of testing instances)
for each round is shown in the image below:
Figure 11. Multi-Layer Perceptron classification rate per round
Analyzing these results, we can realize that the Multi-Layer Perceptron classifier was able to
predict very well some rounds such as the #29, and #35, with a classification rate between 80%
and 90%. These rates are higher than soccer specialist guesses. However, it had a poor result in
the rounds #21, #22, #23, #25, #36, and #38, with a classification rate between 30% and 40%.
The average classification rate of the Multi-Layer Perceptron is 55.7895%, slightly better than
the Maximum Likelihood classifier.
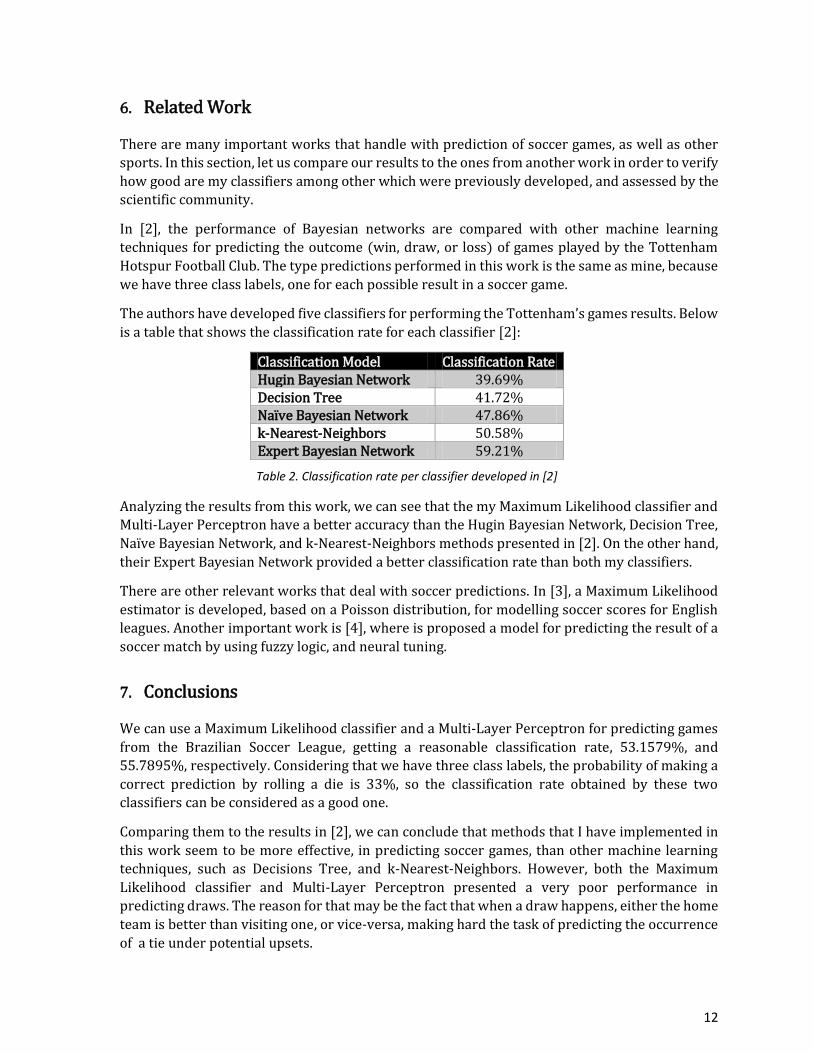
Below is the Confusion Matrix for the predictions to all the 190 testing matches:
Figure 12. Total confusion matrix for Multi-Layer Perceptron
We can observe the same behavior as the Maximum Likelihood’s confusion matrix. The correct
classification rate of wins and losses are acceptable, but it is complicated to predict draws.
Looking at second row, we have that only 11 of them out of 49 were predicted, an accuracy of
22.45%.
12
6. Related Work
There are many important works that handle with prediction of soccer games, as well as other
sports. In this section, let us compare our results to the ones from another work in order to verify
how good are my classifiers among other which were previously developed, and assessed by the
scientific community.
In [2], the performance of Bayesian networks are compared with other machine learning
techniques for predicting the outcome (win, draw, or loss) of games played by the Tottenham
Hotspur Football Club. The type predictions performed in this work is the same as mine, because
we have three class labels, one for each possible result in a soccer game.
The authors have developed five classifiers for performing the Tottenham’s games results. Below
is a table that shows the classification rate for each classifier [2]:
Classification Model Classification Rate Hugin Bayesian Network 39.69% Decision Tree 41.72% Naïve Bayesian Network 47.86% k-Nearest-Neighbors 50.58% Expert Bayesian Network 59.21%
Table 2. Classification rate per classifier developed in [2]
Analyzing the results from this work, we can see that the my Maximum Likelihood classifier and
Multi-Layer Perceptron have a better accuracy than the Hugin Bayesian Network, Decision Tree,
Naïve Bayesian Network, and k-Nearest-Neighbors methods presented in [2]. On the other hand,
their Expert Bayesian Network provided a better classification rate than both my classifiers.
There are other relevant works that deal with soccer predictions. In [3], a Maximum Likelihood
estimator is developed, based on a Poisson distribution, for modelling soccer scores for English
leagues. Another important work is [4], where is proposed a model for predicting the result of a
soccer match by using fuzzy logic, and neural tuning.
7. Conclusions
We can use a Maximum Likelihood classifier and a Multi-Layer Perceptron for predicting games
from the Brazilian Soccer League, getting a reasonable classification rate, 53.1579%, and
55.7895%, respectively. Considering that we have three class labels, the probability of making a
correct prediction by rolling a die is 33%, so the classification rate obtained by these two
classifiers can be considered as a good one.
Comparing them to the results in [2], we can conclude that methods that I have implemented in
this work seem to be more effective, in predicting soccer games, than other machine learning
techniques, such as Decisions Tree, and k-Nearest-Neighbors. However, both the Maximum
Likelihood classifier and Multi-Layer Perceptron presented a very poor performance in
predicting draws. The reason for that may be the fact that when a draw happens, either the home
team is better than visiting one, or vice-versa, making hard the task of predicting the occurrence
of a tie under potential upsets.
13
References
[1] Mauricio Murad, Football and Society in Brazil, Konrad-Adenauer-Stiftung e.V. International
Reports, Berlin, Aug. 25, 2006.
[2] A. Joseph, N. E. Fenton and M. Neil, Predicting football results using Bayesian nets and other machine learning techniques, Knowledge-Based Systems, vol. 19, no. 7, pp. 544-553, 2006.
[3] Dixon M.J. and Coles S.C, Modelling association football scores and inefficiencies in the football betting market, Applied Statistics 46: 265-280, 1997.
[4] P. Rotshtein, M. Posner and A. B. Rakityanskaya, Football Predictions Based on a Fuzzy Model with Genetic and Neural Tuning, Cybernetics and Systems Analysis Journal, 2005.
Related Documents


![[Social Media Marketing Digital Adverting Agency Indonesia] Strategy for brazilian soccer school](https://static.cupdf.com/doc/110x72/568bd9181a28ab2034a5c853/social-media-marketing-digital-adverting-agency-indonesia-strategy-for-brazilian-56de589a4a845.jpg)