Predicting Properties of Gas and Solid Streams by Intrinsic Kinetics of Fast Pyrolysis of Wood Jordan Klinger,* ,† Ezra Bar-Ziv, † David Shonnard, ‡,§ Tyler Westover, ∥ and Rachel Emerson ∥ † Department of Mechanical Engineering-Engineering Mechanics, ‡ Department of Chemical Engineering, and § Sustainable Futures Institute, Michigan Technological University, Houghton, Michigan 49931, United States ∥ Idaho National Laboratory, 2525 Fremont Avenue, Idaho Falls, Idaho 83415, United States ABSTRACT: Pyrolysis has the potential to create a biocrude oil from biomass sources that can be used as fuel or as feedstock for subsequent upgrading to hydrocarbon fuels or other chemicals. The product distribution/composition, however, is linked to the biomass source. This work investigates the products formed from pyrolysis of woody biomass with a previously developed chemical kinetics model. Different woody feedstocks reported in prior literature are placed on a common basis (moisture, ash, fixed carbon free) and normalized by initial elemental composition through ultimate analysis. Observed product distributions over the full devolatilization range are explored, reconstructed by the model, and verified with independent experimental data collected with a microwave-assisted pyrolysis system. These trends include production of permanent gas (CO, CO 2 ), char, and condensable (oil, water) species. Elementary compositions of these streams are also investigated. Close agreement between literature data, model predictions, and independent experimental data indicate that the proposed model/method is able to predict the ideal distribution from fast pyrolysis given reaction temperature, residence time, and feedstock composition. 1. INTRODUCTION Thermal degradation of polymers can selectively degrade the structure based on the processing severity (temperature and residence time). Recently, this pyrolysis process has been investigated in an inert atmosphere at mild conditions (400− 600 °C) for the generation of many smaller species that originate from the parent structure. In the case of biomass, pyrolysis creates a solid carbonaceous char, permanent gases (mainly CO and CO 2 ), many organic molecules such as ketones, organic acids, aldehydes, phenolics, cyclics, and saccharide based fragments, and larger polyphenolic polymers collectively referred to as pyrolytic tars. 1,2 Because of the processing temperature and high heating rates, most of the original mass is partitioned into species that are condensable at ambient temperatures. This condensed mixture, bio-oil, is typically very viscous and acidic and has a composition that is reflective of the parent biomass, consisting of typically 44−49% carbon while the remaining is primarily oxygen (45−52%) and hydrogen (6−9%). 2,3 Bio-oil can be used as a fuel oil for heating or electricity generation, or it can be upgraded to produce chemicals or hydrocarbon fuels. To meet the large modern day energy consumption, any biomass-to-energy process should be flexible and accommodate a wide range of biomass sources and subsequently bring about process considerations due to heterogeneity of biomass feedstock sources and resulting bio-oil. 4−6 To ensure product consistency and quality, processing conditions must be carefully controlled or tailored to the specific biomass source being processed. Establishing correlations or models to predict these properties is essential for efficient utilization of feedstock resources. Numerous review and experimental articles study the properties of pyrolysis products and their impact on fuel quality or applications. 2,3,7−14 Many of the current studies are parametric in nature and reportedly change based on many factors such as temperature, heating rate, residence time, particle size, vapor residence time, biomass feedstock composition, and moisture, among others. For example, in 2008 Garcia-Perez et al. 14 performed a comprehensive study on the pyrolysis of mallee wood and the resulting product properties. They found that as processing temperature increased (severity), the solid yield from the process decreased (almost linearly). Furthermore, the decrease in solid yield is associated with a linear decrease in solid volatile matter as oxygen decreases from 25 to 10% and carbon increases from approximately 70 to 87%, which also leads to an increased heating value. Here, volatile matter refers to the mass loss upon heating to 950 °C as described in methods similar to ASTM D3172. The overall decrease in solid yield is balanced between increased liquid and gas phase yields. The main gas phase species, CO 2 and CO, increase in a similar ratio over the processing conditions with minimal contribution from hydro- carbons. These same trends are observed in other literature sources across feedstock type and processing conditions, 14−16 suggesting an underlying relationship that has yet to be described. This paper uses a kinetic model to further elucidate the relationship between processing conditions and product properties. Previously, our group developed a kinetic model to describe torrefaction through a series of three consecutive reactions. 17 During these lumped pseudochemical reactions, the solid biomass breaks down into a series of intermediates and a set of gas/vapor phase species. The solid intermediates do not singularly exist but are modeled values representing average solid composition used to derive overall behavior. The solid Received: August 17, 2015 Revised: December 10, 2015 Published: December 12, 2015 Article pubs.acs.org/EF © 2015 American Chemical Society 318 DOI: 10.1021/acs.energyfuels.5b01877 Energy Fuels 2016, 30, 318−325

Welcome message from author
This document is posted to help you gain knowledge. Please leave a comment to let me know what you think about it! Share it to your friends and learn new things together.
Transcript

Predicting Properties of Gas and Solid Streams by Intrinsic Kineticsof Fast Pyrolysis of WoodJordan Klinger,*,† Ezra Bar-Ziv,† David Shonnard,‡,§ Tyler Westover,∥ and Rachel Emerson∥
†Department of Mechanical Engineering-Engineering Mechanics, ‡Department of Chemical Engineering, and §Sustainable FuturesInstitute, Michigan Technological University, Houghton, Michigan 49931, United States∥Idaho National Laboratory, 2525 Fremont Avenue, Idaho Falls, Idaho 83415, United States
ABSTRACT: Pyrolysis has the potential to create a biocrude oil from biomass sources that can be used as fuel or as feedstockfor subsequent upgrading to hydrocarbon fuels or other chemicals. The product distribution/composition, however, is linked tothe biomass source. This work investigates the products formed from pyrolysis of woody biomass with a previously developedchemical kinetics model. Different woody feedstocks reported in prior literature are placed on a common basis (moisture, ash,fixed carbon free) and normalized by initial elemental composition through ultimate analysis. Observed product distributionsover the full devolatilization range are explored, reconstructed by the model, and verified with independent experimental datacollected with a microwave-assisted pyrolysis system. These trends include production of permanent gas (CO, CO2), char, andcondensable (oil, water) species. Elementary compositions of these streams are also investigated. Close agreement betweenliterature data, model predictions, and independent experimental data indicate that the proposed model/method is able topredict the ideal distribution from fast pyrolysis given reaction temperature, residence time, and feedstock composition.
1. INTRODUCTION
Thermal degradation of polymers can selectively degrade thestructure based on the processing severity (temperature andresidence time). Recently, this pyrolysis process has beeninvestigated in an inert atmosphere at mild conditions (400−600 °C) for the generation of many smaller species thatoriginate from the parent structure. In the case of biomass,pyrolysis creates a solid carbonaceous char, permanent gases(mainly CO and CO2), many organic molecules such asketones, organic acids, aldehydes, phenolics, cyclics, andsaccharide based fragments, and larger polyphenolic polymerscollectively referred to as pyrolytic tars.1,2 Because of theprocessing temperature and high heating rates, most of theoriginal mass is partitioned into species that are condensable atambient temperatures. This condensed mixture, bio-oil, istypically very viscous and acidic and has a composition that isreflective of the parent biomass, consisting of typically 44−49%carbon while the remaining is primarily oxygen (45−52%) andhydrogen (6−9%).2,3 Bio-oil can be used as a fuel oil forheating or electricity generation, or it can be upgraded toproduce chemicals or hydrocarbon fuels. To meet the largemodern day energy consumption, any biomass-to-energyprocess should be flexible and accommodate a wide range ofbiomass sources and subsequently bring about processconsiderations due to heterogeneity of biomass feedstocksources and resulting bio-oil.4−6 To ensure product consistencyand quality, processing conditions must be carefully controlledor tailored to the specific biomass source being processed.Establishing correlations or models to predict these propertiesis essential for efficient utilization of feedstock resources.Numerous review and experimental articles study the
properties of pyrolysis products and their impact on fuelquality or applications.2,3,7−14 Many of the current studies areparametric in nature and reportedly change based on many
factors such as temperature, heating rate, residence time,particle size, vapor residence time, biomass feedstockcomposition, and moisture, among others. For example, in2008 Garcia-Perez et al.14 performed a comprehensive study onthe pyrolysis of mallee wood and the resulting productproperties. They found that as processing temperatureincreased (severity), the solid yield from the process decreased(almost linearly). Furthermore, the decrease in solid yield isassociated with a linear decrease in solid volatile matter asoxygen decreases from 25 to 10% and carbon increases fromapproximately 70 to 87%, which also leads to an increasedheating value. Here, volatile matter refers to the mass loss uponheating to 950 °C as described in methods similar to ASTMD3172. The overall decrease in solid yield is balanced betweenincreased liquid and gas phase yields. The main gas phasespecies, CO2 and CO, increase in a similar ratio over theprocessing conditions with minimal contribution from hydro-carbons. These same trends are observed in other literaturesources across feedstock type and processing conditions,14−16
suggesting an underlying relationship that has yet to bedescribed. This paper uses a kinetic model to further elucidatethe relationship between processing conditions and productproperties.Previously, our group developed a kinetic model to describe
torrefaction through a series of three consecutive reactions.17
During these lumped pseudochemical reactions, the solidbiomass breaks down into a series of intermediates and a set ofgas/vapor phase species. The solid intermediates do notsingularly exist but are modeled values representing averagesolid composition used to derive overall behavior. The solid
Received: August 17, 2015Revised: December 10, 2015Published: December 12, 2015
Article
pubs.acs.org/EF
© 2015 American Chemical Society 318 DOI: 10.1021/acs.energyfuels.5b01877Energy Fuels 2016, 30, 318−325
intermediates are assumed to be a partially degraded form ofthe original biomass where the carbohydrate and fiber fractionsof the material have gone through scission reactions. The fiber/carbohydrates are then represented by a smaller amount of theoriginal cellulose, hemicellulose, and lignin at shorter averagedegrees of polymerization. The solid intermediates becomeprogressively more recalcitrant with higher activation energiesas weakly bound compounds are broken and removed from thechemical structure and as condensation reactions deposit morerecalcitrant compounds on the surface.This lumped model approach was then extended into the
pyrolysis range from 300 to 425 °C using a series of sixpseudoreactions.18 At these increased temperatures, more oilproduction was observed from more complete degradation ofthe cellulose and lignin fractions in particular. This increaseddegradation of cellulose and lignin at higher temperatures hasalso been observed by others.19−21 These six pseudoreactionsproceed through a set of five solid intermediates that requireincreasing energies to degrade until only fixed carbon andmineral content, or nonvolatile mass, remains. These sixreactions, likely representing many near-parallel reactionsacross the consecutive stages, were able to accurately describedynamic gas-vapor species production. The model was basedupon the identification of 32 unique chemical masses that werevolatized as well as upon measurements of total weight loss.Stoichiometry factors were used to partition the relativeproduction of the species through the six reactions. Thesereactions and parameters are summarized in Reactions 1−6below, where j denotes the intermediate reaction stage (2, 3, 4,or 5), Rj is a degraded solid intermediate during reaction j, αj,i isa stoichiometric parameter for species i in reaction j, and Pj,i isproduct i formed in reaction j. The activation energies werefound to be 104, 129, 154, 217, 256, and 285 kJ/mol,respectively, with frequency factors of 2.6E9, 1.6E11, 5.0E12,1.2E17, 3.6E19, and 9.3E20 min‑1, respectively.18 The priorwork showed that torrefaction and pyrolysis can be explainedby a single unified model and are similar processes. Theactivation energies for the progressive stages of degradationincrease and can explain the differences in product productionrate and component (cellulose, hemicellulose, lignin) degrada-tion within the different temperature regimes.
∑ α→ +s R PBiomask
i i1 1, 1,1
(1)
∑ α→ +−R R Pjk
j j i j i1 , ,j
(2−5)
∑ α→ +R PChark
i i5 6, 6,6
(6)
In the present work, the applications of such a kinetic modelwere explored for understanding the products of fast pyrolysis.Throughout this manuscript, fast pyrolysis refers to pyrolysisprocessing in which the reactions are limited primarily byreaction kinetics, not heat transfer limitations. Importantly,because the reaction kinetics for processing temperatures colderthan 300 °C (i.e., torrefaction) are relatively slow, in manycases torrefaction can be considered mild fast pyrolysis.Consequently, torrefaction and fast pyrolysis reaction datafrom the literature are grouped together in this work. Thejustification for this grouping is discussed further below. Datafor the elemental composition of pyrolytic chars at variousextents of reactions are used to determine the composition ofthe solid pseudoreactant intermediates in the model and
calibrate the model predictions. The predictions of the yield ofgaseous, liquid, and solid product were explored and comparedto literature data, in addition to the distribution of permanentgases (CO, CO2), water, and the condensable pyrolysis oil. Theretention of the embodied energy in the pyrolytic chars wasalso investigated. Model predictions are compared against abroad literature survey for fast pyrolysis and torrefaction data,in addition to experimental data gathered independently formodel/method validation. Variation in feedstock compositionis addressed through normalization as discussed below. Theresulting model is able to accurately predict the distribution ofpyrolytic species and their composition. These elementalcompositions and dynamic prediction of products can provideuseful engineering tools, as well as development of otherstudies. Comparison to other modeling approaches is detailedin the previous work.18
2. MATERIALS AND METHODSMicropyrolysis experiments and development of the pyrolysis modelwere conducted at Michigan Technological University (MTU), withexperimental and modeling details described in previous work.18,22,23
The model was validated using experimental data from Idaho NationalLaboratory (INL) using a microwave-assisted pyrolysis system as wellas data published in the literature.24,25 The samples used in themicrowave-assisted fast pyrolysis tests include clean and whole treepine, hybrid poplar, and tulip poplar. Detailed characterization of thesamples has been described in a previous publication.24,25 Briefexperimental details are provided here for convenience.
2.1. Micropyrolysis Experiments. Micropyrolysis experimentsfor kinetic model development were performed with a CDS 5200HPPyroprobe resistive filament pyrolyzer. The unit is capable of achievingapproximately 1000 °C/s heating rates with predominantly radiativetransport to the biomass sample. Samples studied with themicropyrolysis unit were debarked aspen fibers (500−600 μm, 100−300 μg). The pyrolyzer was connected directly to a GC/MS unit(ThermoFisher trace GC, DSQII MS) with a heated transfer line thatwas maintained at 300 °C to limit product vapors from condensing.The GC/MS was equipped with a short nonretentive guard columnand maintained at 300 °C to minimize convolution of dynamicproduct traces before data acquisition.
2.2. Modeling Approach. The kinetic model is described inReactions 1−6 above. To calibrate the modeling parameters, literaturedata were collected for the product distribution and composition fromfast pyrolysis of woody biomass for the entire temperature rangestudied.14−16,24,26−38 In these studies, fast pyrolysis implies decoupledreaction kinetics to heat and mass transport effects and therefore hasnegligible influence due to transport phenomena. This is achievedthrough fast heating rate/flux into the biomass particles and smalloverall particle size. Selected studies were chosen where data werepresent for weight distribution between solid, liquid, gas phase species,distribution of primary gas species (CO and CO2), water formedduring pyrolysis, elemental distribution (C, H, O) through ultimateanalysis , and/or proximate analysis and heating valuedata.14−16,24,26−38 In this work gaseous hydrocarbon species (hydro-gen, methane, ethane, ethylene, and propane) and hydrogen were notconsidered due to their relatively low abundance and inconsistentobservation. Additionally, the observance of hydrocarbons has beensuggested to be a result of secondary reactions due to alkali mineralcontent and heat and mass transport effects.39−42 As discussed, woodybiomass with low mineral ash content was chosen with experimentalconditions that minimize the impacts of heat and mass transportlimitations, thereby decreasing the formation of gaseous hydrocarbons.These data were tabulated with their respective processing times andtemperatures. At small particles, as discussed above, sample particlesare approximately uniformly heated, and the process can be decoupledfrom heat transfer dynamics and can be expressed in an extent ofreaction through pyrolysis. For this work, the extent of reaction isexpressed through mass loss from the biomass sample, which is the
Energy & Fuels Article
DOI: 10.1021/acs.energyfuels.5b01877Energy Fuels 2016, 30, 318−325
319

amount of volatile matter removed. For the woody feedstocks used inthe studies above, the nonvolatile matter (mineral content and fixedcarbon) sum to approximately 10−15% (12% average used duringmodeling) of the initial dry weight. Because of this, the extent ofreaction (mass loss) ranges from 0 to 88% where remaining organicmatter is the nonvolatile fixed carbon. Secondary reactions (resultingin gas-phase hydrocarbons) are primarily attributed to the presence ofsignificant alkali mineral content or long gas-phase residence times butwere not considered because the surveyed data were sourced from fastpyrolysis systems with short vapor-phase residence times and usedwoody biomass with insignificant alkali mineral content.39−42
These literature data were used to calibrate the composition of thesolid intermediates of Rxns 1−2−5 from an assumed feed of 1 mol ofhydrogen contained in the parent biomass (16.6 g of biomass) andcomplete degradation to a solid char with only the nonvolatile massremaining as char (solid product in Rxn 6). The nonvolatile mass isconsidered as the fixed carbon content (∼12 wt %) and mineralcontent (negligible for woody biomass). An average initialcomposition from the literature sources of woody biomass was usedto initiate the model (48% carbon, 6.0% hydrogen, 46% oxygen).Fitting was performed by minimizing the squared difference betweenthe bulk literature trends and the model predictions for composition(C, H, O) of the solid reactant, the production of reaction-formedwater, and the mass distribution between the CO and CO2 in thepermanent gas stream. Predictions for the oil species (excluding water)are found through an elemental balance. The embodied energy of thesolid products is found through a correlation developed to predictheating values of a wide range of biomass species.43 From a set of 122samples studied, an estimate of the heating value is given by
= − − + × + +C C H C H NHHV 3.55 232 2230 51.2 131 20,6002
where the heating value, HHV, is expressed in kJ/kg, and C, H, and Nare the weight percent contributions from carbon, hydrogen, andnitrogen, respectively. Embodied energy in the produced water andCO2 are taken as zero by definition, and a typical value of 10.1 MJ/kgwas used for the HHV of carbon monoxide. The energy in the bio-oilcan also be approximated from the correlation above.This model approach contains many parameters that need to be fit
in order to be used predictively. Because of this, the sample datacollected from the literature were used for the parameter fittingroutines described above. Additional experimental data were gathered(described in the following sections) and compared to modelpredictions to provide validation. As shown below, woody feedstockbehave similarly, and the modeling outcomes would be similar if thefitting routine was performed on the experimental data and thencompared to the literature. If a significant amount of data weregathered for a singular feedstock and used for model calibration,however, the correlation may be higher than those presented below,which were obtained using multiple woody feedstocks with varyingproperties and composition.2.3. Feedstock/Solid Product Characterization. Feedstock for
experimental validation of the model were four different wood speciesincluding pine without bark (Bulter, AL), pine with bark (Butler, AL),hybrid poplar (Morrow, OR), and tulip poplar (Knox, KY). Proximateanalysis were carried out with a LECO TGA701 (LECO, St. Joseph,MI) according to ASTM D5142. Ultimate analysis (CHN) wasperformed using a modified ASTM D5373 method for a slightlyshorter burn profile with a LECO TruSpec CHN Analyzer (LECO, St.Joseph, MI). Oxygen content was determined by difference. Heatingvalues (HHV) were determined using ASTM D5865-10 with a LECOAC600 calorimeter (LECO, St. Joseph, MI). Average values of at leastduplicate measurements were used in this study.2.4. Fast Pyrolysis. A microwave-assisted fast pyrolysis reactor was
used to obtain independent data for model validation. Here fastpyrolysis refers to processing in which reactions are limited bychemical reaction kinetics, not heat transfer. The lab-scale microwavepyrolysis unit was used for data collection from low to high severitylevels (conditions described below). To enhance microwaveabsorption, samples were ground using a Retzch ZM200 fine grinderequipped with a 200 μm screen and then doped with 5% activated
charcoal from Sigma-Aldrich. The experimental apparatus consisted ofa quartz tube surrounded by an insulated microwave cavity (furnace)that could be independently heated with resistive heaters to 550 °C. A3 kW SM1250D model microwave generator (MKS Instruments,Andover, MA) was used in combination with a waveguide andmicrowave autotuners to briefly focus a microwave beam onto samplesinside the cavity to achieve fast pyrolysis heating rates. A PRO 82pyrometer (Williamson, Concord, MA) was used to monitor sampletemperature during the reaction. A virtual instrument developed inLabVIEW (National Instruments, Austin, TX) was used to control themicrowave power applied to the sample. The sample temperature asdetermined by the pyrometer and the forward and reverse microwavepowers through the autotuner were tracked in LabVIEW. The softwarewas programmed to maintain approximately constant microwavepower until the target sample temperature was achieved and thenautomatically turn off microwave power.
Each experiment was performed by following 6 steps. (1) Preheatthe microwave cavity and a quartz tube to 300, 375, or 450 °C usingresistive heating. (2) Load a sample into the end of the tube away fromthe heated furnace and start a nitrogen purge gas flow of 2 L/min. (3)After an inert atmosphere was achieved in the quartz tube, the sampleis relocated to the center of the heated microwave cavity using apushrod to maintain inert atmosphere. (4) The microwave beam wasactivated to rapidly heat the samples to the target reaction temperatureof 320, 395, or 470 °C, and then the microwave power wasautomatically shut-off. All target reaction temperatures in these resultswere reached within 8.0 s. (5) After a total residence time of 20 s, thequartz tube containing the samples is removed from the furnace andcooled using reverse nitrogen flow. (6) After the quartz tubecontaining the sample cools to approximately 100 °C, the sample isremoved, and sample and gas line components are weighed todetermine solid and liquid yields. Each experimental condition wasperformed in triplicate.
Importantly, the feedstocks chosen for the microwave pyrolysis areidentical to feedstocks that were previously prepared at Idaho NationalLaboratory (INL) and tested for fast pyrolysis conversion at theNational Renewable Energy Laboratory (NREL) in a 2 in. fluidizedbed fast pyrolysis system.24,25 Because the feedstocks chosen for themicrowave tests are identical to feedstocks that have been tested in anestablished fluidized bed fast pyrolysis reactor, direct comparison ofthe product data can establish the relevance of the microwaveapproach to fluidized bed fast pyrolysis. Motivation for using amicrowave-assisted fast pyrolysis system are (1) each test can becompleted, including the weighing of products, in minutes, rather thanhours or days; (2) because of microwave heating, heat transfer media,such as silica sand, is not necessary, greatly simplifying the process toweigh the solid products; (3) the microwave heats the samplesinternally allowing for potentially larger particles and slower surfaceheating rates while still achieving fast pyrolysis conditions.
2.5. Pyrolysis Product Characterization. Proximate andultimate analyses of the bio-oil and char was performed using thesame methods described above in Section 2.3. Water content of bio-oilwas measured in accordance with ASTM D5530 by Karl Fishertitration and was measured in triplicate and quantified against NISTtraceable water standards. A Model300 NDIR (California AnalyticalInstruments) and three-channel (10m MS 5A, 10m PBQ, and 8m CPSil 5) CP 4900 MicroGC (Varian) were used to measure and recordpermanent gas products.
3. RESULTS AND DISCUSSION
3.1. Model Calibration. The kinetic model is displayed inRxns 1−6 above and was previously developed from carefulstudy of chemical dynamics.18 In order to make mass-basedpredictions for pyrolysis products, several parameters werecalibrated to literature data as discussed in section 2.2. Thecalibrated parameters include the elemental composition of thesolid reaction intermediates, Rj, and the reaction stoichiometric
Energy & Fuels Article
DOI: 10.1021/acs.energyfuels.5b01877Energy Fuels 2016, 30, 318−325
320
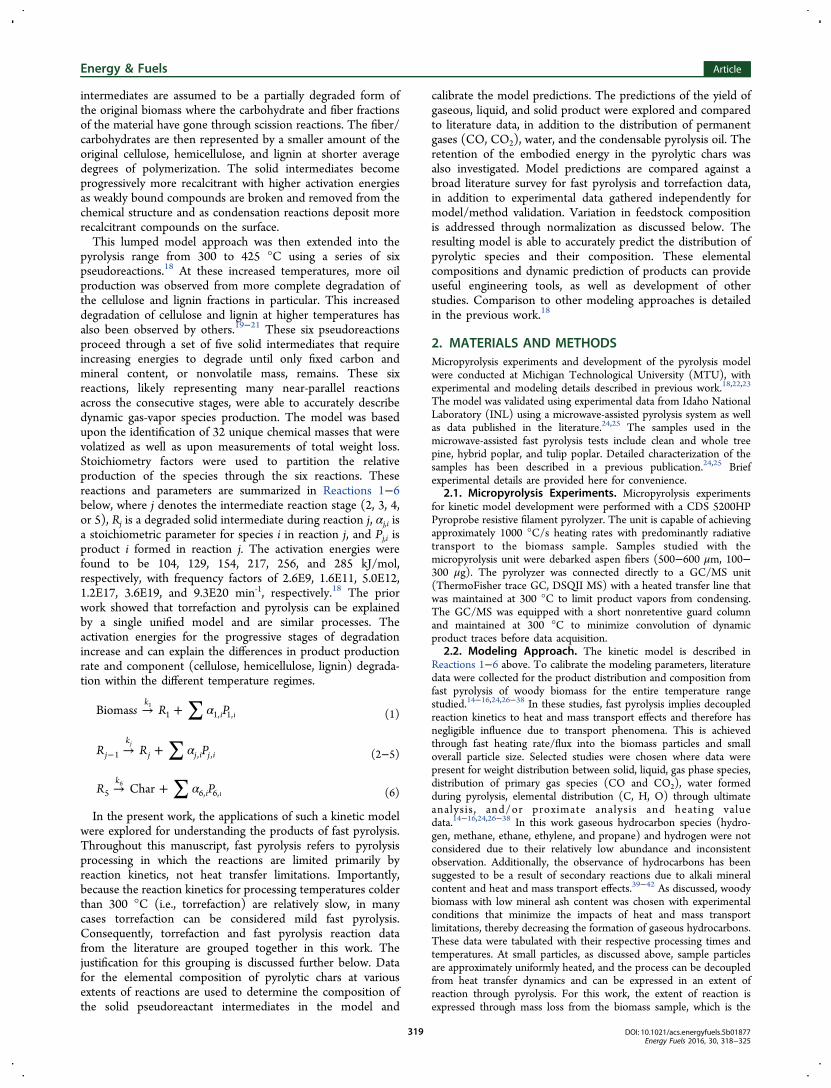
parameters for noncondensable gases (CO and CO2) andwater.Figure 1 shows a comparison of relative elemental
composition in solids from literature (“Literature”) and the
experimental data (“Experimental”) gathered from the micro-wave assisted pyrolyzer over the mass loss observed by theoriginal sample. Also highlighted are data reported by Howe etal. because the same feedstock was used. There is a generaltrend to the data, where the relative carbon content beginsaround 50% and increases to approximately 60% at 50%removal of initial sample mass. As mass is further removed, therate of change in the relative carbon content (carbon mass tototal mass) increases to final value approaching 100%, whichconsists almost exclusively of fixed carbon. The increase incarbon content is due to the preferential removal of hydrogenand oxygen. At 50% mass removal, average oxygen contentdecreased from approximately 45% to 35%, while averagehydrogen content decreases from approximately 6.0% to 5.5%.The relative amounts of both hydrogen and oxygen quicklydecay to their final values near zero when the material is fullydevolatilized. Though these general trends apply across manydifferent studies investigating woody feedstock, there issubstantial scatter likely due to experimental uncertainties and
conditions and, perhaps more substantially, due to variability infeedstock composition within woody feedstock. Evidence of theimportance of feedstock variability is shown by the closeagreement between the experiments using microwave-assistedfast pyrolysis and the fluidized bed results reported by (Howeet al.) using the same four feedstocks. This is illustrated by thecomparison and general agreement of “Experimental” and“Howe et al.” trends in Figure 1.Because of the large scatter in empirical data, a more uniform
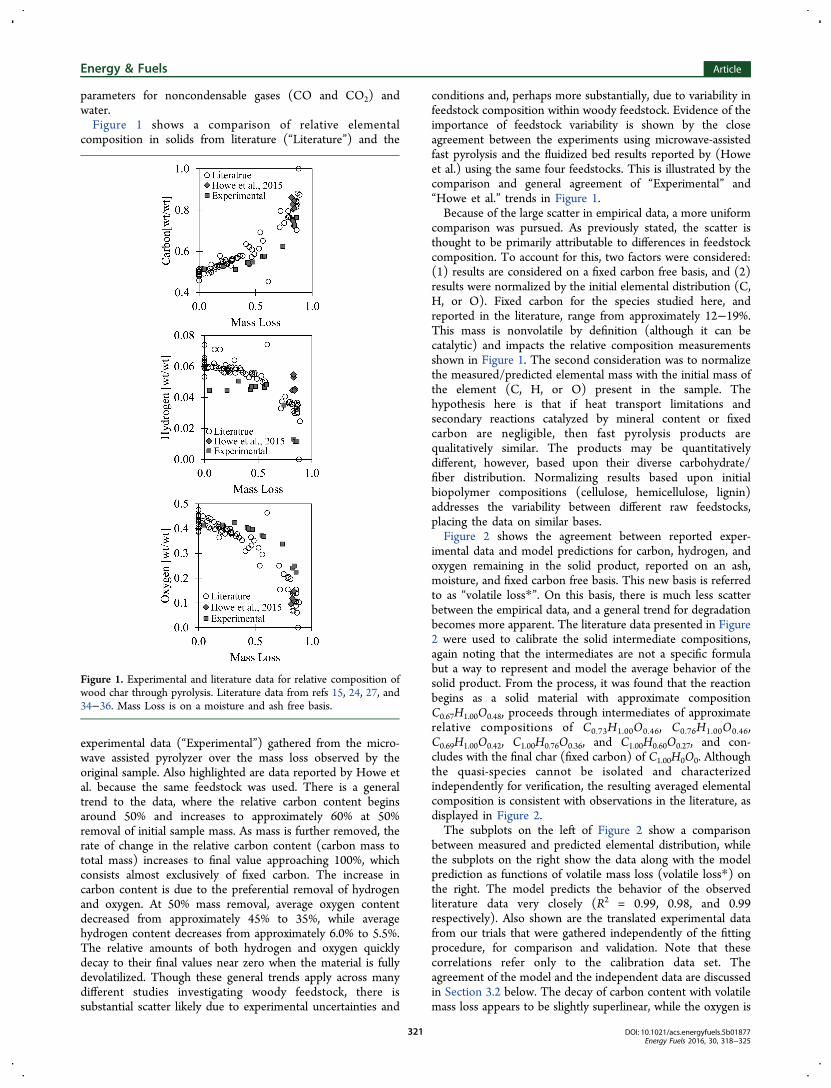
comparison was pursued. As previously stated, the scatter isthought to be primarily attributable to differences in feedstockcomposition. To account for this, two factors were considered:(1) results are considered on a fixed carbon free basis, and (2)results were normalized by the initial elemental distribution (C,H, or O). Fixed carbon for the species studied here, andreported in the literature, range from approximately 12−19%.This mass is nonvolatile by definition (although it can becatalytic) and impacts the relative composition measurementsshown in Figure 1. The second consideration was to normalizethe measured/predicted elemental mass with the initial mass ofthe element (C, H, or O) present in the sample. Thehypothesis here is that if heat transport limitations andsecondary reactions catalyzed by mineral content or fixedcarbon are negligible, then fast pyrolysis products arequalitatively similar. The products may be quantitativelydifferent, however, based upon their diverse carbohydrate/fiber distribution. Normalizing results based upon initialbiopolymer compositions (cellulose, hemicellulose, lignin)addresses the variability between different raw feedstocks,placing the data on similar bases.Figure 2 shows the agreement between reported exper-
imental data and model predictions for carbon, hydrogen, andoxygen remaining in the solid product, reported on an ash,moisture, and fixed carbon free basis. This new basis is referredto as “volatile loss*”. On this basis, there is much less scatterbetween the empirical data, and a general trend for degradationbecomes more apparent. The literature data presented in Figure2 were used to calibrate the solid intermediate compositions,again noting that the intermediates are not a specific formulabut a way to represent and model the average behavior of thesolid product. From the process, it was found that the reactionbegins as a solid material with approximate compositionC0.67H1.00O0.48, proceeds through intermediates of approximaterelative compositions of C0.73H1.00O0.46, C0.76H1.00O0.46,C0.69H1.00O0.42, C1.00H0.76O0.36, and C1.00H0.60O0.27, and con-cludes with the final char (fixed carbon) of C1.00H0O0. Althoughthe quasi-species cannot be isolated and characterizedindependently for verification, the resulting averaged elementalcomposition is consistent with observations in the literature, asdisplayed in Figure 2.The subplots on the left of Figure 2 show a comparison
between measured and predicted elemental distribution, whilethe subplots on the right show the data along with the modelprediction as functions of volatile mass loss (volatile loss*) onthe right. The model predicts the behavior of the observedliterature data very closely (R2 = 0.99, 0.98, and 0.99respectively). Also shown are the translated experimental datafrom our trials that were gathered independently of the fittingprocedure, for comparison and validation. Note that thesecorrelations refer only to the calibration data set. Theagreement of the model and the independent data are discussedin Section 3.2 below. The decay of carbon content with volatilemass loss appears to be slightly superlinear, while the oxygen is
Figure 1. Experimental and literature data for relative composition ofwood char through pyrolysis. Literature data from refs 15, 24, 27, and34−36. Mass Loss is on a moisture and ash free basis.
Energy & Fuels Article
DOI: 10.1021/acs.energyfuels.5b01877Energy Fuels 2016, 30, 318−325
321

sublinear. The close fit between measured and predicted dataacross a wide range of woody feedstock suggests that thesetraces can apply to other similar feedstock without priorknowledge of their degradation pathway.Additional calibration was needed to find the reaction
stoichiometric parameters for carbon monoxide, carbondioxide, and water. Results from this procedure are shown inFigure 3. The fitting procedure was performed using the sameliterature and experimental data as discussed above, except thatCO and CO2 yields are not available from some sources,including the microwave pyrolysis experiments.24,25 Although asmaller set of data is available for mass yields of these speciesover the progression of pyrolysis severity, the general trend iscaptured through the fitting procedure. The productionbehaviors for CO and CO2 are similar and begin with modestproduction followed by an increasing production rate withincreasing process severity. These behaviors for CO and CO2are also commonly observed in the literature, as notedabove.14,15,38 The behavior of water production is in starkcontrast to the formation of fixed gases and exhibits the fastestproduction rate during mild pyrolysis. As severity increases,water formation decreases and almost plateaus as it approaches100% removal of the volatile mass. This likely corresponds towater formation from structural carbohydrates/fiber. Fromthermogravimetric analyses, it is known that hemicellulose
degrades at the lowest severity conditions, cellulose at mediumseverity, and lignin degradation is portioned between mediumand severe processing.19,20,44,45 In addition, there is evidencethat water production from thermal treatment of lignin is muchlower than that of the carbohydrates and that hemicellulose isthe largest producer.44,45 We hypothesize that these combinedeffects account for the observed trends and predictions.
3.2. Validation. 3.2.1. Char Composition. As a result of themass loss, the relative elemental composition of the pyrolyticchar is altered. As described and shown in Figure 2 above, thesolid composition of the pyrolytic chars collected from themicrowave system are well predicted by the model. Thecoefficient of determination for the normalized carbon,hydrogen, and oxygen is 0.95, 0.99, and 0.96 respectively.This, combined with the magnitude of mass loss discussedabove, validates that the model has accurate representation ofexperimental observations.
3.2.2. Gross Calorific Value. Figure 4 shows the modelpredictions and data for the heating value of the solid char. Thedata presented were not used during the model calibration, andthus both literature and experimental data provide validation.There is a clear trend in the bulk literature data that is inagreement with the model. The gross calorific value increaseswith increasing severity. Beginning at approximately 19 MJ/kgin the original material, the heating value observes a modest
Figure 2. Comparison of experimental data and model prediction fornormalized composition of wood char through pyrolysis. VolatileLoss* is on a moisture, ash, and fixed carbon free basis. Literature datafrom refs 14, 15, 24, 27, and 34−36.
Figure 3. Comparison of carbon monoxide, carbon dioxide, and wateryield to model predictions for mass calibration of reactionstoichiometry. Volatile Loss* is on a moisture, ash, and fixed carbonfree basis. Literature data from refs 14, 15, 24, 25, 27, and 37.
Energy & Fuels Article
DOI: 10.1021/acs.energyfuels.5b01877Energy Fuels 2016, 30, 318−325
322

increase to approximately 22 MJ/kg with 50% removal of thevolatile mass. As more mass is removed, a higher proportion ofcarbon remains in the solid product and thereby increases theheating value. This trend is well within the scatter observed inthe literature and agrees with data gathered in this study. Above90% volatile mass removal, however, the model appears topredict a higher energy content than typically measured. This islikely a combined result of few data available at the most severeprocessing conditions during calibration, which skews themodel toward higher accuracy at less severe conditions, andexperimental error in collection/measurement of pyrolyticchars, as they are usually distributed between several unitoperations in the collection train such as cyclones, electrostaticprecipitators, hot vapor filters, or suspended in oil/tars. To theauthors’ knowledge, there is not a significant quantity ofpublished data on the heating values of the produced liquid andgas-phase products over a wide range of processing severities.Because of the lack of comprehensive published data, theirenergy contents are not shown here. The predictions for gasand liquid-phase product energy densities, however, may beinferred from the elemental composition/distributions dis-cussed in Section 3.3 Model Summary.3.2.3. Product Phase Distribution. Experimental data trends
and model prediction for yield of total gas, total liquid, and oilproducts are shown in Figure 5. The data presented were notused in model calibration, and thus both literature andexperimental data provide validation. The yields within allsubplots are present as weight percent of the initial biomasssample. The gas species yield represents the combinedproduction of carbon dioxide and carbon monoxide. Theyield of gaseous species increases approximately linearly withvolatile mass loss, reaching 10% of the total product massaround 70% volatile mass loss and increasing to 22% at totaldevolatilization. Liquid product yield represents the totalproduction of condensable species or the combined productionof bio-oil and water. There is an approximate linear increase intotal liquid production to a product yield of 60% at 80% volatilemass loss, after which the production rate slows slightly, endingat approximately 66%. The production of oil begins slowlythrough the initial volatile loss* zone and begins to increasearound 20% volatile mass loss (6% oil yield). After this, there isan approximate linear increase in oil yield until 70% volatilemass loss (to 35% oil yield). The oil production with massremoval is slowed after 70% volatile loss* and ends at amaximum of approximately 45% yield. Note that there is muchgreater scatter in the oil yield data than in the liquid yield data,
presumably due to errors in determining the water content ofthe product liquids. The predictions of the model are validatedby the observations of other researchers, and the experimentaldata collected, as shown by the agreement in the figure.
3.3. Model Summary. A summary of the mass distributionmodeling results is shown in Figure 6. Subplots on the leftdetail distribution between solid, liquid, and gas, and subplotson the right show the predicted elemental distribution betweenthe three product phases. The behaviors of product massdistribution are described in detail in Section 3.2. Initially(<20% volatile loss*), the carbon distribution is favored towardthe enhanced carbon content of the solid structure, while thecarbon attributed to the gas follows closely the total massallocated to the gas phase. The carbon enriched solid productcomes at the expense of a carbon-lean liquid product. From theliquid-oil−water distribution, this is evident from the higherportion of mass attributed to water. Further, the oil formedduring this region is known to be oxygen-rich, containingprimarily organic acids, aldehydes, ketones, and somefurans.27,29,30,38 This region is also associated with thehemicellulose region of biomass and has the lowest carbon(highest oxygen) content on a relative basis.19 In the middlingregion (up to 70% volatile loss*) primarily cellulose degrades,and the elemental distribution closely follows the trendspresented in the product mass distribution. In this region, muchof the degraded mass is converted into pyrolysis oil that issimilar in composition to the major chemical species: primarilylevoglucosan, but also including organic acids, aldehydes, andother saccharide variants.46 In this region, comparatively moreCO2 is produced, shifting the oxygen distribution higher in
Figure 4. Higher heating value predictions and data for pyrolytic charsformed at varying process severity. Volatile Loss* is on a moisture, ash,and fixed carbon free basis. Literature data from refs 15, 24, 27, and34−36.
Figure 5. Model predictions and data for yield of total gas, total liquid,and oil products. Volatile Loss* is on a moisture, ash, and fixed carbonfree basis. Literature data from refs 14, 15, 24, 25, 27, 36, and 37.
Energy & Fuels Article
DOI: 10.1021/acs.energyfuels.5b01877Energy Fuels 2016, 30, 318−325
323
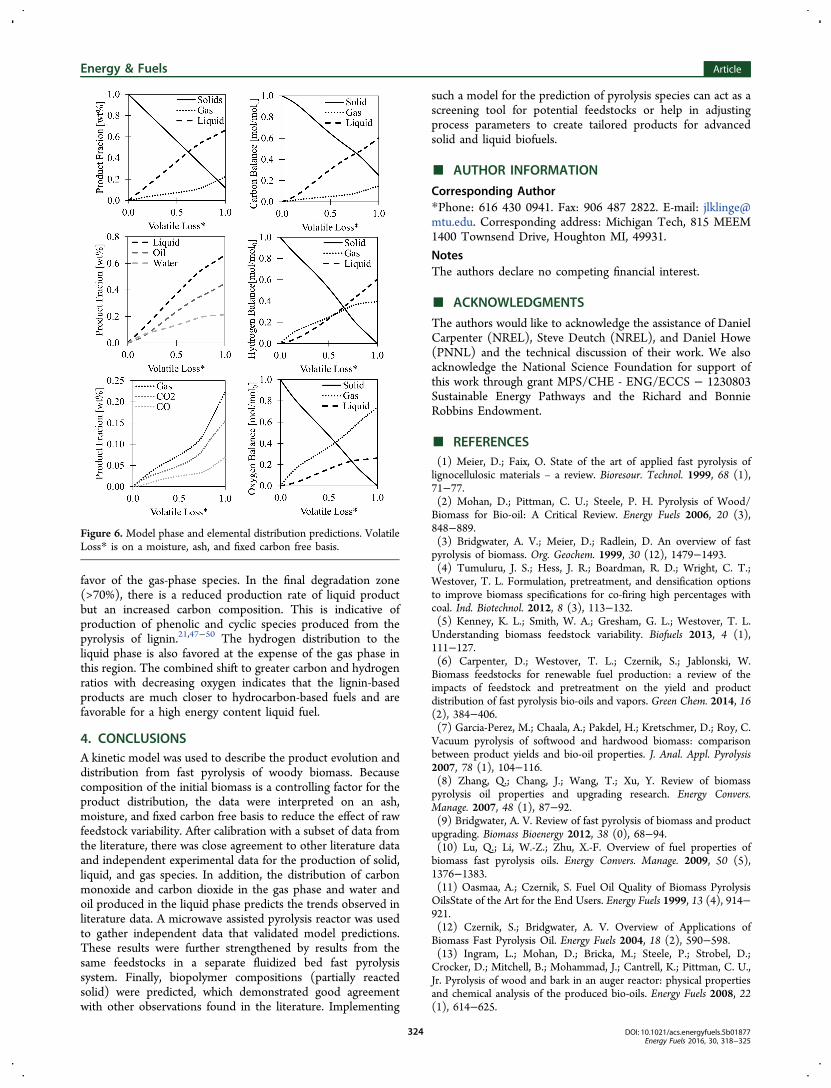
favor of the gas-phase species. In the final degradation zone(>70%), there is a reduced production rate of liquid productbut an increased carbon composition. This is indicative ofproduction of phenolic and cyclic species produced from thepyrolysis of lignin.21,47−50 The hydrogen distribution to theliquid phase is also favored at the expense of the gas phase inthis region. The combined shift to greater carbon and hydrogenratios with decreasing oxygen indicates that the lignin-basedproducts are much closer to hydrocarbon-based fuels and arefavorable for a high energy content liquid fuel.
4. CONCLUSIONSA kinetic model was used to describe the product evolution anddistribution from fast pyrolysis of woody biomass. Becausecomposition of the initial biomass is a controlling factor for theproduct distribution, the data were interpreted on an ash,moisture, and fixed carbon free basis to reduce the effect of rawfeedstock variability. After calibration with a subset of data fromthe literature, there was close agreement to other literature dataand independent experimental data for the production of solid,liquid, and gas species. In addition, the distribution of carbonmonoxide and carbon dioxide in the gas phase and water andoil produced in the liquid phase predicts the trends observed inliterature data. A microwave assisted pyrolysis reactor was usedto gather independent data that validated model predictions.These results were further strengthened by results from thesame feedstocks in a separate fluidized bed fast pyrolysissystem. Finally, biopolymer compositions (partially reactedsolid) were predicted, which demonstrated good agreementwith other observations found in the literature. Implementing
such a model for the prediction of pyrolysis species can act as ascreening tool for potential feedstocks or help in adjustingprocess parameters to create tailored products for advancedsolid and liquid biofuels.
■ AUTHOR INFORMATION
Corresponding Author*Phone: 616 430 0941. Fax: 906 487 2822. E-mail: [email protected]. Corresponding address: Michigan Tech, 815 MEEM1400 Townsend Drive, Houghton MI, 49931.
NotesThe authors declare no competing financial interest.
■ ACKNOWLEDGMENTS
The authors would like to acknowledge the assistance of DanielCarpenter (NREL), Steve Deutch (NREL), and Daniel Howe(PNNL) and the technical discussion of their work. We alsoacknowledge the National Science Foundation for support ofthis work through grant MPS/CHE - ENG/ECCS − 1230803Sustainable Energy Pathways and the Richard and BonnieRobbins Endowment.
■ REFERENCES(1) Meier, D.; Faix, O. State of the art of applied fast pyrolysis oflignocellulosic materials – a review. Bioresour. Technol. 1999, 68 (1),71−77.(2) Mohan, D.; Pittman, C. U.; Steele, P. H. Pyrolysis of Wood/Biomass for Bio-oil: A Critical Review. Energy Fuels 2006, 20 (3),848−889.(3) Bridgwater, A. V.; Meier, D.; Radlein, D. An overview of fastpyrolysis of biomass. Org. Geochem. 1999, 30 (12), 1479−1493.(4) Tumuluru, J. S.; Hess, J. R.; Boardman, R. D.; Wright, C. T.;Westover, T. L. Formulation, pretreatment, and densification optionsto improve biomass specifications for co-firing high percentages withcoal. Ind. Biotechnol. 2012, 8 (3), 113−132.(5) Kenney, K. L.; Smith, W. A.; Gresham, G. L.; Westover, T. L.Understanding biomass feedstock variability. Biofuels 2013, 4 (1),111−127.(6) Carpenter, D.; Westover, T. L.; Czernik, S.; Jablonski, W.Biomass feedstocks for renewable fuel production: a review of theimpacts of feedstock and pretreatment on the yield and productdistribution of fast pyrolysis bio-oils and vapors. Green Chem. 2014, 16(2), 384−406.(7) Garcia-Perez, M.; Chaala, A.; Pakdel, H.; Kretschmer, D.; Roy, C.Vacuum pyrolysis of softwood and hardwood biomass: comparisonbetween product yields and bio-oil properties. J. Anal. Appl. Pyrolysis2007, 78 (1), 104−116.(8) Zhang, Q.; Chang, J.; Wang, T.; Xu, Y. Review of biomasspyrolysis oil properties and upgrading research. Energy Convers.Manage. 2007, 48 (1), 87−92.(9) Bridgwater, A. V. Review of fast pyrolysis of biomass and productupgrading. Biomass Bioenergy 2012, 38 (0), 68−94.(10) Lu, Q.; Li, W.-Z.; Zhu, X.-F. Overview of fuel properties ofbiomass fast pyrolysis oils. Energy Convers. Manage. 2009, 50 (5),1376−1383.(11) Oasmaa, A.; Czernik, S. Fuel Oil Quality of Biomass PyrolysisOilsState of the Art for the End Users. Energy Fuels 1999, 13 (4), 914−921.(12) Czernik, S.; Bridgwater, A. V. Overview of Applications ofBiomass Fast Pyrolysis Oil. Energy Fuels 2004, 18 (2), 590−598.(13) Ingram, L.; Mohan, D.; Bricka, M.; Steele, P.; Strobel, D.;Crocker, D.; Mitchell, B.; Mohammad, J.; Cantrell, K.; Pittman, C. U.,Jr. Pyrolysis of wood and bark in an auger reactor: physical propertiesand chemical analysis of the produced bio-oils. Energy Fuels 2008, 22(1), 614−625.
Figure 6. Model phase and elemental distribution predictions. VolatileLoss* is on a moisture, ash, and fixed carbon free basis.
Energy & Fuels Article
DOI: 10.1021/acs.energyfuels.5b01877Energy Fuels 2016, 30, 318−325
324

(14) Garcia-Perez, M.; Wang, X. S.; Shen, J.; Rhodes, M. J.; Tian, F.;Lee, W.-J.; Wu, H.; Li, C.-Z. Fast Pyrolysis of Oil Mallee WoodyBiomass: Effect of Temperature on the Yield and Quality of PyrolysisProducts. Ind. Eng. Chem. Res. 2008, 47 (6), 1846−1854.(15) Nachenius, R.; van de Wardt, T.; Ronsse, F.; Prins, W.Torrefaction of pine in a bench-scale screw conveyor reactor. BiomassBioenergy 2015, 79, 96−104.(16) Agblevor, F. A.; Besler, S.; Wiselogel, A. E. Fast Pyrolysis ofStored Biomass Feedstocks. Energy Fuels 1995, 9 (4), 635−640.(17) Klinger, J.; Bar-Ziv, E.; Shonnard, D. Kinetic study of aspenduring torrefaction. J. Anal. Appl. Pyrolysis 2013, 104 (0), 146−152.(18) Klinger, J.; Bar-Ziv, E.; Shonnard, D. Unified kinetic model fortorrefaction−pyrolysis. Fuel Process. Technol. 2015, 138, 175−183.(19) Yang, H.; Yan, R.; Chen, H.; Lee, D. H.; Zheng, C.Characteristics of hemicellulose, cellulose and lignin pyrolysis. Fuel2007, 86 (12−13), 1781−1788.(20) Sarvaramini, A.; Assima, G. P.; Larachi, F. Dry torrefaction ofbiomass − Torrefied products and torrefaction kinetics using thedistributed activation energy model. Chem. Eng. J. 2013, 229 (0), 498−507.(21) Collard, F.-X.; Blin, J. A review on pyrolysis of biomassconstituents: Mechanisms and composition of the products obtainedfrom the conversion of cellulose, hemicelluloses and lignin. RenewableSustainable Energy Rev. 2014, 38 (0), 594−608.(22) Klinger, J.; Bar-Ziv, E.; Shonnard, D. Predicting Properties ofTorrefied Biomass by Intrinsic Kinetics. Energy Fuels 2015, 29 (1),171−176.(23) Klinger, J.; Klemetsrud, B.; Bar-Ziv, E.; Shonnard, D.Temperature dependence of aspen torrefaction kinetics. J. Anal.Appl. Pyrolysis 2014, 110 (0), 424−429.(24) Howe, D.; Westover, T.; Carpenter, D.; Santosa, D.; Emerson,R.; Deutch, S.; Starace, A.; Kutnyakov, I.; Lukins, C. Field-to-FuelPerformance Testing of Lignocellulosic Feedstocks: An IntegratedStudy of the Fast Pyrolysis−Hydrotreating Pathway. Energy Fuels2015, 29 (5), 3188−3197.(25) Westover, T. L.; Phanphanich, M.; Clark, M. L.; Rowe, S. R.;Egan, S. E.; Zacher, A. H.; Santosa, D. Impact of thermal pretreatmenton the fast pyrolysis conversion of southern pine. Biofuels 2013, 4 (1),45−61.(26) Nachenius, R. W.; van de Wardt, T.; Ronsse, F.; Prins, W.Residence time distributions of coarse biomass particles in a screwconveyor reactor. Fuel Process. Technol. 2015, 130, 87−95.(27) Wannapeera, J.; Fungtammasan, B.; Worasuwannarak, N. Effectsof temperature and holding time during torrefaction on the pyrolysisbehaviors of woody biomass. J. Anal. Appl. Pyrolysis 2011, 92 (1), 99−105.(28) Ren, S.; Lei, H.; Wang, L.; Bu, Q.; Chen, S.; Wu, J. Thermalbehaviour and kinetic study for woody biomass torrefaction andtorrefied biomass pyrolysis by TGA. Biosystems Engineering 2013, 116(4), 420−426.(29) Branca, C.; Di Blasi, C.; Galgano, A.; Brostrom, M. Effects of theTorrefaction Conditions on the Fixed-Bed Pyrolysis of NorwaySpruce. Energy Fuels 2014, 28 (9), 5882−5891.(30) Westerhof, R. J.; Brilman, D. W. F.; Garcia-Perez, M.; Wang, Z.;Oudenhoven, S. R.; Kersten, S. R. Stepwise fast pyrolysis of pine wood.Energy Fuels 2012, 26 (12), 7263−7273.(31) Prins, M. J.; Ptasinski, K. J.; Janssen, F. J. J. G. Torrefaction ofwood: Part 2. Analysis of products. J. Anal. Appl. Pyrolysis 2006, 77 (1),35−40.(32) Nocquet, T.; Dupont, C.; Commandre, J.-M.; Grateau, M.;Thiery, S.; Salvador, S. Volatile species release during torrefaction ofwood and its macromolecular constituents: Part 1 − Experimentalstudy. Energy 2014, 72 (0), 180−187.(33) Zheng, A.; Zhao, Z.; Chang, S.; Huang, Z.; He, F.; Li, H. Effectof Torrefaction Temperature on Product Distribution from Two-Staged Pyrolysis of Biomass. Energy Fuels 2012, 26 (5), 2968−2974.(34) Brostrom, M.; Nordin, A.; Pommer, L.; Branca, C.; Di Blasi, C.Influence of torrefaction on the devolatilization and oxidation kineticsof wood. J. Anal. Appl. Pyrolysis 2012, 96 (0), 100−109.
(35) Arias, B.; Pevida, C.; Fermoso, J.; Plaza, M. G.; Rubiera, F.; Pis,J. J. Influence of torrefaction on the grindability and reactivity ofwoody biomass. Fuel Process. Technol. 2008, 89 (2), 169−175.(36) Salehi, E.; Abedi, J.; Harding, T. Bio-oil from Sawdust: Effect ofOperating Parameters on the Yield and Quality of Pyrolysis Products.Energy Fuels 2011, 25 (9), 4145−4154.(37) Sınag , A.; Uskan, B.; Gulbay, S. Detailed characterization of thepyrolytic liquids obtained by pyrolysis of sawdust. J. Anal. Appl.Pyrolysis 2011, 90 (1), 48−52.(38) Nocquet, T.; Dupont, C.; Commandre, J.-M.; Grateau, M.;Thiery, S.; Salvador, S. Volatile species release during torrefaction ofbiomass and its macromolecular constituents: Part 2 − Modelingstudy. Energy 2014, 72 (0), 188−194.(39) Zhang, J.; Toghiani, H.; Mohan, D.; Pittman, C. U.; Toghiani, R.K. Product analysis and thermodynamic simulations from the pyrolysisof several biomass feedstocks. Energy Fuels 2007, 21 (4), 2373−2385.(40) Wei, L.; Xu, S.; Zhang, L.; Zhang, H.; Liu, C.; Zhu, H.; Liu, S.Characteristics of fast pyrolysis of biomass in a free fall reactor. FuelProcess. Technol. 2006, 87 (10), 863−871.(41) Trendewicz, A.; Evans, R.; Dutta, A.; Sykes, R.; Carpenter, D.;Braun, R. Evaluating the effect of potassium on cellulose pyrolysisreaction kinetics. Biomass Bioenergy 2015, 74 (0), 15−25.(42) Shen, D. K.; Gu, S. The mechanism for thermal decompositionof cellulose and its main products. Bioresour. Technol. 2009, 100 (24),6496−6504.(43) Friedl, A.; Padouvas, E.; Rotter, H.; Varmuza, K. Prediction ofheating values of biomass fuel from elemental composition. Anal.Chim. Acta 2005, 544 (1−2), 191−198.(44) Khelfa, A.; Bensakhria, A.; Weber, J. V. Investigations into thepyrolytic behaviour of birch wood and its main components: Primarydegradation mechanisms, additivity and metallic salt effects. J. Anal.Appl. Pyrolysis 2013, 101 (0), 111−121.(45) Stefanidis, S. D.; Kalogiannis, K. G.; Iliopoulou, E. F.; Michailof,C. M.; Pilavachi, P. A.; Lappas, A. A. A study of lignocellulosic biomasspyrolysis via the pyrolysis of cellulose, hemicellulose and lignin. J. Anal.Appl. Pyrolysis 2014, 105 (0), 143−150.(46) Patwardhan, P. R.; Satrio, J. A.; Brown, R. C.; Shanks, B. H.Product distribution from fast pyrolysis of glucose-based carbohy-drates. J. Anal. Appl. Pyrolysis 2009, 86 (2), 323−330.(47) Bai, X.; Kim, K. H.; Brown, R. C.; Dalluge, E.; Hutchinson, C.;Lee, Y. J.; Dalluge, D. Formation of phenolic oligomers during fastpyrolysis of lignin. Fuel 2014, 128 (0), 170−179.(48) Jackson, M. A.; Compton, D. L.; Boateng, A. A. Screeningheterogeneous catalysts for the pyrolysis of lignin. J. Anal. Appl.Pyrolysis 2009, 85 (1−2), 226−230.(49) Patwardhan, P. R.; Brown, R. C.; Shanks, B. H. Understandingthe Fast Pyrolysis of Lignin. ChemSusChem 2011, 4 (11), 1629−1636.(50) Zhang, M.; Resende, F. L. P.; Moutsoglou, A. Catalytic fastpyrolysis of aspen lignin via Py-GC/MS. Fuel 2014, 116 (0), 358−369.
Energy & Fuels Article
DOI: 10.1021/acs.energyfuels.5b01877Energy Fuels 2016, 30, 318−325
325
Related Documents


