Predicting Post-Release Defects in OO Software using Product Metrics Gabriel de Souza Pereira Moreira 1 , Roberto Pepato Mellado 1 , Robson Luis Monteiro Junior 1 , Adilson Marques da Cunha 2 , and Luiz Alberto Vieira Dias 2 1 IMAGEM - Geographic Information Solutions, Software Engineering Department Sao Jose dos Campos, SP, Brazil {gspmoreira,rpepato,kimmaydesign}@gmail.com 2 ITA – Aeronautics Institute of Technology, Computer Science Division, Sao Jose dos Campos, SP, Brazil {cunha,vdias}@ita.br Abstract — Software maintenance has consumed more than 50% of develop- ment effort and about 90% of software lifecycle. Finding and correcting defects after software delivery have often presented high costs when compared to cor- rect it on previous project phases. Within this context, defect prediction has at- tracted growing interest from industry and academy. In this study, a survey is conducted, considering two object-oriented systems developed by industry and currently under maintenance. It was proposed and implemented a method for collection and integration of software product metrics for defect prediction. Code and design metrics, at class level, were extracted using static code analy- sis. The code modules where defects were detected were obtained from correc- tive maintenance history data. The prediction models presented are based on Multivariate Linear Regression and have used internal quality metrics as pre- dictors and detected defects as predicted variables. This approach can be used to help prioritizing quality activities like testing, inspecting, and refactoring on defect-prone classes. Keywords. Software corrective maintenance, defect prediction, defect prone- ness, defect volume, object-oriented, software metrics, multivariate regression analysis, iterative process. 1 Introduction As software lifetime increases, code and design qualities become important factors for development and maintenance of cost reduction. Kemerer and Slaughter attested that software maintenance is an understudied phe- nomenon within the research community [1]. They estimate that software mainte- nance activities can constitute 50% of all efforts undertaken in software development. Bennett reported in [2] that 40% to 90% of the software product lifetime total cost is spent in maintenance. Jones [3] stated that during the early years of the XXI centu-

Welcome message from author
This document is posted to help you gain knowledge. Please leave a comment to let me know what you think about it! Share it to your friends and learn new things together.
Transcript

Predicting Post-Release Defects in OO Software using
Product Metrics
Gabriel de Souza Pereira Moreira1, Roberto Pepato Mellado
1, Robson Luis Monteiro
Junior1, Adilson Marques da Cunha
2, and Luiz Alberto Vieira Dias
2
1IMAGEM - Geographic Information Solutions, Software Engineering Department
Sao Jose dos Campos, SP, Brazil
{gspmoreira,rpepato,kimmaydesign}@gmail.com 2ITA – Aeronautics Institute of Technology, Computer Science Division,
Sao Jose dos Campos, SP, Brazil
{cunha,vdias}@ita.br
Abstract — Software maintenance has consumed more than 50% of develop-
ment effort and about 90% of software lifecycle. Finding and correcting defects
after software delivery have often presented high costs when compared to cor-
rect it on previous project phases. Within this context, defect prediction has at-
tracted growing interest from industry and academy. In this study, a survey is
conducted, considering two object-oriented systems developed by industry and
currently under maintenance. It was proposed and implemented a method for
collection and integration of software product metrics for defect prediction.
Code and design metrics, at class level, were extracted using static code analy-
sis. The code modules where defects were detected were obtained from correc-
tive maintenance history data. The prediction models presented are based on
Multivariate Linear Regression and have used internal quality metrics as pre-
dictors and detected defects as predicted variables. This approach can be used
to help prioritizing quality activities like testing, inspecting, and refactoring on
defect-prone classes.
Keywords. Software corrective maintenance, defect prediction, defect prone-
ness, defect volume, object-oriented, software metrics, multivariate regression
analysis, iterative process.
1 Introduction
As software lifetime increases, code and design qualities become important factors for
development and maintenance of cost reduction.
Kemerer and Slaughter attested that software maintenance is an understudied phe-
nomenon within the research community [1]. They estimate that software mainte-
nance activities can constitute 50% of all efforts undertaken in software development.
Bennett reported in [2] that 40% to 90% of the software product lifetime total cost
is spent in maintenance. Jones [3] stated that during the early years of the XXI centu-
ry, more than 50% of developers were involved in modifying existing applications in
detriment of implementing new ones.
Boehm [4] has depicted that assessing maintenance factors and developing mainte-
nance activities still represent important challenges for the software community.
Boehm and Basili [5] have asserted that locating and fixing software bugs after its
deployment can generally cost one hundred times more than within the design and
analysis phase. Thus, early defects detection can lead to corrective actions before the
delivery of defective software.
This paper presents a defect prediction survey, considering two Object-Oriented
(OO) software projects developed in an industry software factory. It proposes and
implements a method for collecting and integrating software metrics needed for defect
prediction.
Prediction models are based on the Multivariate Linear Regression (MLR) statisti-
cal technique and are calibrated based on the internal quality and defects history met-
rics. Statistical analysis like descriptive statistics and correlations are also conducted
for better understanding of measures and their relationship. The prediction approach
of these defects aims to provide quantitative information for developers, testers, and
managers in decision-maker positions, in order to help to identify defect-prone classes
and prioritize quality activities like testing, inspecting, and refactoring.
2 Literature Research
Empirical studies have confirmed the hypothesis that certain characteristics of source
code influence software maintenance costs, efforts, and effectiveness [9]. Among
these influences, there are aspects related to code size, complexity, coupling, pro-
gramming language, and programming style [3].
The use of complexity measures within the OO paradigm has been the focus of re-
search over time. Some of the previous papers proposing metrics for OO software are:
Briand et al., 1997 [11]; Chidamber and Kemerer, 1994 [12]; Henderson-Sellers, 1996
[13]; Li and Henry, 1993 [14]; and Lorenz and Kidd, 1994 [15].
Lehman [16] and Kafura et al. [17] have studied the relationship among the most
extreme measures (outliers) with elevated rates of defects.
Many studies of software defects prediction have been conducted in the last dec-
ade. In general, predictive techniques can be grouped in: statistics-based, like Linear
Regression [6] and Binary Logistic Regression [7] [8]; and machine learning-based,
like Bayesian Networks [27] and Decision Trees [19].
In related studies, prediction models have been generally calibrated on product
measures obtained from open-source projects [28] [7] or from projects developed
using traditional (non-iterative) processes [27], where maintenance phase has a well-
defined start.
In some studies, considering software projects developed with an iterative process,
defect prediction for future iterations are conducted based on detected defects history
from other projects [21] or on implemented changes in source code from past itera-
tions [6].

3 Description of this Investigation
1) Purpose
This investigation aims to analyze the software metrics potential for post-release de-
fects prediction and to identify defect-prone classes. Within this context, post-release
defects are detected after the software deployment, leading to a late corrective
maintenance. Defect-prone classes are the ones that present large volume (number) of
predicted defects [9].
Defect prediction can help to answer technical and managerial questions like: “On
which modules or classes should we invest more inspection and test efforts?” or
“What is the risk in maintaining this codebase?”
2) Systems Investigated
Within this investigation, two software products developed in a software factory were
analyzed. Both OO systems developed in web platform, implemented by using the C#
language and .NET Framework version 2.0. These projects were based on Geographic
Information System (GIS) solutions, with similar business requirement and technolo-
gy alike. The development of these projects was mainly performed by different pro-
grammers except by three professionals, which have participated in both projects.
These projects were developed using an iterative development process established
by a software factory, based on Rational Unified Process (RUP). This process has
included: requirement and defects registration in an issue tracker system; the usage of
Version Control Systems (VCS); and the traceability among use cases, defects, and
corrective maintenance changes within source codes of classes. This environment
allowed the recovery of detailed information from the history systems development,
as well as the identification of classes from where defects were located.
Table 1 presents information from projects A and B, and also from their developed
software products. It shows a great number of use cases, lines of code, and developers
turnover in Project A, and less defect count and defect density in Project B. Project B
also contains more types, which can potentially indicate more modularized code.
Table 1. Data from the surveyed software projects
Projects A B
Projects Data
Development Start 08/2008 08/2009
Number of Use Cases 103 93
Revision Count (a) 2,997 1,358
Distinct Developers 20 8
Defects detected by testers and end users 1,387 313
Defect density per KLOC (thousands of lines of code) 14,2 4,42
Software Products Data
Platform Web Web

Programming Language C# 2.0 C# 2.0
Total LOC 97,488 70,735
LOC without comments and blank lines 51,017 33,644
Types (classes, interfaces, structs) 289 387
Assemblies (b) 23 10
(a) Revision – Identifier of a change set in the source code, sent from the developers local copy to a Version Control Sytem
repository, through a commit or check-in operation.
(b) Assembly – Software binary component in .NET platform; generally an executable file or Dynamic Linked Library (DLL).
4 Data Collection and Integration
In this section, it is presented a method for collecting and integrating software metrics
for defect prediction. It also describes the metrics used as independent and dependent
variables in the prediction models.
1) The Method of Software Measurement for Defect Prediction (MEM-DEF)
During this investigation, a Method of Software Measurement for Defect Prediction
called MEM-DEF was conceptualized and implemented, inspired on METACOM
[25]. This method consists of a set of automatable steps to Extract, Transform, and
Load (ETL) software internal quality metrics and defect history metrics. Internal met-
rics are extracted from code revisions, stored in a Version Control System (VCS).
Defect history metrics are obtained from corrective maintenance history, registered on
an Issue Tracker System (ITS). Defects location in code (classes) can be obtained due
to an integration between VCS and ITS.
The MEM-DEF can be applied to extract information from development history of
past or current projects. Its requirements are: the usage of a VCS repository with
source code change history; an issue tracker, with the registry of use cases and defects
detected during the project; and a traceability mechanism that allows tracking code
changes related to corrective maintenance. The proposed MEM-DEF is not restricted
to object-oriented developed systems. It only requires a programming language for
which exist static code analysis tools, to enable metrics extraction.
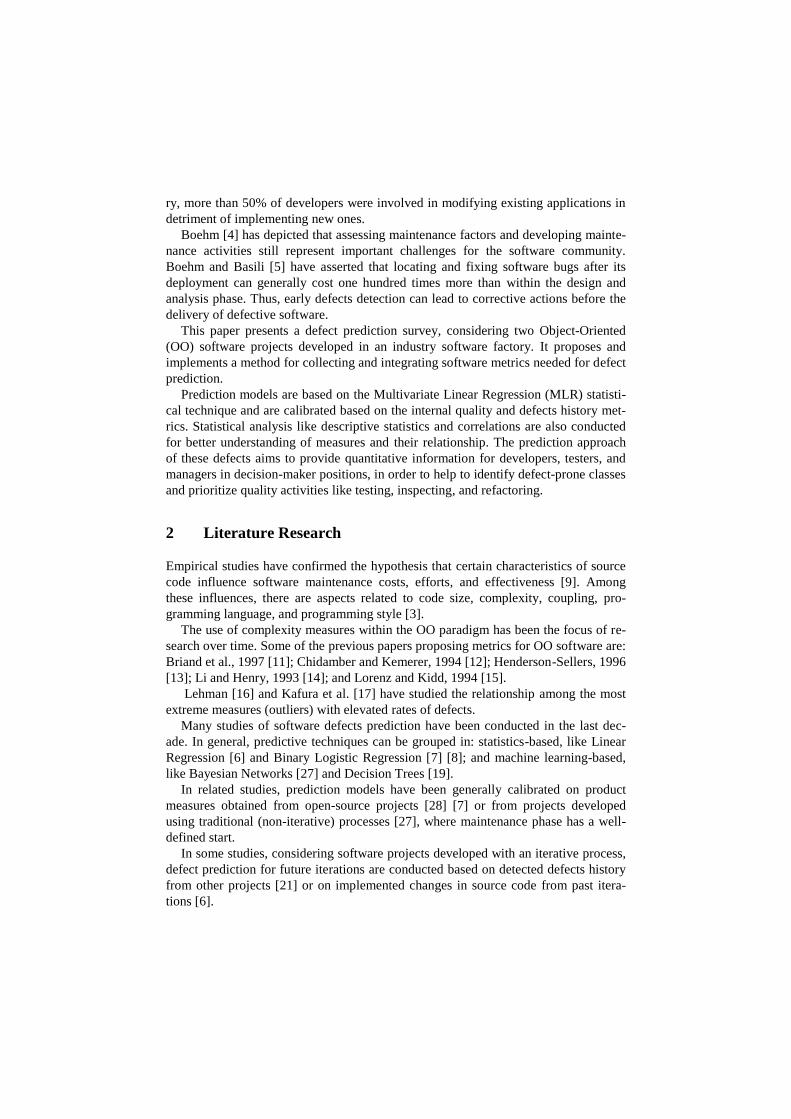
In this paper, the MEM-DEF was implemented, by the integration of some open-
source and commercial tools, and also by the development of two new tools and some
automation scripts. Figure 1 presents a diagram with the MEM-DEF implementation
for this investigation, including the tools used for the ETL automation.
The main steps for the MEM-DEF execution are:
Step 1 – Revision Checkout – Within this step, it is performed a local copy of
each source code revision stored on the VCS repository. For this step implementa-
tion, it was developed a tool named SVNExtractor, responsible for locally copying
all software product revisions from the VCS Subversion (SVN);
Step 2 – Compiling – Within this step, the source code is compiled and its corre-
spondent binaries are generated for all revisions. This step is necessary only on
statically typed languages like C#, Java, and C++. For this step implementation, it
were used the MSBuild and NAnt tools;
Step 3 – Static Analysis – Within this step, the source code and its generated bina-
ries are analyzed throughout static analysis tools, in order to extract metrics. In this
study, measures related to code and design aspects like size, coupling, cohesion,
complexity, and inheritance were extracted by using NDepend [30] and SDMetrics
[31] tools;
Step 4 – Defects’ retrieval and corrective maintenance changes traceability –
Within this step, software defects detected in classes after the software release are
counted. In this investigation, information was extracted from Mantis issue tracker,
which included: defects history, and traceability between defects and classes
changes in corrective maintenance. This traceability was made possible due to an
implemented integration between VCS SVN and Mantis issue tracker; and
Step 5 – Measurement Integration and Consolidation – Within this step, measures
are integrated and consolidated into a table designed for defect prediction. In this
investigation, this step was implemented with the development of the DataExtractor
tool.
Fig. 1. The Method of Software Measurement for Defect Prediction (MEM-DEF)
2) Dependent Variables
This investigation is focused in defect prediction models based on OO software met-
rics. The dependent variables are cumulative counts of defects detected in a class,
during a period after its deployment.
In this analysis, it is considered that a class is deployed when the functionality that
the class is designed or changed for is delivered at the end of an iteration (a develop-
ment time box) and deployed in the end-user environment. After this moment, any
change in this class is considered a maintenance change. In this study, the last revi-
sion of the class before its first deployment is named “delivery revision”.
In order to analyze prediction models accuracy for different observation periods af-
ter software deployment, the following periods of three, six, and twelve months after
deployment were defined. For each observation period, defect counts were accumu-
lated for each class in the following dependent variables:
DEF1quarter – Defects detected in a class, during the first quarter of the year,
starting from its deployment in an end user environment;
DEF1semester – Defects detected in a class, during the first semester, starting
from its deployment in the end user environment; and
DEF1year – Defects detected in a class, during the first year, starting from its
deployment in the end user environment.
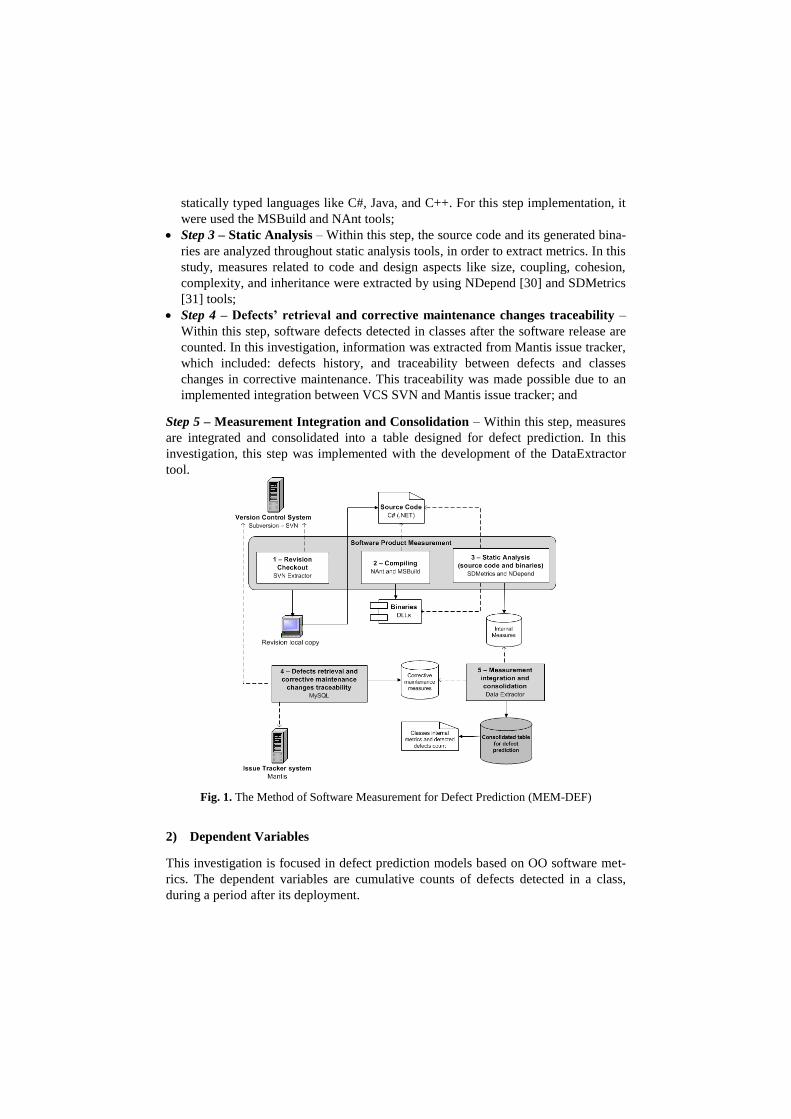
3) Independent Variables
This investigation considered 31 internal quality metrics related to size, complexity,
cohesion, coupling, and other aspects. These metrics can be extracted from many OO
languages by means of existing static code analysis tools. Traditional metrics like
Halstead [32] and Cyclomatic Complexity [33]; object-oriented metrics like CK suite
[12]; and coupling metrics (AC, EC, ABC) [34] were also considered. The software
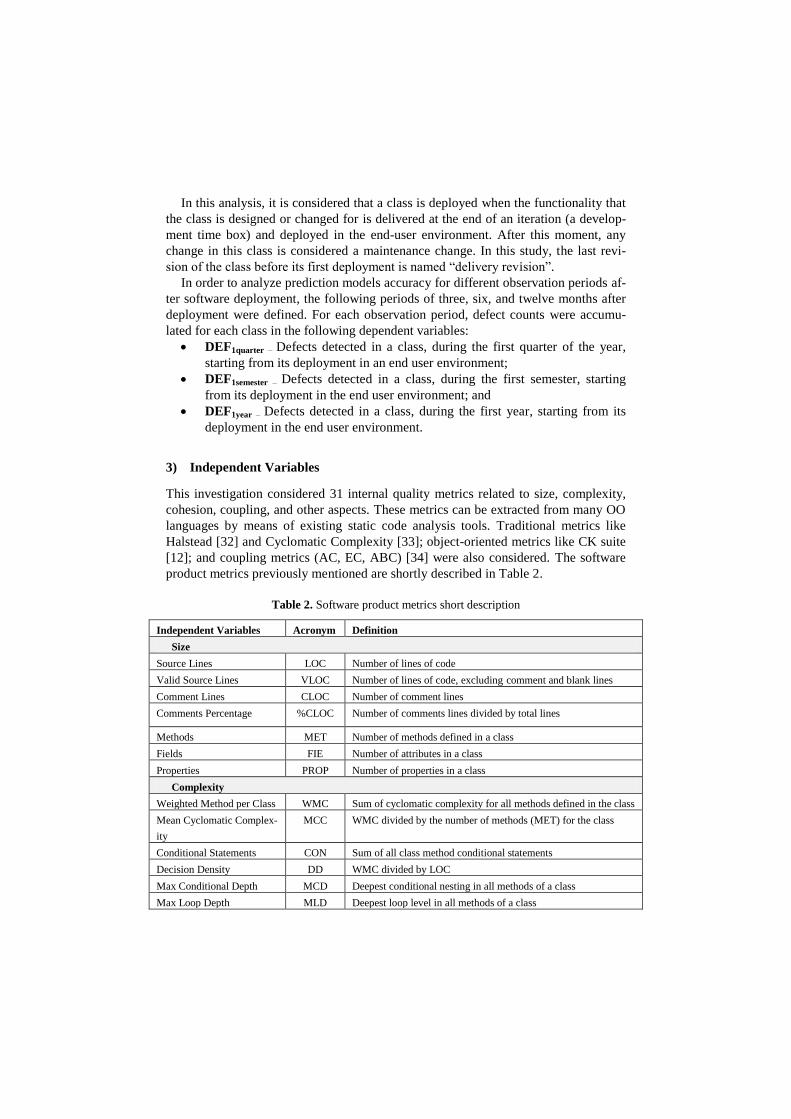
product metrics previously mentioned are shortly described in Table 2.
Table 2. Software product metrics short description
Independent Variables Acronym Definition
Size
Source Lines LOC Number of lines of code
Valid Source Lines VLOC Number of lines of code, excluding comment and blank lines
Comment Lines CLOC Number of comment lines
Comments Percentage %CLOC Number of comments lines divided by total lines
Methods MET Number of methods defined in a class
Fields FIE Number of attributes in a class
Properties PROP Number of properties in a class
Complexity
Weighted Method per Class WMC Sum of cyclomatic complexity for all methods defined in the class
Mean Cyclomatic Complex-
ity
MCC WMC divided by the number of methods (MET) for the class
Conditional Statements CON Sum of all class method conditional statements
Decision Density DD WMC divided by LOC
Max Conditional Depth MCD Deepest conditional nesting in all methods of a class
Max Loop Depth MLD Deepest loop level in all methods of a class
Halstead Metrics (Size and Complexity)
Distinct Operators HDOpt Distinct operators in class (n1). Operator is any token that speci-
fies an action in a program
Distinct Operands HDOpd Distinct operands in class (n2). Operand is any token that is not an
operator in a program.
Operator Occurrence HOptO Total operator occurrences in class (N1)
Operand Occurrence HOpdO Total operand occurrences in class (N2)
Program Length HLen N = N1 + N2
Program Vocabulary HVoc n = n1 + n2
Program Volume HVol V = N * (LOG2 n)
Program Difficulty HDif D = (n1/2) * (N2/n2)
Program Effort HEff E = D * V
Bug Prediction HBug B = (N1 + N2) log2 (n1 + n2) / 3000
Coupling
Afferent coupling AC Number of types that depends directly on the class under analysis
Efferent coupling EC Number of types the class under analysis directly depends upon
Association Between Class ABC Number of members of others types that the class under analysis
directly uses in the body of its methods
Inheritance
Number of Children NOC Number of sub-classes (whatever their positions in the sub branch
of the inheritance tree)
Depth of Inheritance Tree DIT Number of base classes
Cohesion
Lack Of Cohesion Of
Methods
LCOM Measures whether methods access disjoint sets of instance varia-
bles.
Lack of Cohesion Of
Methods-Henderson-Sellers
LCOM-
HS
Percentage of methods that do not access a specific attribute
averaged over all attributes in the class
Maintainability
Maintainability Index MI Regression model for predicting maintainability of software,
calibrated by specialists’ subjective analysis, proposed by Oman
et al. in [20].
4) Measurement Consolidation
Metrics were collected from all classes implemented in Projects A and B, in all revi-
sions, considering the MEM-DEF implementation. In the analysis conducted in this
investigation, for each class identified it was considered only the internal metrics
collected from the delivery revision - the last version of the class before its deploy-
ment.
Figure 2 presents the structure of the consolidated table produced by the MEM-
DEF, where lines represent classes developed in projects A and B; columns represent
software internal metrics at the delivery revision (independent variables) and defect
counts per period after deployment (dependent variables). The consolidated table had
274 classes, 183 from Project A, and 91 from Project B.

Fig. 2. Table structure consolidated by the MEM-DEF for defect prediction models
5 Analysis
After data collection and integration, a statistical analysis was conducted in order to
assess the potential of product metrics to predict defect volume and identify defect-
prone classes.
In this section, it is summarized some of the statistical analysis performed on data
obtained by the MEM-DEF implementation. The main statistical techniques used
were Descriptive Analysis, Correlation Analysis, and Multivariate Linear Regression.
It was used the SPSS 17.0 software package for conducting an exploratory analysis.
1) Descriptive Statistics
Descriptive statistics can aid to identify corrupted data points, inconsistencies, incom-
pleteness, and unusual distributions. This technique was used to verify each of the
independent and dependent variables, as shown in Table 3.
An analysis of quartiles, minimum, and maximum allowed assessing the correct-
ness of the collected metrics, which were within the expected ranges for the system’s
classes.
Skewness and Kurtosis, which stands for whether the data distribution is skewed,
peaked or flat in relation to a normal distribution, are useful for numerically infer
whether a variable follows normal distribution. Values close to 0 for Skewness and
Kurtosis indicate approximated normal distribution.
From quartiles and Skewness and Kurtosis measures, it could be observed that
most independent and dependent variables do not follow normal distribution.
Most classes did not present any defect, but some of them had 13 detected defects
in the first year after their deployment.
In these systems, a set of 20% of classes contained about 74% of detected defects
in one year. This finding indicates a distribution following the Pareto’s law that,
aligned with other defect prediction studies [22], asserts that 20% of the population
can be responsible for 80% of the outcome.

Table 3. Descriptive Statics of independent and dependent variables
Metric
Minimum Quartiles Maximum Mean Std. Devi-
ation
Skewness Kurtosis
25 50 75
Independent Variables
LOC 23,000 93,750 195,000 389,000 3400,000 322,993 398,464 3,448 17,529
VLOC 8,000 34,000 75,000 183,500 2643,000 151,832 229,665 5,815 52,901
CLOC 0,000 24,500 72,000 127,750 897,000 105,712 126,551 2,662 9,258
%CLOC 0,000 2,267 2,920 5,557 42,750 4,880 5,085 3,490 16,718
MET 0,000 4,000 7,000 12,000 91,000 9,909 10,043 3,454 18,710
FIE 0,000 1,000 3,000 5,000 46,000 4,496 5,635 3,150 14,400
PROP 0,000 0,000 1,000 3,000 49,000 2,566 5,032 5,004 35,890
WMC 0,000 5,000 14,000 27,750 473,000 26,383 43,564 5,948 49,878
MCC 0,000 1,000 1,800 2,785 23,650 2,460 2,422 4,433 28,390
CON 0,000 0,000 6,000 20,000 542,000 18,186 42,892 8,123 87,741
DD 0,000 0,140 0,170 0,200 0,400 0,174 0,060 0,704 1,525
MCD 0,000 0,000 1,000 3,000 19,000 2,102 2,524 2,321 8,844
MLD 0,000 0,000 0,000 1,000 3,000 0,522 0,766 1,499 1,813
HUOpt 2,000 10,000 18,000 27,000 46,000 19,453 9,173 0,457 -0,686
HUOpd 3,000 27,000 64,500 174,250 701,000 115,573 120,451 1,776 3,515
HOpt 17,000 76,750 214,000 622,000 9912,000 522,555 907,496 5,485 45,527
HOpd 17,000 74,500 196,000 573,500 8778,000 473,204 803,629 5,416 44,854
HLen 34,000 153,500 412,500 1222,250 18690,000 995,759 1710,11 5,457 45,292
HVoc 5,000 38,000 84,000 203,500 747,000 135,026 127,789 1,669 3,035
HVol 144,430 799,010 2655,0 8959,658 170578,1 7967,0 15465,6 5,753 48,744
HDif 4,920 13,848 26,780 44,743 240,150 34,338 28,423 2,466 11,156
HEff 1104 11786 68734 439641 40964820 654036 2792476 11,784 162,497
HBug 0,050 0,265 0,885 2,985 56,860 2,656 5,155 5,753 48,742
AC 0,000 0,000 1,000 3,000 36,000 2,818 5,444 3,431 13,298
EC 0,000 1,000 4,000 8,000 28,000 4,934 5,098 1,516 3,093
ABC 0,000 1,000 6,000 19,000 100,000 13,190 17,862 2,014 4,632
NOC 0,000 0,000 0,000 0,000 31,000 0,270 2,620 10,246 107,520
DIT 0,000 0,000 0,000 1,000 3,000 0,511 0,675 1,326 1,870
LCOM 0,000 0,168 0,600 0,793 1,000 0,516 0,338 -0,489 -1,263
LCOM_HS 0,000 0,198 0,670 0,880 1,330 0,573 0,365 -0,599 -1,166
MI 75,600 131,970 145,270 155,350 172,530 143,099 17,569 -0,861 1,343
Dependent Variables
DEF1quarter 0,000 0,000 0,000 1,000 7,000 0,467 0,894 2,810 11,914
DEF1semester 0,000 0,000 0,000 1,000 12,000 0,876 1,631 3,266 14,449
DEF1year 0,000 0,000 0,000 2,000 13,000 1,270 2,207 2,750 9,091
2) Correlation Analysis
A correlation analysis was performed among the independent and dependent variables
in this investigation, by using Spearman’s rho coefficient, which can be used in not

normally distributed measures [10], like most data in this study. Every correlation
coefficient had significant (p-value) at the 0.01 level (2-tailed). The correlations table
was omitted in this paper for the sake of space.
Correlation analysis was used to understand the linear relationship among inde-
pendent (software internal metrics) and dependent (defect counts) variables.
Within this investigation, correlations were assessed using Hopkins [28] and Co-
hen [23] classifications: less than 0.1 trivial, 0.1–0.3 minor, 0.3–0.5 moderate, 0.5–0.7
large, 0.7–0.9 very large, and 0.9–1 almost perfect.
It was found that size (LOC, VLOC, CLOC), complexity (WMC, CON, MCD), and
coupling (EC, ABC) metrics have presented large correlations (0.5–0.7) with defect
counts. Besides, some critics addressed the Halstead metrics use, especially in the OO
paradigm; these metrics presented large correlation with defects. Cohesion (LCOM,
LCOM-HS) and inheritance (NOC, DIT) measures presented minor correlations.
Differently from previous studies [29], it was found weak correlation between
Maintainability Index (MI) and defects. The MI has presented even lower correlation
than individual metrics (LOC, MCC, and HVol) used in its formula.
3) Multivariate Linear Regression
Multivariate Linear Regression (MLR) is the most common technique used for mod-
eling the relationship between two or more independent variables and a dependent
variable by fitting a linear equation to observed data. The main advantages of this
technique are its simplicity and support in many popular statistical packages [27].
Reducing the number of variables considered in regression models allows a better
understanding of metrics influence on dependent variables. In this investigation, it
was used the Stepwise method, which iteratively select variables more correlated with
dependent variable, keeping only statistically significant variables in the model.
The resulting models were assessed with R2
coefficient, a statistical measure of the
proportion of variability of a dependent variable that can be predicted by a model. An
R2 value of 1.0 (100%) means a perfect fit.
The Adjusted R2 coefficient can be used to explain some R
2 deviation, because it
penalizes models that uses many variables, in relation to the population size. For large
datasets, its value tends to be near to R2 coefficient.
MLR was performed for prediction of three dependent variables: DEF1quarter,
DEF1semester, and DEF1year.
The summary of calibrated models is presented in Table 4. It can be observed that
metrics considered in the model DEF1semester, for example, can predict about 58% (R2)
of the variability of classes’ defects counts, observed during the first semester after
their deployment.
DEF1quarter model has presented inferior R2 coefficient in relation to the other models.
One possible reason is that, as system usage period increased, new defects were de-
tected, some of them in functionalities not much exercised by users initially. Thus,
defects tended to distribute more over time, allowing best fitting of the models.
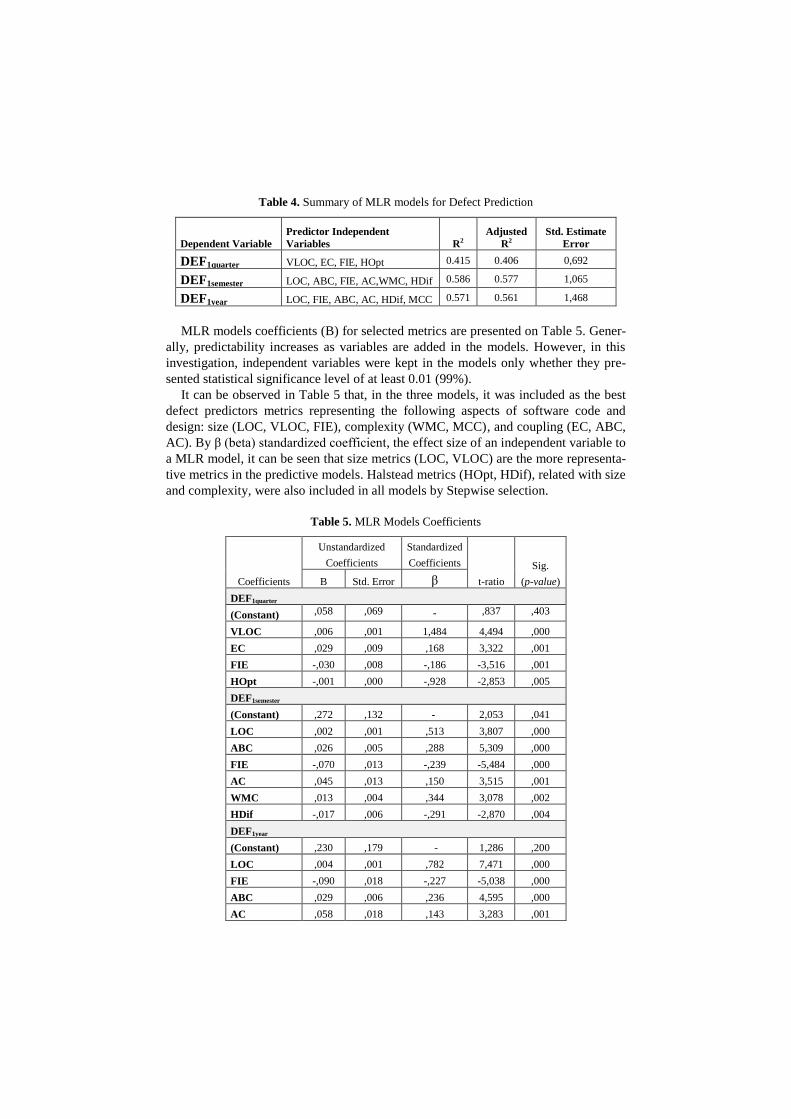
Table 4. Summary of MLR models for Defect Prediction
Dependent Variable
Predictor Independent
Variables R2
Adjusted
R2
Std. Estimate
Error
DEF1quarter VLOC, EC, FIE, HOpt 0.415 0.406 0,692
DEF1semester LOC, ABC, FIE, AC,WMC, HDif 0.586 0.577 1,065
DEF1year LOC, FIE, ABC, AC, HDif, MCC 0.571 0.561 1,468
MLR models coefficients (B) for selected metrics are presented on Table 5. Gener-
ally, predictability increases as variables are added in the models. However, in this
investigation, independent variables were kept in the models only whether they pre-
sented statistical significance level of at least 0.01 (99%).
It can be observed in Table 5 that, in the three models, it was included as the best
defect predictors metrics representing the following aspects of software code and
design: size (LOC, VLOC, FIE), complexity (WMC, MCC), and coupling (EC, ABC,
AC). By β (beta) standardized coefficient, the effect size of an independent variable to
a MLR model, it can be seen that size metrics (LOC, VLOC) are the more representa-
tive metrics in the predictive models. Halstead metrics (HOpt, HDif), related with size
and complexity, were also included in all models by Stepwise selection.
Table 5. MLR Models Coefficients
Coefficients
Unstandardized
Coefficients
Standardized
Coefficients
t-ratio
Sig.
(p-value) B Std. Error β
DEF1quarter
(Constant) ,058 ,069 - ,837 ,403
VLOC ,006 ,001 1,484 4,494 ,000
EC ,029 ,009 ,168 3,322 ,001
FIE -,030 ,008 -,186 -3,516 ,001
HOpt -,001 ,000 -,928 -2,853 ,005
DEF1semester
(Constant) ,272 ,132 - 2,053 ,041
LOC ,002 ,001 ,513 3,807 ,000
ABC ,026 ,005 ,288 5,309 ,000
FIE -,070 ,013 -,239 -5,484 ,000
AC ,045 ,013 ,150 3,515 ,001
WMC ,013 ,004 ,344 3,078 ,002
HDif -,017 ,006 -,291 -2,870 ,004
DEF1year
(Constant) ,230 ,179 - 1,286 ,200
LOC ,004 ,001 ,782 7,471 ,000
FIE -,090 ,018 -,227 -5,038 ,000
ABC ,029 ,006 ,236 4,595 ,000
AC ,058 ,018 ,143 3,283 ,001

HDif -,025 ,008 -,323 -3,039 ,003
MCC ,145 ,050 ,158 2,881 ,004
6 Limitations
This investigation was based upon a dataset extracted from corrective maintenance
history of two software products, developed in a software factory using a process
based on Rational Unified Process (RUP). Both products were developed for web
platform, using C#, with similar technologies and business requirements. As MLR
models were built over these systems classes’ metrics, external validity of the pre-
sented models is threatened.
Halstead metrics were used as independent variables. Therefore, there is no calcu-
lation consensus of these traditional metrics in popular OO languages like C# or Java.
Other critiques address the lack of metrology concepts in that metrics.
Dependent variables were extracted according to a strategy to trace code changes
related defects correction. This traceability depends on developers to associate with
an issue tracker item (defect) when committing changes to a Version Control System.
This human-dependent manual process has led to defects not associated to respective
corrective changes. In Project A, 67% (669 / 998) of defects and in Project B only
45% (139 / 304) of defects presented traceability with code changes.
It is well known that preventive maintenance, for code quality improvement, im-
pacts on its maintainability. Thus, it is expected that refactored classes reduce its error
proneness. Therefore, in this analysis, dependent variables were compared with met-
rics obtained in the delivery revision of the classes, ignoring future improvements in
classes’ design and code.
7 Conclusions and Future Work
This paper has presented an investigation on the use of OO software product metrics
to predict defects after software releases. This approach allows early identification of
error-prone classes and direction of quality activities like testing and refactoring.
Within this investigation, it was proposed and implemented the Method of Soft-
ware Measurement for Defect Prediction (MEM-DEF). The MEM-DEF’s goal is to
collect software internal and defects history metrics, from Version Control and Issue
Tracker systems, and to integrate measures in a consolidated table, adequate for de-
fect prediction models.
By the usage of descriptive statistics analysis, it could be observed that most soft-
ware metrics did not follow normal distribution in this investigation, thus limiting
statistical techniques that could be used in the study.
Correlation analysis allowed identifying metrics largely correlated with defect
counts, related to class size, complexity, and coupling. Cohesion and inheritance met-
rics presented almost null correlation with dependent variables.

Multivariate Linear Regression models were built for three dependent variables,
representing detected defects in the first three, six, and twelve months after the clas-
ses’ deployment. In the models construction, it was used the stepwise selection meth-
od to reduce metrics considered and keep only statistically significant ones.
It was assessed the defect prediction potential of 31 traditional and OO metrics.
Size (LOC, VLOC, FIE), complexity (WMC, MCC), coupling (EC, ABC, AC), and
Halstead metrics (HOpt, HDif) were included into models as best predictors. Cohe-
sion and inheritance metrics did not presented promising results in defect prediction.
Thus, authors suggest the usage of size, complexity, and coupling metrics for defect
prediction in OO software.
The proposed defect prediction approach can be used to help prioritizing quality
activities like testing, inspecting, and refactoring on defect-prone classes.
Authors of this paper suggest the MEM-DEF implementation in other investiga-
tions, within different contexts, business domains, and technologies. It is also sug-
gested the implementation of a mechanism that avoid committing corrective mainte-
nance changes without informing the associated issue number, in order to ensure de-
fects and code changes traceability.
8 References
[1] C. F. Kemerer, and S. Slaughter, “An empirical approach to studying software evolu-
tion”. IEEE Trans. Softw. Eng., IEEE Press, Piscataway, NJ, USA, v. 25, n. 4, p. 493-509,
1999. ISSN 0098-5589.
[2] K. Bennett, “Software maintenance: A tutorial”. IEEE Trans. Softw. Eng., IEEE Press,
Los Alamitos CA, v. 1 The Development Process (2nd edn), p. 471-485, 2002.
[3] C. Jones, “Geriatric Issues of Aging Software”. December 2007. Available:
http://www.stsc.hill.af.mil/crosstalk/2007/12/0712Jones.html>
[4] Nguyen, V.; Boehm, B.; Danphitsanuphan, P. A controlled experiment in assessing and
estimating software maintenance tasks. Information and Software Technology, v. 53, p. 682-
691, November 2010.
[5] Boehm, B. and Basili, V. Software defect reduction top 10 list. IEEE Computer, v. 34, n.
1, p. 135-137, 2001.
[6] Nagappan, N.; Ball, T. Use of relative code churn measures to predict system defect den-
sity. In: International Conference on Software Engineering, 27., 2005, Leipzig. Proceed-
ings... [S.l.]: ICSE, 2005.
[7] Olague, H. M.; Etzkorn, L. H.; Messimer, S. L. An empirical validation of object-
oriented class complexity metrics and their ability to predict error-prone classes in highly it-
erative, or agile, software - a case study. Journal of Software Maintenance and Evolution -
Reseach and Practice, v. 20, p. 171-197, February 2008.
[8] Shatnawi, R.; Li, W. The effectiveness of software metrics in identifying error-prone
classes in post-release software evolution process. Journal of Systems and Software, v. 81,
p. 1868-1882, 2008.
[9] M. P. Ware, F. G. Wilkie, M. Shapcott, “The application of product measures in direct-
ing software maintenance activity”. J. Softw. Maint. Evol., John Wiley & Sons, Inc., New
York, NY, USA, v. 19, n. 2, p. 133-154, 2007. ISSN 1532-060X.
[10] E.H. Ferneley, “Design Metrics as an Aid to Software Maintenance: An Empirical
Study”, J Softw Maint Evol - R, 11 (1999), pp. 55 – 72
[11] L.C. Briand, P. Devanvu, and W. Melo, “An investigation into coupling measures for
C++”. In Proceedings of ICSE ’97, Boston, USA, pp. 47–52.
[12] S. Chidamber; C. Kemerer, “A metrics suite for object-oriented design”. IEEE Transac-
tions on Software Engineering, v. 20, n. 6, p. 476-493, 1994.
[13] B. Henderson-Sellers 1996. “Software Metrics”, Prentice Hall, U.K.
[14] W. Li and S. Henry. “Object-oriented metrics that predict maintainability”, 1993, Jour-
nal of Systems and Software 23: 111–122.
[15] M. Lorenz and J. Kidd, “Object-oriented software metrics”, 1994, Prentice Hall, New
Jersey, USA.
[16] M. M. Lehman, “On understanding laws, evolution and conservation in the large-
program life cycle”. J. Syst. Software, v. 1, n. 3, p. 213-232, 1980.
[17] D. Kafura; J. T. Canning “A validation of software metrics using many metrics and two
resources”. In: Proc. 8th Int. Conf Software Eng. [S.l.: s.n.], 1985. p. 378-385.
[18] D. Kafura, G. Reddy, “The use of software complexity metrics in software mainte-
nance”. IEEE Transactions on Software Engineering, IEEE, v. 13, n. 3, p. 335-343, 1987.
[19] Bezerra, M. Detecção de módulos de software propensos a falhas através de técnicas de
aprendizagem de máquina. 2008. Dissertação de Mestre em Ciência da Computação) -
Universidade Federal de Pernambuco, Recife.
[20] P. Oman and J. Hagemeister, “Constructing and Testing of Polynomials Predicting
Software Maintainability.” Journal of Systems and Software 24, 3 (March 1994): 251-266.
[21] Ohlsson, M.; Amschler, A.; Wohlin, C. Modelling fault-proneness statistically over a
sequence of releases - a case study. Journal of Software Maintenance and Evolution - Re-
seach and Practice, v. 13, p. 167-199, 2001.
[22] Fenton, N.; Ohlsson, N. Quantitative analysis of faults and failures in a complex soft-
ware system. IEEE Transactions on Software Engineering, v. 28, n. 8, p. 797-814, 2000.
[23] Cohen, J. Statistical power analysis for the behavioral sciences. 2 ed. ed. [S.l.]: Aca-
demic Press, 1988.
[24] Y. Zhou and B. Xu, “Predicting the Maintainability of Open Source Software using De-
sign Metrics”, Wuhan University Journal of Natural Sciences, 13, 1, pp. 14 – 21, 2008.
[25] G. S. P. Moreira, R. P. Mellado, A. M. Cunha, and L. A. V. Dias, “Uma Análise de
Correlação entre Métricas de Produto de Software e Propensão à Manutenção”. In: Proced-
ings of Brazilian Symposium of Software Quality (SBQS), Curitiba, PR, Brazil, June 2011
[26] R. C. Martin, “Object Oriented Design Quality Metrics - an Analysis of Dependencies”.
October, 1994. Available: http://www.objectmentor.com/resources/articles/oodmetrc.pdf
[27] Y. Zhou and H. Leung, “Predicting Object-Oriented Software Maintainability using
Multivariate Adaptive Regression Splines, J Syst Software, 80(2007), pp. 1349 –1361.
[28] W. G. Hopkins, ‘A New View of Statistics”. SportScience, New Zealand, 2003.
[29] K. D. Welker and P.W. Oman, “Development and Application of an Automated Source
Code Maintainability Index”, J Softw Maint Evol - R, 9 (1997), pp. 127 – 159.
[30] NDepend Metrics Definition. Available in <http://www.ndepend.com/metrics.aspx.
Accessed at April, 2011>.
[31] Semantic Designs Metrics extractor for C# Source Code. Available in
<http://www.semdesigns.com/Products/Metrics/CSharpMetrics.html>
[32] M. Halstead, “Elements of Software Science”. [S.l.]: Elsevier North-Holland, 1977.
[33] T. McCabe, “A complexity measure”. IEEE Trans. Software Eng., v. 2, p. 308-320,
December 1976.
Related Documents

![Resultado dos Candidatos Aprovados OBJ - ibade.org.br · 765.702-1 adilson dos santos souza [negro] 74,00 754.197-0 adilson gonÇalves dos santos junior 60,00 760.946-9 adilson jose](https://static.cupdf.com/doc/110x72/5befae1e09d3f2ec148baee0/resultado-dos-candidatos-aprovados-obj-ibadeorgbr-765702-1-adilson-dos.jpg)