Industrial Materials for the Future Managed by UT-Battelle, LLC Final Technical Report Predicting Pattern Tooling and Casting Dimensions for Investment Casting, Phase II September 2005 Principal Investigators: Nick Cannell Edison Materials Technology Center Adrian S. Sabau Oak Ridge National Laboratory ORNL/TM-2005/228

Welcome message from author
This document is posted to help you gain knowledge. Please leave a comment to let me know what you think about it! Share it to your friends and learn new things together.
Transcript

Industrial Materials for the Future
Managed by UT-Battelle, LLC
Final Technical Report Predicting Pattern Tooling and Casting Dimensions for Investment Casting, Phase II September 2005 Principal Investigators:
Nick Cannell Edison Materials Technology Center Adrian S. Sabau Oak Ridge National Laboratory
ORNL/TM-2005/228

DOCUMENT AVAILABILITY
Reports produced after January 1, 1996, are generally available free via the U.S. Department of Energy (DOE) Information Bridge.
Web site http://www.osti.gov/bridge
Reports produced before January 1, 1996, may be purchased by members of the public from the following source.
National Technical Information Service 5285 Port Royal Road Springfield, VA 22161 Telephone 703-605-6000 (1-800-553-6847) TDD 703-487-4639 Fax 703-605-6900 E-mail [email protected] Web site http://www.ntis.gov/support/ordernowabout.htm
Reports are available to DOE employees, DOE contractors, Energy Technology Data Exchange (ETDE) representatives, and International Nuclear Information System (INIS) representatives from the following source.
Office of Scientific and Technical Information P.O. Box 62 Oak Ridge, TN 37831 Telephone 865-576-8401 Fax 865-576-5728 E-mail [email protected] Web site http://www.osti.gov/contact.html

FINAL TECHNICAL REPORT
Project Title: Predicting Pattern Tooling and Casting Dimensions for Investment Casting, Phase II
DOE Award Number: DE-FC36-01ID14033
Project Period: July 1, 2001–September 30, 2004
PI(s): Nick Cannell (EMTEC) (216) 408-7706 [email protected]
Adrian S. Sabau (ORNL) (865) 241-5145 [email protected]
Recipient Organization: Edison Materials Technology Center (EMTC)
3155 Research Blvd. Kettering, OH 45420
National Laboratory: Oak Ridge National Laboratory Project Team:
Contact Company Bill Schrey Schrey & Sons Mold
Bob Dzugan Buycastings.com
Bob Horton Precision Metalsmiths, Inc.
James A. Oti J & J, a DePuy Company
Jerry Donohue Precision Colloids, LLC
Jerry Kovatch Precision Metalsmiths, Inc.
Jerry Snow Minco, Inc.
Jim Gardner JEM Mfg.
Nip Singh S & A Consulting Group, LLP
Timothy Wolff Argueso & Co.
Mike Payne Precision Castings, Inc.
Nick Cannell EMTEC

ORNL/TM-2005/228
Predicting Pattern Tooling and Casting Dimensions for Investment Casting, Phase II
Nick Cannell Edison Materials Technology Center
Adrian S. Sabau
Oak Ridge National Laboratory
September 2005
Prepared by OAK RIDGE NATIONAL LABORATORY
P.O. Box 2008 Oak Ridge, Tennessee 37831-6283
managed by UT-Battelle, LLC
for the U.S. DEPARTMENT OF ENERGY
under contract DE-AC05-00OR22725

ii
Acknowledgments and Disclaimer Acknowledgments This report is based upon work supported by the U.S. Department of Energy, Energy Efficiency and Renewable Energy, Industrial Technologies Program, Industrial Materials for the Future, under Award No. DE-FC36-01ID14033. We would like to thank M. Argueso & Co., Inc., for providing the wax for this study; T. Wolf, P. A. Silverstein, W. R. Fricker, and I. Al-Rabadi of Argueso for assistance with the wax injection experiments; G. Rowe of Abatech, Inc., for obtaining the viscoelastic relaxation spectrum from rheometry data; and T. A. Parham and C. M. Smith for assistance with pressure transducer thermocouples. Thanks also go to Srinath Viswanathan of ORNL, with whom we collaborated on past project tasks and who supervised the work on Sections 1, 2.1, and 2.2. We thank J. Snow, D. Scott, and B. Sneider of Minco, Inc., for shell investment and for embedding thermocouples within the shell; E. Hatfield for casting assistance; Z. Wu, a University of Tennessee graduate student, for obtaining the shrinkage factors from measured dimensions; J. Kovatch and R. Abramczyk of Precision Metalsmiths, Inc. (PMI), for conducting casting experiments; Allen Bransford and Mike Payne, Precision Castings of Tennessee, Inc., for providing access to their foundry; B. Schrey, of Schrey & Sons Mold Co., for providing the sprue tooling; and Jim Gardner, J.E.M. Manufacturing, for casting design and providing wax patterns for the sprue. Disclaimer This report was prepared as an account of work sponsored by an agency of the United States Government. Neither the United States Government nor any agency thereof, nor any of their employees, makes any warranty, express or implied, or assumes any legal liability or responsibility for the accuracy, completeness, or usefulness of any information, apparatus, product, or process disclosed, or represents that its use would not infringe privately owned rights. Reference herein to any specific commercial product, process, or service by trade name, trademark, manufacturer, or otherwise, does not necessarily constitute or imply its endorsement, recommendation, or favoring by the United States Government or any agency thereof. The views and opinions of authors expressed herein do not necessarily state or reflect those of the United States Government or any agency thereof.

iii
Contents List of Figures ............................................................................................................................ v List of Tables............................................................................................................................... vii Abbreviations, Acronyms, and Symbols ..................................................................................... ix 1. Executive Summary....................................................................................................................... 1
1.1 Project Goal ....................................................................................................................... 1 1.2 Summary of Project Achievements ................................................................................... 2
Phase I ............................................................................................................................... 2 Phase II: Current Project.................................................................................................... 3
1.3 Technology Transfer.......................................................................................................... 3 1.4 Recommendations ............................................................................................................. 3
2. Introduction.................................................................................................................................... 5 3. Background.................................................................................................................................... 7
3.1 Project Approach ............................................................................................................... 8 3.2 Review of Computer Models for Wax, Shell, and Alloy Deformation ............................. 9 3.3 Task Breakdown................................................................................................................ 10
4. Results and Discussion .................................................................................................................. 11
4.1 Wax Pattern and Die-Wax Interaction............................................................................... 11 4.1.1 Experimental Data for Wax Patterns ........................................................................ 11 4.1.2 Numerical Simulations of Wax-Die Interaction and Wax Shrinkage...................... 13
4.2 Shell Mold Properties and Thermal Interaction for the Shell-alloy System...................... 19 4.2.1 Experimental Data for Shell Molds ......................................................................... 20 4.2.2 Numerical Simulation Results for Temperature Distribution in the
Shell-Alloy System.................................................................................................. 24 4.3 Alloy Properties and Mechanical Interaction for the Shell-Alloy System ........................ 29
4.3.1 Experimental Results for Alloy Deformation .......................................................... 29 4.3.2 Numerical Simulation Results for Casting Dimensions .......................................... 33
5. Accomplishments........................................................................................................................... 39
5.1 Die-Wax ............................................................................................................................ 39 5.2 Shell-Alloy System: Thermal Interaction.......................................................................... 39 5.3 Shell-Alloy System: Mechanical Interaction..................................................................... 39 5.4 Technology Transfer.......................................................................................................... 40 5.5 Publications and Patents Resulting from Project............................................................... 40
6. Conclusions.................................................................................................................................... 41 7. Recommendations.......................................................................................................................... 43
7.1 Wax.................................................................................................................................... 43 7.2 Shell ................................................................................................................................... 43 7.3 Alloy .................................................................................................................................. 44 7.4 Technology Transfer.......................................................................................................... 44

iv
8. References ...................................................................................................................................... 45 Appendices A. Constitutive Equations for Modeling Wax Deformation ........................................................ 47 B. Constitutive Equations for Shell Molds .................................................................................. 51 C. Natural Convection at Shell Mold Surfaces ............................................................................ 53 D. Thermo-Mechanical Models of Alloys ................................................................................... 55

v
List of Figures 1.1 Sketches of the investment casting process ........................................................................... 1 1.2 Dimensions in the investment casting process ........................................................................ 2 1.3 Flow chart illustrating the steps necessary for obtaining the dimensions and
ensuing shrinkage factors based on computer models ............................................................ 2 3.1 Restrained (or constrained) vs unrestrained dimensions ......................................................... 7 3.2 Schematic of proposed flow chart for obtaining die dimensions ............................................ 8 4.1 (a) Wax pattern dimensions and step index; (b) die and wax pattern ..................................... 12 4.2 Top die showing thermocouple placement ............................................................................. 12 4.3 Evolution in time of the temperature in the injection port and pressure in the
wax pattern for (a) liquid injection and (b) paste injection ..................................................... 13 4.4 Pure elastic case: (a) Temperature distribution and pattern distortion in the
symmetry plane and (b) top view of pattern distortion and length displacement .................. 14 4.5 Viscoelastic case: (a) Temperature distribution and pattern distortion in
the symmetry plane and (b) top view of pattern distortion and length displacement ............. 15 4.6 Pure elastic case: Displacement distribution in the wax pattern (a) along the pattern
length and (b) along the width of the pattern .......................................................................... 16 4.7 Viscoelastic case: Displacement distribution in the wax pattern (a) along the length
and (b) along the width at 3.5 h after the pattern .................................................................... 17 4.8 Hole dimensions showing hole diameter measured along the length direction and
across the width of the pattern . ............................................................................................... 17 4.9 Evolution in time of linear shrinkage of the wax pattern (a) measured and
(b) computed from the viscoelastic data. ................................................................................. 18 4.10 Micrographs of various layers of the shell cross-section shown at
different magnifications .......................................................................................................... 19 4.11 Sketch of typical shell structure. .............................................................................................. 20 4.12 (a) Wax pattern assembly showing casting configuration and (b) pouring of
aluminum A356 alloy ............................................................................................................. 20 4.13 Schematic of casting arrangement showing mold support ...................................................... 21 4.14 Surface configuration showing amount of air flow restriction . .............................................. 21 4.15 Sketch showing thermocouple placement ............................................................................... 22 4.16 Solid fraction profile for two cases . ........................................................................................ 25 4.17 Micrograph showing the concentration of porosity in the center of the plates ....................... 25 4.18 Temperature at a location in the center of the sprue for ORNL castings ................................ 25 4.19 Temperature in the center of the plates for (a) OR1 case and (b) OR2 case ........................... 26 4.20 Temperature for OR3 case (a) in the center of the plates, and (b) in the shell ....................... 27 4.21 Temperature for PC3 case (a) in the center of the plates and (b) in the shell ......................... 28 4.22 Shell molds invested at Minco and cast at PMI ...................................................................... 30 4.23 Position of coordinate measurement points for (a) the width dimensions and
(b) length L2–5, between ends of Steps 2 and 5 ...................................................................... 30 4.24 Width dimension shrinkage factors: (a) ws; (b) cs; (c) as. ........................................................ 32

vi
4.25 Shrinkage factors for the length dimension, L2–5: (a) ws; (b) cs; (c) as .................................. 32 4.26 Casting configuration for numerical simulations . ................................................................... 33 4.27 Comparison between the experimental results and computed results for the
length dimension L2-5.............................................................................................................. 34 4.28 Comparison between experimental and computed shrinkage factors for the width
dimension as a function of length ............................................................................................ 35 4.29 Temperature profile in the alloy .............................................................................................. 36 4.30 Contact pressure due to mold restraint ................................................................................... 37 4.31 Displacement distribution for (a) no-hole casting, and (b) two hole-casting .......................... 37 B.1 Thermal conductivity for ten-backup-coat shell....................................................................... 52 B.2 (a) Magnitude of the infrared (IR) signal for the black body and the shell plate;
(b) estimated shell emissivity from IR experimental data. ....................................................... 52

vii
List of Tables
2.1 Comparison of energy used and energy saved for existing vs new technology....................... 6 4.1 Experimental and numerical simulation results for hole diameters in steps 3 and 5 ............... 18 4.2 Shell system selected for this study ......................................................................................... 20 4.3 Casting conditions for shell mold experiments........................................................................ 23 4.4 Measurement of shell thickness and thermocouple location.................................................... 23 4.5 Heat transfer coefficients used in numerical simulations ........................................................ 23 4.6 Heat transfer coefficients held constant in numerical simulations........................................... 24 4.7 Values of heat transfer coefficients (W/m2 K) used for different ORNL cases ...................... 26 4.8 Heat transfer coefficients (W/m2 K) and parameters for the thermal conductivity
of the shell used for PCT cases ................................................................................................ 27 4.9 Index of wax patterns and castings .......................................................................................... 31 4.10 Cases considered in numerical simulations ............................................................................. 33
4.11 Summary of numerical simulation results for casting dimensions ......................................... 35
A.1 Tests used for determining wax properties .............................................................................. 47 A.2 Relaxation times, �i , and relaxation strengths,gi , determined from
experimental measurements by nonlinear regression analysis................................................. 49 B.1 Studies on radiation effects in ceramic packed beds of unsintered particles
of uniform size ......................................................................................................................... 51 D.1 Fluid flow and deformation mechanisms depending on the solidifying microstructure.......... 55 D.2 Critical solid fractions for thermomechanical behavior during alloy solidification ................ 56 D.3 Mechanical properties used in ProCAST based on Bellet et al. .............................................. 56 D.4 Mechanical properties used in ProCAST based on Kim et al. ................................................ 57

viii

ix
Abbreviations, Acronyms, and Symbols ABAQUS computer simulation program A356 aluminum alloy AFS American Foundry Society as alloy shrinkage BICTA British Investment Casting Trade Association cs casting shrinkage C1, C2 thermocouples embedded in the shell cavity CMM coordinate measurement machine DSC differential scanning calorimeter DTA differential thermal analysis EKK software vendor EMTEC Edison Materials Technology Center HTC heat transfer coefficient, W/m2K ICI Investment Casting Institute IR infrared k thermal conductivity L2-5, L25 length between steps 2 and 5 ORNL Oak Ridge National Laboratory OR1, OR2, OR3 casting experiments performed at ORNL P1, P2 Pressure transducers PCT Precision Casting of Tennesse, Inc. PC1, PC2, PC3 castings experiments performed at PCT, Inc. ProCAST casting simulation software PMI Precision Metalsmiths, Inc. T temperature, units indicated in graphs or tables T1, T2, … , T14 thermocouples ws wax shrinkage

x

1
1. Executive Summary The investment casting process allows the production of complex-shape parts and close dimensional tolerances. One of the most important phases in the investment casting process is the design of the pattern die. Pattern dies are used to create wax patterns by injecting wax into dies. The wax patterns are used to create a ceramic shell by the application of a series of ceramic coatings, and the alloy is cast into the dewaxed shell mold (Fig. 1.1). However, the complexity of shape and the close dimensional tolerances required in the final casting make it difficult to determine tooling dimensions.
Fig. 1.1. Sketches of the investment casting process
(schematic from http://www.machinedesign.com). The final linear dimension of the casting depends on the cumulative effects of the linear expansions or contractions in each step of the investment casting process (Fig. 1.2). In most cases, the mold geometry or cores restrict the shrinkage of the pattern or the cast part, and the final casting dimensions may be affected by time-dependent processes such as viscoelastic deformation of the wax, and viscoplastic creep and plastic deformations of the shell and alloy. The pattern die is often reworked several times to produce castings whose dimensions are within acceptable tolerances. To date, investment casting technology has been based on hands-on training and experience. Technical literature is limited to experimental, phenomenological studies aimed at obtaining empirical correlations for quick and easy application in industry.
1.1 Project Goal
The goal of this project was to predict casting dimensions for investment castings in order to meet blueprint nominal during the first casting run. Several interactions have to be considered in a coupled manner to determine the shrinkage factors: these are the die-wax, wax-shell, and shell-alloy interactions (as illustrated in Fig. 1.3). In this work, the deformations of the die-wax and shell-alloy systems were considered in a coupled manner, while the coupled deformation of the wax-shell system was not considered. Future work is needed in order to deliver to industry a computer program in which all three systems are coupled for determining the dimensions of the wax pattern, the shell mold, and casting in a sequential but coupled manner.
2
AcceptReject
Dim
ensi
on
Processing Time
Wax Pattern
(wax injection, wax shrinkage
during cristallization and cooling)
Cast Alloy Part
(alloy solidification, alloy shrinkage during cooling)
Shell
(shell dewaxing, shell firing)
Nominal dimension
Die-tool dimension
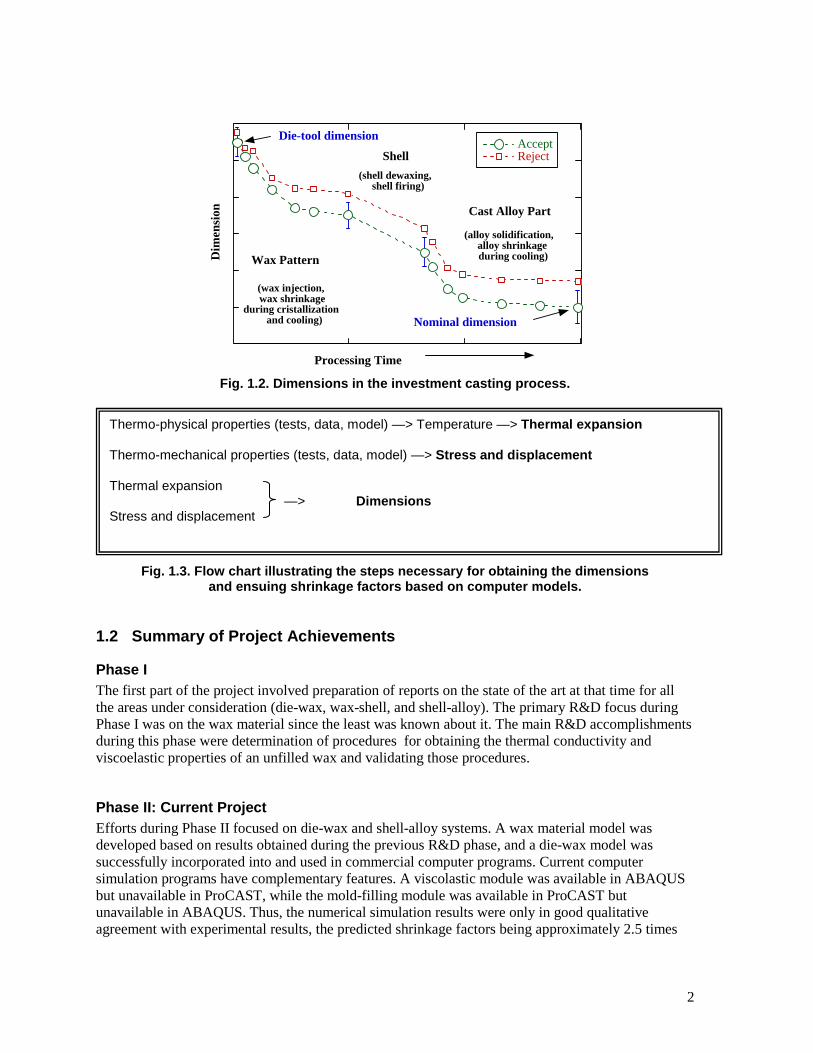
Fig. 1.2. Dimensions in the investment casting process.
Fig. 1.3. Flow chart illustrating the steps necessary for obtaining the dimensions
and ensuing shrinkage factors based on computer models.
1.2 Summary of Project Achievements
Phase I The first part of the project involved preparation of reports on the state of the art at that time for all the areas under consideration (die-wax, wax-shell, and shell-alloy). The primary R&D focus during Phase I was on the wax material since the least was known about it. The main R&D accomplishments during this phase were determination of procedures for obtaining the thermal conductivity and viscoelastic properties of an unfilled wax and validating those procedures.
Phase II: Current Project Efforts during Phase II focused on die-wax and shell-alloy systems. A wax material model was developed based on results obtained during the previous R&D phase, and a die-wax model was successfully incorporated into and used in commercial computer programs. Current computer simulation programs have complementary features. A viscolastic module was available in ABAQUS but unavailable in ProCAST, while the mold-filling module was available in ProCAST but unavailable in ABAQUS. Thus, the numerical simulation results were only in good qualitative agreement with experimental results, the predicted shrinkage factors being approximately 2.5 times
Thermo-physical properties (tests, data, model) —> Temperature —> Thermal expansion Thermo-mechanical properties (tests, data, model) —> Stress and displacement Thermal expansion
—> Dimensions Stress and displacement

3
larger than those measured. Significant progress was made, and results showed that the testing and modeling of wax material had great potential for industrial applications. Additional R&D focus was placed on one shell-alloy system. The fused-silica shell mold and A356 aluminum alloy were considered. The experimental part of the program was conducted at ORNL and commercial foundries, where wax patterns were injected, molds were invested, and alloys were poured. It was very important to obtain accurate temperature data from actual castings, and significant effort was made to obtain temperature profiles in the shell mold. A model for thermal radiation within the shell mold was developed, and the thermal model was successfully validated using ProCAST. Since the fused silica shells had the lowest thermal expansion properties in the industry, the dewaxing phase, including the coupling between wax-shell systems, was neglected. The prefiring of the empty shell mold was considered in the model, and the shell mold was limited to a pure elastic material. The alloy dimensions were obtained from numerical simulations only with coupled shell-alloy systems. The alloy dimensions were in excellent quantitative agreement with experimental data, validating the deformation module. For actual parts, however, the creep properties of the shell molds must also be obtained, modeled, and validated.
1.3 Technology Transfer
The techniques developed in the program were documented in several publications and conference presentations. Detailed reports were also issued to the participating companies. A paper on wax testing standards was presented to the industry trade association, Investment Casting Institute, to incorporate our recommendations into the industry standards. Commercial adoption of the technologies developed in this program took place through the active participation of the American Foundry Society, Edison Materials Technology Center, and the industrial partners participating in this proposal. Most of the property data and constitutive equations developed in this program were implemented in ProCAST, the leading casting simulation software for the investment casting industry, allowing immediate dissemination of the information to industry. Other commercial casting software, including Flow3D and software from EKK, Inc., were provided with the results of this study in order to increase the dissemination of information to industry. As a result of this work, ProCAST is implementing a viscoelastic module. However, more work is needed to make the viscoelastic module applicable to industrial waxes and available to users.
1.4 Recommendations
This project laid the theoretical groundwork for predicting shrinkage factors. In this work, the deformations of the die-wax and shell-alloy systems were considered in a coupled manner, but the coupled deformation of wax-shell systems was not considered. Future work is needed for delivering to the industry a computer program in which the die-wax, wax-shell, and shell-alloy systems are coupled for determining the dimensions of the wax pattern, shell mold, and casting in a sequential but coupled manner. For technology dissemination, it is now recommended that a new project be set up and conducted to incorporate the proposed methodologies into commercial casting software. The software vendors should collaborate with a team of users.


5
2. Introduction The final linear dimension of a casting depends on the cumulative effects of the linear expansions or contractions in each step of the investment casting process. In most cases, the mold geometry or cores restrict the shrinkage of the pattern or the cast part, and the final casting dimensions may be affected by time-dependent processes such as viscoelastic deformation of the wax, and viscoplastic creep and plastic yield of the shell and alloy. Although there is significant information in the literature on these processes, and mathematical models have been developed for continuous and direct chill casting, there has been little or no application to shaped castings. In particular, although many commercial casting codes have stress modules to predict elastic stress, they cannot predict dimensional change or model the effects of geometrical restraint, viscoelastic creep, viscoplastic creep, and plastic yield. These processes occur primarily in investment casting, due to the extended time the casting is at high temperature, and occur to a much lesser extent in other casting processes. The status of investment casting technology worldwide mirrors that in the United States. Most investment casting companies are small businesses with limited facilities for research. Technology development is carried out primarily by suppliers, who then transfer it to the rest of the industry. The leading commercial casting software suppliers are global, with a handful of companies dominating the world market. To date, investment casting technology has been based on hands-on training and experience. Technical literature is limited to experimental, phenomenological studies aimed at obtaining empirical correlations for quick and easy application in industry. The pattern die is often reworked several times to produce castings whose dimensions are within acceptable tolerances. The complexity of shape and the close dimensional tolerances required in the final casting make it difficult to determine the appropriate pattern dimensions with existent casting simulation software except by trial and error. Improvements in industrial dimensional practices are hindered by (a) the complexity of physical phenomena that determine casting dimensions; (b) the lack of thermophysical property data for the wax, shell, and alloy; and (c) the lack of well-established, validated thermomechanical models that describe the deformation of the wax, shell, and alloy. In the past eight to ten years, several commercial casting simulation codes have become available for the simulation of mold filling and solidification. Although not all of the commercial packages have all the features pertinent to investment casting (e.g., input for radiation heat transfer), most can be used to design gating systems and minimize areas of solidification shrinkage. However, none of the commercial packages can be used for determining the pattern tooling dimensions. This project directly addressed High Priority Research Needs for the Metalcasting Industry in the areas of Products and Markets, and Manufacturing (Exhibit 1-1, Metalcasting Industry Roadmap). Specifically, the project addressed the need to “develop tools and technologies to reduce lead times in the metalcasting industry,” and “improve tooling design to reduce the time to get castings to market.” In the area of Products and Markets, this project directly addressed Major Technology Barriers in Market Development (Exhibit 2-4, Metalcasting Industry Roadmap), in the area of Design Tools and Processes. The project addressed near-term and mid-term R&D Needs in Products and Markets (Exhibit 2-5, Metalcasting Industry Roadmap) in the area of Design Tools and in the area of Product and Process Improvements. The project also addressed Major Technology Barriers in Manufacturing (Exhibit 4-2) and R&D Needs in Manufacturing in the areas outlined above.

6
The cost savings due to the introduction of this technology will come primarily from increased yield and the elimination of trial and error in the casting design process. This will lead to reduced material and energy needs, and economic benefits. The tools developed will also considerably improve overall productivity and expand markets, although these benefits are somewhat difficult to quantify. Only the energy benefits will be used in calculating energy and environmental savings. The increased demands for the consolidation of components into fewer parts and the emphasis on net-shape parts makes investment casting increasingly attractive for the production of high-precision, high-integrity castings. In addition, the need to increase consistency in investment castings and reduce costs by improving yields and eliminating rework justifies the development of tools for predicting pattern tooling and casting dimensions in investment casting. A large part of the investment casting industry deals with high-value iron, nickel, and cobalt-based alloys. The technology will result in the following benefits:
• Energy efficiency through scrap reduction and yield increase (more parts with dimensions within blueprint tolerances)
• Ability to pour molten metal at lower temperatures, as a result of process analysis • Reduced downtime due to mold rework, furnace idling, and lost furnace heat. Die rework,
and the ensuing downtime, will be eliminated. • Less metal: Thinner walls, more structural geometry, and less mass, resulting from process
analysis • Productivity improvements: Less cutting, grinding, rework, and heat treating; more parts with
dimensions within blueprint tolerances and fewer part features requiring machining We assume that this technology will reduce scrap from 4% to 3% and increase yield from 55% to 65%. Table 2.1 provides the basis for these assumptions.
Table 2.1. Comparison of energy used and energy saved for existing vs new technology
Investment casting material Assumptions Energy used/saved
(× 1012 Btu/year)
Baseline metric
HA steel 32.8 x 10⁶ Btu/ton x 120,775 tons/year 3.96
Titanium 35.0 x 10⁶ Btu/ton x 8,627 tons/year 0.30
Aluminum 7.5 x 10⁶ Btu/ton x 43,134 tons/year 0.32
Total energy use, baseline 4.58
New technology metric
HA steel 27.5 x 10⁶ Btu/ton x 119,614 tons/year 3.29
Titanium 29.3 x 10⁶ Btu/ton x 8,544 tons/year 0.25
Aluminum 6.29 x 10⁶ Btu/ton x 43,719 tons/year 0.28
Total energy use, new technology
3.82
Energy savings 0.76

7
3. Background The difference between the die dimensions and corresponding casting dimensions are usually referred to as the tooling allowances, or shrinkage factors. To determine the shrinkage factors, the die-wax, wax-shell, and shell-alloy interactions must be considered in a coupled manner. Another important factor that affects wax and alloy deformations is the dimensional restriction provided by the geometrical features, such as cores, die mold and shell mold (Fig. 3.1). The wax and alloy deformations are more complex in most investment castings, since geometrically constrained stresses build up around those regions of the casting.
Fig. 3.1. Restrained (or constrained) vs unrestrained dimensions. Dimension D2 is restrained by cores used to make the holes in the part (Hockin, 1968).
Since casting dimensions are determined by the die dimensions used for making the wax pattern, die dimensioning is one of the most important phases in the design of investment casting process. A series of tooling allowance surveys were conducted by the Investment Casting Institute (ICI) to assess tooling allowance practices used in the industry (Peters, Voigt, and Blair 1997). The last survey, performed in 1997, found that industry estimates pattern die dimensions by adjusting the part dimensions to account for dimensional changes associated with the wax and alloy systems. The only equation used in investment casting practice to describe dimensional changes due to the thermal loading of the wax, shell, and alloy during investment casting is that of linear thermal expansion, which appears as ( )[ ]00 1 TTDD −+= α , (3.1)
where D and D0 are dimensions at the elevated temperature, T, and ambient temperature, T0, respectively (Weddington, Reddy, and Mobley 1990). For partially or fully constrained dimensional features, tooling dimensioning is based on proprietary and practical experience. To date, no methodology has been developed to allow the die designer to account for the extent of constrained dimensions in setting the appropriate die blueprint correction factors; die dimensions are reworked by trial-and-error procedures until casting dimensions fall within acceptable dimensional tolerances, increasing the costs of the castings. The ICI surveys indicated that the assignment of tooling allowances is not consistent across the industry; tooling allowances vary greatly from investment caster to investment caster.
8
3.1 Project Approach
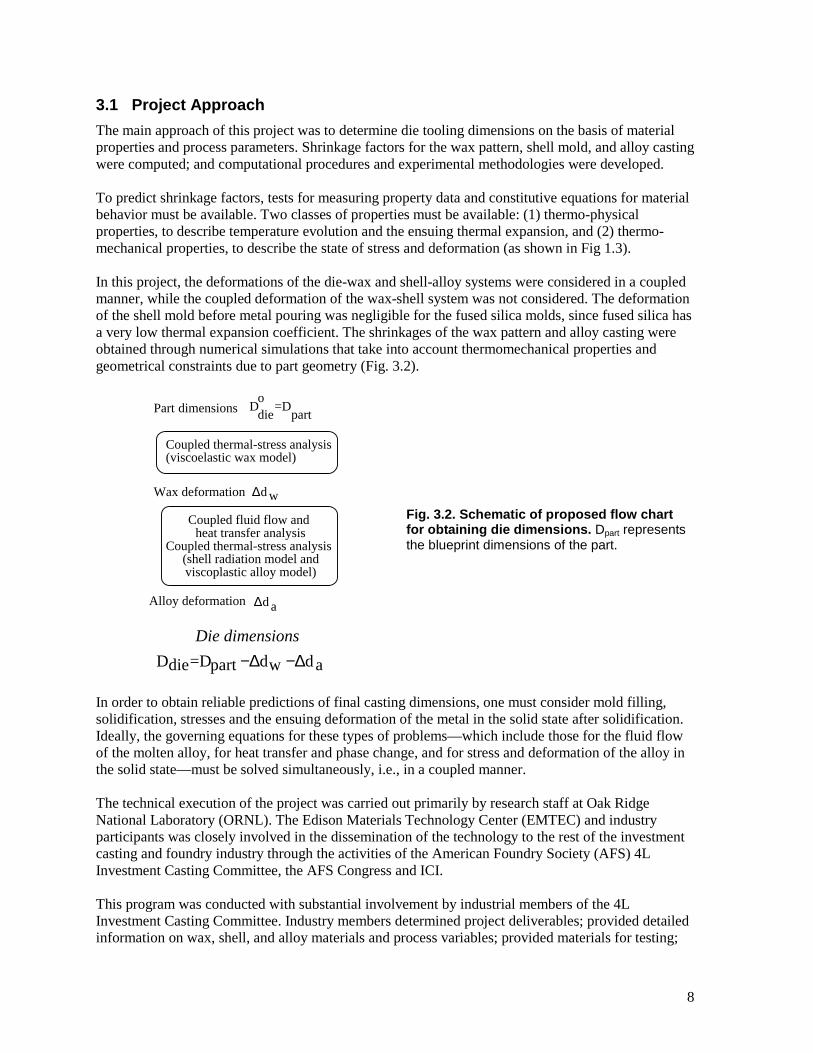
The main approach of this project was to determine die tooling dimensions on the basis of material properties and process parameters. Shrinkage factors for the wax pattern, shell mold, and alloy casting were computed; and computational procedures and experimental methodologies were developed. To predict shrinkage factors, tests for measuring property data and constitutive equations for material behavior must be available. Two classes of properties must be available: (1) thermo-physical properties, to describe temperature evolution and the ensuing thermal expansion, and (2) thermo-mechanical properties, to describe the state of stress and deformation (as shown in Fig 1.3). In this project, the deformations of the die-wax and shell-alloy systems were considered in a coupled manner, while the coupled deformation of the wax-shell system was not considered. The deformation of the shell mold before metal pouring was negligible for the fused silica molds, since fused silica has a very low thermal expansion coefficient. The shrinkages of the wax pattern and alloy casting were obtained through numerical simulations that take into account thermomechanical properties and geometrical constraints due to part geometry (Fig. 3.2).
Wax deformation
Part dimensions
Coupled thermal-stress analysis (viscoelastic wax model)
Alloy deformation
Coupled fluid flow and heat transfer analysis
Coupled thermal-stress analysis (shell radiation model and viscoplastic alloy model)
Ddieo
=Dpart
∆d a
∆d w
Die dimensions
−∆dw −∆daDdie=Dpart
Fig. 3.2. Schematic of proposed flow chart for obtaining die dimensions. Dpart represents the blueprint dimensions of the part.
In order to obtain reliable predictions of final casting dimensions, one must consider mold filling, solidification, stresses and the ensuing deformation of the metal in the solid state after solidification. Ideally, the governing equations for these types of problems—which include those for the fluid flow of the molten alloy, for heat transfer and phase change, and for stress and deformation of the alloy in the solid state—must be solved simultaneously, i.e., in a coupled manner. The technical execution of the project was carried out primarily by research staff at Oak Ridge National Laboratory (ORNL). The Edison Materials Technology Center (EMTEC) and industry participants was closely involved in the dissemination of the technology to the rest of the investment casting and foundry industry through the activities of the American Foundry Society (AFS) 4L Investment Casting Committee, the AFS Congress and ICI. This program was conducted with substantial involvement by industrial members of the 4L Investment Casting Committee. Industry members determined project deliverables; provided detailed information on wax, shell, and alloy materials and process variables; provided materials for testing;

9
characterized materials; gave technical assistance; conducted experiments needed for model validation; conducted in-plant trials for the validation of developed technologies; and monitored progress.
3.2 Review of Computer Models for Wax, Shell, and Alloy Deformation
Wax deformation (die-wax interaction). The use of computer models for the prediction of wax dimensions has been hindered by the lack of data for constitutive equations of thermomechanical behavior. The evaluation of the thermomechanical characteristics of waxes used in the investment casting industry is based on engineering behavior (Horacek and Helan 1998; Fielder 1998; BICTA 1983, 1985), such as cavitation propensity and volumetric expansion, rather than by the local deformation of the wax determined by physical and computational models (Chakravorty 1999). Recently, Sabau and Viswanathan (2000) documented experimental measurements on CERITA 29-51, an industrial, unfilled wax, with data on material properties that can be used for numerical simulations. At this time, computer simulation programs for wax deformation have complementary features. A viscolastic module was available in ABAQUS but unavailable in ProCAST, while the mold-filling module was available in ProCAST but unavailable in ABAQUS. Shell deformation (wax-shell and shell-alloy interactions). Thermal expansion and shrinkage are the most important properties of the shell. The thermal expansion behavior of shell systems is very well reported in the literature (Straton et al.; Weddington, Reddy, and Mobley 1990; Snow 1995). Dimensional changes of the shell mold reported in the literature primarily take into account the thermal expansion characteristics of the shell. Computer models are unavailable for the numerical simulation of wax-shell interaction. Computer simulations are available for the shell-alloy systems. Modeling of alloy deformation (shell-alloy interaction). In general, constitutive models are developed based on one-dimensional tests. These constitutive relations can in general be written as strain-stress relationships (Garofalo 1965; Conway and Flagella 1971; Bressers 1981). For example, Hallvard and Asbjorn (1990) fit the experimental data of Nedreberg (1990) for A6063, an AlMgSi alloy, by using predefined functions (power law) for the stress, strain, and hardening parameters. Bellet et al. (1996) used a Norton-Hoff power law to describe the viscoplastic behavior of an Al7Si0.3Mg alloy. Drezet and Rappaz (1996) also used a Norton-Hoff power law to describe the viscoplastic behavior of AA1201 alloy in the mushy state. In order to assess the mechanical behavior of alloys at temperatures very close to the solidus, the mechanical behavior of the mushy zone must be studied (Ackermann and Kurz 1985). Ackermann and Kurz described a new tensile test method and apparatus that allows the in situ measurement of the mechanical properties of a solidifying shell in the mushy zone.

10
3.3 Task Breakdown
The tasks for this project were as follows: 1. Determine the thermophysical properties of shell and alloy materials, with each measurement
considered a subtask, as follows:
1.1 Thermal conductivity 1.2 Emissivity 1.3 Density and thermal expansion 1.4 Specific heat capacity 1.5 Shell gas permeability 1.6 Fraction solid evolution of the alloy as a function of temperature and shell void fraction 1.7 Heat transfer coefficients (mold surface, mold-metal interface)
2. Determine thermomechanical behavior of shell and alloy materials
2.1 Determine tensile, bend, and creep behavior of shell materials from room to elevated temperatures
2.2 Determine tensile, compressive, creep, and stress relaxation tests on alloy materials 2.3 Develop material constitutive models for shell materials from data in Tasks 1 and 2 2.4 Develop material constitutive models for alloy materials from data in Tasks 1 and 2
3. Develop computational methodologies for determining the dimensional changes occurring during
shell dewaxing, firing, casting, and solidification
3.1 Develop and implement constitutive equations in ProCAST for the thermomechanical behavior of the shell
3.2 Conduct controlled experiments to validate and improve constitutive models of shell deformation
3.3 Develop and implement constitutive equations in ProCAST for the thermomechanical behavior of the alloy in the solid and mushy states
3.4 Conduct controlled experiments to validate and improve constitutive models of alloy deformation
4. Validate the model
4.1 Select simple, moderately complex, and complex castings for study 4.2 Make shells of simple, moderately complex, and complex shapes and measure dimensional
changes for various process steps and process parameters 4.3 Make castings of simple, moderately complex, and complex shapes and measure
dimensional changes for various process steps and process parameters 4.4 Run model for various conditions and compare with experimental measurements 4.5 Modify or refine model based on feedback from Task 4.4
5. Develop documentation and training materials and transfer the technology to industry
5.1 Develop simplified version of tools 5.2 Document results and develop user manuals 5.3 Develop materials for training prospective users 5.4 Conduct meetings and workshops

11
4. Results and Discussion In this work, deformations of the die-wax and shell-alloy systems were considered in a coupled manner, but the coupled deformation of the wax-shell system was not considered. Therefore, the project contained tasks pertaining to each material and their interactions, which are described in distinct sections. Section 4.1 presents results for the work on wax and wax-die interaction. Section 4.2 describes results for the shell mold, and Section 4.3 deals with the alloy and shell-alloy interaction.
4.1 Wax Pattern and Die-Wax Interaction
A wax material model was developed based on the results from the phase I work (see Sect. 1.2), and a die-wax model was successfully utilized in commercial computer programs. Computer simulation programs at this time have complementary features. A viscolastic module was available in ABAQUS but unavailable in ProCAST, while the mold-filling module was available in ProCAST but unavailable in ABAQUS. Thus, the numerical simulation results were only in good qualitative agreement with experimental results, the predicted shrinkage factors being approximately 2.5 times larger than those measured. Significant progress was made, and results showed that the testing and modeling of wax material had great potential for industrial applications. Wax pattern deformation has a large effect on tooling allowances. Rosenthal (1979) and Okhuysen, Padmanabhan, and Voigt (1998) indicated that wax shrinkage is one of the largest components of the overall dimensional change between the pattern tooling and its corresponding cast part. The use of computer models for the prediction of wax dimensions has been hindered by the lack of data for constitutive equations of thermomechanical behavior. The evaluation of the thermomechanical characteristics of waxes used in the investment casting industry is based on engineering behavior (Horacek and Helan 1998; Fielder 1998; BICTA 1983, 1985), such as cavitation propensity and volumetric expansion, rather than on the local deformation of the wax determined by physical and computational models (Chakravorty 1999). This project pioneered the use of computer programs for determining the wax pattern dimensions based on three-dimensional finite-element simulations. The model for coupled thermal and mechanical analysis was developed within ABAQUS. The wax model is described in Appendix A. The following factors are considered in the analysis: (1) the restraint due to geometrical features in the metal die; and (2) process parameters such as dwell time, die/platen temperature, injection pressure and injection temperature. The following sections present and discuss the numerical simulation results for the wax pattern dimensions.
4.1.1 Experimental Data for Wax Patterns The geometry of the stepped patterns considered for this study is shown in Fig. 4.1. The 2.54-cm-thick step is considered to be Step 1. In order to capture the effects of geometrical restraint on the wax pattern dimensions, cores were placed in the die to provide restraint in the pattern. The die for the wax pattern had dimensions of 19.5 × 10.3 × 9.0 cm. The parting plane of the die almost coincided with the flat surface of the pattern. The centerline of the injection port was in the parting plane of the die. The die was instrumented with thermocouples, indicated by the letter T in Fig. 4.2, and pressure transducers, indicated by the letter P, also shown in Fig. 4.2. The top die (Fig. 4.2) contained thermocouples T10–T14, which were inserted into the center of the corresponding

12
steps in the wax pattern. Thermocouple T9 was inserted into the center of the injection port. Pressure transducers (P1 and P2) or thermocouples (T12 and T14) were located at the positions of the core pin inserts, permitting either to be used when core pins were not utilized. The pressure transducers were mounted such that their sensor surfaces coincided with the top (flat) portion of the die cavity. For this work, the wax was injected as a paste using an injection machine that was available at the laboratory facilities of M. Argueso & Co. Due to the configuration of the machine, the die had to be clamped to the machine platen with an external C-clamp. This introduced an extra step in the injection process and also necessitated extra time prior to removal of the wax pattern from the die. The following time intervals are specified during the production of each wax pattern: (a) the dwell time, during which
2.54
2.540.457
3.81
0.254
1.27
1 2 3 4 5 6Step index:
Fig. 4.1. (a) Wax pattern dimensions (cm) and step index; (b) die and wax pattern.
A
A
A-A
1.27
3.456.00
11.07
==
T9T10T11T12T13T14P1P2
Fig. 4.2. Top die showing thermocouple placement (dimensions in cm). Thermocouple and pressure transducer indices are also shown.

13
the injection pressure is applied; and (b) the holding period, which is the time elapsed during the removal of the C-clamps. The experimental variables were as follows: injection pressure 2.04 MPa (300 psi) injection temperature 54°C (130°F) dwell time 80 s holding time 95 s An intermediate period of 5 s between the dwell and holding periods, during which the injection pressure is released, was considered in the numerical simulations. Typical data for the pressure in the wax (transducer P1) and the temperature in the injection port (thermocouple T9) are shown in Fig. 4.3. The instant at which the die was filled with wax is that at which the maximum pressure is recorded (Fig. 4.3). The pressure drops almost linearly throughout the dwell time. The temperature drops steeply in the first 25 s and reaches a plateau at about 90 s. The injection temperature (54°C) is not observed in the cooling curve, since the filling time is much smaller than the response time of the thermocouple. About 130 s after the die was filled with wax, pressure ceased to be transmitted into the wax pattern. The instant at which the pressure is not transmitted through the wax pattern is also marked by an inflection in the temperature profile. The data suggest that the wax behaves like a paste until about 29°C. As long as the wax in the injection port is in a paste state, it continues to transmit pressure. These types of pressure data can be used to determine the onset of gate freezing, a property than can then be used to effectively determine the shortest dwell time for that injection port. Pressure data were found to have a high degree of reproducibility. Data on pressure can also be used to determine appropriate dimensions for the injection port such that it will not freeze prematurely.
(a)
0
50
100
150
200
250
25
30
35
40
45
50
0 50 100 150 200
oC
]
Time [s] (b)
25
30
35
40
45
50
1
5
9
13
17
21
0 30 60 90 120 150 180
Temperature
Pressure
Pre
ssur
e [a
tm]
Time [s]
Tem
pera
ture
[o C
]
Fig. 4.3. Evolution in time of the temperature in the injection port (thermocouple T9) and the pressure in the wax pattern (pressure transducer P1) for (a) liquid injection and (b) paste injection.
4.1.2 Numerical Simulations of Wax-Die Interaction and Wax Shrinkage An interface heat transfer coefficient of 250 W/m2K between the wax and die was used based on preliminary estimations from experimental data. The temperature of the pattern die was taken to be 28°C. A constant heat transfer coefficient of 4.18 W/m2K was used for the heat transfer coefficient between the wax and the ambient after the pattern was removed from the die. The ambient temperature was taken to be 22°C. The wax injection phase, in which the die is filled with wax, was

14
not considered. The data for the bulk modulus is given in Sabau and Viswanathan (2002). For a Poisson ratio of 0.48, a hybrid-element, constant-pressure, eight-node thermally coupled brick, with trilinear displacement and temperature, designed for use with incompressible materials, was used in this study. The first numerical simulation was performed for the case in which the wax was considered to be a purely elastic material, its viscoelastic behavior being neglected. The second numerical simulation considered the viscoelastic properties of the wax. The comparison between the results of the two numerical simulations will be used to determine the applicability of (a) pure elastic models, which are readily available, and (b) viscoelastic models, which should be more appropriate for wax deformation problems but are not widely available. The evolution of the temperature field and the ensuing displacements with time were calculated for the cases with restraint (i.e., cores). Fig. 4.4 shows the temperature and displacement map for the restrained pattern for the case in which the wax is considered to be a purely elastic material, while Fig. 4.5 shows similar results for the viscoelastic material.
(a)
(b)
Fig. 4.4. Pure elastic case: (a) Temperature distribution (°C) and pattern distortion in the symmetry plane right after removal of the wax from the die and (b) top view of pattern distortion and length displacement (cm). Displacements are magnified 20 times.

15
The temperature and displacement distributions shown in Figs. 4.4 and 4.5 were taken immediately after the removal of the wax pattern from the die. In Figs. 4.4(a) and 4.5(a), the temperature distribution is shown for a vertical mid-plane cross section in the wax pattern right before the wax pattern is removed from the die. After cooling in the die for 180 s, a thin layer of solid wax about 2.5 mm thick forms on the surface of the pattern. Due to its low thermal diffusivity, the wax cools very slowly, with most of the wax still at the injection temperature. The maximum temperature in the wax decreases slowly from an initial value of 54°C to 45, 40, 35, 31, and 26°C approximately 25 min, 50 min, 1.2 h, 1.6 h, and 2.5 h after its removal from the die. Figs. 4.4(b) and 4.5(b) show the displacement along the length of the wax pattern. All displacements are relative to the die, and in the x-direction. Negative displacements indicate a contraction towards the injection port. Figs. 4.4(b) and 4.5(b) indicate that there is significant longitudinal contraction before the pattern is removed from the die. After removal from the die, the wax deformation is unconstrained, and the initial distortion due to the constraint from the die decreases with time. For the viscoelastic case, the core restraint has a significant effect on wax deformation and the pattern dimensions [Fig. 4.5(b)]. Conversely, core restraint does not have a large effect on the wax deformation in the pure elastic case [Fig. 4.4(b)]. The large deformation in the region adjacent to the injection port is only observed with the viscoelastic model.
(a)
(b)
Fig. 4.5. Viscoelastic case: (a) Temperature distribution (°C) and pattern distortion in the symmetry plane right after removal of the wax from the die and (b) top view of pattern distortion and length displacement (cm). Displacements are magnified 20 times.

16
Figs. 4.6 and 4.7 show the deformation of the wax pattern at a time of 3.5 h after the pattern has been removed from the die. For the pure elastic case (Fig. 4.6), the wax pattern relaxes completely, with geometrical features conforming with that of the die, with minimal distortion. In the viscoelastic case, the wax does not relax completely (Fig. 4.7), and residual distortion is evident. The effect of geometric restraint is most evident in step 5, which is only 0.7 cm thick. The distortion is much less significant in step 3, which is also restrained but is more than twice as thick as step 5. This is supported by industrial experience—i.e., thin sections are more affected by geometric restrictions since they cool faster and relax less than thicker sections as the wax has already hardened while in the die.
(a)
(b)
Fig. 4.6. Pure elastic case: Displacement distribution (cm) in the wax pattern (a) along the pattern length and (b) along the width of the pattern at 3.5 h after the pattern is removed from the die. Displacements are magnified 20 times.

17
(a)
(b)
Fig. 4.7. Viscoelastic case: Displacement distribution (cm) in the wax pattern (a) along the length and (b) along the width at 3.5 h after the pattern is removed from the die. Displacements are magnified 20 times.
The hole dimensions are indicated in Fig. 4.8. Table 4.1 indicates experimentally measured dimensions of the holes in steps 3 and 5 of the wax pattern. The measurements indicate that the hole in step 5 is more distorted than the hole in step 3. Also, experimental measurements indicate that the holes are elongated in the direction along the plate length rather than normal to the symmetry plane. Experimental measurement of the pattern width also indicates that the width of the pattern decreases in step 5 and that the width of step 4 is less than that of step 6. The details on wax pattern deformation that have been observed experimentally can also be seen in the numerical simulation results in Fig. 4.7.
Dx
1 2 3 4 5 6
Step index:
Dy
Fig. 4.8. Hole dimensions showing hole diameter measured along the length direction and across the width of the pattern, Dx and Dy, respectively.

18
Table 4.1. Experimental and numerical simulation results for hole diameters (mm) in steps 3 and 5
Diameter, step 3 Diameter, step 5
Measured Measured Dimension
Sample 1 Sample 2 Computed
Sample 1 Sample 2 Computed
Dx 12.638 12.592 12.523 12642 12.638 12.678
Dy 12.446 12.432 12.428 12.570 12.508 12.484
Dx = hole diameter measured along the length direction Dy = hole diameter measured across the width of the pattern
The change in pattern length was computed from the displacement data only for the numerical simulation of the viscoelastic case, since the effect of geometric restraint is not captured in the pure elastic model. The evolution of the shrinkage with time is shown in Fig. 4.9. In Fig. 4.9(a) the measured shrinkage is shown, while in Fig. 4.9(b), the numerical simulation results for the shrinkage are shown. The computed shrinkage and the measured shrinkage are 1.09 and 0.26%, respectively, 300 s after removal of the pattern from the die.
(a)
0.2
0.3
0.4
0.5
0.6
0.7
0 1800 3600 5400 7200 9000 10800 12600 14400
plate lengthstep 1 thicknessstep 3 thicknessSh
rink
age
[%]
Time [s](b)
0.91
1.01
1.11
1.21
1.31
1.41
1.51
1.61
1.71
0 1800 3600 5400 7200 9000 10800 12600 14400
plate lengthstep 1 thicknessstep 3 thickness
Shri
nkag
e [%
]
Time [s]
Fig. 4.9. Evolution in time of linear shrinkage of the wax pattern (a) measured and (b) computed from the viscoelastic data.
The mass of the wax pattern was measured to be 77.18 g. The theoretical mass of the sample at the instant of injection can be computed based on the density of the wax at the injection temperature and the volume of the die cavity. This theoretical mass of the sample was determined to be 73.22 g. The measured mass of the sample is larger than the theoretical mass due to the feeding of wax to compensate for shrinkage during the dwell period when pressure is applied at the injection port. Accordingly, one explanation for the large difference in the computed and measured values is that wax feeding during the dwell time was not considered in the numerical simulations. Since the wax is almost incompressible, the wax that is fed into the die during the dwell time must compensate for the shrinkage that takes place when the pattern is in the die.

19
4.2 Shell Mold Properties and Thermal Interaction for the Shell-Alloy System
Additional R&D focus was placed on one shell-alloy system—the fused-silica shell mold system.The experimental part of the program was conducted at ORNL and commercial foundries, where wax patterns were injected, molds were invested, and alloys were poured. It was very important to obtain accurate temperature data from actual castings, and significant effort was made to obtain temperature profiles in the shell mold. A model for thermal radiation within the shell mold was developed, and the thermal model was successfully validated using ProCAST. Since the fused silica shells had the lowest thermal expansion properties in the industry, the dewaxing phase including the coupling between wax-shell systems was neglected. This section discusses the heat transfer effects, such as thermal radiation due to the semi-transparent nature of the investment casting shells, consisting of fused silica backup coats and a zircon face coat. Shell deformation during the prefiring phase was neglected, since the fused silica has a very low thermal expansion property, approximately five times less than that of any other shell mold material, ensuring that shell deformation during the prefiring is minimal. Investment casting shells have a layered structure (Fig. 4.10). In general, shell systems contain the following types of substrates: face coats, intermediate coats, backup coats, and seal coats (Fig. 4.11). Each coat is generally made up of two layers, a slurry layer and a stucco layer, although the seal coat sometimes consists only of slurry. For this study, a zircon and fused silica shell system was selected (Table 4.2), and either three or five backup coats were used. Based on the microstructure shown in Fig. 4.10, we consider each shell coat to be a packed bed of sintered ceramic particles of different sizes and shapes. The thermophysical properties for the shell molds considered, including thermal conductivity and emissivity, are provided in Appendix B.
(a) (b)
Fig. 4.10. Micrographs of various layers of the shell cross-section shown at different magnifications. Drawn scale is (a) 300 and (b) 150 µm.

20
����������
����� ���������
������������
���������
�
�
�
�
��
����
����� �����
Fig. 4.11. Sketch of typical shell structure.
Table 4.2. Shell system selected for this study
Shell coat Stucco material Stucco size Flour material Flour size
Face Zircon GFN 110 Zircon 50% 200 mesh and 50% 325 mesh
Intermediate Fused silica -50 +100 mesh Fused silica 120 mesh
Backup Fused silica -30 +50 mesh Fused silica 120 mesh
Seal — — Fused silica 120 mesh
Note: Slurry was colloidal silica for all coats.
4.2.1 Experimental Data for Shell Molds The casting configuration considered in this study contained a downsprue, a runner, and two plate castings (Fig. 4.12). The mold was air-cooled. The natural convection of air around the shell mold, thermal radiation within the shell, and thermal radiation from shell surfaces were the dominant heat-transfer mechanisms associated with the mold. Unlike in other casting processes, the outer surface of the mold mimicked closely the shape of the casting, providing different levels of restriction of the airflow to mold surfaces. Natural convection and thermal radiation were also affected by the final arrangement of many parts into a tree or cluster as some surfaces became close to other surfaces.
(a) (b)
Fig. 4.12. (a) Wax pattern assembly showing casting configuration and (b) pouring of aluminum A356 alloy. The mold was placed on a firebrick and supported by two firebricks on its sides.

21
In the casting experiments, the casting tree was supported on its sides by firebricks as shown in Fig. 4.12 and in a representation shown in Fig. 4.13. The two bricks reduced the air flow on the lower part of the plate, sprue, and runner. The space between plates was a closed channel, while the space between first plate and sprue was partially open on the sprue side, as the width of the sprue was less than that of the plate. Due to these geometrical differences, it was expected that cooling conditions for the first plate would have been different than those for the second plate. Until the present study, these geometrical considerations had not been addressed in any study on investment casting. In a casting tree, the path of airflow could be restricted by new surface configurations, such as closed channels created by proximity to other parts (Fig. 4.14). The end of the casting tree is fully open to airflow. At the other tree end, near by the riser/sprue, the airflow is obstructed by the sprue. The cooling of the casting surface near the sprue is less effective than the cooling of the surface at the end of the casting tree. Thus, different heat transfer coefficients must be assigned according to the proximity of other surfaces or the lack thereof.
(a) (b)
Fig. 4.13. Schematic of casting arrangement showing mold support: (a) The mold rests on a brick, supported by two bricks on each side, and the end of the casting tree is fully open to airflow; (b) the sprue/riser is close to the first casting part.
Key:
Surfaces facing other surfaces
Surface at end of cluster
Surface facing the riser
Open surface
Fig. 4.14. Surface configuration showing amount of air flow restriction, which affects cooling.

22
In order to obtain temperature measurements in shell molds and castings, thermocouples were inserted in the shell and the center of the plates as indicated in Fig. 4.15 (b) and (c). Ungrounded stainless steel sheathed thermocouples, 0.032 in. (0.081cm) thick, were embedded in the shell during shell investment. The larger gauge wire was used in this study since the 0.01 in. (0.025cm) gauge thermocouple wires, which were used in previous study, were too fragile to survive the shell investment process. In order to minimize conduction losses from the thermocouple wires to the ambient, the thermocouples were embedded in the shell mold over a significant length (Fig. 4.15) and were insulated outside the mold using braided ceramic sheathing.
(a)
(b)
��������������� ���������
������������
���������
�����
�����
�� ��� ���
(c)
�
�����
�� �� (d)
Fig. 4.15. Sketch showing thermocouple placement (a) in first plate and shell (b) in second plate, and (c) in shell. (d) Photo of thermocouple S11.
One casting from Precision Casting of Tennessee, Inc. (PCT), and two castings from the ORNL foundry were considered (see Table 4.3). Photos were taken during pouring (see Fig. 4.12) to document the inlet area of the metal stream in the pouring cup and the metallostatic head of the metal, i.e., from the ladle to the pouring cup surface. The pouring area was initially estimated to be 1.3 × 1.3 cm (0.5 × 0.5 in.). For the PCT castings, two operators used a larger ladle, keeping the metallostatic head and the pouring cup constant during filling. The filling velocity for the PCT castings was estimated to be 12.7 cm/s (5 in./s). For ORNL castings, the operator lowered the ladle during pouring, increasing the filling area. The inlet velocity based on the filling time, filling area, and casting volume was estimated to vary as follows:
Inlet velocity Time (s) cm/s in./s 0 10.1 4 2 12.2 4.8 2.5 13.7 5.4 5 20.3 8

23
The pouring temperature was estimated from a thermocouple placed in the sprue. The filling time was estimated from videotape recordings of the casting process. The casting conditions are shown in Table 4.3. The shell thickness was measured for each of the molds after casting (Table 4.4). The shell mold was destroyed to identify the thermocouple location. Table 4.5 shows the heat transfer coefficient (HTC) types used for the casting configurations considered. The relationships used to estimate these heat transfer coefficients are shown in Appendix C.
Table 4.3. Casting conditions for shell mold experiments
Case
Pouring temp. °C (°F)
Prefiring furnace °C (°F)
Prefiring time (min)
Shell temp.* °C (°F)
Holding time (min)
Holding furnace °C (°F)
Shell in ambient
(s)
Filling time (s)
PCT1 680 (1255) 900 (1650) 60 450 (840) 90 900–630 (1650–1165)
130 8
OR1 680 (1255) 975 (1800) 45 430 (800) 15 400 (750) 36 5
OR2 670 (1240) 975 (1800) 45 412 (770) 15 400 (750) 29 5
* Average shell temperature at pouring.
Table 4.4. Measurement of shell thickness and thermocouple location
Shell thickness (mm)
Thermocouple distance from casting interface
(mm) Case
Min Max Av Bulge* S11 S12 S21
PCT1 6.9 8.2 7.4 9.5 0.9 4.1 1.3
OR1 6.4 8.2 7.2 8.7 2.6 3.1 1.0
OR2 6.6 7.7 7.2 8.6 1.1 2.9 1.1
*Bulge = shell thickness in regions where two thermocouples were embedded.
Table 4.5. Heat transfer coefficients used in numerical simulations
Symbol Interface Mold region Comments
hms Mold – support Direct contact between the mold and other supporting materials
Where the casting rests or is supported (i.e., sand, side bricks)
hsa Mold – air Sprue —
hcao
Mold – air Surfaces within the cluster Surfaces fully open to air flow (i.e., narrow plate surfaces)
hcaop
Mold – air Surfaces within the cluster facing other cluster surfaces
Surfaces partially open to air flow (i.e., between plates)
omah Mold – air At the end of cluster Plate surface at the end of cluster, fully
open to air flow
opmah Mold – air At the end of cluster Plate surface facing the sprue, partially
open to air flow

24
4.2.2 Numerical Simulation Results for Temperature Distribution in the Shell-Alloy System
Numerical simulations were conducted for conditions similar to those of the experiments. The casting parameters, material properties, and boundary conditions were computed based on equations from the previous sections. The mesh was created using the Shelling feature in MeshCAST, a module in ProCAST. One mesh layer (0.026 in., 0.66 mm) was used for the zircon face coat, another layer (0.036 in., 0.9 mm) was used for the intermediate fused silica coat, and three layers (0.048 in., 1.2 mm each) were used for the fused silica backup coat. In order to account for the shell bulge in the center of the plates, where thermocouples were embedded, a patch of different shell thickness was created using MeshCAST. Initially, the value for the heat transfer coefficient at the mold-metal interface, hmm, was based on recommendations made by Woodbury, Woolley, and Piwonka (2003).
Preliminary calculations were conducted to assess the effect of the hmm on the shell temperature, and a value of 850 W/m2 K was found to be appropriate (Table 4.6). This value was close to that determined by Woodbury, Woolley, and Piwonka. In the remainder of this report, the time origin for all figures is at the onset of metal pouring. The shell molds at the ORNL foundry have a more uniform temperature than those at the PCT foundry. In order to isolate the effect of the nonuniform shell mold temperature, the first series of simulations were conducted for the ORNL castings. During preliminary calculations, it was found that the heat transfer coefficient between shell mold and supporting materials, hms , was an important variable. As shown in Fig. 4.16, the last region to solidify in the ORNL castings was shown to be influenced by the choice of hms . For a high value of hms , the last region to solidify was located in the upper regions of the plates, while for a low value, the last region to solidify was in the lower regions of the plate. To identify which regions were the last to solidify, the castings were cut through their vertical symmetry plane. As evidenced by Fig. 4.17, the last regions to solidify were located right in the center of the casting. This information was used in estimating the useful range of values for msh .
The correlations shown in previous sections for natural convection were applied for the investment casting process. Equations C.4–C.6, Appendix C, were used to give the heat transfer coefficient dependence on the surface dimensions. Preliminary calculations were performed with the same heat transfer coefficient, 17 W/m2 K, on all shell surfaces. The results, shown in Fig. 4.18, indicated that the temperature in the sprue was not accurately predicted. When a heat transfer coefficient of 34 W/m2 K was used for the sprue surface, corresponding to its characteristic dimension (1 in. or 2.54 cm), the accuracy of temperature predictions was greatly improved. The recommendation from the results shown in Fig. 4.18 was to calculate the heat transfer coefficient values for each surface based on characteristic surface dimension. Further computational results showed that hsa =38 W/m2 K was found to yield the best results for the sprue temperature.
Table 4.6. Heat transfer coefficients held constant in numerical simulations
Symbol Interface Region Value
(W/m2 K)
mmh Metal - mold - 850
rah Metal – air Top of riser/sprue 30

25
(a) (b)
Fig. 4.16. Solid fraction profile for two cases: (a) msh = 840 W/m2 K and (b) msh = 8.40
W/m2 K, showing the last region to solidify in casting.
(a) (b)
Fig. 4.17. Micrograph showing the concentration of porosity in the center of the plates from (a) PCT and (b) ORNL.
���
���
���
���
���
���
�� ��� ��� ���� ���� ���� ���� ���
����������
���
���
���
� �
�����������������
��
��������
(1,290)
(1,200)
(1,110)
(1,020)
(930)
(840)
(oF) Fig. 4.18. Temperature at a location in the center of the sprue for ORNL castings.
For the two-plate configuration considered, the airflow pattern for the region between the plates should have been different from that for a plate fully open to air flow. Therefore, the heat transfer coefficient had to be adjusted accordingly. The parameters for the cases considered are shown in Table 4.7. In the OR1 case, no distinction was made between cooling conditions on plate surfaces facing the sprue, between the plates, and facing the ambient (i.e., the surface at the end of the casting

26
tree). The results obtained for OR1 are shown in Fig. 4.19(a). The OR1 results showed that there was no distinction between the cooling curves in the plate centers, unlike the experimental observation. In the OR2 case, a heat transfer coefficient was computed using the formulas for the natural convection between two plates 3 in. (7.62 cm) in length separated by an air gap of 2 in. (5 cm). The results were similar to those from the OR1 case—i.e., the center plate temperatures were almost the same. However, the predicted temperatures were closer to the C2 temperature.
Table 4.7. Values of heat transfer coefficients (W/m2 K) used for different ORNL cases
Case ID msh hsa hcao
hcaop
omah
opmah
Natural convection effects
OR1 21 38 38 12.5 12.5 12.5
OR2 21 38 38 17 12.5 12.5 Between the plates
OR3 21 38 38 17 12.5 4.2 Include restrictive airflow effects of sprue
(a)
���
���
���
���
���
�� ��� ��� ��� ��� ��� ��� ���
�������
������
�������
������
�������
������
�����������
���
��������
(1,290)
(1,200)
(1,110)
(1,020)
(930)
(oF) (b)
���
���
���
���
���
�� ��� ��� ��� ��� ��� ��� ���
�������
������
�������
������
�������
������
�����������
���
��������
(1,290)
(1,200)
(1,110)
(1,020)
(930)
(oF)
Fig. 4.19. Temperature in the center of the plates for (a) OR1 case and (b) OR2 case. C1 indicates the center of the plate close to the sprue.
For the two-plate configuration considered, the airflow pattern should had been different for the plate surface facing the sprue from the pattern for the plate surface at the end of cluster, which faced the ambient, since the sprue obstructed the flow of air. Thus, the surface of the second plate at the end of the cluster was cooled more than the surface of the first plate facing the sprue. In case OR3, a lower heat transfer coefficient was used on the plate surface facing the sprue. The agreement for casting temperatures was excellent (Fig. 4.20). For the shell mold, the temperature also showed a good agreement.

27
(a)
���
���
���
���
���
�� ��� ��� ��� ��� ��� ��� ���
�������
������
�������
������
�������
������
�����������
���
��������
(1,290)
(1,200)
(1,110)
(1,020)
(930)
(oF)
(b)
���
���
���
���
���
���
� ��� ��� ��� ��� ��� ��� ���
�������
������
������
������
�������
������
�����������
���
��������
(1,110)
(1,020)
(930)
(840)
(750)
(660)
(oF)
Fig. 4.20. Temperature for OR3 case (a) in the center of the plates, and (b) in the shell. The next series of simulations were conducted for the PCT castings. The shell molds from the PCT foundry had a less uniform temperature than those from the ORNL foundry due to their different temperature schedule before pouring. Unlike the ORNL molds, the PCT shell molds were held in the furnace after sintering, and the furnace was allowed to cool for a long time. It was thus expected that the amount of sintering during firing was different at the two foundries. In addition, the average shell thicknesses of the two foundry products were slightly different, and in the case of the PCT shell mold, the shell bulge, where thermocouples were placed, was larger. For the sake of simplicity, the same mesh was used for the PCT case. Thus, the same shell thickness, including in the region where thermocouple were embedded in the shell, was used for the PCT simulations. Three cases were considered for the PCT simulations (Sabau 2005) (Table 4.8). In order to decrease the solidification time in the second plate, we had to increase the heat transfer coefficient on the
casting tree end, omah , in the third numerical simulation case, PC3, from 12.5 to 21 W/m2 K (Fig.
4.21). Looking back at the experimental conditions at PCT, we noted that fans were used on the plant floor to enhance cooling conditions. The enhanced cooling conditions at PCT supported the use of
higher values for omah , which were found to be required for accurate temperature predictions.
Table 4.8. Heat transfer coefficients (W/m2 K) and parameters for the thermal conductivity of the shell used for PCT cases
Case ID msh hsa hcao
hcaop
omah
opmah ak bk
PC1 21 17 17 4.2 3.4 0.8 0.85 6.25E-10
PC2 21 38 38 17 12.5 4.2 0.39 2.9E-10
PC3 21 38 38 17 21 4.2 0.39 2.9E-10

28
(a)
���
���
���
���
���
� ��� ��� ��� ��� ��� ��� ��� ��
��������
������
��������
������
��������
������
�����������
���
��������
(1,290)
(1,200)
(1,110)
(1,020)
(930)
(oF) (b)
���
���
���
���
���
���
� ��� ��� ��� ��� ��� ��� ��� ��
� �������
������
� �������
������� �������
�����������������
���
��������
(1,110)
(1,020)
(930)
(840)
(750)
(660)
(oF)
Fig. 4.21. Temperature for PC3 case (a) in the center of the plates and (b) in the shell. Numerical simulations are an important tool for process analysis and are increasingly used in the investment casting industry. In order to obtain data for a specific foundry, combined experimental and computational programs must take place. The experimental program should be concentrated on measuring material properties. This program should be relatively small, since it can be carried out only once for each type of shell mold. The properties for alloy systems are much more available than those for the shell materials, since they were likely to be measured for other material-processing applications. For a shell system, the property data for the mold can be used for castings of any geometry. Based on the results presented in previous sections, the following recommendations were made for the use of numerical simulation in the investment casting process: To determine properties and dimensions for the shell mold:
• Measure shell emissivity using infrared techniques. • Measure thermal diffusivity of shell molds at room temperature using the laser flash
technique. Account for thermal radiation within the shell mold using the following correlation for thermal conductivity: k(T) = ak + bk T3 .
• Measure shell thickness. • Compute heat transfer coefficients using correlations for natural convection. • Conduct calculations according to well-known relationships for natural convection based on
each surface dimension and orientation with respect to the vertical direction. • Use existing HTC correlations for casting surfaces fully open to ambient airflow and for
surfaces within the casting tree, i.e., surfaces facing surfaces from adjacent parts. • For other surfaces partially open to airflow, adjust heat transfer coefficients, since no
correlations are available for the actual geometrical configuration. • Use a heat transfer coefficient of approximately 800–2800 W/m2 K for the metal-mold
interface (for shell molds with a zircon prime coat). • Mesh the shell using at least four- or five-grid spacing across its thickness. • Determine the temperature distribution in the mold, in cases when shell is held out of the
furnace for a long time before pouring. At the time of metal pouring, the mold has a nonuniform temperature as the shell mold cools after it has been taken out of the furnace. The nonuniform temperature distribution of the mold can be obtained by performing numerical simulations of the heat transfer within the shell mold and hot air that fills it.
The following recommendations were made for measuring the shell temperature for the investment casting process:

29
• Use ungrounded 0.032-in.- (0.081-cm-) gauge thermocouples. These thermocouples can withstand the shell investment process, while providing a small response time of approximately 0.3 s.
• Embed the thermocouples in the shell molds at least 0.5–1 in (1.2–2.5 cm) in order to minimize conduction losses through the wires.
• Use small-gauge thermocouple wire [0.01 in. (0.025cm)] only when a very small response time is required of the thermocouple. These wires showed a high failure rate (50%) during shell investment.
With respect to computer software for the investment casting process, we found that a significant amount of time was required to set up the heat transfer coefficients on different casting surfaces. The setup of numerical simulations could be easily simplified if surfaces can be automatically grouped according to their dimensions, orientations, and amount of obstruction to natural convection. Each surface group could then be assigned a heat transfer coefficient. It was demonstrated in this study that accurate computational results were obtained when heat transfer coefficients at mold surfaces were assigned on the basis of first-principle theories of natural convection. The heat transfer conditions at each mold surface depended on the surface length scale and surface position in the casting tree. Assignment of heat transfer conditions based on first principles eliminated the guesswork in conducting numerical simulations, increased the accuracy of the results, and reduced time required to obtain process recommendations.
4.3 Alloy Properties and Mechanical Interaction for the Shell-Alloy System
Alloy dimensions were obtained by numerical simulation only with the coupled shell-alloy system. The prefiring of the empty shell mold was considered in the model, and the shell mold was limited to a pure elastic material. The alloy dimensions were in excellent quantitative agreement with experimental data, validating the deformation module. However, for actual parts the creep properties of the shell molds must also be obtained, modeled, and validated. The critical properties of the alloy, which need to be considered for computing the final part dimensions, were reviewed by Sabau and Viswanathan (2002). For permanent mold castings, Bellet et al. (1996) found that the combined effect of thermoelastic, plastic, and creep-induced strain-stress fields must be considered in order to predict the final shape. Section 4.3 is concerned with determining the alloy tooling allowances from a combined analysis of heat transfer and deformation of the casting process. This study was performed for the aluminum alloy A356. The shell molds were made of fused silica with a zircon prime coat, as shown in previous sections. The wax patterns were invested at Minco, Inc., and casting experiments were conducted at Precision Metalsmiths, Inc. (PMI).
4.3.1 Experimental Results for Alloy Deformation The casting configuration considered in this study contains a downsprue, a runner, and one casting (Fig. 4.22). The sprue was dimensioned such that there was enough metallostatic head to fill the entire part. The height of the downspure and pouring cup is 17cm and 6.35cm, respectively. The section dimensions for the pouring cup were 6.35 × 6.35, 2.54 × 2.54, and 2.54 × 1.9 cm at the top of pouring cup, end of pouring cup, and end of sprue, respectively.

30
(a) (b) (c)
Fig. 4.22. Shell molds invested at Minco and cast at PMI: (a) wax pattern; (b) shell mold; (c) aluminum casting.
The dimensions of the die tool, wax patterns, and casting were measured at the same locations using a coordinate measurement machine (CMM). Wax pattern dimensions were measured to provide a baseline for casting dimensions. The positions of CMM measurement points are shown in Fig. 4.23(a). The width shrinkage was calculated from the width coordinates for each pair of points, which were located at the same length and height but situated at opposite sides of the pattern. A representative length dimension was chosen to be L2-5, between the ends of Steps 2 and 5. Four no-hole patterns and four two-hole patterns were injected. Since the wax pattern showed good reproducibility, only two castings were made for each case. The parts were labeled as shown in Table 4.9. The dimensional variations were calculated using the following relationships:
Wax Shrinkage = Pattern Dimensions – Die Dimensions Alloy Shrinkage = Casting Dimensions – Pattern Dimensions Casting Shrinkage = Pattern Dimensions – Casting Dimensions
(a) (b)
Fig. 4.23. The position of coordinate measurement points for (a) the width dimensions and (b) length L2–5, between ends of Steps 2 and 5.

31
Table 4.9. Index of wax patterns and castings
Part index No. of holes in part Part no.
0a1 — 1
0a2 — 2
2a1 2 1
2a2 2 2
The shrinkage of L2–5 was calculated by subtracting the length coordinate of points on Step 5 from that of corresponding points on Step 2. The percentage of the shrinkage was calculated for all examined dimensional variations, and the results are shown in Figs. 4.24 and 4.25. The width shrinkage was nonlinear along pattern length in all cases. There was a high degree of reproducibility for the wax patterns. The only difference between the dimensions of the unrestrained pattern and restrained pattern was observed at Step 3, where the longest hole was made for the restrained pattern. The lowest wax shrinkage was observed at Step 5, where the smallest hole was made. For the L2–5 dimension, the shrinkage of the wax pattern had approximately the same values for both restrained and unrestrained patterns, although the unrestrained pattern showed larger scatter in shrinkage. The points with a zero width coordinate were located on the symmetry plane of the patterns. Smaller shrinkage was measured in the symmetry plane of the patterns for the restrained pattern. As indicated in Fig. 4.25(b), for the case of overall casting shrinkage, the unrestrained parts shrink more than the unrestrained ones. The same was observed for the alloy dimension as well. For the L2–5 dimension, the shrinkage of the wax pattern had approximately the same values for both restrained and unrestrained patterns, although the unrestrained pattern showed larger scatter in shrinkage. The points with a zero width coordinate were located on the symmetry plane of the patterns. Smaller shrinkage was measured in the symmetry plane of the patterns for the restrained pattern. As indicated in Fig. 4.25(b), for the case of overall casting shrinkage, the unrestrained parts shrink more than the unrestrained ones. The same was observed for the alloy dimension as well.

32
(a)
���
���
���
���
���
���
� �� � � �� ��� ��� �� ��
�� �
�� �
�� �
�� �
������������ �����������
��������
(b)
���
���
���
���
���
�
� � � � �� �� �
�� � ��������� � ��������� � ���������� � ��������
������������ ����������������
�������� (c)
���
���
���
���
���
�
� �� �� � �� ��� ��� ��� ��
��� �
��� �
��� �
��� �
�������������� ��������������
��������
Fig. 4.24. Width dimension shrinkage factors: (a) ws; (b) cs; (c) as.
(a)
0.5
0.55
0.6
0.65
0.7
0.75
0.8
0 3.75 7.5 11.25 15
L5_2; 0a1 [%]
L5_2; 0a2 [%]
L5_2; 2a1 [%]
L5_2; 2a2 [%]
��������� ��������������
������
WIDTH (mm)
(b)
1
1.2
1.4
1.6
1.8
2
0 3.75 7.5 11.25 15
L5_2; 0a1 m [%]L5_2; 0a2 m [%]
L5_2; 2a1 m [%]L5_2; 2a2 m [%]
�������������� ���������������
WIDTH (mm) (c)
0.5
0.7
0.9
1.1
1.3
1.5
0 3.75 7.5 11.25 15
L5_2; 0a1 w [%]L5_2; 0a2 w [%]
L5_2; 2a1 w [%]L5_2; 2a2 w [%]
������������� ��������������
�����������
WIDTH (mm)
Fig. 4.25. Shrinkage factors for the length dimension, L2–5: (a) ws; (b) cs; (c) as.

33
4.3.2 Numerical Simulation Results for Casting Dimensions Numerical simulations of heat transfer, solidification, and deformation during casting and subsequent cooling were conducted with ProCAST (Waite and Samonds, 1990) using the casting parameters, material properties, and boundary conditions given in the previous sections and in Sabau (2005). The mesh was created using the shelling feature in MeshCAST, a module of ProCAST (Fig. 4.26). Table 4.10 shows following cases considered in the numerical simulations. Thermomechanical models developed by Bellet et al. (1996) and Kim, Sakuta, and Suzuki (1991) were used to study the effect of mold rigidity and alloy rigidity point on alloy shrinkage factors. Different cases considered for numerical simulations are shown in Table 4.10. The packing point, fpk,
(a) (b) (c)
Fig. 4.26. Casting configuration for numerical simulations: (a) alloy material, and shell mold around the part; (b) part without cores, having unrestrained deformation; (c) part with cores, with length and width dimensions are partially constrained by cores.
Table 4.10. Cases considered in numerical simulations
Index case no-hole part
Index case two-hole part
Thermomechanical properties reference
fpk (%) Shell mold
1-0h 1-2h Bellet et al. 1996 90 Rigid
2-0h 2-2h Kim, Sakuta, and Suzuki 1991 90 Rigid
3-0h 3-2h Kim, Sakuta, and Suzuki 1991 70 Rigid
4-0h 4-2h Kim, Sakuta, and Suzuki 1991 90 Elastic
5-0h 5-2h Kim, Sakuta, and Suzuki 1991 70 Elastic

34
is considered to be the point at which the stress calculations started in ProCAST. For fS < fpk liquid regions were taken into account, while for fS ≥ fpk, the solid models were used in numerical simulation (see Appendix D, Tables D.3 and D.4). When the shell mold was considered to be a linear-elastic material, the Young’s modulus of 2586 MPa that was provided by Minco was used for numerical simulation (J. D. Snow, personal communication, 2004). The numerical simulation results for the alloy shrinkage are shown in Figs. 4.27 and 4.28 for the length and width dimensions, respectively. As shown in Figs. 4.27(a), 4.27(c), 4.28(a), and 4.28(c), the results for the two thermomechanical models were close to each other for all dimensions measured in the cases 1-0h, 2-0h, 1-2h, and 2-2h, irrespective of mold restraints. Thus, in the remainder of this study, results were presented only for the Kim’s model. The measured dimensions were grouped according to the level of mold constraints. The unrestrained-dimension groups include the length L2–5 for the no-hole pattern, and width, W, for the no-hole pattern and two-hole pattern. The length L2–5 for the two-hole pattern was restrained by the shell mold. For a rigid mold and fpk = 90%, the shrinkage factors were well predicted for unrestrained dimensions but underpredicted for restrained dimensions (cases 2-0h and 2-2h). In an attempt to obtain higher shrinkage, the fpk was lowered to 70% and cases 3-0h and 3-2h were simulated. As fpk was lowered to 70%, the model allowed for an increased deformation of the alloy in the mushy zone due thermal expansion behavior and low stiffness. For a rigid mold and fpk = 70%, the shrinkage factors, SF, were overpredicted in the case of unrestrained dimensions and underpredicted
(a)
0.75
1
1.25
1.5
1.75
0 3.75 7.5 11.25 15
exp 1-0hexp 2-2hcase 1-0hcase 2-0hcase 3-0h
��������������� ��������
WIDTH (mm) (b)
0.75
1
1.25
1.5
1.75
0 3.75 7.5 11.25 15
exp 1-0hexp 2-0hcase 4-0hcase 5-0h
�� �������� ��������������
WIDTH (mm)
(a)
0
0.25
0.5
0.75
1
1.25
0 3.75 7.5 11.25 15
exp 1-2hexp 2-2h
case 1-2hcase 2-2h
case 3-2h
�� �������� ��������������
WIDTH (mm) (b)
0
0.25
0.5
0.75
1
1.25
0 3.75 7.5 11.25 15
exp 1-2hexp 2-2hcase 4-2hcase 5-2h
�� �������� ��������������
WIDTH (mm)
Fig. 4.27. Comparison between the experimental results and computed results for the length dimension L2-5: (a-b) part with no holes; (c-d) part with two holes.

35
(a)
0.5
0.8
1.1
1.4
1.7
2
0 25 50 75 100 125 150
exp 1-0hexp 2-0hcase 1-0hcase 2-0hcase 3-0h
����������
���� ��������������
Length (mm) (b)
0.5
0.8
1.1
1.4
1.7
2
0 25 50 75 100 125 150
exp 1-0hexp 2-0h
case 4-0hcase 5-0h
����������
���� ��������������
Length (mm)
(a)
0.5
0.8
1.1
1.4
1.7
2
0 25 50 75 100 125 150
exp 1-2hexp 2-2hcase 1-2hcase 2-2hcase 3-2h
����������
���� ��������������
Length (mm) (b)
0.5
0.8
1.1
1.4
1.7
2
0 25 50 75 100 125 150
exp 1-2hexp 2-2h
case 4-2hcase 5-2h
����������
���� ��������������
Length (mm)
Fig. 4.28. Comparison between experimental and computed shrinkage factors for the width dimension as a function of length: (a-b) part with no holes; (c-d) part with two holes.
for restrained dimensions. The fact that shrinkage factors for unrestrained dimensions were overpredicted indicated that unrealistic deformations were introduced in the model. For an elastic mold and fpk = 90%, the shrinkage factors were well predicted for both the unrestrained dimensions and restrained dimensions (cases 4-0h and 4-2h). In the case of fpk = 70% (cases 5-0h and 5-2h), the shrinkage factors assuming elastic mold were overpredicted for the unrestrained dimensions, results which were consistent with those for the rigid mold case (cases 3-0h and 3-2h). Comparison of the experimental and numerical simulations results indicate that the best results were obtained for the fourth case, in which an elastic mold and fpk = 90% were considered (Table 4.11).
Table 4.11. Summary of numerical simulation results for casting dimensions
Unrestrained dimensions
fpk (%) Mold type
L2-5 (no holes)
W (no holes)
W (2 holes)
Restrained dimensions
L2-5 (2 holes) Agreement
90 Rigid X X X –
70 Rigid + + + −
90 Elastic X X X X X
70 Elastic + + + X
Key: − underpredicted + overpredicted X good agreement
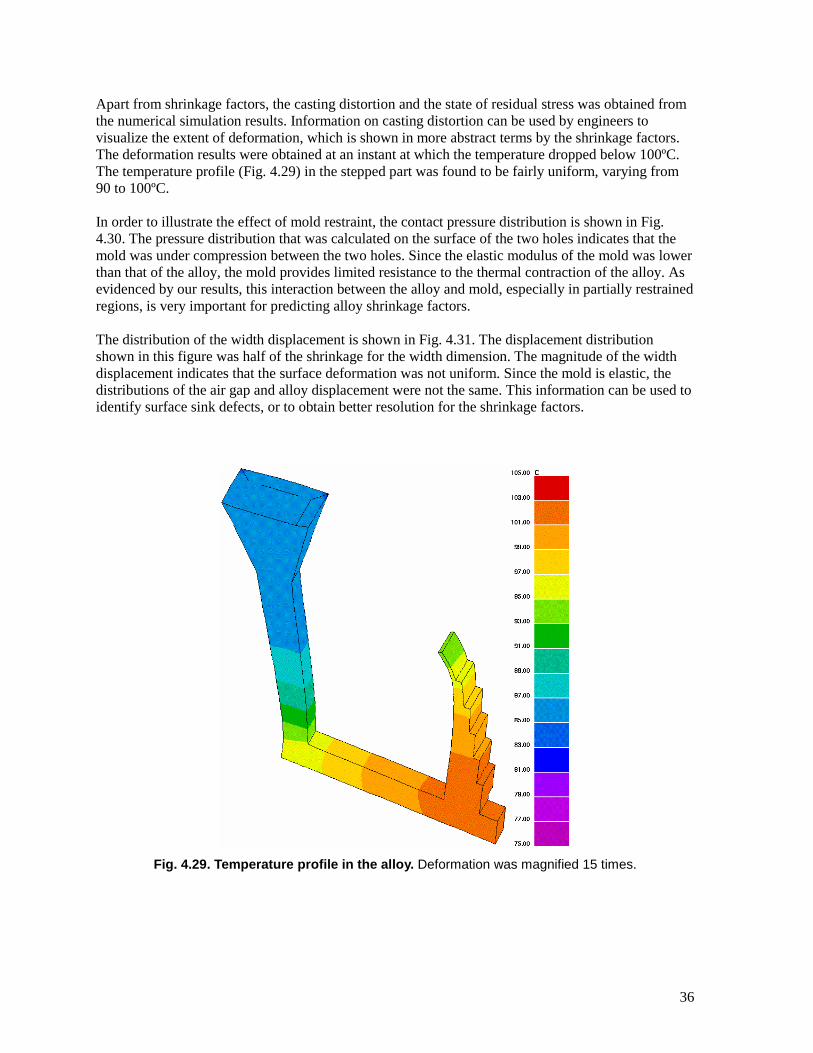
36
Apart from shrinkage factors, the casting distortion and the state of residual stress was obtained from the numerical simulation results. Information on casting distortion can be used by engineers to visualize the extent of deformation, which is shown in more abstract terms by the shrinkage factors. The deformation results were obtained at an instant at which the temperature dropped below 100ºC. The temperature profile (Fig. 4.29) in the stepped part was found to be fairly uniform, varying from 90 to 100ºC. In order to illustrate the effect of mold restraint, the contact pressure distribution is shown in Fig. 4.30. The pressure distribution that was calculated on the surface of the two holes indicates that the mold was under compression between the two holes. Since the elastic modulus of the mold was lower than that of the alloy, the mold provides limited resistance to the thermal contraction of the alloy. As evidenced by our results, this interaction between the alloy and mold, especially in partially restrained regions, is very important for predicting alloy shrinkage factors. The distribution of the width displacement is shown in Fig. 4.31. The displacement distribution shown in this figure was half of the shrinkage for the width dimension. The magnitude of the width displacement indicates that the surface deformation was not uniform. Since the mold is elastic, the distributions of the air gap and alloy displacement were not the same. This information can be used to identify surface sink defects, or to obtain better resolution for the shrinkage factors.
Fig. 4.29. Temperature profile in the alloy. Deformation was magnified 15 times.

37
Fig. 4.30. Contact pressure due to mold restraint. Deformation was magnified 15 times.
(a) (b)
Fig. 4.31. Displacement distribution (cm) for (a) no-hole casting, and (b) two hole-casting. Deformation was magnified 15 times.

38
The experimental and computational study of alloy shrinkage factors for the investment casting process were carried out for parts that have unrestrained dimensions and parts whose dimensions were restrained by cores. The alloy deformations were predicted numerically by taking into account the thermomechanical properties of the alloy and shell mold materials. The measured dimensions were grouped according to the level of mold constraint. When the shell mold was considered to be a rigid body, the restrained dimensions were underpredicted, indicating that the rigidity of the ceramic mold was not high enough to prevent mold deformation. The solid fraction threshold, at which the transition occurred from the fluid dynamics to the solid dynamics, was found to be an important factor for predicting shrinkage factors. For the thermomechanical models considered, the shrinkage factors were well predicted for both the unrestrained dimensions and restrained dimensions when the solid fraction threshold was 90%. Results for casting distortion were also included. The alloy dimensions were determined from numerical simulation results of solidification, heat transfer, fluid dynamics, and deformation phenomena. The investment casting process was carried out using wax patterns, unfilled wax, and the shell molds that were made of fused silica with a zircon prime coat. Dimensions of the die tooling, the wax pattern, and the casting were measured in order to determine the actual tooling allowances. Several numerical simulations were carried out to assess the level of accuracy predicted for alloy shrinkage and casting dimensions. The solid fraction threshold, at which the transition from fluid dynamics to solid dynamics occurs, was found to be an important parameter for predicting shrinkage factors. It was found that accurate predictions were obtained for all measured dimensions when the shell mold was considered as a deformable material.

39
5. Accomplishments For convenience, a web site containing pertinent papers, reports and other information on this project has been established at http://www.ms.ornl.gov/mpg/sabau.htm.
5.1 Die-Wax
The thermomechanical properties of the wax were successfully measured for the first time, identifying test procedures, test sample geometry, and equipment. A complete set of property data for waxes was obtained for use in computer simulation software. A paper on wax testing standards was presented to the industry trade association, Investment Casting Institute, to incorporate our recommendations into the industry standards. This study pioneered the use of computer models to determine wax pattern dimensions by taking into account the thermophysical and rheological behavior of the wax. The following factors were considered in the analysis:
• the restraint due to geometrical features in the metal die; • process parameters such as dwell time, die/platen temperature, injection pressure and
injection temperature. The wax pattern dimensions were determined using a three-dimensional finite element model for coupled thermal and mechanical analysis developed within ABAQUS. It was found that models based on pure elastic materials did not predict wax pattern distortion. When wax was injected as a paste, wax pattern distortion can qualitatively be predicted using viscoelastic models that neglect wax feeding after complete filling.
5.2 Shell-Alloy System: Thermal Interaction
The emissivity of shell molds was determined experimentally using infrared measurements. Shell temperature was measured using different thermocouple arrangements. Fused silica shell molds are semitransparent materials, and a constitutive equation for thermal radiation within the mold was proposed. Thermophysical properties of the backup coats are very important, while those of the prime coat are secondary. The heat transfer module was validated against experimental results from castings at ORNL and a commercial foundry. It was demonstrated that accurate computational results were obtained when the heat transfer conditions at mold surfaces were assigned on the basis of first-principle theories of natural convection, as a function of the surface length-scale and surface position in the casting tree. The assignment of the heat transfer conditions based on first principles eliminated the guesswork in conducting numerical simulations, increased the accuracy of the results, and reduced the operator time required to obtain process recommendations.
5.3 Shell-Alloy System: Mechanical Interaction
The alloy deformation module was validated against experimental results from a commercial foundry. The alloy dimensions were determined from numerical simulation results of solidification, heat

40
transfer, fluid dynamics, and deformation phenomena. Several numerical simulations were carried out to assess the level of accuracy for the alloy shrinkage and casting dimensions. The solid fraction threshold, at which the transition from the fluid dynamics to the solid dynamics occurs, was found to be an important factor for predicting shrinkage factors. It was found that accurate predictions were obtained for all measured dimensions when the shell mold was considered as a deformable material.
5.4 Technology Transfer
Commercial adoption of the technologies developed in this program took place through the active participation of AFS, EMTEC, and the industrial partners participating in this proposal. The technologies developed during the project were transferred to the participating companies continually throughout the course of the program. Most of the property data and constitutive equations developed in this program were implemented in ProCAST, the leading casting simulation software for the investment casting industry, allowing immediate dissemination of the information to industry. Other commercial casting software, including Flow3D and software from EKK, Inc., were provided with the results of this study in order to increase the information dissemination to the industry. As a result of this work, ProCAST has already implemented a viscoelastic module. However, more work is needed to make the viscoelastic module applicable to industrial waxes and available to users.
5.5 Publications and Patents Resulting from Project
This project resulted in the following conference papers and archival journal articles reflecting results throughout the project: Sabau, A. S. 2005. “Alloy Shrinkage Factors for the Investment Casting Process,” paper accepted for
publication in Metallurgical and Materials Transactions.
Sabau, A. S. 2005. “Numerical Simulation of the Investment Casting Process,” Transactions of American Foundry Society, paper 05-160.
Sabau, A. S., and Viswanathan, S. 2003. “Temperature Measurements in Wax Patterns and Wax-Die Interfacial Heat Transfer Coefficients in Investment Casting,” Transactions of American Foundry Society, paper 03-026, Vol. 111, pp. 411–417.
Sabau, A. S., and Viswanathan, S. 2003. “Material Properties for Predicting Wax Pattern Dimensions in Investment Casting,” Materials Science & Engineering A, Vol. 362A, pp. 125–134.
Sabau, A. S., and Viswanathan, S. 2002. “Prediction of Wax Pattern Dimensions in Investment Casting,” Transactions of American Foundry Society, paper 02-103, Vol. 110, pp. 733–746.
Sabau, A. S., and Viswanathan, S. 2001. “Critical Material Properties for Predicting Pattern Tooling Dimensions in Investment Casting,” Transactions of American Foundry Society, Paper No. 01-017, pp. 1–18.
Sabau, A. S., and Viswanathan, S. 2001. “Numerical Simulation of Wax Pattern Dimensions in Investment Casting,” Proceedings of Computational Modeling of Materials, Minerals, and Metals Processing, 2001 Annual Fall TMS Meeting, San Diego, CA, Sept. 23–26, pp. 431–440.
Sabau, A. S., and Viswanathan, S. 2001. “Determining Wax Pattern Dimensions in Investment Casting Using Viscoelastic Models,” Investment Casting Institute 49th Annual Meeting, Orlando, FL, October 7–10, 2001, paper no. 3.
Sabau, A. S., and Viswanathan, S. 2000. “Material Properties for Predicting Wax Pattern Dimensions in Investmet Casting,” Investment Casting Institute 48th Annual Meeting, Dallas, TX, October 15–18, 2000, paper no. 4.

41
6. Conclusions In this project, material properties were successfully investigated for dimensional predictions of investment casting parts. In spite of their different properties, important contributions were made for each of the three materials involved in the investment casting process: waxes, ceramic molds, and alloys. The experimental part of the program was carried out mainly at participating companies. This study pioneered the use of computer models to determine wax pattern dimensions by taking into account the thermophysical and rheological behavior of the wax. Computer simulation results for wax deformation demonstrated the capability of viscoelastic models to consider the effect of geometrically restrained dimensions by cores or other part features. Although the viscoelastic model results were in qualitative agreement with experimental data, the shrinkage magnitude was overestimated by a factor of two. An analysis of experimental and computational data revealed that consideration of the wax feeding during the dwell time would increase the accuracy of dimensional predictions. The heat transfer module was validated against experimental data from multiple foundries for shell molds consisting of fused silica backup coats and a zircon face coat. Aside from considering thermal radiation within the shell, one important finding was to demonstrate that the natural convection theory provides accurate information on the heat transfer coefficients at the shell mold surface. The accomplishments on the heat transfer module laid solid groundwork for the combined stress-temperature simulations. The alloy deformation module was validated for aluminum alloy A356. The alloy deformations were predicted by taking into account the thermomechanical properties of the alloy and shell mold materials. The shrinkage factors were well predicted for both the unrestrained dimensions and restrained dimensions. These findings are very important for future investigations and for the enhancement of commercial investing casting software. Due to this work, the guesswork in estimating shrinkage factors would be eliminated, the accuracy of the results be increased, and the operator time required to obtain process recommendations would be reduced. The computer simulation software is mature enough to predict (a) qualitative shrinkage factors for wax patterns (b) quantitative temperature distribution, and (c) quantitative shrinkage factors for light cast alloys.


43
7. Recommendations Numerical simulations are becoming an important tool for process analysis in the investment casting industry. In order to obtain data for a specific foundry, combined experimental and computational programs must be instituted. The experimental program should concentrate on measuring material properties. The experimental program could be relatively small, since it could be carried only once for each type of wax and shell mold. The properties for alloy systems are much more available, since they were likely to be measured for other material processing applications. For a given wax, shell, and alloy system, the same property data can be used for castings of any geometry. Based on the results presented in previous sections, the following recommendations were made for the use of numerical simulation in the investment casting process.
7.1 Wax
Additional work must be performed in order to increase of accuracy of dimensional prediction from qualitative to quantitative. Without including wax feeding effects in computer models, the total shrinkage is overestimated by a factor of two. There is evidence that there was significant feeding of wax into the die, even after the die was filled up, which altered the shrinkage of wax patterns. It is believed that the wax is fed into the die during the dwell time to compensate for the shrinkage that takes place when the pattern is in the die (Sabau and Viswanathan 2002). Other phenomena must also be included in the wax module, such as viscous heating phenomena during filling in the delivery system; and constitutive models for liquid-paste transition must be developed when liquid wax is used. Current Lagrangian finite element models, such as the one implemented in ABAQUS, cannot deal with wax feeding effects; instead, Eulerian models, such as the one used in ProCAST, must be used.
7.2 Shell
Concerning the simulation software for the investment casting process, the setup of numerical simulations could be easily simplified if surfaces were automatically grouped according to their dimensions, orientations, and amount of obstruction to natural convection. To achieve this end, the following recommendations are made:
• Measure shell thermal diffusivity at room temperature. This can be done using laser flash technique. Shell mold properties may vary from foundry to foundry.
• Measure shell emissivity using infrared techniques. • Account for thermal radiation within the shell mold using the correlation for thermal
conductivity: k(T) = ak + bk T3.
• Measure the shell thickness. • Compute heat transfer coefficients for air convection according to well-known relationships
for natural convection based on the dimensions and orientation of each surface with respect to the vertical direction. For other surfaces partially open to air flow, the heat transfer coefficients need to be adjusted based on the actual geometrical configuration.
• Mesh the shell using at least four or five grid spacings across its thickness. • Before pouring, the shell has a nonuniform temperature as the shell mold cools down after it
has been taken out of the furnace. The magnitude of shell temperature nonuniformity increases with the time the shell is held before pouring. Cooling the shell outside can be dealt

44
within ProCAST by considering that the shell mold is filled up with hot air, without considering any heat resistance inside the casting—i.e., between air inside the mold and the mold.
7.3 Alloy
Future work should include the validation of the alloy deformation module for a high-temperature alloy.
7.4 Technology Transfer
Additional work is needed to enhance the wax model. To date, the viscoelastic module implemented in ProCAST is in the development stage. More work is needed to make the viscoelastic module applicable to industrial waxes and available to users. In order to demonstrate the applicability of this technology to commercial foundries, the approach used in this study must be extended to more complex materials used in the investment casting industry:
• Filled wax must be considered. This project considered only unfilled waxes. • Shell deformation must be included in the analysis. This project considered only fused silica
shell molds, for which shell deformation is negligible. • High-temperature alloys must be included. Only aluminum alloys were considered in this
project.

45
8. References
Ackermann, P., and Kurz, W. 1985. “In Situ Tensile Testing of Solidifying Aluminum and Al-Mg Shells,” Materials Science and Engineering, Vol. 75, pp. 79–86.
Bellet, M.; Decultieux, F.; Menai, M.; Bay, F.; Levaillant, C.; Chenot, J. L.; Schmidt, P.; and Svensson, I. L. 1996, “Thermomechanics of the Cooling Stage in Casting Processes: Three-Dimensional Finite Element Analysis and Experimental Validation,” Metallurgical and Materials Transactions, Vol. 29B, pp. 81–99.
BICTA (British Investment Casting Trade Association). 1983. “Characterization of Investment Casting Foundry Waxes-Phase 1,” Agreement No. 71c/2232: Investment Casting Studies.
BICTA (British Investment Casting Trade Association). 1985. “Characterization of Investment Casting Foundry Waxes-Phase 2,” Agreement No. A28B/061: Investment Casting Studies.
Bressers, J. 1981. Creep and Fatigue in High Temperature Alloys, Applied Science Publishers, London.
Chakravorty, S. 1999. “Assessment of Properties of Investment Casting Waxes,” Paper No. 1, Proceedings of 24th BICTA Conference on Investment Casting, Oxford, U.K., June 6–8.
Conway J. B., and Flagella, P. N. 1971. Creep-Rupture Data for the Refractory Metals to High Temperatures, Gordon and Breach Science Publisher, New York.
Drezet, J.-M., and Rappaz, M. 1996. “Modeling of Ingot Distortion during Direct Chill Casting of Aluminum Alloys,” Metallurgical and Materials Transactions, Vol. 27A, pp. 3214–3225.
Fielder, H. 1998. “The Relationship between Wax Fillers and Resultant Wax Physical Properties,” Paper No. 2, Proceedings of 46th Annual Technical Meeting, Investment Casting Institute, Orlando.
Garofalo, F. 1965. Fundamentals of Creep and Creep-Rupture in Metals, Macmillan, New York.
Hallvard, G. F., and Asbjorn, M. 1990. “ALSPEN: A Mathematical Model for Thermal Stresses in Direct Chill Casting of Aluminum Billets,” Metallurgical and Materials Transactions, Vol. 21B, pp. 1049–1061.
Hockin, J. 1968. “Dimensional Variations in Investment Casting,” Proceedings, British Investment Casters Technical Association Ninth Annual Conference, London.
Horacek, M., and Helan, J. 1998. “Dimensional Stability of Investment Casting,” Proceedings of 46th Annual Technical Meeting, Investment Casting Institute, Orlando, FL.
Kim, K. Y.; Sakuta, H.; and T. Suzuki. 1991. Modeling of Casting, Welding and Advanced Solidification Processes, V, ed. M. Rappaz, K. Mahan, and M. Ozgu, The Minerals, Metals & Materials Society.
Metalcasting Industry Technology Roadmap. 1998. Cast Metal Coalition of the American Foundry Society, January.
Nedreberg, M. L. 1990. Ph. D. Thesis, University of Oslo, Oslo, Norway.
Okhuysen V. F.; Padmanabhan, K.; and Voigt, R. C. 1998. “Tooling Allowance Practices in the Investment Casting Industry,” Paper No. 1, 46th Annual Technical Meeting, Investment Casting Institute.
Peters, F.; Voigt, R.; and Blair, M. 1997. “Dimensional Repeatability of Investment Castings,” Incast, Vol. 10, pp. 7–11.
Rosenthal, H. H. 1979, “Shrink Allowance for Pattern Dies in Investment Casting,” Paper No. 2, Proceedings of the 27th Annual Meeting of the Investment Casting Institute.

46
Rowe, G. M., and Sharrock, M. J. 2000. “Development of Standard Techniques for the Calculation of Master Curves for Linear-Visco Elastic Materials,” First International Symposium on Binder Rheology and Pavement Performance, University of Calgary, Alberta, Canada, August 14–15.
Sabau, A. S. 2005. “Numerical Simulation of the Investment Casting Process,” Transactions of American Foundry Society, paper 05-160.
Sabau, A. S., and Viswanathan, S. 2000. “Material Properties for Predicting Wax Pattern Dimensions in Investment Casting,” Paper No. 4, 48th Annual Technical Meeting, Investment Casting Institute, Dallas, TX, Oct. 15–18.
Sabau, A. S., and Viswanathan, S. 2001. “Determining Wax Pattern Dimensions in Investment Casting Using Viscoelastic Models,” Paper No. 3, 49th Annual Technical Meeting, Investment Casting Institute, Orlando, FL, Oct. 7–10.
Sabau, A. S., and Viswanathan, S. 2002. “Prediction of Wax Pattern Dimensions in Investment Casting,” Transactions of American Foundry Society, paper 02-103, Vol. 110, pp. 733–746.
Snow, J. D., and Scott, D. H. 2000. “Comparison of Fused Silica to Alumino-Silicates in Water-Based Shell Systems,” Paper No. 17, Proceedings of the 48th Annual Technical Meeting, Investment Casting Institute.
Straton, R. R., et al. Ceramics Testing Guidebook, Investment Casting Institute.
U.S. Department of Energy, Office of Industrial Technologies, Energy Spreadsheet, 2000.
Waite, D. M., and Samonds, M. T. 1990. “Finite Element Solidification Analysis of Investment Castings,” 38th Annual Technical Meeting, Investment Casting Institute.
Weddington, V. L.; Reddy, G. P.; and Mobley, C. E. 1990. Dimensional Control in the Investment Casting Process, Report EMTEC/CT/TR-90-14, Edison Materials Technology Center, Dayton, OH.
Woodbury, K. A.; Woolley, J. W.; and Piwonka, T. S. 2003. “Metal/Mold and Mold/Environment Interfacial Heat Transfer,” Transactions of the American Foundry Society, Paper No. 03-114, Vol. 111, pp. 529–541.
Zoller, P.; Bolli, P.; Pahud, V.; and Ackermann, H. 1976. “Apparatus for Measuring Pressure-Volume-Temperature Relationships of Polymers to 350°C and 2200 kg/cm2,” Review of Scientific Instruments, Vol. 47, pp. 948–952.
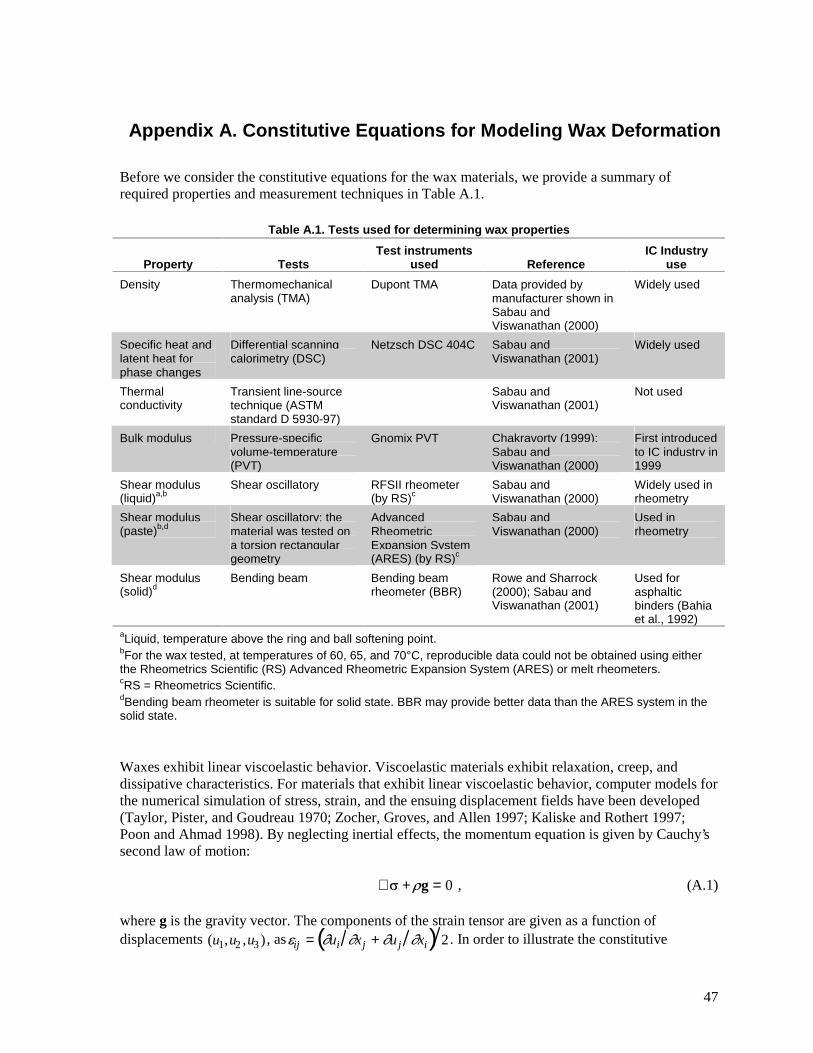
47
Appendix A. Constitutive Equations for Modeling Wax Deformation
Before we consider the constitutive equations for the wax materials, we provide a summary of required properties and measurement techniques in Table A.1.
Table A.1. Tests used for determining wax properties
Property Tests Test instruments
used Reference IC Industry
use
Density Thermomechanical analysis (TMA)
Dupont TMA Data provided by manufacturer shown in Sabau and Viswanathan (2000)
Widely used
Specific heat and latent heat for phase changes
Differential scanning calorimetry (DSC)
Netzsch DSC 404C Sabau and Viswanathan (2001)
Widely used
Thermal conductivity
Transient line-source technique (ASTM standard D 5930-97)
Sabau and Viswanathan (2001)
Not used
Bulk modulus Pressure-specific volume-temperature (PVT)
Gnomix PVT Chakravorty (1999); Sabau and Viswanathan (2000)
First introduced to IC industry in 1999
Shear modulus (liquid)a,b
Shear oscillatory RFSII rheometer (by RS)c
Sabau and Viswanathan (2000)
Widely used in rheometry
Shear modulus (paste)b,d
Shear oscillatory; the material was tested on a torsion rectangular geometry
Advanced Rheometric Expansion System (ARES) (by RS)c
Sabau and Viswanathan (2000)
Used in rheometry
Shear modulus (solid)d
Bending beam Bending beam rheometer (BBR)
Rowe and Sharrock (2000); Sabau and Viswanathan (2001)
Used for asphaltic binders (Bahia et al., 1992)
aLiquid, temperature above the ring and ball softening point. bFor the wax tested, at temperatures of 60, 65, and 70°C, reproducible data could not be obtained using either the Rheometrics Scientific (RS) Advanced Rheometric Expansion System (ARES) or melt rheometers. cRS = Rheometrics Scientific. dBending beam rheometer is suitable for solid state. BBR may provide better data than the ARES system in the solid state.
Waxes exhibit linear viscoelastic behavior. Viscoelastic materials exhibit relaxation, creep, and dissipative characteristics. For materials that exhibit linear viscoelastic behavior, computer models for the numerical simulation of stress, strain, and the ensuing displacement fields have been developed (Taylor, Pister, and Goudreau 1970; Zocher, Groves, and Allen 1997; Kaliske and Rothert 1997; Poon and Ahmad 1998). By neglecting inertial effects, the momentum equation is given by Cauchy’s second law of motion: ∇ � +�g = 0 , (A.1) where g is the gravity vector. The components of the strain tensor are given as a function of displacements (u1,u2 ,u3 ), as�ij = �ui �xj + �uj �xi( ) 2. In order to illustrate the constitutive
48
equations for waxes, it is convenient to introduce the deviatoric stress tensor, s = � − I�0 3, and deviatoric strain tensor, e = � − I �0 3. The �0 = tr� and �0 = tr e are the hydrostatic stress and dilatation components of the stress and strain tensors, respectively. If the wax is assumed to be an isotropic material, the viscoelastic constitutive equation for the deviatoric stress and strain tensors is given by
s = 2 G t − �,T( )0
t
∫ Ý ��d� , (A.2)
where G is the shear relaxation modulus (Ferry 1980). The shear modulus was determined from dynamical mechanical analysis (DMA) measurements (Sabau and Viswanathan 2000). Shear oscillatory measurements were carried out at temperatures of 25 to 55°C at 5°C increments using a Rheometric Scientific Advanced Rheometric Expansion System (ARES). The material was tested on a torsion rectangular geometry using a strain of 0.04%. We found that the wax is a thermo-rheologically simple material that obeys the time-temperature superposition principle. The principle of time-temperature superposition is based on the observation that time and temperature have an equivalent influence on the viscoelastic properties; an increase in temperature corresponds to an extension of the time scale of the experiment. The modulus for thermo-rheologically simple materials is given by G t − s,T( ) = G � t( )−� s( ),T0( ) , (A.3)
where the reduced time, � t( ) , is given as a function of the shift factor, aT , as
� t( ) =1
aT T ( )( )0
t
∫ d . (A.4)
In addition to the data provided by ARES measurements (Sabau and Viswanathan 2000), additional measurements were conducted using a bending beam rheometer (BBR). The BBR was introduced as a test method for asphaltic binders (Bahia et al. 1992). Robust procedures have been developed to determine master curves from the BBR (Rowe and Sharrock, 2000). The instrument was specifically developed to overcome testing problems that can occur with other methods when testing stiff binders at cold temperatures. The test specimen is a slender beam of wax (125 × 12.5 × 6.25 mm) that is simply supported and loaded with a constant force at mid span. The deflection is monitored with time and used for calculation of stiffness as a function of time (Bahia et al. 1992). The wax was tested with the BBR at temperatures from 0 to 25°C in 5°C increments. The optimum fit for the analysis was made with the exclusion of one isotherm from the BBR testing (25°C) and two isotherms from the torsion bar data obtained with ARES (25°C and 30°C). The shift factor was calculated by a linear regression of the shift amounts used to construct the master curves to the WLF equation (Ferry 1980):
log10 aT( )= −C1 T − T0( )C2 + T − T0
, (A.5)

49
where T0=25°C, C1= _16.21658, and C2=
_74.85206. For a generalized Maxwell-material, the shear
relaxation modulus as a function of time, t, is given as
G t( ) = g0 + gii=1
N
∑ exp −t �i( ) , (A.6)
where �i is the relaxation time and gi is the relaxation strength. These material constants were determined by a nonlinear regression of the master curve data, using the IRIS software (Baumgaertel and Winter 1989), and are shown in Table A.2. The data presented in this section were measured at temperatures below 55°C where the wax behaves like a hard paste or solid. The wax loses its strength at a temperature just above 60°C. The time-temperature superposition principle may not be applicable across the transition domain when the wax behavior changes from that of a paste to that of a liquid.
Table A.2. Relaxation times, �i , and relaxation strengths,gi , determined from experimental measurements by nonlinear regression analysis at the reference temperature of 25°C
No. gi (kPa) �i (s) No. gi (kPa) �i (s)
1 8.4000E+04 1.4080E-04 14 4.8090E+03 1.5717E+05
2 5.5456E+04 9.2040E-04 15 3.9863E+03 6.8180E+05
3 5.2022E+04 4.7020E-03 16 4.6647E+03 2.7893E+06
4 4.9323E+04 2.3528E-02 17 3.08056E+03 1.7274E+07
5 4.3975E+04 1.1611E-01 18 2.4393E+03 9.6268E+07
6 3.7048E+04 5.1398E-01 19 2.4446E+03 5.4497E+08
7 3.3772E+04 2.1960E+00 20 1.7370E+03 3.1685E+09
8 3.9505E+04 1.1748E+01 21 1.3903E+03 1.7257E+10
9 2.1745E+04 5.7720E+01 22 9.1295E+02 8.1363E+10
10 1.8180E+04 2.2298E+02 23 6.9663E+02 4.4666E+11
11 1.5983E+04 9.8453E+02 24 6.7480E+02 2.4230E+12
12 1.1557E+04 5.5447E+03 25 2.7218E+03 3.9814E+13
13 8.1935E+03 3.0675E+04
Appendix A References
Bahia, H. U.; Anderson, D. A.; and Christensen, D. W. 1992. “The Bending Beam Rheometer: A Simple Device for Measuring Low Temperature Rheology of Asphalt Binders,” Journal of the Association of Asphalt Paving Technologists, Vol. 61, pp. 117–153.
Baumgaertel, M., and Winter, H. H. 1989. “Determination of Discrete Relaxation and Retardation Time Spectra from Dynamic Mechanical Data,” Rheol. Acta, Vol. 28, p. 511.
Chakravorty, S. 1999. “Assessment of Properties of Investment Casting Waxes,” Paper No. 1, Proceedings of 24th BICTA Conference on Investment Casting, Oxford, UK, June 6–8.
Ferry, J. D. 1980. Viscoelastic Properties of Polymers, 3rd ed., John Wiley and Sons, New York.

50
Kaliske, M., and Rothert, H. 1997. “Formulation and Implementation of Three-Dimensional Viscoelasticity at Small and Finite,” Computational Mechanics, Vol. 19, pp. 228–239.
Poon, H., and Ahmad, M. F. 1998. “A Material Point Time Integration Procedure for Anisotropic, Thermo Rheologically Simple, Viscoelastic Solids,” Computational Mechanics, Vol. 21, pp. 236–242.
Rowe, G. M., and Sharrock, M. J. 2000. “Development of Standard Techniques for the Calculation of Master Curves for Linear-Visco Elastic Materials,” First International Symposium on Binder Rheology and Pavement Performance, University of Calgary, Alberta, Canada, August 14–15.
Sabau, A. S., and Viswanathan, S. 2000. “Material Properties for Predicting Wax Pattern Dimensions in Investment Casting,” Paper No. 4, 48th Annual Technical Meeting, Investment Casting Institute, Dallas, TX, Oct. 15–18.
Sabau, A. S., and Viswanathan, S. 2001. “Determining Wax Pattern Dimensions in Investment Casting Using Viscoelastic Models,” Paper No. 3, 49th Annual Technical Meeting, Investment Casting Institute, Orlando, FL, Oct. 7–10.
Taylor, R. L.; Pister, K. S.; and Goudreau, G. L. 1970. “Thermomechanical Analysis of Viscoelastic Solids,” International Journal for Numerical Methods in Engineering, Vol. 2, pp. 45–59.
Zocher M. A.; Groves S. E.; and Allen D. H. 1997. “A Three-Dimensional Finite Element Formulation for Thermoviscoelastic Orthotropic Media,” International Journal for Numerical Methods in Engineering, Vol. 40, pp. 2267–2288.

51
Appendix B. Constitutive Equations for Shell Molds In the Rosseland diffusion approximation, the semitransparent bulk material is treated as a medium that has a thermal conductivity given as k = kc + kr , (B.1) Due to the semitransparent nature of ceramic particles used in the packed bed, it may be difficult to relate the packed-bed thermal conductivity to properties of the bulk ceramic material, since the scattering of radiation on numerous inhomogeneities, such as pores, cracks, and particles, must be considered. A brief summary of results for thick packed beds of ceramic particles is shown in Table B.1.
Table B.1. Studies on radiation effects in ceramic packed beds of unsintered particles of uniform size, for which diffusion correlations are presented for thermal conductivity
Material Particle size
(mm) Bed size
(mm) References
Alumina 3.8 — Kamiuto 1991; Hill and Wilhelm 1959
Alumino-silicate 6 — Kamiuto 1991; Beveridge and Haughey 1971
Alumina 1.2 4.2 Kamiuto 1991, 1992
Glass 1.2 4.2 Kamiuto 1991, 1992
Alumina 2.7, 6.6, 9.6 127 Nasr, Viskanta, and Ramadhyani 1994
Soda-lime silica glass 2.8, 6, 13.5 127 Nasr, Viskanta, and Ramadhyani 1994
Moreover, semi-empirical correlations for thermal conductivity that were reviewed by Nasr, Viskanta, and Ramadhyani (1994) indicate that the radiative component of the thermal conductivity can in general be given as kr T( )= 4EσdpT
3, (B.1)
where σ is the Stefan-Boltzman constant, T is the absolute temperature [K], and dp is the dimension of the particle size of packed bed. The above relationship is limited to “optically thick” packed beds, i.e., those whose dimension, L, fulfills the condition α + β( )L >> 1 , (B.2) where α is the effective absorption coefficient and β is the effective scattering coefficient. Thermal conductivity data obtained for a shell made of ten successive backup coats by Snow and Scott (2000) were used in this study. These data were obtained using the hot-wire method (ASTM Cl113). A third-order polynomial fit of the form a+b*T3 was assumed to describe the overall shell thermal conductivity, including the conduction and radiation effects in the shell. The results of the polynomial regression are shown in Fig. B.1. As shown in this figure, it was found that the thermal conductivity for the ten-backup shell obeys a third-order polynomial law, which was postulated on the basis of models developed for packed beds.

52
0.5
1
1.5
2
2.5
3
200 400 600 800 1000 1200 1400 1600
Least square curve fitExperimental data
The
rmal
con
duct
ivit
y [W
/mK
]
Temperature [K]
y=a+b T3
ErrorValue3.1111e-036.5003e-01a2.6635e-124.8091e-10b
NA1.5043e-05ChisqNA9.9998e-01R
T[K] K[W/mK]295 0.66755 0.86
1255 1.60
Fig. B.1. Thermal conductivity for ten-backup-coat shell.
Shell emissivity was determining using an infrared (IR) camera (Fig. B.2). IR signals were obtained with the camera for a black body and for the shell mold. Then, the emissivity was obtained by comparing the two signals.
(a)
���
����
����
����
����
��� ��� ��� ��� ��� �� ����
��������������� ���
����������� ��
������������� (b)
��
��
��
��
�
�
��� ��� ��� ��� ��� ��� ����
��������������
�������������
Fig. B.2. (a) Magnitude of the infrared (IR) signal for the black body and the shell plate; (b) estimated shell emissivity from IR experimental data.
Appendix B References Beveridge, G. S. G., and Haughey, D. P. 1971. “Axial Heat Transfer in Packed Beds: Stagnant Beds
between 20 and 750°C,” International Journal of Heat and Mass Transfer, Vol. 14, pp. 1093–1113.
Hill, F. B., and Wilhelm, R. H. 1959. AichE J., Vol. 5, p. 486.
Kamiuto, K. 1991. “Analytical Expression for Total Effective Thermal Conductivities of Packed Beds,” Journal of Nuclear Science and Technology, Vol. 28, pp. 1153–1156.
Kamiuto, K. 1992. “Radiative Properties of Packed-Sphere Systems Estimated by the Extended Emerging-Intensity Fitting Method,” Journal of Quant. Spectrosc. Radiat. Transfer, Vol. 47, pp. 257–261.
Nasr, K.; Viskanta, R.; and Ramadhyani, S. 1994. “An Experimental Evaluation of the Effective Thermal Conductivities of Packed Beds at High Temperatures,” Journal of Heat Transfer, Vol. 116, pp. 829–837.
Snow, J. D. 1995. “How the Shell Affects Casting Dimensions,” Proceedings of 43rd Annual Meeting of the Investment Casting Institute, Paper No. 18.
53
Appendix C. Natural Convection at Shell Mold Surfaces The overall heat transfer coefficient between the ambient and shell mold, ha can be given as a function of the convection heat transfer coefficient, hma, and shell emissivity, as:
ha = hma + hR = hma +σε T 2 + TA2( )T + TA( ) , (C.1)
where hR is an effective radiation heat transfer coefficient, T is the temperature of the surface [K], and TA is ambient temperature [K]. There are different correlations for the heat transfer coefficient depending on the characteristic length of the surface and surface orientation, i.e., vertical and horizontal (Incropera and DeWitt 1990). Most of correlations on natural convection are given in terms of the Nusselt number, NuL , and the Rayleigh number, RaL :
NuL = hmaL
k and RaL = gβ(Ts −T∞)L3
vα , (C.2)
where g = gravitational acceleration, β is the thermal expansion coefficient, v is the kinematic viscosity of the fluid, L is the characteristic length scale, and α is the thermal diffusivity, Ts is the surface temperature, and T∞ is the ambient temperature. For air at ambient temperature, the thermal conductivity k = 2.6E–2 W/mK and gβ vα = 9.07E+7 [1/m3K]. The characteristic length scale, L, for a surface can be computed as the ratio between the surface area, A, and its perimeter, p; i.e., L = A/p. The heat transfer coefficient is determined from the Nusselt number, as
hma = kL
⋅ NuL , (C.3)
In order to determine the heat transfer coefficient, it was necessary to take into account the different airflow patterns on the mold surfaces. For surfaces that are fully open to airflow, NuL can be expressed in terms of the Rayleigh number, RaL , as the following (Bejan 2004):
4/154.0 LL RaNu = (C.4)
4/127.0 LL RaNu = (C.5)
NuL = 0.68 + 0.515RaL1/ 4
(C.6) Equations (C.4) and (C.5) describe the correlations for the cooling of a horizontal surface facing upward and downward, respectively. Equation (C.5) is for vertical surfaces. For inclined walls, correlation equation (C.6) can be used, provided that RaL is evaluated considering the gravitational acceleration component that is parallel to the wall. In the literature, there are also correlations given for cylinders and other shapes. Other types of mold surfaces encountered in investment casting are those between adjacent casting parts, i.e., surfaces facing other surfaces. In this case, the airflow is partially restricted, and we can

54
use the correlations developed for the “two-plate” configuration. The equation for the Nusselt number for a channel between two plates is
Nus = 1
24Ras
S
L
1−exp
-35
Ras
L
S
3 / 4
, (C.7)
where S is the distance between the two plates and the Rayleigh number is computed based on S. Appendix C References Bejan, A. 2004. Convection Heat Transfer, 3rd ed., John Wiley and Sons, Hoboken, NJ.
Incropera, F. P., and DeWitt, D. P. 1990. Fundamentals of Heat and Mass Transfer, 3rd ed., John Wiley & Sons, New York, NY.

55
Appendix D. Thermo-Mechanical Models of Alloys Advanced models for the numerical simulation of stress, strain, and the ensuing displacement fields during casting were developed in the 1990s (Bellet et al. 1996; Drezet and Rappaz 1996). These advances, made in academia, were recently implemented in commercial simulation software. ProCAST has recently implemented a stress module that works in conjunction with the fluid flow module, such that appropriate constitutive equations can be considered for the liquid, semi-solid, and solid states that coexist during solidification (Table D.1).
Table D.1. Fluid flow and deformation mechanisms depending on the solidifying microstructure
Solidification domain Microstructure Fluid flow Deformation
fs < fsc Floating equiaxed crystals
Mass feeding N/A (i.e., no yield strength)
fsc < fs < fpk Dendritic network is established; packing increases
Mass feeding decreases; interdendritic feeding increases
Low yield point increases slowly (0–0.01Mpa)
fpk < fs Dendritic network Interdendritic feeding Yield point increases faster (0.01–0.9Mpa)
Source: Dahle and St. John 1999
Critical solid fractions for thermomechanical behavior during alloy solidification were determined from experimental data obtained by Arnberg, Backerud, and Cahi (1996) for aluminum alloy A356 (Table D.2). Bellet et al. (1996) developed a methodology for modeling casting solidification by combining constitutive equations for the mushy zone and liquid regions into a solid model that is based on Perzyna’s work (1963). Bellet et al. (1996) used a Norton-Hoff power law to describe the viscoplastic behavior of an Al-7Si-0.3Mg alloy, as follows:
Ý ε pl = γσeq
σo−1
1/m
, γ = 1
3
σ0
3K
1
m , (D.1)
where the operator < . > is defined as < f > = f when f �������������� ���� and
Ý ε pl = plastic strain rate γ = fluidity of the material m = strain rate sensitivity coefficient K = viscoplastic consistency σo = yield stress σeq = von Mises equivalent stress
Both γ and m were temperature-dependent coefficients. For example, at low temperatures when the alloy tends to behave in an elastoplastic manner, m has very small values while γ has very large values. In ProCAST, the power exponent, n, and a viscous parameter,η , are used instead of the variables m and γ, respectively.

56
The following equations provide the relationship between the variables used by Bellet et al. (1996) and those in ProCAST (Table D.3):
n=1/m, and η = 11.5γ
. (D.2)
ProCAST allows modeling of the liquid regions by the Navier-Stokes equations, eliminating the need to artificially extend the stress model to liquid regions. Kim, Sakuti, and Sazuki (1991) proposed an elastoplastic model based on a linear-hardening model (Table D.4), which now a part of the stress database in ProCAST.
Table D.2. Critical solid fractions for thermomechanical behavior during alloy solidification
Solidification characteristics Temperature
(°C) Solid fraction
(%)
Liquidus 610–617 0
Dendrite coherency 598–604 19–29
Eutectic 565–570 51–56
Rigidity point 565–567 63–74
Solidus 540–533 1
Source: Arnberg, Backerud, and Cahi 1996.
Table D.3. Mechanical properties used in ProCAST based on Bellet et. al (1996)
Temp. (°C)
E (MPa) σ o (MPa) � n
η (s)
25 60000 200 0.33 50 0
100 21.3 8.320e-17
200 12.4 5.000e-10
300 8.75 3.040e-07
400 6.76 1.000e-05
545 34000 1 0.33 5 1.656e-04
572 34000 1 0.33 5
573 0.01 0.01 0.49 0.2
579 0.2
600 1
615 0.01 0.01 0.49 1 1.656e-04

57
Table D.4. Mechanical properties used in ProCAST based on Kim et al. (1991)
Temp. (°C)
E (MPa)
σ o (MPa)
H (MPa)
20 71,705 186 7,170
200 69,636 172 6,963
300 63,776 116 6,377
400 57,226 54 5,722
500 36,542 31 3,654
550 6,894 689
556 1,434 9 143
616 143 1 14
Appendix D References
Arnberg, L.; Backerud, L.; and G. Cahi. 1996. Solidification Characteristics of Aluminum Alloys, Vol. 3: Dendrite Coherency, Des Plaines, IL.
Bellet, M.; Decultieux, F.; Menai, M.; Bay, F.; Levaillant, C.; Chenot, J. L.; Schmidt, P.; and Svensson, I. L. 1996, “Thermomechanics of the Cooling Stage in Casting Processes: Three-Dimensional Finite Element Analysis and Experimental Validation,” Metallurgical and Materials Transactions, Vol. 29B, pp. 81–99.
Drezet, J.-M., and Rappaz, M. 1996. “Modeling of Ingot Distortion during Direct Chill Casting of Aluminum Alloys,” Metallurgical and Materials Transactions, Vol. 27A, pp. 3214–3225.
Kim, K. Y.; Sakuta, H.; and T. Suzuki. 1991. Modeling of Casting, Welding and Advanced Solidification Processes, V, ed. M. Rappaz, K. Mahan, and M. Ozgu, The Minerals, Metals & Materials Society.
Perzyna, P. 1963. “The Constitutive Equations for Rate Sensitive Plastic Materials,” Quarterly Applied Math., Vol. 20, pp. 321–332.

Related Documents