Predicting Maintenance Performance Using Object-Oriented Design Complexity Metrics Rajendra K. Bandi, Vijay K. Vaishnavi, Fellow, IEEE, and Daniel E. Turk, Member, IEEE Abstract—The Object-Oriented (OO) paradigm has become increasingly popular in recent years. Researchers agree that, although maintenance may turn out to be easier for OO systems, it is unlikely that the maintenance burden will completely disappear. One approach to controlling software maintenance costs is the utilization of software metrics during the development phase, to help identify potential problem areas. Many new metrics have been proposed for OO systems, but only a few of them have been validated. The purpose of this research is to empirically explore the validation of three existing OO design complexity metrics and, specifically, to assess their ability to predict maintenance time.This research reports the results of validating three metrics, Interaction Level (IL), Interface Size (IS), and Operation Argument Complexity (OAC). A controlled experiment was conducted to investigate the effect of design complexity (as measured by the above metrics) on maintenance time. Each of the three metrics by itself was found to be useful in the experiment in predicting maintenance performance. Index Terms—Object-oriented metrics, software maintenance, metrics validation, predicting software maintenance time. æ 1 INTRODUCTION T HE object-oriented (OO) paradigm has become increas- ingly popular in recent years as is evident by more and more organizations introducing object-oriented methods and languages into their software development practices. Claimed advantages of OOP (object-oriented programming) include easier maintenance through better data encapsula- tion [10]. There is some evidence to support the claim that these benefits may be achieved in practice [36], [44]. Although maintenance may turn out to be easier for programs written in OO languages, it is unlikely that the maintenance burden will completely disappear [50]. Main- tenance, in its widest sense of “post deployment software support,” is likely to continue to represent a very large fraction of total system costs. Maintainability of software thus continues to remain a critical area even in the object- oriented era. Object-oriented design can play an important role in maintenance especially if design-code consistency is maintained [6], [24]. The control of software maintenance costs can be approached in several ways. One approach to controlling software maintenance costs is the utilization of software metrics during the development phase. These metrics can be utilized as indicators of the system quality and can help identify potential problem areas [19], [38], [43]. Several metrics applicable during the design phase have been developed. Several studies have been conducted examining the relationships between design complexity metrics and maintenance performance and have concluded that design- based complexity metrics can be used as predictors of maintenance performance; many of these studies, however, were done in the context of traditional software systems [20], [25], [29], [40], [41]. The OO approach involves modeling the real world in terms of its objects, while more traditional approaches emphasize a function-oriented view that separates data and procedures. Chidamber and Kemerer [17] argue that, because of the fundamentally different notions inherent in these two views, software metrics developed with tradi- tional methods in mind do not direct themselves to notions such as classes, inheritance, encapsulation, and message passing. Therefore, given that such metrics do not support key OO concepts, it seems appropriate to have new metrics especially designed to measure the unique aspects of the OO design [1], [2], [3], [4], [11], [17], [21], [22], [23], [27], [28], [35], [46], [47]. To be useful in practice, such metrics need to be validated too. This exact course of action has been suggested by at least one set of researchers: “metrics which reflect the specificities of the OO paradigm must be defined and validated” ([8], p. 751). Thus far, only a few empirical studies have investigated the relationship between the proposed metrics and OO design quality attributes such as maintainability [5], [8], [11], [12], [14], [26], [31], [33], [34]. Most of these studies have investigated two metrics sets (Chidamber and Kemerer’s metrics suite [17] and the MOOD metrics [3], [4]). The work of Briand et al. [11] is an exception and defines a number of new metrics for coupling and cohesion and investigates their relationship to fault-proneness in three large-scale projects. Another ex- ception is the work of Cartwright and Shepperd [14] who show how accurate prediction systems for size and defects, based on certain simple counts, can be empirically built to suit a local context. IEEE TRANSACTIONS ON SOFTWARE ENGINEERING, VOL. 29, NO. 1, JANUARY 2003 77 . R.K. Bandi is with the Quantitative Methods and Information Systems Department, Indian Institute of Management, Bannerghatta Rd., Banga- lore-560 076, India. E-mail: [email protected]. . V.K. Vaishnavi is with the Department of Computer Information Systems, Georgia State University, PO Box 4015, Atlanta, GA 30302-4015. E-mail: [email protected]. . D.E. Turk is with the Computer Information Systems Department, Colorado State University, 026 Rockwell Hall, Fort Collins, CO 80523. E-mail: [email protected]. Manuscript received 25 June 2001; revised 23 May 2002; accepted 12 Sept. 2002. Recommended for acceptance by G. Canfora. For information on obtaining reprints of this article, please send e-mail to: [email protected], and reference IEEECS Log Number 114424. 0098-5589/03/$17.00 ß 2003 IEEE Published by the IEEE Computer Society

Welcome message from author
This document is posted to help you gain knowledge. Please leave a comment to let me know what you think about it! Share it to your friends and learn new things together.
Transcript
Predicting Maintenance Performance UsingObject-Oriented Design Complexity Metrics
Rajendra K. Bandi, Vijay K. Vaishnavi, Fellow, IEEE, and Daniel E. Turk, Member, IEEE
Abstract—The Object-Oriented (OO) paradigm has become increasingly popular in recent years. Researchers agree that, although
maintenance may turn out to be easier for OO systems, it is unlikely that the maintenance burden will completely disappear. One
approach to controlling software maintenance costs is the utilization of software metrics during the development phase, to help identify
potential problem areas. Many new metrics have been proposed for OO systems, but only a few of them have been validated. The
purpose of this research is to empirically explore the validation of three existing OO design complexity metrics and, specifically, to
assess their ability to predict maintenance time.This research reports the results of validating three metrics, Interaction Level (IL),
Interface Size (IS), and Operation Argument Complexity (OAC). A controlled experiment was conducted to investigate the effect of
design complexity (as measured by the above metrics) on maintenance time. Each of the three metrics by itself was found to be useful
in the experiment in predicting maintenance performance.
Index Terms—Object-oriented metrics, software maintenance, metrics validation, predicting software maintenance time.
æ
1 INTRODUCTION
THE object-oriented (OO) paradigm has become increas-
ingly popular in recent years as is evident by more and
more organizations introducing object-oriented methods
and languages into their software development practices.
Claimed advantages of OOP (object-oriented programming)
include easier maintenance through better data encapsula-tion [10]. There is some evidence to support the claim that
these benefits may be achieved in practice [36], [44].
Although maintenance may turn out to be easier for
programs written in OO languages, it is unlikely that the
maintenance burden will completely disappear [50]. Main-
tenance, in its widest sense of “post deployment software
support,” is likely to continue to represent a very large
fraction of total system costs. Maintainability of softwarethus continues to remain a critical area even in the object-
oriented era. Object-oriented design can play an important
role in maintenance especially if design-code consistency is
maintained [6], [24].The control of software maintenance costs can be
approached in several ways. One approach to controllingsoftware maintenance costs is the utilization of softwaremetrics during the development phase. These metrics canbe utilized as indicators of the system quality and can helpidentify potential problem areas [19], [38], [43]. Several
metrics applicable during the design phase have beendeveloped. Several studies have been conducted examiningthe relationships between design complexity metrics andmaintenance performance and have concluded that design-based complexity metrics can be used as predictors ofmaintenance performance; many of these studies, however,were done in the context of traditional software systems[20], [25], [29], [40], [41].
The OO approach involves modeling the real world interms of its objects, while more traditional approachesemphasize a function-oriented view that separates data andprocedures. Chidamber and Kemerer [17] argue that,because of the fundamentally different notions inherent inthese two views, software metrics developed with tradi-tional methods in mind do not direct themselves to notionssuch as classes, inheritance, encapsulation, and messagepassing. Therefore, given that such metrics do not supportkey OO concepts, it seems appropriate to have new metricsespecially designed to measure the unique aspects of theOO design [1], [2], [3], [4], [11], [17], [21], [22], [23], [27], [28],[35], [46], [47]. To be useful in practice, such metrics need tobe validated too. This exact course of action has beensuggested by at least one set of researchers: “metrics whichreflect the specificities of the OO paradigm must be definedand validated” ([8], p. 751). Thus far, only a few empiricalstudies have investigated the relationship between theproposed metrics and OO design quality attributes suchas maintainability [5], [8], [11], [12], [14], [26], [31], [33], [34].Most of these studies have investigated two metrics sets(Chidamber and Kemerer’s metrics suite [17] and theMOOD metrics [3], [4]). The work of Briand et al. [11] isan exception and defines a number of new metrics forcoupling and cohesion and investigates their relationship tofault-proneness in three large-scale projects. Another ex-ception is the work of Cartwright and Shepperd [14] whoshow how accurate prediction systems for size and defects,based on certain simple counts, can be empirically built tosuit a local context.
IEEE TRANSACTIONS ON SOFTWARE ENGINEERING, VOL. 29, NO. 1, JANUARY 2003 77
. R.K. Bandi is with the Quantitative Methods and Information SystemsDepartment, Indian Institute of Management, Bannerghatta Rd., Banga-lore-560 076, India. E-mail: [email protected].
. V.K. Vaishnavi is with the Department of Computer Information Systems,Georgia State University, PO Box 4015, Atlanta, GA 30302-4015.E-mail: [email protected].
. D.E. Turk is with the Computer Information Systems Department,Colorado State University, 026 Rockwell Hall, Fort Collins, CO 80523.E-mail: [email protected].
Manuscript received 25 June 2001; revised 23 May 2002; accepted 12 Sept.2002.Recommended for acceptance by G. Canfora.For information on obtaining reprints of this article, please send e-mail to:[email protected], and reference IEEECS Log Number 114424.
0098-5589/03/$17.00 ß 2003 IEEE Published by the IEEE Computer Society
Li et al. [34] study the metrics proposed by Chidamberand Kemerer [17] with reference to the maintenance effortin two commercial systems and conclude that these metricsin general can be used as predictors of maintenance effort[33], [34]. The major criticism about this work is that“Maintenance Effort” was operationalized as the number oflines of code changed. This is perhaps as controversial asusing the lines of code (LOC) as a size metric. Anotherexperimental study [8] conducted to validate these metricsas predictors of reliability (fault-proneness) found that fiveof the six metrics seem to be useful to predict classreliability during the early phases of the life cycle. Kolewe[31] confirms (based on a field study) that two of the metrics(class coupling and response for class) correlate with thedefect densities. Briand et al. [12] study, in a universitysetting, a number of available metrics, including some of theChidamber/Kemerer metrics, that measure structural prop-erties of OO designs and report that the coupling andinheritance metrics studied are significantly related to theprobability of detecting a fault in a class during testing. Thework of Chidamber and Kemerer, however, is not withoutcriticisms. Several researchers have pointed out ambiguitiesassociated with some of these metrics [18], [30], [33].
For the MOOD metrics, Abreu and Melo [5] report thatin an experimental study they found these metrics tocorrelate with the system reliability and maintainability. Inanother study, Harrison et al. [26] report that the MOODmetrics can be said to be theoretically valid, but only ifappropriate changes are made to rectify existing proble-matic discontinuities.
OO designs are relatively richer in information and,therefore, metrics, if properly defined, can take advantageof that information available at any early stage in the lifecycle. Unfortunately, most of the prior research does notexploit this additional information. Three metrics, interac-tion level [1], [2], interface size [1], and operation argumentcomplexity [15], which are the focus of the current paper,are among the metrics proposed and/or studied that seemto take advantage of some of the additional informationavailable in an OO design. Their definitions include the useof interface size information in slightly different ways.Interaction level metric is the most complex out of the threemetrics and additionally captures the potential interactionsthat may occur in an execution sequence. Operationargument complexity is the simplest of the three metrics.
None of the studies of the interaction level [1], [2], [9],interface size [1], and operation argument complexity [15]metrics has validated the proposed metrics empirically. Themetrics have, however, been subjectively validated, wherethe metrics values are compared to expert judgments. Insuch a study of 16 OO design quality metrics (includingthree Chidamber/Kemerer metrics [17]) by Binkley andSchach [9], the interaction level metric (also known aspermitted interaction metric) was found to be the secondbest for predicting implementation and maintenance effort.
The objective of the current paper is to present the resultsof a study that assessed the validity of predicting main-tenance time from the design complexity of a system asmeasured by the three metrics mentioned above. Thesemetrics have also been analytically validated [7] using therelevant mathematical properties specified by Weyuker [49].This paper, however, focuses only on the empirical study.
The rest of the paper proceeds as follows: Section 2discusses the design of the study, describing the dependentand independent variables, and the metrics that are to bevalidated. It presents the hypotheses to be tested, describesthe subjects who participated in the study, and finallyexplains the data collection procedures, measurementinstruments, and data collected. Section 3 presents ananalysis of the data. Section 4 draws conclusions and makessuggestions for further work.
2 DESIGN OF THE EMPIRICAL STUDY
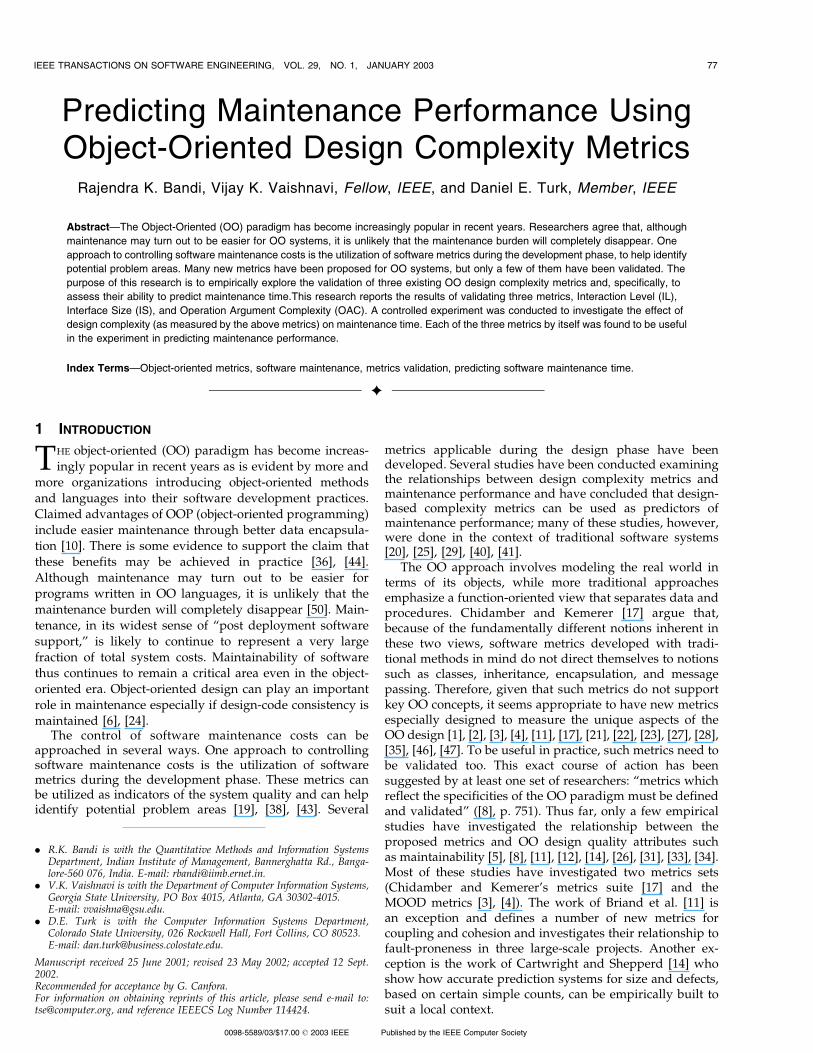
Fig. 1 summarizes the research design of this study,1 whichsuggests that design complexity, maintenance task, andprogrammer ability all influence maintenance performance.Maintenance performance is the dependent variable anddesign complexity, maintenance task, and programmerability are independent variables. This paper reports ononly the first two of these independent variables.
The figure suggests that there may be some sort of causalrelationship on maintenance performance by design com-plexity, maintenance task, and programmer ability. How-ever, this study simply looked at whether a relationshipexists, and whether these variables might be able to be usedto predict maintenance time. The study does not make anyclaims with respect to causality.
The empirical study was carried out using a controlledexperiment in which students at a US university partici-pated as subjects.
2.1 Dependent Variable
Maintainability is defined as the ease with which systemscan be understood and modified [25]. In past studies, it hasbeen operationalized as “number of lines of code changed”[33], [34], time (required to make changes) and accuracy[20], [25], and “time to understand, develop, and implementmodification” [39]. In this study, following Rising [39],maintainability was operationalized as “time to understand,develop, and actually make modifications to existingprograms.” We did not include accuracy in the maintenancemeasurement because of the following reasons: 1) Aninverse relationship exists between time (for making
78 IEEE TRANSACTIONS ON SOFTWARE ENGINEERING, VOL. 29, NO. 1, JANUARY 2003
1. In order to make it easy to replicate the experiment, all instruments,forms, designs, instructions, etc., have been made available at the Website: http://www.biz.colostate.edu/faculty/dant/pages/papers/IEEETrxSE-OOMetrics/20020917/.
Fig. 1. Research design.
changes) and accuracy. 2) For the measured accuracy to bestatistically useful, the maintenance should be done in somerestricted amount of time. 3) To counter the criticism ofRombach [40], that the students used as participants lackmotivation, we designed the experiment as a requiredassignment for a course that was graded and the gradecounted towards the course grade. With this as themotivating factor, it was not feasible to restrict the studentto finish the assignment in a constrained amount of time ina single sitting.
2.2 Independent Variables
2.2.1 Design Complexity
Interaction level (IL) [1], [2], interface size (IS) [1], andoperation argument complexity (OAC) [15] were chosen asmeasures of design complexity in this study. All threemetrics have been subjectively validated by comparing theirvalues to experts’ judgments and have been found toperform well [1], [2], [9], [15]. The three metrics aredescribed below.
The fundamental basis for the interaction level metric, aswell as for the other two metrics, is the assumption that thegreater the interface, the more scope for (direct) interactionsand interaction increases complexity. This assumption isconsistent with the notions of complexity suggested byvarious researchers. Weyuker has developed a formal list ofproperties for software complexity metrics [49]. Interactionis one of these properties. Bunge defines complexity of a“thing” to be the “numerosity of its composition,” implyingthat a complex “thing” has a large number of properties[13]. Using this definition as a base, the complexity of anobject class can be defined to be the cardinality of its set ofproperties. Abbott [1] extends this notion further anddefines the complexity to be a function of the interactionsof its set of properties. In the case of objects and classes, themethods and data attributes are the set of properties and,therefore, complexity of a class is a function of theinteraction between the methods and the data attributes.
The concept of IL specifies the amount of potential(direct) interaction that can occur in a system, class, ormethod. For example, the IL of a method indicates theamount of (direct) interaction that can occur whenever amethod is invoked. To explain further, whenever a methodis invoked, its parameters are used for some internalcomputation along with some of the data attributesassociated with the class to which that method belongs.Also, a value (object) may be passed back to the callingroutine. (Thus, the parameter count used in IL includes boththe regular method parameters and any return value if oneexists.) There is said to be an “interaction” between twoentities A and B if the value of entity A is calculated directlybased on the value of entity B, or vice versa. In the contextof the interaction level metric, if the value of some dataattribute is calculated directly based on the value of one ormore of the parameters, or vice versa, then there is said tobe an interaction between the parameters and the dataattribute. It is expected that a higher interaction level willcorrelate with an increased difficulty in determining how toimplement or modify a design.
The interaction level metric can be computed at varyinglevels of granularity: The interaction level of a class is thesum of the interaction levels of its methods. The interaction
level of a design is the sum of the interaction levels of itsclasses. The current study validates IL and the other twometrics at the design level.
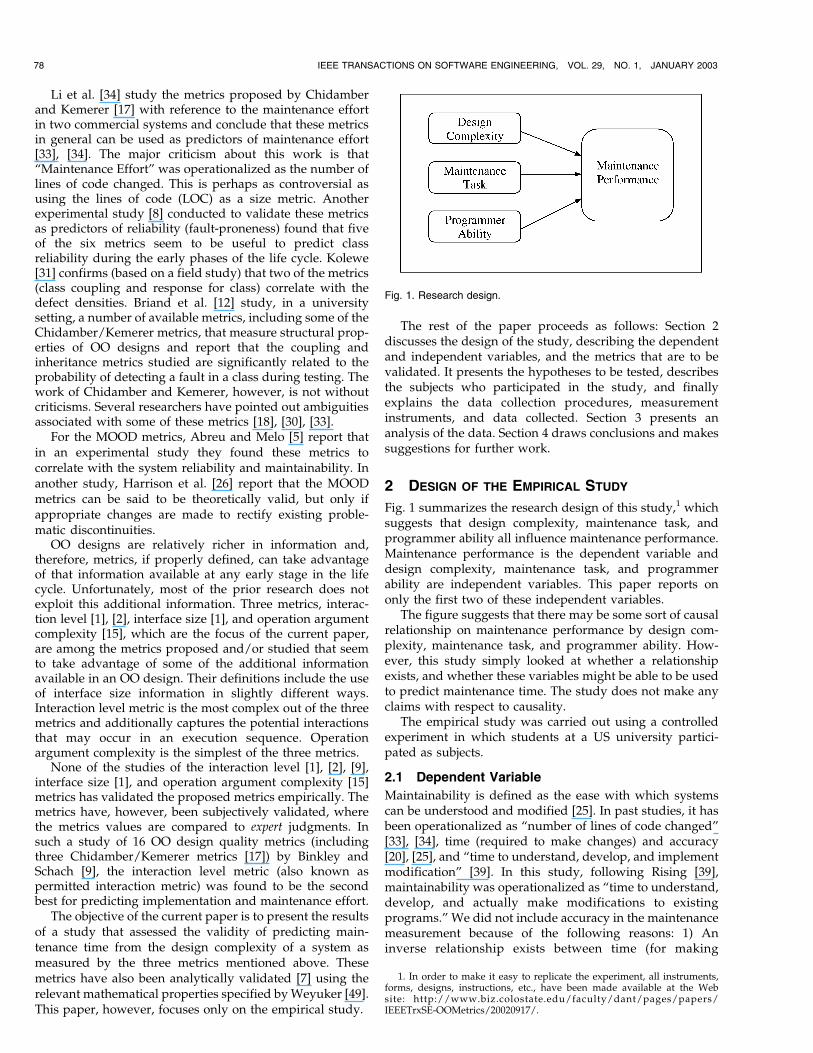
Both interaction level and interface size metrics use theconcept of “number” and “strength.” For example, theinteraction level of a method depends on the number ofinteractions and the strength of interactions. The size of aparameter (argument) or attribute is a specified constant(see Fig. 22), signifying the complexity of the parameter/attribute type. The strength of interaction is defined as theproduct of the sizes of the parameters/attributes involvedin the interaction. It is necessary to use both number andstrength because they typically have an inverse relationshipin the sense that decreasing one increases the other and viceversa. Also, a large increase in either number or strength (ofinteractions) could increase the complexity. Accordingly,the interaction level (IL) of a method is defined as: IL = K1*(number of interactions) + K2* (sum of strength ofinteractions).
The constants K1 and K2 used in the linear combinationare tentatively set to 1 for simplicity and to balance theeffect of the strength of interactions and the number ofinteractions. They are however subject to revision asexperience is gained with the metric. This approach isconsistent with assumptions made by other researchers intentatively fixing a value for the constants in metricdefinitions [16].
It is to be noted that the interaction level metric is derivedbased on the number and the strength of the interactions“permitted” by the design. These interactions may or maynot actually occur in realizing the method. For example, aparameter of a method may, upon implementation, be seento interact with only one of the data attributes, not all ofthem. Nonetheless, the design of the method has created themechanism for these interactions to occur and hence“permits” them. Whether or not all the interactions occurand how many times they occur is an implementation issue.The presence or absence of the mechanism is a design issueand, hence, serves as an appropriate base for a design metric.
The concept of interface size gives a measure of themeans for information to flow in and out of classencapsulation. Some classes define many methods, perhapsmany of which have complex signatures (i.e., parameterlists) that provide abundant means for information to flow
BANDI ET AL.: PREDICTING MAINTENANCE PERFORMANCE USING OBJECT-ORIENTED DESIGN COMPLEXITY METRICS 79
2. The size values in Fig. 2 are based on the values suggested in [1] and[15]. The size value for Boolean type is used if a parameter’s intended use(as a Boolean) is clear from the context.
Fig. 2. Parameter/attribute sizes and their types.
in and out of their encapsulation. Other classes may providefew methods, many of which have simple signatures. It isexpected that a larger interface size will correlate with anincreased difficulty in comprehending how to select andcorrectly use the services provided by a class.
Interface size (IS) of a method is defined as: IS = K3*(number of parameters) + K4* (sum of sizes of parameters).
As in the case of the definition of IL, the constants K3and K4 used in the linear combination are tentatively setto 1 for simplicity and to balance the effect of the numberof parameters and size of the parameters. They are,however, subject to revision as experience is gained withthe metric [16].
Interface size of a class is the sum of the interface sizes ofits methods. The interface size of a design (the focus of thecurrent study) is the sum of the interface sizes of its classes.
Operation argument complexity is the simplest of thethree metrics. Operation argument complexity (OAC) of amethod is defined as: OAC = � P(i), where P(i) is the size ofeach parameter as specified in Fig. 2.
Operation argument complexity of a class is the sum ofthe operation argument complexities of its methods. Theoperation argument complexity of a design (the focus of thecurrent study) is the sum of the operation argumentcomplexities of its classes.
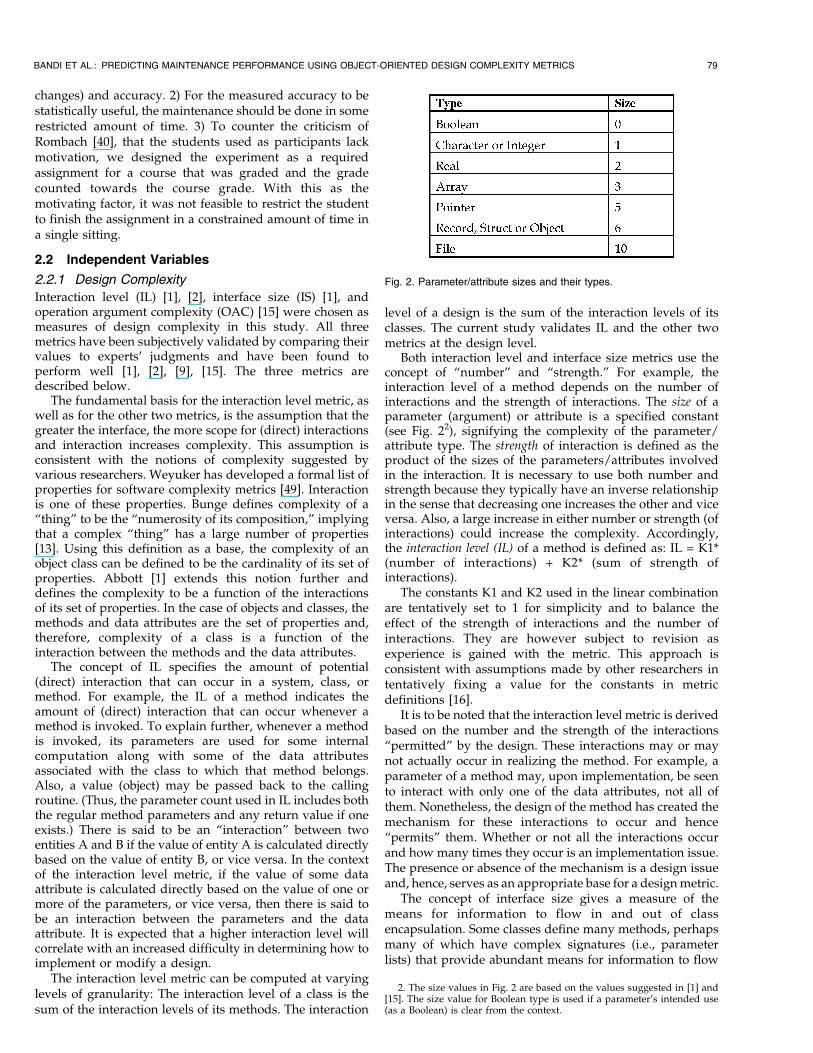
Example. The following example demonstrates the compu-tation of these metrics. Let us consider a sample class“quadrilateral” which has eight float attributes (x1, x2,x3, x4, y1, y2, y3, y4) to store each of the four vertices.Assume that this class has one method “hasVertex”which takes a point (two float variables x, y) as aparameter and returns a Boolean value to indicate if thepoint is inside the quadrilateral. Accordingly, the classcan be defined as below:
Class Quadrilateral
Attributes: float x1; y1; float x2; y2; float x3; y3;
float x4; y4;Methods: Boolean hasVertex(float x, float y)
The interaction permitted in the class is shown in Fig. 3.Based on the above information and Fig. 2, we can noticethat 1) the size of each float data attribute (x1, .., x4, y1, ..,y4) = 2. 2) The size of each float parameter (x, y) = 2. 3) Thesize of the Boolean return value = 0. 4) The strength of eachinteraction (involving parameter x or parameter y) = size ofa data attribute (2) * the size of x or y (2) = 4. 5) The strengthof each interaction which involves return value = size of adata attribute (2) * the size of return value (0) = 0.
Interaction level (IL) for the method “hasVertex” =K1*(number of interactions) + K2*(sum of strength ofinteractions), where K1 = K2 = 1. Thus, IL = 1*(number ofdata attributes * number of method parameters) + 1*(sum ofstrength of eight interactions with parameter x, eightinteractions with parameter y, and eight interactions withreturn value) = (8*3) + ((8*4) + (8*4) + (8*0)) = 24 + 64 = 88.(Note that the return value of a method is treated similarlyas a method parameter.) Therefore, IL = 88. Since the classhas only one method, IL of the class = 88.
Interface size (IS) for the method “hasVertex” = K3*(num-ber of parameters) + K4*(sum of size of parameters), whereK3 = K4 = 1; the method has 3 parameters (including returnvalue), the size of parameter x = 2, the size of parameter y = 2,and the size of the return value (treated as a parameter) = 0.Therefore, IS = 1*(3) + 1*(2+2+0) = 7. Since the class has onlyone method, IS of the class = 7.
Operation argument complexity (OAC) for the method“hasVertex” = �P(i), where P(i) is the size of each parameterof the method = (size of parameter x + size of parameter y +size of return value) = (2+2+0) = 4. Therefore, the OAC ofthe class = 4.
2.2.2 Maintenance Task
The second independent variable in the study was main-tenance task.
Most researchers categorize maintenance activities asadaptive, corrective, and perfective [32]. Adaptive maintenanceis environment-driven. The need for adaptive maintenancearises when there are changes in hardware, operatingsystems, files, or compilers, which impact the system.Corrective maintenance is error-driven. This activity is equiva-lent to debugging, but it occurs after the system is placed inoperation. Since programs are never truly error free,corrective maintenance is required throughout the life of asystem. Perfective maintenance is user driven. Most perfectivemaintenance occurs in the form of report modifications tomeet changing user requirements [32]. The bulk of main-tenance activities are of this latter type. To be representative,two maintenance tasks were used in the study, one of whichwas perfective and the other was corrective.
2.2.3 Variables Held Constant
Languages, hardware, interface modes, tools, and techni-ques used in software production may influence perfor-mance, and are used to measure environment measures.Managerial styles, such as team structures, communication,and feedback are examples of managerial measures. In this
80 IEEE TRANSACTIONS ON SOFTWARE ENGINEERING, VOL. 29, NO. 1, JANUARY 2003
Fig. 3. Class quadrilateral’s interactions.
research, environmental and managerial measures were
kept constant and hence not included in the research model.
2.3 Summary of Research Variables
Based on the above research model, in this study our main
research objective was to focus on the relationship between
the design complexity metrics and the maintenance
performance. Since we measured design complexity using
the metrics we wished to validate, if these metrics are
indeed valid metrics of design complexity, we expected to
see a positive correlation between design complexity and
maintenance time. We studied this relationship in the
contexts of both perfective and corrective maintenance
tasks.
2.4 Hypotheses
The hypotheses for the study are derived from the
following proposition:
P1. There is a relationship between the complexity of a
system’s design and the maintenance time required to
make changes.
Propositions are generic statements made based on the
research model discussed earlier (Fig. 1). P1 is a generic
statement made based on the research model.There are numerous ways to assess whether “a relation-
ship” exists between two variables: t-test/ANOVA, correla-
tion, regression, etc. For each of the metrics of interest in
this study, we performed three types of tests—ANOVA,
correlation, and regression—to assess whether a relation-
ship indeed seems to exist, to see whether each complexity
metric can be used as a reliable indicator of expected
maintenance time. Each test is expressed in terms of a
hypothesis. Both the Null (HO) and the Alternate hypoth-
eses (HA) are shown. The null hypothesis says that
maintenance time does not vary as a function of the metric.
If a metric is valid, we expected to find a significant
relationship between the metric and the maintenance time,
and hence our objective is to be able to reject the null
hypotheses.The following hypotheses formalize these tests:
H1O: There is no difference in the maintenance time
required to make changes to systems, irrespective of
whether they have low- or high-complexity designs:
�1 ¼ �2.
H1A: There is a difference in the maintenance time required
to make changes to systems, depending on whether they
have low- or high-complexity designs: �1 6¼ �2.
H2O: There is no correlation between the complexity of a
system’s design and the maintenance time required to
make changes to that system: � = 0.
H2A: There is a nonzero correlation between the complexity
of a system’s design and the maintenance time required
to make changes to that system: � 6¼ 0.
H3O: There is no linear regression relationship between the
complexity of a system’s design and the maintenance
time required to make changes to that system: �i ¼ 0.
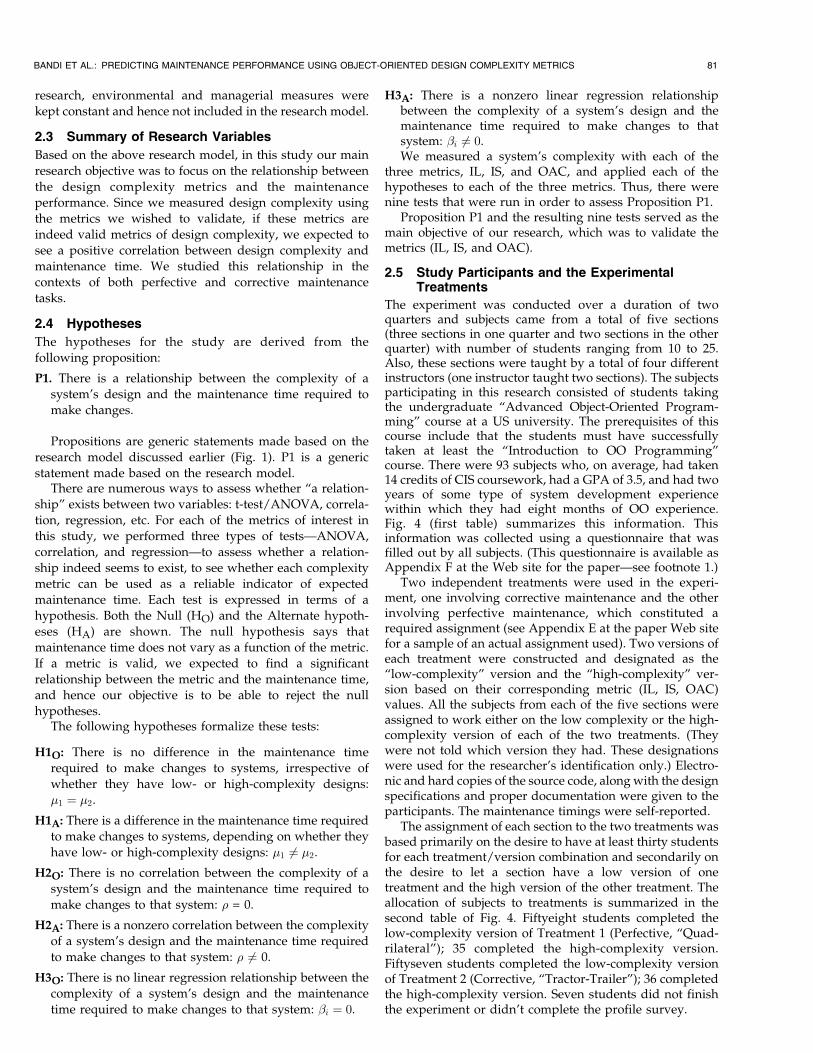
H3A: There is a nonzero linear regression relationshipbetween the complexity of a system’s design and themaintenance time required to make changes to thatsystem: �i 6¼ 0.We measured a system’s complexity with each of the
three metrics, IL, IS, and OAC, and applied each of thehypotheses to each of the three metrics. Thus, there werenine tests that were run in order to assess Proposition P1.
Proposition P1 and the resulting nine tests served as themain objective of our research, which was to validate themetrics (IL, IS, and OAC).
2.5 Study Participants and the ExperimentalTreatments
The experiment was conducted over a duration of twoquarters and subjects came from a total of five sections(three sections in one quarter and two sections in the otherquarter) with number of students ranging from 10 to 25.Also, these sections were taught by a total of four differentinstructors (one instructor taught two sections). The subjectsparticipating in this research consisted of students takingthe undergraduate “Advanced Object-Oriented Program-ming” course at a US university. The prerequisites of thiscourse include that the students must have successfullytaken at least the “Introduction to OO Programming”course. There were 93 subjects who, on average, had taken14 credits of CIS coursework, had a GPA of 3.5, and had twoyears of some type of system development experiencewithin which they had eight months of OO experience.Fig. 4 (first table) summarizes this information. Thisinformation was collected using a questionnaire that wasfilled out by all subjects. (This questionnaire is available asAppendix F at the Web site for the paper—see footnote 1.)
Two independent treatments were used in the experi-ment, one involving corrective maintenance and the otherinvolving perfective maintenance, which constituted arequired assignment (see Appendix E at the paper Web sitefor a sample of an actual assignment used). Two versions ofeach treatment were constructed and designated as the“low-complexity” version and the “high-complexity” ver-sion based on their corresponding metric (IL, IS, OAC)values. All the subjects from each of the five sections wereassigned to work either on the low complexity or the high-complexity version of each of the two treatments. (Theywere not told which version they had. These designationswere used for the researcher’s identification only.) Electro-nic and hard copies of the source code, along with the designspecifications and proper documentation were given to theparticipants. The maintenance timings were self-reported.
The assignment of each section to the two treatments wasbased primarily on the desire to have at least thirty studentsfor each treatment/version combination and secondarily onthe desire to let a section have a low version of onetreatment and the high version of the other treatment. Theallocation of subjects to treatments is summarized in thesecond table of Fig. 4. Fiftyeight students completed thelow-complexity version of Treatment 1 (Perfective, “Quad-rilateral”); 35 completed the high-complexity version.Fiftyseven students completed the low-complexity versionof Treatment 2 (Corrective, “Tractor-Trailer”); 36 completedthe high-complexity version. Seven students did not finishthe experiment or didn’t complete the profile survey.
BANDI ET AL.: PREDICTING MAINTENANCE PERFORMANCE USING OBJECT-ORIENTED DESIGN COMPLEXITY METRICS 81
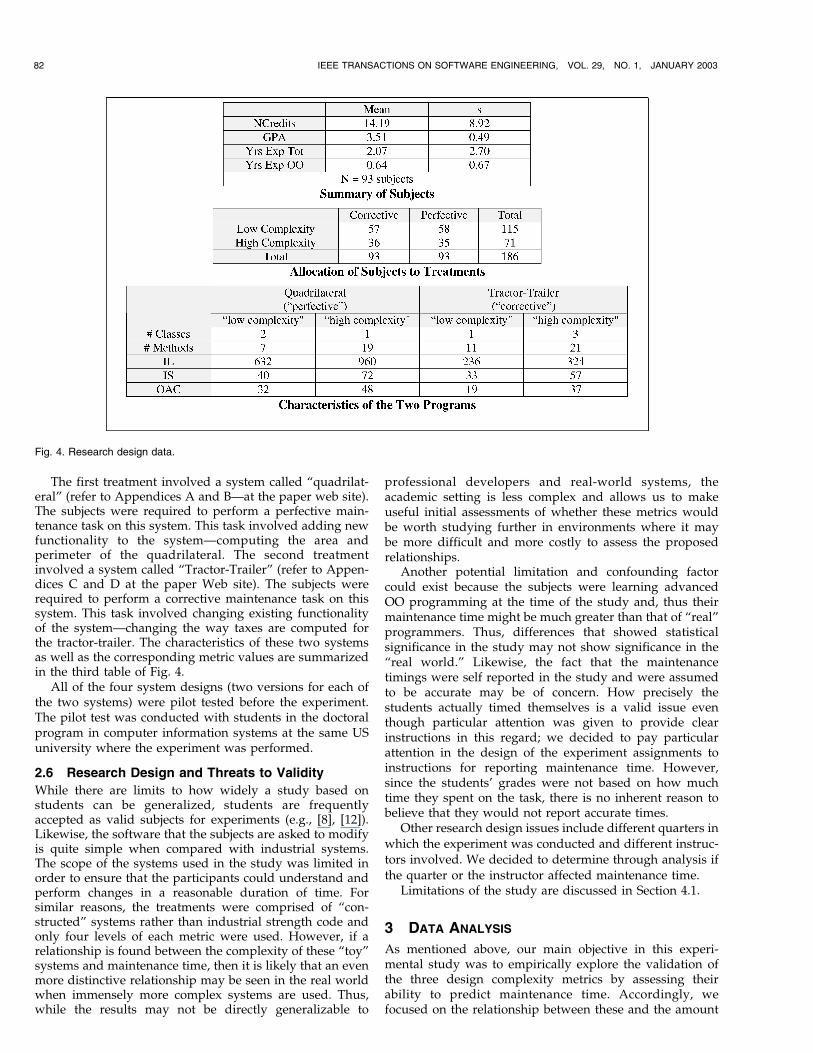
The first treatment involved a system called “quadrilat-eral” (refer to Appendices A and B—at the paper web site).The subjects were required to perform a perfective main-tenance task on this system. This task involved adding newfunctionality to the system—computing the area andperimeter of the quadrilateral. The second treatmentinvolved a system called “Tractor-Trailer” (refer to Appen-dices C and D at the paper Web site). The subjects wererequired to perform a corrective maintenance task on thissystem. This task involved changing existing functionalityof the system—changing the way taxes are computed forthe tractor-trailer. The characteristics of these two systemsas well as the corresponding metric values are summarizedin the third table of Fig. 4.
All of the four system designs (two versions for each ofthe two systems) were pilot tested before the experiment.The pilot test was conducted with students in the doctoralprogram in computer information systems at the same USuniversity where the experiment was performed.
2.6 Research Design and Threats to Validity
While there are limits to how widely a study based onstudents can be generalized, students are frequentlyaccepted as valid subjects for experiments (e.g., [8], [12]).Likewise, the software that the subjects are asked to modifyis quite simple when compared with industrial systems.The scope of the systems used in the study was limited inorder to ensure that the participants could understand andperform changes in a reasonable duration of time. Forsimilar reasons, the treatments were comprised of “con-structed” systems rather than industrial strength code andonly four levels of each metric were used. However, if arelationship is found between the complexity of these “toy”systems and maintenance time, then it is likely that an evenmore distinctive relationship may be seen in the real worldwhen immensely more complex systems are used. Thus,while the results may not be directly generalizable to
professional developers and real-world systems, theacademic setting is less complex and allows us to makeuseful initial assessments of whether these metrics wouldbe worth studying further in environments where it maybe more difficult and more costly to assess the proposedrelationships.
Another potential limitation and confounding factorcould exist because the subjects were learning advancedOO programming at the time of the study and, thus theirmaintenance time might be much greater than that of “real”programmers. Thus, differences that showed statisticalsignificance in the study may not show significance in the“real world.” Likewise, the fact that the maintenancetimings were self reported in the study and were assumedto be accurate may be of concern. How precisely thestudents actually timed themselves is a valid issue eventhough particular attention was given to provide clearinstructions in this regard; we decided to pay particularattention in the design of the experiment assignments toinstructions for reporting maintenance time. However,since the students’ grades were not based on how muchtime they spent on the task, there is no inherent reason tobelieve that they would not report accurate times.
Other research design issues include different quarters inwhich the experiment was conducted and different instruc-tors involved. We decided to determine through analysis ifthe quarter or the instructor affected maintenance time.
Limitations of the study are discussed in Section 4.1.
3 DATA ANALYSIS
As mentioned above, our main objective in this experi-mental study was to empirically explore the validation ofthe three design complexity metrics by assessing theirability to predict maintenance time. Accordingly, wefocused on the relationship between these and the amount
82 IEEE TRANSACTIONS ON SOFTWARE ENGINEERING, VOL. 29, NO. 1, JANUARY 2003
Fig. 4. Research design data.
of maintenance time, based on the research model dis-cussed earlier. We conducted ANOVAs to determine if themean maintenance times for the high- and low-complexityversions (categorized as high or low based on all threemetric values) were significantly different, to be able toreject null hypothesis H1 for all three metrics. Weconducted additional ANOVA tests to rule out thepossibility that the different instructors who had taughtthe course sections, and the quarter in which the study wasconducted, had any significant effect on the maintenancetimes observed.
We also conducted a correlation analysis and bothsimple as well as multiple regression analyses to examinethe importance of each metric (IL, IS, and OAC) indetermining maintenance time. We found in all cases thatthe results were significant and, thus, were able to reject thenull hypotheses H2 and H3 for all three metrics. In order tovalidate our analyses, we divided the data into modelbuilding and holdout data sets [37], [42], [45], [48].Comparing the results obtained from the model-buildingand holdout data sets allowed us to gain confidence thatour models and conclusions were valid. We built modelsusing three different holdout sizes: 28 percent, 16 percent,and no holdout.
3.1 Experimental Results
The following analyses were conducted on the datagathered.
3.1.1 Complexity versus Maintenance Time—Analysis
of Variance (ANOVA)
As mentioned above, each subject received two treatments:a quadrilateral system requiring perfective maintenance(treatment 1) and a tractor-trailer system requiring correc-tive maintenance (treatment 2). For each treatment, a singlefactor ANOVA was performed to verify if the true meansof the dependent variable (maintenance time) for the twogroups (high complexity and low complexity systems)were equal.
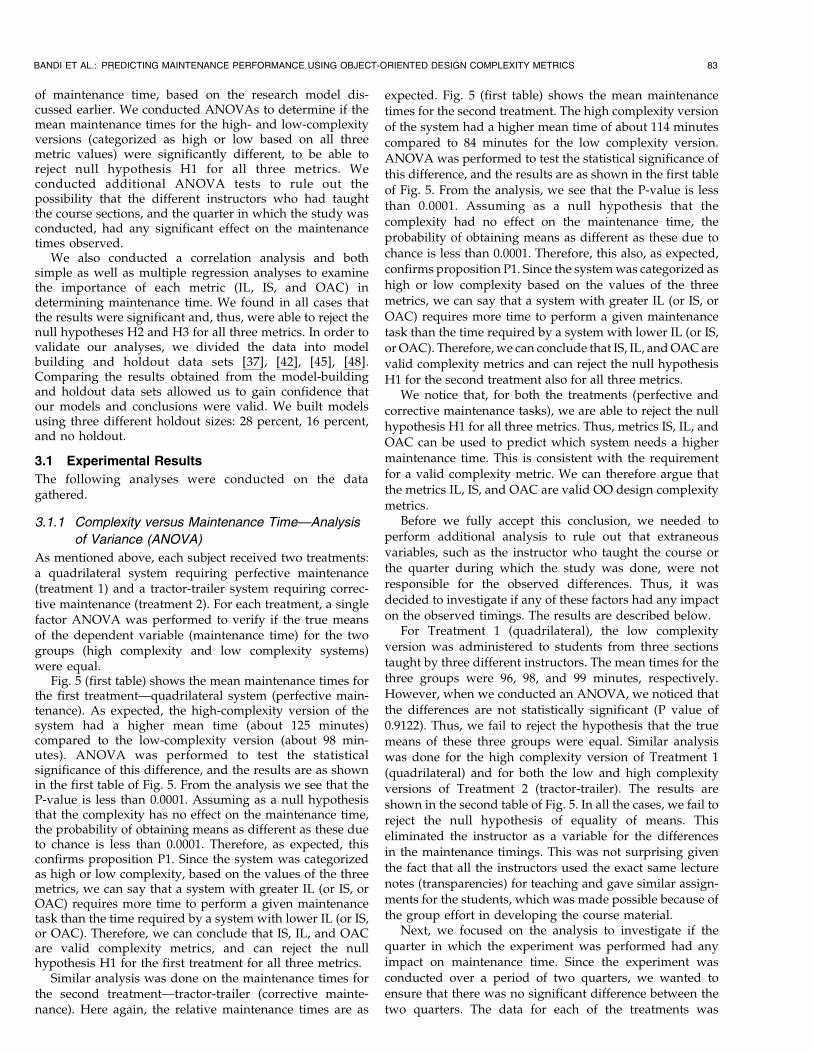
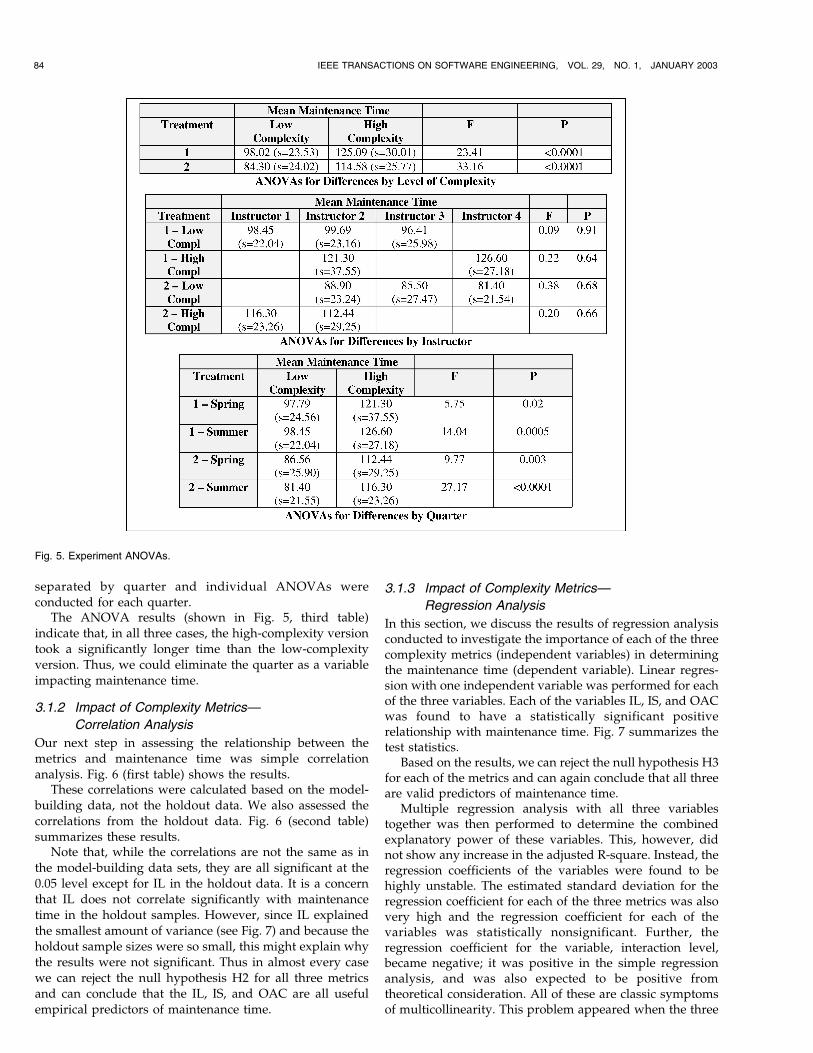
Fig. 5 (first table) shows the mean maintenance times forthe first treatment—quadrilateral system (perfective main-tenance). As expected, the high-complexity version of thesystem had a higher mean time (about 125 minutes)compared to the low-complexity version (about 98 min-utes). ANOVA was performed to test the statisticalsignificance of this difference, and the results are as shownin the first table of Fig. 5. From the analysis we see that theP-value is less than 0.0001. Assuming as a null hypothesisthat the complexity has no effect on the maintenance time,the probability of obtaining means as different as these dueto chance is less than 0.0001. Therefore, as expected, thisconfirms proposition P1. Since the system was categorizedas high or low complexity, based on the values of the threemetrics, we can say that a system with greater IL (or IS, orOAC) requires more time to perform a given maintenancetask than the time required by a system with lower IL (or IS,or OAC). Therefore, we can conclude that IS, IL, and OACare valid complexity metrics, and can reject the nullhypothesis H1 for the first treatment for all three metrics.
Similar analysis was done on the maintenance times forthe second treatment—tractor-trailer (corrective mainte-nance). Here again, the relative maintenance times are as
expected. Fig. 5 (first table) shows the mean maintenancetimes for the second treatment. The high complexity versionof the system had a higher mean time of about 114 minutescompared to 84 minutes for the low complexity version.ANOVA was performed to test the statistical significance ofthis difference, and the results are as shown in the first tableof Fig. 5. From the analysis, we see that the P-value is lessthan 0.0001. Assuming as a null hypothesis that thecomplexity had no effect on the maintenance time, theprobability of obtaining means as different as these due tochance is less than 0.0001. Therefore, this also, as expected,confirms proposition P1. Since the system was categorized ashigh or low complexity based on the values of the threemetrics, we can say that a system with greater IL (or IS, orOAC) requires more time to perform a given maintenancetask than the time required by a system with lower IL (or IS,or OAC). Therefore, we can conclude that IS, IL, and OAC arevalid complexity metrics and can reject the null hypothesisH1 for the second treatment also for all three metrics.
We notice that, for both the treatments (perfective andcorrective maintenance tasks), we are able to reject the nullhypothesis H1 for all three metrics. Thus, metrics IS, IL, andOAC can be used to predict which system needs a highermaintenance time. This is consistent with the requirementfor a valid complexity metric. We can therefore argue thatthe metrics IL, IS, and OAC are valid OO design complexitymetrics.
Before we fully accept this conclusion, we needed toperform additional analysis to rule out that extraneousvariables, such as the instructor who taught the course orthe quarter during which the study was done, were notresponsible for the observed differences. Thus, it wasdecided to investigate if any of these factors had any impacton the observed timings. The results are described below.
For Treatment 1 (quadrilateral), the low complexityversion was administered to students from three sectionstaught by three different instructors. The mean times for thethree groups were 96, 98, and 99 minutes, respectively.However, when we conducted an ANOVA, we noticed thatthe differences are not statistically significant (P value of0.9122). Thus, we fail to reject the hypothesis that the truemeans of these three groups were equal. Similar analysiswas done for the high complexity version of Treatment 1(quadrilateral) and for both the low and high complexityversions of Treatment 2 (tractor-trailer). The results areshown in the second table of Fig. 5. In all the cases, we fail toreject the null hypothesis of equality of means. Thiseliminated the instructor as a variable for the differencesin the maintenance timings. This was not surprising giventhe fact that all the instructors used the exact same lecturenotes (transparencies) for teaching and gave similar assign-ments for the students, which was made possible because ofthe group effort in developing the course material.
Next, we focused on the analysis to investigate if thequarter in which the experiment was performed had anyimpact on maintenance time. Since the experiment wasconducted over a period of two quarters, we wanted toensure that there was no significant difference between thetwo quarters. The data for each of the treatments was
BANDI ET AL.: PREDICTING MAINTENANCE PERFORMANCE USING OBJECT-ORIENTED DESIGN COMPLEXITY METRICS 83
separated by quarter and individual ANOVAs wereconducted for each quarter.
The ANOVA results (shown in Fig. 5, third table)indicate that, in all three cases, the high-complexity versiontook a significantly longer time than the low-complexityversion. Thus, we could eliminate the quarter as a variableimpacting maintenance time.
3.1.2 Impact of Complexity Metrics—
Correlation Analysis
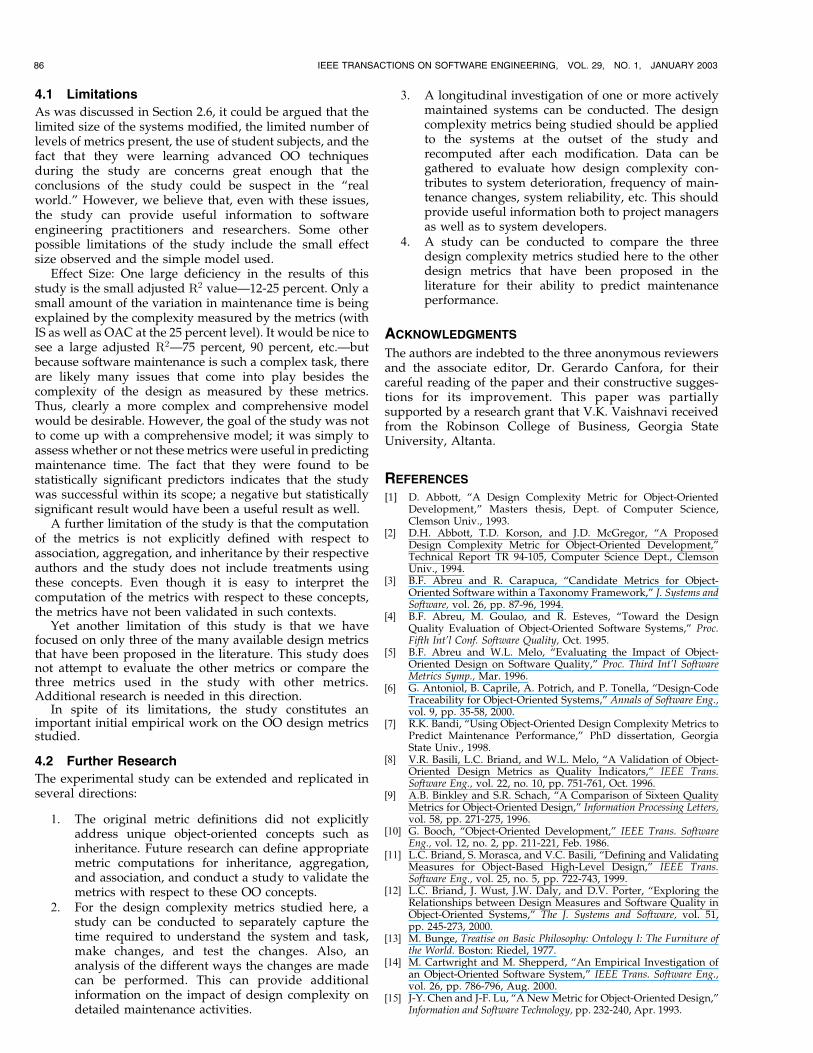
Our next step in assessing the relationship between themetrics and maintenance time was simple correlationanalysis. Fig. 6 (first table) shows the results.
These correlations were calculated based on the model-building data, not the holdout data. We also assessed thecorrelations from the holdout data. Fig. 6 (second table)summarizes these results.
Note that, while the correlations are not the same as inthe model-building data sets, they are all significant at the0.05 level except for IL in the holdout data. It is a concernthat IL does not correlate significantly with maintenancetime in the holdout samples. However, since IL explainedthe smallest amount of variance (see Fig. 7) and because theholdout sample sizes were so small, this might explain whythe results were not significant. Thus in almost every casewe can reject the null hypothesis H2 for all three metricsand can conclude that the IL, IS, and OAC are all usefulempirical predictors of maintenance time.
3.1.3 Impact of Complexity Metrics—
Regression Analysis
In this section, we discuss the results of regression analysisconducted to investigate the importance of each of the threecomplexity metrics (independent variables) in determiningthe maintenance time (dependent variable). Linear regres-sion with one independent variable was performed for eachof the three variables. Each of the variables IL, IS, and OACwas found to have a statistically significant positiverelationship with maintenance time. Fig. 7 summarizes thetest statistics.
Based on the results, we can reject the null hypothesis H3for each of the metrics and can again conclude that all threeare valid predictors of maintenance time.
Multiple regression analysis with all three variablestogether was then performed to determine the combinedexplanatory power of these variables. This, however, didnot show any increase in the adjusted R-square. Instead, theregression coefficients of the variables were found to behighly unstable. The estimated standard deviation for theregression coefficient for each of the three metrics was alsovery high and the regression coefficient for each of thevariables was statistically nonsignificant. Further, theregression coefficient for the variable, interaction level,became negative; it was positive in the simple regressionanalysis, and was also expected to be positive fromtheoretical consideration. All of these are classic symptomsof multicollinearity. This problem appeared when the three
84 IEEE TRANSACTIONS ON SOFTWARE ENGINEERING, VOL. 29, NO. 1, JANUARY 2003
Fig. 5. Experiment ANOVAs.
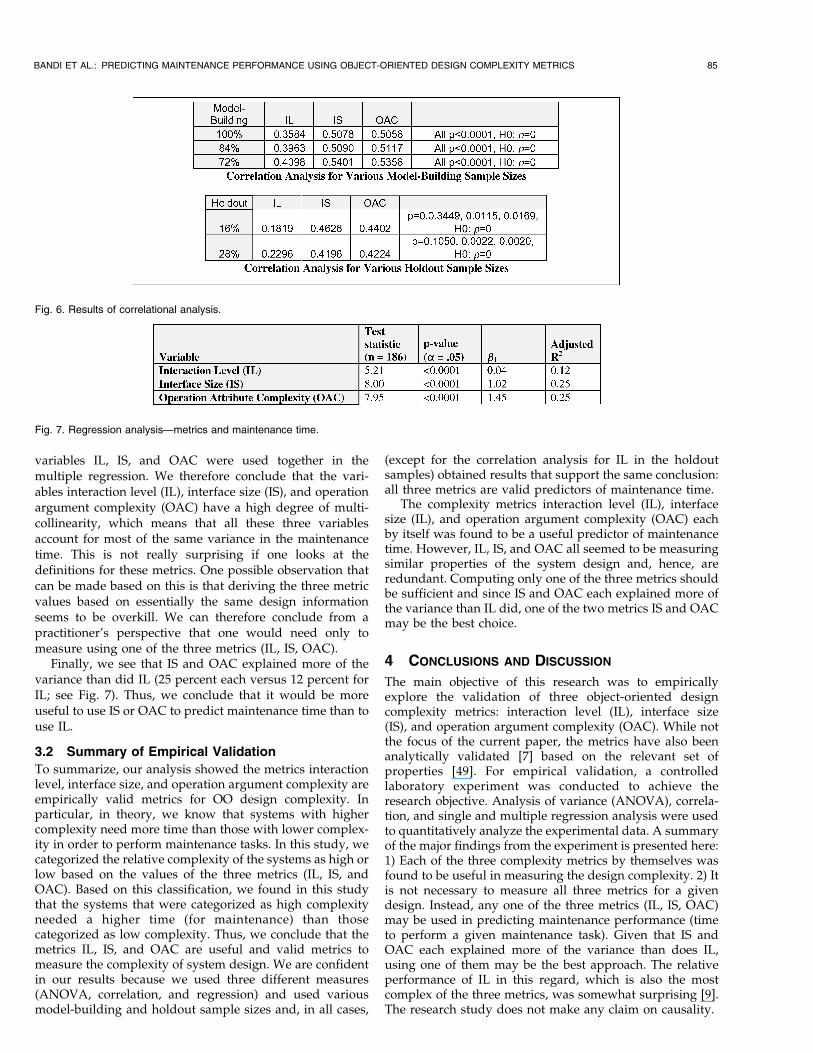
variables IL, IS, and OAC were used together in themultiple regression. We therefore conclude that the vari-ables interaction level (IL), interface size (IS), and operationargument complexity (OAC) have a high degree of multi-collinearity, which means that all these three variablesaccount for most of the same variance in the maintenancetime. This is not really surprising if one looks at thedefinitions for these metrics. One possible observation thatcan be made based on this is that deriving the three metricvalues based on essentially the same design informationseems to be overkill. We can therefore conclude from apractitioner’s perspective that one would need only tomeasure using one of the three metrics (IL, IS, OAC).
Finally, we see that IS and OAC explained more of thevariance than did IL (25 percent each versus 12 percent forIL; see Fig. 7). Thus, we conclude that it would be moreuseful to use IS or OAC to predict maintenance time than touse IL.
3.2 Summary of Empirical Validation
To summarize, our analysis showed the metrics interactionlevel, interface size, and operation argument complexity areempirically valid metrics for OO design complexity. Inparticular, in theory, we know that systems with highercomplexity need more time than those with lower complex-ity in order to perform maintenance tasks. In this study, wecategorized the relative complexity of the systems as high orlow based on the values of the three metrics (IL, IS, andOAC). Based on this classification, we found in this studythat the systems that were categorized as high complexityneeded a higher time (for maintenance) than thosecategorized as low complexity. Thus, we conclude that themetrics IL, IS, and OAC are useful and valid metrics tomeasure the complexity of system design. We are confidentin our results because we used three different measures(ANOVA, correlation, and regression) and used variousmodel-building and holdout sample sizes and, in all cases,
(except for the correlation analysis for IL in the holdoutsamples) obtained results that support the same conclusion:all three metrics are valid predictors of maintenance time.
The complexity metrics interaction level (IL), interfacesize (IL), and operation argument complexity (OAC) eachby itself was found to be a useful predictor of maintenancetime. However, IL, IS, and OAC all seemed to be measuringsimilar properties of the system design and, hence, areredundant. Computing only one of the three metrics shouldbe sufficient and since IS and OAC each explained more ofthe variance than IL did, one of the two metrics IS and OACmay be the best choice.
4 CONCLUSIONS AND DISCUSSION
The main objective of this research was to empiricallyexplore the validation of three object-oriented designcomplexity metrics: interaction level (IL), interface size(IS), and operation argument complexity (OAC). While notthe focus of the current paper, the metrics have also beenanalytically validated [7] based on the relevant set ofproperties [49]. For empirical validation, a controlledlaboratory experiment was conducted to achieve theresearch objective. Analysis of variance (ANOVA), correla-tion, and single and multiple regression analysis were usedto quantitatively analyze the experimental data. A summaryof the major findings from the experiment is presented here:1) Each of the three complexity metrics by themselves wasfound to be useful in measuring the design complexity. 2) Itis not necessary to measure all three metrics for a givendesign. Instead, any one of the three metrics (IL, IS, OAC)may be used in predicting maintenance performance (timeto perform a given maintenance task). Given that IS andOAC each explained more of the variance than does IL,using one of them may be the best approach. The relativeperformance of IL in this regard, which is also the mostcomplex of the three metrics, was somewhat surprising [9].The research study does not make any claim on causality.
BANDI ET AL.: PREDICTING MAINTENANCE PERFORMANCE USING OBJECT-ORIENTED DESIGN COMPLEXITY METRICS 85
Fig. 6. Results of correlational analysis.
Fig. 7. Regression analysis—metrics and maintenance time.
4.1 Limitations
As was discussed in Section 2.6, it could be argued that thelimited size of the systems modified, the limited number oflevels of metrics present, the use of student subjects, and thefact that they were learning advanced OO techniquesduring the study are concerns great enough that theconclusions of the study could be suspect in the “realworld.” However, we believe that, even with these issues,the study can provide useful information to softwareengineering practitioners and researchers. Some otherpossible limitations of the study include the small effectsize observed and the simple model used.
Effect Size: One large deficiency in the results of thisstudy is the small adjusted R2 value—12-25 percent. Only asmall amount of the variation in maintenance time is beingexplained by the complexity measured by the metrics (withIS as well as OAC at the 25 percent level). It would be nice tosee a large adjusted R2—75 percent, 90 percent, etc.—butbecause software maintenance is such a complex task, thereare likely many issues that come into play besides thecomplexity of the design as measured by these metrics.Thus, clearly a more complex and comprehensive modelwould be desirable. However, the goal of the study was notto come up with a comprehensive model; it was simply toassess whether or not these metrics were useful in predictingmaintenance time. The fact that they were found to bestatistically significant predictors indicates that the studywas successful within its scope; a negative but statisticallysignificant result would have been a useful result as well.
A further limitation of the study is that the computationof the metrics is not explicitly defined with respect toassociation, aggregation, and inheritance by their respectiveauthors and the study does not include treatments usingthese concepts. Even though it is easy to interpret thecomputation of the metrics with respect to these concepts,the metrics have not been validated in such contexts.
Yet another limitation of this study is that we havefocused on only three of the many available design metricsthat have been proposed in the literature. This study doesnot attempt to evaluate the other metrics or compare thethree metrics used in the study with other metrics.Additional research is needed in this direction.
In spite of its limitations, the study constitutes animportant initial empirical work on the OO design metricsstudied.
4.2 Further Research
The experimental study can be extended and replicated inseveral directions:
1. The original metric definitions did not explicitlyaddress unique object-oriented concepts such asinheritance. Future research can define appropriatemetric computations for inheritance, aggregation,and association, and conduct a study to validate themetrics with respect to these OO concepts.
2. For the design complexity metrics studied here, astudy can be conducted to separately capture thetime required to understand the system and task,make changes, and test the changes. Also, ananalysis of the different ways the changes are madecan be performed. This can provide additionalinformation on the impact of design complexity ondetailed maintenance activities.
3. A longitudinal investigation of one or more activelymaintained systems can be conducted. The designcomplexity metrics being studied should be appliedto the systems at the outset of the study andrecomputed after each modification. Data can begathered to evaluate how design complexity con-tributes to system deterioration, frequency of main-tenance changes, system reliability, etc. This shouldprovide useful information both to project managersas well as to system developers.
4. A study can be conducted to compare the threedesign complexity metrics studied here to the otherdesign metrics that have been proposed in theliterature for their ability to predict maintenanceperformance.
ACKNOWLEDGMENTS
The authors are indebted to the three anonymous reviewersand the associate editor, Dr. Gerardo Canfora, for theircareful reading of the paper and their constructive sugges-tions for its improvement. This paper was partiallysupported by a research grant that V.K. Vaishnavi receivedfrom the Robinson College of Business, Georgia StateUniversity, Altanta.
REFERENCES
[1] D. Abbott, “A Design Complexity Metric for Object-OrientedDevelopment,” Masters thesis, Dept. of Computer Science,Clemson Univ., 1993.
[2] D.H. Abbott, T.D. Korson, and J.D. McGregor, “A ProposedDesign Complexity Metric for Object-Oriented Development,”Technical Report TR 94-105, Computer Science Dept., ClemsonUniv., 1994.
[3] B.F. Abreu and R. Carapuca, “Candidate Metrics for Object-Oriented Software within a Taxonomy Framework,” J. Systems andSoftware, vol. 26, pp. 87-96, 1994.
[4] B.F. Abreu, M. Goulao, and R. Esteves, “Toward the DesignQuality Evaluation of Object-Oriented Software Systems,” Proc.Fifth Int’l Conf. Software Quality, Oct. 1995.
[5] B.F. Abreu and W.L. Melo, “Evaluating the Impact of Object-Oriented Design on Software Quality,” Proc. Third Int’l SoftwareMetrics Symp., Mar. 1996.
[6] G. Antoniol, B. Caprile, A. Potrich, and P. Tonella, “Design-CodeTraceability for Object-Oriented Systems,” Annals of Software Eng.,vol. 9, pp. 35-58, 2000.
[7] R.K. Bandi, “Using Object-Oriented Design Complexity Metrics toPredict Maintenance Performance,” PhD dissertation, GeorgiaState Univ., 1998.
[8] V.R. Basili, L.C. Briand, and W.L. Melo, “A Validation of Object-Oriented Design Metrics as Quality Indicators,” IEEE Trans.Software Eng., vol. 22, no. 10, pp. 751-761, Oct. 1996.
[9] A.B. Binkley and S.R. Schach, “A Comparison of Sixteen QualityMetrics for Object-Oriented Design,” Information Processing Letters,vol. 58, pp. 271-275, 1996.
[10] G. Booch, “Object-Oriented Development,” IEEE Trans. SoftwareEng., vol. 12, no. 2, pp. 211-221, Feb. 1986.
[11] L.C. Briand, S. Morasca, and V.C. Basili, “Defining and ValidatingMeasures for Object-Based High-Level Design,” IEEE Trans.Software Eng., vol. 25, no. 5, pp. 722-743, 1999.
[12] L.C. Briand, J. Wust, J.W. Daly, and D.V. Porter, “Exploring theRelationships between Design Measures and Software Quality inObject-Oriented Systems,” The J. Systems and Software, vol. 51,pp. 245-273, 2000.
[13] M. Bunge, Treatise on Basic Philosophy: Ontology I: The Furniture ofthe World. Boston: Riedel, 1977.
[14] M. Cartwright and M. Shepperd, “An Empirical Investigation ofan Object-Oriented Software System,” IEEE Trans. Software Eng.,vol. 26, pp. 786-796, Aug. 2000.
[15] J-Y. Chen and J-F. Lu, “A New Metric for Object-Oriented Design,”Information and Software Technology, pp. 232-240, Apr. 1993.
86 IEEE TRANSACTIONS ON SOFTWARE ENGINEERING, VOL. 29, NO. 1, JANUARY 2003
[16] S.R. Chidamber and C.F. Kemerer, “Towards Metric Suite forObject-Oriented Design,” Proc. Sixth ACM Conf. Object OrientedProgramming Systems, Language, and Applications (OOPSLA),pp. 197-211, Nov. 1991.
[17] S.R. Chidamber and C.F. Kemerer, “A Metrics Suite for ObjectOriented Design,” IEEE Trans. Software Eng., pp. 476-493, June 1994.
[18] N.I. Churcher and M.J. Shepperd, “Comments on ’A Metrics Suitefor Object Oriented Design’,” IEEE Trans. Software Eng., vol. 21,pp. 263-265, Mar. 1995.
[19] D. Coleman, D. Lowther, and P. Oman, “The Application ofSoftware Maintainability Models in Industrial Software Systems,”J. Systems Software, vol. 29, pp. 3-16, 1995.
[20] B. Curtis, S.B. Shepperd, P. Milliman, M.A. Borst, and T. Love,“Measuring the Psychological Complexity of Software Mainte-nance Tasks with the Halstead and McCabe Metrics,” IEEE Trans.Software Eng., pp. 96-104, Mar. 1979.
[21] D. De Champeaux, Object-Oriented Development Process andMetrics. Prentice-Hall, 1997.
[22] L. Etzcorn, J. Bansiya, and C. Davis, “Design and Code Complex-ity Metrics for OO Classes,” J. Object-Oriented Programming, vol. 12,no. 1, pp. 35-40, 1999.
[23] N.E. Fenton and S.L. Pfleeger, Software Metrics, A Rigorous andPractical Approach, second ed. Boston: Int’l Thomson ComputerPress, 1997.
[24] R. Fiutem and A. Antoniol, “Identifying Design-Code Inconsis-tencies in Object-Oriented Software: A Case Study,” Proc. Int’lConf. Software Maintenance, pp. 94-102, 1998.
[25] V.R. Gibson and J.A. Senn, “System Structure and SoftwareMaintenance Performance,” Comm. ACM, pp. 347-358, Mar. 1989.
[26] R. Harrison, S.J. Counsell, and R.V. Nithi, “An Evaluation of theMood Set of Object-Oriented Software Metrics,” IEEE Trans.Software Eng., vol. 24, pp. 491-496, June 1998.
[27] B. Henderson-Sellers, Object-Oriented Metrics: Measures of Complex-ity. Prentice-Hall, 1996.
[28] B. Henderson-Sellers, “The Mathematical Validity of SoftwareMetrics,” Software Eng. Notes, vol. 21, no. 5, pp. 89-94, Sept. 1996.
[29] S. Henry and C. Selig, “Predicting Source-Code Complexity at theDesign Stage,” IEEE Software, pp. 36-44, Mar. 1990.
[30] M. Hitz and B. Montazeri, “Chidamber and Kemerer’s MetricsSuite: A Measurement Theory Perspective,” IEEE Trans. SoftwareEng., vol. 22, no. 4, pp. 267-271, Apr. 1996.
[31] R. Kolewe, “Metrics in Object-Oriented Design and Program-ming,” Software Development, pp. 53-62, Oct. 1993.
[32] B.P. Lientz and E.B. Swanson, Software Maintenance Management.Reading, Mass.: Addison-Wesley, 1980.
[33] W. Li and S. Henry, “Object Oriented Metrics that PredictMaintainability,” J. Systems and Software, pp. 111-122, Nov. 1993.
[34] W. Li, S. Henry, D. Kafura, and R. Schulman, “Measuring Object-Oriented Design,” J. Object-Oriented Programming, vol. 8, no. 4,pp. 48-55, July/Aug. 1995.
[35] M. Lorenz and J. Kidd, Object Oriented Software Metrics. Engle-wood Cliffs, N.J.: Prentice Hall, 1994.
[36] D. Mancl and W. Havanas, “A Study of the Impact of C++ onSoftware Maintenance,” Proc. IEEE Conf. Software Maintenance,pp. 63-69, Nov. 1990.
[37] J. Neter, W. Wasserman, and M. Kutner, Applied Linear StatisticalModels: Regression, Analysis of Variance, and Experimental Designs,third ed. Boston: Irwin, 1990.
[38] T. Pearse and P. Oman, “Maintainability Measurements onIndustrial Source Code Maintenance Activities,” Proc. Int’l Conf.Software Maintenance, pp. 295-303, 1995.
[39] L.S. Rising, “Information Hiding Metrics for Modular Program-ming Languages,” PhD dissertation, Arizona State Univ., 1992.
[40] H.D. Rombach, “A Controlled Experiment on the Impact ofSoftware Structure on Maintainability,” IEEE Trans. Software Eng.,pp. 344-354, Mar. 1987.
[41] H.D. Rombach, “Design Measurement: Some Lessons Learned,”IEEE Software, pp. 17-25, Mar. 1990.
[42] R.D. Snee, “Validation of Regression Models: Methods andExamples,” Technometrics, vol. 19, pp. 415-428, 1977.
[43] H.M. Sneed, “Applying Size Complexity and Quality Metrics toan Object-Oriented Application,” Proc. European Software Controland Metrics Conf.-Software Certification Programme in Europe(ESCOM-SCOPE), 1999.
[44] H.M. Sneed and T. Dombovari, “Comprehending a Complex,Distributed, Object-oriented Software System: A Report from theField,” Proc. Seventh Int’l Workshop Program Comprehension, 1999.
[45] M. Stone, “Cross-Validatory Choice and Assessment of StatisticalPredictions (with Discussion),” J. Royal Statistical Soc. B, vol. 36,pp. 111-147, 1974.
[46] D. Taylor, “Software Metrics for Object-Oriented Technology,”Object Magazine, pp. 22-28, Mar.-Apr. 1993.
[47] D.P. Tegarden, S.D. Sheetz, and D.E. Monarchi, “A SoftwareComplexity Model of Object-Oriented Systems,” Decision SupportSystems, vol. 13, nos. 3/4, pp. 241-262, Mar. 1995.
[48] W.N. Venables and B.D. Ripley, Modern Applied Statistics withS_PLUS. Springer, 1999.
[49] E.J. Weyuker, “Evaluating Software Complexity Measures,” IEEETrans. Software Eng., pp. 1357-1365, Sept. 1988.
[50] N. Wilde and R. Huitt, “Maintenance Support for Object-OrientedPrograms,” IEEE Trans. Software Eng., pp. 1038-1044, Dec. 1992.
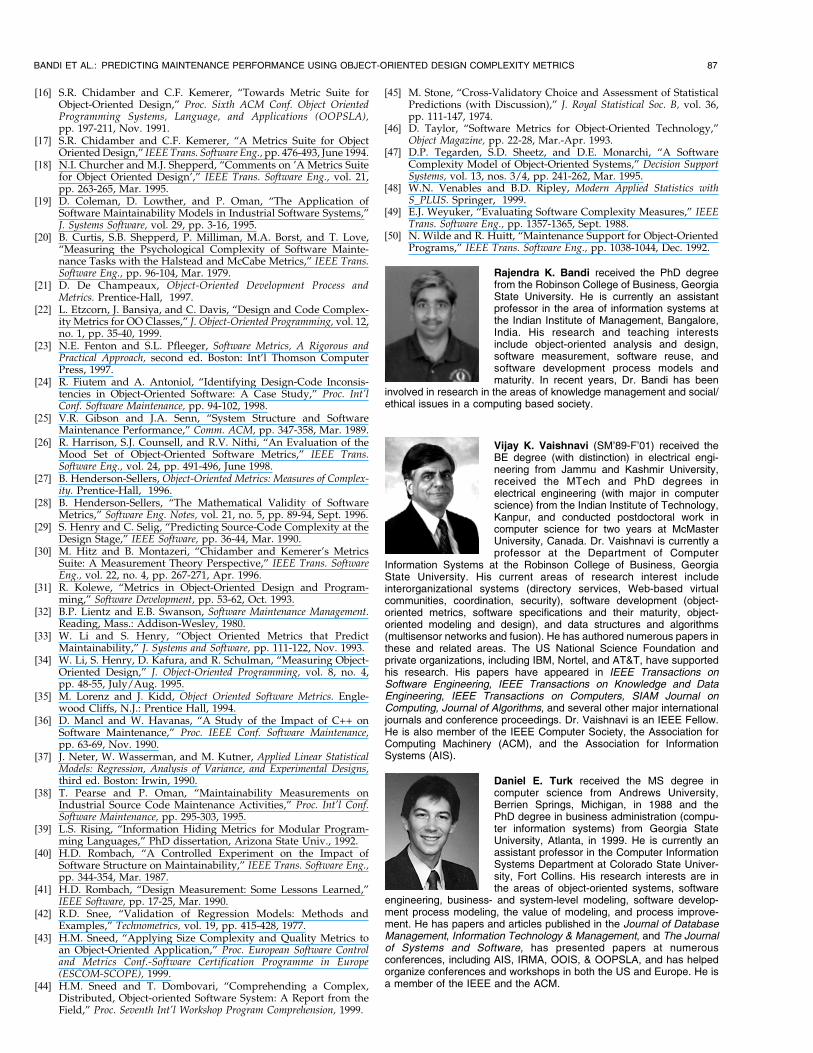
Rajendra K. Bandi received the PhD degreefrom the Robinson College of Business, GeorgiaState University. He is currently an assistantprofessor in the area of information systems atthe Indian Institute of Management, Bangalore,India. His research and teaching interestsinclude object-oriented analysis and design,software measurement, software reuse, andsoftware development process models andmaturity. In recent years, Dr. Bandi has been
involved in research in the areas of knowledge management and social/ethical issues in a computing based society.
Vijay K. Vaishnavi (SM’89-F’01) received theBE degree (with distinction) in electrical engi-neering from Jammu and Kashmir University,received the MTech and PhD degrees inelectrical engineering (with major in computerscience) from the Indian Institute of Technology,Kanpur, and conducted postdoctoral work incomputer science for two years at McMasterUniversity, Canada. Dr. Vaishnavi is currently aprofessor at the Department of Computer
Information Systems at the Robinson College of Business, GeorgiaState University. His current areas of research interest includeinterorganizational systems (directory services, Web-based virtualcommunities, coordination, security), software development (object-oriented metrics, software specifications and their maturity, object-oriented modeling and design), and data structures and algorithms(multisensor networks and fusion). He has authored numerous papers inthese and related areas. The US National Science Foundation andprivate organizations, including IBM, Nortel, and AT&T, have supportedhis research. His papers have appeared in IEEE Transactions onSoftware Engineering, IEEE Transactions on Knowledge and DataEngineering, IEEE Transactions on Computers, SIAM Journal onComputing, Journal of Algorithms, and several other major internationaljournals and conference proceedings. Dr. Vaishnavi is an IEEE Fellow.He is also member of the IEEE Computer Society, the Association forComputing Machinery (ACM), and the Association for InformationSystems (AIS).
Daniel E. Turk received the MS degree incomputer science from Andrews University,Berrien Springs, Michigan, in 1988 and thePhD degree in business administration (compu-ter information systems) from Georgia StateUniversity, Atlanta, in 1999. He is currently anassistant professor in the Computer InformationSystems Department at Colorado State Univer-sity, Fort Collins. His research interests are inthe areas of object-oriented systems, software
engineering, business- and system-level modeling, software develop-ment process modeling, the value of modeling, and process improve-ment. He has papers and articles published in the Journal of DatabaseManagement, Information Technology & Management, and The Journalof Systems and Software, has presented papers at numerousconferences, including AIS, IRMA, OOIS, & OOPSLA, and has helpedorganize conferences and workshops in both the US and Europe. He isa member of the IEEE and the ACM.
BANDI ET AL.: PREDICTING MAINTENANCE PERFORMANCE USING OBJECT-ORIENTED DESIGN COMPLEXITY METRICS 87
Related Documents


![When do Software Complexity Metrics Mean Nothing? do Software Complexity Metrics Mean ... and Hassan [40] ask whether code metrics are affected by ... When do Software Complexity Metrics](https://static.cupdf.com/doc/110x72/5ab63d137f8b9ab47e8da4f2/when-do-software-complexity-metrics-mean-nothing-do-software-complexity-metrics.jpg)

