1 Predicting Diabetic Readmission Rates: Moving Beyond HbA1c Damian Mingle WPC Healthcare, Nashville, USA Corresponding author: Damian Mingle, Chief Data Scientist, WPC Healthcare, 1802 Williamson Court, Brentwood, TN 37027, USA Email: [email protected] Abstract Hospital readmission is considered an effective measurement of care provided within healthcare. Being able to risk identify patients facing a high likelihood of unplanned hospital readmission in the next 30- days could allow for further investigation and possibly prevent the readmission. Current models, such as LACE, sacrifice accuracy in order to allow for end-users to have a straight forward and simple experience. This study acknowledges that while HbA1c is important, it may not be critical in predicting readmissions. It also investigates the hypothesis that using machine learning on a wide feature, making use of model diversity, and blending prediction will improve the accuracy of readmission risk predictions compared with existing techniques. A dataset originally containing 100,000 admissions and 56 features was used to evaluate the hypothesis. The results from the study are encouraging and can help healthcare providers improve inpatient diabetic care. Keywords: Predictive modeling, 30-day readmission, hospital readmission, type 2 diabetes, diabetes mellitus 1. Introduction A survey conducted by the Agency for Healthcare Research and Quality (AHRQ) found that in the year 2011 more than 3.3 million patients were readmitted in the United States within 30- days of being discharged. Over $250 million was spent on treatment of readmitted diabetic patients in 2011 (Hines et al., 2014). Current practice to identify at-risk diabetic patients are subjective: a clinician will assess the patient and decide what the appropriate care plan is for that individual. Research has shown that these subjective methods for determining readmission are slightly better than random guessing (Allaudeen et al., 2011) . However, there are tools to objectively score readmission risk, such as LACE (van Walraven et al., 2010). These objective tools are seen to be useful because end-users can make these calculations manually and offer improved accuracy over subjective techniques. Machine learning models can be used to create objective models which then can be used to measure risk (Mingle, 2015). These models are more complex, but may be able to create more accurate risk predictions that should lead to improved diabetic patient outcomes. This study investigates the hypothesis that advanced machine learning techniques can make use of a wide set of clinical features to improve diabetic readmission risk prediction over simpler objective measures like LACE while reducing hospital cost. An existing dataset and algorithms are used to test this hypothesis.

Welcome message from author
This document is posted to help you gain knowledge. Please leave a comment to let me know what you think about it! Share it to your friends and learn new things together.
Transcript
1
Predicting Diabetic Readmission Rates: Moving Beyond HbA1c
Damian Mingle WPC Healthcare, Nashville, USA
Corresponding author: Damian Mingle, Chief Data Scientist, WPC Healthcare, 1802 Williamson Court,
Brentwood, TN 37027, USA Email: [email protected]
Abstract
Hospital readmission is considered an effective measurement of care provided within healthcare. Being
able to risk identify patients facing a high likelihood of unplanned hospital readmission in the next 30-
days could allow for further investigation and possibly prevent the readmission. Current models, such as
LACE, sacrifice accuracy in order to allow for end-users to have a straight forward and simple
experience. This study acknowledges that while HbA1c is important, it may not be critical in predicting
readmissions. It also investigates the hypothesis that using machine learning on a wide feature, making
use of model diversity, and blending prediction will improve the accuracy of readmission risk predictions
compared with existing techniques. A dataset originally containing 100,000 admissions and 56 features
was used to evaluate the hypothesis. The results from the study are encouraging and can help
healthcare providers improve inpatient diabetic care.
Keywords: Predictive modeling, 30-day readmission, hospital readmission, type 2 diabetes, diabetes mellitus
1. Introduction
A survey conducted by the Agency for Healthcare Research and Quality (AHRQ) found that in
the year 2011 more than 3.3 million patients were readmitted in the United States within 30-
days of being discharged. Over $250 million was spent on treatment of readmitted diabetic
patients in 2011 (Hines et al., 2014). Current practice to identify at-risk diabetic patients are
subjective: a clinician will assess the patient and decide what the appropriate care plan is for
that individual. Research has shown that these subjective methods for determining readmission
are slightly better than random guessing (Allaudeen et al., 2011). However, there are tools to
objectively score readmission risk, such as LACE (van Walraven et al., 2010). These objective
tools are seen to be useful because end-users can make these calculations manually and offer
improved accuracy over subjective techniques.
Machine learning models can be used to create objective models which then can be used to
measure risk (Mingle, 2015). These models are more complex, but may be able to create more
accurate risk predictions that should lead to improved diabetic patient outcomes.
This study investigates the hypothesis that advanced machine learning techniques can make
use of a wide set of clinical features to improve diabetic readmission risk prediction over
simpler objective measures like LACE while reducing hospital cost. An existing dataset and algorithms are used to test this hypothesis.

2
2. Background and Related Work
Many healthcare providers in the U.S. use LACE to identify at-risk patients. At its core LACE is a
logistic regression model that makes use of a small set of features. LACE itself was derived from
a set of 4812 patients, and validated on 1,000,000 patients using patient records from 2004 to
2008 (van Walraven et al., 2010).
In addition, numerous previous studies have analyzed the risk factors that predict readmission
rates of diabetic patients. However, much of the research is focused on subsets of diabetic
populations and solutions are derived from a smaller sample size than this study. In some cases,
the results were based on demographic and socioeconomic factors that influence readmission
rates (Jiang et al., 2003). In some cases, the models are unspecific in target and focus on
general readmission for all-cause (Hosseinzadeh, 2013). Our study considers data that covers
demographic, clinical procedure-related and diagnostic-related features, as well as medication
information for all ages to predict readmissions for diabetic patients within a 30-day window.
We provide comprehensive results on features and the model performance is superior to those
currently in use. Our goal was not an analysis of readmission cost as this is well documented by
other researchers.
In our judgment, our work is the first of its kind structuring a machine learning framework,
which analyses all age groups specifically for the diabetic population and unplanned
readmissions within a 30-day window. Our study uses a considerably larger dataset which is
more balanced when comparing to previous works. Accordingly, our results appear to be more
reflective of the problem of unplanned readmissions within 30-days of discharge for diabetics
of all ages within the United States.
Other studies have not documented the typical performance metrics of machine learning
classifiers. Our machine learning framework solves a general problem for diabetic patients who
discharge from the hospital and as a single comprehensive solution can be easily implemented.
In addition to addressing the above gaps in the research, this work coves methods to identify
potential modifiable risk factors leading to readmission rates. Machine learning identification of
likelihood of readmission is the foundational step to understanding and developing protocols
for better inpatient diabetes care. Our primary aim to have the results presented in this s tudy
be the baseline for any future work to compare.
3. Materials and Methods 3.1. Data Assembly
We performed a secondary analysis of a multicenter prospective cohort study conducted
between 1999-2008. The study involved patients discharged to the community from 130
hospitals. The data is provided by the Center for Clinical and Translational Research, Virginia
Commonwealth University and is a de-identified abstract of the Health Facts database
(Cerner Corporation, Kansas City, MO). This data was used to test the hypotheses that
3
machine learning could predict the likelihood of readmission within the next 30-days for a
diabetic patient. The data represents 10 years (1999-2008) of clinical care at 130 hospitals
and integrated delivery networks through the United States: Midwest (18 hospitals),
Northeast (58), South (28), and West (16). Most of the hospitals (78) have bed size between
100 and 499, 38 hospitals have bed size less than 100, and bed size of 14 hospitals is greater
than 500. The dataset contains 50 features representing patient encounters: patient
demographics, admission details, diagnoses and procedures (in ICD-9-CM format),
laboratory data, and pharmacy data. Strack et al., 2014 originally pulled the dataset to meet
the following criteria:
(1) It is an inpatient encounter (a hospital admission).
(2) It is a “diabetic” encounter; that is, one during which any kind of diabetes was
entered into the system as a diagnosis.
(3) The length of stay was at least 1 day and at most 14 days.
(4) Laboratory tests were performed during the encounter.
(5) Medications were administered during the encounter.
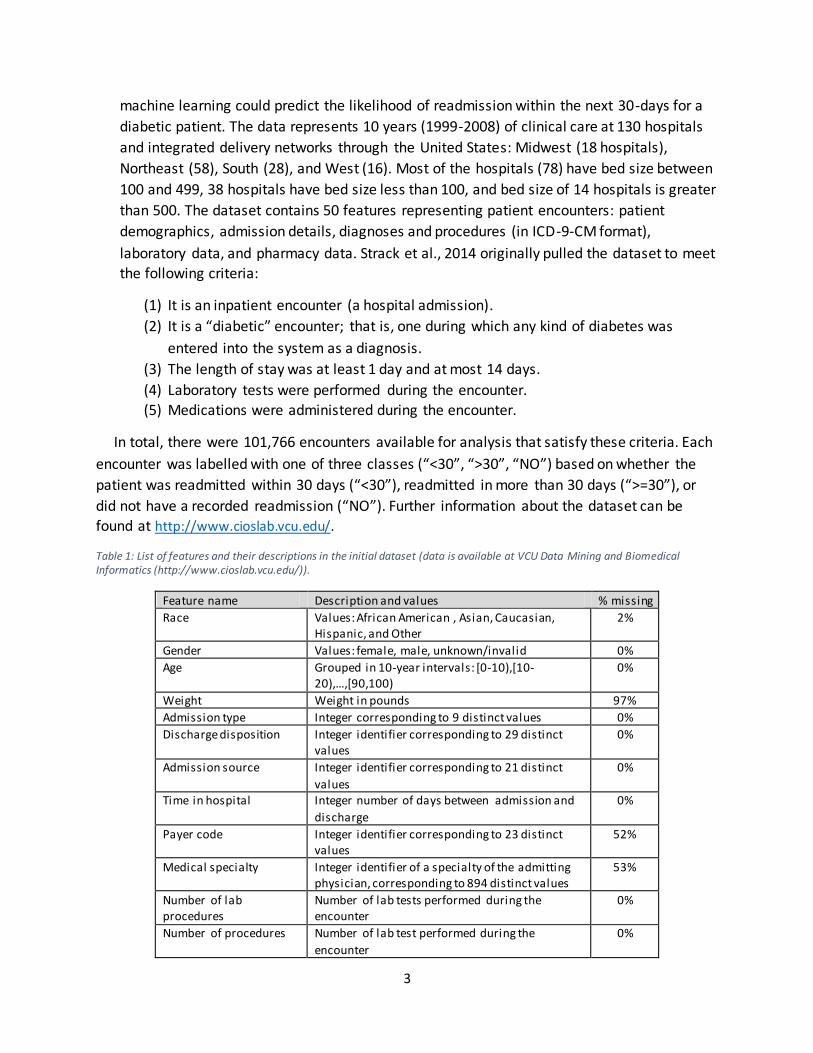
In total, there were 101,766 encounters available for analysis that satisfy these criteria. Each
encounter was labelled with one of three classes (“<30”, “>30”, “NO”) based on whether the
patient was readmitted within 30 days (“<30”), readmitted in more than 30 days (“>=30”), or
did not have a recorded readmission (“NO”). Further information about the dataset can be
found at http://www.cioslab.vcu.edu/.
Table 1: List of features and their descriptions in the initial dataset (data is available at VCU Data Mining and Biomedical Informatics (http://www.cioslab.vcu.edu/)).
Feature name Description and values % missing
Race Values: African American , Asian, Caucasian, Hispanic, and Other
2%
Gender Values: female, male, unknown/invalid 0%
Age Grouped in 10-year intervals: [0-10),[10-20),…,[90,100)
0%
Weight Weight in pounds 97%
Admission type Integer corresponding to 9 distinct values 0%
Discharge disposition Integer identifier corresponding to 29 distinct values
0%
Admission source Integer identifier corresponding to 21 distinct
values
0%
Time in hospital Integer number of days between admission and
discharge
0%
Payer code Integer identifier corresponding to 23 distinct values
52%
Medical specialty Integer identifier of a specialty of the admitting physician, corresponding to 894 distinct values
53%
Number of lab procedures
Number of lab tests performed during the encounter
0%
Number of procedures Number of lab test performed during the
encounter
0%
4
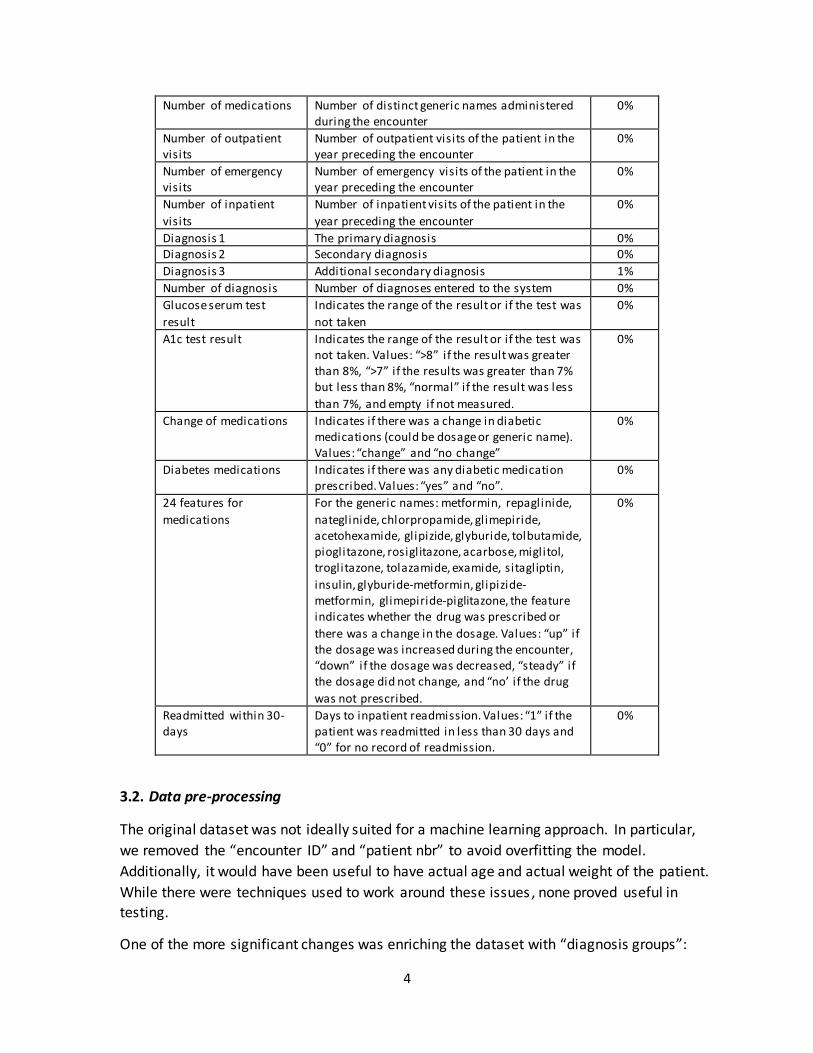
Number of medications Number of distinct generic names administered during the encounter
0%
Number of outpatient visits
Number of outpatient visits of the patient in the year preceding the encounter
0%
Number of emergency visits
Number of emergency visits of the patient in the year preceding the encounter
0%
Number of inpatient
visits
Number of inpatient visits of the patient in the
year preceding the encounter
0%
Diagnosis 1 The primary diagnosis 0% Diagnosis 2 Secondary diagnosis 0%
Diagnosis 3 Additional secondary diagnosis 1%
Number of diagnosis Number of diagnoses entered to the system 0%
Glucose serum test
result
Indicates the range of the result or if the test was
not taken
0%
A1c test result Indicates the range of the result or if the test was not taken. Values: “>8” if the result was greater than 8%, “>7” if the results was greater than 7% but less than 8%, “normal” if the result was less
than 7%, and empty if not measured.
0%
Change of medications Indicates if there was a change in diabetic medications (could be dosage or generic name). Values: “change” and “no change”
0%
Diabetes medications Indicates if there was any diabetic medication prescribed. Values: “yes” and “no”.
0%
24 features for
medications
For the generic names: metformin, repaglinide,
nateglinide, chlorpropamide, glimepiride, acetohexamide, glipizide, glyburide, tolbutamide, pioglitazone, rosiglitazone, acarbose, miglitol, troglitazone, tolazamide, examide, sitagliptin,
insulin, glyburide-metformin, glipizide-metformin, glimepiride-piglitazone, the feature indicates whether the drug was prescribed or
there was a change in the dosage. Values: “up” if the dosage was increased during the encounter, “down” if the dosage was decreased, “steady” if the dosage did not change, and “no’ if the drug
was not prescribed.
0%
Readmitted within 30-days
Days to inpatient readmission. Values: “1” if the patient was readmitted in less than 30 days and “0” for no record of readmission.
0%
3.2. Data pre-processing
The original dataset was not ideally suited for a machine learning approach. In particular,
we removed the “encounter ID” and “patient nbr” to avoid overfitting the model.
Additionally, it would have been useful to have actual age and actual weight of the patient.
While there were techniques used to work around these issues, none proved useful in
testing.
One of the more significant changes was enriching the dataset with “diagnosis groups”:
5
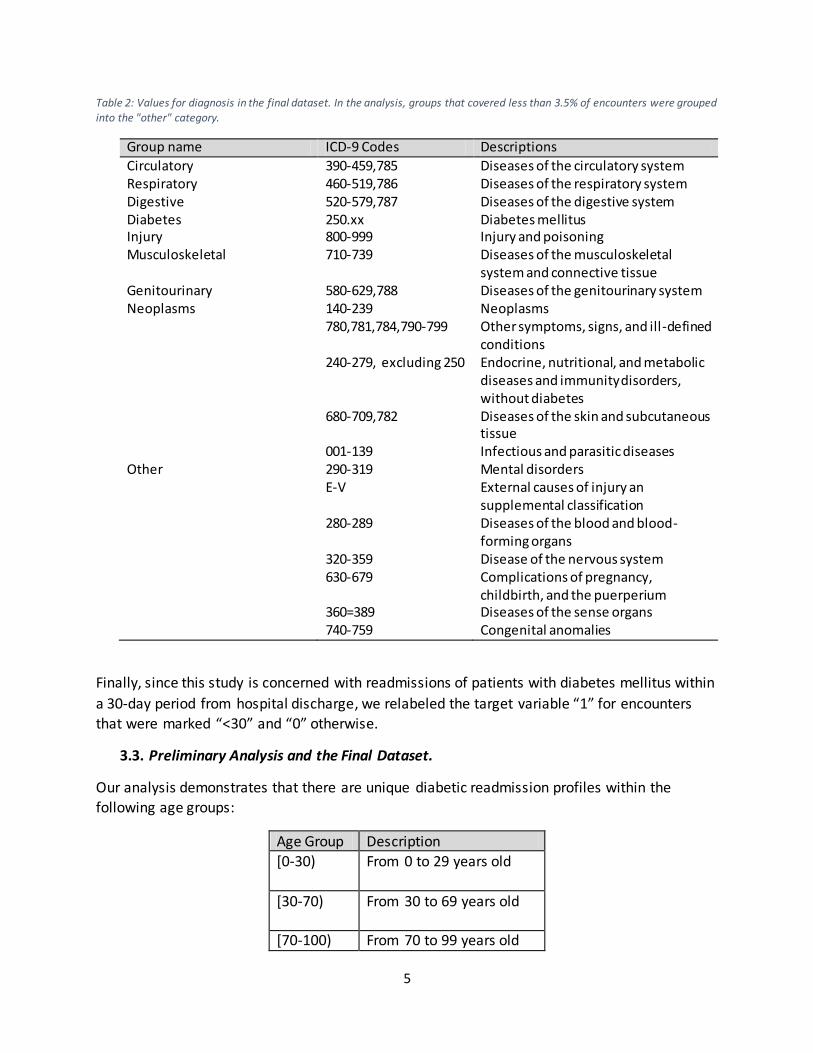
Table 2: Values for diagnosis in the final dataset. In the analysis, groups that covered less than 3.5% of encounters were grouped into the "other" category.
Group name ICD-9 Codes Descriptions
Circulatory 390-459,785 Diseases of the circulatory system Respiratory 460-519,786 Diseases of the respiratory system Digestive 520-579,787 Diseases of the digestive system Diabetes 250.xx Diabetes mellitus Injury 800-999 Injury and poisoning Musculoskeletal 710-739 Diseases of the musculoskeletal
system and connective tissue Genitourinary 580-629,788 Diseases of the genitourinary system Neoplasms 140-239 Neoplasms 780,781,784,790-799 Other symptoms, signs, and ill-defined
conditions 240-279, excluding 250 Endocrine, nutritional, and metabolic
diseases and immunity disorders, without diabetes
680-709,782 Diseases of the skin and subcutaneous tissue
001-139 Infectious and parasitic diseases Other 290-319 Mental disorders E-V External causes of injury an
supplemental classification 280-289 Diseases of the blood and blood-
forming organs 320-359 Disease of the nervous system 630-679 Complications of pregnancy,
childbirth, and the puerperium 360=389 Diseases of the sense organs 740-759 Congenital anomalies
Finally, since this study is concerned with readmissions of patients with diabetes mellitus within
a 30-day period from hospital discharge, we relabeled the target variable “1” for encounters
that were marked “<30” and “0” otherwise.
3.3. Preliminary Analysis and the Final Dataset.
Our analysis demonstrates that there are unique diabetic readmission profiles within the
following age groups:
Age Group Description [0-30)
From 0 to 29 years old
[30-70)
From 30 to 69 years old
[70-100) From 70 to 99 years old
6
We are making the original dataset inclusive with data augmentation and enrichment available
(https://www.researchgate.net/publication/312493339_Diabetic_30-
Day_Unplanned_Readmission_by_Age_Group). Each of the groups has its own set of unique
characteristics that we utilized when building our machine learning framework.
3.4. Machine Learning Methods. A. Classification
Identification of high-risk diabetic patients was posed as the problem of classifying whether
a patient would be readmitted within 30-days of being discharged. Best practice is to make
use of several machine learning algorithms, which is part of this study. Prior to training the
classification algorithms, we randomly split our dataset into two dis tinct sets – the training
and the test set. The training and test set consisted of 75% and 25% of the data. The
parameters of each algorithm were chosen based on the classification performance
evaluated by 10-fold cross-validation on the training set. The performance of all algorithms was evaluated on the test set.
Each age group was treated as a subset of the entire available diabetic population, however
the final models for each age group are viewed as independent of each other.
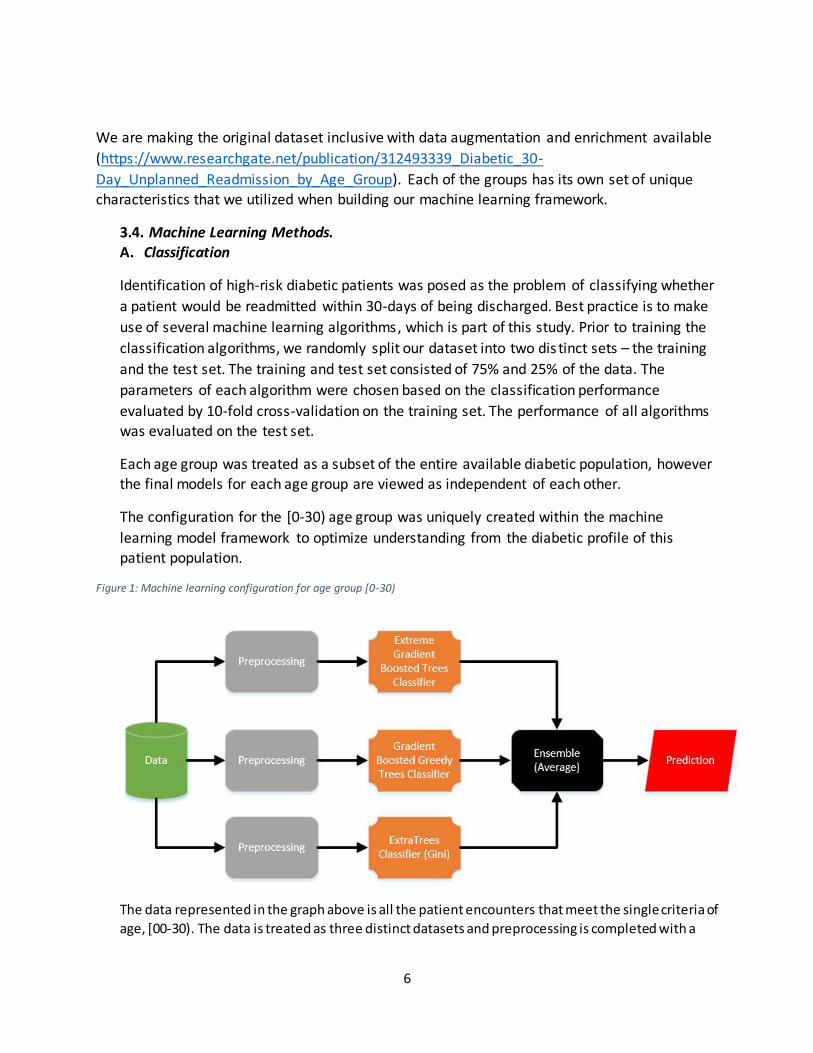
The configuration for the [0-30) age group was uniquely created within the machine
learning model framework to optimize understanding from the diabetic profile of this
patient population.
Figure 1: Machine learning configuration for age group [0-30)
The data represented in the graph above is all the patient encounters that meet the single criteria of
age, [00-30). The data is treated as three distinct datasets and preprocessing is completed with a

7
single model as the focus. As each model experiences each diabetic patient encounter, it will make a prediction that will be stored until an ensemble is created. The models include:
(1) Extreme Gradient Boosted Trees - we made use of ordinal encoding of categorical
variables and missing value imputations.
(2) Gradient Boosted Greedy Trees Classifier - we implemented One-Hot Encoding,
univariate credibility estimates with ElasticNet, category count, missing value
imputations, search for differences, and search for ratios.
(3) ExtraTrees Classifier (Gini) - we utilized One-Hot Encoding, univariate credibility
estimates with ElasticNet, missing value imputations, search for differences, and search
for ratios.
The ensemble of all models for [0-30) was averaged using the following
𝐴 = 1
𝑛× ∑ 𝑥𝑖
𝑛
𝑖=1
where 𝐴 equals average, 𝑛 equals the number of models being averaged, and 𝑥𝑖 equals the
predicted probability of each patient encountered. Other important measures for this ensemble are:
Table 3: Summary of measures for configuration for [0-30)
Measure Value
F1 Score 0.4213 Sensitivity 0.4978
False Positive Rate 0.1081 Specificity 0.8919
Precision 0.3651
Negative Predictive Value 0.9343
Accuracy 0.8481
Matthews Correlation Coefficient 0.3416
Configuration for [30-70)
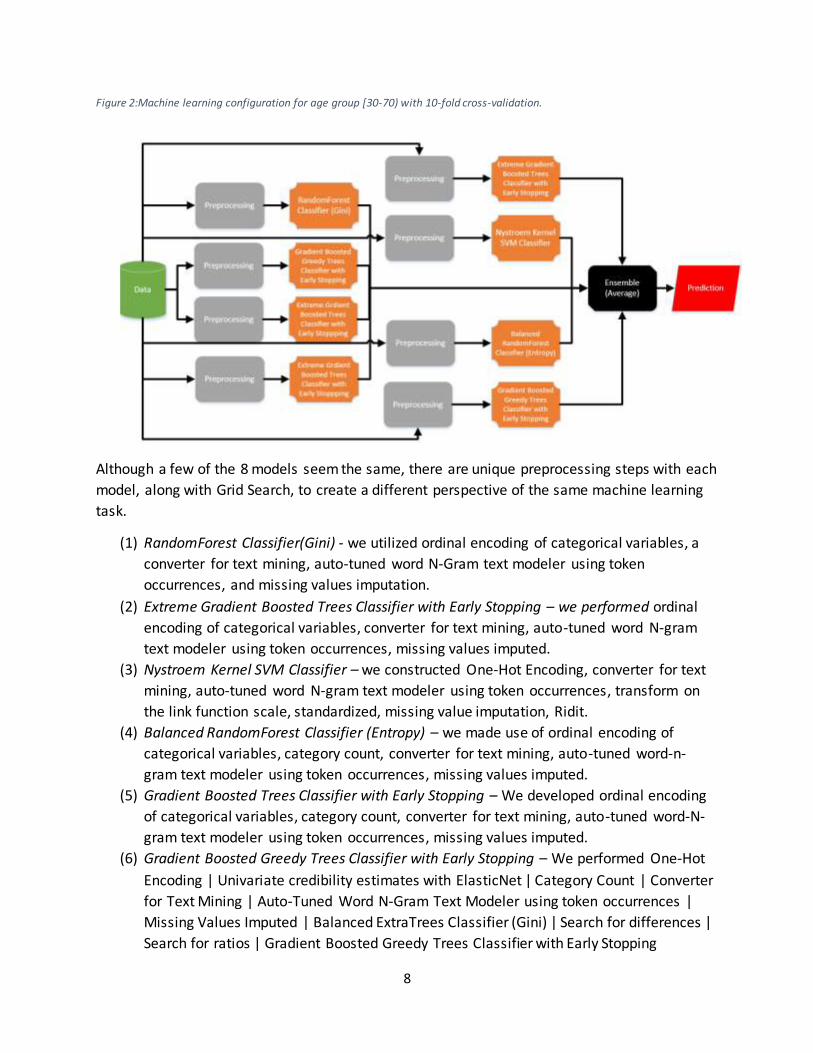
The machine learning framework produced a model for the [30-70) age group, which is the
most complex of three age groups. There was a total of 8 different models averaged together to produce a final output.
8
Figure 2:Machine learning configuration for age group [30-70) with 10-fold cross-validation.
Although a few of the 8 models seem the same, there are unique preprocessing steps with each
model, along with Grid Search, to create a different perspective of the same machine learning
task.
(1) RandomForest Classifier(Gini) - we utilized ordinal encoding of categorical variables, a
converter for text mining, auto-tuned word N-Gram text modeler using token
occurrences, and missing values imputation.
(2) Extreme Gradient Boosted Trees Classifier with Early Stopping – we performed ordinal
encoding of categorical variables, converter for text mining, auto-tuned word N-gram
text modeler using token occurrences, missing values imputed.
(3) Nystroem Kernel SVM Classifier – we constructed One-Hot Encoding, converter for text
mining, auto-tuned word N-gram text modeler using token occurrences, transform on
the link function scale, standardized, missing value imputation, Ridit.
(4) Balanced RandomForest Classifier (Entropy) – we made use of ordinal encoding of
categorical variables, category count, converter for text mining, auto-tuned word-n-
gram text modeler using token occurrences, missing values imputed.
(5) Gradient Boosted Trees Classifier with Early Stopping – We developed ordinal encoding
of categorical variables, category count, converter for text mining, auto-tuned word-N-
gram text modeler using token occurrences, missing values imputed.
(6) Gradient Boosted Greedy Trees Classifier with Early Stopping – We performed One-Hot
Encoding | Univariate credibility estimates with ElasticNet | Category Count | Converter
for Text Mining | Auto-Tuned Word N-Gram Text Modeler using token occurrences |
Missing Values Imputed | Balanced ExtraTrees Classifier (Gini) | Search for differences |
Search for ratios | Gradient Boosted Greedy Trees Classifier with Early Stopping

9
(7) Extreme Gradient Boosted Trees Classifier with Early Stopping – we used Ordinal
encoding of categorical variables | Category Count | Converter for Text Mining | Auto-
Tuned Word N-Gram Text Modeler using token occurrences | Missing Values Imputed |
Balanced ExtraTrees Classifier (Gini) | Search for differences | eXtreme Gradient
Boosted Trees Classifier with Early Stopping
(8) Extreme Gradient Boosted Classifier with Early Stopping - We used Ordinal encoding of
categorical variables | Matrix of word-grams occurrences | Pairwise Cosine Similarity |
Converter for Text Mining | Auto-Tuned Word N-Gram Text Modeler using token
occurrences | Missing Values Imputed | eXtreme Gradient Boosted Trees Classi fier with Early Stopping
The ensemble method to average the 8 predicted probabilities for each diabetic patient by
encounter is the same as the [0-30) equation.
Below are other important measures for this age group:
Table 4: Summary of measures for configuration for [30-70) with 10-fold cross-validation.
Measure Value F1 Score 0.3001
Sensitivity 0.4363 False Positive Rate 0.1738
Specificity 0.8262
Precision 0.2288
Negative Predictive Value 0.9254
Accuracy 0.785 Matthews Correlation Coefficient 0.2012
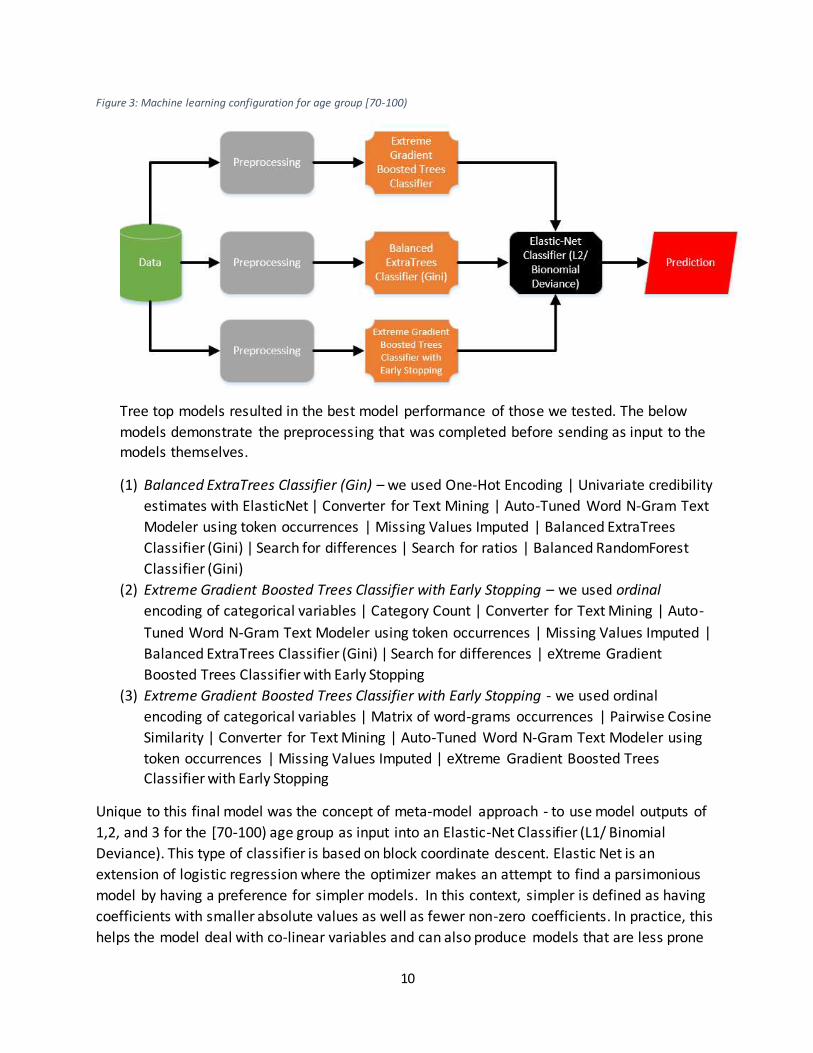
Our machine learning framework produced another set of 3 models that captured well the
underlying data pattern for age group [70-100). Although it is the same number of models
as [00-30), the models themselves are different.
10
Figure 3: Machine learning configuration for age group [70-100)
Tree top models resulted in the best model performance of those we tested. The below
models demonstrate the preprocessing that was completed before sending as input to the
models themselves.
(1) Balanced ExtraTrees Classifier (Gin) – we used One-Hot Encoding | Univariate credibility
estimates with ElasticNet | Converter for Text Mining | Auto-Tuned Word N-Gram Text
Modeler using token occurrences | Missing Values Imputed | Balanced ExtraTrees
Classifier (Gini) | Search for differences | Search for ratios | Balanced RandomForest
Classifier (Gini)
(2) Extreme Gradient Boosted Trees Classifier with Early Stopping – we used ordinal
encoding of categorical variables | Category Count | Converter for Text Mining | Auto-
Tuned Word N-Gram Text Modeler using token occurrences | Missing Values Imputed |
Balanced ExtraTrees Classifier (Gini) | Search for differences | eXtreme Gradient
Boosted Trees Classifier with Early Stopping
(3) Extreme Gradient Boosted Trees Classifier with Early Stopping - we used ordinal
encoding of categorical variables | Matrix of word-grams occurrences | Pairwise Cosine
Similarity | Converter for Text Mining | Auto-Tuned Word N-Gram Text Modeler using
token occurrences | Missing Values Imputed | eXtreme Gradient Boosted Trees Classifier with Early Stopping
Unique to this final model was the concept of meta-model approach - to use model outputs of
1,2, and 3 for the [70-100) age group as input into an Elastic-Net Classifier (L1/ Binomial
Deviance). This type of classifier is based on block coordinate descent. Elastic Net is an
extension of logistic regression where the optimizer makes an attempt to find a parsimonious
model by having a preference for simpler models. In this context, simpler is defined as having
coefficients with smaller absolute values as well as fewer non-zero coefficients. In practice, this
helps the model deal with co-linear variables and can also produce models that are less prone

11
to overfitting and generalize better to new data. Elastic-Net is useful in machine learning
problems where there are multiple features that are correlated with one another.
For completeness, we provide the additional important measures and their corresponding
values to compare with the other final models produced for age groups [00-30), [30-70), and
[70-100):
Table 5: Summary of measures for configuration for [30-70) with 10-fold cross-validation
Measure Value
F1 Score 0.2694
Sensitivity 0.4902 False Positive Rate 0.2889
Specificity 0.7111 Precision 0.1857
Negative Predictive Value 0.9121
Accuracy 0.6849 Matthews Correlation Coefficient 0.1403
B. Feature Analysis
In our study we decided to augment and enrich the original features in an effort to maximize
the signal provided in each age group. We implemented several engineered features that we
either gained intuition about through the initial study of the data or through the domain
expertise of clinicians. While this table does not represent all that can be done with this data, it
does represent what we studied:
Table 6: List of engineered features and their descriptions in the construction of machine learning models (data is available at Research Gate (http://www.ResearchGate/doi.com)).
Feature name Description and values Add_outpatient_inpatient Adding together the number of
outpatient and inpatient values
Div_emergency_labeProcedures_medications Dividing the number of emergency visits by the sum of lab procedures and
medications Diag_1_name Short text descriptions for ICD-9 codes
for primary diagnosis G_mult_outpatient_inpatient Multiply encounter values for
“outpatient” and “inpatient”
G_labProcedures_medications Concatenating the number of lab procedures with the number of
medications G_averageDiag Arithmetic mean of numeric values:
diag_1, diag_2, and diag_3. In the event

12
of an alpha-numeric diag code the remaining values will be averaged.
Admit_type_descr Short text description for admit type.
8 features for Admit Type Binary values for 1 of 8 admit types. TiH_medicalSpeciality Concatenated values from “Time In
Hospital” and “Medical Specialty”
G_missing_values A row-wise count of the number of missing values for a specific encounter.
Result_MedicalSpecialty Concatenated values from “A1Cresult” and “Medical Specialty”
MedSpec_Discharge Concatenated values from “medical specialty” and “Discharge”
Race_Discharge Concatenated values from “Race” and “Discharge
Discharge_TiH Concatenated values from “Discharge”
and “Time In Hospital” Admission_source_description Short text description of admission
source
Diag_2_name Short text descriptions for ICD-9 codes for secondary diagnosis
Diag_3_name Short text descriptions for ICD-9 codes for additional secondary diagnosis
Because various machine learning models induce learning from a variety of perspectives
(information-based, similarity-based, probability-based, error-based), it was important to select
features that provided the greatest context for each machine learning model. In our case,
feature selection proved to be significant in improving model performance in all three age
groups for diabetic patients. No age group had the exact same feature importance ascribed to
the same top 5 features. As can be seen below in Tables 8-10, items in bold are unique within
the top 5 ranked features across all models.
The final model for the age group [0-30) worked with over 74 features. We ranked the top 5
features for this model by informativeness how informative they are relative to the other
features of that age group. (Mingle, 2017). The “Number of emergency” feature and the
feature engineered by dividing the number of emergency visits by the sum of lab
procedures plus medications were both unique among all three models:
Table 7: Ranked list of features for age group [00-30)
Rank_1 Rank_2 Rank_3 Rank_4 Rank_5
Number Inpatient
Add Outpatient and
Diagnosis Code 1
Number Emergency Divide Emergency by the sum of Lab Procedures and Medications

13
Inpatient values together
In the case of the age group [30-70) final model, we worked with 79 features that shared the same features as the [70-100} age group
Table 8: Ranked list of features for age group [30-70)
Rank_1 Rank_2 Rank_3 Rank_4 Rank_5
Number Inpatient
Add Outpatient and Inpatient values together
Medical Specialty Concatenated with Discharge Code
Diagnosis Code 1
Discharge Disposition Description
Like the age group [00-30), the age group [70-100) resulted in two unique features ranking
in the top 5 out of 79 features. They were the concatenation of discharge disposition with
time in hospital and concatenation of race with discharge disposition:
Table 9: Ranked list of features for age group [70-100)
Rank_1 Rank_2 Rank_3 Rank_4 Rank_5
Medical Specialty Concatenated with Discharge Code
Discharge Concatenated with Time in Hospital
Race Concatenated with Discharge
Discharge Disposition Description
Number Inpatient
It is significant that all models did not utilize “A1c” results from patients when making a
predication for unplanned hospital readmissions. In our study we see that only very few
clinicians perform the measurement of HbA1c (18.4%) in the inpatient setting. Many
researchers suggest that further attention to the HbA1c by a clinician before a diabetic
patient is discharged from the hospital may prove helpful in patient outcomes and lower
cost of inpatient care (Strack et al., 2014). In our study, we aimed to develop learning
models that could be predictive without the HbA1c measurement, the primary reason being
clinician judgment and hospital protocols vary greatly.
3.5. Evaluation Method
Each algorithm was evaluated using a 10-fold stratified cross-validation. Cross-validation is
an evaluation technique where the dataset is randomly but evenly distributed into a
number of fold (this study, 10). The learning algorithm is trained on all but one of the folds
14
and tested on the held-out fold. This repeated for each possible holdout fold. Stratified
cross-validation attempts to preserve the class distribution between folds so that each fold
is representative of the date full dataset. The process of cross -validation is repeated ten
times to ensure that particular random initialization does not bias the overall result.
All algorithms were evaluated using the area-under-the-curve (AUC), which is equivalent to
the c-statistic in this binary classification scenario. The AUC is the probability that a
randomly chosen positive instance (this study, “<30” represented as “1”) ranks higher than
a randomly chosen negative one (this study, “0”). An AUC of 0.5 or less indicates that the
algorithm is not better than a random guess while an AUC of 1.0 indicates perfect
classification. Previous research in readmission risk has achieved AUCs between 0.5 and 0.7.
AUC is a graphical plot that illustrates the performance of a binary classifier system as its
discrimination threshold is varied. It is created by plotting the fraction of true positives out
of the positives vs the fraction of false positives out of the negatives, at various threshold
settings. TPR is also known as sensitivity, and FPR is one minus the specificity or true
negative rate.
In all cases our machine learning models are compared to the LACE index AUC, calculated by
comprising a threshold of each index value to the true positive and false positives achieved by that threshold.
3.6. LACE Index Scoring Tool for Risk Assessment of Hospital Readmission
LACE is seen as the current in-use solution for readmissions for the U.S. One considerable
benefit to LACE is the interpretability of the index itself. While many hospitals use the index
in a computer assisted way, manual calculation is certainly possible. Further work is
required to identify additional factors that may increase the discrimination or accuracy of
the index. LACE is known to have limitations in that it was derived over a small sample size
which may prevent it from being useful in the hospitals population if they do not overlap.
There are four steps to calculating the LACE Score Risk of Readmission (van Walraven et al., 2010):
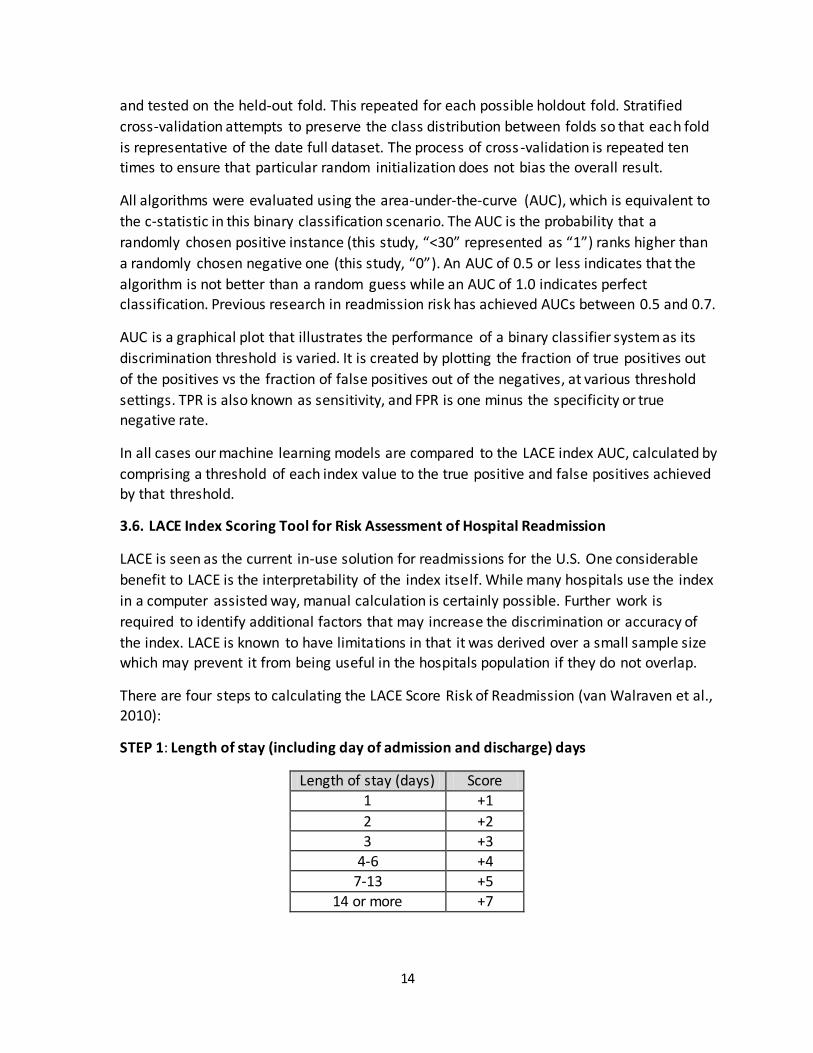
STEP 1: Length of stay (including day of admission and discharge) days
Length of stay (days) Score
1 +1
2 +2
3 +3 4-6 +4
7-13 +5
14 or more +7

15
STEP 2: Acuity of Admission
If you can answer “yes” to the question,” Was the patient admitted to the hospital via the
emergency department?” then you can add “3” to the LACE Score from step 1.
STEP 3: Comorbidities
The patient may have multiple comorbidities. If the total score in this section is between 0
and 3 then “3” should be added to the LACE Score. If the score is ≥ 4 than “5” is added to
the LACE Score. Additional information about what is meant by these conditions is in
Appendix A.
Condition Score
Previous myocardial infarction +1
Cerebrovascular disease +1
Peripheral vascular disease +1
Diabetes without complications +1
Congestive heart failure +2
Diabetes with end organ damage +2
Chronic pulmonary disease +2
Mild liver or renal disease +2
Any tumor (including lymphoma or
leukemia)
+2
Dementia +3
Connective tissue disease +3
AIDS +4
Moderate or severe liver or renal disease
+4
Metastatic solid tumor +6
STEP 4: Emergency Department Visits
Determine how many times the patient has visited an emergency department in the six
months prior to admission (not including the emergency department visit immediately

16
preceding the current admission) and ad that figure to the LACE score. However, in cases
where the visits are => 4 then add only “4” to the LACE score.
Once LACE steps 1 through 4 are complete, then total the score. If in total a patient receives
a LACE Score of ≥ 10 then the patient is labeled “high risk for readmission.” LACE attempts
to lessen the burden for clinicians by requiring only a very few number of features that can
be found within a patient’s record. The non-condition specific nature of LACE, as it relates
to diabetes mellitus and its simple approach, renders the result slightly better than random.
Cost Analysis
It is well known that hospital readmissions are costly to the healthcare system. Research
shows that the cost of readmission of diabetes mellitus and its complications is $251 million
for 23,700 total readmissions. Hence the cost per readmission is approximately equal to
$10,591 (Hines et al., 2014). In this secondary analysis the average length of stay for the
diabetic patient encounter is 4.396 days, leading us to believe the cost for one-day
admission is considered to be $2,409.
This is of particular importance to develop costing models around the benefit of having a
proper machine learning solution delivered to hospital clinicians in a low-tech way. By
establishing a one-day review of a patient before actual discharge there could be risk-reward trade-off that would be appealing to many healthcare settings.
4. Results and Discussion
The results from performing 10-fold cross-validation are presented in Table 8:
Table 10: Comparison of model performance
Age Group Model Description AUC
[0-30) Ensemble Average 0.79 [30-70) Ensemble Average 0.70
[70-100) Meta Model (Elastic Net) 0.65
All Age Groups LACE 0.56
In conclusion, while providers of care may make the decision not to obtain a measurement of
HbA1c for patients with diabetes mellitus during the stay at the hospital , there exist other
useful predictors of readmission rates that may prove valuable in the development of strategies
to reduce readmission rates and associated costs for the care of these individuals. Our machine
learning approach yielded a 26% improvement using over 100,000 patient encounters from 130
U.S. hospitals over a 10-year period compared to LACE, which was derived from 4,800 patients
over a 4-year period.
5. Conclusion and Future work
17
Our research suggests that applying a machine learning approach to a larger feature set as well
as novel approaches to model diversity and model blending can improve on simpler
readmission models such as LACE, potentially improving patient outcomes and lowering
inpatient cost to hospitals. The highest performing models were those developed around age groups rather than a general “all” age group.
This study targets diabetic patients only; however, we believe this early work sets the stage for
further research to improve the accuracy of readmission risk for other top health conditions like
heart disease, Schizophrenia, COPD, etc. An improved dataset, one that includes other critical
features such as age, weight, and lab values, could prove valuable and are worth further study.
Additional discovery may exist in modeling by condition group name (circulatory, respiratory,
diabetes) as a primary condition. Also, suggesting a “next step” in transitions of care (home
health, SNF, rehab facility) for a patient’s optimal outcome may prove useful within healthcare.
Conflict of Interests
The authors declare that they have no conflict of interests.
Acknowledgment
The authors thank Cerner Corp. and the VCU cent for Clinical and Translation Research for the
data used in the study. The authors appreciate the information available through organizations
such as American Diabetes Association, International Diabetes Federation, and the Juvenile Diabetes Research Foundation. The authors thank WPC Healthcare for supporting this study.
References
1. Allaudeen, N., Schnipper, J. L., Orav, E. J., Wachter, R. M., & Vidyarthi, A. R. (2011).
Inability of providers to predict unplanned readmissions. Journal of general internal
medicine, 26(7), 771-776.
2. Blondel, M., Seki, K., & Uehara, K. (2013). Block coordinate descent algorithms for large-
scale sparse multiclass classification. Machine learning, 93(1), 31-52.
3. Britton, K. A., Aggarwal, V., Chen, A. Y., Alexander, K. P., Amsterdam, E., Fraulo, E., ... &
Roe, M. T. (2011). No association between hemoglobin A1c and in-hospital mortality in
patients with diabetes and acute myocardial infarction. American heart journal, 161(4),
657-663.
4. Chen, T., & He, T. (2015). Higgs boson discovery with boosted trees. In Cowan et al.,
editor, JMLR: Workshop and Conference Proceedings (No. 42, pp. 69-80).
5. Forsythe, C. E. (2014). Predictive Risk Modelling for Hospital Readmissions.
6. Friedman, B., & Basu, J. (2004). The rate and cost of hospital readmissions for
preventable conditions. Medical Care Research and Review, 61(2), 225-240.
7. Friedman, J., Hastie, T., & Tibshirani, R. (2001). The elements of statistical learning (Vol.
1). Springer, Berlin: Springer series in statistics.

18
8. Geiss, L. S., Pan, L., Cadwell, B., Gregg, E. W., Benjamin, S. M., & Engelgau, M. M. (2006).
Changes in incidence of diabetes in US adults, 1997–2003. American journal of
preventive medicine, 30(5), 371-377.
9. Geurts, P., Ernst, D., & Wehenkel, L. (2006). Extremely randomized trees. Machine
learning, 63(1), 3-42.
10. Halkos, M. E., Puskas, J. D., Lattouf, O. M., Kilgo, P., Kerendi, F., Song, H. K., ... &
Thourani, V. H. (2008). Elevated preoperative hemoglobin A1c level is predictive of
adverse events after coronary artery bypass surgery. The Journal of thoracic and
cardiovascular surgery, 136(3), 631-640.
11. Hines, A. L., Barrett, M. L., Jiang, H. J., & Steiner, C. A. (2014). Conditions with the largest
number of adult hospital readmissions by payer, 2011.
12. Hines, A. L., Barrett, M. L., Jiang, H. J., & Steiner, C. A. (2014). Conditions with the largest
number of adult hospital readmissions by payer, 2011.
13. Hosseinzadeh, A., Izadi, M. T., Verma, A., Precup, D., & Buckeridge, D. L. (2013, June).
Assessing the Predictability of Hospital Readmission Using Machine Learning. In IAAI.
14. Howell, S., Coory, M., Martin, J., & Duckett, S. (2009). Using routine inpatient data to
identify patients at risk of hospital readmission. BMC Health Services Research, 9(1), 1.
15. Jiang, H. J., Stryer, D., Friedman, B., & Andrews, R. (2003). Multiple hospitalizations for
patients with diabetes. Diabetes care, 26(5), 1421-1426.
16. Kim, H., Ross, J. S., Melkus, G. D., Zhao, Z., & Boockvar, K. (2010). Scheduled and
unscheduled hospital readmissions among diabetes patients. The American journal of
managed care, 16(10), 760.
17. Levetan, C. S., Passaro, M., Jablonski, K., Kass, M., & Ratner, R. E. (1998). Unrecognized
diabetes among hospitalized patients. Diabetes Care, 21(2), 246-249.
18. Lichman. M. (2013). UCI machine learning repository.
19. Mingle, D. (2015). A Discriminative feature space for detecting and recognizing
Pathologies of the vertebral column. International Journal of Biomedical Data
Mining, 04(01). doi:10.4172/2090-4924.1000114 20. Mingle, D. (2017). Controlling Informative Features for Improved Accuracy and Faster
Predictions in Omentum Cancer Models. Curr Trends Biomedical Eng & Biosci, 1(2).
doi:CTBEB.MS.ID.555559
21. Pittas, A. G., Siegel, R. D., & Lau, J. (2004). Insulin therapy for critically ill hospitalized
patients: a meta-analysis of randomized controlled trials. Archives of internal
medicine, 164(18), 2005-2011.
22. Shah, R. V., Altman, R. K., Park, M. Y., Zilinski, J., Leyton-Mange, J., Orencole, M., ... &
Das, R. (2012). Usefulness of Hemoglobin A 1c to Predict Outcome After Cardiac
Resynchronization Therapy in Patients With Diabetes Mellitus and Heart Failure. The
American journal of cardiology, 110(5), 683-688.
23. Siegelaar, S. E., Hoekstra, J. B., & DeVries, J. H. (2011). Special considerations for the
diabetic patient in the ICU; targets for treatment and risks of hypoglycaemia. Best
Practice & Research Clinical Endocrinology & Metabolism , 25(5), 825-834.
19
24. Silverstein, M. D., Qin, H., Mercer, S. Q., Fong, J., & Haydar, Z. (2008, October). Risk
factors for 30-day hospital readmission in patients? 65 years of age. In Baylor University
Medical Center. Proceedings (Vol. 21, No. 4, p. 363). Baylor University Medical Center.
25. Stolker, J. M., Spertus, J. A., McGuire, D. K., Lind, M., Tang, F., Jones, P. G., ... &
Kosiborod, M. (2012). Relationship between glycosylated hemoglobin assessment and
glucose therapy intensification in patients with diabetes hospitalized for acute
myocardial infarction. Diabetes Care, 35(5), 991-993.
26. Strack, B., DeShazo, J. P., Gennings, C., Olmo, J. L., Ventura, S., Cios, K. J., & Clore, J. N.
(2014). Impact of HbA1c measurement on hospital readmission rates: analysis of 70,000
clinical database patient records. BioMed research international, 2014.
27. Umpierrez, G. E., Isaacs, S. D., Bazargan, N., You, X., Thaler, L. M., & Kitabchi, A. E.
(2002). Hyperglycemia: an independent marker of in-hospital mortality in patients with
undiagnosed diabetes. The Journal of Clinical Endocrinology & Metabolism, 87(3), 978-
982.
28. van Walraven, C., Dhalla, I. A., Bell, C., Etchells, E., Stiell, I. G., Zarnke, K., ... & Forster, A.
J. (2010). Derivation and validation of an index to predict early death or unplanned
readmission after discharge from hospital to the community. Canadian Medical
Association Journal, 182(6), 551-557.
29. Vinik, R., & Clements, J. (2011). Management of the hyperglycemic inpatient: tips, tools,
and protocols for the clinician. Hospital Practice, 39(2), 40-46.
30. Williams, C., & Seeger, M. (2001). Using the Nyström method to speed up kernel
machines. In Proceedings of the 14th annual conference on neural information processing systems (No. EPFL-CONF-161322, pp. 682-688).
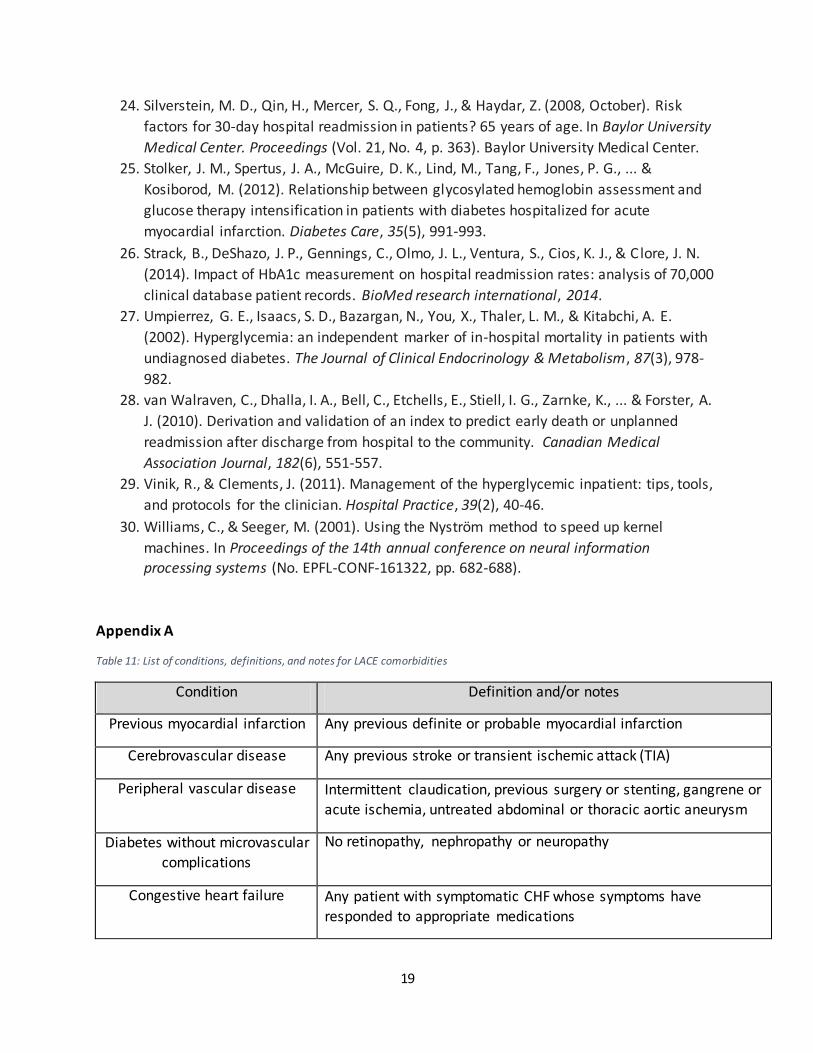
Appendix A
Table 11: List of conditions, definitions, and notes for LACE comorbidities
Condition Definition and/or notes
Previous myocardial infarction Any previous definite or probable myocardial infarction
Cerebrovascular disease Any previous stroke or transient ischemic attack (TIA)
Peripheral vascular disease Intermittent claudication, previous surgery or stenting, gangrene or
acute ischemia, untreated abdominal or thoracic aortic aneurysm
Diabetes without microvascular
complications
No retinopathy, nephropathy or neuropathy
Congestive heart failure Any patient with symptomatic CHF whose symptoms have
responded to appropriate medications
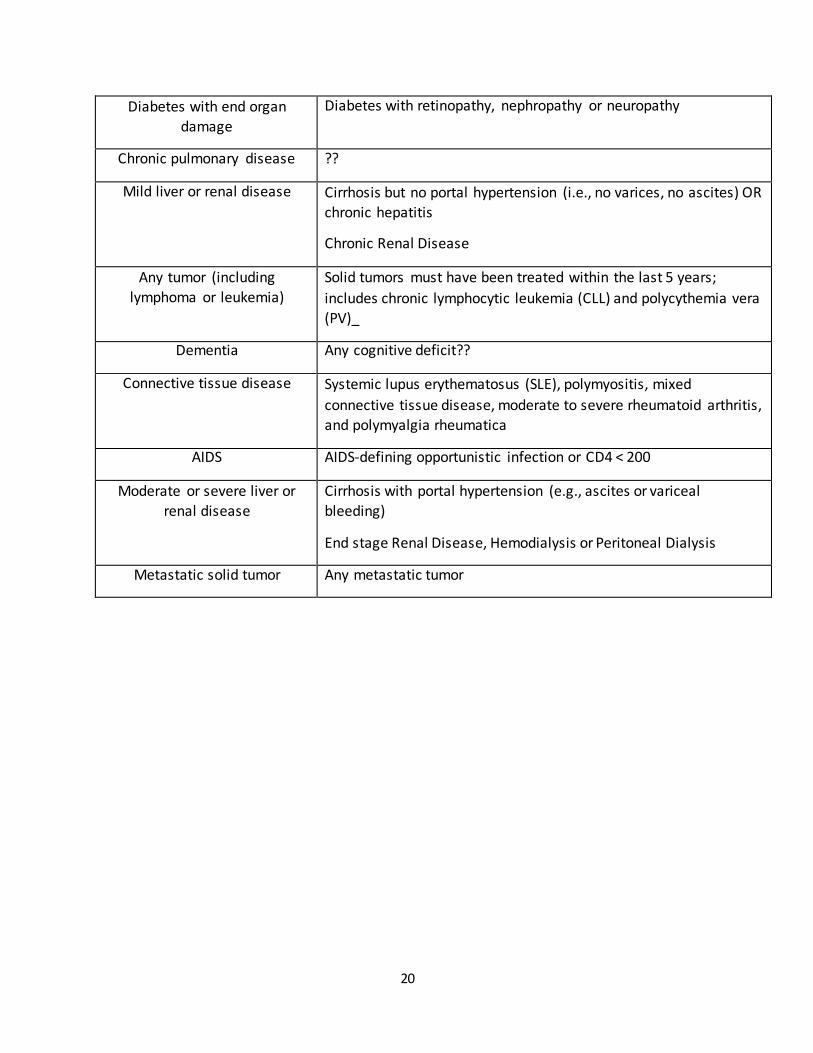
20
Diabetes with end organ
damage
Diabetes with retinopathy, nephropathy or neuropathy
Chronic pulmonary disease ??
Mild liver or renal disease Cirrhosis but no portal hypertension (i.e., no varices, no ascites) OR chronic hepatitis
Chronic Renal Disease
Any tumor (including
lymphoma or leukemia)
Solid tumors must have been treated within the last 5 years;
includes chronic lymphocytic leukemia (CLL) and polycythemia vera (PV)_
Dementia Any cognitive deficit??
Connective tissue disease Systemic lupus erythematosus (SLE), polymyositis, mixed
connective tissue disease, moderate to severe rheumatoid arthritis, and polymyalgia rheumatica
AIDS AIDS-defining opportunistic infection or CD4 < 200
Moderate or severe liver or
renal disease
Cirrhosis with portal hypertension (e.g., ascites or variceal
bleeding)
End stage Renal Disease, Hemodialysis or Peritoneal Dialysis
Metastatic solid tumor Any metastatic tumor
Related Documents