Universidade Católica Portuguesa Católica-Lisbon School of Business and Economics Title: Predicting consumers’ intention to purchase fully autonomous driving systems – Which factors drive acceptance? Candidate: Reiner Kelkel Supervisor: Prof. Paulo Cardoso Do Amaral Dissertation submitted in partial fulfillment of requirements for the degree of MSc in Business Administration, at the Universidade Católica Portuguesa, 04.01.2015.

Welcome message from author
This document is posted to help you gain knowledge. Please leave a comment to let me know what you think about it! Share it to your friends and learn new things together.
Transcript

Universidade Católica Portuguesa
Católica-Lisbon School of Business and Economics
Title:
Predicting consumers’ intention to purchase fully
autonomous driving systems –
Which factors drive acceptance?
Candidate:
Reiner Kelkel
Supervisor:
Prof. Paulo Cardoso Do Amaral
Dissertation submitted in partial fulfillment of requirements for the degree of MSc in
Business Administration, at the Universidade Católica Portuguesa, 04.01.2015.

II
Abstract
Title: Predicting consumers’ intention to purchase fully autonomous driving systems –
Which factors drive acceptance?
Author: Reiner Kelkel
This study aimed to find which factors influence consumers’ intention to purchase a fully
autonomous driving system in the future and which perceived product characteristics
influence the purchase intention and how. Therefore, an extension of the acceptance
model of Driver Assistant Systems by Arndt (2011) is presented. It integrates perceived
product characteristics specific to autonomous driving technology, to investigate which
factors determine the acceptance of fully autonomous driving systems. The proposed
model was empirically tested based on primary data collected in Germany. Exploratory
and confirmatory factor analyses were performed to assess the reliability and validity of
the measurement model. Further, structural equation modeling was used to evaluate the
causal relationships. The findings indicated that Attitude toward buying, Subjective Norm
and the perceived product characteristics Efficiency, Trust in Safety and Eco-Friendliness
significantly influenced individuals’ behavioral intention to purchase driverless
technology. The variables perceived Comfort, Image and Driving Enjoyment were not
found to have a significant effect on behavioral intention. Attitude and Subjective Norm
had the most significant influence. A somewhat surprising finding was that Subjective
Norm not only had a direct effect on Behavioral Intention, as suggest by the theory of
reasoned action and theory of planned behavior, but also on Attitude.

III
Acknowledgements
I am using this opportunity to express my gratitude to everyone who supported me
throughout the course of this Master Program and Master Thesis. I am thankful for their
aspiring guidance, invaluably constructive criticism and friendly advice during this time.
I am sincerely grateful to them for sharing their truthful and illuminating views on a
number of issues related to the project.
I especially express my warm thanks to my girlfriend Regina Stadler, which supported
me throughout the whole process with constant advice and feeback and was never tired
to discuss my issues.
I would also like to thank my family for giving me the opportunity to study in Portugal
and for supporting me throughout my whole life.
Moreover, I want to thank my advisor Prof. Paulo Cardoso Do Amaral who provided me
with feedback and guidance for my thesis. Additionally, I would like to thank Professor
Francesco Sguera and Prof Rita Coelho do Vale for their feedback.
Thank you,
Reiner Kelkel
IV
Table of Content
Abstract ............................................................................................................................ II
Acknowledgements ......................................................................................................... III
Table of Content .............................................................................................................. IV
List of Abbreviations..................................................................................................... VII
List of Figures .............................................................................................................. VIII
List of Tables................................................................................................................... IX
1. Introduction ................................................................................................................ 1
1.1 Relevance of the topic ....................................................................................... 1
1.2 Objective and plan of action ............................................................................. 2
2. State of the art on fully autonomous driving technology........................................... 4
2.1 Potential advantages and promises.................................................................... 8
2.1.1 Safety benefits ............................................................................................... 8
2.1.2 Times savings ................................................................................................ 8
2.1.3 Fuel savings ................................................................................................. 10
2.1.4 Productivity ................................................................................................. 10
2.2 Effects on convenience and travel behaviour.................................................. 10
2.2.1 Increased mobility for people unable or unwilling to drive ........................ 10
2.2.2 Efficiency – utilization of cars & cost savings............................................ 11
2.2.3 Insurance charges ........................................................................................ 11
2.2.4 Trends .......................................................................................................... 11
2.3 Potential disadvantages ................................................................................... 12
2.4 Barriers ............................................................................................................ 13
2.4.1 Software and hardware reliability .................................................................. 13
2.4.2 Customer acceptance ...................................................................................... 13
2.4.3 Implementation of regulatory and legal framework.................................... 14
3 State of the art on acceptance and behavioural theory ............................................. 15

V
3.1 What is acceptance .......................................................................................... 15
3.2 From intention to behavior .............................................................................. 15
3.3 Fundamental theoretical models ..................................................................... 16
3.3.1 Theories of reasoned action and of planned behavior ................................. 16
3.3.2 Model of Acceptance of Driver Assistance Systems .................................. 17
4 Research methodology ............................................................................................. 20
4.1 Research model ............................................................................................... 20
4.2 Theoretical reasoning and hypothesis development ....................................... 21
4.2.1 Effects of behavioral variables .................................................................... 22
4.2.2 Effects of perceived product characteristics on acceptance ........................ 22
4.3 Measurement ................................................................................................... 27
4.4 Data collection procedure and sample ............................................................ 28
4.5 Method ............................................................................................................ 29
4.6 Descriptive statistics........................................................................................ 29
5 Analysis ................................................................................................................... 31
5.1 Data screening ................................................................................................. 31
5.1.1 Univariate .................................................................................................... 31
5.1.2 Multivariate (tested after revised model) .................................................... 31
5.2 Measurement Model........................................................................................ 31
5.2.1 Exploratory Factor Analysis ....................................................................... 31
5.2.2 Confirmatory Factor Analysis ..................................................................... 35
5.3 Structural model .............................................................................................. 38
6 Findings ................................................................................................................... 39
7 Discussion ................................................................................................................ 43
7.1 Critical reflection on research results .............................................................. 43
7.2 Limitations ...................................................................................................... 45
7.3 Implications for further research ..................................................................... 46

VI
8 Conclusion ............................................................................................................... 48
Appendix .......................................................................................................................... X
A) German Questionnaire Items .................................................................................... X
B) Questionnaire product description ........................................................................... XI
C) Exploratory Factor Analysis Results .................................................................... XVI
Assertation .................................................................................................................... XX
References .................................................................................................................... XXI
VII
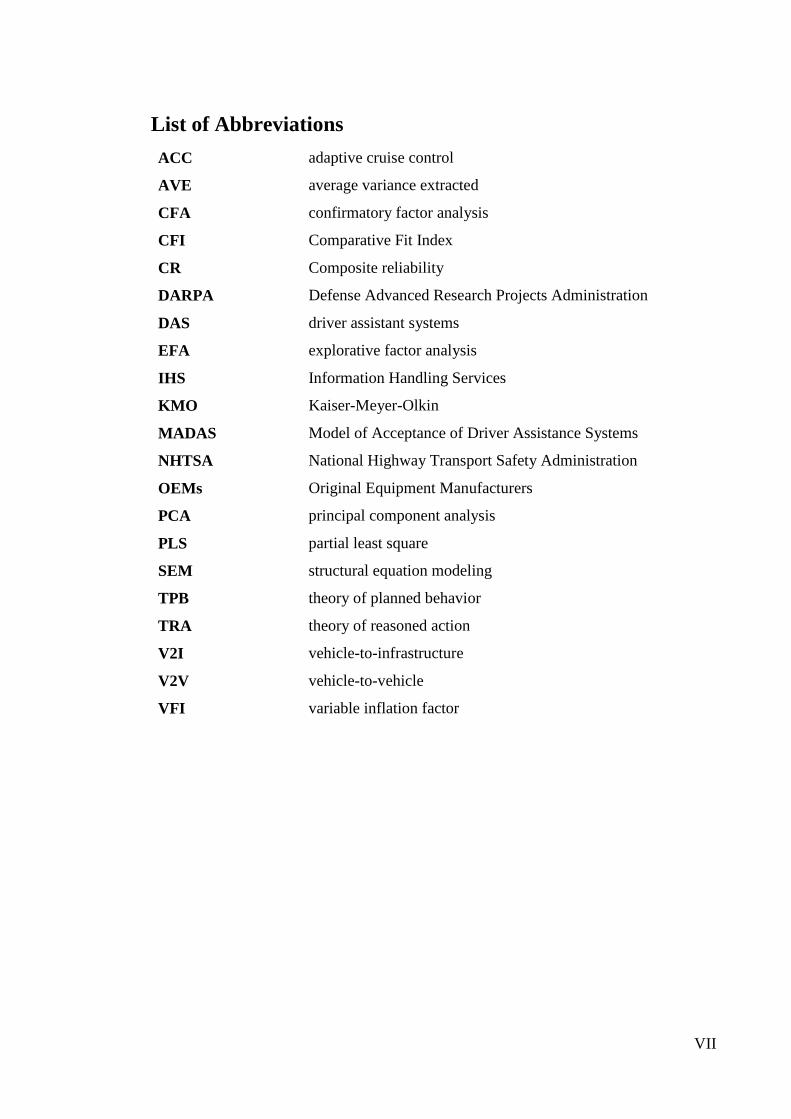
List of Abbreviations
ACC adaptive cruise control
AVE average variance extracted
CFA confirmatory factor analysis
CFI Comparative Fit Index
CR Composite reliability
DARPA Defense Advanced Research Projects Administration
DAS driver assistant systems
EFA explorative factor analysis
IHS Information Handling Services
KMO Kaiser-Meyer-Olkin
MADAS Model of Acceptance of Driver Assistance Systems
NHTSA National Highway Transport Safety Administration
OEMs Original Equipment Manufacturers
PCA principal component analysis
PLS partial least square
SEM structural equation modeling
TPB theory of planned behavior
TRA theory of reasoned action
V2I vehicle-to-infrastructure
V2V vehicle-to-vehicle
VFI variable inflation factor
VIII
List of Figures
Figure 2-1: Technology and components that enable driver-less car technology.. ........... 6
Figure 2-2: The sensors and camera recognize objects on the streets such as road signs,
other vehicles, pedestrians and cyclists ............................................................................. 6
Figure 2-3: The system reacts and alternates its movement ............................................. 7
Figure 2-4: Expected development of autonomous technologies and level of autonomy
over time............................................................................................................................ 7
Figure 3-1: Theory of reasoned action and theory of planned behavior. ........................ 17
Figure 3-2: Model of Acceptance of Driver Assistance Systems ................................... 18
Figure 3-3: Revised Model of Acceptance of Driver Assistance Systems.. ................... 19
Figure 4-1: Research model including hypothesized direct effects ................................ 20
Figure 4-2: Process of survey. ......................................................................................... 29
Figure 5-1: Revised research model. ............................................................................... 35
Figure 6-1 Direct effects of revised and fitted SEM ....................................................... 39

IX
List of Tables
Table 2-1: Definitions of vehicle autonomy ..................................................................... 5
Table 4-1: Translated questionnaire items. ..................................................................... 28
Table 4-2: Descriptive statistics based on the survey.. ................................................... 30
Table 5-1: Rotated Component Matrix and Component Transformation Matrix. .......... 33
Table 5-2: Component Matrix ......................................................................................... 34
Table 5-3: Construct reliability of the revised research model.. ..................................... 35
Table 5-4: Goodness of fit indices and recommended thresholds.. ................................ 36
Table 5-5: Research model fit indices and recommended values. .................................. 36
Table 5-6: Validity and reliability measures for hypothesized constructs. ..................... 37
Table 5-7: Model indices before and after fitting. .......................................................... 38
Table 6-1: Estimation results of the revised and refitted research model ....................... 40
Table 6-2: Hypothesis Summary Table........................................................................... 42
Table A-1: German Questionnaire Items ......................................................................... X
Table C-1: KMO and Bartlett’s Test ............................................................................ XVI
Table C-2: Communalities. .......................................................................................... XVI
Table C-3: Total Variance Explained ........................................................................ XVII
Table C-4: Rotated Component Matrix..................................................................... XVIII
Table C-5: Component Transformation Matrix ........................................................... XIX

1
1. Introduction
1.1 Relevance of the topic
During the last 30 years, the global car market has undergone significant changes in driver
experience due to technological progress (Knight, 2012). Today, a typical middle-class
car comes with standard features, such as power windows, automatic gearbox and
electronic stability program (Handmer, 2014; Knight, 2012). High-end automobiles can
be bought with intelligent features like automatic start-stop mechanism enhanced cruise
control, active lane assistance and self-parking technology (Handmer, 2014; Knight
2014).
These innovations make driving more comfortable, but still require human interaction
(Knight, 2012). However, todays’ connected cars and increasing technological progress
pave the way for fully autonomous vehicles (Handmer, 2014).
This master thesis adopts the definition from the National Highway Transport Safety
Administration (NHTSA) for autonomous vehicles. According to the NHTSA (2013),
driverless cars are defined as:
“[…] those in which operation of the vehicle occurs without direct driver
input to control the steering, acceleration, and braking and are designed so
that the driver is not expected to constantly monitor the roadway while
operating in self-driving mode”.
Driver-less car technology today is very advanced and opens new possibilities for
individuals, automotive companies but also for new market players
The most well-known OEMs of the automobile industry, as well as new companies,
expect to sell limited self-driving cars, vehicles that allow drivers to hand over full control
of all safety-critical functions under certain traffic or environmental conditions, before
2020 (IHS Automotive, 2014).
Furthermore, Information Handling Services (2014) (IHS) estimates that globally 230
thousand autonomous vehicles will be sold till 2025 and that this number will grow to
11.8 million cars in 2035.

2
Thus, if the assumption of autonomous driving technology comes true, it will have a
strong effect on individual mobility. However, before driverless vehicles enter the market
three main challenges relating to technology, legal and consumers lie ahead (IHS
Automotive, 2014). Software reliability and cyber security must be guaranteed (Kelly &
CNN, 2014), a legal framework for self-driving vehicles regarding insurance and liability
has to be established (Kelly & CNN, 2014) and consumers must be convinced to accept
driverless vehicles (IHS Automotive, 2014).
Consumers may question, whether driverless driving features will offer an overall better
option than driving themselves. Taking into account that failure of consumer acceptance
entails considerable costs to companies (Chiesa & Frattini, 2011). It is essential for
organizations to understand under which circumstances customers accept autonomous
cars. Acceptance and future use of new technologies are frequently subject to tradeoffs
between uncertain benefits and costs of adopting the new invention (Venkatesh, Morris,
Davis, & Davis, 2003).
Several studies have researched the acceptance of driver assistant systems (DAS) (Adell,
2009; Arndt, 2004; Arndt & Engeln, 2008; Huth & Gelau, 2013). However, so far no
studies have explored users’ acceptance of fully autonomous driving systems.
1.2 Objective and plan of action
This research aims to find which factors influence consumers’ intention to purchase a
fully autonomous driving system in the future and which perceived product
characteristics influence the purchase intention and how.
The objective of this thesis is to answer the following questions:
(1) Which product characteristics of driverless technology influence consumers
purchase intention?
(2) How strong are effects of perceived product characteristics on purchase intention?
(3) Are they positively or negatively related to purchase intention?
To answer the research questions, the model of acceptance of driver assistant system
(Arndt, 2011) is adapted to ensure fit with the context of driverless cars. Further, a
quantitative online survey is conducted to empirically investigate the topic. The
determinants of purchase intention of a fully autonomous driving system are analyzed
using structural equation modeling (SEM).

3
The dissertation proceeds as follows: In chapter 2, the background, expected functions,
assumed benefits and drawbacks as well as the current state of autonomous driving
technology is summarized. This is followed by a literature review of the fundamental
theoretical models and the model of acceptance of driver assistant systems by Arndt
(2011). In the first part of chapter 4 the research model is presented and hypotheses are
derived. In the second part, the methodology is outlined. Chapter 5 presents the analysis
of the collected data. This is followed by the presentation of the relevant findings. In
section 7 a discussion about the survey results is provided. Moreover, limitations and
implications for further research are emphasized. Subsequently, a conclusion summarizes
the key aspects of this thesis and provides practical implications.

4
2. State of the art on fully autonomous driving technology
This chapter reviews the current state of the art of autonomous car technology, possible
benefits, as well as challenges, and drawbacks from the technology.
The dream of autonomous vehicles is as old as the early 1930 when driverless vehicles
and taxis have been improving the lives of millions in science fiction books (Weber,
2014). However, rather than revolutionary, progress was only incremental till the
beginning of this century (Weber, 2014). For the first time in 2005, several driverless
vehicles were able to cross a 150 miles long track in California’s Mojave Desert in the
Defense Advanced Research Projects Administration (DARPA) challenge (Fagnant &
Kockelman, 2013; Weber, 2014). Furthermore, in 2007 six teams completed the Urban
Challenge, which required to deal with moving and fixed obstacles and to obey traffic
rules in order to simulate realistic everyday traffic scenarios (Fagnant & Kockelman,
2013). Since then, most of the OEMs, including BMW, Audi, GM, Nissan, Volkswagen,
Mercedes-Benz began to accelerate research & development in driverless cars (Fagnant
& Kockelman, 2013).
Autonomous vehicle technology is defined as electronic systems that complement todays
cars to control its driving without the need of a human driver (IHS Automotive, 2014).
In NHTSA’s statement of policy on automated vehicles, different levels of vehicle
automation are defined as shown in table 2-1.

5
Table 2-1: Definitions of vehicle autonomy. Source: NHTSA (2013).
Currently, autonomous vehicles are already allowed to be tested on public roads in the
four states Michigan, Florida, Nevada and California of the United States of America (and
the government in the United Kingdom (has ruled to allow testing from 1st January 2015
(BBC News, 2014).
The requirements for a driverless car are straight forward. It has to be able to drive from
its current location to a defined target and obey all traffic rules, including the reading and
understanding of all necessary road signs and signals, during the journey (IHS
Automotive, 2014).
Even though the companies’ driverless car systems’ show differences in design to fulfill
these requirements, they usually consist of lasers, cameras, GPS, radar, processors and
complex software systems (Knight, 2012) which are illustrated in figure 2-1.
Level Autonomy
0 No Automation. The driver is in complete and sole control of the vehicle controls (brake,
steering, throttle, and motive power) at all times
1 Autonomy of one or more primary control functions. E.g. the vehicle assists
automatically with pre-charged braking to enable driver to stop faster than possible by
acting alone.
2 Autonomy of at least two primary control functions designed to work in unison to relieve
the driver of control of these functions. E.g. the combined function of active cruise
control and lane centering.
3 Limited Self-Driving Automation: Vehicles at this level of automation enable the driver to
cede full control of all safety-critical functions under certain traffic or environmental
conditions and in those conditions to rely heavily on the vehicle to monitor for changes in
those conditions requiring transition back to driver control. The driver is expected to be
available for occasional control, but with sufficiently comfortable transition time.
4 Full Self-Driving Automation: The vehicle is designed to perform all safety-critical driving
functions and monitor roadway conditions for an entire trip. It is designed so that the
driver will provide only destination or navigation input. The driver is not expected to be
available for control at any time during the trip. This includes both occupied and
unoccupied vehicles.
6
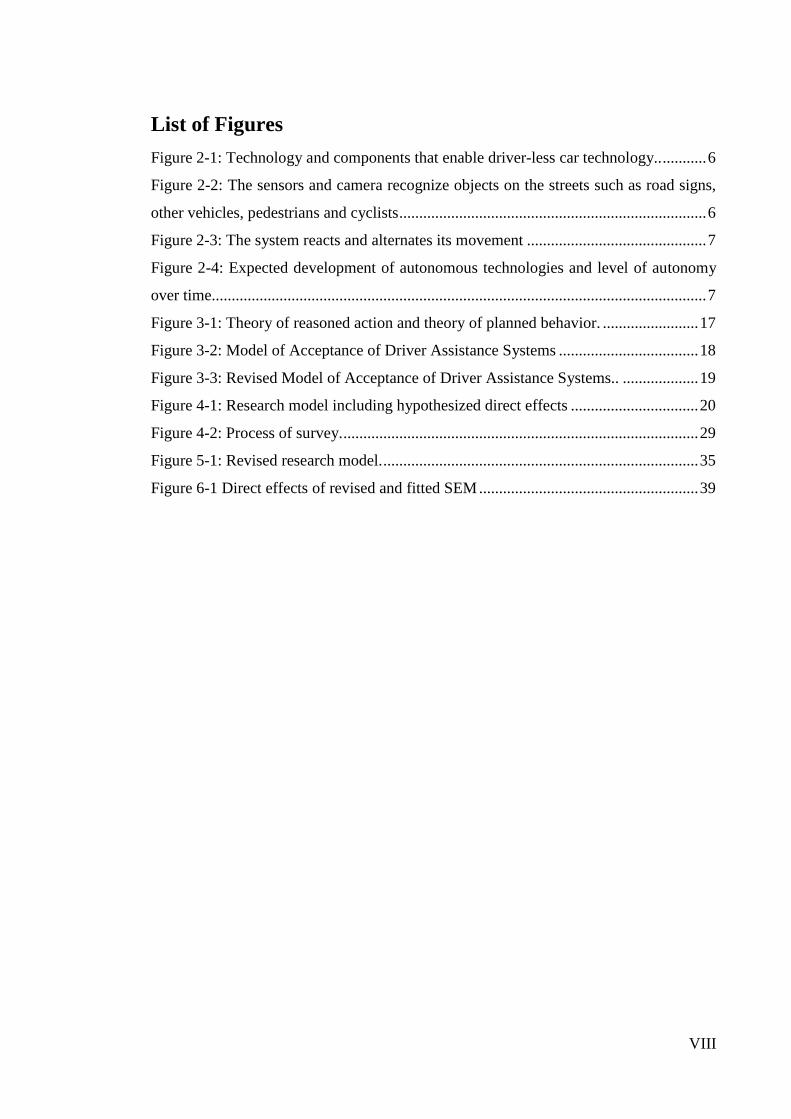
Figure 2-1: Technology and components that enable driver-less car technology. Source: Kiconco (2014).
The technology that enables autonomous driving can be described in three steps:
First step: the vehicle identifies its own position by GPS and perceives its environment,
using cameras, lasers and radars to identify obstacles e.g. other vehicles, pedestrians,
bikers or constructions sites on the road and also identifies the distance from these (IHS
Automotive, 2014; Knight, 2012).
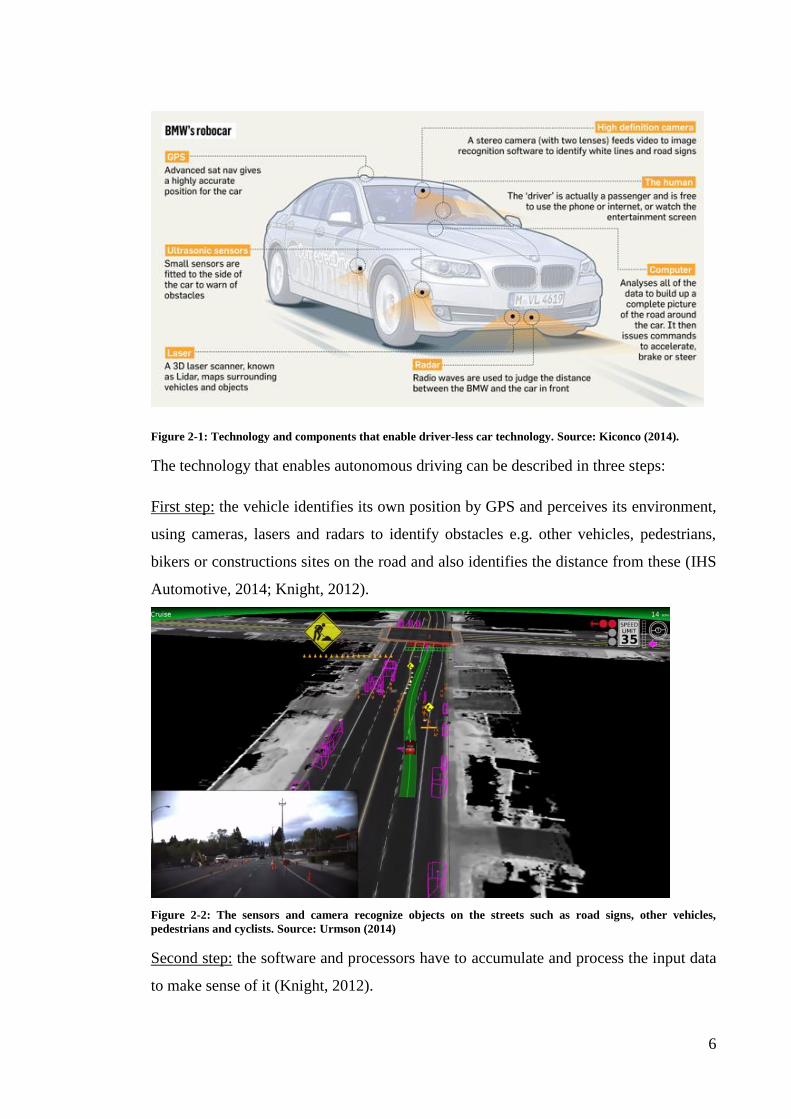
Figure 2-2: The sensors and camera recognize objects on the streets such as road signs, other vehicles,
pedestrians and cyclists. Source: Urmson (2014)
Second step: the software and processors have to accumulate and process the input data
to make sense of it (Knight, 2012).

7
Third step: the system reacts and adapts the movement of the vehicle in real time (Knight,
2012).
Figure 2-3: The system reacts and alternates its movement. Source: Tutu (2011).
Figure 2-4 illustrates how experts believe autonomous vehicle technology will evolve
from the sum of the listed driver assistance systems. The horizontal axis describes the
approximated entrance time of the technology and the vertical axis shows the
corresponding autonomy level according to the definitions of NHTSA (2013).
Figure 2-4: Expected development of autonomous technologies and level of autonomy over time. Source: IHS
Automotive (2014).

8
It is expected that autonomous driving will be available from 2025 but first only in cars
of the luxury segment and then slowly move down to mid- and low cost vehicles over the
next decade (IHS Automotive, 2014).
2.1 Potential advantages and promises
2.1.1 Safety benefits
The NHTSA found that in 2008 human error accounted for 93 percent of car accidents in
the U.S. (National Highway Traffic Safety Administration, 2008). Autonomous driving
systems show a great potential to increase traffic safety, since they enable the driver to
hand over all safety critical functions to the system, in situations of fatigue, sickness or
when being distracted.
According to the World Health Organization, (World Health Organization, 2013) every
year worldwide approximately 1.24 million people die and an additional 50 million
people become injured in car accidents. Injuries from road accidents are number eight
leading cause of death worldwide and for young people between 15 and 29 years old it is
even the leading cause of death (European Commission, 2003; World Health
Organization, 2009).
Several authors believe that the rate of accidents could be reduced close to zero percent
for fully automated cars (Bickerstaffe, 2014; IHS Automotive, 2014; KPMG & CAR,
2012; Noor & Beiker, 2012).
2.1.2 Times savings
Automated cars have the ability to achieve time savings for passengers and other vehicles
via several functions.
Automated vehicles are expected to be able to optimize their route choice according to
up to date traffic information from other vehicles and thereby are expected to reach the
desired destinations faster than human drivers (Fagnant & Kockelman, 2013).
The Federal Highway Administration (2005) found that one eight of congestion is
attributable to road accidents. Reduced accident rates through automated vehicles will
have an impact to reduce congestion and travel times for all participants (Anderson et al.,
2014). Automobile manufacturers further develop cars, which enable vehicle-to-vehicle
(V2V) and vehicle-to-infrastructure (V2I) communication (Anderson et al., 2014;

9
Fagnant & Kockelman, 2013; KPMG & CAR, 2012). V2V enables vehicles to sense and
anticipate the leading vehicles’ decision to accelerate and brake (Anderson et al., 2014;
KPMG & CAR, 2012) and thus declines. Traffic-destabilizing shockwave propagation
can be achieved through more anticipatory speed adjustments when following others and
when approach traffic lights (Fagnant & Kockelman, 2013). Likewise, autonomous
vehicles are expected to be able to drive closer together and hence enable an increase in
the utilization rate of current infrastructure (Fagnant & Kockelman, 2013; Tientrakool,
Ho, & Maxemchuk, 2011). Tientrakool, Ho, & Maxemchuk (2011) posed if all vehicles
would use adaptive cruise control (ACC) and sensors to automatically brake, the highway
capacity would increase from 43 up to 273 percent and that speed of congested traffic
may increase by 8 to 13 percent. Furthermore, V2I will enable autonomous cars to
optimize adjustments in acceleration, speed and braking according to traffic information
from traffic lights and other infrastructure (Anderson et al., 2014).
Autonomous vehicles are further designed with self-parking functionalities, which will
evolve in two levels (Fagnant & Kockelman, 2014; IHS Automotive, 2014). The first
level of self-parking is already commercially available and requires the driver to
accelerate, speed and break manually, while the car takes over the steering into the gap
(IHS Automotive, 2014). The second level, expected by 2018, will be an autopilot for
finding a parking space and retrieving from it without interaction and without the presence
of the driver (IHS Automotive, 2014). Shoup (2005) indicated that around 30 percent of
traffic in business districts is caused by vehicles, trying to find a place to park near their
occupants’ desired destination. Drivers of autonomous vehicles can ask the vehicle to
drop them off at destination and to find a parking place in a cheaper area. This saves the
driver a significant amount of time and money (Fagnant & Kockelman, 2013; Ferreras,
2014; IHS Automotive, 2014; Knight, 2012; KPMG & CAR, 2012). Moreover, self-
parking should reduce the number of minor damages caused by parking accidents.
Especially in rural areas, parents or friends spend a lot of time driving people around that
are under current legislation unable to drive, e.g. elderly, young or sick people. Experts
agree that the cost of time for these rides can be drastically reduced by transporting these
groups of people in driverless cars (Fagnant & Kockelman, 2013; IHS Automotive, 2014;
KPMG & CAR, 2012).

10
2.1.3 Fuel savings
Similarly to time savings, anticipatory driving from V2V and V2I communication enables
fuel reduction (Fagnant & Kockelman, 2013). Atiyeh (2012) showed that fuel economy
may increase by 23 to 39 percent through automated vehicles, ACC and V2V and V2I.
Additionally, the higher utilization of roads, autonomous vehicles ability’ to travel closely
together and reduction of air resistance of shared slipstreams will further result in fuel
savings (Fagnant & Kockelman, 2013).
Lastly, several studies mention that increased fuel economy of automated vehicles may
lessen environmental damage from reduced greenhouse emissions and lower air pollution
and thus have a possibility to reduce social costs related to human health but also climate
change (Anderson et al., 2014; Ferreras, 2014; KPMG & CAR, 2012).
2.1.4 Productivity
Autonomous technology enables passengers of driverless cars to involve themselves in
different kinds of activities, such as working, watching movies, reading or even sleeping
(Anderson et al., 2014; Fagnant & Kockelman, 2013; Kelly & CNN, 2014). Moreover,
designers already imagine cars to be transformed into mobile offices for job categories
like salespersons, which have to travel a lot (AG, 2014).
Finally, people have experienced situations in which they would like to meet friends or
family, but eventually do not, because the use of public transport and/or driving
themselves takes too much time and effort. With the possibility to do other things than
driving, autonomous driving technology and its ability to reduce the opportunity cost of
time, has a great potential to solve these issues (Fagnant & Kockelman, 2013; Kelly &
CNN, 2014).
2.2 Effects on convenience and travel behaviour
2.2.1 Increased mobility for people unable or unwilling to drive
Automated vehicles will allow access to individual mobility for young, elderly, sick, or
blind people that are currently not allowed to steer a car (Anderson et al., 2014). In
Googles driverless car video “Self-Driving Car Test: Steve Mahan” a blind man is invited
to go around town in one of their self-driving cars to run errands, such as buying tacos

11
(Google Inc., 2014). Other usage examples of self-driving cars are rides to hospital by
sick people or just carrying the children to and from school.
Concluding, these groups of people can especially benefit from more independence,
reduced social isolation and access to essential services (Ayodele & Ragland, 2003;
Rosenbloom, 2001).
2.2.2 Efficiency – utilization of cars & cost savings
Shoup (2005) argued that the typical car sits idle in the parking spot around 95 percent of
its lifetime. Researchers anticipate that private persons can reduce the number of cars they
own since one automated car can drop of and pick up several family members during the
day instead of a manual driven one being parked 23 hours out of every day (Fagnant &
Kockelman, 2013, Ferreras, 2014).
As a solution to high vehicle cost and low utilization rate, consumers already engage in
increased car sharing services. Therefore, experts anticipate this current trend in North
America and Europe to strengthen with the emergence of autonomous cars and the
possibility of lowering vehicle costs per person (Anderson et al., 2014; Butterman, 2013;
Fagnant & Kockelman, 2013; KPMG & CAR, 2012)
2.2.3 Insurance charges
Experts believe that fully autonomous cars will have a large possibility to reduce
individual car insurance costs (Anderson et al., 2014; KPMG & CAR, 2012). Car
premiums are calculated based on driver and vehicle characteristics like age, number of
accidents in the past, gender, engine size, etc.. New service models, such as “pay as you
go and drive” are expected to enable drivers to save insurance costs, because insurance
companies can offer different premiums for human driven and autonomous driven cars
(KPMG & CAR, 2012). Thus, there is a high probability that insurance premiums for
driverless cars will be lower due to the avoidance of human errors.
2.2.4 Trends
Knight (2012) argued that demographic change, ageing population with slower reflexes
and worsening eyesight in Western societies increase the need for driverless cars to
remain mobile and independent.

12
In contrast studies indicated that young people become less enthusiastic to drive and fewer
young people gain a driver license (Davis & Dutzik, 2014; KPMG & CAR, 2012). Neff
(2010) and Davis & Dutzik (2014) advocated that younger generations, growing up with
social networks, game consoles and smart phones are less interested in cars, because they
want to be constantly connected and perceive the act of driving rather as a distraction
from being online. Davis & Dutzik (2014), KPMG & CAR (2012) and Fagnant &
Kockelman (2014) posed that car ownership became less important to generation Y.
Additionally, KPMG & CAR (2012) found that even baby boomers owning premium cars
would eagerly give up driving to work in exchange for a stress-free commute.
Moreover, especially in urban areas an increasing usage of car sharing is predicted
because driverless cars can be ordered flexibly according to personal needs using
telecommunication devices like smartphones (Fagnant & Kockelman, 2014; KPMG &
CAR, 2012).
Concluding, experts anticipate that all three trends will support the acceptance of
driverless vehicles. (Anderson et al., 2014; Butterman, 2013; Fagnant & Kockelman,
2013; KPMG & CAR, 2012).
2.3 Potential disadvantages
Autonomous driving technology does not only offer advantages, but also disadvantages.
In case all mentioned benefits and trends prove true, they also point toward increasing
vehicle miles with associated externalities of increasing absolute fuel consumption,
congestion, suburban sprawl and higher demand for road capacity in total (Anderson et
al., 2014; Fagnant & Kockelman, 2013; KPMG & CAR, 2012). Since many of the
benefits depend on network effects, the adoption of autonomous cars, V2V and V2I
communication, it is hard for experts to forecast the exact development.
Moreover, automated technologies are likely replace jobs related to driving, such as taxi
and bus operators and delivery and professional driver jobs (Anderson et al., 2014;
Fagnant & Kockelman, 2013; KPMG & CAR, 2012). In contrast, the new technology
will also create a high amount of new jobs, however, it is questionable if a skill match
exists for those people losing their occupation (Anderson et al., 2014).
13
Additional industries such as insurance companies, repair shops, doctors and lawyers will
face strong changes in the economic environment as road accidents disappear (Fagnant
& Kockelman, 2013).
2.4 Barriers
2.4.1 Software and hardware reliability
Today’s traffic situations are very complex because they involve many participants such
as other vehicles, cyclist, pedestrians, animals but also physical obstacles like
construction sites or lost objects on the Recognizing humans and other objects on the road
is critical and difficult for computers, since they can appear in all sizes and may be
standing, walking or even lying (Fagnant & Kockelman, 2013).
Especially urban traffic shows a high amount of complexity, which is yet not mastered
by any of the current companies (Anderson et al., 2014). The software, operating these
cars has to be completely reliable and will need extensive testing of all possible events
(IHS Automotive, 2014).
Another issue mentioned by IHS Automotive (2014) is cyber security. Accordingly the
industry will be constantly challenged to provide a secure system, which is able to detect
and rectify intrusions into the vehicle’s operating system.
Additionally, the software reliability, poor weather conditions such as fog, snow, ice, rain
and storms challenge the hardware, especially the sensors to safely operate self-driving
vehicles (Anderson et al., 2014; Fagnant & Kockelman, 2013).
2.4.2 Customer acceptance
The acceptance of driverless technology by consumers ranks among the highest obstacles
of driverless technology (Butterman, 2013). A lot of people really enjoy driving
themselves and strongly identify themselves with cars (Butterman, 2013). Butterman
argues that to give this freedom up is not appealing for them and will require a lot of effort
to change their behavior and habits.
Furthermore, people have to trust the technology (IHS Automotive, 2014; KPMG &
CAR, 2012). In a survey among 1,500 American, Australian and British drivers regarding
limited and completely autonomous driving vehicles, approximately three-quarter of
Americans and two-thirds of Australians and British are moderately and highly concerned

14
about the performance of self-driving vehicles compared to human drivers (Schoettle &
Sivak, 2014). Additionally, the survey results show that nearly two-third are strongly or
moderately worried about the systems’ and cars’ security from hackers, a possible loss of
privacy and data, the systems’ performance in bad weather conditions and its interaction
with other vehicles, bicyclists and pedestrians (Schoettle & Sivak, 2014).
2.4.3 Implementation of regulatory and legal framework
Finally, the availability or the lack of legislation will influence the speed at which
automated cars are allowed to enter the market (IHS Automotive, 2014). Some states of
the U. S., such as California and Nevada, already passed legislations permitting the
operation of autonomous cars. However, the majority of states and especially no complete
country in the world has passed any legislation yet (KPMG & CAR, 2012).
Furthermore, a legal framework regulating insurance and liabilities for self-driving cars
is missing (IHS Automotive, 2014). There are still several open questions regarding the
liability in accidents: “Who is liable if an automated car gets involved in an accident? -
The passenger of the vehicle, the manufacturer or the company providing the operation
system?” (KPMG & CAR, 2012). Since such potential complex liability issues have to
be settled, legislation experts believe especially the implementation of a legal framework
will slow down the growth of automated cars (IHS Automotive, 2014; Kelly & CNN,
2014; KPMG & CAR, 2012).
15
3 State of the art on acceptance and behavioural theory
At first, an introduction to the different definitions of acceptance and the term used for
this research is given. Afterwards, the link between intention and behavior is explained.
Moreover, the model of acceptance of DAS, the theory of reasoned action (TRA) and
theory of planned behavior (TPB) are discussed.
3.1 What is acceptance
In the field of drivers’ acceptance of support systems, it is close to impossible to find a
standard definition of acceptance that fits all purposes and disciplines (Arndt & Engeln,
2008). Regan, Mitsopoulos, Haworth, & Young (2002) argued:
“While everyone seems to know what acceptability is, and all agree that
acceptability is important, there is no consistency across studies as to what
‘acceptability’ is and how to measure it”.
A major problem of acceptance research in this field derives from the mixture of attitude
and behavior aspects (Anstadt, 1994). Franken (2007) stated that the decision to accept a
system is based on attitudinal acceptance from experience and emotions related to the
system. Kollmann (1999) defined that acceptance goes beyond the affective and cognitive
attitude formation, and intention to act. Additionally, he posed that acceptance manifests
in the specific acquisition and usage of a product. Similarly, Arndt (2004) affirmed in the
context of DAS that the acceptance of DAS has to connect the affective and cognitive
assessment with the actual adoption and use of the system. Likewise, (Adell, 2009)
defined acceptance of DAS as:
“the degree to which an individual intends to use a system and, when
available, to incorporate the system in his/her driving.”
Based on the discussion of the term acceptance and the unavailability of driverless car
technology, the definition for this research is built on intention and not actual behavior.
3.2 From intention to behavior
Behavioral intention is an indicator of a person’s readiness to perform a given behavior
and is considered to be the direct antecedent of behavior (Ajzen, 1991). Wicker (1969)
revealed that studies using intention to predict behavior had a rather low and non-
16
significant intention-behavior relationship. Conversely, Ajzen (1991) found the intention-
behavior relationship to be positive and significant, if research is well established.
Intention is a weak predictor of behavior, if the target behavior is formulated vaguely, if
attitude and intention after being measured change, and if the timespan between the
measurement of intention and the behavior is very long (Ajzen, 2005). To reliably predict
behavior from intention, the target behavior, the situation, in which the behavior should
be performed, and the time aspect has to be formulated specifically (Ajzen, 1991).
Intention as a predictor of behavior is not limited to behavior changing studies, but is
widely used in acceptance of information technology research, product development, and
medical research (e.g. Davis, Bagozzi, & Warshaw, 1989; Venkatesh et al., 2003).
3.3 Fundamental theoretical models
This research is based on the revised “Modell der Akzeptanz von
Fahrerassistenzsystemen“ (Arndt & Engeln, 2008). An English title for the theory is not
available; therefore the proposed translation “Model of Acceptance of Driver Assistance
Systems” (MADAS) will be used for better understanding for the rest of the study.
Since the MADAS is based on the theory of reasoned action and the theory of planned
behavior, both theories are reviewed before proceeding to MADAS.
3.3.1 Theories of reasoned action and of planned behavior
The TRA by Fishbein & Ajzen (1975) is one of the most fundamental and influential
theories to predict human behavior (Venkatesh et al., 2003). It states that an individual’s
behavioral intention depends on the person’s attitude toward behavior and the
surrounding subjective norms toward the behavior (Fishbein & Ajzen, 1975). The
behavioral intention then directly influences people’s behavior.
The TPB is an extension of the TRA to help explain how people’s behavior can be
changed (Ajzen, 1991). Both are illustrated in figure 3-1.

17
Figure 3-1: Theory of reasoned action and theory of planned behavior. Source: Adapted from Madden, Ellen,
& Ajzen (1992).
Ajzen (1991) included the variable Perceived Behavioral Control into TRA to account for
non-voluntary behaviors. The formed TPB suggests that Behavioral Intentions and
Behavior are guided by Attitude toward Behavior, Subjective Norm and by Perceived
Behavioral Control (Ajzen, 1991).
Attitude toward Behavior is an individual’s evaluation of positive and negative
consequences that are perceived results from performing the target behavior (Fishbein &
Ajzen 1975). Subjective Norm describes a person’s perception whether people, who are
important to him/her, think that he/she should or should not perform the behavior under
consideration (Fishbein & Ajzen 1975). Perceived Behavioral Control, is a persons’
evaluation with which expected easiness or difficulty the behavior will be performed
(Ajzen, 1991). The Behavioral Intention measures a person’s relative strength of intention
to perform the behavior in question (Fishbein & Ajzen, 1975). Finally, Behavior is the
observable outcome in response to a given situation and target (Fishbein & Ajzen, 1975).
3.3.2 Model of Acceptance of Driver Assistance Systems
The MADAS is based on the theory of planned behavior and the acceptance model of
road pricing measures by Schlag (1997). Firstly, Arndt & Engeln (2008) designed the
model to explain the acceptance of DAS, where acceptance is being defined as the actual
purchase and use of the systems. Secondly, it is used to identify and analyze barriers and
incentives to buy these systems before they are introduced to the market (Arndt & Engeln,
2008).

18
The MADAS is shown in figure 3-2.
Figure 3-2: Model of Acceptance of Driver Assistance Systems. Source: Arndt, Engeln, & Vratil, (2008).
The acceptance of a DAS is predicted using the variables of the TPB, and includes
external variables (perceived product features) to obtain detailed reasons for the
acceptance or rejection of DAS.
Purchase Intention to buy driverless driving technology is defined as the degree to which
an individual believes that one will acquire a fully autonomous driving system in the
future. Attitude toward Buying includes the consequences that potential customers expect
from the purchase and the value they attach to these expectations (Arndt & Engeln, 2008).
Subjective Norm is an individual’s belief that reference persons or groups have regarding
the acceptance of the system in question (Arndt & Engeln, 2008).
Perceived Behavioral Control is defined as the expected ease or difficulty to actually
purchase the DAS, which is assumed to depend on an individual’s belief about own
abilities, resources and situational factors (Arndt & Engeln, 2008).
The Perceived Product Characteristics identify and measure the direction and strength
of whether users approve or reject some characteristics (Arndt & Engeln, 2008). They
proposed that a DAS can contribute to comfort while driving, traffic safety, eco-

19
friendliness, driving enjoyment and driver image. Additionally, this construct measures
the consumer’s trust in the system and the usability of it.
Arndt (2011) revised the MADAS, after performing a two-step structural equation model
analysis on it in her doctoral thesis. Figure 3-3 illustrates the revised model.
Figure 3-3: Revised Model of Acceptance of Driver Assistance Systems. Source: Arndt (2011).
Arndt (2011) tested the model for a navigation system and found that all effects from
Perceived Product Characteristics were completely mediated by the variables of the TPB
on Purchase Intention. In contrast to TPB, Subjective Norm did not have a direct impact
on Intention but on Attitude toward Buying the DAS. Additionally, Attitude toward
Buying the DAS was found to directly influence Perceived Behavioral Control besides
directly influencing Purchase Intention (Arndt, 2011). The causal effects of Usability and
Driving Enjoyment could not be assessed since they caused a negative covariance matrix
(Arndt, 2011).

20
4 Research methodology
In the beginning of this section, the research model to explore the acceptance of driverless
car technology is presented and the hypotheses to be tested, are developed. Afterwards
the method and measures used to gather, process and analyze the data, are described. The
chapter finishes with an overview on descriptive statistics of the survey.
4.1 Research model
The research model, illustrated in figure 4-1 is based on the MADAS (Arndt, Engeln, &
Vratil, 2008), and adapted to the acceptance of fully autonomous driving systems for cars.
Figure 4-1: Research model including hypothesized direct effects. Source: Own illustration.
The model hypothesizes that Perceived Product Characteristics are expected to influence
Subjective Norm and Attitude. Potential consumers’ Purchase Intention is proposed to be
determined by his/her Attitude and by Subjective Norm. Attitude and Subjective Norm
are expected to mediate all effects from Perceived Product Characteristics on Purchase
Intention.
Purchase Intention to buy driverless driving technology is defined as the degree to which
an individual believes that one will acquire a fully autonomous driving system in the
future.
Attitude, equivalent to Attitude toward Behavior by Fishbein & Ajzen (1975), is the
product of the consequences that potential customers expect from the purchase of a fully

21
autonomous driving system and the value they attach to these expectations (Arndt &
Engeln, 2008).
Subjective Norm is an individual’s belief that reference persons or groups have regarding
the acceptance of the system in question (Arndt & Engeln, 2008).
Perceived Product Characteristics identify whether the users approve or reject some
characteristics. They measure the perceived impact of DAS on Comfort while driving,
Traffic Safety, Eco-Friendliness, Driving Enjoyment, Driver Image and consumer’s Trust
in the System (Arndt & Engeln, 2008). To fit the model to driverless systems, the
perceived characteristics Productivity, Efficiency, and Time Saving, derived from fully
autonomous driving literature (see chapter 2), are added as possible predictors of
intention. Moreover, Usability was removed from the model.
The construct of Perceived Product Characteristics helps to answer the first, second and
third objective of this research: (1) Which product characteristics of driverless technology
influence the consumers’ purchase intention? (2) How strong is the influence of perceived
product characteristics on purchase intention? (3) Are the influences positively or
negatively related?
The variables Attitude towards buying and Subjective Norm of the TRA, are mediators.
Mediators describe a causal chains of causation and help to identify a more accurate
explanation for the relationships between independent and dependent variables (Hair,
Black, Babin, & Anderson, 2010). In this research model, they are necessary to answer
the fourth objective: (4) Why do the perceived product characteristics affect purchase
intention?
4.2 Theoretical reasoning and hypothesis development
In chapter 3.2 empirical findings regarding the positive relationship between behavioral
intention and behavior have already been discussed. (Ajzen, 1991) found if a person has
a strong behavioral intention, the probability is high that the person will perform the
behavior. In context of this study, purchase intention means that the person has the
objective to buy a fully autonomous driving system and based on past findings, predicts
actual purchase in the future.

22
4.2.1 Effects of behavioral variables
Attitude consists of an emotional evaluation toward the behavior and an cognitive
evaluation of the expected consequences of the behavior (Arndt, 2011). Arndt (2011);
König (2005) and identified Attitude to be the strongest predictor, explaining between 69
and 74 percent of the variance in Purchase Intention of DAS. In line with this, it is
proposed:
H1: Attitude has a positive direct effect on Purchase Intention.
Subjective Norm is determined by the perceived expectations of people, who are
important to the user and the strength of motivation to comply with their expectations
Due to the high price value of a car purchase and different needs of users in a household,
potential buyers take into account the opinion of others in their purchase decision (Davis,
1976). Further, while only a part of the benefits are accumulated by the buyer of the
vehicle, the majority of benefits accrues to other vehicles, bicyclists, pedestrians and the
environment in the form of positive externalities (Anderson et al., 2014; Fagnant &
Kockelman 2013). Both, opinion of important others and the wider society, are expected
to cause a positive relationship between Subjective Norm and Purchase Intention.
H2: Subjective Norm has a positive direct effect on Purchase Intention.
4.2.2 Effects of perceived product characteristics on acceptance
Empirical studies have shown that consumers’ evaluation of product functions impact the
acceptance of DAS (Arndt, 2004; Arndt, 2011; Huth & Gelau, 2013; König, 2005, Van
der Laan, 1998). Since fully autonomous driving systems are made up of the sum of
several DAS, perceived product characteristics are hypothesized to impact the Purchase
Intention of these systems in the future.
Usability (often termed Perceived Easiness to Use) has shown to be an important predictor
of use in several acceptance studies (Davis, 1985; Davis et al., 1989; Venkatesh, Thong,
& Xu, 2012). However, currently only assumptions are available on how driverless
technology will be controlled in the future, e.g. via voice control or smartphone (KPMG
& CAR, 2012). Without the possibility of interacting with a prototype or viewing a
presentation on how the systems will be operated, reliable results when asking individuals
regarding their perceived usability of a driverless system are not expected. Thus, it was
decided to remove it from the model. Nevertheless, once the operation of the systems is

23
known, it is recommended to include this variable in future acceptance studies related to
driverless driving technology.
Perceived Time Saving measures the degree to which an individual believes that using
the system will help to save time. The use of fully autonomous driving technology is
expected to decrease traveling time through optimized routing, anticipative driving and
efficient use of lanes (Anderson et al., 2014; Fagnant & Kockelman, 2013; KPMG &
CAR, 2012). Shoup (2006) observed that around 30 percent of traffic in business districts
is caused by vehicles trying to find a place to park. The system’s self-driving and self-
parking function is expected to enable drivers to send the vehicle to find a parking and
park on its own (Fagnant & Kockelman, 2013; Ferreras, 2014; IHS Automotive, 2014;
Knight, 2012; KPMG & CAR, 2012). Moreover, fully autonomous driving systems
enable individual mobility for people that are unfit or unable (e.g. elderly, young or
physically handicapped) to drive (Fagnant & Kockelman, 2013; KPMG & CAR, 2012).
With this the time spent driving family members or friends around that are unable to drive,
can be reduced, because they can use a car with a driverless system themselves. In
conclusion it is hypothesized:
H3a: Time Saving has a positive direct effect on Attitude.
H3b: Time Saving has a positive direct effect on Subjective Norm.
H3c: Time Saving has a positive indirect effect on Purchase Intention.
Perceived Productivity assesses the degree to which consumers associate that the use of
the system supports them to increase their ability to achieve more things that are important
to them. The technology enables passengers to involve themselves in all kind of different
activities such as working, watching movies, reading or even sleeping (Anderson et al.,
2014; Fagnant & Kockelman, 2013; Kelly & CNN, 2014) while driving. Thus, the
opportunity cost of time for owners of the technology is reduced (Fagnant & Kockelman,
2013; Kelly & CNN, 2014). Moreover, people encounter situations where they would like
to go to places, meet family or friends but driving there and back by car is too much effort
and public transport can be inconvenient and costly. Since driverless driving enables to
reach places without engaging in tiring drives and without compromising on convenience
or flexibility it is expected to increase the time and amount for activities with family and
friends. Therefore, it is hypothesized:

24
H4a: Productivity has a positive direct effect on Attitude.
H4b: Productivity has a positive direct effect on Subjective Norm.
H4c: Productivity has a positive indirect effect on Purchase Intention.
Perceived Utilization measures the degree to which an individual believes that purchasing
the system will enable a higher usage of a car. According to Shoup (2005) the typical car
sits idly in the parking spot around 95 percent of its lifetime. Cars with fully automotive
driving systems enable to use a car more often and thereby increase possible utilization
(Fagnant & Kockelman, 2014; Ferreras, 2014; KPMG & CAR, 2012). Since one
automated car can drop of and pick up several household members during the day instead
of a manual driven car sitting idly on the parking spot while being at work (Fagnant
& Kockelman, 2014) a positive relationship between Utilization and Attitude, Subjective
Norm and Purchase Intention is hypothesized.
H5a: Utilization has a positive direct effect on Attitude.
H5b: Utilization has a positive direct effect on Subjective Norm.
H5c: Utilization has a positive indirect effect on Purchase Intention.
Perceived Image measures the effect of the system’s use on driver image and acceptance
of the technology (Arndt, 2011). Cars and new technologies, are often used to express or
improve ones’ status (Arndt, 2011). Yet, the use of driverless technology could also have
a negative effect, since the technology could convey that its users are bad drivers.
Nevertheless, as benefits of driverless driving technology accrue to the owner and to other
traffic participants, household members and environment (Fagnant & Kockelman, 2013),
it is expected that buying a driverless system is viewed as beneficial and desirable by
society. Since the effect of Image considers what other people think about the purchase,
Image is hypothesized to have a positive effect on Subjective Norm and Purchase
Intention.
H6a: Image has a positive direct effect on Subjective Norm.
H6c: Image has a positive indirect effect on Purchase Intention.
Perceived Driving Enjoyment measures the degree to which an individual perceives that
a driverless system positively influences driving enjoyment (Arndt, 2011). Arndt (2011)

25
argued that acceptance is negatively influenced by driving systems that reduce driving
enjoyment or increase boredom while driving. The impact of fully driverless technology
on driving enjoyment is however unclear, since it depends on whether people enjoy the
act of driving more than doing something else, e.g. reading a book, working or socializing.
Nevertheless, as people can decide when to drive themselves and when to use the system
to engage in another activity, a positive relationship between Driving Enjoyment and
Attitude and Purchase Intention is hypothesized.
H7a: Driving Enjoyment has a positive direct effect on Attitude.
H7b: Driving Enjoyment has a positive indirect effect on Purchase Intention.
Perceived Eco-Friendliness is the degree to which a person associates that the system
reduces the environmental impact of driving (Arndt, 2011). Through anticipative driving,
efficient routing and higher usability of the car, autonomous driving systems are expected
to use fuel more efficiently and to be more environmentally friendly (Fagnant
& Kockelman, 2014; KPMG & CAR, 2012). Over the last decade, social responsible
consumption and demand for sustainable products has been increasing (Webb, Mohr, &
Harris, 2008). Studies found that consumers’ intention to buy environmentally friendly
products were affected by environmental consciousness, social norms and the pressure to
conform to it. Additionally, consumers were found to purchase green products to improve
their self-image (Kaiser, Wolfing & Fuhrer, 1999; Kim & Chung, 2011; Park & Sohn,
2012). Since fully autonomous driving systems are expected to have a positive impact on
the environment, and taking into consideration findings from conscious consumer studies,
a direct effect on Subjective Norm, Attitude and Purchase Intention is hypothesized:
H8a: Eco-Friendliness has a positive direct effect on Attitude.
H8b: Eco-Friendliness has a positive direct effect on Subjective Norm.
H8c: Eco-Friendliness has a positive indirect effect on Purchase Intention.
Perceived Comfort deals with the degree to which an individual believes that the system
impacts the comfort of driving in a car (Arndt, 2011). Driver system relieving the driver
from stressful situations have a positive effect on acceptance (Arndt, 2011). Again, the
possibility to hand over control to the system at any time and to avoid driving in stressful
traffic situation, e.g. during rush hours, or when being tired, is expected to positively

26
influence acceptance of the technology (KPMG & CAR, 2012). Consequently, Comfort
is expected to positively influence Attitude and Purchase Intention.
H9a: Comfort has a positive direct effect on Attitude.
H9b: Comfort has a positive indirect effect on Purchase Intention.
Perceived Trust identifies the effect of trust on acceptance of the system (Arndt, 2011).
A fully autonomous driving system performs all functions of controlling the vehicle (IHS
Automotive, 2014). Therefore, it is expected that only people that have trust in the system
will value the product and form a Purchase Intention, since a malfunction of the system
could lead to injury or death. Additionally, other researchers posed trust to be an
important determinant of acceptance (e.g. Abe & Richardson, 2006; Arndt, 2011; Kassner
& Vollrath, 2006). Moreover, Arndt (2011) found a positive relationship between Trust
and Subjective Norm. Consequently, it is hypothesized:
H10a: Trust has a positive direct effect on Attitude.
H10b: Trust has a positive direct effect on Subjective Norm.
H10c: Trust has a positive indirect effect on Purchase Intention.
Perceived Traffic Safety measures the degree to which consumers perceive that fully
autonomous driving technology improves traffic safety (Arndt, 2011). Unlike humans,
computers do not get distracted or tired in traffic (Fagnant & Kockelman, 2013; KPMG
& CAR, 2012) and hence, automated vehicles have an enormous potential to reduce
traffic accidents related to human error (Anderson et al., 2014; Bickerstaffe, 2014;
Butterman, 2013; Fagnant & Kockelman, 2013; Hayes, 2011; IHS Automotive, 2014;
KPMG & CAR, 2012). Since drivers have the motive to reach their destination safely and
most drivers have encountered precarious situations while driving, such a system would
have been beneficial. A direct effect of Traffic Safety on Attitude is postulated. Moreover,
a direct effect on Subjective Norm is expected, since researchers have found that the
purchase of safety systems if often motivated by the pressure to comply with the
expectations of others (Arndt, 2011; Schade & Schlag, 2003). The following is
hypothesized:
H11a: Traffic Safety has a positive direct effect on Attitude.

27
H11b: Traffic Safety has a positive direct effect on Subjective Norm.
H11c: Traffic Safety has a positive indirect effect on Purchase Intention.
4.3 Measurement
In the field of acceptance of DAS studies, no general tool is available to validly and
reliably measure the various constructs affecting it (Adell, 2009; Arndt, 2011; Regan et
al., 2002). Nevertheless, there is consensus that quantitative questionnaires are the most
suitable method to assess acceptance and underlying constructs (e.g. Beier, Boemak, &
Renner, 2001; Van der Laan, 1998). Similarly, the acceptance of IT, which is the most
mature field in acceptance studies is mainly measured using quantitative questionnaires
(e.g. Davis, 1989; Gefen, Karahanna, & Straub, 2003; Venkatesh et al., 2012).
Accordingly, the underlying study draws on a quantitative questionnaire and mostly uses
items and scales, which have been tested previously. Since the former questionnaire was
in German, an English translation is presented while the German one is available in the
Appendix A. The questionnaire items and their sources are shown in table 4-1.
The variables of Perceived Product Characteristics, Subjective Norm and Purchase
Intention were measured on a 5-point Likert scale from (1) “Strongly Disagree” to (5)
“Strongly Agree” with (3) “Neither Agree nor Disagree” in the middle. Attitude toward
buying a fully autonomous driving system is measured using a semantic differential with
5 points drawn from Ajzen & Fishbein (2002).

28
Table 4-1: Translated questionnaire items. Source: Own illustration.
4.4 Data collection procedure and sample
The initial survey was pretested among 10 people in order to avoid vagueness in the
questionnaire that could impact validity and reliability of the research. After ambiguous
items were corrected, the survey was conducted online from 15.11. – 27.11.2014 using
the Qualtrics survey software and distributed via social networks and e-mails.
As the topic of the survey was expected to be rather new to the survey participants, an
introduction to driverless technology was provided before the survey started, which can
be found in the Appendix B.
Construct Item Source
TraSaf1: The system improves road safety.
TraSaf2: The system helps to reduce the risk of accidents
Image1: The system harms the image of the owner.
Image2: It would be embarrassing for me to use the system in front of my colleagues.
Image3: The system will be used by people that do not feel safe driving themselves.
DE1: The system makes driving boring.
DE2: The system increases driving enjoyment.
Trust1: I trust that the system performs in my interest. Arndt (2011)
Trust2: I do not trust the system. Own item
Comf1: The system allows the driver to physically relax while driving.
Comf2: The system increases the stress level of the driver.
EcoF1: The system supports environmental friendly driving.
EcoF2: The system would help me to save fuel.
Prod1: The system would increase my chances of achieving things that are important to me.Venkatesh et al.
(2003)
Prod2: The system would help me accomplish things more quickly. Own Item
TimeSav1: The system would help to decrease traveling time to my destinations. Own item
TimeSav2: The system would help me to save time. Own item
Utilization1: The system enables to share a car more efficiently with others.
Utilization2: The system enables a better/more efficient usage of the car.
Bad – Good
Useless – Useful
Unpleasant – Pleasant
Unimportant – Important
Harmful – Beneficial
SN1: I can imagine that my friends will buy a car with such a system. König (2005)
SN2: My friends would encourage me to buy a driverless system. Arndt (2004a)
SN3: My family would appreciate, if I would have such a system in my car. Arndt (2004a)
SN4: Others would find it good if I had a driverless system. Meyer (2002)
PI1: I would like to have this system in my car. Meyer (2002)
PI2: I will consider buying a car with such a system. Arndt (2011)
PI3: Once the technology is available, I plan to buy a car with a driverless system. Arndt (2011)
Which characteristics do driverless/autonomous car systems have?
Please evaluate the different properties of the system.
Arndt (2011)
Arndt (2011)Image
Traffic Safety
Own item
Would you buy a car with a fully autonomous driving system?
Productivity
Arndt (2011)
Arndt (2011)
Arndt (2011)
Driving
Enjoyment
Trust
Comfort
Would you buy a car with a fully autonomous driving system?
Purchase
Intention
I find buying a car with autonomous driving technology....
Ajzen & Fishbein
(2002)
What do you believe other people think about fully autonomous driving systems?
Eco-
Friendliness
Time Saving
Utilization
Attitude
Subjective
Norm
29
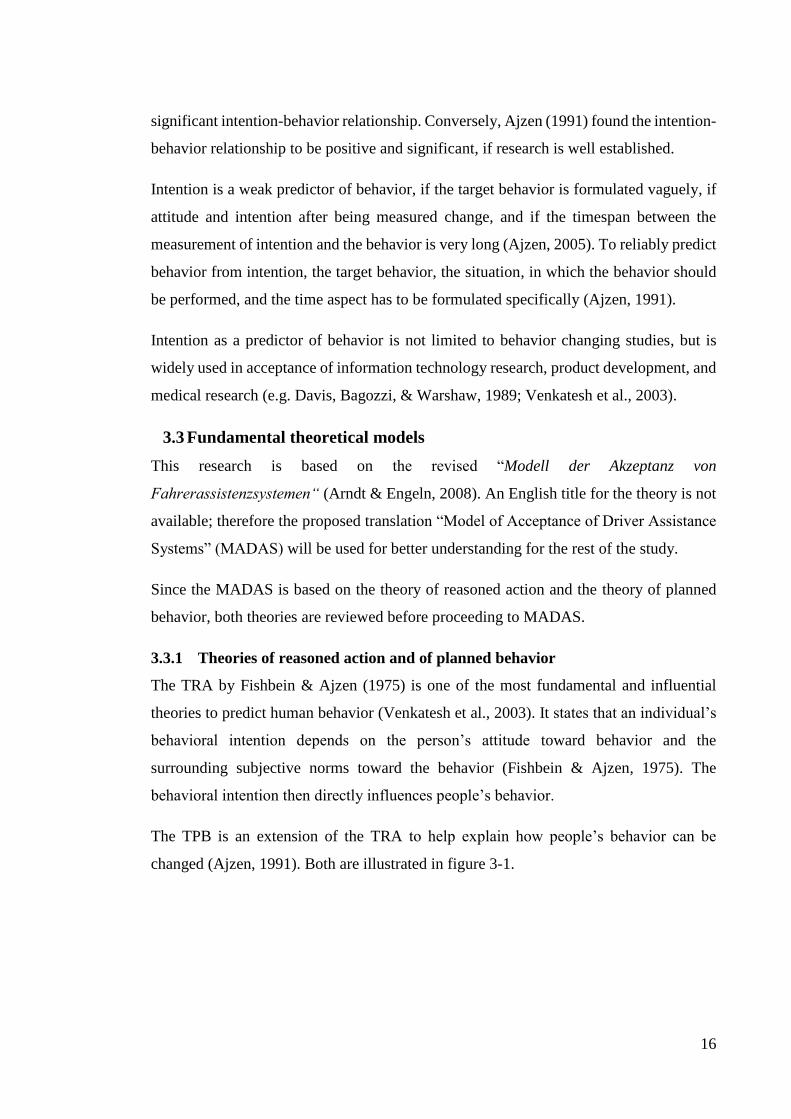
The survey proceeded as illustrated in figure 4-2.
Figure 4-2: Process of survey. Source: Own illustration.
4.5 Method
As recommended by Arndt (2011), the research model was evaluated using structural
equation modeling (SEM) via the software program AMOS. SEM allows to specify and
operationalize hypothesis more precisely than multivariate regression, reveals
relationships that have not been hypothesized and can be used for exploratory and
confirmatory studies (Bagozzi & Yi, 2012). Further, SEM enables to examine complex
relationships between latent variables simultaneously, to account for measurement errors
and to calculate direct, indirect and total effects between variables (Jöreskog & Sörbom,
1982). Following the recommendation by Anderson & Gerbing (1988), the measurement
and structural model were estimated separately. Reliability and validity of data obtained
and theorized constructs were tested by exploratory factor analysis (EFA). EFA revealed
that several of the constructs should be combined, due to high correlations between them.
Therefore, a revised model was developed during the analysis part. The revised
measurement model was tested for reliability and validity by confirmatory factor analysis
(CFA). After the measurement model has been validated, the structural model was
developed and hypothesized relationships were tested.
Prior to the analysis, the items TraSaf2, DE1, Comf2, Image1, Image2, Image3 and Trust2
were transformed to measure the same direction as the other items belonging to the same
construct.
4.6 Descriptive statistics
Table 4-2 illustrates the demographic data of the sample. The sample of 115 participants
consisted of 53 females (46 percent) and 62 males (54 percent).

30
Table 4-2: Descriptive statistics based on the survey. Source: Own survey and analysis.
Frequency Percent (%) Cumulative
Total Sample 115 100,0 100,0
Gender
Female 62 53,9 53,9
Male 53 46,1 100,0
Age
16-24 21 18,3 18,3
25-34 59 51,3 69,6
35-44 11 9,6 79,1
45-54 10 8,7 87,8
55-64 7 6,1 93,9
65-74 7 6,1 100,0
Driven kilometers
over the last year
no km 4 3,5 3,5
below 5,000 km 36 31,3 34,8
5,001-10,000 km 28 24,3 59,1
10,001-15,000 km 23 20,0 79,1
15,001-20,000 km 13 11,3 90,4
more than 20,001 km 11 9,6 100,0
Net household
income
below € 500 3 2,6 2,6
€ 500 to € 1,000 12 10,4 13,0
€ 1,001 to € 2,000 19 16,5 29,6
€ 2,001 to € 3,000 20 17,4 47,0
€ 3,001 to € 4,000 18 15,7 62,6
€ 4,001 to € 5,000 13 11,3 73,9
above € 5,000 13 11,3 85,2
Unknown 17 14,8 100,0
31
5 Analysis
In this chapter, the survey results are presented and analyzed.
5.1 Data screening
5.1.1 Univariate
The online survey was completed by 123 German respondents. Thereof, three responses
were deleted because of missing data. Since all variables were measured on a Likert scale,
extreme outliers did not exist. Nevertheless, five additional responses were deleted due
to unengaged answering (standard deviation < 0.5), as recommended by Gaskin (2012a),
leaving 115 valid responses.
Since all variables were measured on 5-point Likert scales, it is adequate to assess
univariate normality using kurtosis (Gaskin, 2012a). All variables showed univariate
normality within the threshold of ±3.0 standard errors of kurtosis (Bollen, 1989), thus no
lack of sufficient variance was detected.
5.1.2 Multivariate (tested after revised model)
Linearity was tested by curve estimation regression for all relationships in the model. It
determined that all direct effects were sufficiently linear (all p-values<0.005) to be tested
in SEM.
Multicollinearity was assessed calculating the Variable Inflation Factor (VFI) for all
independent variables simultaneously. All of the VIFs had an acceptable level below 5.0
indicating that the variables were distinct (Hair, Ringle, & Sarstedt, 2011).
5.2 Measurement Model
5.2.1 Exploratory Factor Analysis
Several items have been newly developed for this research and the items drawn and
adapted from other research have never been used in the context of fully autonomous
driving systems. To investigate if variables loaded as expected, were sufficiently
correlated within one factor and whether criteria of validity and reliability were met,
explorative factor analysis (EFA) using principal component analysis (PCA) with
varimax rotation was conducted. The Kaiser-Meyer-Olkin (KMO) measure and the
Bartlett’s test assess whether the variables are adequate for an EFA (Janssen & Laatz,

32
2013) and communalities measure whether an item correlates with all other items. KMO
values >0.8, a significant Bartlett’s test and communalities higher than 5, indicate a good
adequacy (Janssen & Laatz, 2013).
The KMO measure of 0.851, a significant (p=0.000) Bartlett test and all items except
Image1, Prod1 and TimeSav1 showing higher communalities than 0.5, indicated that the
variables were sufficiently correlated and suitable for a factor analysis (Hair, Tatham,
Anderson, & Black, 1998; Tabachnick & Fidell, 2007).
Based on Kaiser-criterion the rotated-component-matrix identified a 7-factor model,
explaining 67.64 percent of total variance and did not support the theoretical model with
11 factors. The detailed results of the EFA can be found in Appendix C.
The EFA revealed that the items belonging to Image, Subjective Norm, Driving
Enjoyment, Comfort and Attitude loaded as expected on a distinctive factor. However,
EFA also reported that the three new constructs Utilization, Time Saving and Productivity
loaded on the same factor as Eco-Friendliness and that Trust and Traffic Safety loaded on
one factor.
As part of analyzing an EFA, Fabrigar & Wegener (2012) and Hair et al. (1998) stress the
importance to balance parsimony (a model consisting of very few factors) and plausibility
(ensuring that an appropriate number of factors are in the model to sufficiently account
for correlations among variables), when deciding how many factors to be included.
Moreover, Gaskin (2012b), Hair et al. (1998) and Janssen & Laatz (2013) recommended,
if a theory has been established before doing an EFA, one should not blindly believe the
EFA results, but should try to retain as much theoretical considerations as possible while
still gaining valid results. Further, when considering the EFA solutions, one should check
whether the items that load on the same factor are similar in nature (face validity) and
make sense (Gaskin, 2012b).
The wording of the constructs Utilization, Time Saving and Productivity are all related to
either time saving, accomplishing things in less time or better usage efficiency and can
be considered to have a similar context. However, the items for Eco-Friendliness ask
whether fuel could be saved or environmental driving is supported, which is different in
nature. Therefore, a second factor analysis with only these eight items was conducted. As
table 5-1 shows, based on eigenvalue>1, two factors, with one factor consisting of all six

33
items of Productivity, Time Saving and Utilization and a second factor consisting of the
two Eco-Friendliness items were extracted, which are sufficiently uncorrelated (0.561).
Based on this finding, it was decided to include the eight items into the models as two
separate variables. One latent variable consisting of Utilization, Time Saving and
Productivity named “Efficiency” and the two items belonging to Eco-Friendliness have
been retained under the same variable name, “Eco-Friendliness”.
Table 5-1: Rotated Component Matrix and Component Transformation Matrix. Source: Own survey and
analysis.
Rotated Component Matrixa
Component
1 2
Prod2 ,843 ,010
TimeSav2 ,831 ,222
Prod1 ,690 ,116
Utilization1 ,670 ,154
Utilization2 ,569 ,565
TimeSav1 ,529 ,353
EcoF2 ,114 ,889
EcoF1 ,122 ,874
Component Transformation Matrix
Component 1 2
1 ,828 ,561
2 -,561 ,828
Extraction Method: Principal Component Analysis.
Rotation Method: Varimax with Kaiser Normalization.
Likewise, a separate PCA for the items of Trust and Traffic Safety was conducted, which
showed to load on two distinctive factors in past research but loaded on the same factor
in the underlying EFA. However, as table 5-2 indicates, it was not possible to separate
those items. A possible explanation for the strong correlation of these items could be that
trust in a fully autonomous driving system is directly related with perceived traffic safety.
If people do not consider the system safe they will not trust it. Vice versa it can be
expected that people, who do not trust the system, will not consider it to improve traffic
safety. Therefore, the variables should be kept as one variable named “Trust in Safety”,

34
despite the findings of Arndt (2011), which found the items should load on different
constructs.
Table 5-2: Component Matrix. Source: Own survey and analysis.
Component Matrixa
Component
1
TraSaf1 ,849
Trust2 ,824
Trust1 ,808
TraSaf2 ,790
Extraction Method: Principal Component Analysis.
a. 1 component extracted
Since all other items loaded as proposed in the theoretical model, the revised model is
shown in figure 5-1. As a result, the hypotheses H3a - H3c, H4a - H4c, H5a - H5c, H10a
- H10c and H11a - H11c cannot be tested anymore. However, two new hypotheses are
formed for the new factor “Efficiency” and “Trust in Safety”.
H12a: Efficiency has a positive direct effect on Attitude.
H12b: Efficiency has a positive direct effect on Subjective Norm.
H12c: Efficiency has a positive indirect effect on Purchase Intention.
H13a: Trust in Safety has a positive direct effect on Attitude.
H13b: Trust in Safety has a positive direct effect on Subjective Norm.
H13c: Trust in Safety has a positive indirect effect on Purchase Intention.

35
Figure 5-1: Revised research model. Source: Own illustration.
Reliability, meaning how dependable a set of items will consistently load on the same
factor (Gaskin, 2012b) for the variables of the revised research model, was calculated
using Cronbach’s alpha and are shown in table 5-3.
Table 5-3: Construct reliability of the revised research model. Source: Own survey and analysis.
5.2.2 Confirmatory Factor Analysis
After the EFA, a CFA was conducted to test measurement model for validity and
reliability.
Goodness of fit
Model fit analysis is used to assess how well the proposed model fits the data (Hair et al.,
1998) and is the basis for accepting or rejecting a model. Measurement model validity is
subject to an acceptable level of goodness of fit for the measurement model and construct
validity (Hair et al., 2010). A description of the model fit indices for assessment of the
Variable Label Number of items Cronbach’s alpha
Comfort 2 0.719
Driving Enjoyment 2 0.622
Eco-friendliness 2 0.793
Image 3 0.552
Trust and Safety 4 0.830
Efficiency 6 0.821
Attitude 5 0.91
Subjective Norm 4 0.84
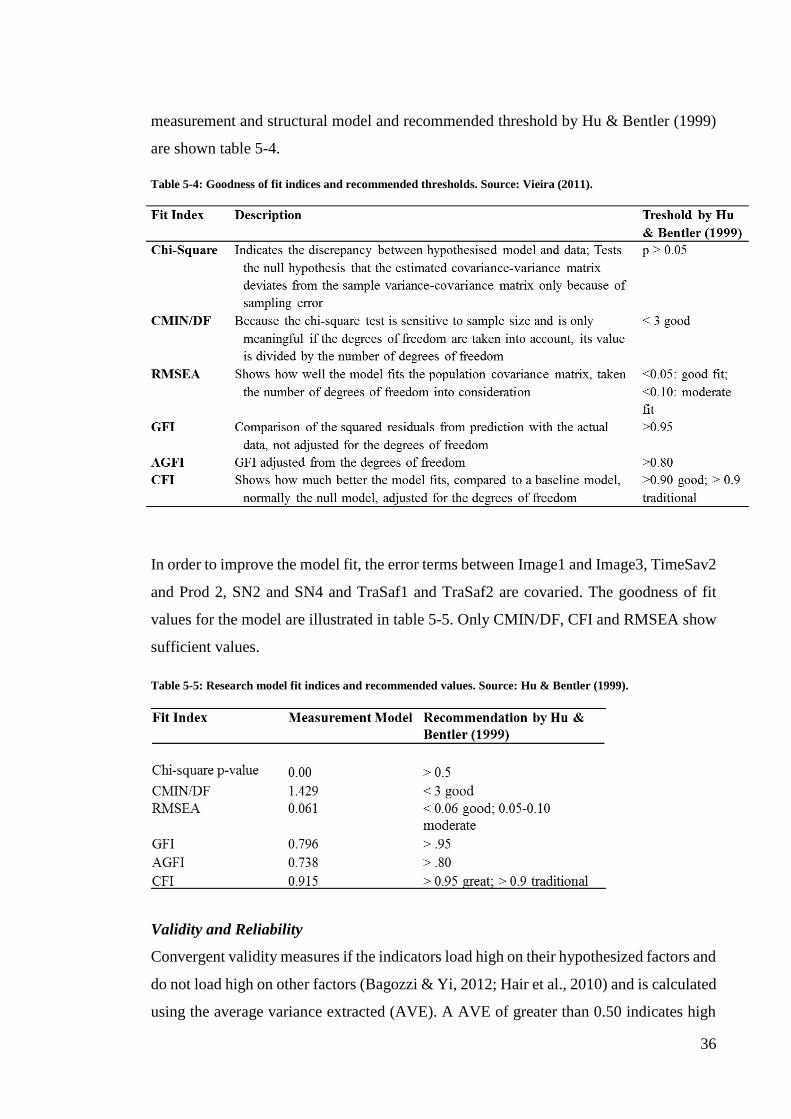
36
measurement and structural model and recommended threshold by Hu & Bentler (1999)
are shown table 5-4.
In order to improve the model fit, the error terms between Image1 and Image3, TimeSav2
and Prod 2, SN2 and SN4 and TraSaf1 and TraSaf2 are covaried. The goodness of fit
values for the model are illustrated in table 5-5. Only CMIN/DF, CFI and RMSEA show
sufficient values.
Table 5-5: Research model fit indices and recommended values. Source: Hu & Bentler (1999).
Validity and Reliability
Convergent validity measures if the indicators load high on their hypothesized factors and
do not load high on other factors (Bagozzi & Yi, 2012; Hair et al., 2010) and is calculated
using the average variance extracted (AVE). A AVE of greater than 0.50 indicates high
Table 5-4: Goodness of fit indices and recommended thresholds. Source: Vieira (2011).

37
validity of the construct and the individual variable (Anderson & Gerbing, 1988; Bagozzi,
Yi, & Phillips, 1991; Hair et al., 1998). For Image (0.362), Efficiency (0.420) and Driving
Enjoyment (0.455) convergent validity issues were observed while, the other factors’
AVE were above 0.50. AVE computations are illustrated in table 5-6.
Discriminant validity, measures whether a construct is really different from others
(Fornell & Larcker, 1981; Hair et al., 2010). Constructs demonstrate discriminant validity
when the square root of their AVE (value on diagonal on matrix below) is higher than
any inter-factor correlations (Hair et al., 2010). Table 5-6 presents the outcome of the
discriminant analysis and illustrates discriminant validity issues for Image with square
root of AVE (0.602) < correlation between Image and Attitude (0.623) and Subjective
Norm’s square root of AVE (0.726) < correlation between Subjective Norm and Attitude
(0.786). All other constructs had adequate discriminant validity.
Composite reliability (CR) measures the internal consistency of a measure and should be
above 0.70 to be reliable (Fornell & Larcker, 1981; Hair et al., 2010). Table 5-6 shows
the computed CRs’ for every factor. For all factors CR was higher than 0.70, indicating
reliability in the factors except for Image (0.624) and Driving Enjoyment (0.625), which
displayed internal reliability issues in the factors.
Table 5-6: Validity and reliability measures for hypothesized constructs. Source: Own survey and analysis.
Even though issues related to convergent and discriminant validity and reliability are
evident, it was decided to keep all constructs and items in the model. Image and Driving
Enjoyment are kept, since their respective items have been tested in past research and
showed to be reliable and valid. Even though Efficiency is internally not especially strong
(AVE=0.420), this shortcoming is considered admissible, since it is still a reliable
(CR=0.811) and distinct construct within the model measuring three different perceived
product characteristics (Time Saving, Productivity and Utilization).
CR AVE Image Attitude Efficiency Safety SN DE Comfort EcoFriend
Image 0.624 0.362 0.602
Attitude 0.913 0.679 0.623 0.824
Efficiency 0.811 0.420 0.551 0.632 0.648
Safety 0.806 0.520 0.56 0.696 0.432 0.721
SN 0.816 0.527 0.571 0.786 0.583 0.605 0.726
DE 0.625 0.455 0.588 0.565 0.533 0.521 0.472 0.675
Comfort 0.736 0.588 0.473 0.564 0.555 0.513 0.507 0.568 0.766
EcoFriend 0.794 0.659 0,269 0,283 0,566 0,313 0,201 0,212 0,051 0,812001
SN=Subjective Norm; DE=Driving Enjoyment; EcoFriend=Eco-Friendliness; Safety=Trust in Safety
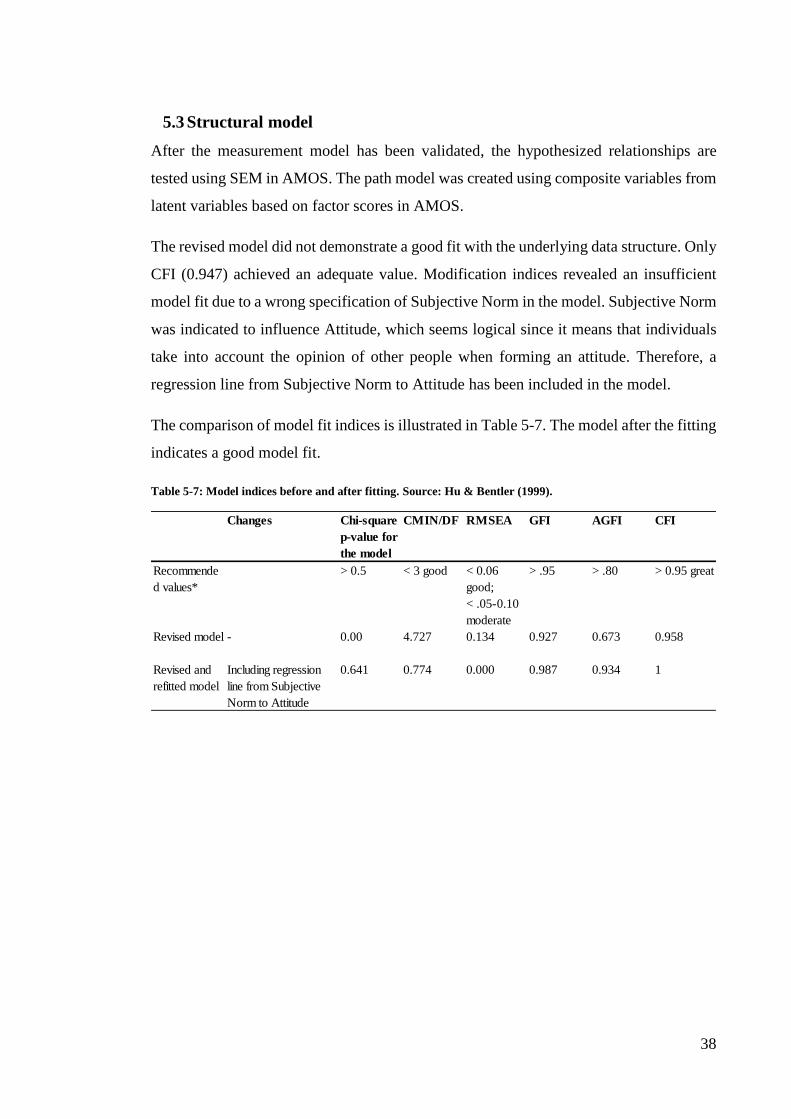
38
5.3 Structural model
After the measurement model has been validated, the hypothesized relationships are
tested using SEM in AMOS. The path model was created using composite variables from
latent variables based on factor scores in AMOS.
The revised model did not demonstrate a good fit with the underlying data structure. Only
CFI (0.947) achieved an adequate value. Modification indices revealed an insufficient
model fit due to a wrong specification of Subjective Norm in the model. Subjective Norm
was indicated to influence Attitude, which seems logical since it means that individuals
take into account the opinion of other people when forming an attitude. Therefore, a
regression line from Subjective Norm to Attitude has been included in the model.
The comparison of model fit indices is illustrated in Table 5-7. The model after the fitting
indicates a good model fit.
Table 5-7: Model indices before and after fitting. Source: Hu & Bentler (1999).
Changes Chi-square
p-value for
the model
CMIN/DF RMSEA GFI AGFI CFI
Recommende
d values*
> 0.5 < 3 good < 0.06
good;
< .05-0.10
moderate
> .95 > .80 > 0.95 great
Revised model - 0.00 4.727 0.134 0.927 0.673 0.958
Revised and
refitted model
Including regression
line from Subjective
Norm to Attitude
0.641 0.774 0.000 0.987 0.934 1

39
6 Findings
Figure 6-1 displays the final structural model including the path from Subjective Norm
to Attitude, significant and insignificant structural relationships, standardized regression
weights and the predictive power (variance explained) of Attitude, Subjective Norm and
Purchase Intention. The model explains 67 percent of the variance in Purchase Intention,
82 percent variance in Attitude and 68 percent of the variance in Subjective Norm.
Figure 6-1 Direct effects of revised and fitted SEM. Source: Own survey and analysis.
As shown in Figure 6-1, and as postulated by the research model, Attitude and Subjective
Norm have been found to be the only variables with a direct effect on Purchase Intention.
The significant path from Subjective Norm to Attitude, meaning that Attitude mediates
effects from Subjective Norm on Purchase Intention was not hypothesized but was found
to be highly significant.
The path analysis confirmed the positive and significant direct effects from Attitude
(0.604**) and Subjective Norm (0.236*) on Purchase Intention, supporting H1 and H2
and mean that Attitude and Subjective Norm are important determinants of Purchase
Intention. Hypothesis H12a and H13a were also supported, since Efficiency (0.234*) and
Trust in Safety (0.291***) indicated a significant positive direct effect on Attitude.
Likewise, Trust in Safety (0.415***) and Efficiency (0.541***) also had a positive direct
effect on Subjective Norm, confirming H12b and H13b. H8b, had to be rejected even

40
though Eco-Friendliness (-0.296***) had a significant direct effect on Subjective Norm,
the effect was not hypothesized to be negative. H7a, H8a and H9a had to be rejected since
Comfort (-0.030), Driving Enjoyment (0.086) and Eco-Friendliness (-0.072) did not show
a positive direct effect on Attitude. Further, Image (0.155) was not found to have a
significant effect on Subjective Norm leading to a rejection of H6a.
Table 6-1 shows the strength and direction of the standardized direct, indirect and total
effects of the SEM. 2,000 bias-corrected bootstrapping resamples with a confidence level
of 95 was used to assess direct and indirect effects.
Table 6-1: Estimation results of the revised and refitted research model. Source: Own survey and analysis.
The standardized total effects on Purchase Intention indicate the total impact of all
variables in the model. Efficiency (0.428**) and Trust in Safety (0.395**) had a
significant, positive total impact on Purchase Intention, confirming H12c and H13c. H8c
Structural Model Results: Revised and refitted model
DV: Purchase Intention Standardized direct effects Standardized indirect effects Standardized total effects
R²
Efficiency 0.428** 0.428**
Trust in Safety 0.395** 0.395**
Image 0.082 0.082
Eco-Friendliness -0.200** -0.200**
Driving Enjoyment 0.052 0.052
Comfort -0.018 -0.018
Attitude 0.604*** 0.604**
Subjective Norm 0.236* 0.294*** 0.529**
DV: Attitude Standardized direct effects Standardized indirect effects Standardized total effects
R²
Efficiency 0.234* 0.263** 0.497**
Trust in Safety 0.291*** 0.202** 0.493**
Image 0.076 0.076
Eco-Friendliness -0.072 -0.144** -0.216*
Driving Enjoyment 0.086 0.086
Comfort -0.030 -0.030
Subjective Norm 0.487*** 0.487**
DV: Subjective Norm Standardized direct effects Standardized indirect effects Standardized total effects
R²
Efficiency 0.541***
Trust in Safety 0.415***
Image 0.155
Eco-Friendliness -0.296***
DV: Purchase Intention Standardized direct effects Standardized indirect effects Standardized total effects
R²
Attitude 0.603*** 0.603
Subjective Norm 0.236* 0.520** 0.756
***p < 0.001; **p < 0.01; *p < 0.05
0.66
0.67
0.82
0.68

41
had to be rejected since Eco-Friendliness (-0.200**) had a significant negative effect on
Purchase Intention, which was hypothesized to be positive. Further, Image (0.082),
Driving Enjoyment (0.052) and Comfort (-0.018) did not have a significant indirect effect
on Purchase Intention and therefore H6c, H7c and H9c had to be rejected.
Additionally, Attitude (0.604**) has been found to be the variable with the strongest total
effect on Purchase Intention, followed by Subjective Norm (0.529**), Efficiency
(0.428**), Trust in Safety (0.395**) and Eco-Friendliness (-0.200**).
Moreover, as indicated by Table 6-2, Attitude and Subjective Norm alone have been
found to explain 66 percent of variance in Purchase Intention.
Further, analyzing direct effects of Efficiency, Trust in Safety and Eco-Friendliness on
Attitude and Subjective Norm and their indirect effects on Purchase Intention, Attitude
and Subjective Norm together have been found to fully mediate the effects of Efficiency,
Trust in Safety and Eco-Friendliness on Purchase Intention.
Table 6-2 displays the summary of the hypothesis, tested during the analysis.

42
Table 6-2: Hypothesis Summary Table. Source: Own analysis and data.
Hypothesis Path coefficient
and significance
Supported
H1: Attitude positively affects Purchase Intention. 0.604*** Yes
H2: Subjective Norm positively influences Purchase Intention. 0.236* Yes
H3a: Time Saving has a positive direct effect on Attitude. - -
H3b: Time Saving has a positive direct effect on Subjective Norm. - -
H3c: Time Saving has a positive indirect effect on Purchase Intention. - -
H4a: Productivity has a positive direct effect on Attitude. - -
H4b: Productivity has a positive direct effect on Subjective Norm. - -
H4c: Productivity has a positive indirect effect on Purchase Intention. - -
H5a: Utilization has a positive effect on Attitude. - -
H5b: Utilization has a positive effect on Subjective Norm. - -
H5c: Utilization has a positive indirect effect on Purchase Intention. - -
H6a: Image has a positive direct effect on Subjective Norm. 0.155 (n.s.) No
H6c: Image has a positive indirect effect on Purchase Intention. 0.082 (n.s.) No
H7a: Driving Enjoyment has a positive direct effect on Attitude. 0.086 (n.s.) No
H7b: Driving Enjoyment has a positive indirect effect on Purchase Intention. 0.052 (n.s.) No
H8a: Eco-Friendliness has a positive direct effect on Attitude. -0.072 (n.s.) No
H8b: Eco-Friendliness has a positive direct effect on Subjective Norm. -0.296*** No
H8c: Eco-Friendliness has a positive indirect effect on Purchase Intention. -0.200** No
H9a: Comfort has a positive direct effect on Attitude. -0.030 (n.s.) No
H9b: Comfort has a positive indirect effect on Purchase Intention. -0.018 (n.s.) No
H10a: Trust has a positive direct effect on Attitude. - -
H10b: Trust has a positive direct effect on Subjective Norm. - -
H10c: Trust has a positive indirect effect on Purchase Intention. - -
H11a: Traffic Safety has a positive direct effect on Attitude. - -
H11b: Traffic Safety has a positive direct effect on Subjective Norm. - -
H11c: Traffic Safety has a positive indirect effect on Purchase Intention. - -
H12a: Efficiency has a positive direct effect on Attitude. 0.234* Yes
H12b: Efficiency has a positive direct effect on Subjective Norm. 0.541*** Yes
H12c: Efficiency has a positive indirect effect on Purchase Intention. 0.428** Yes
H13a: Trust in Safety has a positive direct effect on Attitude. 0.291*** Yes
H13b: Trust in Safety has a positive direct effect on Subjective Norm. 0.415*** Yes
H13c: Trust in Safety has a positive indirect effect on Purchase Intention. 0.395** Yes
***p < 0.001; **p < 0.01; *p < 0.05; (n.s.) = not significant

43
7 Discussion
The following chapter discusses the empirical results of the thesis. Subsequently,
limitations and implications for further research are provided.
7.1 Critical reflection on research results
The findings provide empirical support for some of the relationships originally proposed
by Arndt (2011) and contribute to acceptance studies in the field of DAS studies. With an
explanatory power of 67 percent, the model contributes to the understanding of which
factors are important and how they influence purchase intention of driverless driving
technology and thus contribute to theoretical and practical understanding.
Hypothesis 1, postulating a positive direct effect of Attitude on Purchase Intention, was
supported and indicated that peoples’ Purchase Intention is positively influenced by an
individual’s evaluation of the consequences of buying the product and that an increase in
Attitude leads to an increase in Purchase Intention. Hypothesis 2, stating that Subjective
Norm has a positive direct effect on Purchase Intention, has also been supported, meaning
that besides an individual’s attitude, social normative pressure to use the system and the
perception that important others view the use of the system as positive, influence the
Purchase Intention. Further to the hypothesized direct effect of Subjective Norm on
Attitude, the SEM also revealed a causal path from Subjective Norm to Attitude, meaning
that Attitude mediates effects of Subjective Norm on Purchase Intention. However, since
Subjective Norm still has a direct effect on Purchase Intention, Attitude only partially
mediates the effects and thus, Subjective Norm should stay in the model to increase
explanatory power. This direct effect on Attitude could be explained by the fact that the
purchase of a car has a high price value and is one of the most expensive investments
people make. In order to avoid bad investment, they take into account the opinion of
others, when forming an attitude towards buying. Moreover, buying a car is often a
household decision, which is not decided by a single person but rather by several
household members.
The finding that none of the perceived product characteristic had a significant direct effect
on Purchase Intention indicates that the variables Attitude and Subjective Norm are
sufficient to predict Purchase Intention, if one is not interested in the effects of product
characteristics. This is reflected by the variance in Purchase Intention explained, since

44
Attitude and Subjective Norm alone explain 66 percent, only 1 percent less than the whole
model.
Hypothesis 6a-c, which proposed a positive effect of Image on Subjective Norm and
Purchase Intention, had to be rejected since Image did not show a significant effect on
both. The technology is still several years away and more than 50 percent of the sample
has only heard a few times of it (see descriptive statistics in chapter 4.6). Therefore, it is
possible that only a few people have discussed the technology with their friends and peers.
Most of them, however, have not formed an opinion on the subject yet. Consequently, if
one does not have an opinion whether the purchase will impact their image as a driver,
the impact on image is not a critical factor that is taken into account when forming a
purchasing intention.
Driving Enjoyment did also not show a significant influence on Attitude and Purchase
Intention. Likewise to Image, this could be because people did not have a chance to
interact with the technology. Thus, they could not yet evaluate whether the technology
actually increases or decreases the pleasure of driving car. In contrast to H9a and H9b,
Comfort did also not have a significant effect on Attitude and Purchase Intention.
Arndt & Engeln (2008) and Arndt (2011) found that depending on the purpose of the
DAS, not all perceived product characteristics have always a significant impact on
Purchase Intention (e.g. Eco-Friendliness did not have a significant effect on the intention
to purchase an automatic windscreen wiper). Therefore, it is possible that Driving
Enjoyment and Comfort in fact do not significantly influence acceptance. In support of
this argument it has to be mentioned that 69 percent of the study sample was below 34
years old. Thus, it is possible, that these individuals are more price consciousness and less
comfort-focused and hence allocate more importance to gains in efficiency and safety,
while an increase in comfort is a nice-to-have side effect. One additional explanation
could be that due to the low awareness of the sample of the technology, people are not
yet aware of all the benefits the system offers and therefore these characteristics do not
have an influence yet.
Hypothesis 8a, which proposed a positive direct relationship between Eco-Friendliness
and Attitude, was not supported. Also H8b and H8c, which hypothesized a positive effect
of Eco-Friendliness on Subjective Norm and Purchase Intention, were found to be wrong.

45
In contrast to the hypotheses, the effect on Subjective Norm and Purchase Intention was
found to be negative, which means that the more eco-friendly the system becomes, the
lower the purchase intention is. These negative relationships seem somewhat
unreasonable since other studies have found a positive relationship between eco-friendly
products and Purchase Intention (Kaiser, Wolfing & Fuhrer, 1999; Kim & Chung, 2011;
Park & Sohn, 2012). A possible explanation could be that people expect the system to
become more expensive, the more environmental friendly it is. According to the supply
and demand concept, a higher purchase price leads to less demand. Thus people might
assume that an increase in eco-friendliness will lead to an increase in the prices.
Consequently, a higher price makes eco-friendly products less attractive and thus could
explain the negative effect of eco-friendliness on Subjective Normand Purchase Intention.
The hypotheses H12a-c, which hypothesized that Efficiency has a positive direct effect
on Attitude and Subjective Norm and a positive indirect effect on Purchase Intention,
have been supported by the results. Moreover, Efficiency has also shown to have the
strongest impact of all perceived product characteristics on Purchase Intention.
Consequently, this characteristic is the most influential one when forming a Purchase
Intention.
Similarly to Efficiency, Trust in Safety, which was hypothesized to positively directly
influence Attitude and Subjective Norm and indirectly Purchase Intention, has been found
to confirm all three hypotheses. The strong positive effect of Trust in Safety implicates
that a change in the value of this characteristic has a strong impact on Purchase Intention.
7.2 Limitations
Among limitations, the generalizability of these findings has to be mentioned. The study
was only conducted in Germany and therefore the findings may not apply to other
countries. Further, the survey was only conducted online and thus the results are not
representative of the whole German population.
The revised model was largely confirmed and achieved a good model fit, however this
could be specific to the sample of this study and does not necessarily imply a good
structure of the model. Moreover, during the development of the measurement model,
issues related to convergent and discriminant validity as well as reliability were
46
encountered, which were reflected in only a moderate model fit and further questions the
results.
The small sample size (N=115) has to be mentioned as a limitation. According to
Baumgartner and Homburg (1996) the sample size should be at least five times bigger
than the free parameters, to achieve trustworthy parameter estimates. This study only
achieved a 4:1 ratio.
Since it is not clear when driverless driving systems will be available for purchase, the
situation and specific time in which the purchase should be performed could not be
specified as recommended by Ajzen (2005). Thus, the reliability to predict the actual
purchase of a fully autonomous driving system from intention is questionable.
Moreover, since the technology was not available at the time of the study a product
description of fully autonomous driving systems was given to read before people would
answer the survey. Therefore, the results of the survey might be biased due to the product
description by the author.
7.3 Implications for further research
Based on already mentioned limitations, several implications for further research are
given. Future studies should rely on a bigger sample size and should enable consumers to
interact with a prototype of the system and to ask questions related to the use of the
product before answering the questionnaire. This would enable to include the constructs
“usability” or “perceived easiness to use” into the model, which have been found to be a
strong predictor in Information System studies. In order to achieve all this, offline surveys
are recommended, which should enable to achieve a more representative sample and with
this a better generalizability of the findings. In addition, future research should use
longitudinal data instead of only cross-sectional data to actually prove the theorized
relationships, rather than to solely infer those.
While it was beyond the scope of this study, future research should also try to analyze
how demographic factors (age, gender, income etc.) moderate or influence the acceptance
of driverless driving technologies.
Additionally, the purchase of a car and with this the decision to add a fully autonomous
driving system often depends on several people in a household. Therefore, an

47
investigation of the acceptance using theories such as the adoption of technology in
households (Brown & Venkatesh, 2005) may allow for deeper insights into factors that
influence purchase intention and actual purchase of driverless systems.

48
8 Conclusion
This study aimed to explore which factors influence the intention to purchase a fully
autonomous driving system in the future. Moreover, it questioned which perceived
product characteristics influence purchase intention and how they do this. For this
purpose, the model proposed by Arndt (2011) to predict the acceptance of Driver
Assistance Systems was modified and used.
The empirical findings showed that Attitude towards buying the system had the strongest
positive effect on the intention to purchase a fully autonomous driving system, followed
by Subjective Norm. Additionally, among the perceived product characteristics,
Efficiency had the strongest positive effect on Purchase Intention, followed by Trust in
Safety, which also had a positive effect. Eco-Friendliness was found to influence
Purchase Intention, however, it showed to have a negative effect on Purchase Intention.
Perceived Image, Driving Enjoyment and Comfort were found to not have an effect on
Purchase Intention at all.
To give managerial implications, this master thesis aimed to reveal a more accurate
explanation on why perceived product characteristics affect Purchase Intention. An
analysis of the causal relationship between the variables revealed that Attitude towards
buying is affected by Efficiency, Trust in Safety and Subjective Norm. Thus, Efficiency,
Trust in Safety and Subjective Norm influence the Purchase Intention through an
individual’s Attitude towards buying. Moreover, Subjective Norm is influenced by
Efficiency, Trust in Safety and Eco-Friendliness meaning that their effect on Purchase
Intention is mediated by Subjective Norm.
Consequently, in order to increase the Attitude of people to buy a fully autonomous
driving system in the future, OEMs should increase the value of the product
characteristics that consumers take into account when forming a purchasing intention. As
shown, the perceived efficiency and safety benefits offered by driverless driving systems
have the strongest impact and thus marketers should exploit this lever and focus to
increase the value of these functions to achieve a high purchase intention. Thus, marketing
campaigns should focus on promoting the characteristics of Efficiency and increase Trust
and Safety. Campaigns could for example focus on the benefits from the technology that
family members could be picked up by the autonomous car, while the actual owner is at
work. Another possibility would be to highlight the improved safety aspects through this

49
technology. Since Subjective Norm had the second biggest standardized effect on
Purchase Intention and also a strong impact on Attitude, public campaigns that promote
“driverless driving to be safer than manual driving” are not only expected to increase the
awareness of people but also expected to increase social pressure to use this technology.
Autonomous driving brings along a lot of benefits for the user and the whole society
therefore, changing social norms similar to “anti-smoking” or “don’t drink and drive
yourself” campaigns are expected to have a strong impact on people’s intention to buy
the technology through social pressures.

X
Appendix
A) German Questionnaire Items
Table A-1: German Questionnaire Items Source: Own survey.
Construct Item Source
TraSaf1: Das System erhöht die Verkehrssicherheit.
TraSaf2: Das System trägt dazu bei, das Unfallrisiko zu senken.
Image1: Das System schadet dem Image des Fahrers.
Image2: Es wäre mir vor meinen Kollegen peinlich, das System zu benutzen.
Image3: Das System wird von Personen genutzt, die sich beim Fahren nicht sicher fühlen.
DE1: Das System würde das Autofahren langweilig machen.
DE2: Das System erhöht den Fahrgenuss.
Trust1: Ich vertraue darauf, dass dieses System in meinem Interesse handelt. Arndt (2011)
Trust2: Ich vertraue diesem System nicht. Own item
Comf1: Das System fördert die körperliche Entspannung beim Fahren.
Comf2: Das System erhöht den Stress für den Fahrer.
EcoF1: Das System unterstützt eine umweltfreundliche Fahrweise.
EcoF2: Das System würde mir helfen Kraftstoff zu sparen.
Prod1: Das System erhöht die Chance Dinge zu erreichen/erledigen, die mir wichtig sind. Venkatesh et al. (2003)
Prod2: Das System würde mir helfen Dinge schneller zu erledigen. Own item
TimeSav1: Das System würde mir helfen meine Reisedauer zu verkürzen. Own item
TimeSav2: Das System würde mir helfen Zeit zu sparen. Own item
Utilization1: Das System ermöglicht ein Auto besser mit anderen Personen zu teilen.
Utilization2: Das System ermöglicht eine bessere/effizientere Nutzung des Autos.
schlecht – gut
nutzlos – nützlich
unangenehm – angenehm
unwichtig – wichtig
nachteilig – vorteilhaft
SN1: Ich kann mir vorstellen, dass sich meine Freunde ein Auto mit solch einem System
kaufen werden.König (2005)
SN2: Meine Familie würde es begrüßen, wenn ich diese Technologie in meinem Auto hätte. Arndt (2004a)
SN3: Andere würden es gut finden, wenn ich ein fahrerloses System hätte. Arndt (2004a)
SN4: Meine Freunde würden mich darin bestärken, mir diese Technologie zu kaufen. Meyer (2002)
PI1: Ich würde dieses System gerne in meinem Auto besitzen. Meyer (2002)
PI2: Ich werde den Kauf eines Autos mit solch einem System in Betracht ziehen. Arndt (2011)
PI3: Sobald diese Technologie verfügbar ist, plane ich ein Auto mit fahrerlosem System zu
kaufen.Arndt (2011)
Welche Eigenschaften hat selbstfahrende Fahrzeugtechnologiie?
Bitte bewerten Sie die verschiedenen Eigenschaften des Systems.
Arndt (2011)
Arndt (2011)
Purchase Intention
Subjective Norm
Ich finde den Kauf eines Autos mit autonomer Fahrtechnologie…
Ajzen & Fishbein (2002)
Was glauben Sie, würden andere Personen über fahrerlose Fahrzeugsysteme sagen?
Driving Enjoyment
Image
Traffic Safety
Attitude
Würden Sie ein Auto mit vollautonomer Fahrzeugtechnologie kaufen?
Own item
Würden Sie ein Auto mit vollautonomer Fahrzeugtechnologie kaufen?
Utilization
Time Saving
Productivity
Arndt (2011)
Arndt (2011)
Arndt (2011)
Comfort
Eco-Friendliness
Trust

XI
B) Questionnaire product description
Nun folgt eine Einführung zum fahrerlosen/autonomen Autofahren.
Heutige Fahrerassistenzsysteme, wie das Antiblockiersystem (ABS), Elektronisches
Stabilitätsprogramm (ESP), Spurassistent und automatisiertes Bremsen, tragen zu
erhöhter Verkehrssicherheit bei. Komfortsysteme, wie
der Abstandsregeltempomat gestalten das Autofahren komfortabler.
Es wird erwartet, dass im Laufe der nächsten Jahre weitere Assistenzsysteme, wie
Autopiloten für Stau und Autobahnen, kommerziell verfügbar sind. In Kombination
werden solche Fahrerassistentsysteme zu Systemen führen, die ununterbrochenes,
fahrerloses/autonomes Autofahren ermöglichen.
Voll autonom fahrende Fahrzeuge übernehmen alle sicherheitskritischen
Fahrfunktionen, das Fahren, Steuern, Einparken und die Fahrbahnüberwachung für die
gesamte Fahrt, ohne den Einfluss/Eingriff eines menschlichen Fahrers zu
benötigen. Der Fahrer gibt lediglich das Reiseziel an. Diese fahrerlosen Systeme sollen
es ermöglichen besetzte und unbesetzte Fahrzeuge zu kontrollieren.
Ein autonomes Fahrzeug zu benutzen, kann mit einem Taxi verglichen werden, in das
man einsteigt und dem Fahrer das Ziel angibt. Der Unterschied ist, dass man im eigenen
Auto fährt, das von einem technologischen System kontrolliert wird.

XII
Dieses Bild zeigt exemplarisch die Technologie und Bauteile, die es Autos
ermöglichen, ohne Fahrer zu fahren.
Die Technologie, die autonomes Fahren ermöglicht, kann in drei Schritten erklärt
werden.
1. Schritt: Das Fahrzeug bestimmt seine eigene Position mit dem Satellitensystem GPS
und nimmt seine Umgebung mit Kameras, Lasern und Radar wahr, um Hindernisse auf
der Fahrbahn, wie zum Beispiel andere Fahrzeuge, Fußgänger oder Fahrradfahrer, zu
identifizieren und deren Abstand zu messen.
2. Schritt: Die Computer- und Softwaresysteme sammeln und verarbeiten die erfassten
Daten, um deren Bedeutung zu verstehen und Handlungsmaßnahmen einzuleiten.

XIII
3. Schritt: Das System reagiert und passt die Fahrzeugbewegung in Echtzeit an.
Fahrerlose Systeme erweitern die Beschäftigungsmöglichkeiten während der Fahrt
sowie die Nutzungsmöglichkeiten des Autos.
Anstelle das Auto selbst zu steuern kann der/die FahrerIn sich anderweitig beschäftigen,
z. B. mit lesen, Filme schauen, im Internet surfen, arbeiten, sich entspannen oder
schlafen.
Autonomes Fahren soll auch individuelle Mobilität für Personen, die fahruntauglich
(krank, körperlich beeinträchtigt, blind, unter Einfluss von Medikamenten oder Alkohol
stehen) oder zu jung zum Selbstfahren sind, ermöglichen.

XIV
Es wird davon ausgegangen, dass Autos nach Bedarf per Mobiltelefon oder Computer
gesteuert werden können. Sie könnten sich z. B. zur Arbeit fahren lassen und das Auto
danach anweisen, sich selbst einen Parkplatz zu suchen oder zurück nach Hause zu fahren,
um anderen Personen zur Verfügung zu stehen. Die Fernsteuerung und das Fahren ohne
Personen ermöglichen damit eine bessere Nutzung des Autos für mehr Personen.
Außerdem wird erwartet, dass autonome Fahrzeuge aufgrund von Echtzeitinformationen,
durch die Kommunikation von Fahrzeugen untereinander und mit der Infrastruktur,
schneller ans Ziel kommen. Darüber hinaus ermöglicht optimiertes Beschleunigen und
Bremsen auch mit weniger Kraftstoff eine umweltfreundlichere Fahrweise.

XV
Schließlich werden diese Systeme zur Fahrsicherheit beitragen, da Computer schneller
reagieren und sich nicht vom Verkehr abwenden. Menschliche Fehler aufgrund von
Ablenkung, z. B. durch Mitfahrer, andere Fahrer, Handys oder
Stimmungsschwankungen, wie Müdigkeit, Langeweile oder Trunkenheit, können somit
verringert werden.
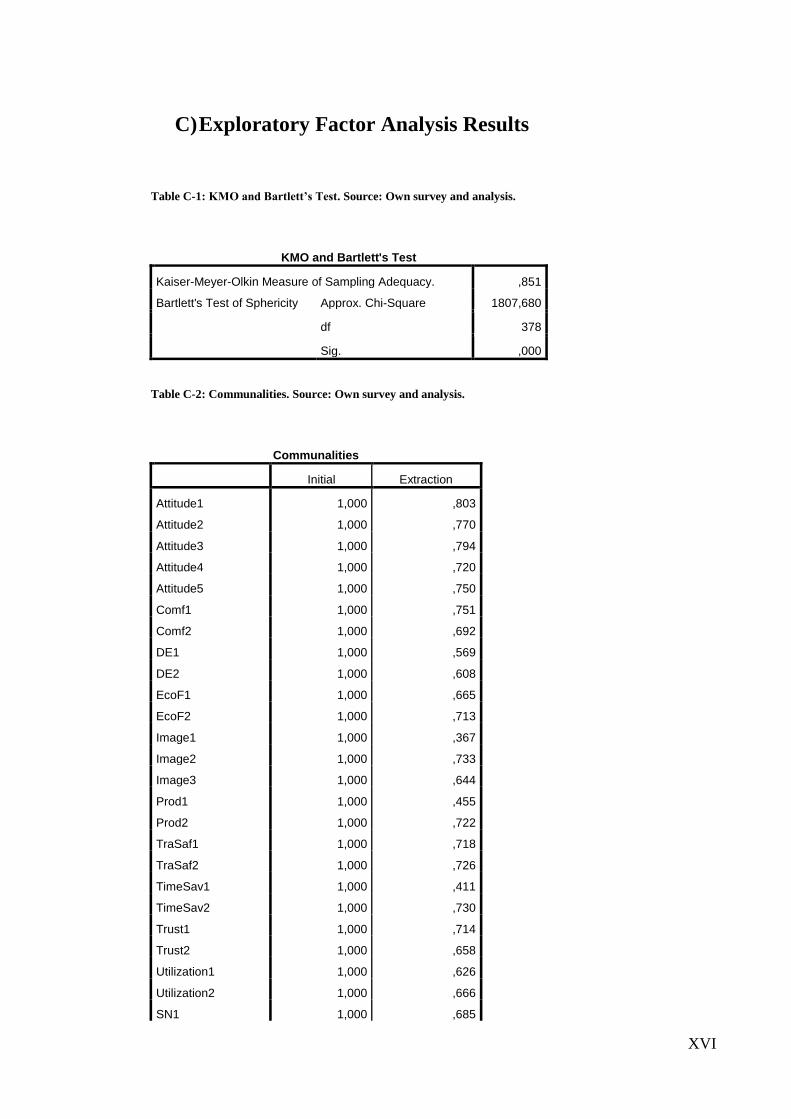
XVI
C) Exploratory Factor Analysis Results
Table C-1: KMO and Bartlett’s Test. Source: Own survey and analysis.
KMO and Bartlett's Test
Kaiser-Meyer-Olkin Measure of Sampling Adequacy. ,851
Bartlett's Test of Sphericity Approx. Chi-Square 1807,680
df 378
Sig. ,000
Table C-2: Communalities. Source: Own survey and analysis.
Communalities
Initial Extraction
Attitude1 1,000 ,803
Attitude2 1,000 ,770
Attitude3 1,000 ,794
Attitude4 1,000 ,720
Attitude5 1,000 ,750
Comf1 1,000 ,751
Comf2 1,000 ,692
DE1 1,000 ,569
DE2 1,000 ,608
EcoF1 1,000 ,665
EcoF2 1,000 ,713
Image1 1,000 ,367
Image2 1,000 ,733
Image3 1,000 ,644
Prod1 1,000 ,455
Prod2 1,000 ,722
TraSaf1 1,000 ,718
TraSaf2 1,000 ,726
TimeSav1 1,000 ,411
TimeSav2 1,000 ,730
Trust1 1,000 ,714
Trust2 1,000 ,658
Utilization1 1,000 ,626
Utilization2 1,000 ,666
SN1 1,000 ,685
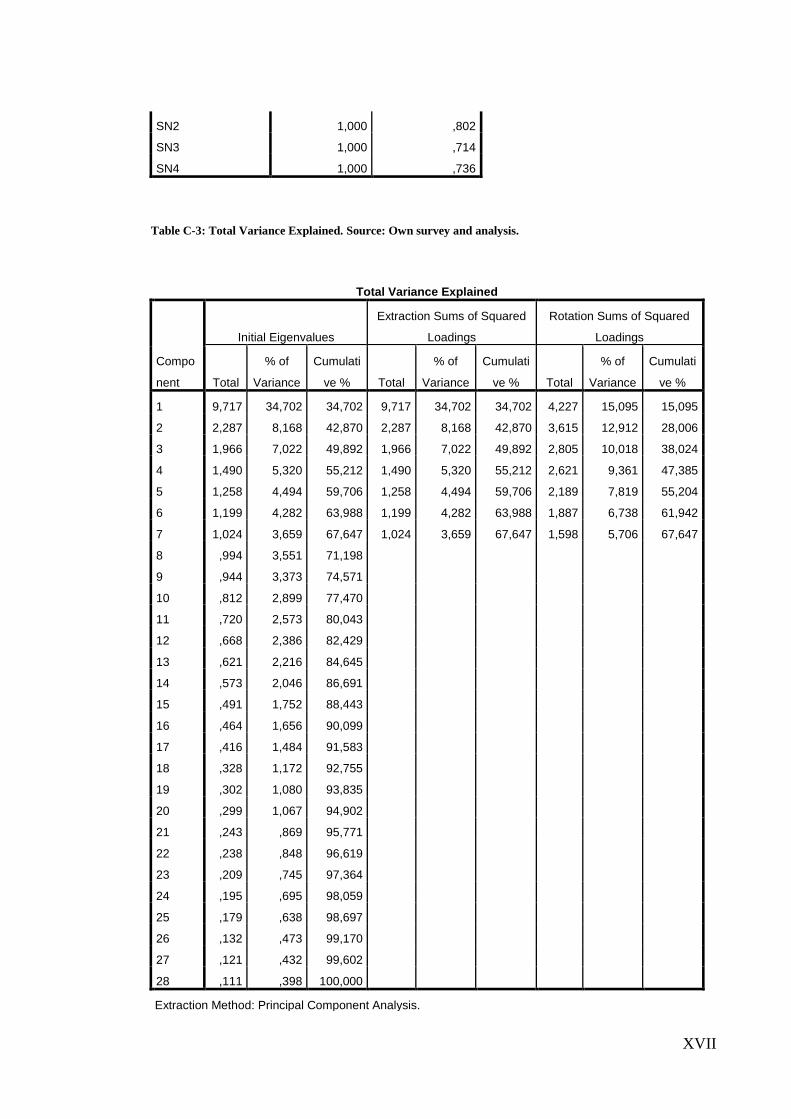
XVII
SN2 1,000 ,802
SN3 1,000 ,714
SN4 1,000 ,736
Table C-3: Total Variance Explained. Source: Own survey and analysis.
Total Variance Explained
Compo
nent
Initial Eigenvalues
Extraction Sums of Squared
Loadings
Rotation Sums of Squared
Loadings
Total
% of
Variance
Cumulati
ve % Total
% of
Variance
Cumulati
ve % Total
% of
Variance
Cumulati
ve %
1 9,717 34,702 34,702 9,717 34,702 34,702 4,227 15,095 15,095
2 2,287 8,168 42,870 2,287 8,168 42,870 3,615 12,912 28,006
3 1,966 7,022 49,892 1,966 7,022 49,892 2,805 10,018 38,024
4 1,490 5,320 55,212 1,490 5,320 55,212 2,621 9,361 47,385
5 1,258 4,494 59,706 1,258 4,494 59,706 2,189 7,819 55,204
6 1,199 4,282 63,988 1,199 4,282 63,988 1,887 6,738 61,942
7 1,024 3,659 67,647 1,024 3,659 67,647 1,598 5,706 67,647
8 ,994 3,551 71,198
9 ,944 3,373 74,571
10 ,812 2,899 77,470
11 ,720 2,573 80,043
12 ,668 2,386 82,429
13 ,621 2,216 84,645
14 ,573 2,046 86,691
15 ,491 1,752 88,443
16 ,464 1,656 90,099
17 ,416 1,484 91,583
18 ,328 1,172 92,755
19 ,302 1,080 93,835
20 ,299 1,067 94,902
21 ,243 ,869 95,771
22 ,238 ,848 96,619
23 ,209 ,745 97,364
24 ,195 ,695 98,059
25 ,179 ,638 98,697
26 ,132 ,473 99,170
27 ,121 ,432 99,602
28 ,111 ,398 100,000
Extraction Method: Principal Component Analysis.

XVIII
Table C-4: Rotated Component Matrix. Source: Own survey and analysis.
Rotated Component Matrixa
Component
1 2 3 4 5 6 7
Attitude1 ,754 ,208 ,237 ,170 ,262 ,182 ,070
Attitude2 ,717 ,336 ,070 ,183 ,006 ,189 ,264
Attitude3 ,803 ,059 ,153 ,215 ,242 ,134 ,007
Attitude4 ,703 ,137 ,044 ,375 ,066 ,009 ,245
Attitude5 ,751 ,252 ,270 ,141 ,107 ,089 ,101
Comf1 ,163 ,154 ,223 ,141 ,367 ,704 ,019
Comf2 ,184 ,023 ,307 ,202 -,014 ,706 ,152
DE1 ,185 -,001 ,048 ,123 ,690 ,103 ,176
DE2 ,119 ,197 ,139 ,122 ,716 ,035 ,085
EcoF1 ,076 ,634 ,389 -,083 ,055 -,300 ,082
EcoF2 -,009 ,688 ,360 -,004 -,101 -,308 ,071
Image1 ,296 ,202 ,037 -,058 ,269 ,070 ,396
Image2 ,311 ,121 ,071 ,052 ,123 ,235 ,737
Image3 -,008 ,028 ,200 ,305 ,139 -,099 ,694
Prod1 ,291 ,504 -,073 ,186 ,272 ,049 ,012
Prod2 ,188 ,517 -,090 ,031 ,449 ,427 ,163
TraSaf1 ,114 ,218 ,784 ,116 ,043 ,132 ,098
TraSaf2 ,105 ,133 ,809 ,095 -,042 ,159 ,079
TimeSav1 ,233 ,547 ,155 ,130 ,107 ,071 ,005
TimeSav2 ,096 ,688 -,032 ,144 ,371 ,202 ,218
Trust1 ,479 ,043 ,568 ,144 ,365 ,044 ,067
Trust2 ,392 ,001 ,633 ,149 ,255 ,082 ,096
Utilization1 ,223 ,617 -,142 ,132 -,002 ,379 -,117
Utilization2 ,127 ,742 ,187 ,153 -,020 ,147 ,140
SN1 ,240 ,143 ,113 ,679 -,140 ,255 ,220
SN2 ,219 ,086 ,105 ,799 ,273 ,108 ,100
SN3 ,557 ,174 ,151 ,590 ,017 ,030 ,047
SN4 ,267 ,176 ,138 ,726 ,285 ,072 ,022
Extraction Method: Principal Component Analysis.
Rotation Method: Varimax with Kaiser Normalization.
a. Rotation converged in 10 iterations.

XIX
Table C-5: Component Transformation Matrix. Source: Own survey and analysis.
Component Transformation Matrix
Component 1 2 3 4 5 6 7
1 ,581 ,430 ,340 ,383 ,311 ,250 ,239
2 -,317 ,864 ,038 -,346 -,059 -,163 -,036
3 -,039 -,171 ,887 -,106 -,292 -,293 -,003
4 -,358 -,173 ,251 -,396 ,654 ,401 ,185
5 -,452 ,091 ,139 ,428 -,379 ,651 -,134
6 -,455 -,005 -,039 ,513 ,177 -,425 ,562
7 ,146 -,033 -,109 -,346 -,460 ,245 ,757
Extraction Method: Principal Component Analysis.
Rotation Method: Varimax with Kaiser Normalization.

XX
Assertation
I ensure that I wrote this thesis without the help of others and without the use of other
sources than mentioned. This thesis has never been submitted in the same or
substantially similar version to any other examinations office. All explanations that I
have been adopted literally or analogously are marked as such.
Aschaffenburg, January 4th 2014

XXI
References
Abe, G., & Richardson, J. (2006). Alarm timing, trust and driver expectation for
forward collision warning systems. Applied Ergonomics, 37, 577-586.
Adell, E. (2009). Driver experience and acceptance of driver support systems. A case of
speed adaptation. Lund: Lund Institute of Technology.
AG, R. (2014). Rinspeed – Creative think tank for the automotive industry. Where the
future is reality – today. Retrieved from http://www.rinspeed.eu/concept-
galery.php?cid=25
Ajzen, I. (1991). The theory of planned behavior. Organizational Behavior and Human
Decision Processes, 50(2), 179-211.
Ajzen, I. (2005). Attitudes, personality and behavior. Mapping social psychology (2nd
ed.) Maidenhead: Open University Press.
Ajzen, I., & Fishbein, M. (2002). Attitudes and the Attitude-Behavior Relation.
European Review of Social Psychology, 11(1), 1-33.
Anderson, J. C., & Gerbing, D. W. (1988). Structural equation modeling in practice: A
review and recommended two-step approach. Psychological Bulletin, 103(3), 411-
423.
Anderson, J. M., Nidhi, K., Stanley, K. D., Sorensen, P., Samaras, C., & Oluwatola, O.
A. (2014). Autonomous Vehicle Technology: A Guide for Policymakers. Santa
Monica: RAND Corporation.
Anstadt, U. (1994). Determinanten der individuellen Akzeptanz bei Einführung neuer
Technologien: Eine empirische arbeitswissenschaftliche Studie am Beispiel von
CNC-Werkzeugmaschinen und Industrierobotern. Arbeitswissenschaft in der
betrieblichen Praxi. (Vol. 1). Frankfurt am Main, New York: P. Lang.
Arndt, S. (2004). Entwicklung und Erprobung einer Methode zur empirischen
Untersuchung der Akzeptanz von Fahrerassistenzsystemen (Unpublished
dissertation). Friedrich-Schiller Universität Jena, Lehrstuhl für Verkehrspsychologie.
Arndt, S. (2011). Evaluierung der Akzeptanz von Fahrerassistenzsystemen: Prüfung
eines Modells zur Vorhersage des Kaufverhaltens von Endkunden (1st ed).
Verkehrspsychologie. Wiesbaden: VS Verlag für Sozialwissenschaften.

XXII
Arndt, S., & Engeln, A. (2008). Prädiktoren der Akzeptanz von
Fahrerassistenzsystemen. In J. Schade & A. Engeln (Eds.), Fortschritte der
Verkehrspsychologie (pp. 313–337). Wiesbaden: VS Verlag für
Sozialwissenschaften.
Arndt., S., Engeln, A., & Vratil, B. (2008). Prädiktoren der Akzeptanz von
Fahrerassistenzsystemen. In J. Schade & A. Engeln (Eds.), Fortschritte der
Verkehrspsychologie (pp. 313-337). VS Verlag für Sozialwissenschaften.
Atiyeh, C. (2012, June 25). Predicting Traffic Patterns, One Honda at a Time. MSN
Auto.
Ayodele, H., & Ragland, D. R. (2003). Consequences of Driving Reduction or
Cessation for Older Adults. Transportation Research Record, 1843(1), 96-104.
Bagozzi, R. P., & Yi, Y. (2012). Specification, evaluation, and interpretation of
structural equation models. Journal of the Academy of Marketing Science, 40(1), 8-
34.
Bagozzi, R. P., Yi, Y., & Phillips, L. W. (1991). Assessing Construct Validity in
Organizational Research. Administrative Science Quarterly, 36(3), 421-458.
Baumgartner, H., & Homburg, C. (1996) Applications of structural equation modeling
in marketing and consumer research: a review. International Journal of Research in
Marketing, 13(2), 139-161.
BBC News (2014, July 30). UK to allow driverless cars on public roads in January.
BBC News. Retrieved from http://www.bbc.com/news/technology-28551069
Beier, G., Boemak, N., & Renner, G. (2001). Sinn und Sinnlichkeit — psychologische
Beiträge zur Fahrzeuggestaltung und -bewertung. In T. Jürgensohn & K.-P. Timpe
(Eds.), Kraftfahrzeugführung (pp. 263-284). Berlin, Heidelberg: Springer Berlin
Heidelberg.
Bickerstaffe, S. (2014). Life assurance policy. Automotive Engineer, 39(2), 34-35.
Bollen, K. A. (1989). Structural equations with latent variables. A Wiley-interscience
publication. New York, NY: Wiley.
Brown, S. A., & Venkatesh, V. (2005). Model of Adoption of Technology in
Households: A Baseline Model Test and Extension Incorporating Household Life
Cycle. MIS Quarterly, 29(3), 399-426.
XXIII
Butterman, E. (2013). Fast approaching: driverless cars. Mechanical Engineering,
135(5), 12-14. Retrieved from
http://search.ebscohost.com/login.aspx?direct=true&db=a9h&AN=87340569&site=e
host-live
Chiesa, V., & Frattini, F. (2011). Commercializing Technological Innovation: Learning
from Failures in High-Tech Markets. Journal of Product Innovation Management,
28(4), 437-454.
Davis, B., & Dutzik, T. (2014). Transportation and the New Generation: Why Young
People Are Driving Less and What It Means for Transportation Policy. Frontier
Group, U.S. PIRG Education Fund. Retrieved from
http://www.uspirg.org/sites/pirg/files/reports/Transportation%20%26%20the%20Ne
w%20Generation%20vUS_0.pdf
Davis, F. D. (1985). A technology acceptance model for empirically testing new end-
user information systems: Theory and results (Doctoral dissertation). Massachusetts
Institute of Technology. Retrieved from
http://dspace.mit.edu/handle/1721.1/15192#files-area
Davis, F. D. (1989). Perceived Usefulness, Perceived Ease of Use, and User Acceptance
of Information Technology. MIS Quarterly, 13(3), 319-340.
Davis, F. D., Bagozzi, R. P., & Warshaw, P. R. (1989). User acceptance of computer
technology: a comparison of two theoretical models. Management Science, 35(8),
982-1003.
Davis, H. L. (1976). Decision Making within the Household. Journal of Consumer
Research, 2(4), 241-260.
European Commission. (2003). Glossary for transport statistics: Eurostat Theme 7
Transport Methods and Nomenclatures (3rd ed.). Luxembourg: Office for Official
Publication of the European Communities.
Fabrigar, L. R., & Wegener, D. T. (2012). Exploratory factor analysis. Series in
understanding statistics. Oxford, New York: Oxford University Press.
Fagnant, D. J., & Kockelman, K. M. (2013). Preparing a Nation for Autonomous
Vehicles: Opportunities, Barriers and Policy Recommendations. Washington, DC:
Eno Center for Transportation. Retrieved from http://www.enotrans.org/wp-
content/uploads/wpsc/downloadables/AV-paper.pdf
XXIV
Fagnant, D. J., & Kockelman, K. M. (2014). The travel and environmental implications
of shared autonomous vehicles, using agent-based model scenarios. Transportation
Research Part C: Emerging Technologies, 40, 1-13.
Federal Highway Administration. (2005). Traffic Congestion and Reliability: Linking
Solutions to Problems. Washington, D.C.
Ferreras, L. E. (2014). The Driverless City. Civil Engineering, 84(3), 52-55.
Fishbein, M., & Ajzen, I. (1975). Belief, Attitude, Intention and Behavior: An
Introduction to Theory and Research. Reading, MA: Addison-Wesley.
Fornell, C., & Larcker, D. F. (1981). Evaluating Structural Equation Models with
Unobservable Variables and Measurement Error. Journal of Marketing Research,
18(1), 39-50.
Franken, V. (2007). Use of navigation systems and consequences for travel behaviour.
Brno, Czech Republic.
Gaskin, J. (2012a). In Gaskination's StatWiki: Univariate Outliers. "Data screening".
Retrieved from http://statwiki.kolobkreations.com/
Gaskin, J. (2012b). "Exploratory Factor Analysis", Gaskination's StatWiki. Retrieved
from http://statwiki.kolobkreations.com/wiki/Data_screening#Univariate
Gefen, D., Karahanna, E., & Straub, D. W. (2003). Trust and TAM in online shopping:
an integrated model. MIS Quarterly, 27(1), 51-90.
Google Inc. (2014). Self-Driving Car Test: Steve Mahan. Google Careers. Retrieved
from http://www.google.com/about/careers/lifeatgoogle/self-driving-car-test-steve-
mahan.html
Hair, J. F., Black, W. C., Babin, B. J., & Anderson, R. E. (2010). Multivariate data
analysis (7th ed.). Upper Saddle River, NJ: Prentice Hall.
Hair, J. F., Ringle, C. M., & Sarstedt, M. (2011). PLS-SEM: Indeed a Silver Bullet. The
Journal of Marketing Theory and Practice, 19(2), 139-152.
Hair, J. F., Tatham, R. L., Anderson, R. E., & Black, W. (1998). Multivariate data
analysis (5th ed.). Upper Saddle River, N.J.: Prentice Hall.
Handmer, L. (2014, April 15). The smart cars of today and tomorrow. TechLife.
Retrieved from http://www.techlife.net/2014/04/smart-cars-of-today-and-
tomorrow.html

XXV
Hayes, B. (2011). Leave the Driving to It. American Scientist, 99(5), 362-366.
Hu, L., & Bentler, P. M. (1999). Cutoff criteria for fit indexes in covariance structure
analysis: Conventional criteria versus new alternatives. Structural Equation
Modeling: A Multidisciplinary Journal, 6(1), 1-55.
Huth, V., & Gelau, C. (2013). Predicting the acceptance of advanced rider assistance
systems. Accident; analysis and prevention, 50, 51-58.
IHS Automotive. (2014). Automotive Technology Research Emerging Technologies:
Autonomous Cars- Not if but when. IHS.com. Retrieved from
http://orfe.princeton.edu/~alaink/SmartDrivingCars/PDFs/IHS%20_EmergingTechn
ologies_AutonomousCars.pdf
Janssen, J., & Laatz, W. (2013). Statistische Datenanalyse mit SPSS: Eine
anwendungsorientierte Einführung in das Basissystem und das Modul exakte Tests
(8th ed.). Berlin: Springer.
Jöreskog, K. G., & Sörbom, D. (1982). Recent Developments in Structural Equation
Modeling. Journal of Marketing Research, 19(4), 404-416.
Kaiser, F.G., Wolfing, S., & Fuhrer, U. (1999). Environmental attitude and ecological
behaviour. Journal of Environmental Psychology, 19(1), 1-19.
Kassner, A., & Vollrath, M. (2006). Akzeptanzmessung als Baustein für die
Entwicklung von Fahrerassistenzsystemen. In VDI (Ed), VDI-Berichte, Fahrzeug-
und Verkehrstechnik: Integrierte Sicherheit und Fahrerassistenzsysteme (pp. 97-
112). Düsseldorf: VDI Verlag GmbH.
Kelly, H. & CNN. (2014, April 7). Driverless car tech gets serious at CES. CNN
International. Retrieved from
http://edition.cnn.com/2014/01/09/tech/innovation/self-driving-cars-ces/
Kiconco, K. (2014, January 1). BMW Introduces Its Autonomous Driverless Car. Will
Apps. Retrieved from http://www.willappsug.com/2014/01/bmw-introduces-its-
autonomous-driverless-car/
Kim, H.Y., & Chung, J.-E. (2011). Consumer purchase intention for organic personal
care products. Journal of Consumer Marketing, 28(1), 40-47.
Knight, W. (2012). Driverless Cars: Coming to Your Street Sooner Than You Think.
Trends Magazine, 115, 26-31.
XXVI
Kollmann, T. (1999). Das Konstrukt der Akzeptanz im Marketing: neue Aspekte der
Akzeptanzforschung dargestellt am Beispiel innovativer Telekommunikations- und
Multimediasysteme. Zeitschrift für Studium und Forschung, 28(3), 125-130.
König, K. (2005). Weiterentwicklung und empirische Überprüfung einer Methode zur
Untersuchung der Akzeptanz innovativer Fahrerassistenzsysteme (Unpublished
dissertation). Technische Universität Dresden, Lehrstuhl für Verkehrspsychologie.
KPMG & CAR. (2012). Self-driving cars: The next revolution. KPMG. Retrieved from
http://www.kpmg.com/US/en/IssuesAndInsights/ArticlesPublications/Documents/sel
f-driving-cars-next-revolution.pdf
Madden, T. J., Ellen, P. S., & Ajzen, I. (1992). A Comparison of the Theory of Planned
Behavior and the Theory of Reasoned Action. Personality and Social Psychology
Bulletin, 18(1), 3-9.
Meyer, J. (2002). Entwicklung eines Fragebogens zur Messung der Akzeptanz von
innovativen Systemen im Fahrzeug (Unpublished dissertation). Humboldt-Universität
zu Berlin, Institut für Psychologie.
National Highway Traffic Safety Administration. (2008). National Motor Vehicle Crash
Causation Survey. National Highway Traffic Safety Administration. Retrieved from
http://www-nrd.nhtsa.dot.gov/Pubs/811059.pdf
National Highway Traffic Safety Administration. (2013). U.S. Department of
Transportation Releases Policy on Automated Vehicle Development. National
Highway Traffic Safety Administration. Retrieved from
http://www.nhtsa.gov/About+NHTSA/Press+Releases/U.S.+Department+of+Transp
ortation+Releases+Policy+on+Automated+Vehicle+Development
Neff, J. (2010, May 31). Is Digital Revolution Driving Decline in U.S. Car Culture?:
Shift Toward Fewer Young Drivers Could Have Repercussions for All Marketers.
Advertising Age. Retrieved from http://adage.com/article/digital/digital-revolution-
driving-decline-u-s-car-culture/144155/
Noor, A. K., & Beiker, S. A. (2012). Intelligent and Connected. Mechanical
Engineering, 134(11), 32-37.
Park, S.-Y., & Sohn, S.H. (2012). Exploring the normative influences of social norms
on individual environmental behavior. Journal of Global Scholars of Marketing
Science: Bridging Asia and the World, 22(2), 183-194.

XXVII
Regan, M. A., Mitsopoulos, E., Haworth, N., & Young, K. (2002). Acceptability of in-
vehicle intelligent transport systems to Victorian car drivers. Report No. 02/02.
Noble Park North, Victoria: Royal Automobile Club of Victoria.
Rosenbloom, S. (2001). Driving Cessation Among Older People: When Does It Happen
and What Impact Does It Have? Transportation Research Record, 1779, 93-99.
Schade, J., & Schlag, B. (2003). Acceptability of urban transport pricing strategies.
Transportation Research Part F: Traffic Psychology and Behaviour, 6(1), 45-61.
Schlag, B. (Ed.). 1997. Road pricing-Maßnahmen und ihre Akzeptanz. Bonn: Deutscher
Psychologen Verlag.
Schoettle, B., & Sivak, M. (2014). A survey of public opinion about autonomous and
self-driving vehicles in the U.S., the U.K., and Australia. Report No. UMTRI-2014-
21. University of Michigan: Transportation Research Institute. Retrieved from
http://deepblue.lib.umich.edu/bitstream/handle/2027.42/108384/103024.pdf?sequenc
e=1&isAllowed=y
Shoup, D. C. (2005). The high cost of free parking. Chicago: Planners Press, American
Planning Association.
Tabachnick, B. G., & Fidell, L. S. (2007). Using multivariate statistics (5th ed.).
Boston: Pearson/Allyn & Bacon.
Tientrakool, P., Ho, Y.-C., & Maxemchuk, N. F. (2011). Highway Capacity Benefits
from Using Vehicle-to-Vehicle Communication and Sensors for Collision
Avoidance. San Francisco, CA: IEEE.
Tutu, A. (2011). BMW Working on Autonomous Cars - ConnectedDrive Connect.
Autoevolution. Retrieved from http://www.autoevolution.com/news/bmw-working-
on-autonomous-cars-connecteddrive-connect-38341.html#
Urmson, C. (2014). The latest chapter for the self-driving car: mastering city street
driving. Google Official Blog. Retrieved from
http://googleblog.blogspot.pt/2014/04/the-latest-chapter-for-self-driving-car.html
Van der Laan, J. D. (1998). Acceptance of automatic violation-registration systems
(Unpublished doctoral dissertation). University of Groningen.
Venkatesh, V., Morris, M. G., Davis, G. B., & Davis, F. D. (2003). User acceptance of
information technology: toward a unified view. MIS Quarterly, 27(3), 425-478.
XXVIII
Venkatesh, V., Thong, J. Y. L., & Xu, X. (2012). Consumer acceptance and use of
information technology: extending the unified theory of acceptance and use of
technology. MIS Quarterly, 36(1), 157-178.
Vieira, A.L. (2011). Interative LISREL in Practice. Heidelberg, Dordrecht, London,
New York: Springer.
Webb, D. J., Mohr, L. A., & Harris, K. E. (2008). A re-examination of socially
responsible consumption and its measurement. Journal of Business Research, 61(2),
91-98.
Weber, M. (2014). Where to? A History of Autonomous Vehicles. Computer History
Museum. Retrieved from http://www.computerhistory.org/atchm/where-to-a-history-
of-autonomous-vehicles/
Wicker, A. W. (1969). Attitudes versus Actions: The Relationship of Verbal and Overt
Behavioral Responses to Attitude Objects. Journal of Social Issues, 25(4), 41-78.
World Health Organization. (2013). Global status report on road safety 2013:
Supporting a decade of action. Geneva: World Health Organization.
World Health Organization. (2009). Global status report on road safety: Time for action.
Geneva: World Health Organization.
Related Documents