Predicting concrete behaviour from quasi-static loading to hy- pervelocity impact: an overview of the PRM Model C. Pontiroli* A. Rouquand* J. Mazars** * DGA/Centre d'Etudes de Gramat (France) 46500 Gramat (France) [email protected] [email protected] ** Laboratoire Sols, Solides, Structures Risques and VOR research network Université de Grenoble, 38041 Grenoble (France) [email protected] ABSTRACT: One of the greatest challenges during the last twenty years in the defense research area has been to propose realistic nu- merical tools to model efficiently the response of reinforced concrete structures under severe mechanical loading. At the end of the 80’s years there were not suitable finite element tools able to predict the behavior of reinforced concrete structures under extreme loading generated by earthquakes, explosions, impacts and other high dynamic phenomena. This paper presents the main results obtained dur- ing a long and intensive research period on the understanding and on the modeling of the main physical mechanisms of the concrete damaging. The challenge was to propose a general material model able to describe concrete and geologic material behavior for a large range of static and dynamic loading, with reasonable computation time and a high level of robustness and reliability. The starting point of all these works has been the J. Mazars one scalar damage model (Mazars, 1984). In 1984 this model has been one of the first damage models for concrete. The damage variable is controlled by an equivalent tensile strain that allow the simulation, in a simple way, of the concrete behavior under monotonic and unconfined loading. An important advantage of this model concerns its explicit formulation where the stress tensor can be directly established knowing the total strain tensor. In 1995 C. Pontiroli & A. Rouquand took advantage of this concept and proposed a two scalar damage model (PRM Model). The new model takes into account the crack closure mechanism. Irreversible strains, strain rate effects and internal friction stresses have been introduced. All these mechanisms al- low the simulation of a large panel of loading like earthquake, far field explosions or soft impact generated by highly crushable projec- tiles. Nevertheless, it was not able to simulate high dynamic event like near field explosions and high velocity impacts of hard projec- tiles. The simulation of this kind of problems requires the introduction of other physical mechanisms encountered under high pressure regime. These mechanisms are the pore collapse phenomena and plastic shear deformations. Another important aspect is relative to the water content effect on the behavior of concrete for confined loading. Experimental results obtained on the laboratory Giga press in Grenoble (Gabet 2006, Vu 2007), shows clearly a very important effect of the water content on the shear response for standard con- cretes. These mechanisms have been incorporated in an elastic plastic model for geologic material and this model has been coupled to the PRM damage model. The numerical implementation of the coupled model has been done in order to preserve numerical efficiency and robustness. After a presentation of the most important features of the concrete model several applications are given for a large range of loading like quasi static loading, earthquake loading and impact of soft or hard projectile loading. KEYWORDS: Concrete model, damage modeling, plasticity, simulations, structural dynamics, impact loading

Welcome message from author
This document is posted to help you gain knowledge. Please leave a comment to let me know what you think about it! Share it to your friends and learn new things together.
Transcript

Predicting concrete behaviour from quasi-static loading to hy-pervelocity impact: an overview of the PRM Model C. Pontiroli* A. Rouquand* J. Mazars** * DGA/Centre d'Etudes de Gramat (France) 46500 Gramat (France) [email protected] [email protected] ** Laboratoire Sols, Solides, Structures Risques and VOR research network Université de Grenoble, 38041 Grenoble (France) [email protected]
ABSTRACT: One of the greatest challenges during the last twenty years in the defense research area has been to propose realistic nu-merical tools to model efficiently the response of reinforced concrete structures under severe mechanical loading. At the end of the 80’s years there were not suitable finite element tools able to predict the behavior of reinforced concrete structures under extreme loading generated by earthquakes, explosions, impacts and other high dynamic phenomena. This paper presents the main results obtained dur-ing a long and intensive research period on the understanding and on the modeling of the main physical mechanisms of the concrete damaging. The challenge was to propose a general material model able to describe concrete and geologic material behavior for a large range of static and dynamic loading, with reasonable computation time and a high level of robustness and reliability. The starting point of all these works has been the J. Mazars one scalar damage model (Mazars, 1984). In 1984 this model has been one of the first damage models for concrete. The damage variable is controlled by an equivalent tensile strain that allow the simulation, in a simple way, of the concrete behavior under monotonic and unconfined loading. An important advantage of this model concerns its explicit formulation where the stress tensor can be directly established knowing the total strain tensor. In 1995 C. Pontiroli & A. Rouquand took advantage of this concept and proposed a two scalar damage model (PRM Model). The new model takes into account the crack closure mechanism. Irreversible strains, strain rate effects and internal friction stresses have been introduced. All these mechanisms al-low the simulation of a large panel of loading like earthquake, far field explosions or soft impact generated by highly crushable projec-tiles. Nevertheless, it was not able to simulate high dynamic event like near field explosions and high velocity impacts of hard projec-tiles. The simulation of this kind of problems requires the introduction of other physical mechanisms encountered under high pressure regime. These mechanisms are the pore collapse phenomena and plastic shear deformations. Another important aspect is relative to the water content effect on the behavior of concrete for confined loading. Experimental results obtained on the laboratory Giga press in Grenoble (Gabet 2006, Vu 2007), shows clearly a very important effect of the water content on the shear response for standard con-cretes. These mechanisms have been incorporated in an elastic plastic model for geologic material and this model has been coupled to the PRM damage model. The numerical implementation of the coupled model has been done in order to preserve numerical efficiency and robustness. After a presentation of the most important features of the concrete model several applications are given for a large range of loading like quasi static loading, earthquake loading and impact of soft or hard projectile loading. KEYWORDS: Concrete model, damage modeling, plasticity, simulations, structural dynamics, impact loading

2 EJECE-2010
1. Introduction
The simulation of the failure process in complex reinforced structures is a big challenge. Several physical phenomena must be considered. For example, for high velocity impacts and explosion events near concrete structures, high pressures and high strain rate loading occur locally around the projectile and around the explosive charge. Such phenomena generate pore collapse mechanisms that dissipate a large amount of energy. Irreversible shear strains under high pressure can also be observed driving a significant part of the material response. Under a high pressure regime in porous material, the elastic response becomes non linear and pressure dependent. For soils, rocks and concrete, the water content inside the open voids is very important. This parameter controls the pressure volume relationship and heavily influences the shear material response.
At some distance from the projectile or the explosive charge, the physical phenomena change progressively to become structure oscillations at moderate strain rate levels. The material response is now driven by an increase of concrete damage due to crack opening mechanisms, crack closure effects and friction phenomena related to differential displacements at the crack tip level. The material model has to account for all of these effects such as stiffness deterioration, recovery of stiffness due to crack closure, or permanent strains and frictional stresses that generate hysteretic loops during unloading and reloading paths. All these mechanisms must be implemented together in a unique material model able to simulate a large range of dynamic problems.
Different kinds of material models are proposed for concrete structures including plasticity (Ottosen, 1979), damage (Mazars 1986, Mazars 1989, Jirasek 2004) or fracture based approaches (Bazant et al., 1996). Nevertheless, very few are able to simulate crash tests (Krieg 1978, Van Mier & al 1991).
The ability of the constitutive model to reproduce the real material behaviour is not the only challenge. Numerical as-pects, related to the algorithm used to compute the stress tensor at the local level or related to the computation of structural displacements at the global level in a finite element analysis are also very important. At each level, the computational pro-cedure has to be numerically efficient and robust.
This paper gives some details of the numerical procedure used to perform numerical simulations of concrete structures under severe loadings. Examples are given and finite element results are compared to experimental data.
2. Damage and plastic model for concrete: PRM crash model
2.1. The two scalar damage model (PRM model)
2.1.1. Constitutive relations
To simulate the behaviour of concrete at a moderate stress level, a two scalar damage model has been proposed from works by J. Mazars in 1986, C. Pontiroli in 1995, A. Rouquand in 1995 & 2005. The named PRM model simulates the cy-clic behaviour of concrete.
This model distinguishes the behaviour under tension and the behaviour under compression. Between theses two load-ing states a transition zone is defined by (σft, εft). Where σft and εft are respectively the crack closure stress and the crack closure strain. The main equations of the PRM model for a uniaxial loading are:
under traction: (σ - σft) = E0 ⋅ (1-Dt) ⋅ (ε-εft)
under compression: (σ - σft) = E0 ⋅ (1-Dc) ⋅ (ε-εft)
where E0 is the initial Young’s modulus. Dt evolves as well in tension as in compression through the variable:
∑ +=
iix
2~ε
where <xi>+ = xi if xi >0 and <xi>+= 0 if not; xi = ει are the principal strain components in compression and xi = (ε-εft)i in tension.

Predicting concrete behaviour: an overview of the PRM Model 3
ε~ is an indicator of the local tensile state (positive strain state) responsible of damage.
The general evolution of damage is an exponential form driven byε~ : Dt = fct(ε~ , ε0t, At, Bt) where ε0t, At, Bt are material
parameters. ε0t is the tensile damage threshold. Dc is driven by the same variableε~ and evolves through the same function:
Dc = fct (ε~ , ε0c, Ac, Bc).
Figure 1. Stress strain curve for a tensile - compressive loading
Initially εft = εft0 is a material parameter. Afterwards εft is directly link to Dc. σft = f(εft, Dc) gives the stage where the transition between the two kinds of damage occurs. The corresponding response for a uniaxial cyclic loading is given in Figure 1. We can observe that the behaviour can be described by the classical equation:
σd = E0 (1-Di) εd with i = t or c, εd = ε − εft and σd = σ − σft
The general 3D constitutive equation of the model relating strain and stress tensors (in bold) is reported below:
( − ft ) = 0 (1-D) ( − ft)
or ( − ft )= (1-D) [ λ0 trace( − ft)11 + 2µ0 ( − ft)]
where ft and ft are the crack closure stress and strain tensors used to manage permanent effects; 0 is related to the initial mechanical characteristics of the material. The damage D remains a scalar and is issued from a combination of the two modes of damage:
D = αt Dt + (1- αt)Dc
where αt evolves between 0 and 1 and the actual values depend on ( − ft).
For more details see Mazars (1986).
This formulation is an explicit one. It has been implemented into “ABAQUS explicit” and is used for dynamic struc-tural simulations. In order to avoid depending mesh size solutions, Hillerborg method has been used (Hillerborg, 1976) which allows the control of the dissipated energy in each element.
σ
ε
Tensio
compression
σ c
σ t
ε ft0
ε ft A
σ ft
B
C
D
4 EJECE-2010
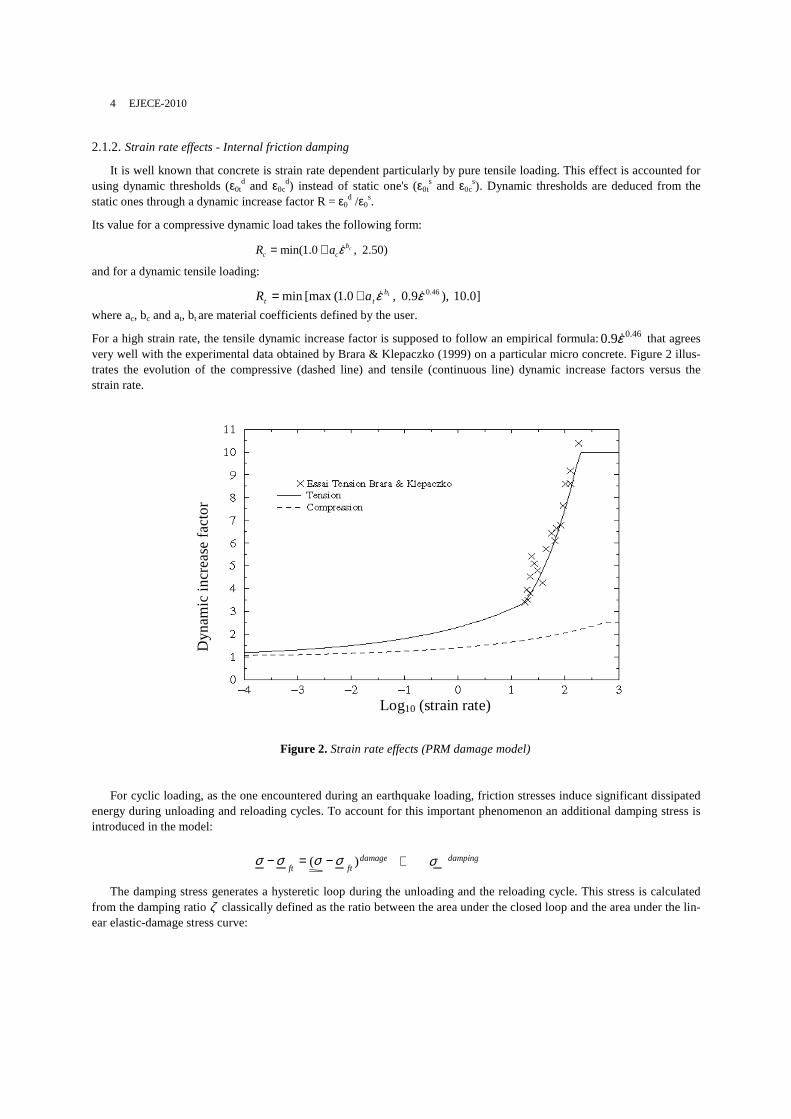
2.1.2. Strain rate effects - Internal friction damping
It is well known that concrete is strain rate dependent particularly by pure tensile loading. This effect is accounted for using dynamic thresholds (ε0t
d and ε0cd) instead of static one's (ε0t
s and ε0cs). Dynamic thresholds are deduced from the
static ones through a dynamic increase factor R = ε0d /ε0
s.
Its value for a compressive dynamic load takes the following form:
)50.2 ,0.1min( cbcc aR ε&+=
and for a dynamic tensile loading:
]0.10 ),9.0 ,0.1( [max min 46.0εε && tbtt aR +=
where ac, bc and at, bt are material coefficients defined by the user.
For a high strain rate, the tensile dynamic increase factor is supposed to follow an empirical formula: 46.09.0 ε& that agrees very well with the experimental data obtained by Brara & Klepaczko (1999) on a particular micro concrete. Figure 2 illus-trates the evolution of the compressive (dashed line) and tensile (continuous line) dynamic increase factors versus the strain rate.
D
ynam
ic in
crea
se f
acto
r
Log10 (strain rate)
Figure 2. Strain rate effects (PRM damage model)
For cyclic loading, as the one encountered during an earthquake loading, friction stresses induce significant dissipated energy during unloading and reloading cycles. To account for this important phenomenon an additional damping stress is introduced in the model:
damping damage ft ft σ σ σ σ σ + − = − ) (
The damping stress generates a hysteretic loop during the unloading and the reloading cycle. This stress is calculated
from the damping ratio ζ classically defined as the ratio between the area under the closed loop and the area under the lin-ear elastic-damage stress curve:

Predicting concrete behaviour: an overview of the PRM Model 5
( ) ( )2max0 1 ft
h
DE
A
εες
−−=
Ah is the loop area under the stress strain curve, E0 (1-D) is the current material stiffness. εmax is the maximum strain before unloading, εft is the closure strain that defines the transition point between compression and tension.
The damping stresses are computed in such a way that the damping ratio ζ is related to the damage D according to the rela-tion:
ζ = (β1 + β2D)
β1 is a damping ratio for an undamaged and perfectly elastic material. β1 + β2 is the damping ratio for a fully damaged ma-terial. β1 and β2 are material parameters. Usually β1 can be chosen equal to 0.02 and β2 can be chosen equal to 0.05. Figure 3 shows, for cyclic tensile or compressive loading, the strain stress curve including damping stresses.
Co
mpr
essi
ve s
tres
s (M
Pa)
-0.5 -0.4 -0.3 -0.2 -0.1 0 -30
-27
-24
-21
-18
-15
-12
-9
-6
-3
0
3
Compressive strain (%)
Figure 3. Cyclic loading including damping stresses
2.2. Plastic model with effective stresses
The previous damage model is very efficient to simulate the behaviour of concrete for unconfined or low confined cy-clic loading (Rouquand, 2005). For very high dynamic loads leading to a higher pressure level, an elastic plastic model is more appropriate. For example, the impact of a projectile striking a concrete plate at 300 m/s induces local pressures near the projectile nozzle of several hundred MPa. The previous damage model cannot simulate the pore collapse phenomena rising at this pressure level. It also cannot model the shear plastic strain occurring in this pressure range. To overcome these limitations, the elastic and plastic model proposed by Krieg (1978) has been chosen to simulate this kind of problem. From this simple elasto-plastic model a first improvement has been introduced in order to simulate the non linear elastic behaviour encountered during an unloading and reloading cycle under a high pressure level. A second improvement has been made to account for the water content effects introducing an effective stress theory as described by C. Mariotti (2002). This effect induces change on the pressure volume curve and on the shear plastic stress limit.
2.2.1. The modified Krieg model (dry material)
The Krieg model (Krieg, 1978) can be applied to describe the behaviour of a dry material. The improvements made here concern the elastic behaviour which is now non linear and pressure dependent. This non linearity increases as the pore collapse phenomena progresses. Figure 4 shows a typical pressure volume curve used in the modified Krieg model. For pressure values under P1, the behaviour between pressure and volume is linear and elastic. For a pressure greater than P1,

6 EJECE-2010
the pore collapse mechanism becomes effective. During the loading process, the pressure-volume response follows a curve identified from experiments. During the unloading, the behaviour is elastic but non linear. The bulk modulus becomes pressure dependent. It is equal to Kmax at the first unloading point and decreases to Kmin when the tensile pressure cut-off Pmin is reached (this value is generally negative, which means that traction is necessary to recover the initial volume). This pressure cut-off becomes smaller and smaller as the maximum pressure Pmax increases. When Pmax is close to P1, Kmax is close to Kmin and also closed to the initial bulk modulus Kp. When Pmax reaches Pcons, Kmax becomes equal to Kgrain and Kmin becomes equal to K0grain. So the non linearity becomes more and more important as the pore collapse phenomena pro-gresses.
Figure 4. Pressure volume behaviour (modified elastic and plastic model)
When Pmax becomes greater than Pcons, the pore collapse phenomena is achieved because all the voids are removed from the material. At this pressure level the material is consolidated and the behaviour becomes purely elastic and non linear.
2.2.2. Improvement of the Krieg model for partially saturated materials
Many concrete and geologic media have an open porous structure. The water can move through the porous media from one void to another. Consequently, the void can be partially or totally filled with water. This induces significant changes in the material response and particularly on the relation between pressure and volume.
Figure 5. Simplified geologic media of a partially saturated material
To understand more easily the water effect on a geologic medium, the material structure can be studied as a mixture of a solid medium with a void partially filled with water as shown in

Predicting concrete behaviour: an overview of the PRM Model 7
Figure 5. For high dynamic loads, the time scale is very low (few milliseconds or less) so the water has no time to move inside the material and undrained conditions can be considered. Figure 6 shows the generic response of a partially saturated material. This response is given in terms of pressure versus the volume change. For a dry material, the pressure volume response follows the solid curve shown on figure 6. When the pressure is sufficient to remove all the voids, the re-sponse is given by the dotted curve. In case of a partially saturated material, the relation between pressure and volume is given by the response of the dry material until all the voids (part of the pores without water) are removed from the me-dium. Thereafter, the dashed curve gives the response of the solid and water mixture. The intersection of the dotted curve with the horizontal axis gives the porosity of the dry material. The intersection of the dashed curve with the horizontal axis gives the “free porosity” εvps of the partially saturated material. Consequently, when the material becomes more and more dry, the dashed curve moves to the right. In the modified plastic model presented here, the knowledge of the water content ratio η (water volume divided by the total volume) is sufficient to deduce all the improvements of the material behaviour.
Figure 6. Water content effect on pressure volume relationship
When the pressure reaches the particular value Pvps corresponding to the intersection of the solid line with the dashed line, all the voids of the partially saturated medium are removed, so the medium becomes a two phase mixture of liquid and solid. To define the behaviour of this solid and water mixture (dashed curve) the pressure is assumed to increase in the same way in the two phases (solid and liquid phases). So an iterative procedure as to be run in order to find the relative volume changes of each phase. This procedure gives a pressure difference equal to the consolidation pressure of the par-tially saturated material Pvps when the total volume change of the two phases (εv - εvps) is known. Liquid behaviour is de-scribed using the Mie-Gruneisen equation of state and the solid phase behaviour is the non linear elastic model briefly de-scribed in 2.2.1.
Water content has an effect on the shear behaviour. In the Krieg model, the plastic shear strength q0 (computed as the Von-Mises stress) is pressure dependent (see Figure 7). As the pressure increases, the shear yield stress increases too. This effect is the consequence of the porous structure of the material. During the pore collapse phenomena the void volume de-creases, the pressure increases so the contact area of the solid grains inside the material matrix increases and the shear forces inducing sliding motions between the solid grains also increase. When all the voids are removed, the shear strength remains constant and becomes pressure independent because the contact area cannot increase any more. The material be-comes “homogeneous” and the shear strength reaches a limit that is material dependent. For a partially saturated material, the behaviour remains similar to the behaviour of a dry material until all the voids are removed. Thereafter we suppose that water pressure and solid grain pressure increase together in the same way. So the pressure difference between the two phases remains constant, contact forces and contact areas at the micro scale level maintain constant and the shear strength remains also constant.
At this point, the effective stress concept can be introduced. The shear strength is related to the effective pressure and this effective pressure is taken equal to the interstitial pressure. For a dry material, the effective pressure is always equal to

8 EJECE-2010
the total pressure. But for a partially saturated material, the effective pressure is the total pressure like in dry material until all the voids are removed. After consolidation the interstitial (or the effective) pressure does not increase any more because the pressure in the solid phase and in the water increases together and consequently the shear yield strength remains con-stant. As the water contents increase, the pressure level Pvps at the consolidation point decreases and then the shear strength q0 also decreases. Figure 7 illustrates the effect of the effective pressure concept. The solid line gives the shear yield strength versus the pressure for a dry material. For a partially saturated one, the shear strength follows the solid line until the pressure Pvps is reached. Afterwards the shear strength does not increase and it follows the dashed horizontal line.
Figure 7. Shear yield strength versus pressure for dry and partially saturated materials
2.3. Coupling procedure for the damage and the modified Krieg model : PRM crash model
The scalar damage model has been coupled with the modified Krieg model. The coupling procedure ensures a perfect continuity between the two model responses. The predicted stresses correspond to the damage model response if the maxi-mum pressure is too low to start the pore collapse phenomena or if the shear stress is too low to reach the shear yield stress. If not, the plastic model is activated and pilots the evolutions until the extensions sufficiently increase to lead to a damage failure. The left part of figure 8 shows the predicted static response obtained on a cylindrical dry specimen for tri-axial tests with increasing lateral pressure. On the right part, tests results performed on the GIGA machine at 3S-R Greno-ble prove the pertinence of these results (Gabet, 2006).
-1 0 1 2 3 4 5 6 7 8 9 10
Axial strain (%)
0
50
100
150
200
250
300
350
400
450
Axi
al s
tres
s (M
Pa)
5 MPa
10 MPa
20 MPa
40 MPa
80 MPa
120 MPa
0 MPa
-2 0 2 4 6 8 10 0
50
100
150
200
250
300
350
400
450
100 MPa
50 MPa
0 MPa
σ x (
MP
a)
εx
Figure 8. Stress strain response on a concrete given by the coupled damage and plastic model (tri-axial tests)
(Totally saturated)

Predicting concrete behaviour: an overview of the PRM Model 9
3. Numerical simulations
This model has been implemented in the ABAQUS explicit finite element code and it has been extensively used to simulate a lot of complex problems. The PRM damage model can be used with most of the available finite elements (1D truss elements, beam elements, 2D plane stress and plane strain elements, 2D axisymmetric elements, shell elements, 3D solid elements, etc.). The coupled damage and plastic model (PRM crash model) can be used with 2D plane strain ele-ments, 2D axisymmetric and 3D solid elements. In order to show the capabilities of the coupled model some applications are presented here and numerical results are compared to experimental data.
3.1. Dynamic three points bending test on a reinforced concrete beam
Figure 9 shows the experimental device and the beam characteristics (in mm). These tests have been conducted by Agardh, Magnusson & Hanson (1999) in Sweden on a high strength reinforced concrete beam.
Figure 9. Experimental device (dynamic three points bending tests)
Beam elements, 2D plane stress elements and 3D solid elements are used to model the reinforced concrete beam. A sin-gle element is used in the depth direction with the 3D model. Taking advantage of the symmetry, only a half part of the beam is modelled. The reinforcement material model is the classical Johnson Cook plasticity model. The concrete and the steel reinforcement are supposed to be perfectly bonded. Figure 9 details the experimental apparatus. When the deflection becomes greater than 90 mm, shock absorbers damp the central part of the beam.
Figure 10 shows, at the end of the dynamic test, the tensile damage contours on the 3D beam model (upper part of the figure). The lower part shows the corresponding observed crack pattern. The computed cracks are mainly concentrated in the central part of beam like in the experiment. In Figure , the measured force (cross points) is compared to the three com-puted forces resulting from the three different meshes. The beam model gives the lower force. The 2D and 3D models give very similar results.

10 EJECE-2010
Figure 10. Computed and observed crack pattern
Figure 11. Measured and computed dynamic load
3.2. Impact on a T-shape reinforced concrete structure
This study is related to the analysis of the vulnerability of concrete structures under intentional actions. More specifi-cally, the effect of a projectile of about 80 kg striking a reinforced concrete plate is studied. Such an experiment has been done by E. Buzaud et al. (2003). The 35NCD16 steel projectile has an ogival nozzle. Its diameter is 160 mm and its length is 960 mm (Figure 12). An accelerometer recorder system is mounted inside the projectile to measure the axial and lateral accelerations during the tests. Figure shows the test configuration with a T-shape concrete structure. The size of each rein-forced concrete square plate composing the target is 3 m. The thickness of the front part of the concrete target is 400 mm and the thickness of the rear part is 300 mm. Reinforcement is composed of two steel layers (one on each side of the con-crete plate) with 16 mm diameter bars. Other 10 mm diameter bars link each reinforcement mesh node of the face to face layers. The distance that separates each bar is 100 mm. The distance between the reinforcement layer and the top (or the bottom) plate surface is 50 mm.
0.85m
Figure 12. Projectile mesh and test configuration, impact on T-structure
3D numerical simulations have been done using the ABAQUS explicit finite element code. The total number of the fi-nite elements is about 530 000 for the entire model. The projectile material (Figure 12) is simulated using an elastic and perfectly plastic model with a plastic yield stress of 1300 MPa. The reinforcement is also modelled with an elasto-plastic
0 5 10 15 20 25 30 35 40 45
Experiment ABAQUS 1D ABAQUS 2D ABAQUS 3D
Time (ms)
120
140
160
180
10
80
60
40
20
0
Ap
plie
d fo
rce
(kN
)
Predicting concrete behaviour: an overview of the PRM Model 11
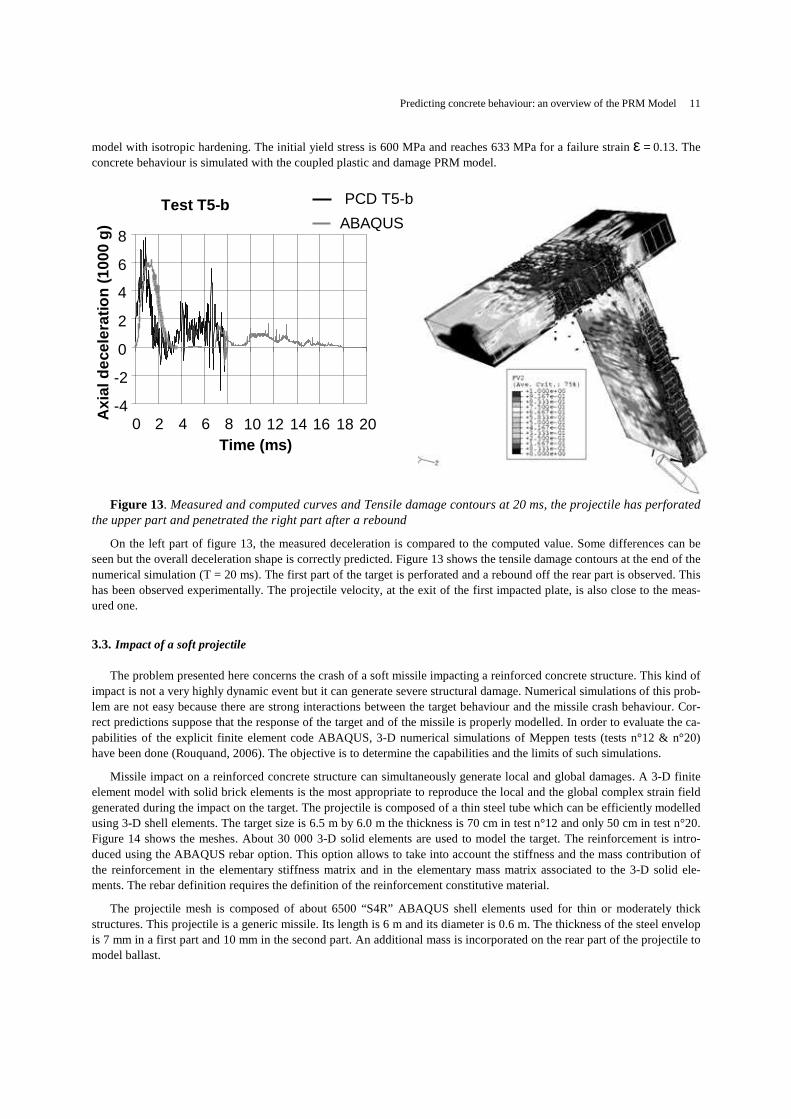
model with isotropic hardening. The initial yield stress is 600 MPa and reaches 633 MPa for a failure strain ε = 0.13. The concrete behaviour is simulated with the coupled plastic and damage PRM model.
Figure 13. Measured and computed curves and Tensile damage contours at 20 ms, the projectile has perforated the upper part and penetrated the right part after a rebound
On the left part of figure 13, the measured deceleration is compared to the computed value. Some differences can be seen but the overall deceleration shape is correctly predicted. Figure 13 shows the tensile damage contours at the end of the numerical simulation (T = 20 ms). The first part of the target is perforated and a rebound off the rear part is observed. This has been observed experimentally. The projectile velocity, at the exit of the first impacted plate, is also close to the meas-ured one.
3.3. Impact of a soft projectile
The problem presented here concerns the crash of a soft missile impacting a reinforced concrete structure. This kind of impact is not a very highly dynamic event but it can generate severe structural damage. Numerical simulations of this prob-lem are not easy because there are strong interactions between the target behaviour and the missile crash behaviour. Cor-rect predictions suppose that the response of the target and of the missile is properly modelled. In order to evaluate the ca-pabilities of the explicit finite element code ABAQUS, 3-D numerical simulations of Meppen tests (tests n°12 & n°20) have been done (Rouquand, 2006). The objective is to determine the capabilities and the limits of such simulations.
Missile impact on a reinforced concrete structure can simultaneously generate local and global damages. A 3-D finite element model with solid brick elements is the most appropriate to reproduce the local and the global complex strain field generated during the impact on the target. The projectile is composed of a thin steel tube which can be efficiently modelled using 3-D shell elements. The target size is 6.5 m by 6.0 m the thickness is 70 cm in test n°12 and only 50 cm in test n°20. Figure 14 shows the meshes. About 30 000 3-D solid elements are used to model the target. The reinforcement is intro-duced using the ABAQUS rebar option. This option allows to take into account the stiffness and the mass contribution of the reinforcement in the elementary stiffness matrix and in the elementary mass matrix associated to the 3-D solid ele-ments. The rebar definition requires the definition of the reinforcement constitutive material.
The projectile mesh is composed of about 6500 “S4R” ABAQUS shell elements used for thin or moderately thick structures. This projectile is a generic missile. Its length is 6 m and its diameter is 0.6 m. The thickness of the steel envelop is 7 mm in a first part and 10 mm in the second part. An additional mass is incorporated on the rear part of the projectile to model ballast.
Test T5-b
-4
-2
0
2
4
6
8
0 2 4 6 8 10 12 14 16 18 20Time (ms)
Axi
al d
ecel
erat
ion
(10
00 g
)
PCD T5-b,
ABAQUS

12 EJECE-2010
Target mesh (test n°12) Target mesh (test n°20) Projectile mesh (test n° 12 & n°20)
Figure 14. Mesh of the projectile and of the slab in tests n°12 and n°20
The behaviour of the metallic bars is modelled using a standard elastic and plastic model. Strain rate is not accounted because it is very low in the reinforcement. The behaviour of the metallic missile material is modelled using the Johnson Cook elastic and plastic model. Strain rate is now accounted because during the projectile crash, it can reach about 1000/s. In the tests, the reinforced concrete slab was put on a vertical position at the end of the rail. The projectile is accelerated on the rail and impacts the plate in its middle point. The slab is supported on a very stiff metallic frame of 5.4 m by 5.4 m cen-tred on its rear face. To simulate this support, all the nodes on the rear face located along the frame, are fixed (zero dis-placement) in the plate normal direction. The missile initial velocity is 241.5 m/s in test n°12 and 197.7 m/s in test n°20. The missile axis and the velocity vector are perpendicular to the reinforced concrete plate.
Test n°12: Figure 15 shows a comparison between measured and computed displacements on three points (w10, w6 and w8). The agreement is good. The error is less than 10 %. Displacements curves for points: w10 and w6 are closer in the computation than in the experiment.
w10
w6
w8
Mw9
Figure 15. Comparison between measured (dashed line) and computed displacements (solid line) in test n° 12
W10
W6
Dis
pla
cem
ent
(mm
)
Time (ms)
W8

Predicting concrete behaviour: an overview of the PRM Model 13
Figure 16 shows the comparison between the maximum tensile strains and the observed crack pattern. Maximum ten-sile strains can be advantageously used to traduce the tensile damage level. This comparison shows that the conical zone with open tensile cracks corresponds more or less to the computed cracked zone (deep blue contours).
Figure 16. Comparison between computed and observed damages (test n° 12)
Test n° 20: The figure 17 compares the computed displacement at point w6 to the measured displacement and to the meas-ured value on the symmetric point of w6. Measurement on point w10 has not been possible due to tensile failure of con-crete. Experiment gives a non symmetric response of the concrete slab.
Figure 17. Comparison between computed and measured displacements (test n° 20)
Figure 18 shows the comparison between the computed maximum tensile strains and the observed crack pattern. In the experiment, a severe damage is obtained in the concrete ahead the projectile nozzle. Because of the reduction of the slab thickness in this test, a concrete plug is now clearly observed in the experiment. This damage mode is the result of large shear strains around the plug. This kind of damage is correctly predicted in the numerical simulation.
Median vertical slab section
Median horizontal slab section
Dis
plac
emen
t (m
m)
Time (ms)
W6 computed
W6 meas-
Sym of W6 measured

14 EJECE-2010
Figure 18. Comparison between computed and observed damages (test n° 20)
3.4. Shock wave propagation in a partially saturated media
R. P. Swift (1973) details a series of experimental tests where a spherical LX – 0401 explosive charge, embedded in a geologic tuff specimen, detonates (see Figure 19).
Figure 19. Experimental tests in a geologic tuff specimen with various saturation ratios
The charge diameter is 2.5 cm. The size of the geologic material is enough large to prevent the comeback of reflecting waves during the first microseconds. For each test, 3 electromagnetic velocity gages are incorporated into the tuff sample to measure the material velocity (numbered from 1 to 3 on the Figure 19). Four tests have been done. Between each test, the water content is changed. The ABAQUS explicit finite element code simulates the detonation of the pyrotechnic device and the shock wave propagation through the tuff material. A single row of 2D axi-symmetric elements is used to model the problem. The total number of the finite elements is 550. The size of each element is 1 mm. The J.W.L. equation of state simulates the behaviour of the explosive combustion products. The PRM coupled plastic and damage model is used for the tuff.
Median vertical slab section
Median horizontal slab section
Tuff
Spherical Charge
Electromagnetic velocity gages
3 2 1

Predicting concrete behaviour: an overview of the PRM Model 15
As an example, the left part of figure 20 shows a comparison between experimental and numerical velocities at different points in the geologic specimen. Here, we consider a test with a water content of 51.8 %. Three sets of curves are given. Each refers to a particular point (velocity transducer point, see Figure 19). The amplitude of the peak velocity and the arri-val time of the shock wave are correctly predicted. The numerical simulation gives a stiffer material response so the arrival time is a little bit overestimated. The right part of figure 20 shows the same results but for a test with a water contents of 81.4 %.
Figure 20. Material velocity profiles (water content of 58.8% and 81.4%)
Finally figure 21 shows a comparison between two numerical simulations. In the first, the water content is taken equal to 58.8 %. This value is taken equal to 81.4% in the second simulation. These results clearly show the great influence of the water contents on the shock wave characteristics (amplitude and arrival time).
Figure 21. Water contents effects on the propagating shock wave
4. Conclusions
A general constitutive model for concrete structures submitted to extreme loading (high velocity and high confinement) has been developed and implemented into the “ABAQUS explicit” finite element code in the framework of damage and plasticity mechanics. The concrete damage model proposed by J. Mazars for monotonic tensile loading is the starting point of the proposed improved version. The resulting coupled damage and plasticity model (PRM crash model) can simulate a
Water content: 58.8 % Water content: 81.4%
Time (µµµµs)
Mat
eria
l vel
ocit
y (m
/s)
0 10 20 30 40 50 0
100
200
300
400
500
600
Experiment PRM model
1
2
3
1
2
3
Mat
eria
l vel
ocit
y (m
/s)
Time (µµµµs)
1
2
3

16 EJECE-2010
lot of physical mechanisms like crack opening and crack closure effects, strain rate effects, material damping induced by internal friction, compaction of porous media, shear plastic strains under high pressure, water content effects on the pres-sure volume behaviour and on the shear strength. The validation of the coupled damage and plasticity model has been done through a complete experimental program performed at 3S - R Grenoble laboratory using the GIGA press machine and through a large panel of experimental tests corresponding to a large range of static and dynamic loading. All the examples presented in this paper, demonstrate the efficiency of the proposed explicit finite element procedure to capture the real be-haviour of complex reinforced concrete structures. The explicit formulation of the proposed model allows to run very large simulations of dynamic problems using several millions of finite elements in few hours.
5. References
Agardh L., Magnusson J., Hansson H., « High strength concrete beams subjected to impact loading, an experimental study », 1999, FOA Defence Research Establishment, FOA-R-99-01187-311—SE.
Bazant Z.P., « Nonlocal damage theory based on micromechanic of crack interaction », 1994, Journal of Engineering Mechanics. ASCE, vol. 120, pp. 593-617.
Buzaud E. et al., « An experimental investigation of corner effects resulting from vertical attack on hardened structures », 2003, Proceed-ings of 11th ISIEMS, Mannheim, Germany.
Brara A., « Etude expérimentale de la traction dynamique du béton par écaillage », 1999, Thèse de l'université de Metz – France.
Combescure D., Chaudat T., « ICONS European program seismic tests on R/C bearing walls, CAMUS III specimen », 2000, Rapport DMT, SEMT/EMSI/RT/00-014/A, Commissariat à l'Energie Atomique (CEA) Saclay.
Combescure D., Mazars J., Naze P.A., Reynouard J.M., « CAMUS III international benchmark, synthesis of participant reports », 2001, Post- Framcos-4 workshop on seismic loading effects on structural walls.
Gabet T., « Comportement triaxial du béton sous fortes contraintes : Influence du trajet de chargement », 2006, Thèse de doctorat, Univer-sité Joseph Fourier, Grenoble.
Hillerborg A., Modeer M., Petersson P. E., « Analysis of crack formation and growth in concrete beams of fracture mechanics and finite elements », 1976, Cement and Concrete Research, vol. 6, pp 773-782.
Jirásek M., « Non-local damage mechanics with application to concrete », 2004, Revue Française de Génie Civil, vol. 8 (2004), pp. 683-707.
Krieg R. D., « A simple constitutive description for soils and crushable foams », 1978, Sandia National Laboratories, SC-DR-72-0833, Albuquerque, New Mexico.
Mariotti C., Perlat J. P., Guerin J. M., « A numerical approach for partially saturated geomaterials under shock », 2002, CEA/DAM Bruyères le Châtel, International Journal of Impact Engineering, vol. 28 (2003) 717 – 741.
Mazars J., « Application de la mécanique de l'endommagement au comportement non linéaire et à la rupture du béton de structure », 1984, Thèse d'Etat, Université Paris VI.
Mazars J., « A description of micro and macro scale damage of concrete structures », 1986, Engineering Fracture Mechanics, vol. 25, n° 5/6.
Mazars J., Pijaudier-Cabot G., « Continuum damage theory - application to concrete », 1989, Journal of Engineering Mechanics, ASCE, vol. 115(2), pp. 345–365.
Ottosen N.S., « Constitutive model for short time loading of concrete », 1979, Journal of Engineering Mechanics, ASCE, vol. 105, pp. 127-141.
Pontiroli C., « Comportement au souffle de structures en béton armé, analyse expérimentale et modélisation », 1995, Thèse de doctorat, Ecole Normale Supérieure de Cachan, Centre d'études de Gramat.
Rouquand A., Pontiroli C., « Some considerations on explicit damage models including crack closure effects and anisotropic behaviour », 1995, Proceedings FRAMCOS-2, Ed.F.H. Wittmann, AEDIFICATIO Publisher, Freiburg.
Rouquand A., « Comportement d'un bâtiment posé sur table sismique, programme CAMUS III, comparaisons calculs expériences », 2002, Centre d'Etudes de Gramat, rapport technique T2002-00052/CEG/NC.

Predicting concrete behaviour: an overview of the PRM Model 17
Rouquand A., « Présentation d'un modèle de comportement des géomatériaux, applications au calcul de structures et aux effets des armes conventionnelles », 2005, Centre d'Etudes de Gramat, rapport technique T2005-00021/CEG/NC.
Rouquand A., « Simulations numériques des essais Meppen : Impacts de projectiles déformables contre des parois en béton armé », 2006, Rapport technique T2006-00052/CEG/NC, Centre d’Etudes de Gramat.
Swift R.P., « Dynamic response of earth media to spherical stress waves », 1973, Final report, Physics International Compagny.
Van Mier J.G., Pruijssers A., Reinhardt H.W., Monnier T., « Load time response of colliding concrete bodies », 1991, Journal of Structure Engineering, vol. 117, p. 354-374.
Vu Xuan Hong, « Caractérisation expérimentale du béton sous fort confinement : Influence du degré de saturation et du rapport eau/ciment », 2007, Thèse de doctorat, Université Joseph Fourier, Grenoble.
Related Documents