Q. J. R. Meteorol. SOC. (1996), 122, pp. 1573-1595 Predicting cloud-droplet effective radius and indirect sulphate aerosol forcing using a general circulation model By A. JONES* and A. SLING0 Hadley Centre for Climate Prediction and Research, Meteorological Ofice, UK (Received 23 October 1995; revised 8 February 1996) SUMMARY Various methods for predicting cloud-droplet effective radius in the Hadley Centre general circulation model are compared with aircraft and satellite retrievals, and are used to estimate the indirect radiative forcing by anthro- pogenic sulphate aerosols since the beginning of the industrial era. The effects both of different parametrization approaches and of different input sulphate data sets are examined; however, there is no clear evidence to prefer either of the two sulphate data sets used in the study. 'ho of the parametrizations generate distributions of present- day effective radius which are similar to each other and compare favourably with observations, yet provide very different estimates of the indirect effect, ranging from -0.5 to -1.5 W m-2 in the global annual mean. A sensitivity experiment in which it is assumed that droplet concentrations are not determined by sulphate concentrations in continental air reduces this global-mean forcing to -0.3 to -0.8 W m-2. This sensitivity demonstrates the need for a much better understanding of the link between sulphate aerosol mass concentrations, cloud condensation nuclei, and cloud-droplet number concentrations. KEYWORDS: Climate change Cloud-droplet effective radius General circulation model Parametriza- tion Radiative forcing Sulphate aerosol 1. INTRODUCTION Satellite observations of the earth's radiation budget show that clouds are responsible for about half of the incident solar radiation that is reflected back into space. Clouds thereby reduce the absorbed short-wave radiation by about 50 W m-*, although this is partially offset by their 30 W m-* contribution to the long-wave greenhouse effect (Harrison et al. 1990; Hartmann 1993). These figures are modest in comparison with the overall short- wave absorption of about 235 W m-2, but the difficulty in representing clouds in numerical models means that they contribute significantly to the uncertainties in predicting the future climate (IPCC 1990). The radiative properties of a cloud in the short-wave region of the spectrum are determined primarily by the liquid- or ice-water content and by the size and shape of the water droplets or ice crystals. Together with the area covered by cloud within a given region, referred to here as the cloud amount, these properties determine the contribution of clouds to the short-wave radiation budget. Changes in the global distribution of cloud amount, water content and particle size could all contribute to climate variability as well as to climate change. These three quantities, therefore, need to be represented in climate models, so that they can be used to explore the many radiative forcings and feedbacks which may be associated with clouds. Numerical experiments have established that the radiation budget is sensitive to changes in particle size (Sling0 1990; Kiehll994). Nevertheless, most climate models assume fixed values for the size of cloud particles, so that cloud feedbacks can only take place through variations in the cloud amounts and water contents. Despite this apparent restriction, the models are capable of a wide range of cloud feedbacks, both in the short-wave and long-wave spectral regions. These feedbacks are responsible for a threefold range in the overall sensitivity of the models to an idealized perturbation in the intercomparison of Cess et al. (1990). The possibility that the mean drop size in water clouds could decrease as an indirect ef- fect of pollution was first raised by Tbomey (1974). He showed that such a decrease would * Corresponding author: Hadley Centre for Climate Prediction and Research, Meteorological Office, London Road, Bracknell, Berkshire RG12 2SY, UK. email: [email protected]. 1573

Welcome message from author
This document is posted to help you gain knowledge. Please leave a comment to let me know what you think about it! Share it to your friends and learn new things together.
Transcript
Q. J. R. Meteorol. SOC. (1996), 122, pp. 1573-1595
Predicting cloud-droplet effective radius and indirect sulphate aerosol forcing using a general circulation model
By A. JONES* and A. SLING0 Hadley Centre for Climate Prediction and Research, Meteorological Ofice, UK
(Received 23 October 1995; revised 8 February 1996)
SUMMARY
Various methods for predicting cloud-droplet effective radius in the Hadley Centre general circulation model are compared with aircraft and satellite retrievals, and are used to estimate the indirect radiative forcing by anthro- pogenic sulphate aerosols since the beginning of the industrial era. The effects both of different parametrization approaches and of different input sulphate data sets are examined; however, there is no clear evidence to prefer either of the two sulphate data sets used in the study. ' h o of the parametrizations generate distributions of present- day effective radius which are similar to each other and compare favourably with observations, yet provide very different estimates of the indirect effect, ranging from -0.5 to -1.5 W m-2 in the global annual mean. A sensitivity experiment in which it is assumed that droplet concentrations are not determined by sulphate concentrations in continental air reduces this global-mean forcing to -0.3 to -0.8 W m-2. This sensitivity demonstrates the need for a much better understanding of the link between sulphate aerosol mass concentrations, cloud condensation nuclei, and cloud-droplet number concentrations.
KEYWORDS: Climate change Cloud-droplet effective radius General circulation model Parametriza- tion Radiative forcing Sulphate aerosol
1. INTRODUCTION
Satellite observations of the earth's radiation budget show that clouds are responsible for about half of the incident solar radiation that is reflected back into space. Clouds thereby reduce the absorbed short-wave radiation by about 50 W m-*, although this is partially offset by their 30 W m-* contribution to the long-wave greenhouse effect (Harrison et al. 1990; Hartmann 1993). These figures are modest in comparison with the overall short- wave absorption of about 235 W m-2, but the difficulty in representing clouds in numerical models means that they contribute significantly to the uncertainties in predicting the future climate (IPCC 1990).
The radiative properties of a cloud in the short-wave region of the spectrum are determined primarily by the liquid- or ice-water content and by the size and shape of the water droplets or ice crystals. Together with the area covered by cloud within a given region, referred to here as the cloud amount, these properties determine the contribution of clouds to the short-wave radiation budget. Changes in the global distribution of cloud amount, water content and particle size could all contribute to climate variability as well as to climate change. These three quantities, therefore, need to be represented in climate models, so that they can be used to explore the many radiative forcings and feedbacks which may be associated with clouds. Numerical experiments have established that the radiation budget is sensitive to changes in particle size (Sling0 1990; Kiehll994). Nevertheless, most climate models assume fixed values for the size of cloud particles, so that cloud feedbacks can only take place through variations in the cloud amounts and water contents. Despite this apparent restriction, the models are capable of a wide range of cloud feedbacks, both in the short-wave and long-wave spectral regions. These feedbacks are responsible for a threefold range in the overall sensitivity of the models to an idealized perturbation in the intercomparison of Cess et al. (1990).
The possibility that the mean drop size in water clouds could decrease as an indirect ef- fect of pollution was first raised by Tbomey (1974). He showed that such a decrease would
* Corresponding author: Hadley Centre for Climate Prediction and Research, Meteorological Office, London Road, Bracknell, Berkshire RG12 2SY, UK. email: [email protected].
1573
1574 A. JONES and A. SLING0
enhance the planetary albedo and thus tend to cool the climate. Subsequently, llvomey et al. (1984) estimated that the cooling might offset significantly the global warming pro- duced by increasing concentrations of greenhouse gases. Subsequent investigations of the indirect effect have focused on the sulphate aerosol component of pollution and have been performed with a simple climate model (Charlson et al. 1992), a zonally averaged energy- balance model (Kaufman and Chou 1993) and with three-dimensional models (Jones et al. 1994; Boucher and Lohmann 1995). For recent reviews see IPCC (1995) and Schwartz and Slingo (1996). Another possible effect of aerosols is on cloud lifetime and precipitation development (e.g. Albrecht 1989), whereby clouds with a smaller mean drop size are less likely to dissipate by the development of precipitation, and so have longer lifetimes; this mechanism is not considered here.
In this paper we present results from climate model simulations of the mean drop size in water clouds and compare these with satellite retrievals. The drop sizes are com- puted from the modelled cloud liquid-water contents and from externally imposed sulphate aerosol distributions derived from two chemical-transport models. The effect of using three contrasting parametrizations for deriving the drop number concentrations from the aerosol distributions is also investigated. Finally, we show that calculations of the indirect effect of sulphate aerosols are very sensitive to the choice of parametrization, further emphasizing the large uncertainties in current estimates.
2. PARAMETRIZATION OF DROPLET EFFECTIVE RADIUS
The model used in this study was the Hadley Centre general circulation model (GCM), a configuration of the UK Meteorological Office's unified forecast/climate model (Cullen 1993). This model is similar to that used by Gregory (1995). The model was run with a horizontal resolution of 5" latitude by 7.5" longitude, with 19 layers in the vertical (model top at 0.5 mb), a time step of 1 hour, and used climatological sea surface temperatures. Cloud liquid- and ice-water contents and fractional cloud amount are calculated using the prognostic cloud-water scheme of Smith (1990), with the condensate changing smoothly from entirely water above 0 "C to entirely ice below -15 "C. This scheme does not treat mixed-phase clouds explicitly, but at the time resolution of the model (time step = 1 hour) one may assume that a cloud is either wholly liquid or wholly ice. The transition from liquid to ice on going from 0 "C to - 15 "C may then be interpreted as defining the fraction of clouds in the ensemble within a gridbox which are glaciated. The model's radiation code is called every three hours; cloud radiative properties are calculated from the cloud-water contents and mean particle size, using parametrizations of the single-scattering properties of the cloud as input to a two-stream model (Slingo 1989). The appropriate measure of the mean drop size for use in such parametrizations is the effective radius (Hansen and Travis 1974):
re = 1 r3n(r) dr/ 1 r2n(r) dr (1)
where r is cloud-droplet radius and n is cloud-droplet concentration. Numerous experimental studies performed by the UK Meteorological Office's
Meteorological Research Flight (MRF) have yielded a parametrization of the effective radius of stratiform water clouds in terms of the cloud liquid-water content, L, and the number concentration of cloud droplets, N,,, (Martin et al. 1994):
re = ( ~ L / ~ ~ ~ K N , , , ) " ~ (2) where K is the cube of the ratio of the mean volume radius and the effective radius of the cloud-droplet spectrum, and has a constant value depending on whether the airmass
INDIRECT FORCING BY SULPHATE AEROSOLS 1575
is continental ( K = 0.67) or maritime ( K = 0.80) in origin. It is assumed that clouds over land are continental, and those elsewhere are maritime, although it is recognized that this is a great simplification, and that continental air can maintain its characteristics after many days over the ocean. Equation (2) was also used to determine re for shallow convective clouds (those less than about 500 m in depth), as recommended by Bower and Choularton (1992). For deep convective clouds, fixed values of re were used owing to the large amount of entrainment present in such clouds (Bower and Choularton 1992), with re = 9.5 p m for continental clouds and 13.5 p m for maritime clouds. Ice-cloud particles have a prescribed re of 30 pm. For cloudy gridboxes in the temperature range 0 "C to -15 "C, the effective radius used by the radiation code is a weighted mean of the value calculated from Eq. (2) and the 30 p m prescribed for ice particles. The weighting is dependent on temperature, with gridboxes > 0 "C consisting entirely of liquid-water clouds, and those c -15 "C entirely of ice clouds.
To use Eq. (2) to calculate re, we need to know N,,,. In this study we assume that the distribution of N,,, is determined by the distribution of sulphate aerosol. This assumption is also made in all recent studies of the indirect effect, and its validity will be re-examined in section 5. Sulphate is a major component of atmospheric aerosol and of the cloud conden- sation nucleus (CCN) population (e.g. Pruppacher and Klett 1978), being formed primarily by the oxidation of largely anthropogenic sulphur dioxide and of the dimethyl sulphide produced by marine phytoplankton. As global distributions of sulphate are available from chemical-transport models, these were used to determine the distribution of N,,,. l bo - dimensional distributions of total atmospheric sulphate were obtained from two different models:
(i) distributions of sulphur ion mass-loadings from the 'slow oxidation' version of the
(ii) distributions of sulphate mass-loadings from the model results of Penner etal. (1994).
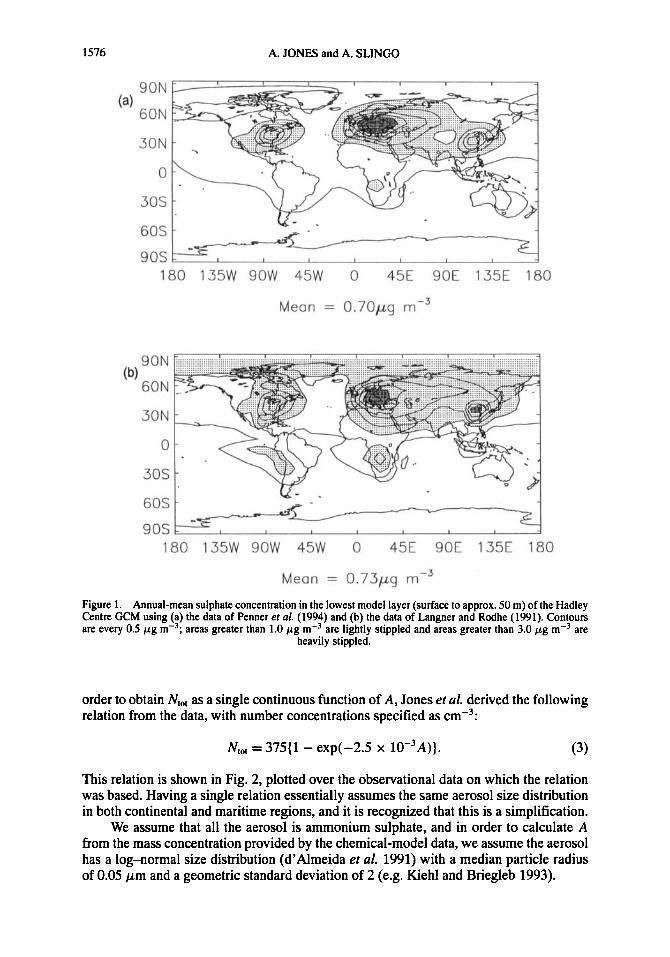
The data from both sources were annual means. These aerosol mass-loadings were distributed in the vertical so that half the mass was uniformly distributed in the lowest five model layers (approximating the planetary boundary layer, having a typical depth of about 2 km), and the rest was distributed aloft. The aerosol was distributed in this fashion to approximate the vertical distribution presented by Langner and Rodhe (1991). This method is more realistic than that employed by Jones et al. (1994), which assumed a fixed boundary-layer depth of 1.5 km. Figure 1 shows the annual-mean mass concentration of aerosol (as sulphate ions) in the lowest model layer from each of the sources. These distributions have similar major features, showing maxima over the large industrial centres in the Eastern USA, central Europe and China, and an asymmetry between the northern and southern hemispheres.
In this study we use three different methods of obtaining N,,, from the model sulphate distributions. Each method has its advantages and disadvantages, as discussed below.
MOGUNTIA model (Langner and Rodhe 1991);
(a) Jones et al. The first approach is the same as that used by Jones et al. (1994). The method has
the advantage of being based on the extensive observational data of Martin et al. (1994), who measured both Ntot and the total aerosol number concentration, A, below cloud base. It has the disadvantage of having to make assumptions as to the aerosol size spectrum and composition. A relation was derived which enabled N,,, to be computed from A; Martin et al. originally defined two such relations, one for maritime and one for continental air masses. However, because of the difficulty of defining such air masses in a GCM, and in
1576 A. JONES and A. SLING0
(4
180 135W 9OW 45W 0 45E 90E 135E 180
Mean = 0 . 7 0 ~ 9 m-3
180 135W 9OW 45W 0 45E 90E 135E 180
Mean = 0 . 7 3 ~ 9 m-3
Figure 1. Annual-mean sulphate concentration in the lowest model layer (surface to approx. 50 m) of the Hadley Centre GCM using (a) the data of Penner et al. (1994) and @) the data of Langner and Rodhe (1991). Contours are every 0.5 pg m-3; areas greater than 1.0 pg m-3 are lightly stippled and areas greater than 3.0 pg m-3 are
heavily stippled.
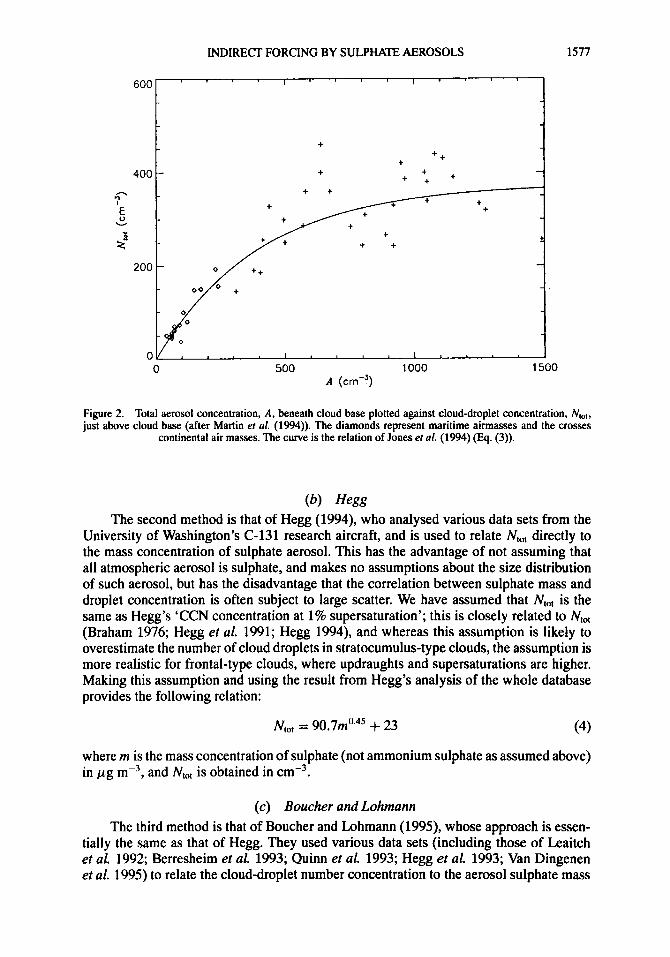
order to obtain N,,, as a single continuous function of A, Jones et al. derived the following relation from the data, with number concentrations specified as ~ m - ~ :
N,,, = 375[1 - exp(-2.5 x 10⁻³A)]. (3)
This relation is shown in Fig. 2, plotted over the observational data on which the relation was based. Having a single relation essentially assumes the same aerosol size distribution in both continental and maritime regions, and it is recognized that this is a simplification.
We assume that all the aerosol is ammonium sulphate, and in order to calculate A from the mass concentration provided by the chemical-model data, we assume the aerosol has a log-normal size distribution (d’Almeida et al. 1991) with a median particle radius of 0.05 pm and a geometric standard deviation of 2 (e.g. Kiehl and Briegleb 1993).
INDIRECT FORCING BY SULPHATE AEROSOLS 1577
Figure 2. Total aerosol concentration, A, beneath cloud base plotted against cloud-droplet concentration, NlOl, just above cloud base (after Martin er al. (1994)). The diamonds represent maritime airmasses and the crosses
continental air masses. The curve is the relation of Jones ef a!. (1994) (Eq. (3)).
(b) Hegg The second method is that of Hegg (1994), who analysed various data sets from the
University of Washington’s C-131 research aircraft, and is used to relate Nt0, directly to the mass concentration of sulphate aerosol. This has the advantage of not assuming that all atmospheric aerosol is sulphate, and makes no assumptions about the size distribution of such aerosol, but has the disadvantage that the correlation between sulphate mass and droplet concentration is often subject to large scatter. We have assumed that Ntot is the same as Hegg’s ‘CCN concentration at 1% supersaturation’; this is closely related to N,,, (Braham 1976; Hegg et al. 1991; Hegg 1994), and whereas this assumption is likely to overestimate the number of cloud droplets in stratocumulus-type clouds, the assumption is more realistic for frontal-type clouds, where updraughts and supersaturations are higher. Making this assumption and using the result from Hegg’s analysis of the whole database provides the following relation:
N,,, = 90.7m0.45 + 23 (4)
where rn is the mass concentration of sulphate (not ammonium sulphate as assumed above) in p g mP3, and N,,, is obtained in ~ m - ~ .
(c ) Boucher and Lohmann The third method is that of Boucher and Lohmann (1995), whose approach is essen-
tially the same as that of Hegg. They used various data sets (including those of Leaitch et al. 1992; Berresheim et al. 1993; Quinn et al. 1993; Hegg et al. 1993; Van Dingenen et al. 1995) to relate the cloud-droplet number concentration to the aerosol sulphate mass
1578 A. JONES and A. SLING0
400
300
I E 2 200
100
0
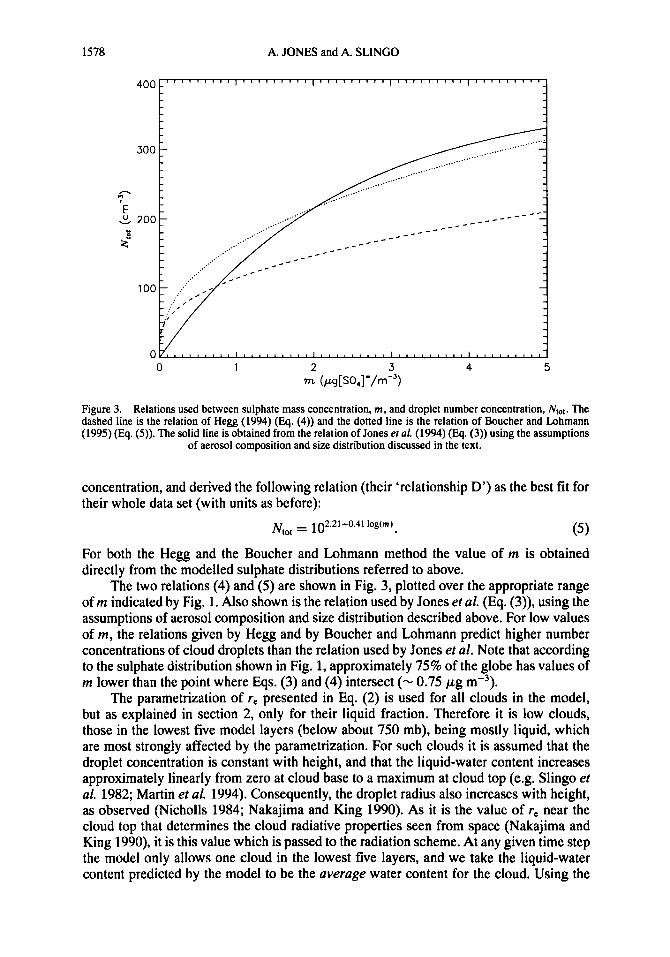
Figure 3. Relations used between sulphate mass concentration, m, and droplet number concentration, N,,,. The dashed line is the relation of Hegg (1994) (Eq. (4)) and the dotted line is the relation of Boucher and Lohmann (1995) (Eq. (5)). The solid line is obtained from the relation of Jones eral. (1994) (Eq. (3)) using the assumptions
of aerosol composition and size distribution discussed in the text.
concentration, and derived the following relation (their 'relationship D') as the best fit for their whole data set (with units as before):
(5) N - 102.21+0.41 log(m) tot -
For both the Hegg and the Boucher and Lohmann method the value of m is obtained directly from the modelled sulphate distributions referred to above.
The two relations (4) and (5) are shown in Fig. 3, plotted over the appropriate range of m indicated by Fig. 1. Also shown is the relation used by Jones etal. (Eq. (3)), using the assumptions of aerosol composition and size distribution described above. For low values of m, the relations given by Hegg and by Boucher and Lohmann predict higher number concentrations of cloud droplets than the relation used by Jones et al. Note that according to the sulphate distribution shown in Fig. 1, approximately 75% of the globe has values of m lower than the point where Eqs. (3) and (4) intersect (- 0.75 pg m-3).
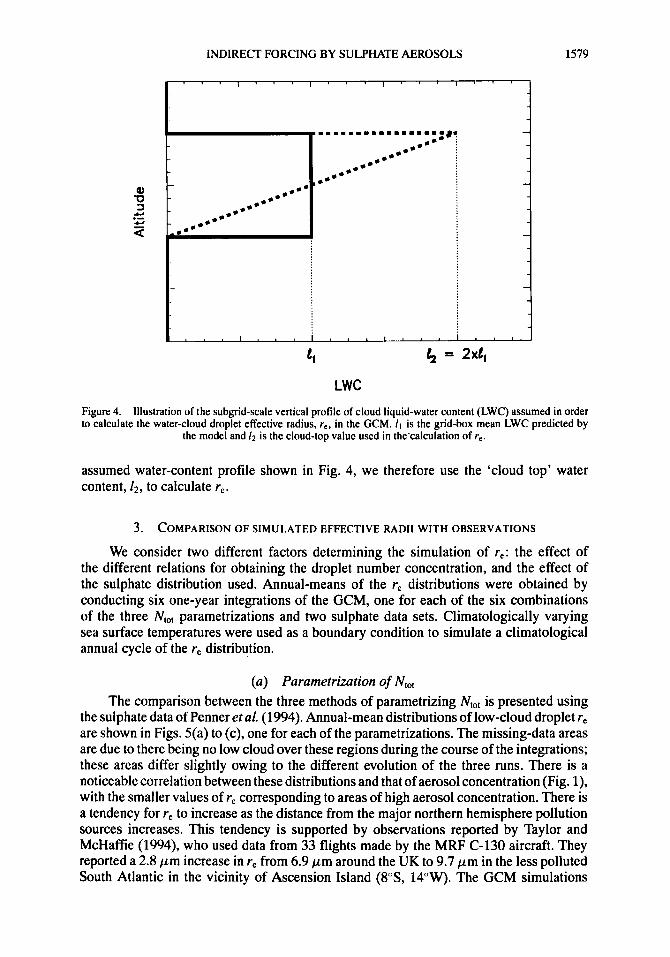
The parametrization of re presented in Eq. (2) is used for all clouds in the model, but as explained in section 2, only for their liquid fraction. Therefore it is low clouds, those in the lowest five model layers (below about 750 mb), being mostly liquid, which are most strongly affected by the parametrization. For such clouds it is assumed that the droplet concentration is constant with height, and that the liquid-water content increases approximately linearly from zero at cloud base to a maximum at cloud top (e.g. Slingo et af. 1982; Martin et al. 1994). Consequently, the droplet radius also increases with height, as observed (Nicholls 1984; Nakajima and King 1990). As it is the value of re near the cloud top that determines the cloud radiative properties seen from space (Nakajima and King 1990), it is this value which is passed to the radiation scheme. At any given time step the model only allows one cloud in the lowest five layers, and we take the liquid-water content predicted by the model to be the average water content for the cloud. Using the
INDIRECT FORCING BY SULPHATE AEROSOLS 1579
4 = 2x1,
LWC
Figure 4. Illustration of the subgrid-scale vertical profile of cloud liquid-water content (LWC) assumed in order to calculate the water-cloud droplet effective radius, re, in the GCM. / I is the grid-box mean LWC predicted by
the model and /2 is the cloud-top value used in the-calculation of re .
assumed water-content profile shown in Fig. 4, we therefore use the 'cloud top' water content, 12, to calculate re.
3. COMPARISON OF SIMULATED EFFECTIVE RADII WITH OBSERVATIONS
We consider two different factors determining the simulation of re: the effect of the different relations for obtaining the droplet number concentration, and the effect of the sulphate distribution used. Annual-means of the re distributions were obtained by conducting six one-year integrations of the GCM, one for each of the six combinations of the three N,,, parametrizations and two sulphate data sets. Climatologically varying sea surface temperatures were used as a boundary condition to simulate a climatological annual cycle of the re distribution.
(a) Parametrization of N,,, The comparison between the three methods of parametrizing N,,, is presented using
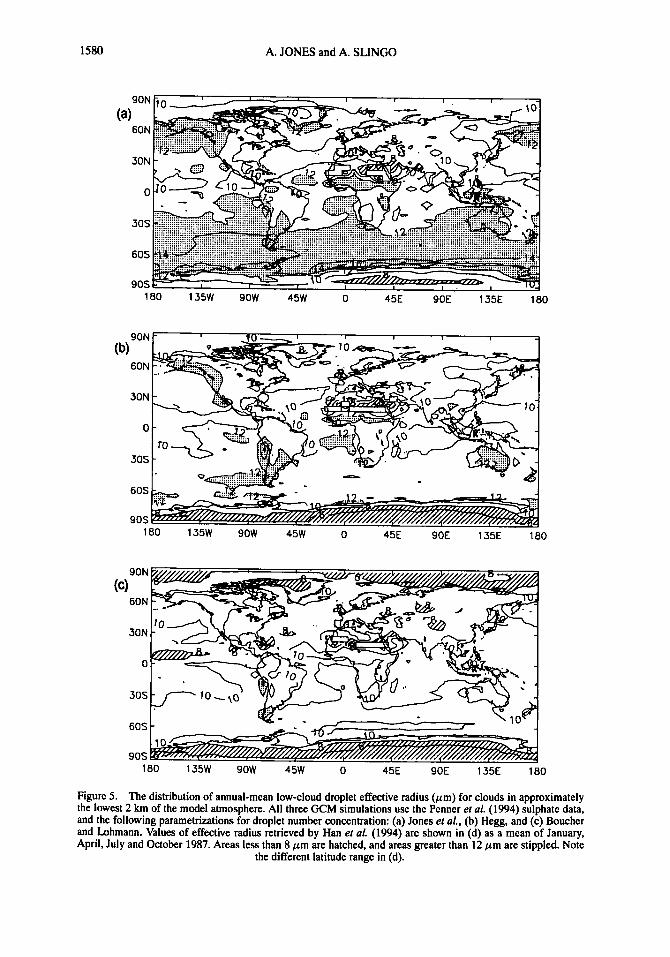
the sulphate data of Penner et al. (1994). Annual-mean distributions of low-cloud droplet re are shown in Figs. 5(a) to (c), one for each of the parametrizations. The missing-data areas are due to there being no low cloud over these regions during the course of the integrations; these areas differ slightly owing to the different evolution of the three runs. There is a noticeable correlation between these distributions and that of aerosol concentration (Fig. l), with the smaller values of re corresponding to areas of high aerosol concentration. There is a tendency for re to increase as the distance from the major northern hemisphere pollution sources increases. This tendency is supported by observations reported by Taylor and McHaffie (1994), who used data from 33 flights made by the MRF C-130 aircraft. They reported a 2.8 p m increase in re from 6.9 p m around the UK to 9.7 p m in the less polluted South Atlantic in the vicinity of Ascension Island (8"S, 14"W). The GCM simulations
1580 A. JONES and A. SLING0
(b)’ON 60N
30N
0
30s
60s
90s 45E 90E 135E 180 180 135w 9ow 45w 0
Figure 5 . The distribution of annual-mean low-cloud droplet effective radius (pm) for clouds in approximately the lowest 2 km of the model atmosphere. All three GCM simulations use the Penner ef af. (1994) sulphate data, and the following parametrizations for droplet number concentration: (a) Jones ef al., (b) Hegg, and (c) Boucher and Lohmann. Values of effective radius retrieved by Han er 01. (1994) are shown in (d) as a mean of January, April, July and October 1987. Areas less than 8 p m are hatched, and areas greater than 12 p m are stippled. Note
the different latitude range in (d).
INDIRECT FORCING BY SULPHATE AEROSOLS 1581
(d) 30N
0
30s
45E 90E 135E 180 180 135W 9Ow 45w 0
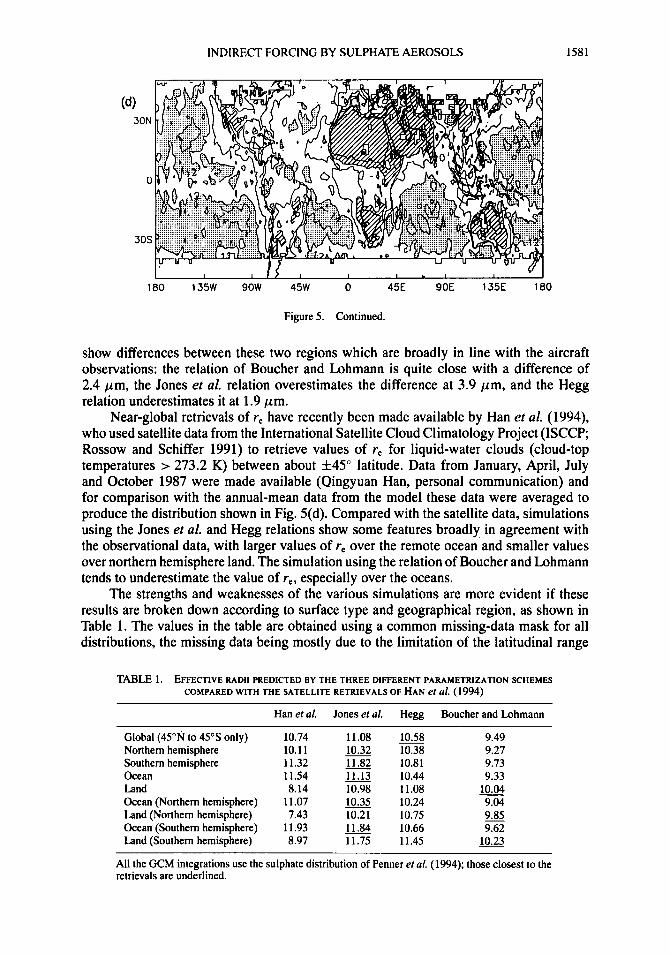
Figure 5. Continued.
show differences between these two regions which are broadly in line with the aircraft observations: the relation of Boucher and Lohmann is quite close with a difference of 2.4 pm, the Jones et al. relation overestimates the difference at 3.9 pm, and the Hegg relation underestimates it at 1.9 pm.
Near-global retrievals of re have recently been made available by Han et al. (1994), who used satellite data from the International Satellite Cloud Climatology Project (ISCCP; Rossow and Schiffer 1991) to retrieve values of re for liquid-water clouds (cloud-top temperatures > 273.2 K) between about f 4 5 " latitude. Data from January, April, July and October 1987 were made available (Qingyuan Han, personal communication) and for comparison with the annual-mean data from the model these data were averaged to produce the distribution shown in Fig. 5(d). Compared with the satellite data, simulations using the Jones et al. and Hegg relations show some features broadly in agreement with the observational data, with larger values of re over the remote ocean and smaller values over northern hemisphere land. The simulation using the relation of Boucher and Lohmann tends to underestimate the value of re, especially over the oceans.
The strengths and weaknesses of the various simulations are more evident if these results are broken down according to surface type and geographical region, as shown in Table 1. The values in the table are obtained using a common missing-data mask for all distributions, the missing data being mostly due to the limitation of the latitudinal range
TABLE 1. EFFECTIVE RADII PREDICTED BY THE THREE DIFFERENT PARAMETRIZATION SCHEMES COMPARED WITH THE SATELLITE RETRIEVALS OF HAN el a/. (1994)
Han et al. Jones et al. Hegg Boucher and Lohmann
Global (45"N to 45's only) Northern hemisphere Southern hemisphere Ocean Land Ocean (Northern hemisphere) Land (Northern hemisphere) Ocean (Southern hemisphere) Land (Southern hemisphere)
10.74 11.08 10.58 10.11 10.32 10.38 11.32 11.82 10.81 11.54 11.13 10.44 8.14 10.98 11.08
11.07 10.35 10.24 7.43 10.21 10.75
11.93 11.84 10.66 8.97 11.75 11.45
9.49 9.27 9.73 9.33 10.04
9.04 9.85
10.23 9.62
All the GCM integrations use the sulphate distribution of Penner et al. (1994); those closest to the retrievals are underlined.
1582 A. JONES and A. SLING0
of the satellite data; this unfortunately excludes those regions of highest anthropogenic sulphate emissions.
In large-scale (global and hemispheric) terms, the simulation using the relations of Jones et al. and Hegg are both very close to the observations. Over oceans the simulation using the Jones et al. relation produces values which are consistently closer to the observa- tions, and similarly over land for the simulation using the Boucher and Lohmann relation. The 'global' performance of the simulation using the Hegg relation would appear to be due to a compensation of the underprediction over ocean and the overprediction over land. The observations show that re is smaller in the more polluted northern hemisphere when com- pared with the southern, the interhemispheric difference being 1.21 pm. The simulation using the Jones et al. relation estimates a somewhat larger difference of 1.50 pm, whereas both the simulation using the Hegg relation and that using the Boucher and Lohmann relation underestimate the difference at 0.43 and 0.46 p m respectively. The observations also indicate significantly smaller values of re over land, the mean difference between land and ocean areas being 3.40 pm; none of the simulations exhibit a clear systematic difference between land and ocean regions. If only mean land and ocean values of re are considered, the simulation using the Jones et al. relation substantially underestimates the land-sea difference at 0.15 pm. However, the other two simulations have differences in the wrong sense, with mean re values larger over land than over the oceans by 0.64 p m (Hegg) and 0.71 p m (Boucher and Lohmann).
(b) Sulphate distribution The six GCM simulations were grouped into pairs which used the same parametriza-
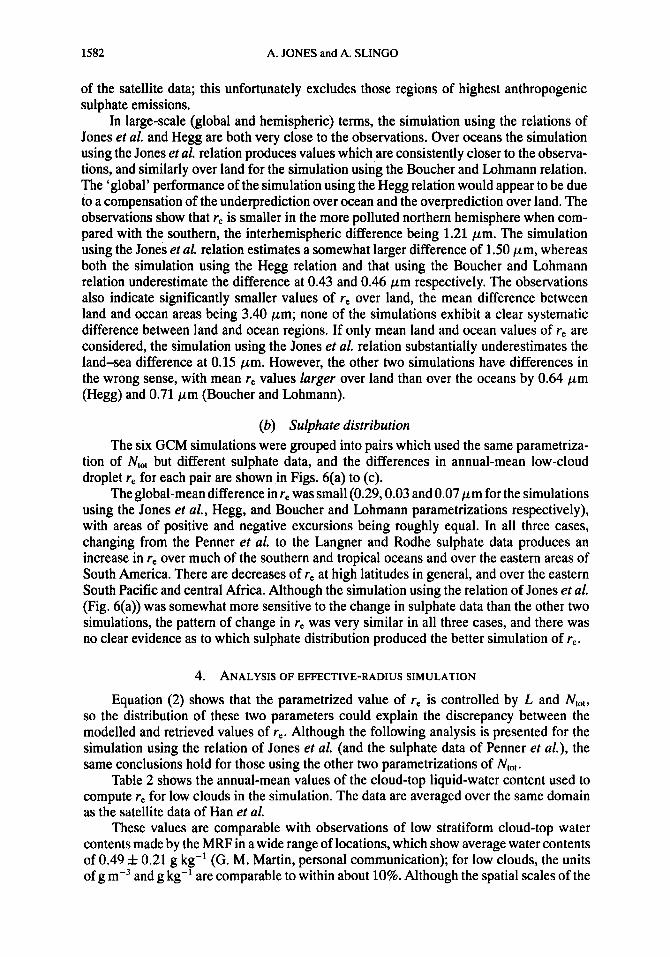
tion of N,,, but different sulphate data, and the differences in annual-mean low-cloud droplet re for each pair are shown in Figs. 6(a) to (c).
the global-mean difference in re was small (0.29,0.03 and 0.07 p m for the simulations using the Jones et al., Hegg, and Boucher and Lohmann parametrizations respectively), with areas of positive and negative excursions being roughly equal. In all three cases, changing from the Penner et al. to the Langner and Rodhe sulphate data produces an increase in re over much of the southern and tropical oceans and over the eastern areas of South America. There are decreases of re at high latitudes in general, and over the eastern South Pacific and central Africa. Although the simulation using the relation of Jones et al. (Fig. 6(a)) was somewhat more sensitive to the change in sulphate data than the other two simulations, the pattern of change in re was very similar in all three cases, and there was no clear evidence as to which sulphate distribution produced the better simulation of re.
4. ANALYSIS OF EFFECTIVE-RADIUS SIMULATION
Equation (2) shows that the parametrized value of re is controlled by L and NtOt, so the distribution of these two parameters could explain the discrepancy between the modelled and retrieved values of re. Although the following analysis is presented for the simulation using the relation of Jones et al. (and the sulphate data of Penner et al.), the same conclusions hold for those using the other two parametrizations of Ntot.
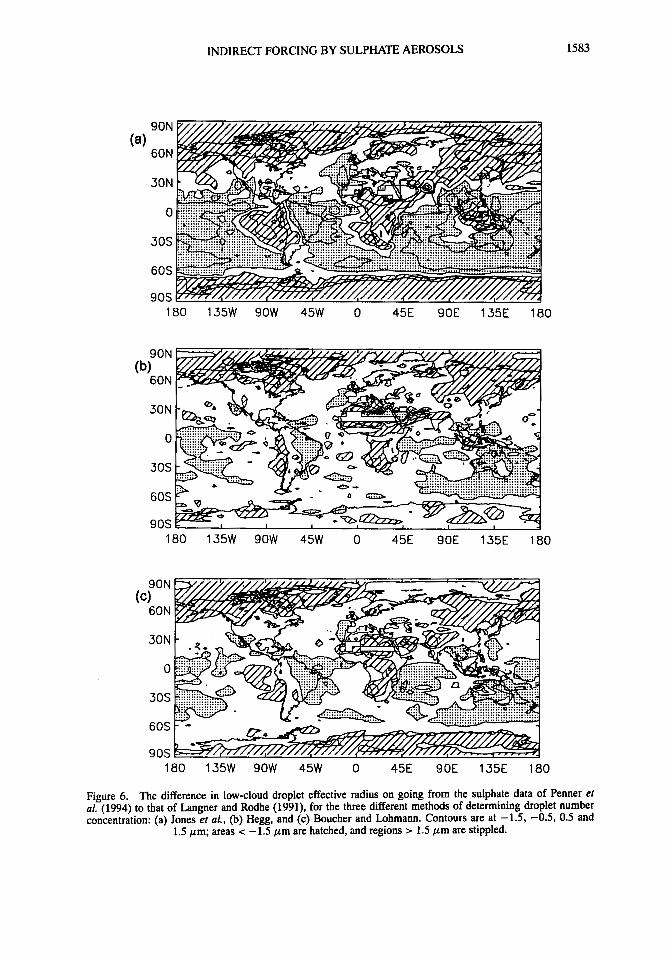
Table 2 shows the annual-mean values of the cloud-top liquid-water content used to compute re for low clouds in the simulation. The data are averaged over the same domain as the satellite data of Han et al.
These values are comparable with observations of low stratiform cloud-top water contents made by the MRF in a wide range of locations, which show average water contents of 0.49 f 0.21 g kg-' (G. M. Martin, personal communication); for low clouds, the units of g m-3 and g kg-' are comparable to within about 10%. Although the spatial scales of the
INDIRECT FORCING BY SULPHATE AEROSOLS 1583
90N
60N
30N
0
30s
60s
90s
(b)
~~
180 135W 9OW 45W 0 45E 90E 135E 180
90N
60N
30N
0
30s
60s
90s
(c)
180 135W 9OW 45W 0 45E 90E 135E 180
Figure 6. The difference in low-cloud droplet effective radius on going from the sulphate data of Penner et al. (1994) to that of Langner and Rodhe (1991), for the three different methods of determining droplet number concentration: (a) Jones et al., @) Hegg, and (c) Boucher and Lohmann. Contours are at -1.5, -0.5, 0.5 and
1.5 pm; areas < -1.5 pm are hatched, and regions > 1.5 p m are stippled.
1584 A. JONES and A. SLING0
TABLE 2. ANNUAL-MEAN VALUES OF
CLOUD TOP (g m-3) LOW-CLOUD LIQUID-WATER CONTENT AT
Total: 0.40 f 0.16 Ocean: 0.39 f 0.17 Land: 0.43 f 0.14 Northern hemisphere: 0.40 f 0.17 Southern hemisphere: 0.41 f 0.17
These values are from the integration of the GCM with the relation of Jones et al. (f one standard deviation) using the sul- phate data of Penner et al. (1994). Values are for the domain of the satellite data of Han et al. (1994).
measurements are smaller than the 100s of kilometres implied by the model resolution, the general similarity of the measurements at different locations suggests that such a comparison is meaningful. However, inspection of the modelled water contents shows that the land/sea difference is in the wrong sense to explain the systematic deviation of the GCM simulation of re from the observations, with slightly larger amounts of cloud water over land than over the ocean, which by Eq. (2) should produce larger, rather than smaller, values of re over land. The inter-hemispheric difference in water content, although in the correct sense, is far too small to account for the differences in re. It would, therefore, appear that the distribution of cloud water is not the major factor which determines the modelled distribution of re.
To consider the role of the number concentration of drops, Table 3 shows the distri- bution of N,,, simulated in the GCM run using the relation of Jones et al. broken down into land and sea areas and for each hemisphere.
TABLE 3. ANNUAL-MEAN VALUES OF CLOUD-DROPLET NUMBER CONCENTRATION ( ~ m - ~
Northern hemisphere Southern hemisphere Global ~~~ ~~
Ocean: 106.0 68.9 85.0 Land: 143.4 96.1 120.9 Total: 117.1 74.4 93.8
These values are from the integration of the GCM with the relation of Jones et al. using the sulphate data of Penner et al. (1994). Values are for the domain of the satellite data of Han et al. (1994).
The droplet concentrations over the northern and southern hemisphere oceans differ by a factor of 1.53. Given the inverse cube-root relation between N,,, and re in Eq. (2), and assuming no change in cloud-water contents, this should yield a ratio between northern and southern hemisphere oceanic re of 0.86; the ratio in the GCM is 0.87. Comparing northern and southern hemisphere land areas, the difference in N,, would be expected to change re by a factor of 0.88; the value in the model is 0.87. For the land/sea ratio, account must also be taken of the change in the value of K between land and ocean areas. In this case, the land/sea ratio in NtOt of 1.42 should yield an re ratio of 0.94, and a value of 0.99 is in fact obtained from the model, although the assumption that liquid-water content is constant is less accurate in this case, as shown in Table 2. This analysis shows that it is the distribution of N,,, which largely controls the model’s distribution of re. The large inter-hemispheric difference in droplet concentration and in the sulphate aerosol concentration which controls
300
200
8 l
E u v ., s?
100
1585
1 1 1 1 1 1 1 1 1 1 1 1 1 1 1 1 1 1 1 I I ( ~ I I I I I I I I I . I ~ . I . 1 1 1 1 ( 1 ~ ~ " L
0 100 200 300 400 500 A (cm-3)
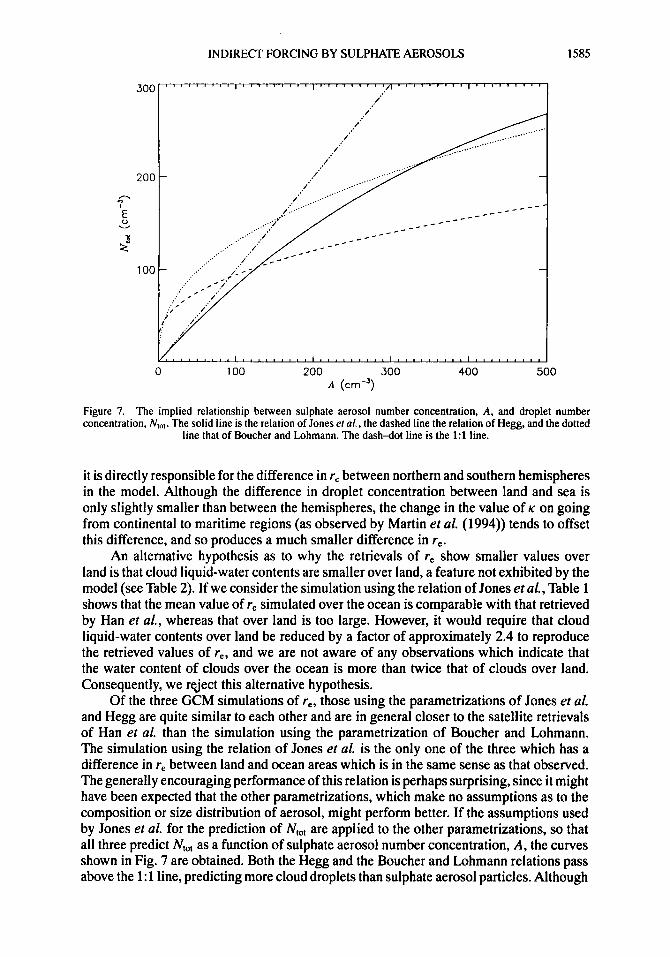
Figure 7. The implied relationship between sulphate aerosol number concentration, A, and droplet number concentration, Ntot. The solid line is the relation of Jones er al., the dashed line the relation of Hegg, and the dotted
line that of Boucher and Lohmann. The dash-dot line is the 1:l line.
it is directly responsible for the difference in re between northern and southern hemispheres in the model. Although the difference in droplet concentration between land and sea is only slightly smaller than between the hemispheres, the change in the value of K on going from continental to maritime regions (as observed by Martin et al. (1994)) tends to offset this difference, and so produces a much smaller difference in re.
An alternative hypothesis as to why the retrievals of re show smaller values over land is that cloud liquid-water contents are smaller over land, a feature not exhibited by the model (see Table 2). If we consider the simulation using the relation of Jones et al., Table 1 shows that the mean value of re simulated over the ocean is comparable with that retrieved by Han et al., whereas that over land is too large. However, it would require that cloud liquid-water contents over land be reduced by a factor of approximately 2.4 to reproduce the retrieved values of re, and we are not aware of any observations which indicate that the water content of clouds over the ocean is more than twice that of clouds over land. Consequently, we reject this alternative hypothesis.
Of the three GCM simulations of re, those using the parametrizations of Jones et al. and Hegg are quite similar to each other and are in general closer to the satellite retrievals of Han et al. than the simulation using the parametrization of Boucher and Lohmann. The simulation using the relation of Jones et al. is the only one of the three which has a difference in re between land and ocean areas which is in the same sense as that observed. The generally encouraging performance of this relation is perhaps surprising, since it might have been expected that the other parametrizations, which make no assumptions as to the composition or size distribution of aerosol, might perform better. If the assumptions used by Jones et al. for the prediction of N,,, are applied to the other parametrizations, so that all three predict N,,, as a function of sulphate aerosol number concentration, A, the curves shown in Fig. 7 are obtained. Both the Hegg and the Boucher and Lohmann relations pass above the 1:l line, predicting more cloud droplets than sulphate aerosol particles. Although
1586 A. JONES and A. SLING0
30N
0
30s
90E 135E 180 180 135W 9OW 45" 0 45E
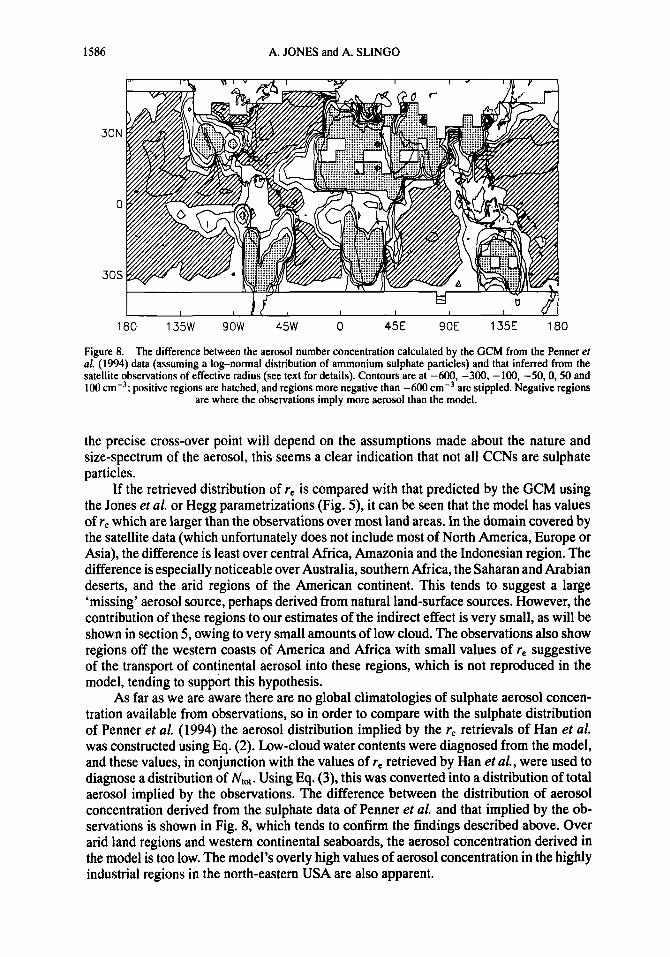
Figure 8. The difference between the aerosol number concentration calculated by the GCM from the Penner et al. (1994) data (assuming a log-normal distribution of ammonium sulphate particles) and that inferred from the satellite observations of effective radius (see text for details). Contours are at -600, -300, -100, -50,0,50 and 100 positive regions are hatched, and regions more negative than -600 cmW3 are stippled. Negative regions
are where the observations imply more aerosol than the model.
the precise cross-over point will depend on the assumptions made about the nature and size-spectrum of the aerosol, this seems a clear indication that not all CCNs are sulphate particles.
If the retrieved distribution of re is compared with that predicted by the GCM using the Jones et al. or Hegg parametrizations (Fig. 5), it can be seen that the model has values of re which are larger than the observations over most land areas. In the domain covered by the satellite data (which unfortunately does not include most of North America, Europe or Asia), the difference is least over central Africa, Amazonia and the Indonesian region. The difference is especially noticeable over Australia, southern Africa, the Saharan and Arabian deserts, and the arid regions of the American continent. This tends to suggest a large 'missing' aerosol source, perhaps derived from natural land-surface sources. However, the contribution of these regions to our estimates of the indirect effect is very small, as will be shown in section 5, owing to very small amounts of low cloud. The observations also show regions off the western coasts of America and Africa with small values of re suggestive of the transport of continental aerosol into these regions, which is not reproduced in the model, tending to support this hypothesis.
As far as we are aware there are no global climatologies of sulphate aerosol concen- tration available from observations, so in order to compare with the sulphate distribution of Penner et al. (1994) the aerosol distribution implied by the re retrievals of Han et al. was constructed using Eq. (2). Low-cloud water contents were diagnosed from the model, and these values, in conjunction with the values of re retrieved by Han et al., were used to diagnose a distribution of Ntol. Using Eq. (3), this was converted into a distribution of total aerosol implied by the observations. The difference between the distribution of aerosol concentration derived from the sulphate data of Penner et al. and that implied by the ob- servations is shown in Fig. 8, which tends to confirm the findings described above. Over arid land regions and western continental seaboards, the aerosol concentration derived in the model is too low. The model's overly high values of aerosol concentration in the highly industrial regions in the north-eastern USA are also apparent.
INDIRECT FORCING BY SULPHATE AEROSOLS 1587
5. ESTIMATION OF INDIRECT SULPHATE AEROSOL RADIATIVE FORCING
Given a simulation of present-day re which is broadly in line with observations, it is feasible to attempt to quantify the magnitude and distribution of the indirect effect of sulphate aerosols on climate. As discussed in the introduction, this is the radiative forcing caused by increases in atmospheric sulphate aerosols due to human activities, and it has been suggested that the effects of these aerosols have to some degree offset the expected warming due to increases in greenhouse gases since the beginning of the industrial era (Wigley 1991).
In order to calculate the indirect radiative forcing due to anthropogenic sulphate aerosols since pre-industrial times, it is necessary to have distributions of sulphate aerosols for both present-day and pre-industrial scenarios. These are obtained from the chemical- transport-model results of Langner and Rodhe (1991) as annual-mean distributions of sulphate loading (which are distributed in the vertical as described in section 2). The ‘present-day’ distribution is the one used in the previous sections (see Fig. l(b)). For the ‘pre-industrial’ distribution we use the distribution obtained by Langner and Rodhe when using only natural sources of sulphur. The difference between these two distributions is the anthropogenic contribution, assumed to be representative of the change in atmospheric sulphate loading since the beginning of the industrial era. In the total (present-day) distribu- tion, the anthropogenic component forms approximately 60% of the global-mean sulphate loading of 3.1 mg m-2.
In this section we build on previous GCM studies of the indirect effect (Jones et al. 1994; Boucher and Lohmann 1995). We use the three different parametrizations presented above, which link atmospheric sulphate to cloud droplet concentrations, to examine the range of estimates of the indirect forcing obtained.
To estimate the indirect effect, three one-year integrations of the GCM were run using each of the three parametrizations of NtOt; we assume that the parametrizations are valid for sulphate from purely natural sources. At every radiation time step (every 3 hours) two calls to the radiation scheme were made: the first call used the ‘natural sources only’ sulphate distribution, representing pre-industrial conditions, and the second call used the distributions of total sulphate to represent present-day conditions. Diagnostics were archived from both calls, but it was only the output from the second call, using present-day sulphate distributions, which affected the evolution of the model simulation, the first call being for diagnostic purposes only. This method essentially runs a multitude of single- time-step experiments, allowing the forcing due to switching from one sulphate data set to the other to be calculated, but not allowing any feedbacks to take place. By running the integration for a year and doing the calculations every radiation time step, both diurnal and annual cycles are sampled. The annual-mean indirect forcing is calculated as the difference in the top-of-atmosphere (TOA) reflected solar radiation between the mean of the calls using the total and those using the natural-only sulphate.
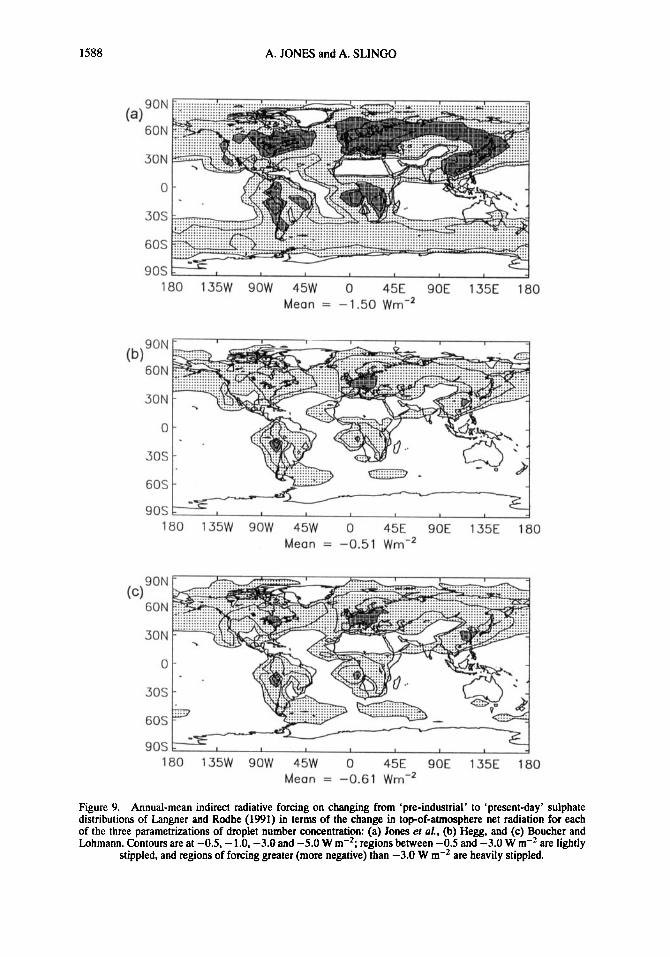
The annual-mean estimates of indirect radiative forcing due to anthropogenic sul- phate aerosols are shown in Fig. 9. Negative regions indicate areas where there has been an increase in reflected solar radiation on going from the pre-industrial to the present-day scenario. This ‘cooling’ (negative) forcing is significant when compared with the ‘warm- ing’ (positive) forcing of +2.5 W m-* due to the increases in greenhouse gases to date (IPCC 1995). The forcing is strongest in regions where there is both a large increase in aerosol (and hence a sizeable decrease in re) and where there is sufficient low cloud un- obscured by higher-level ice cloud. Thus all three simulations exhibit cooling maxima not only over the major pollution sources (see Fig. l(b)), but also in the regions of sub-tropical stratocumulus off the western continental coasts, which are generally unobscured by any
1588 A. JONES and A. SLING0
(a)90N 60N
30N
0
30s
60s
90St = , 180 135W 9 O W 45W 0 45E 90E 135E 180
Mean = -1.50 Wrn-2
180 135W 9 O W 45W 0 45E 90E 135E 180 Mean = -0.51 Wrn-’
180 135W 9OW 45W 0 45E 90E 135E 180 Mean = -0.61 Wrn-’
Figure 9. Annual-mean indirect radiative forcing on changing from ‘pre-industrial’ to ‘present-day’ sulphate distributions of Langner and Rodhe (1991) in terms of the change in top-of-atmosphere net radiation for each of the three pmametrizations of droplet number concentration: (a) Jones ef aL, (b) Hegg, and (c) Boucher and Lohmann. Contours are at -0.5, -1.0, -3.0 and -5.0 W m-’; regions between -0.5 and -3.0 W m-’ are lightly
stippled, and regions of forcing greater (more negative) than -3.0 W m-’ are heavily stippled.
INDIRECT FORCING BY SULPHATE AEROSOLS 1589
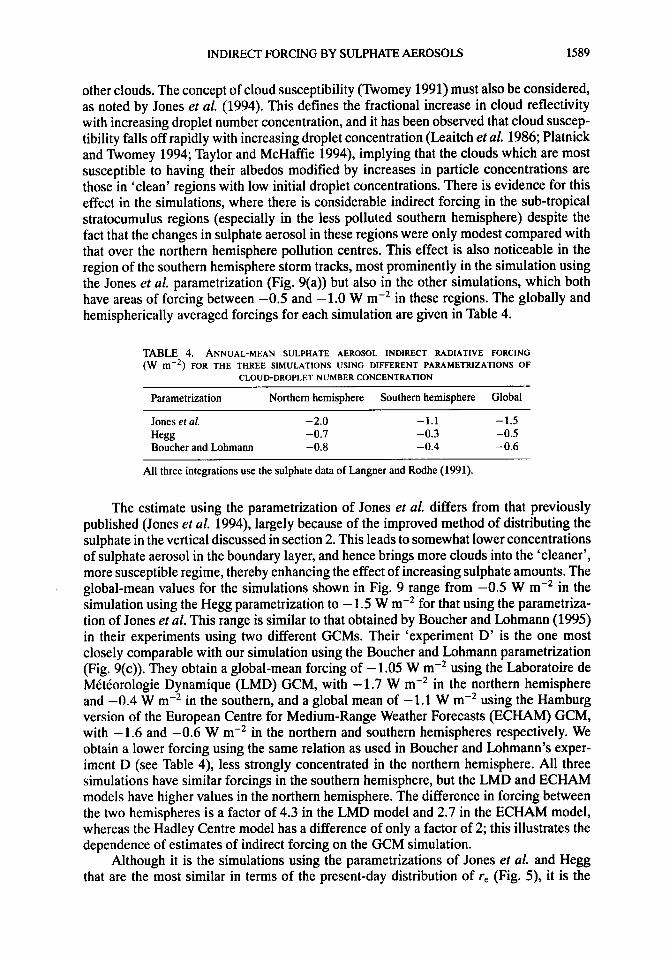
other clouds. The concept of cloud susceptibility (Romey 1991) must also be considered, as noted by Jones et al. (1994). This defines the fractional increase in cloud reflectivity with increasing droplet number concentration, and it has been observed that cloud suscep- tibility falls off rapidly with increasing droplet concentration (Leaitch et al. 1986; Platnick and Romey 1994; Taylor and McHaffie 1994), implying that the clouds which are most susceptible to having their albedos modified by increases in particle concentrations are those in ‘clean’ regions with low initial droplet concentrations. There is evidence for this effect in the simulations, where there is considerable indirect forcing in the sub-tropical stratocumulus regions (especially in the less polluted southern hemisphere) despite the fact that the changes in sulphate aerosol in these regions were only modest compared with that over the northern hemisphere pollution centres. This effect is also noticeable in the region of the southern hemisphere storm tracks, most prominently in the simulation using the Jones et al. parametrization (Fig. 9(a)) but also in the other simulations, which both have areas of forcing between -0.5 and -1.0 W m-2 in these regions. The globally and hemispherically averaged forcings for each simulation are given in Table 4.
TABLE 4. ANNUAL-MEAN SULPHATE AEROSOL INDIRECT RADIATIVE FORCING (W m-2) FOR THE THREE SIMULATIONS USING DIFFERENT PARAMETIUZATIONS OF
Parametrization Northern hemisphere Southern hemisphere Global
Jones et af. -2.0 -1.1 -1.5 Hegg -0.1 -0.3 -0.5 Boucher and Lohmann -0.8 -0.4 -0.6
CLOUDDROPLET NUMBER CONCENTRATION
All three integrations use the sulphate data of Langner and Rodhe (1991).
The estimate using the parametrization of Jones et al. differs from that previously published (Jones et al. 1994), largely because of the improved method of distributing the sulphate in the vertical discussed in section 2. This leads to somewhat lower concentrations of sulphate aerosol in the boundary layer, and hence brings more clouds into the ‘cleaner’, more susceptible regime, thereby enhancing the effect of increasing sulphate amounts. The global-mean values for the simulations shown in Fig. 9 range from -0.5 W m-2 in the simulation using the Hegg parametrization to -1.5 W m-2 for that using the parametriza- tion of Jones et al. This range is similar to that obtained by Boucher and Lohmann (1995) in their experiments using two different GCMs. Their ‘experiment D’ is the one most closely comparable with our simulation using the Boucher and Lohmann parametrization (Fig. 9(c)). They obtain a global-mean forcing of -1.05 W m-2 using the Laboratoire de MCtCorologie Dynamique (LMD) GCM, with -1.7 W m-2 in the northern hemisphere and -0.4 W m-2 in the southern, and a global mean of -1.1 W m-2 using the Hamburg version of the European Centre for Medium-Range Weather Forecasts (ECHAM) GCM, with -1.6 and -0.6 W m-2 in the northern and southern hemispheres respectively. We obtain a lower forcing using the same relation as used in Boucher and Lohmann’s exper- iment D (see Table 4), less strongly concentrated in the northern hemisphere. All three simulations have similar forcings in the southern hemisphere, but the LMD and ECHAM models have higher values in the northern hemisphere. The difference in forcing between the two hemispheres is a factor of 4.3 in the LMD model and 2.7 in the ECHAM model, whereas the Hadley Centre model has a difference of only a factor of 2; this illustrates the dependence of estimates of indirect forcing on the GCM simulation.
Although it is the simulations using the parametrizations of Jones et al. and Hegg that are the most similar in terms of the present-day distribution of re (Fig. 5), it is the
1590 A. JONES and A. SLING0
simulations using the Hegg and the Boucher and Lohmann parametrizations (Figs. 9(b) and (c)) which produce the most similar estimates of the indirect forcing. The similarities in the prediction of re are due to the similarities in the predicted values of N,,, for the most widespread values of sulphate concentration, m, (in the region of about 0.75 p g m-3) as shown in Fig. 3. However, for calculating the indirect effect, the important factor is the gradient of the relation between m and N,, over the relevant range of m. On going from the pre-industrial to the present-day scenario, the global-mean value of m in the model’s boundary layer increases from 0.32 to 0.73 p g m-3. The Hegg and the Boucher and Lohmann relations both have a lower gradient than the relation of Jones et al. over this range of m. For this approximately 130% increase in m , the Jones et al. relation predicts an increase of 110% in the number concentration of cloud droplets, whereas the other two relations predict much smaller increases of 32% and 40% for the Hegg and the Boucher and Lohmann relations respectively.
In conducting the simulations described above it is assumed that there is a corre- spondence between the concentration of sulphate aerosol and the concentration of cloud droplets. There is considerable evidence that this is the case in maritime air masses, al- though there is much debate as to the relative importance of sulphate and sea-salt aerosol in the formation of cloud droplets in remote maritime regions, especially under high wind- speed conditions (e.g. Charlson et al. 1987; Blanchard and Cipriano 1987; Latham and Smith 1990). However, the existence of a direct relation between sulphate and droplet concentrations in continental air is more doubtful (e.g. Novakov and Penner 1993). This is also suggested by the data presented in Fig. 2: there is a close relation between A and Nto, for the maritime cases, but much greater scatter for the continental data. Indeed, it could be argued that the continental droplet-concentration data in Fig. 2 do not show a correlation with aerosol concentration, especially if one neglects the three continental points on the extreme left (those with values of Nto, c 200 ~ m - ~ ) . Assuming a mean value of around 300 cm-3 arguably fits the data just as well as Eq. (3). The existence of CCN sources other than sulphate, such as nitrates and various organic sources, might be responsible for the lack of a clear relation between sulphate and droplet concentrations over continents.
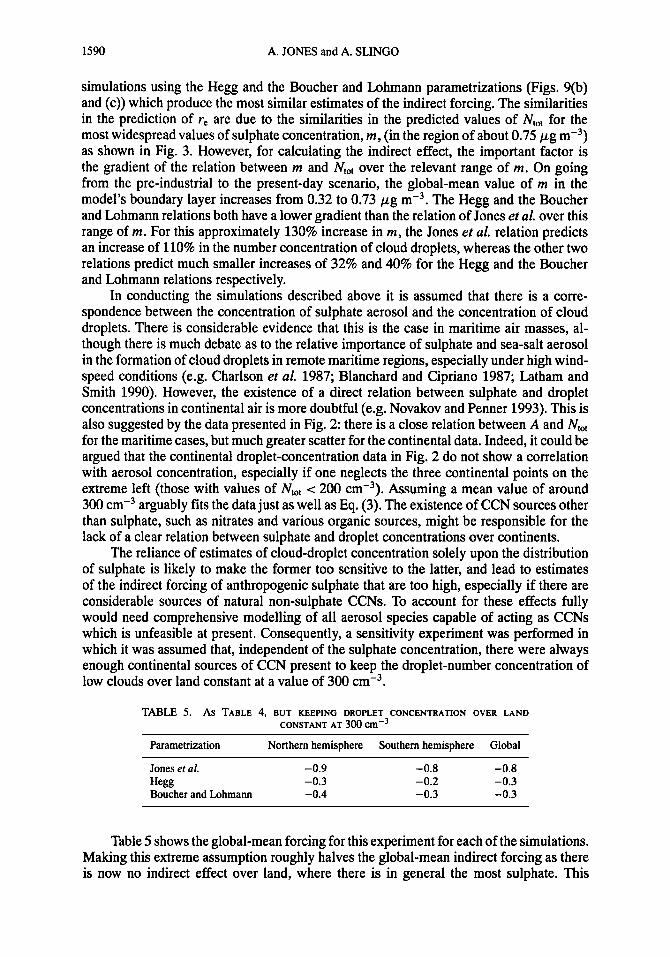
The reliance of estimates of cloud-droplet concentration solely upon the distribution of sulphate is likely to make the former too sensitive to the latter, and lead to estimates of the indirect forcing of anthropogenic sulphate that are too high, especially if there are considerable sources of natural non-sulphate CCNs. To account for these effects fully would need comprehensive modelling of all aerosol species capable of acting as CCNs which is unfeasible at present. Consequently, a sensitivity experiment was performed in which it was assumed that, independent of the sulphate concentration, there were always enough continental sources of CCN present to keep the droplet-number concentration of low clouds over land constant at a value of 300 ~ m - ~ .
TABLE 5. AS TABLE 4, BUT KEEPING DROPLET CONCENTRATION OVER LAND CONSTANT AT 300 ~ 1 1 1 1 ~
Parametrization Northern hemisphere Southern hemisphere Global
Jones et al. -0.9 -0.8 -0.8 He= -0.3 -0.2 -0.3 Boucher and Lohrnann -0.4 -0.3 -0.3
Table 5 shows the global-mean forcing for this experiment for each of the simulations. Making this extreme assumption roughly halves the global-mean indirect forcing as there is now no indirect effect over land, where there is in general the most sulphate. This
INDIRECT FORCING BY SULPHATE AEROSOLS 1591
demonstrates the sensitivity of estimates of the indirect effect to the assumptions made about the connection between sulphate aerosol and cloud-droplet number concentrations.
6. DISCUSSION AND CONCLUSIONS
Using the Hadley Centre GCM we have carried out simulations of low-cloud droplet effective radius using three different parametrizations of the relation between sulphate aerosol and cloud droplet concentrations (due to Jones et al. (1994), Hegg (1994) and Boucher and Lohmann (1995)), and using annual-mean distributions of sulphate from two different chemical-transport models (Langner and Rodhe (1991) and Penner et al. (1994)). Comparing the simulations with satellite retrievals of effective radius (Han et al. 1994) showed a sensitivity to the form of the relation chosen between sulphate and droplet concentrations, but no strong preference for either of the model sulphate distributions. Using the three different methods for determining N,,, we have estimated the indirect effect of anthropogenic sulphate aerosols to date, and obtain values in the range from -0.5 to -1.5 W m-2 in the global annual mean. If we assume that there are always sufficient aerosols present over land to provide CCNs for cloud droplets, and that the addition of anthropogenic sulphate makes no difference to the cloud droplet concentration, the range of forcing estimates is reduced to -0.3 to -0.8 W mP2. These estimates of the indirect effect of sulphate aerosols are comparable with those of their direct effect, which are in the range from -0.25 to -0.9 W m-’ (IPCC 1995).
There are problems inherent in both approaches used in this study to determine the distribution of Ntot, the method of Jones et al. being one approach, and that of Hegg and of Boucher and Lohmann being the other. The method used by Jones et al., although establishing a link between N,,, and A, is hampered by the fact that there is currently little information as to the spatial (or historical, when considering the indirect effect) dis- tribution of A. Consequently, modelled distributions of sulphate aerosol mass have been used instead, which has the obvious problem that only sulphate aerosols are represented, and various studies have shown that not all aerosols are sulphate (e.g. Novakov and Pen- ner 1993; O’Dowd and Smith 1993). The approach taken by Hegg and by Boucher and Lohmann would seem to circumvent these problems by making a direct link between N,, and sulphate mass. However, this assumes that there is such a link. The large amount of scatter in the data used by these authors, and a comparison of the simulations with the satellite retrievals of Han et al., suggest that this link is contingent at best-for example, the weak land/sea contrast in the simulations suggests that the distribution of N tot i s con- siderably underdetermined by the distribution of sulphate mass. The problem with the first approach is the necessity of using distributions of sulphate mass rather than aerosol num- ber concentration. The problem with the second is that it implicitly assumes that which is explicit in the first-the uncertain link between mass concentration and Nrot.
It seems clear that other important sources of CCNs need to be represented: the land- sea contrast in the satellite retrievals of re suggests that continental sources of CCNs other than just sulphate are responsible for the determination of the distribution of cloud droplet concentration. The very small values of re retrieved over arid regions seem to point to a source of natural land-surface aerosols, such as dust. The satellite measurements tend to suggest that continental CCNs are transported far enough away from land to affect the radiatively important regions of sub-tropical stratocumulus off the western continental coasts, a fact supported by in situ observations (Albrecht et al. 1995). How much of this ‘continental effect’ is natural and how much anthropogenic will affect the magnitude of the indirect effect of anthropogenic aerosol, as will the magnitude of natural background CCN
1592 A. JONES and A. SLING0
sources. The relative uniformity between the two hemispheres in the satellite retrievals of the effect of continents on re tends to suggest a considerable natural component.
The reliance of the validation of the re simulations largely upon a single data source, namely the satellite retrievals of Han et al., is clearly a weakness in this study. There is an urgent need for additional retrievals using independent satellite data. Ideally, such retrievals should extend to higher latitudes than those sampled by Han et al. so as to provide coverage of the regions of highest sulphate emissions. If new retrievals were to show a systematic offset in these data, then whilst our conclusions about the specific merits and demerits of the individual simulations might change, it would not alter our overall conclusions regarding other sources of CCN and the indirect effect of sulphate aerosols. However, our results might need substantial re-evaluation if any new retrievals were to show significant differences in the geographical distribution and magnitude of cloud droplet re compared with those of Han et al.
There are problems in understanding the nature of the relation between the mass concentration of sulphur, as predicted by chemical-transport models, and the number con- centration of sulphate particles. There have been widely varying estimates of how much emitted sulphur forms new particles and how much simply adheres to existing particles. For example, Langner et al. (1992) suggest that as little as 6% of anthropogenic SO2 goes to producing new particles (the physicochemical heterogeneity of many aerosol particles being a further complication). There is also the complex problem of how many of any new aerosol particles are actually capable of acting as CCNs, and how aerosol size spectra are modified by processing through clouds (e.g. Bower and Choularton 1993). These effects are important, as the assumption of an essentially linear relationship between the mass concentration of sulphate and the number concentration of sulphate aerosol (as done by Jones et al.) is a great over-simplification. The overestimation of aerosol concentrations over the northern hemisphere industrial regions in Fig. 8 implies that there is not, in fact, such a direct relation. Also, despite the model having no representation of the production of sea-salt aerosol at the ocean surface, the simulation appears to have aerosol number concentrations over the oceans which are too high in many places, even with sulphate as the only aerosol source. A better understanding of the relation between aerosol mass and number concentrations is vital to understanding the indirect effect, as the more sub-linear the relation between mass and number, the less will be the impact of the indirect effect.
The precise nature of the relation between sulphate aerosol concentration and the num- ber of cloud droplets is clearly very important, as it has been shown that two simulations which are similar in their simulation of present-day re differ markedly in their estimates of the indirect radiative effect of anthropogenic sulphate aerosols. The use of distributions of sulphate alone to infer the distribution of droplet concentration seems likely to overesti- mate the magnitude of indirect sulphate forcing, as the link between sulphate and droplet concentration seems not to apply universally, especially in continental air masses. If, as seems possible, CCNs always tend to be present ‘in excess’ in continental regions, and so droplet concentrations are approximately constant, then despite these areas being those of the highest pollution concentrations, the magnitude of anthropogenic sulphate indirect forcing will not be as large as the concentrations of sulphate in these regions might at first suggest. Indeed, it is possible that the indirect effect of sulphate in these regions might be negligible, and that the effect is present predominantly in the less polluted oceanic regions; this would have a large impact on estimates of global-mean indirect sulphate forcing, as indicated in Table 5. On the other hand, the magnitude of this amelioration of the indirect effect of sulphate depends in part on how much of the non-sulphate continental CCNs are themselves anthropogenic, and how much are natural ‘background’-there might still be considerable anthropogenic forcing, but not necessarily due just to sulphate.
INDIRECT FORCING BY SULPHATE AEROSOLS 1593
There is a need for further research in many areas, encompassing many of the points raised above, if estimates of the indirect effect are to be refined from current estimates, which in this study are in the range from -0.5 to -1.5 W m-* if assuming a direct link between sulphate and droplet concentration, and from -0.3 to -0.8 W m-* if assuming a constant droplet concentration over land. Of equal importance is improving GCM sim- ulations of low-level, particularly stratiform, clouds, which are strongly influenced by the indirect effect. To enable better treatment of anthropogenic effects on cloud microphysics in climate models requires a better understanding of some of these complex questions. Improved simulations of cloud droplet re will require more detailed knowledge of the na- ture and distribution of the CCN population, and how that is related to both natural and anthropogenic aerosol sources. This will require a considerable inter-disciplinary effort, both in modelling and in observations, to bring together both the chemical and physical processes which interact to produce aerosols and CCNs.
ACKNOWLEDGEMENTS
We would like to thank Qingyuan Han, Henning Rodhe and Joyce Penner for making their data available to us; and also Gill Martin of the MRF, and Tom Choularton and Keith Bower of the University of Manchester Institute of Science and Technology, fot much helpful information and discussion. This work was supported by the UK Department of the Environment under contract PECD 7/12/37.
Albrecht, B. A.
Albrecht, B. A,, Bretherton, C. S., Johnson, D. W., Schubert, W. H. and Frisch, A. S.
d’Almeida, G. A., Koepke, P. and Shettle, E. P.
Berresheim, H., Eisele, F. L., Tanner, D. J., Mclnnes, L. M., Ramsey-Bell, D. C. and Covert, D. S.
Blanchard, D. C. and Cipriano, R. J. Boucher, 0. and Lohmann, U.
Bower, K. N. and Choularton, T. W.
Braham, R. R. Cess. R. D. and 31 others
Charlson, R. J., Lovelock, J. E., Andreae, M. 0. and Warren, S. G.
Hales, J. M., Cess, R. D., Coakley, J. A., Hansen, J. E. and Hofman, D. J.
Charlson, R. J., Schwartz, S. E.,
Cullen, M. J. P. Gregory, D.
REFERENCES 1989
1995
Aerosols, cloud microphysics, and fractional cloudiness. Science,
The Atlantic stratocumulus transition experiment-ASTEX. Bull. 245,1227-1230
Am. Meteorol. Soc., 76,889-904
1991
1993
Atmospheric aerosols: global climatology and radiative charac- teristics. Deepak, Hampton, Virginia, USA
Atmospheric sulfur chemistry and cloud condensation nuclei (CCN) concentrations over the northeastern Pacific coast. J. Geophys. Res., 98,12701-12711
1987 1995
1992
1993
Biological regulation of climate. Nature, 330,526 The sulfate-CCN4oud albedo effect: A sensitivity study with
two general circulation models. Tellus, 47B, 281-300 A parametrisation of the effective radius of ice free clouds for use
in global climate models. Amos. Res., 27,305-339 Cloud processing of the cloud condensation nucleus spectrum and
its climatological consequences. Q. J . R. Meteorol. SOC., 119, 655-679
CCN spectra in C-k space. J. Atmos. Sci., 33,343-345 Intercomparison and interpretation of climate feedback processes
in 19 atmospheric general circulation models. J. Geophys. Res., 95,16601-16615
Oceanic phytoplankton, atmospheric sulphur, cloud albedo and climate. Nature, 326,655661
1976 1990
1987
1992 Climate forcing by anthropogenic aerosols. Science, 255,423430
1993 1995
The unified forecast/climate model. Meteorol. Mag., 122,81-94 A consistent treatment of the evaporation of rain and snow for use
in large-scale models. Mon. Weather Rev., 123,2716-2732
1594 A. JONES and A. SLING0
Han. Q., Rossow, W. B. and
Hansen, J. E. and Travis, L. D.
Harrison, E. F., Minnis, P., Barkstrom, B. R., Ramanathan, V., Cess, R. D. and Gibson, G. G.
Lacis, A. A.
Hartmann, D. L.
Hegg, D. A.
Hegg, D. A,, Radke, L. F. and
Hegg, D. A,, Ferek, R. J. and
Hobbs, P. V.
Hobbs, P. V.
IPCC (Intergovernmental Panel on Climate Change)
Jones, A., Roberts, D. L. and
Kaufman, Y. J. and Chou, M.-D.
Kiehl, J. T.
Slingo, A.
Kiehl, J. T. and Briegleb, B. I?
Langner, J. and Rodhe, H.
Langner, J., Rodhe, H., Crutzen, P. J. and Zimmermann, P.
Latham, J. and Smith, M. H.
Leaitch, W. R., Strapp, J. W. and
Leaitch, W. R., Isaac, G. A., Hudson, J. G.
Strapp, J. W., Banic, C. M. and Wiebe, H. A.
Spice, A. Martin, G. M., Johnson, D. W. and
Nakajima, T. and King, M. D.
Nicholls, S.
Novakov, T. and Penner, J. E.
O’Dowd, C. D. and Smith, M. H.
Penner, J. E., Atherton, C. S. and Graedel, T. E.
1994
1974
1990
1993
1994
1991
1993
1990
1995
1994
1993
1994
1993
1991
1992
1990
1986
1992
1994
1990
1984
1993
1993
1994
Near-global survey of effective droplet radii in liquid water clouds
Light scattering in planetary atmospheres. Space Sci. Rev., 16, using ISCCP data. J. Climate, 7,475497
527610 Seasonal variation of cloud radiative forcing derived from the Earth
Radiation Budget Experiment. J. Geophys. Res., 95,18687- 18703
‘Radiative effects of clouds on Earth’s climate’. Pp. 151-173 in Aerosol-cloud-climate interactions. Ed. P. V. Hobbs. Aca- demic Press, San Diego
Cloud condensation nucleus-sulfate mass relationship and cloud albedo. J. Geophys. Res., 99,25903-25907
Measurements of Aitken nuclei and cloud condensation nuclei in the marine atmosphere and their relation to the DMS-cloud- climate hypothesis. J. Geophys. Res., 96,18727-18733
Light scattering and cloud condensation nucleus activity of sul- fate aerosol measured over the northeast Atlantic Ocean. J. Geophys. Res., 98,14887-14894
Climate change: The IPCC scientific assessment. Eds. J. T. Houghton, G. J. Jenkins and J. J. Ephraums. Cambridge Uni- versity Press
Climate change 1994: Radiative forcing of climate change and an evaluation of the IPCC IS92 emission scenarios. Eds. J. T. Houghton, L. G. Meira Filho, J. Bruce, Hoesung Lee, B. A. Callander, E. Haites, N. Harris and K. Maskell. Cam- bridge University Press
A climate model study of indirect radiative forcing by anthro- pogenic sulphate aerosols. Nature, 370,450-453
Model simulations of the competing climatic effects of SO2 and C02. J. Climate, 6,1241-1252
Sensitivity of a GCM climate simulation to differences in conti- nental versus maritime cloud drop size. J. Geophys. Res., 99,
The relative roles of sulfate aerosols and greenhouse gases in cli- mate forcing. Science, 260,311-314
A global three-dimensional model of the tropospheric sulfur cycle. J. Amos. Chem., 13,225-263
Anthropogenic influence on the distribution of tropospheric sul- phate aerosol. Nature, 359,712-716
Effect on global warming of wind-dependent aerosol generation at the ocean surface. Nature, 347,372-373
Cloud droplet nucleation and cloud scavenging of aerosol sulphate in polluted atmospheres. Tellus, 38B, 328-344
The relationship between cloud droplet number concentrations and anthropogenic pollution: observations and climatic implica- tions. J. Geophys. Res., 97,2463-2474
The measurement and parametrisation of effective radius of droplets in warm stratocumulus clouds. J. Atmos. Sci., 51, 1823-1842
Determination of the optical thickness and effective particle radius of clouds from reflected solar radiation measurements. Part I: Theory. J. Atmos. Sci., 47,1878-1893
The dynamics of stratocumulus: Aircraft observations and com- parisons with a mixed-layer model. Q. J. R. Meteorol. SOC., 110,783420
Large contribution of organic aerosols to cloud-condensation- nuclei concentrations. Nature, 365,823-826
Physicochemical properties of aerosols over the northeast Atlantic: Evidence for wind-speed-related submicron sea-salt aerosol production. J. Geophys. Res., 98,1137-1 149
‘Global emissions and models of photochemically active com- pounds’. Pp. 223-248 in Global amospheric-biospheric chemistry. Ed. R. Prinn. Plenum, New York
23107-231 15
INDIRECT FORCING BY SULPHATE AEROSOLS 1595
Platnick, S. E. and 'homey, S.
Pruppacher, H. R. and Nett, J. D. Quinn, P. K., Covert, D. S.,
Bates, T. S., Kapustin, V. N., Ramsey-Bell, D. C. and Mclnness, L. M.
Rossow, W. B. and Schiffer, R. A. Schwartz, S. E. and Slingo, A.
Slingo, A.
Slingo, A., Brown, R. and Wrench, C. L.
Smith, R. N. B.
Taylor, J. P. and McHaffie, A.
'homey, S. 'homey, S. A. 'homey, S. A., Piepgrass, M. and
Van Dingenen, R., Raes, F. and Wolfe, T. L.
Jensen, N. R.
Wigley, T. M. L.
1994
1978 1993
1991 1996
1989
1990
1982
1990
1994
1991 1974 1984
1995
1991
Determining the susceptibility of cloud albedo to changes in droplet concentration with the Advanced Very High Reso- lution Radiometer. J. Appl. Meteorol., 33,334-347
Microphysics of clouds and precipitation. D. Reidel, Dordrecht Dimethylsulfide/cloud condensation nuclei/climate system: Rele-
vant size-resolved measurements of the chemical and physical properties of the atmospheric aerosol particles. J. Geophys. Rex, 98,10411-10427
ISCCP cloud data products. Bull. Am. Meteorol. SOC., 72,2-20 'Enhanced shortwave cloud radiative forcing due to anthropogenic
aerosols'. Pp. 191-236 in Clouds, chemistry andclimate. Eds. P. J. Crutzen and V. Ramanathan, NATO AS1 Series, Vol. 135. Springer-Verlag, Berlin
A GCM parametrization for the shortwave radiative properties of water clouds. J. Atmos. Sci., 46, 1419-1427
Sensitivity of the Earth's radiation budget to changes in low clouds. Nature, 343,49-51
A field study of nocturnal stratocumulus: 111. High resolution ra- diative and microphysical observations. Q. J. R. Mereorol.
A scheme for predicting layer clouds and their water content in a general circulation model. Q. J. R. Meteorol. SOC., 116,435- 460
Measurements of cloud susceptibility. J. Amos. Sci., 51, 1298- 1306
Aerosols, clouds and radiation. Atmos. Environ., 25,2435-2442 Pollution and the planetary albedo.Ahos. Environ., 8,1251-1256 An assessment of the impact of pollution on global cloud albedo.
Tellus, 36B, 356-366 Evidence for anthropogenic impact on number concentration and
sulphate content of cloud-processed aerosol particles over the North Atlantic. J. Geophys. Res., 100,21057-21067
Could reducing fossil-fuel emissions cause global warming? Na- ture, 349,503-506
SOC., 108,145-165
Related Documents

![Aluminium Sulphate[1]](https://static.cupdf.com/doc/110x72/563db7b2550346aa9a8d1fe5/aluminium-sulphate1.jpg)