Journal of Accounting and Finance in Emerging Economies Vol 4, No 1, June 2018 47 Volume and Issues Obtainable at Center for Sustainability Research and Consultancy Journal of Accounting and Finance in Emerging Economies ISSN: 2519-0318ISSN (E) 2518-8488 Volume 4: Issue 1June 2018 Journal homepage: www.publishing.globalcsrc.org/jafee Predicting Bankruptcy Using Z-Score and Z Double Prime (Z”): A Study of Pakistan Stock Exchange 1 Sadia Irshad, 2 Maria Shams Khakwani, 3 Azka Qureshi, 4 Irum Saba, 5 Sadia Ishaque 1 Assistant Professor, Institute of Management Sciences, The Women University, Multan, Pakistan [email protected] 2 Lecturer, Institute of Management Sciences, The Women University, Multan, Pakistan [email protected] 3 MS Scholar, Department of Business Administration, Air University Multan Campus, Pakistan [email protected] 4 Assistant Professor, IBA Karachi, Pakistan. [email protected] 5 Lecturer, Department of Business Administration, Air University Multan Campus, Pakistan [email protected] ARTICLEDETAILS ABSTRACT History Revised format: May 2018 Available online: June 2018 Due to the unprecedented happenings and dynamic conditions of international economic system, firms are always at the verge of bankruptcy no matter how sound they are, their sustainability is always in jeopardy. Besides, lenders are continuously raising red flags and giving consistent warnings about possible perils of corporate failure due to fragile economic conditions and increasing debt levels in both corporate and individual businesses these days. Hence there was an exigency to „develop indicators for monitoring long term progress and sustainability of companies. Thereof it would contribute in illustrating to business analysts, firm stakeholders about the relevance of embracing these active checks for predicting bankruptcy as a sustainable business practice. This created a bizarre cult to look into the matter seriously. For this there is no mantra, no clever feats, sure-fire quick strategies. Instead there are well- defined, simple, systematic and sophisticated models to assess sustainability of companies. Thus, to avoid the tide of massive/substantial corporate failure and any future catastrophe; there is a dire need to identify the most suitable and preeminent model that can truly forecast the likelihood of default ahead of time in given circumstances. And, mainstay of this study is to provide an answer of question in hand by comparing two most venerable model choices i.e. Altman‟s Z-score and Z double prime (Z”). © 2018 The authors, under a Creative Commons Attribution-Non Commercial 4.0 Keywords Financial Sustainability, Bankruptcy, Z-Score, Z”, Financial distress JEL Classification: Q56,G33,G10 Corresponding author‟s email address: [email protected] Recommended citation: Irshad, S., Khakwani, M.S., Qureshi, A., Saba, I., Ishaque, S. (2018). Predicting Bankruptcy Using Z-Score and Z Double Prime (Z”): A Study of Pakistan Stock Exchange. Journal of Accounting and Finance in Emerging Economies, 4(1) 47-62 DOI: 10.26710/jafee.v4i1.344 1. Introduction A corporation‟s main aspiration is to setup a lucrative business for its shareholders. In today‟s world where business failure is an inescapable phenomenon experienced in both developed and developing countries, the ingenuity of maintaining sustainability is something that must be inquired from today‟s successful businesses. Since the last decade businesses are failing at an ever-alarming rate. According to figures by US Census Bureau of Labor Statistics in 2015, every year there are only 400,000

Welcome message from author
This document is posted to help you gain knowledge. Please leave a comment to let me know what you think about it! Share it to your friends and learn new things together.
Transcript
Journal of Accounting and Finance in Emerging Economies Vol 4, No 1, June 2018
47
Volume and Issues Obtainable at Center for Sustainability Research and Consultancy
Journal of Accounting and Finance in Emerging Economies ISSN: 2519-0318ISSN (E) 2518-8488
Volume 4: Issue 1June 2018
Journal homepage: www.publishing.globalcsrc.org/jafee
Predicting Bankruptcy Using Z-Score and Z Double Prime (Z”): A Study of
Pakistan Stock Exchange
1Sadia Irshad,
2Maria Shams Khakwani,
3Azka Qureshi,
4Irum Saba,
5Sadia Ishaque
1Assistant Professor, Institute of Management Sciences, The Women University, Multan, Pakistan
2Lecturer, Institute of Management Sciences, The Women University, Multan, Pakistan
[email protected] 3MS Scholar, Department of Business Administration, Air University Multan Campus, Pakistan
[email protected] 4Assistant Professor, IBA Karachi, Pakistan. [email protected]
5Lecturer, Department of Business Administration, Air University Multan Campus, Pakistan
ARTICLEDETAILS ABSTRACT
History
Revised format: May 2018
Available online: June 2018
Due to the unprecedented happenings and dynamic conditions of
international economic system, firms are always at the verge of
bankruptcy no matter how sound they are, their sustainability is always in
jeopardy. Besides, lenders are continuously raising red flags and giving
consistent warnings about possible perils of corporate failure due to
fragile economic conditions and increasing debt levels in both corporate
and individual businesses these days. Hence there was an exigency to
„develop indicators for monitoring long term progress and sustainability
of companies. Thereof it would contribute in illustrating to business
analysts, firm stakeholders about the relevance of embracing these active
checks for predicting bankruptcy as a sustainable business practice. This
created a bizarre cult to look into the matter seriously. For this there is no
mantra, no clever feats, sure-fire quick strategies. Instead there are well-
defined, simple, systematic and sophisticated models to assess
sustainability of companies. Thus, to avoid the tide of massive/substantial
corporate failure and any future catastrophe; there is a dire need to
identify the most suitable and preeminent model that can truly forecast the
likelihood of default ahead of time in given circumstances. And, mainstay
of this study is to provide an answer of question in hand by comparing
two most venerable model choices i.e. Altman‟s Z-score and Z double
prime (Z”).
© 2018 The authors, under a Creative Commons Attribution-Non
Commercial 4.0
Keywords
Financial Sustainability,
Bankruptcy, Z-Score, Z”,
Financial distress
JEL Classification:
Q56,G33,G10
Corresponding author‟s email address: [email protected]
Recommended citation: Irshad, S., Khakwani, M.S., Qureshi, A., Saba, I., Ishaque, S. (2018). Predicting
Bankruptcy Using Z-Score and Z Double Prime (Z”): A Study of Pakistan Stock Exchange. Journal of
Accounting and Finance in Emerging Economies, 4(1) 47-62 DOI: 10.26710/jafee.v4i1.344
1. Introduction
A corporation‟s main aspiration is to setup a lucrative business for its shareholders. In today‟s world
where business failure is an inescapable phenomenon experienced in both developed and developing
countries, the ingenuity of maintaining sustainability is something that must be inquired from today‟s
successful businesses. Since the last decade businesses are failing at an ever-alarming rate. According
to figures by US Census Bureau of Labor Statistics in 2015, every year there are only 400,000
Journal of Accounting and Finance in Emerging Economies Vol 4, No 1, June 2018
48
businesses which shows a sustainable portfolio whereas the failures are 470,000. Thus, it is pretty
much obvious that there are not as much of businesses that show a sustainability portfolio than the
ones that confront failures around the whole corner. This figure seems just too scary. Pakistan being a
developing country is very instable from both political and economic perspectives and thus a
deteriorating sustainability profile of businesses is being observed there. This tremendous fall in the
sustainability profile of businesses is due to the fierce competition among companies in market place
followed by economic downturn. Financial chaos of 2008 has also made a sizeable contribution in
throwing the firms out of business. Thus, these corporate scandals and substantial failures during last
decennium have initiated an extended and deepened research on developing indicators for assessing
the sustainability of businesses. Even companies now are more proactive and likelier to adopt such
measures that may help them in ensuring the sustainability of their companies. Thus far, much
emphasis has been given to the significance of bankruptcy prediction models for tracking
sustainability of companies, hence, to discern and pore over timely signals to the nervous lenders and
other stakeholders looking for any sign of financial distress. These models for forecasting financial
distress has potential to assess the sustainability profile of companies and their likelihood of
bankruptcy in near future.
Assessing the financial stability of a company is always a prime concern for accounting executives,
business analysts, prospective investors etc. because there are enormous corollaries for both internal
and external customers in case of financial distress of a company. Bankruptcy seems to be a big
concern for them as they are very much interested in figuring out the ins and outs of investment and to
keep track about the near future and sustainability of the firm they are eyeing to invest. Bankruptcy is
not something which immediately happen rather it is followed by a series of events. So, to be
bankrupt, a firm must be in financial distress in first place. Financial distress is actually a term of
corporate finance and is primarily used to give “early warning” to companies prior to default and,
hence, it may be very meaningful for those who wish to protect their stakes in company. Four generic
terms stated in literature by Altman and Hotchkiss (2006) to define financial distress are failure,
default, insolvency and bankruptcy Failure happens to be when the rate of return realized on capital
invested is considerably low than that on the same investments. Failure happens when the rate of
return realized on capital invested is considerably low than the rate prevailing on the similar
investments. And when average return is not adequate to cover cost of capital, firm is said to be
financially distressed. Default is another term akin to financial distress. It exists between debtor and
creditor when interest or principal amount is not paid within prescribed time. A more technical term
mentioned in this regard is insolvency. It is a situation in which firm is unable to maintain its liquidity
and to fulfill its promises, hence, ranked as financially distressed. And the last term associated with
distress is bankruptcy which is transpired when the net worth of firm‟s assets is not more than its total
liabilities. It is a set going process borne by a company for its inability to pay the claims.
Thus, bankruptcy prediction has turned out to be an eminent research topic after Beaver (1966) and
Altman (1968) have employed financial ratios for predicting bankruptcy. Owing to this, a wide suite
of models with their respective strengths and weaknesses (Adnan & Humayon, 2006) have emerged
till date and none of them is superior to other. Therefore, despite of the availability of contemporary
options, in this study Grandfather of all i.e. „Altman‟s Z-score‟ and modified Z-score called Z double
prime Z” is used. It is also all the way different from the remaining studies because no direct
comparison has been cited between these two existing models of Multivariate Discriminant Analysis
MDA in case of Pakistan. It is actually the pioneer model of its type i.e. multivariate discriminant
analysis. It not only aids/assists in evaluating and measuring financial health of firm but serves as a
diagnostic tool too for assessing sustainability prior to distress. The purpose of this research is to test
the reliability of ratios provided in Altman Z-score model and to use these ratios in discriminating
between financially distressed and healthy companies. It is also aimed to figure out the financial
indicator which contributes the most in assessing sustainability, apart from those previously proved. It
will help the firms in shifting the focus of their efforts on that very indicator so to minimize the
chances of potential default instead of wasting their efforts on least effective indicator.
Precisely, the salient objectives of this research are;
1. To give prominence to the need of assessing the overall sustainability of firm prior to any
looming collapse.

Journal of Accounting and Finance in Emerging Economies Vol 4, No 1, June 2018
49
2. To test whether the model has ability to forecast future events with same level of accuracy
aforementioned in native study as a statistical evidence (to test whether it overstates or
understates the results).
3. To figure out how well the financial stability of a company can be measured vis-a-vis financial
ratios used in Z-score and Z” model.
4. And to figure out the financial ratio that has the detrimental effect in leading towards
bankruptcy and that can be worked onto minimizing the bankruptcy risk.
Section 2 discusses prior literature relevant to this study. Section 3 describes the research methodology
to employ Altman‟s model. Section 4 provides the data analysis and the final section 5 examines the
findings i.e. whether or not Z-score & Z” model truly predict bankruptcy.
2. Literature Review
Studies regarding the use of financial data and accounting numbers to analyze performance dates back
to couple of years ago (E.I Altman & Edith Hotchkiss, 2006). The growing repercussions of business
failure on economies worldwide, sparked more deepened, aggressive and dedicated researches in this
domain to construct more advanced, sophisticated and powerful statistical models for forecasting
bankruptcy and assessing sustainability. The upshot of all this was explosion of wide suite of
statistical modelling techniques like Logit Analysis; LA (Ohlson, 1980), Probit Analysis; PA
(Zmijewski, 1984), Recursive Partitioning Algorithms; RPA (Quinlan, 1986) and Artificial Neural
networks; ANN (Odom and Sharda, 1990) each having its explicit assumptions and specific
computational complexities. Some of them are either too confined or some are too outmoded in their
forecasting ability but they also have their respective strengths and weaknesses as well (Adnan &
Humayon, 2006). However, this paper doesn‟t contain an exhaustive list of all subsequent studies
made in this field except a few along with modelling techniques that are familiarized till date and are
also discussed in the later section.
2.1. Univariate Analysis
The first ever classical approach in this ratio analysis was made by Beaver, W. H. (1966). He used
almost 30 ratios, categorizes them into a group of 6 and figured out that cash flow to debt ratio is most
appropriate (Cuvakhin & Gertmenian, 2003). However, the shortcoming of his work was rooted in the
type of analysis itself i.e. univariate analysis. It only accounts for single ratio at a time, so results may
be vague and biased for not incorporating all ratios simultaneously. Furthermore, a single ratio can
never truly reflect the overall financial status of firm. Besides this boundary values were assigned for
post failure i.e. financial status of firm is misclassified always. Its limitations were realized later and
there was a need to introduce a more complicated set of ratios with greater empirical applications,
maximum accuracy and improved predictive ability.
2.2. Multivariate Discriminant Analysis
Multi discriminant analysis is another approach to calculate bankruptcy. It is a statistical technique
very much analogous to regression analysis. By means of its multiple measurements can be aggregated
to produce composite score called discriminant score, and, this discriminant score is calculated by
means of regression equation called discriminant function that further helps to differentiate between
two priori groups. Shortly, the objective of this multivariate technique is to maximally differentiate a
sample of firms into dichotomous distinct dimensions. Here this discriminant function turns out as;
Z= a + b1(X1) + b2(X2) +…. + bn(Xn)
Here; Z is discriminant score or Z-score, a is constant and b1 and b2 are discriminant coefficient and
implies effect of x1 and x2 on chances of firm to become bankrupt, where x1 and x2 are independent
variables or predictors.
2.2.3. Z-Score & Z” model
Though Beaver‟s work was a failure but it paved the way for others to follow. Following his footsteps,
Altman, E.I. (1968) just did that. He defied the worth of univariate analysis and introduces a more
successful and sophisticated model called „Z-score model‟ which outperformed the former one. He
exploited 22 different financial ratios to 66 firms and categorizes them into a list of 5 variables or

Journal of Accounting and Finance in Emerging Economies Vol 4, No 1, June 2018
50
ratios i.e. profitability, solvency, liquidity, sales activity and financial leverage but he did this via
multivariate discriminant analysis (MDA).
This approach was used first ever by eponymous Altman, E.I., (1968) and the model thus evolved
gives the best yield of its times in classifying the firms into priori groups, distressed and non-
distressed, and it can correctly forecast the company‟s sustainability with up to 90% accuracy prior to
one year of default, with 86% accuracy prior to two years and this percentage drops out sharply with
longer horizons (1968).
Despite of gaining so much popularity, the Z-score model devised previously, only holds for publicly
listed companies and industrial firms (manufacturing and construction) (Taffler, 1983) not for the non-
listed companies and manufacturing firms (Chuvakhin & Gertmenian, 2003). So, after realizing the
defects inherent in his model, Altman make adjustments in his original model to accommodate above
mentioned companies as well and came up with a more refined model called Z” model (Altman,
1995). The revised model only accounts for the first four ratios i.e. the ratio of Sales/Total (X5) was
dropped out and the weights to rest of the four ratios were objectively reassigned. Due to this update,
only its predictive ability increased to 94% prior to a year of default as compared to 90% in original Z-
score.
2.3. Conditional Probability Models
In early 1980‟s, MDA technique was substituted by other techniques like Logit analysis (LA) (Ohlson,
1980), Probit analysis (PA) (Zmijewski, 1984) etc. Hillegeist, S. A. (2004) underlines that, two
econometric impediments were there in Ohlson logit model. Sample selection bias for incorporating
one non-random observation for every single bankrupt company is first one. And second is the
inability to account for the time variations and associated bankruptcy risk that it reflects. Probit
Analysis (Zmijewski, 1984) was not proficient in assessing failure in small private enterprises. So,
both of these were not much promising approaches and were not adopted much.
2.4. Recursive partitioning algorithm (RPA)
Recursive partitioning algorithm (RPA) is another statistical technique in which non-parametric
sampling is used. Nevertheless, due to two limitation of RPA one being a forward selection method
whereas other is partitioning process continuation, its use in predicting bankruptcy is minimum [14].
2.5. Artificial Neural Network (ANN)
The most popular approach among intelligent techniques is probably neural networks (Demyanyk &
Hasan, 2010). It by means of an algorithm which imitates the biological neural networks of human
nervous system That is, it is a network of interconnected neurons just like in human nervous system
and they are called artificial neurons. In contrast to statistical techniques, this technique has two
unique advantages. The very first is, being non-parametric it has no underlying assumptions unlike in
statistical techniques. Other is that, it relies on non-linear approaches consequently its possibilities for
testing complex data patterns are widespread. However, the downside of model that render it non-
useful is that it is very responsive towards cyclical or temporal economic changes, this makes their
interpretation very difficult (Paliwal & Kumar, 2009).
2.6. Revisiting Z-Score
Among many studies on the application of models, one is conducted by Ijaz, M. S., Hunjra, A. I.,
Hameed, Z., & Maqbool, A. [16] to ascertain the likelihood of failure in listed companies of Pakistan
who were a part of sugar industry. They made a comparison between Altman‟s Z-score model and
current ratio, taking a sample of 35 firms from sugar industry and data was taken for a time frame of
2009 to 2010 and it was explored that Z-score is reliable method for predicting bankruptcy.
Pok, W. C. [17] performed an analysis of Malaysian Syariah-compliant stocks to inspect about
financial stability of the sample of 477 companies. And his results recommend that only 35.43% of the
firms were financially stable using Altman‟s Z-score whereas the results acquired through Z” were
much better i.e. 59.75% of firms were found to be financially healthy using the later 2011-12 model.
This qualifies Z” as more reliable tool than former one.
In one more study Altman‟s model was applied to assess the financial status of firms in Indian
logistics Industry from 2005-06 and by Tyagi, V. [18], and he founds that firms in logistics industry

Journal of Accounting and Finance in Emerging Economies Vol 4, No 1, June 2018
51
are doing satisfactory.
Kumar, M. [19] assess the financial performance of King Fisher airlines using Altman‟s Z-score
model and its findings indicate that firm was continuously facing looming losses from 2005 to 2012,
and if no protective strategies are soon adapted, it will end up in default.
In successive years, Kumar, M. N., & Rao, V. S. H. [20] executed a research in which they estimated
credit risk and bankruptcy prediction under Basel ІІ. The findings suggest that Z” can predict up to
98.6% accurately whereas the comparative accuracy of Z-score was 93.5%. It makes Z” a far better
predictor than Z-score.
Another study in this realm is by Ncube, T. [21] to assess the corporate failure using data of all listed
firms in stock exchange of Zimbawe from 2011-13 to aware government and general public about the
need of detecting sick firms in time and it results so declared showed that 83.33% of the firms were
prone to distress whereas the rest were safe.
A similar research was performed by Thai, S. B., Goh, H. H., HengTeh, B., Wong, J., & San Ong, T.
[22] in Malaysia using multivariate discriminant analysis model undertaking a sample of 30 firms
listed in Bursa Malaysia, 15 in each priori group and its results indicate that Altman‟s Z-score model
has a prediction accuracy of 76.7% and ratio of working capital to total assets is the best financial
indicator of all.
Besides this Malik, M. S., Awais, M., Timsal, A., & Hayat, F. [23] also analyzed the empirical
applications of Altman model in textile sector of Pakistan to account for the performance of firms in
this industry before and after crises and figured out that most of the firms failed to sustain the crises
and collapse.
In another research carried by Anjum, S. [2] all the studies on significance of Altman‟s Z-score model
were discussed and results show that it can be safely exercised to modern economy.
An advanced research made in similar context was of Jan, A., & Marimuthu, M. [24]. Its mainstay was
to revisit Altman‟s model for assessing the sustainability profile of Islamic Banking Industry. The
procured results thus again proves that; Altman‟s model is a viable option for assessing sustainability
and predicting bankruptcy.
A relevant work found in this regard is of Mihalovič, M. [25], who decided to compare the predictive
performance of the two models i.e. a logistic regression model and MDA model. The sample
encompasses a total of 236 firms Slovakia, dissociated into two priori groups. He also endeavors to
catch on the best financial predictor for assessing sustainability. The results comprehended that
logistic regression model is better than the later whereas Working Capital to Total Assets WC/TA &
Retained Earnings to Total Assets (RE/TA) are better predictors. Parallel to above mentioned
researches, Mohammed, S. [26] too contributed in the available discourse by monitoring the
sustainability of a firm Result Cement Company SAOG and its subsidiaries in Oman. The tool
adopted for analysis was Altman‟s Z- score. And the findings revealed that company and its
subsidiaries were financially stable and tool proved as a reliable one.
Though subsequent researchers had explored countless distinct models and have done worth adding
researches in this realm, yet to choose the most appropriate and suitable model out of this wide suit is
never a Hobson‟s choice. Still there is a dearth of discourse on such model choices and financial
indicator that best captures the risk of bankruptcy. So, from the myriad of options, there was a dire
need to ascertain the most suitable and preeminent model that can truly forecast the likelihood of
default ahead of time in given circumstances. Along with that, it was also seriously felt to identify a
financial indicator that plays the most dominant part in pushing the firm towards disturbing its
stability. So that firms start to work on it and maintain its sustainability in order to reduce their
chances of default. So, this research is not only restricted towards mere identification of the best model
Journal of Accounting and Finance in Emerging Economies Vol 4, No 1, June 2018
52
rather this research aims to serve manifold as it first helps the firms to realize the problem i.e.
bankruptcy, than identify a measure to work on and finally provide them a reliable and well tested tool
to help diagnose the problem before time. And for all this a list of hypotheses is developed and is
given below.
3. Hypothesis
Following hypothesis are formulated for the empirical verification of this research:
H1: Z” model is the best, most accurate and reliable method to identify bankruptcy risk
H2: Financial ratios truly capture the risk of bankruptcy.
H3: Working Capital to Total Assets (WC/TA) is the best financial indicator.
H4: Retained Earnings to Total Assets (RE/TA) is the best financial indicator.
H5: Earnings before Interest and Tax to Total Assets (EBIT/TA) is the best financial indicator.
H6: Market Value of equity to Total Liabilities (MV/TL) is the best financial indicator.
H7: Sales to Total Assets (S/TA) is the best financial indicator.
4. Materials and Methods
This section covers a comprehensive detail of research methodology applicable in this study.
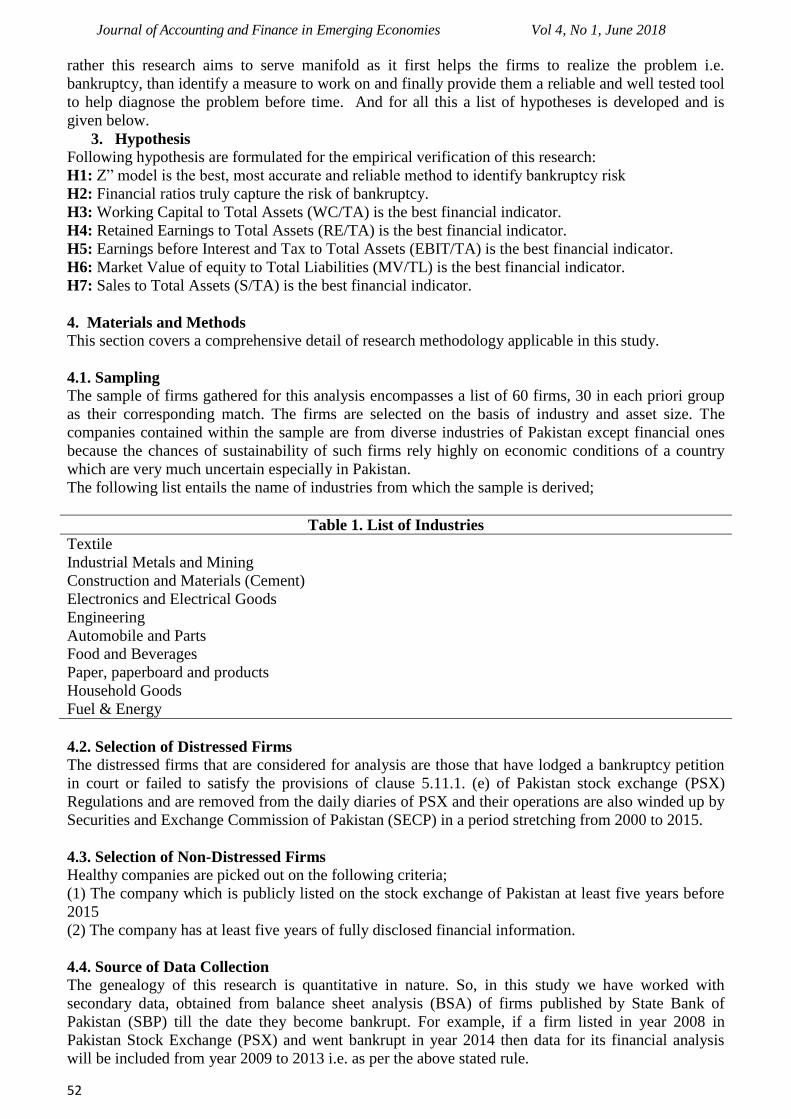
4.1. Sampling
The sample of firms gathered for this analysis encompasses a list of 60 firms, 30 in each priori group
as their corresponding match. The firms are selected on the basis of industry and asset size. The
companies contained within the sample are from diverse industries of Pakistan except financial ones
because the chances of sustainability of such firms rely highly on economic conditions of a country
which are very much uncertain especially in Pakistan.
The following list entails the name of industries from which the sample is derived;
Table 1. List of Industries
Textile
Industrial Metals and Mining
Construction and Materials (Cement)
Electronics and Electrical Goods
Engineering
Automobile and Parts
Food and Beverages
Paper, paperboard and products
Household Goods
Fuel & Energy
4.2. Selection of Distressed Firms
The distressed firms that are considered for analysis are those that have lodged a bankruptcy petition
in court or failed to satisfy the provisions of clause 5.11.1. (e) of Pakistan stock exchange (PSX)
Regulations and are removed from the daily diaries of PSX and their operations are also winded up by
Securities and Exchange Commission of Pakistan (SECP) in a period stretching from 2000 to 2015.
4.3. Selection of Non-Distressed Firms
Healthy companies are picked out on the following criteria;
(1) The company which is publicly listed on the stock exchange of Pakistan at least five years before
2015
(2) The company has at least five years of fully disclosed financial information.
4.4. Source of Data Collection
The genealogy of this research is quantitative in nature. So, in this study we have worked with
secondary data, obtained from balance sheet analysis (BSA) of firms published by State Bank of
Pakistan (SBP) till the date they become bankrupt. For example, if a firm listed in year 2008 in
Pakistan Stock Exchange (PSX) and went bankrupt in year 2014 then data for its financial analysis
will be included from year 2009 to 2013 i.e. as per the above stated rule.

Journal of Accounting and Finance in Emerging Economies Vol 4, No 1, June 2018
53
4.5. Altman Z-Score Model
Z-Score = 1.2X1 + 1.4X2 + 3.3X3 + 0.6X4 + 1.0X5
Where;
X1 is Working capital/total assets
X2 is Retained earnings/total assets
X3 is Earnings before Interest & Tax (EBIT)/total assets
X4 is Market value of equity/total liabilities
X5 is Sales/total assets (measured in number of times, not percentages)
And,
Z is overall index score.
The lower is the Z-score, the higher are the odds that company will go bankrupt. Altman also provided
cut-off scores for generalizability of results. A company having score of 3 or above is ranked as
healthy, and a score below 1.8 means that it has highest odds of becoming bankrupt Altman, E. I.
(1968).
4.6. Altman Z-Double Prime (Z”) Model
Z” = 6.56 X1 +3.26 X2 +6.72 X3 + 1.05 X4
Where;
X1 = Working Capital /Total Assets
X2 = Retained earnings /Total Assets
X3 = Earnings before Interest and Tax / Total Assets
X4 = Market Value of Equity / Total Liabilities
Z” is overall index score.
The cut off scores for generalizability of results in this model are that a firm having score of 2.6 or
above is ranked as healthy, whereas firm with a score below 1.1 is considered to have highest odds of
becoming bankrupt Altman, E. I. (2000), Zopounidis, C., & Paraschou, D. (1998).
Table 2. Cut off scores
Z-Score Z”
Healthy ≥3 ≥2.6
Bankrupt <1.8 <1.1
4.7. Measurement of variables
Financial ratio analysis let us develop a more comprehensive understanding of firm‟s position and
device a strategy that can be well applied to cater the firm‟s financial problems Altman, E. I. (1968). It
generally facilitates in discriminating a bankrupt firm from matched control sample i.e. healthy firms
under observation. In this research, five ratios indicating financial distress are brought to use by
Altman for making appropriate decisions in his model which serve as independent variables and are
given below; whereas the dependent variables are Z-score & Z” prime.
4.7.1. Working Capital / Total Assets (X1=WC/TA)
Working capital is the difference between current assets and current liabilities. It is considered as
liquid asset for company to meet their short-term obligation effectively. A company is able to meet its
short-term obligation when there is positive working capital. When there is insufficient working
capital, the company is concerned that they will not be able to pay their short-term debt. Normally, the
companies that are facing financial difficulties will have a shrinking asset which will cause them to be
non-liquid and fail to pay their creditors.
4.7.2. Earnings before Interest and Tax / Total Assets (X2=RE/TA)
This ratio is used to evaluate the company‟s ability to generate operating profit with existing asset.
When the company has high profit with low asset, it has a relatively low chance of getting default. It is
due to the dollar of asset that is able to generate a larger amount of operating profit. On the other way,
lower income might not be enough to cover company‟s daily expenses.
4.7.3. Retained Earnings / Total Assets (X3=EBIT/TA)

Journal of Accounting and Finance in Emerging Economies Vol 4, No 1, June 2018
54
Retained earnings are the amount of earning that is not paid out as dividend. The purpose of retaining
the company‟s earning is to allow the company to reinvest without adopting external fund with more
cost. In other words, retained earnings can be used to measure the extent of a company by using
leverage. If this ratio is high, it means that there is sufficient funding for the firm to reinvest. If the
ratio is low, the company will borrow instead of retaining earnings to finance their investment. This
will increase the company‟s chance of being default.
4.7.4. Market Value of Equity / Total Liabilities (X4=MV/TL)
By referring to this ratio, we are able to measure how fast the company‟s asset would decline when the
company become insolvent – when liability exceed asset of the company. This ratio is not considered
based on pure fundamental because it computes with the company‟s market value. Market
capitalization indicates the level of confidence the company gives to the market. A higher-level ratio
indicates that the company has a higher chance to sustain when there is an economic downturn.
4.7.5. Sales / Total Assets (X5=S/TA)
This ratio is also known as asset turnover. It indicates how effective the company uses a single dollar
of asset to generate sales. Sales are the amount earned without considering cost, interest and tax. When
this ratio is high, it indicates that with the amount of assets, the company is able to expand their
market share. If the company with low asset turnover is not using proper strategy to improve their
sales, they may not have a promising future.
5. Test Procedures
Table 3 is used to test significance of variables i.e. whether they truly capture the risk of bankruptcy
and it also measures the potential of each predictor variable. And if level of significance of F values is
≤ 0.05, then it indicates that the variable surely contributes to model and also discriminates between
the two groups. Here all the independent variables are highly significant with values less than 0.05 and
they also have high standardized coefficients attached to them, which shows that better discriminating
power between two groups. Wilks‟ lambda also serves the same purpose i.e. it too measures the
variable's potential in predicting bankruptcy. It has a value of 1 and the lower the value of Wilks‟
Lambda the better a variable can discriminate between groups. Here MV/TL shows the best
discriminating ability with Wilks‟ Lambda equals to .638 i.e. lowest of all and also has the highest
standardized coefficient and significance in case of Z” whereas in case of Z-Score S/TA and MV/TL
have significantly smaller values as compared to others. In short, it is pretty much obvious from the
above results that greater significance, high standardized coefficient and smaller Wilks‟ lambda of all
variables shows their best contribution in making up the model.
Table 3 Test of Equality of Group Means
Wilks‟ Lambda F df1 df2 Sig.
Z” WC/TA .899 4.819 1 45 .034
RE/TA .903 4.617 1 45 .037
EBIT/TA .898 4.900 1 45 .032
MV/TL .638 24.423 1 45 .000
Z WC/TA .722 17.319 1 45 .000
RE/TA .810 10.562 1 45 .002
EBIT/TA .925 3.630 1 45 .053
MV/TL .713 18.123 1 45 .000
S/TA .372 75.835 1 45 .000
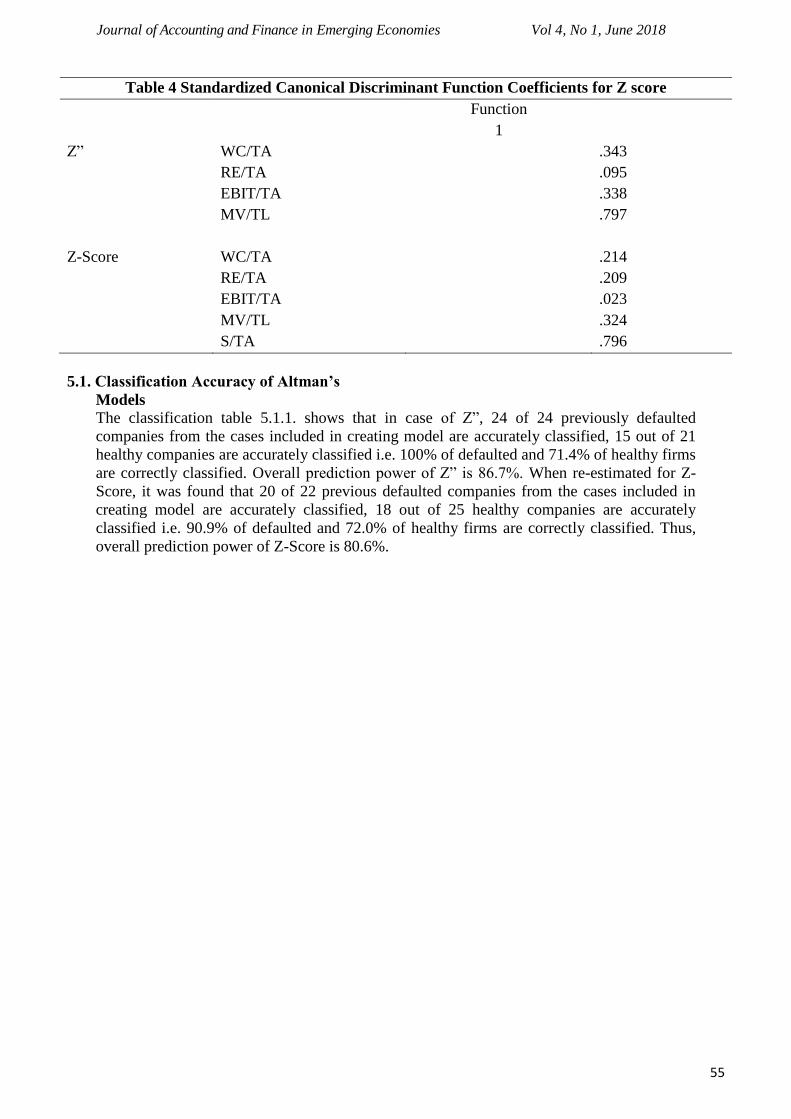
Table 4(b) reports standardized canonical discriminant function coefficients for both models in which
each predictor variable has been assigned with an index which are same as standardized beta
coefficients in regression analysis i.e. it reflects the unique contribution of independent variables like
WC/TA, RE/TA in defining bankruptcy. Here, the strongest indicator in defining bankruptcy in case
of Z” is MV/TL with value of 0.797 whereas in Z-Score S/TA and MV/TL contributes most
respectively.
Journal of Accounting and Finance in Emerging Economies Vol 4, No 1, June 2018
55
Table 4 Standardized Canonical Discriminant Function Coefficients for Z score
Function
1
Z” WC/TA .343
RE/TA .095
EBIT/TA .338
MV/TL .797
Z-Score WC/TA .214
RE/TA .209
EBIT/TA .023
MV/TL .324
S/TA .796
5.1. Classification Accuracy of Altman’s
Models
The classification table 5.1.1. shows that in case of Z”, 24 of 24 previously defaulted
companies from the cases included in creating model are accurately classified, 15 out of 21
healthy companies are accurately classified i.e. 100% of defaulted and 71.4% of healthy firms
are correctly classified. Overall prediction power of Z” is 86.7%. When re-estimated for Z-
Score, it was found that 20 of 22 previous defaulted companies from the cases included in
creating model are accurately classified, 18 out of 25 healthy companies are accurately
classified i.e. 90.9% of defaulted and 72.0% of healthy firms are correctly classified. Thus,
overall prediction power of Z-Score is 80.6%.
Journal of Accounting and Finance in Emerging Economies Vol 4, No 1, June 2018
56
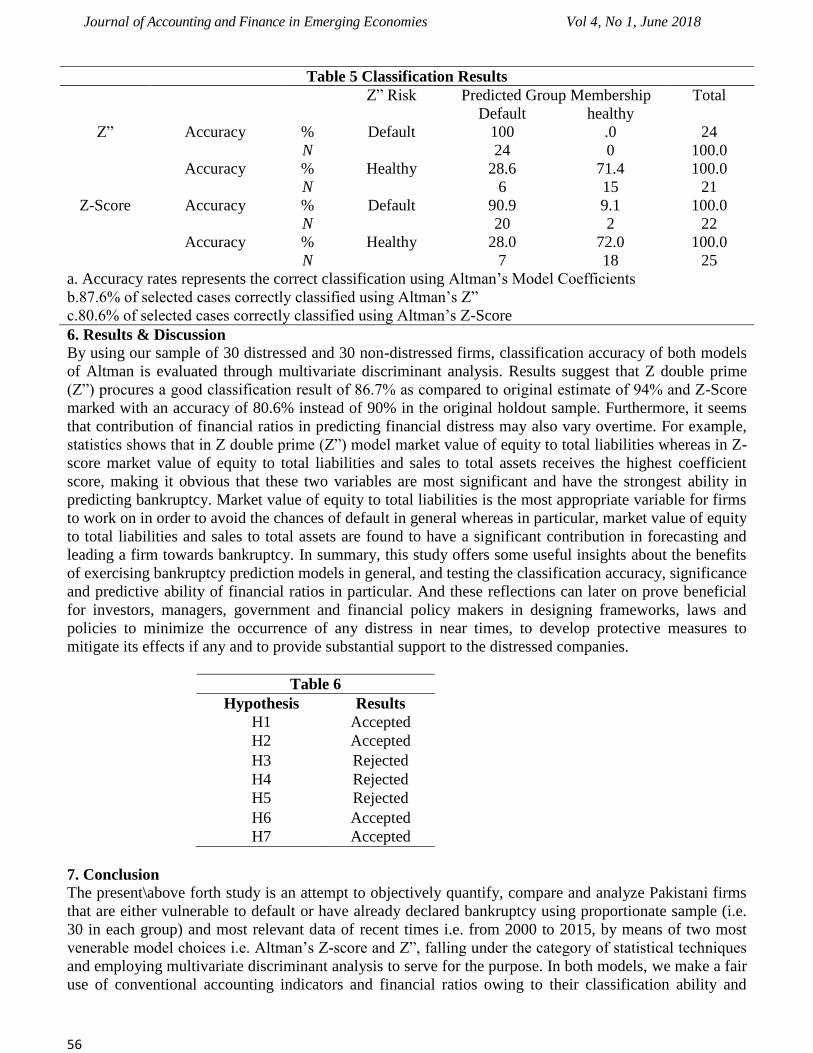
Table 5 Classification Results
Z” Risk Predicted Group Membership Total
Default healthy
Z” Accuracy % Default 100 .0 24
N 24 0 100.0
Accuracy % Healthy 28.6 71.4 100.0
N 6 15 21
Z-Score Accuracy % Default 90.9 9.1 100.0
N 20 2 22
Accuracy % Healthy 28.0 72.0 100.0
N 7 18 25
a. Accuracy rates represents the correct classification using Altman‟s Model Coefficients
b.87.6% of selected cases correctly classified using Altman‟s Z”
c.80.6% of selected cases correctly classified using Altman‟s Z-Score
6. Results & Discussion
By using our sample of 30 distressed and 30 non-distressed firms, classification accuracy of both models
of Altman is evaluated through multivariate discriminant analysis. Results suggest that Z double prime
(Z”) procures a good classification result of 86.7% as compared to original estimate of 94% and Z-Score
marked with an accuracy of 80.6% instead of 90% in the original holdout sample. Furthermore, it seems
that contribution of financial ratios in predicting financial distress may also vary overtime. For example,
statistics shows that in Z double prime (Z”) model market value of equity to total liabilities whereas in Z-
score market value of equity to total liabilities and sales to total assets receives the highest coefficient
score, making it obvious that these two variables are most significant and have the strongest ability in
predicting bankruptcy. Market value of equity to total liabilities is the most appropriate variable for firms
to work on in order to avoid the chances of default in general whereas in particular, market value of equity
to total liabilities and sales to total assets are found to have a significant contribution in forecasting and
leading a firm towards bankruptcy. In summary, this study offers some useful insights about the benefits
of exercising bankruptcy prediction models in general, and testing the classification accuracy, significance
and predictive ability of financial ratios in particular. And these reflections can later on prove beneficial
for investors, managers, government and financial policy makers in designing frameworks, laws and
policies to minimize the occurrence of any distress in near times, to develop protective measures to
mitigate its effects if any and to provide substantial support to the distressed companies.
Table 6
Hypothesis Results
H1 Accepted
H2 Accepted
H3 Rejected
H4 Rejected
H5 Rejected
H6 Accepted
H7 Accepted
7. Conclusion
The present\above forth study is an attempt to objectively quantify, compare and analyze Pakistani firms
that are either vulnerable to default or have already declared bankruptcy using proportionate sample (i.e.
30 in each group) and most relevant data of recent times i.e. from 2000 to 2015, by means of two most
venerable model choices i.e. Altman‟s Z-score and Z”, falling under the category of statistical techniques
and employing multivariate discriminant analysis to serve for the purpose. In both models, we make a fair
use of conventional accounting indicators and financial ratios owing to their classification ability and

Journal of Accounting and Finance in Emerging Economies Vol 4, No 1, June 2018
57
popularity in literature in terms of bankruptcy prediction. Yet, based on the cut off score the two models
differ in terms of their classification accuracy and predictive power. Z” model correctly classifies the
firms in underlying sample with a maximum accuracy of up to 86.7% prior to one year of default as
compared to the original hold out sample of Altman i.e. 94% which is exceptionally good whereas
Atman‟s Z –Score was only 80.6% accurate as compared to 90% in original sample which is indeed
acceptable. Thus, classification results of Z” model demonstrates its improved accuracy over existing
model of Z-score for failure prediction. These results are a reinforcement of the results proposed by Pok,
W. C. and Kumar, M. N., & Rao, V. S. H. So, we can say that results declare Z” as the most accurate and
reliable assessment tool out of the two.
This study is not merely limited towards identification of most accurate and reliable model rather this
research aims to serve manifold as it also calculates a financial indicator that is highly capable, strongly
interpret and contribute the most in defining the firm‟s overall sustainability profile, hence, suggesting the
firms an obvious solution to work on and to manage their risks. And that very financial indicator is
Market Value of equity to total liabilities. As, the firm that is more volatile in its equity or has a low
market value of equity is more likely to default than a firm that is quite stable in this ratio or has a high
market value of equity to total liabilities. Other variables like working capital to total assets, retained
earnings to total assets, earnings before interest and tax to total assets and sales to total assets also
captures the risk of bankruptcy but comparatively to a lesser extent (Rashid, A., & Abbas, Q.,2011, Abid
et al, 2012).
By use of most relevant and recent data, the results of this study serve as an early warning for firms in the
underlying sample about their financial status. It may help the firms to assess sustainability and detect
their likelihood of default if any thus to take necessary actions to avoid colossal losses in future. Besides
this, it may also serve as an indicator for all respective shareholders and analysts about the risky profile of
firm who aims to include it in their portfolio.
In summary, this study offers some useful insights about the benefits of exercising bankruptcy prediction
models in general, and testing the classification accuracy, significance and predictive ability of financial
ratios in particular. And these reflections can later on assist/prove beneficial for investors, managers,
government and financial policy makers in designing frameworks, laws and policies to minimize the
occurrence of any distress in near times, to develop protective measures to mitigate its effects if any and
to provide substantial support to the distressed companies.
8. Future Research Recommendations
In this study we have not only quantified risk of bankruptcy in firms but also compared important and
distinct facts about the performance of the two conventional but venerable models in question and thus it
is empirically evident from the findings that Z double prime (Z”) has superior performance than Z-score
in evaluation of impending success or failure of firm. So, this makes the model a highly recommended
tool by researcher to ascertain bankruptcy risk among companies in future. However, the model is not the
only most relevant and accurate assessment tool in this regard. Researchers and practitioners recommend
to subject all modelling techniques on underling data for thorough empirical testing simultaneously, the
information so condensed will be used to judge the true position of companies. Another major
recommendation that can be made to Altman‟s failure prediction model after this study is to reflect
changing economic, market and industry conditions in its input for improving the status. Perhaps, this can
be done by adding up variety of explanatory variables that may serve as better predictors by re-estimating
the coefficients of model and expanding no of firms in underlying sample. But as mentioned earlier that
one obvious impediment of this research is absence of sufficient data for companies which has confined
the study to just a few variables and small sample size. Furthermore, other models can also be widely
applied and tested at the same time for reflecting better picture of firms in question. To a final note, this
research can also be exercised for financial and non-listed sector of Pakistan to retrieve more remote
trends in this domain.
References

Journal of Accounting and Finance in Emerging Economies Vol 4, No 1, June 2018
58
Abid, .A. S., Kouser, R, Aamir M., & Hussain M., (2012) The Impact of the Corporate Governance and the
Ownership Structure on the Firm‟s Financial Performance and Its Risk Taking Behaviour International
research journal of finance and economics(IRJFE) Issue (93), pp. 44-55
Adnan Aziz, M., & Dar, H. A. (2006). Predicting corporate bankruptcy: where we stand? Corporate
Governance: The international journal of business in society, 6(1), 18-33.
Altman, E. I. (1968). Financial ratios, discriminant analysis and the prediction of corporate bankruptcy. The
journal of finance, 23(4), 589-609.
Altman, E. I. (2000). Predicting financial distress of companies: revisiting the Z-score and ZETA models. Stern
School of Business, New York University, 9-12.
Altman, E.I., & Hotchkiss, E. (Eds.). (2006). corporate financial distress and bankruptcy: predict and avoid
bankruptcy, analyze and invest in distressed debt (3rd
ed.). Hoboken, NJ: Wiley
Anjum, S. (2012). Business bankruptcy prediction models: A significant study of the Altman‟s Z-score model.
Asian Journal of Management Research, 3(1), 212-219.
Beaver, W. H. (1966). Financial ratios as predictors of failure. Journal of accounting research, 71-111.
Chuvakhin, N., & Gertmenian, L. W. (2003). Predicting bankruptcy in the WorldCom age. Journal of
Contemporary Business Practice, 6(1), 3-8.
Demyanyk, Y., & Hasan, I. (2010). Financial crises and bank failures: A review of prediction methods. Omega,
38(5), 315-324.
Hillegeist, S. A., Keating, E. K., Cram, D. P., & Lundstedt, K. G. (2004). Assessing the probability of
bankruptcy. Review of accounting studies, 9(1), 5-34.
Ijaz, M. S., Hunjra, A. I., Hameed, Z., & Maqbool, A. (2013). Assessing the financial failure using z-score and
current ratio: A case of sugar sector listed companies of Karachi stock exchange.
Jan, A., & Marimuthu, M. (2015). Bankruptcy and sustainability: A conceptual review on Islamic banking
industry. Global Business and Management Research, 7(1), 109.
Kumar, M. N., & Rao, V. S. H. (2015). A new methodology for estimating internal credit risk and bankruptcy
prediction under Basel II Regime. Computational Economics, 46(1), 83-102.
Kumar, M., & Anand, M. (2013). Assessing Financial Health of a Firm Using Altman‟s Original and Revised
Z-Score Models: A Case of Kingfisher Airlines Ltd (India). Journal of Applied Management and
Investments, 2(1), 36-48.
Malik, M. S., Awais, M., Timsal, A., & Hayat, F. Z-Score Model: Analysis and Implication on Textile Sector
of Pakistan.
Mihalovic, M. (2016). Performance comparison of multiple discriminant analysis and logit models in
bankruptcy prediction. Economics & Sociology, 9(4), 101.
Mohammed, S. (2016). Bankruptcy Prediction Using the Altman Z-score Model in Oman: A Case Study of
Raysut Cement Company SAOG and its subsidiaries. Australasian Accounting Business & Finance
Journal, 10(4), 70.
Ncube, T. PREDICTING CORPORATE FAILURE.
Odom, M. D., & Sharda, R. (1990, June). A neural network model for bankruptcy prediction. In Neural
Networks, 1990, 1990 IJCNN International Joint Conference on (pp. 163-168). IEEE.
Ohlson, J. A. (1980). Financial ratios and the probabilistic prediction of bankruptcy. Journal of accounting
research, 109-131.
Paliwal, M., & Kumar, U. A. (2009). Neural networks and statistical techniques: A review of applications.
Expert systems with applications, 36(1), 2-17.
Pok, W. C. (2012). Analysis of Syariah quantitative screening norms among Malaysia Syariah-compliant
stocks. Investment Management and Financial Innovations, 9(2), 69-80.
Quinlan, J. R. (1986). Induction of decision trees. Machine learning, 1(1), 81-106.
Rashid, A., & Abbas, Q. (2011). Predicting Bankruptcy in Pakistan. Theoretical & Applied Economics, 18(9).
Taffler, R. J. (1983). The assessment of company solvency and performance using a statistical model.
Accounting and Business Research, 13(52), 295-308.
Thai, S. B., Goh, H. H., HengTeh, B., Wong, J., & San Ong, T. (2014). A Revisited of Altman Z-Score Model
for Companies Listed in Bursa Malaysia. International Journal of Business and Social Science, 5(12).

Journal of Accounting and Finance in Emerging Economies Vol 4, No 1, June 2018
59
Tyagi, V. (2014). A Study to measures the financial health of selected firms with special reference to Indian
logistic industry: an application of Altman‟s Z score. Industrial Engineering Letters, 4(4), 43-54.
Zmijewski, M. E. (1984). Methodological issues related to the estimation of financial distress prediction
models. Journal of Accounting research, 59-82.
Zopounidis, C., & Paraschou, D. (1998). Multicriteria Decision Aid methods for the prediction of business
failure (Vol. 12). Springer Science & Business Media.
Appendix 1
Comparison of Altman Z-Score (1968) and Z”-Double Prime (1995) Bankruptcy
Prediction Models 1 Altman‟s 1968 Paper Altman‟s 1995 Paper
2 Title Edward I. Altman
New York University
Altman & Hartzell and Peck
3 Year 1968, September 1995
4 Dependent Variable Bankrupt/Non-Bankrupt firms EM Scores
5 Independent
Variables
Five out of 22 Four out of 22
6 Sample Size 66 paired (33 each) More than 750 US firms
7 Industry Manufacturing Manufacturing and Non-
Manufacturing
8 Data Source Income Statement and Balance
Sheet
Income Statement and Balance
Sheet
9 Financial Ratios
used as Independent
Variables
WC/TA, RE/TA, EBIT/TA,
MV/TL, S/TA
WC/TA,RE/TA,EBIT/TA,
MV/TL
10 Classification
Accuracy
90% 94%
11 Order of Relative
Contribution
EBIT/TA, RE/TA,W/TA,S/TA,
MV/TL
EBIT/TA,WC/TA,RE/TA,MV/
TL
12 Needed items of
Financial Statement
CA, CL, TA, TL, RE, EBIT,
Sales, No of shares
CA, CL, TA, TL, RE, EBIT,
No of shares
13 Application Publicly held manufacturing
firms
Manufacturing and non-
manufacturing firms with rated
bonds outstanding
Appendix 2: List of companies taken as testing sample Ayesha Textile Mills Limited Hajra Textile Mills Limited
Asim Textile Mills Limited Ideal Spinning Mills Limited
Ashfaq Textile Mills Limited. Idrees Textile Mills Limited
Artistic Denim Mills Ltd. Ishtiaq Textile Mills Limited
Ansari Sugar Mills Ltd Mitchells Fruit Farms Limited
Annoor Textile Mills Limited Mehr Dastgir Textile Mills Limited
Atlas Honda Ltd. Medi Glass Limited
Atlas Engineering Ltd National Foods Limited
Akzo Nobel Pakistan Ltd Nestle Pakistan Limited
Bela Automotives Ltd. Olympia Textile Mills Limited
Bhanero Textile Mills Limited Pak Leather Crafts Limited
Bawany Air Product Limited Pakistan Gum and Chemiclas Limited
Biafo Industries Limited Pakistan Paper Prouducts Limited
Chakwal Spinning Mills Limited Quality Textile Mills Ltd

Journal of Accounting and Finance in Emerging Economies Vol 4, No 1, June 2018
60
Crescent Textile Mills Limited Resham Textile Industries Ltd
Clover Pakistan Limited Shifa International Hospitals Limited
(Colony) Thal Textile Mills Limited S. G. Fibres Ltd
(Colony) Sarhad Textile Mills Limited S. S. Oil Mills Ltd
Colgate Palmolive (Pakistan) Limited Shezan International Ltd
Cherat Cement Company Limited Sind Fine Textile Mills Ltd
Cherat Packaging Limited. Saleem Denim Industries Limited
Dewan Khalid Textile Mills Limited Sazgar Engineering Works Limited
Dewan Textile Mills Limited Sitara Chemical Industries Limited
Din Textile Mills Limited Sitara Peroxide Limited
Dewan Automotive Engineering Limited Transmission Engineering Industries Limited
Dost Steels Limited Wah Noble Chemicals Limited
Dadabhoy Construction Technology Limited Morafco Industries Limited
Dadabhoy Cement Industries Limited Murree Brewery Company Limited
Data Textile Limited Data Agro Limited
Descon Oxychem Limited HinoPak Motors Limited
Dewan Cement Limited Asim Textile Mills Limited
Engro Corporation Limited Diamond Industries Limited
Engro Polymer and Chemicals Limited Baluchistan Wheels Limited
Fatima Enterprizes Limited Globe (OE) Textile Mills Limited
Faisal Spinning Mills Limited Gulistan Spinning Mills Limited
Fazal Cloth Mills Limited Gadoon Textile Mills Ltd
Fateh Textile Mills Limited Goodluck Industries Limited
Gulistan Textile Mills Ltd Ghani Value Glass Limited
Gul Ahmed Textile Mills Limited Honda Atlas Cars (Pakistan) Limited
Globe Textile Mills Limited Husein Industries Limited
Appendix 3: Financially distressed companies indicated by Z” Ansari Sugar Mills Ltd Sind Fine Textile Mills Ltd
Asim Textile Mills Limited S. S. Oil Mills Ltd
Annoor Textile Mills Limited Saleem Denim Industries Limited
Ashfaq Textile Mills Limited S. G. Fibres Ltd
Dewan Textile Mills Limited Morafco Industries Limited
Bela Automotives Ltd. Din Textile Mills Limited
Dewan Khalid Textile Mills Limited (Colony) Sarhad Textile Mills Limited
Globe Textile Mills Limited (Colony) Thal Textile Mills Limited
Gulistan Textile Mills Limited Gadoon Textile Mills Limited
Husein Industries Limited Dadabhoy Cement Industries Limited
Gulshan Spinning Mills Limited Dost Steels Limited
Globe (OE) Textile Mills Limited Data Textile Limited
Dewan Automotive Engineering Limited
Fateh Textile Mills Limited
Idrees Textile Mills Limited Fatima Enterprizes Limited
Kohat Textile Mills Limited Khurshid Spinning Mills Limited
Olympia Textile Mills Limited Hajra Textile Mills Limited
Transmission Engineering Industries Limited Ishtiaq Textile Mills Limited
Dadabhoy Construction Technology Limited Pak Leather Crafts Limited
Appendix 4: Financially distressed companies indicated by Z-Score Sind Fine Textile Mills Ltd Hajra Textile Mills Limited

Journal of Accounting and Finance in Emerging Economies Vol 4, No 1, June 2018
61
Dost Steels Limited Fatima Enterprizes Limited
Ashfaq Textile Mills Limited Data Textile Limited
Dadabhoy Construction Technology Limited Khurshid Spinning Mills Limited
Husein Industries Limited Annoor Textile Mills Limited
(Colony) Thal Textile Mills Limited Husein Industries Limited
Globe (OE) Textile Mills Limited Fateh Textile Mills Limited
Saleem Denim Industries Limited Morafco Industries Limited
Dadabhoy Cement Industries Limited Globe Textile Mills Limited
Husein Industries Limited Saleem Denim Industries Limited
Bela Automotive Limited S. G. Fibres Ltd
Dadabhoy Construction Technology Limited (Colony) Sarhad Textile Mills Limited
Ansari Sugar Mills Ltd Asim Textile Mills Limited
Transmission Engineering Industries Limited Olympia Textile Mills Limited
Dewan Automotive Engineering Limited Gulistan Textile Mills Limited
Journal of Accounting and Finance in Emerging Economies Vol 4, No 1, June 2018
62
Related Documents